Embed Size (px)
Citation preview

1
Solomon Islands Government
Performance Assessment Framework report 2009-2011
Ministry of Education and Human Resource Development
August 2012

2 Solomon Islands
Acknowledgements The Performance Assessment Framework (PAF) report is a product of a cooperative effort. It has been written with the support from the internal divisions in the Ministry of Education and Human Resources Development and officers who are members of the Technical Working Group Monitoring (TWGM). The selection of the indicators used in this report is based on a participatory process of involving many staff in the selection of the main indicators targets and minimum standards for the education sector. This PAF 2009-2011 is a report that is produced from the data collected through the annual school census form entered and stored in the Solomon Islands Education Management Information System (SIEMIS), 2009 population data from the National Statistics Office (NSO), examination data from the National Examination and Selection Unit (NESU) and SPBEA and the human resources development data from the Human Resources Development Division (HRD), The SIEMIS however is the main data base for each education sub sector within the Ministry of Education and Human Resources Development and is annually updated by a huge national data collection process which requires all schools and Education Authorities (EA) to fill in SIEMIS-forms that are distributed by the Ministry. We would like to express our sincere gratitude to our Partners New Zealand Government for their financial and technical assistance towards the Solomon Islands Information Management System. Gratitute is given to the Technical Working Group Monitoring which has senior representatives from various divisions in MEHRD and donor partners, particularly NZ, UNICEF and AusAID and the Monitoring and Evaluation committee which is responsible for the Monitoring and Evaluation in the Education Sector for their advice on the process of producing and improving the PAF. This PAF 2009-2011 is in the same stratucture as PAF 2008-2010. Special appreciation is given to School Head Teachers, Principals and Education Authorities for their effort in the process of completing and returning the SIEMIS-forms to the Ministry of Education. Thanks also go to the SIEMIS-team in the Planning, Coordination and Research Unit for their daily input of the information collected from the SIEMIS-forms (school census form) and for the production of the document. The main message from these PAF-data 2009-2011 shares the same consideration as PAF 2008-2010 that we have made considerable progress with access at all levels with increased number of children going to school. The gains in Primary, Junior and Senior Secondary are impressive. However, the quality of education and the management of the human and financial resources must be much more effective and efficient. We need all actors at the national, provincial and school and community level to collaborate. Let these data be our tools for better planning and policy development that we may make good progress to the goals of our National Education Action Plan 2010-2012. Dr. Fred Isom Rohorua Permanent Secretary Ministry of Education and Human Resources Development

3
Table of Contents
Acknowledgements ................................................................................................................................... 2 List of Tables ................................................................................................................................................ 5 List of Figures .............................................................................................................................................. 9 Acronyms and Abbreviations .............................................................................................................. 11
Overview summary for the Education For All Goals ................................................................. 12 Goal 1: Expanding and improving early childhood care and education for all children of age 3-5 in the Solomon Islands. ........................................................................................................................................... 12 Goal 2. Achieving Universal Primary and Equitable Access to Basic Education ........................................... 12 Goal 3: Promote quality learning and skills for both young people and adults. ............................................. 14
Goal 4: To achieve 50% improvement of adult literacy by 2015 in the Solomon Islands for both women and men. .............................................................................................................................................................. 15 Goal 5: Achieve gender parity in primary and secondary education by 2005, and achieve gender equality by 2015. ............................................................................................................................................................. 15 Goal 6: To improve quality of Education in the Solomon Islands................................................................... 15
Introduction ................................................................................................................................................. 17 Chapter One: Access Indicators ........................................................................................................ 19
Demand......................................................................................................................................................... 19 Participation in Early Childhood Education ................................................................................................ 19 Access to Primary Education .................................................................................................................... 20
Participation in Primary Education............................................................................................................. 20 Participation in Junior Secondary Education ............................................................................................. 21
Participation in Senior Secondary Education ................................................................................................ 22 Chapter Two: Infrastructure Indicators ........................................................................................... 24
Schools ..................................................................................................................................................... 24
Pupil to classroom ratio ............................................................................................................................. 24 Pupil to desk ratios .................................................................................................................................... 25
Dormitory to boarder ratios ........................................................................................................................ 25 Pupil to toilet ratios .................................................................................................................................... 26 Access to clean and safe water ................................................................................................................. 27
Workshops ................................................................................................................................................ 27 Chapter three: Quality Indicators ...................................................................................................... 28
Trained and Untrained Teachers ............................................................................................................... 28 Teachers in management roles ................................................................................................................. 29 Pupil/teacher/Trained/Untrained ratio ........................................................................................................ 30
Percentage of schools with libraries .......................................................................................................... 31 Schools with storage ................................................................................................................................. 31 Pupil to textbook ratios .............................................................................................................................. 31 Access to computers ................................................................................................................................. 32 Literacy and Numeracy Achievement Levels ............................................................................................ 32
Chapter Four: Efficiency Indicators.................................................................................................. 42 Repetition Rates ........................................................................................................................................ 42 Dropout Rates ........................................................................................................................................... 42 Survival (completion) Rates ...................................................................................................................... 43
Transition Rates ........................................................................................................................................ 44 Chapter Five: Human Resources Development .......................................................................... 47
Teacher establishment .............................................................................................................................. 47 MEHRD establishment .............................................................................................................................. 49
Chapter Six: Process Indicators ........................................................................................................ 50

4 Solomon Islands
SIEMIS Return Rate .................................................................................................................................. 50
Policies Developed and Approved by Cabinet .......................................................................................... 52 Recommendations ................................................................................................................................... 53
Early Childhood Education ............................................................................................................................ 53 Primary Education Level ............................................................................................................................... 53
Junior Secondary Education Level ................................................................................................................ 53 Senior Secondary Education Level ............................................................................................................... 53 Financial Management .................................................................................................................................. 53 Efficiency ....................................................................................................................................................... 53 Human Resources Development .................................................................................................................. 53 Process indicators ......................................................................................................................................... 53
Annex one: Access data tables .......................................................................................................... 54 Annex two: Infrastructure data tables ............................................................................................. 61 Annex three: Quality data tables ........................................................................................................ 77 Annex five: Efficiency data tables ..................................................................................................... 91
Annex six: Human Resources Development data tables ........................................................ 98 Annex seven: Management and Process data tables ............................................................. 102 Annex Eight: Performance Assessment Framework .............................................................. 104

5
List of Tables
1.1: Number of pupils enrolled in earlychildhood education by province and gender, 2009-2011. ....................................................................................................... 54
1.2: Number of pupils enrolled in primary education by province and gender, 2009-2011. .......................................................................................................................... 54
1.3: Number of pupils enrolled in junior secondary education by province and gender, 2009-2011. ....................................................................................................... 55
1.4: Number of pupils enrolled in senior secondary education by province and gender, 2009-2011. ....................................................................................................... 55
1.5: National summary of enrolment numbers by education level, 2009-2011. .................................................................................................................................................... 55
1.6: School-aged population for total Solomon Islands of the age range yr 1 to 25 by gender, 2009-2011. ........................................................................................... 56
1.7: Gross and Net Enrolment Rate for ECE by Gender, 2009-2011 ................................................................................................................................................................ 57
1.8: Percent Change in GER and NER for ECE by Gender, 2011 compared to 2009 ..................................................................................................................................... 57
1.9: Gross intake rate (NIR) and net intake rate (NIR) for Primary Education by gender, 2009-2011 ........................................................................................................ 57
1.10: Gross and Net Enrolment Rate for Primary Education by Gender, 2009-2011 .................................................................................................................................... 57
1.11: Percent Change in GER and NER for Primary Education by Gender, 2011 compared to 2009......................................................................................................... 58
1.12: Gross and Net Enrolment Rate for Junior Secondary Education by Gender, 2009-2011 ....................................................................................................... 58
1.13: Percent Change in GER and NER for Junior Secondary Education by Gender, 2011 compared to 2009 ............................................................................ 58
1.14: Gross and Net Enrolment Rate for Senior Secondary Education by Gender, 2009-2011 ....................................................................................................... 58
1.15: Percent Change in GER and NER for Senior Secondary Education by Gender, 2011 compared to 2009 ............................................................................ 58
1.16: Number and percentage of pupils with special needs enrolled in Primary Education by province, 2009-2011 ............................................................ 60
1.17: Number and percentage of pupils with special needs enrolled in Junior Secondary Education by province, 2009-2011 ....................................... 60
1.18: Number and percentage of pupils with special needs enrolled in Senior Secondary education by province, 2009-2011 ....................................... 60
2.1: Number of ECE Centers by Province, 2009-2011 2.2: Num of Primary Schools by Province, 2009-2011 ................................................................................. 61
2.3: Number of CHS by Province, 2009-2011 2.4: Number of PSS by Province, 2009-2011 ......................................................................................... 61
2.5: Number of NSS by Province, 2009-2011 2.6: Number of RTC by Province, 2009-2011 ......................................................................................... 61
2.7: Number of classroom and pupil to classroom ratios for Primary Schools by Province, 2009-2011 ....................................................................................... 62
2.8: Number of classroom and pupil to classroom ratios for CHS by Province, 2009-2011 .......................................................................................................................... 62
6 Solomon Islands
2.9: Number of classroom and pupil to classroom ratios for PSS by Province, 2009-2011 .......................................................................................................................... 62
2.10: Number of classroom and pupil to classroom ratios for NSS by Province, 2009-2011 ................................................................................................................ 63
2.11: Number of classroom and pupil to classroom ratios for RTC by Province, 2009-2011 ................................................................................................................ 63
2.12: Number of desks and pupil to desk ratios for Primary Schools by Province, 2009-2011 ........................................................................................................ 64
2.13: Number of desks and pupil to desk ratios for CHS by Province, 2009-2011 ................................................................................................................................ 64
2.14: Number of desks and pupil to desk ratios for PSS by Province, 2009-2011 ................................................................................................................................ 65
2.15: Number of desks and pupil to desk ratios for NSS by Province, 2009-2011 ................................................................................................................................ 65
2.16: Number of desks and pupil to desk ratios for RTC by Province, 2009-2011 ................................................................................................................................ 65
2.17: Number of dormitories, number of enrolled boarders in CHS and boarder to dorm ratio by Province, 2009-2011 ......................................................... 67
2.18: Number of dormitories, number of enrolled boarders in PSS and boarder to dorm ratio by Province, 2009-2011 .......................................................... 67
2.19: Number of dormitories, number of enrolled boardersin NSS and boarder to dorm ratio by Province, 2009-2011 .......................................................... 67
2.20: Number of dormitories, number of enrolled boarders in RTC and boarder to dorm ratio by Province, 2009-2011 .......................................................... 68
2.21: Pupil to toilet ratio in Early Childhood Education by Province, 2009-2011 ................................................................................................................................ 69
2.22: Pupil to toilet ratio in Primary Schools Education by Province, 2009-2011 ................................................................................................................................ 69
2.23: Pupil to toilet ratio in CHS by Province, 2009-2011 ........................................................ 69 2.24: Pupil to toilet ratio in PSS by Province, 2009-2011 ......................................................... 70
2.25: Pupil to toilet ratio in NSS by Province, 2009-2011 ........................................................ 70
2.26: Number of ECE centres with access to clean and safe water by Province, 2009-2011 .............................................................................................................. 72
2.27: Number of PS centres with access to clean and safe water by Province, 2009-2011 .......................................................................................................................... 72
2.28: Number of CHS centres with access to clean and safe water by Province, 2009-2011 .............................................................................................................. 72
2.29: Number of PSS centres with access to clean and safe water by Province, 2009-2011 .............................................................................................................. 73
2.30: Number of NSS centres with access to clean and safe water by Province, 2009-2011 .............................................................................................................. 73
2.31: Number of CHS with workshops by Province, 2009-2011 ............................................ 75
2.32: Number of PSS with workshops by Province, 2009-2011 ............................................ 75 2.33: Number of NSS with workshops by Province, 2009-2011 ............................................ 75
3.1: Total Number of trained and untrained teachers for ECE by gender and Province, 2009-2011 ........................................................................................................ 77
3.2: Total Number of trained and untrained teachers for PS by gender and Province, 2009-2011 ........................................................................................................ 77
3.3: Total Number of trained and untrained teachers for Secondary by gender and Province, 2009-2011 .......................................................................... 77

7
3.4: Total Number of trained and untrained teachers for TVET by gender and Province, 2009-2011 ........................................................................................................ 78
3.5: Number of Primary Education teacher in management roles by trained and untrained by Province, 2009-2011 ...................................................................... 78
3.6: Number of Secondary Education teacher in management roles by trained and untrained by Province, 2009-2011 ........................................................... 78
3.7: Number of TVET teacher in management roles by trained and untrained by Province, 2009-2011 ............................................................................................ 79
3.8: Pupil/teacher rato, pupil trained teacher ratio and pupil untrained teacher ratio for ECE, 2009-2011................................................................................... 80
3.9: Pupil/teacher rato, pupil trained teacher ratio and pupil untrained teacher ratio for Primary, 2009-2011 ........................................................................... 80
3.10: Pupil/teacher rato, pupil trained teacher ratio and pupil untrained teacher ratio for Secondary, 2009-2011 ..................................................................... 80
3.11: Pupil/teacher rato, pupil trained teacher ratio and pupil untrained teacher ratio for TVET, 2009-2011 ................................................................................ 81
3.12: Number and percentage of primay schools with libraries, 2009-2011 ..................................................................................................................................................... 81 3.13: Number and percentage of CHS with libraries, 2009-2011 .......................................... 81
3.14: Number and percentage of PSS with libraries, 2009-2011 ........................................... 82 3.15: Number and percentage of NSS with libraries, 2009-2011 .......................................... 82
3.16: Number of primary schools with storage, 2009-2011 .................................................... 82 3.17: Number of CHS with storage, 2009-2011 ............................................................................. 83 3.18: Number of PSS with storage, 2009-2011 ............................................................................. 83
3.19: Number of NSS with storage, 2009-2011 ............................................................................. 83
3.20: Number of textbooks and pupil to textbook ratio for primary schools, 2009-2011 ................................................................................................................. 84
3.21: Number of textbooks and pupil to textbook ratio for CHS, 2009-2011 ..................................................................................................................................................... 84
3.22: Number of textbooks and pupil to textbook ratio for PSS, 2009-2011 ..................................................................................................................................................... 84
3.23: Number of textbooks and pupil to textbook ratio for NSS, 2009-2011 ..................................................................................................................................................... 85
3.24: Number of ECE with access to computer by province, 2009-2011 ..................................................................................................................................................... 85
3.25: Number of Primary Schools with access to computer by province, 2009-2011 ................................................................................................................................. 85
3.26: Number of CHS with access to computer by province, 2009-2011 ..................................................................................................................................................... 86
3.27: Number of PSS with access to computer by province, 2009-2011 ..................................................................................................................................................... 86
3.28: Number of NSS with access to computer by province, 2009-2011 ..................................................................................................................................................... 86
3.29: National SISTA 1 overall Literacy level of achievements in 2010 compared to baseline year 2005/2006 .................................................................................. 87
3.30: National SISTA 1 overall Literacy level of achievements in 2010 by gender compared to baseline year 2005/2006 ............................................................ 87
3.31: National SISTA 1 Literacy level of achievements by strand in 2010 compared to baseline year 2005/2006 ............................................................................. 87

8 Solomon Islands
3.32: National SISTA 1 overall numeracy level of achievements in 2010 compared to baseline year 2005/2006 ............................................................................. 87
3.33: National SISTA 1 overall numeracy level of achievements in 2010 by gender compared to baseline year 2005/2006 ....................................................... 88
3.34: National SISTA 1 numeracy level of achievements by strand in 2010 compared to baseline year 2005/2006 ............................................................... 88
3.35: National SISTA 2 overall Literacy level of achievements in 2010 compared to baseline year 2005/2006 .................................................................................. 88
3.36: National SISTA 2 overall Literacy level of achievements in 2010 by strand compared to baseline year 2005/2006 .............................................................. 88
3.37: National SISTA 2 Literacy level of achievements by sub-strand in 2010 compared to baseline year 2005/2006 ............................................................... 89
3.38: National SISTA 2 overall lietarcy level of achievements by province in 2010 compared to baseline year 2005/2006 .......................................................... 89
3.39: National SISTA 2 overall numeracy level of achievements in 2010 compared to baseline year 2005/2006 ............................................................................. 89
3.40: National SISTA 2 numeracy level of achievements by main strand in 2010 compared to baseline year 2005/2006 ............................................................... 89
3.41: National SISTA 2 numeracy level of achievements by sub-strand in 2010 compared to baseline year 2005/2006 ............................................................... 89
3.42: National SISTA 2 overall numeracy level of achievements by province in 2010 compared to baseline year 2005/2006 .................................................... 90
5.1: Repetition rate at primary education level by province, 2009-2011 ................................................................................................................................................................ 91
5.2: Repetition rate at junior secondary education level by province, 2009-2011 ................................................................................................................................. 91
5.3: Repetition rate at senior secondary education level by province, 2009-2011 ................................................................................................................................. 91
5. 4: Survival (completion) rate and cumulative survival rate from prep for all Provinces and SI, 2009-2011 ............................................................................. 93
6.1. Number of vacancies for teachers approved by TSC for Education Authorities, 2008-2010 ...................................................................................................... 98
6.2: Required number number of teacher establishment approved for education authorities by TSC, 2008-2012. .......................................................... 99 6.3: Number of Education Staff by Province, 2008-2010. ........................................................ 99
6.4: Number of vacancies for other education staff by province requested by MEHRD, 2008-2012. ..................................................................................................... 99
6.5: Number of Vacancies for MEHRD officers requested by MEHRD, 2008-2012. ................................................................................................................................ 100
6.6: Number of Teachers on In-service supernumerary training 2009-2012. .................................................................................................................................................. 100
7.1: Total SIEMIS school census return and entry rate, 2008-2010. ........................................................................................................................................................................ 102 7.2: SIEMIS school census return and entry rate by education sector, 2008-2012.................................................................................................................................... 102
7.3: SIEMIS school census form return and entry rate by Education Authority, 2008-2010. .............................................................. Error! Bookmark not defined. Table 6.10: Total number of policies developed and approved by cabinet in 2006-2010. ............................................................................................................................ 103

9
List of Figures Figure 1. Percent Change in GER and NER for ECE by Gender 2011 compared to 2009. ......................................................................................................................... 12
Figure 2. Percent Change in GIR and NIR for primary by Gender, 2011 compared to 2009. ......................................................................................................................... 13
Figure 3: Percent Change in GER and NER for Primary Education by Gender, in 2011 compared to 2009. ...................................................................... 13
Figure 4: Percent Change in GER and NER for Junior Secondary Education by Gender in 2011 compared to 2009 ........................................................................ 14
Figure 4: Percent Change in GER and NER for Senior Secondary Education by Gender, NEAP Baseline Year (2007) to Current Year (2010) ................................................................................................................................................... 14
1.0: Gross and Net Enrolment Rate for ECE by Gender, 2009-2011 ................................................................................................................................................................ 19
1.2: Gross Intake Rate (GIR) and Net Intake Rate (NIR) for Primary Education, 2009-2011 ............................................................................................................ 20
1.3: Gross and Net Enrolment Rate for Primary Education by Gender, 2009-2011 .................................................................................................................................... 21
1.5: Gross and Net Enrolment Rate for Senior Secondary Education by Gender, 2009-2011 ....................................................................................................... 22 3.1: Trained and untrained teacher by sector for 2009-2011 ................................................. 28
3.2: Total nr. of trained and untrained teachers in management positions, 2009-2011 ............................................................................................................................... 29
3.3: The ratio of pupil/teacher/trained and untrained ratio by education sector, 2009-2011 ................................................................................................................ 30
3.4: The national overall literacy achievement levels at year 4 in 2010 compared to the baseline year 2005/2006. .......................................................................... 33
3.5: The national overall literacy achievement levels by gender at year 4 in 2010 compared to the baseline year 2005/2006. .................................................. 33
3.6: The national overall literacy achievement by Lc and L3+ at year 4 in 2010 compared to the baseline year 2005/2006. ....................................................... 34
3.7: The national overall numeracy achievement levels at year 4 in 2010 compared to the baseline year 2005/2006. .................................................................... 34
3.8: The national numeracy achievement levels by gender at year 4 in 2010 compared to the baseline year 2005/2006. ....................................................... 35
3.9: The national numeracy achievement levels by strands at year 4 in 2010 compared to the baseline year 2005/2006. ....................................................... 36
3.10: The national overall literacy achievement levels at year 6 in 2010 compared to the baseline year 2005/2006. .......................................................................... 37
3.11: Achievement levels in the national literacy strands at year 6 in 2010 compared to 2005/2006. ..................................................................................................... 37
3.12: Achievement levels in National Literacy by Sub-Strands at year 6 in 2010 compared to the baseline year 2005/2006. ....................................................... 38
The Lc level for comprehension and vocabulary shows some positive progress by 24% and 8% respectively in 2010 compared to 2005/2006, but these Lc levels are still high indicating that the majority of the learners don’t perform satisfactorily in these areas. ............................................................................................................................................................. 38
3.13: National Literacy achievement levels by Province at year 6 in 2010 compared to the baseline year 2005/2006. .................................................................... 38

10 Solomon Islands
3.14: National Overall Numeracy Achievements levels in 2010 compared to 2005/2006. ......................................................................................................................... 39
3.15: National Numeracy Achievements levels by strands in 2010 compared to 2005/2006. ......................................................................................................................... 39
3.16: National Numeracy Achievements levels by sub-strands in 2010 compared to 2005/2006. .............................................................................................................. 40
3.17: National Numeracy achievement levels by Province at year 6 in 2010 compared to the baseline year 2005/2006. ................................................................. 40
5.2: Repetition rates for primary, junior secondary and senior secondary for 2009-2011 ....................................................................................................................... 42
5.3: National survival rates for all school levels from prep to form six, 2009-2011 .................................................................................................................................. 43
5.4: National transition rates for SISEE, SIF3, SISC and PSSC, 2009-2011 ..................................................................................................................................................... 45
5.5: GPI for enrolment rates for SISEE, SIF3, SISC and PSSC, 2009-2011 ..................................................................................................................................................... 45
5.6: GPI for xtransition rates for SISEE, SIF3, SISC and PSSC, 2009-2011 ..................................................................................................................................................... 46
6.1: Number of vacancies for teachers and trainers approved by TSC by Education Authority, 2009-2011 ......................................................................................... 47
6.2: Number of vacancies for teachers and trainers approved by TSC for Solomon Islands, 2009-2011 ............................................................................................... 47
6.3: Number of teacher establishment posts approved by TSC by Education Authority, 2009-2011 ......................................................................................................... 48
6.4: Number of teachers, trainers and instructors approved by TSC for Solomon Islands, 2008-2010 ............................................................................................... 48
6.5. Number of education staff reported by province, 2009-2011 ........................................ 49
6.6. Number of vacancies for education staff reported by province, 2009-2011 ................................................................................................................................. 49
7.1: Total school census form received from schools and entered into SIEMIS, 2009-2011 .......................................................................................................... 50
7.2: Total school census form received by education sector, 2009-2011 ..................................................................................................................................................... 51
7.3: Total school census form entered into SIEMIS by education sector, 2009-2011 ...................................................................................................................................... 51
11
Acronyms and Abbreviations CDD Curriculum Development Division CHS Community High Schools EA Education Authorities ECE Early Childhood Education EFA Education for All GER Gross Enrolment Rate GIR Gross Intake Rate GPI Gender Parity Index HRD Human Resource Development JS Junior Secondary Education MDG Millenium Development Goals M&E Monitoring and Evaluation MEHRD Ministry of Education and Human Resources Development MoFT Ministry of Finance and Treasury MPS Ministry of Public Service NER Net Enrolment Rate NIR Net Intake Rate NESU National Examination and Selection Unit NSO National Statistics Office NSS National Secondary School PAF Performance Assessment Framework PCRU Planning, Coordination and Research Unit PE Primary Education Pri Primary Sector PS Primary School PSS Provincial Secondary School PSSC Pacific Secondary School Certificate RTC Rural Training Centre SE Secondary Education SIEMIS Solomon Islands Education Mangement Information System SIF3 Solomon Islands Form 3 Examination SIG Solomon Islands Government SISC Solomon Islands Secondary Certificate SISEE Solomon Islands Secondary Entrance Examination SISTA Solomon Islands Standardized Test of Assessment SS Senior Secondary Education TSC Teaching Service Commission TSD Teaching Service Division TWGQ Technical Working Group Quality TWGM Technical Working Group Monitoring ÙBE Universal Basic Education

12 Solomon Islands
Overview summary for the Education For All Goals This section is a snap shot of the progress made in the Solomon Islands education sector against the EFA goals comparing 2011 with 2009. The participation and access indicators reported in this PAF 2011 uses the latest 2009 population census data as the baseline.The chapters report in more details about the progress made towards the national goals of improving Access, Quality and Management for the period 2009-2011. Goal 1: Expanding and improving early childhood care and education for all children of age 3-5 in the Solomon Islands.
The ECE enrolment only increases with 725 (3%) children in 2011 compared to 2009. This is an increase of 313 (2.9%) girls and 412 (3.6%) boys. This has indicated that though the Government of Solomon Islands through the Ministry of Education and Human Resources Development has recognised the importance of providing good quality Early Childhood Care and Education, there is not much improvent in access over this reporting period. See annex 1 table 1.1.
Figure 1. Percent Change in GER and NER for ECE by Gender 2011 compared to 2009.
Source: SIEMIS
The GER for this reporting period seems to remain the same in 2011 compared to 2009. This low Gross Enrolment Rate has indicated low participation in the ECE sector. The Net Enrolment Rate drops by 1.5% in 2011 compared to 2009. This indicates that while fewer children did enroll in absolute numbers, compared to the increase of population for the age group 3-5 years, the ratio of children with the official age going to ECE declines in 2011 compared to 2009. However, the GPI was above 1 in 2009 and 2011 which means more girls were registered in ECE-centres compared to boys.
Goal 2. Achieving Universal Primary and Equitable Access to Basic Education
The primary enrolment has increased with 5,101 (4.4%) with an increase of 2,606 (4.7%) for girls and 2,495 (4.1%) for boys in 2011 compared to 2009. There is also a slight improvement towards girls in the Gender Parity Index (GPI) from 0.9 to 0.91 which has indicated that the number of girls attending to primary education increases more than the dorminant number of boys. See annex 1, table 1.2.

13
Figure 2. Percent Change in GIR and NIR for primary by Gender, 2011 compared to 2009.
Source: SIEMIS
The high Gross Intake Rate (GIR) has indicated that there are still over- aged children enrolling in year 1 primary over this reporting period which is also indicated by the below 50% Net Intake Rate (NIR) over this reporting period. It seems that most of the children enrolling at year one were above 6 years, the official entry age in primary.
Figure 3: Percent Change in GER and NER for Primary Education by Gender, in 2011 compared to 2009.
Source: SIEMIS
The GER and NER for primary education decreases by 1.96% and 1.98% respectively in 2011 compared to 2009. The high GER has indicated that there are still more children above the age group 6-11 enrolling at the primary education level and there is enough space at the primary level to accommodate the official age of primary school children in

14 Solomon Islands
the population. Another indication of the high GER is that there are still late starters at the primary education level.
Figure 4: Percent Change in GER and NER for Junior Secondary Education by Gender in 2011 compared to 2009
Source: SIEMIS
The GER and NER increased with 1.3% and 1.4% respectively in 2011 compared to 2009. The GPI for GER has indicated that there are more over aged boys enrolling at the junior secondary level compared to girls. This has also reflected in high NER GPI.. The low GER overal denotes that there is not enough space available at JSS to accommodate the official population age of 12-13 .However, the enrolment has increased with 2,213 (8.8%). The female increased by 1,372 (11%) and male, 841 (6.3%) in 2011 compared to 2009. See annex 1, table 1.3.
Goal 3: Promote quality learning and skills for both young people and adults. Though, it is a bit difficult to report on Goal 3, the Solomon Islands Education Sector has incorporated programmes for achieving this goal at the Senior Secondary Education Level (year 10 to year 13) and at the Technical, Vocational, Education and Training (TVET) level. Unfortunatly data from TVET subsector are still not complete so it is not reported in the PAF report. Figure 4: Percent Change in GER and NER for Senior Secondary Education by Gender, NEAP Baseline Year
(2007) to Current Year (2010)

15
Source: SIEMIS
At the senior education level, there is some progress made in enrolments in 2011 (15,525) compared to 2009 (13,598). See annex 1, table 1.4. This is an increase of about 14.2%. The GER and NER also increase with 5.9% and 3% respectively. The GPI declines for the GER in 2011 denotes that there are more overage male students enrolling at the senior secondary education level than girls. However, the NER remains the same for this period. The GER for senior seconday education level is the lowest compared to Early Childhood Education, Junior Secondary and Primary education level. This has indicated that the avaible participation space at the senior secondary education is very low compared to the official population age group. Goal 4: To achieve 50% improvement of adult literacy by 2015 in the Solomon Islands for both women and men. We have no complete or reliable data on adult literacy. However, some NGOs and the National Statistics Office Bureau in the Ministry of Finance and Treasury have done surveys and census to collect data on adult literacy in 2008 and 2009. Goal 5: Achieve gender parity in primary and secondary education by 2005, and achieve gender equality by 2015. GPI has clearly improved for ECE, Primary and Secondary Education. However we have no systematic data about gender equality which includes social-geographic, income and cultural information and data in our education system. A study is planned to know more about the main factors for lower girls’ participation compared to boys’ participation in secondary schools. Goal 6: To improve quality of Education in the Solomon Islands. The Government of Solomon Islands has fully recognised that by just simply providing schools and teachers full access to and participation by all students can not be guaranteed. It therefore has developed an education strategic framework to spend more attention to quality issues such as teacher training programmes, reform school curriculum and provision of curriculum materials to schools, focusing on school assessment systems,
16 Solomon Islands
improving learning outcomes in particular in literacy and numeracy, the effectiveness of the inspectorate, school committee/board training, improving preparedness for emergencies etc. This should result in improving completion, drop out rates at all levels of education. At year 4 and 6 at the primary level, we have conducted the Solomon Islands Standardized Test of Archivements 1 and 2 respectively with the support from the South Pacific Commission (SPC) through the South Pacific Board Education and Assessment (SPBEA) to measure the progress made in literacy and numeracy level at the two respective school levels. It is evident that, there was some progress made in literacy and numeracy in 2010 compared to 2005/2006, the baseline years, but there is still serious concern as almost half of the students in year 4 and 6 do not achieve the required levels for literacy and numeracy.

17
Introduction The Performance Assessment Framework (PAF) reports about the ambitious national process in correlation with the international agreements to achieve the Millenium Development Goals (MDG’s, 2 and 3) and Education for All (EFA) and to offer good and relevant learning opportunities for all children, youths and adults in the Solomon Islands. The purpose for developing the PAF is to facilitate the monitoring of the general progress of the Sector Wide Approach education programme in the Solomon Islands which has been implemented through the National Education Action Plans and the Provincial Education Action Plans. These plans relate to the longer term education frameworks, such as the national Education Strategic Framework 2007-2015 and the regional Pacific Education Development Framework. The PAF was developed on the basis of a comprehensive set of agreed indicators related to all the main expected outputs and outcomes in the National Education Action Plan. The overaching goal is to measure the progress of the education sector against the ambitious targets of the EFA and the Millennium Development goals and three national strategic education goals to be met by 2015; improved access/infrastructure, quality and management. The PAF aims to give a ‘quick scan’ of the education sector and to indicate the progress towards the three main goals of the medium term. This report is an assessment of the level of achievement of the national and the global MDG and EFA tagets. It also helps the Ministry to identify and locate existing gaps and challenges related to policy areas in access, quality and equity and management, and to focus on disadvantaged and underserved areas in the Solomon Islands. The indicators cover access, infrastructure, quality and efficient financial management of resources. The PAF captures all sub sector levels: Early Childhood Education (ECE), Primary Education, Junior Secondary Education, Senior Secondary Education and Technical and Vocational Education and Training (TVET). It also aims to capture data at the tertiary education sub sector for SICHE and USPSI since 2009. However, the complete collection of these sub sector data is yet to be done. The progress within the Education Sector has been based on the data available in the Solomon Islands Education Management Information System (SIEMIS). There are different survey forms (SIEMIS forms) developed and used for the education sub-sectors. These survey forms have been sent from the central Ministry of Education to all School Head Teachers, Principals and Directors on an annual basis. It is also their responsibility to ensure that all the information requested in the questionnaire is correctly and accurately recorded. The survey forms need to be submitted by the Ministry not later than 1st of November to the Education Authorities for distribution to their respective schools and the schools and Education Authorities should send the forms back on time in order the Ministry receives all forms not later than 31st March every year. The survey forms have four sections. The first section collects general information about school; the second section collects statistical data about student enrolment classes, data on repeaters, drop outs, transfers and grade progression. The third section collects information

18 Solomon Islands
about teacher and teacher training and the fouth section collects statistical data about school and classroom facilities and educational resources. The forms are now under review. When assessing data quality there are many aspects that we have to consider. High quality statistics must be timely and accessible. Evidence based and good decision and policy making is very much based on reliable and complete data. Therefore the monitoring evaluation committee and the Technical Working Group Monitoring have been working on producing national and international comparable data that we can monitor and use for benchmarking of the progress in the education sector towards achieving the MDG- and EFA goals. National and international comparable data are valuable resources for countries to learn from each other and they support policy and decision makers to make informed decisions in areas as policy making, education planning, review and reform. We have now utilised the population survey data in 2009 which clarifies some of the differences with data in the last PAF 2007-2009. We believe that the GER and NER given now in this PAF 2009-2011 are more realistic than what we have produced before, which was based on the undersestimated population data since 1999. We realise that the PAF (as a summary of data) and SIEMIS (the complete database) as statistic tools are not sufficient to understand all details of the progress and challenges in the education sector. Qualitative analysis of the quality of education is also needed. In order to provide more data and information on the quality of teaching and learning in the schools, more classroom observations, assessments and research is needed. In 2010 MEHRD carried out the Solomon Island Standardised Test of Achievements I (SISTA I) and Solomon Island Standardised Test of Achievements II (SISTA II) on literacy and numeracy levels of which are reflected in chapter 3 on quality. In the long term, when the Learners’ Assessment Policy is fully implemented more information on the quality of education will be available in the PAF. Also the Ministry implemented studies on the Barriers of Education and school grants, which will add qualitative information to the PAF. Though the PAF can be still improved in terms of accuracy, completeness and timeliness, we hope that this PAF 2009-2011 will be used by all Ministry staff and other stakeholders to measure general progress. We also hope that it will encourage staff to utilise data for more result oriented reporting and planning. In the meantime we will make an effort to produce a timely PAF as we realise that this PAF 2009-2011 is more than a year behind. We are now already in 2012. Without these timely data we are lost and can’t take informed decisions. Wish you a decisive and fruitful year.
Noelyne Biliki Director Planning, Coordination and Researc Unit Ministry of Education and Human Resources Development

19
Chapter One: Access Indicators Demand
Participation in Early Childhood Education Early Childhood Enrolment
ECE total enrolment has slightly increased with 3.3% in 2011 compared to 2009’. An increase of 2.9% female and 3.6% male respectively.. The gender balance enrolled in schools has indicated a slight decrease from 0.94 in 2009 to 0.93 in 2011. See annex 1, table 1.1. 1.0: Gross and Net Enrolment Rate for ECE by Gender, 2009-2011
Source: SIEMIS
The GER and NER has indicated a fluctuation trend for the period 2009 to 2011. The low GER also denotes that there is not enough space available to accommodate all ECE population official age children in the ECE education level which has resulted in the below 50% participation over this reporting period. This data shows that about 13.1% of all the children who had enrolled in ECE are over aged.
The data challenge faced in the ECE-sub-sector is that not all ECE centres reported in the PAF 2009-2011 are registered. According to ECE annual report for 2011 only 219 ECE centeres are registered. This means that other unregistered ECE centres also reports through the annual school census form. The decline of the ECE centres as shown in annex 2, table 2.1 might indicate excluding of some ECE centres from receiving assistance from the government because of the terms of reference provided by the ECE policy and probably accessibility. This might result in the fluctuation of the data reported in the PAF because of the on and off or closer of some ECE centres. . To

20 Solomon Islands
address this issue, all functional and proposed ECE- centres in the Solomon Islands should be mapped and registered. More ECE teachers should be trained and the ECE policy should be reviewed to address the practical issues such as closing down of ECE centres because of no support from government and communities, and no accessibility.
Access to Primary Education
1.2: Gross Intake Rate (GIR) and Net Intake Rate (NIR) for Primary Education, 2009-2011
Source: SIEMIS
The e high GIR for year 1 primary has indicated a high degree of access to primary education level and has enough capacity to enroll all age 6 children in the population. However, the NIR shows very low participation by the statutory age children in year 1 which has indicated bymore over aged children enrolling in year 1 for this reporting period. Other factors such as access, geographical isolation, prioritization the value of education, parents support, knowing the right age for children to enter year 1 by the general population in the Solomon Islands might become some of the contributing factors to this low NIR.
The GPI figures for NIR indicate that the share of girls in the total intake rate is higherand is larger than that of boys for all years reported on. The GPI for GER shows a steady progress over the same period.
Participation in Primary Education
The 2011 enrolment in primary has increased with 4.4% in 2011 compared to 2009 with an increase of 2.2% for girls and 4.1%% boys. The GPI for primary education remains the same at 0.91 in 2011 compared to 2009. However, there are still more boys than girls in primary education. The primary education has the highest enrolment compared to other education sub sectors. See annex 1, table 1.2.

21
1.3: Gross and Net Enrolment Rate for Primary Education by Gender, 2009-2011
Source: SIEMIS
The total GER and NER declines ove time in this reporting period. The high GER has indicated a high degree of participation by both the unofficial age and the official age (6yrs-11yrs). It also denotes in principle that the primary education level is able to accommodate all of the primary school-aged population. About 44.3% of children enrolled in primary are either underaged or over age in 2011. This has indicated that there are many late starters in year 1 primary.
Pupils with special needs
The reported number of pupils with special needs enrolled in primary education has increased in 2011 by 18% compared to 2009. Malaita has the highest number of children with special needs in its schools, followed by Guadalcanal and Western Province. Renbel has the lowest number of enrolled children with special needs in their schools in 2011. See annex 1, table 1.16.
Participation in Junior Secondary Education
The total enrolment in junior secondary education has increased with 8.8% in 2011 relatively to 2009. There is an increase of female, 11.8% and male students, 6.3%. See annex 1, table 1.3.
The GPI of 0.91 in 2011 compared to 0.86 in 2009 shows a positive progress towards more girls enrolling in junior secondary schools compared to boys.
22 Solomon Islands
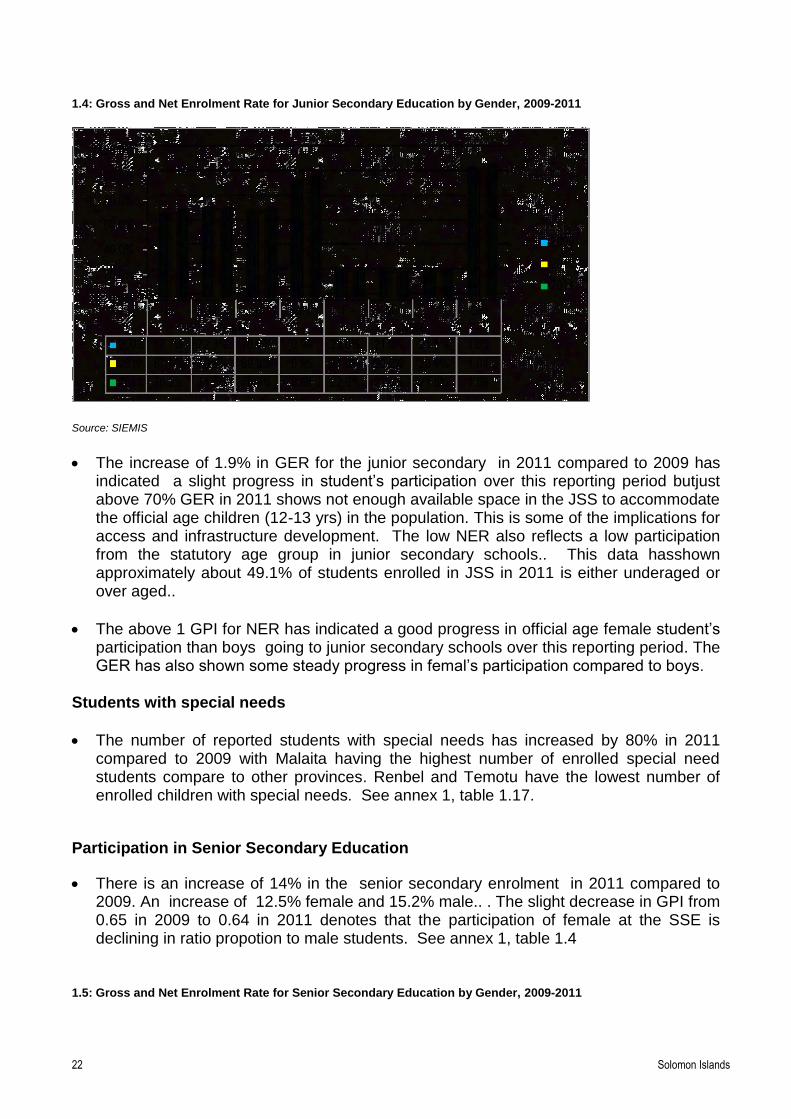
1.4: Gross and Net Enrolment Rate for Junior Secondary Education by Gender, 2009-2011
Source: SIEMIS
The increase of 1.9% in GER for the junior secondary in 2011 compared to 2009 has indicated a slight progress in student’s participation over this reporting period butjust above 70% GER in 2011 shows not enough available space in the JSS to accommodate the official age children (12-13 yrs) in the population. This is some of the implications for access and infrastructure development. The low NER also reflects a low participation from the statutory age group in junior secondary schools.. This data hasshown approximately about 49.1% of students enrolled in JSS in 2011 is either underaged or over aged..
The above 1 GPI for NER has indicated a good progress in official age female student’s participation than boys going to junior secondary schools over this reporting period. The GER has also shown some steady progress in femal’s participation compared to boys.
Students with special needs
The number of reported students with special needs has increased by 80% in 2011 compared to 2009 with Malaita having the highest number of enrolled special need students compare to other provinces. Renbel and Temotu have the lowest number of enrolled children with special needs. See annex 1, table 1.17.
Participation in Senior Secondary Education
There is an increase of 14% in the senior secondary enrolment in 2011 compared to 2009. An increase of 12.5% female and 15.2% male.. . The slight decrease in GPI from 0.65 in 2009 to 0.64 in 2011 denotes that the participation of female at the SSE is declining in ratio propotion to male students. See annex 1, table 1.4
1.5: Gross and Net Enrolment Rate for Senior Secondary Education by Gender, 2009-2011

23
Source: SIEMIS
The GER and NER for SSEhave indicated some steady progress over this reporting period. However, the participation of students at this level is still below 30% for the GER and just above 17% for the NER which is the lowest in comparison with the basic education level. . The low GER and NER has indicated changing of priorities towards access and education infrastructure at the SSE level to provide more space to accommodate the official age children in the population. . Based on this data it seems that about 10.9% students who were enrolled in SSE are either under aged or over aged in 2011.
Students with special needs
The number of reported students with special needs in the senior secondary education has increased by 472.4% in 2011 compared to 2009.. Western and Malaita provinces has the highest disappled chidren in their schools.

24 Solomon Islands
Chapter Two: Infrastructure Indicators
Schools
Based on the 2011 ECE division annual report, a total of 219 (45.4%) ECE centres have been registered of the total 482 ECE centres reported throughout the Solomon Islands in 2011. The number of ECE centres seems to decline by 13.8% in 2011 compared to 2009. Malaita and Western have the highest number of ECE centres and Renbel has the least number of ECE centres over this reporting period.. See annex 2. Table 2.1. The slight reduction in the number of primary schools in 2011 is a result of some primary schools been transitioned to contain the junior secondary education to accommodate the basic education level. So to get the right absolute figure of the total number of primaries, the total number of the primary component of the CHS should be added to the total number of primaries reported. See annex 2, table 2.2.
The increase in the number of Community High Schools is a result of some primary schools been transitioned to accommodate the junior secondary component of the basic education level. This is expected to increase access to students at the junior secondary education level in the secondary education sector. Enrolment is anticipated to increase since more space will be available at the JSS. See annex 2, table 2.2 and 2.3.
The number of PSS and NSS remains the same over this reporting period. This is an apparent reason for low enrolment at the senior education level because there is not enough space available to accommodate all the children who are enrolled in the community high schools up to form three level at the senior secondary education level. See annex 2, table 2.4 and 2.5.
The number of RTC remains steady through out this period 2009-2011. All provinces have RTC except for Choisuel Province who is yet to have one. Guadalcanal (7), Malaita (6) and Western (6) have the highest number of RTC while other provinces have one RTC each. Most of these RTC’s are runned under church education authorities.
Pupil to classroom ratio
Pupil to classroom ratio in primary has generally improved over the years 2009-2011. All provinces show ratio under the standard of the Ministry which is 35. (1 classroom occupied by a maxium of 35 students). However, it is still worse for Honiara overtime since 2009. The increase for Honiara may be explained as the result of the urban migration and the impact of the fee free basic education and the thinking by parents that schools in town are generally better facilitated than rural schools. Rennnel and Bellona has the least ratio over this reporting period. This has indicated that the infrastructure in place can accommodate all children in the primary education sector. See annex 2, table 2.7.
Pupil to classroom ratio for CHS has improved in 2011 compared to 2009. Honiara shows a different pattern of overcrowded classes at the CHS similar to primary. See annex 2, table 2.8.

25
Pupil to classroom ratio for the PSS has worsened over the period of reporting with 49.6 in 2011 compared to 43.6 in 2009. Honiara with a very high ratio (113.9) in 2011 followed by Malaita which has indicated that many overcrowded classrooms is expected to affect the quality of teaching and learning. The majority of provinces show ratios for provincial secondary schools that falls inline with the accepted level from the Ministry (1/40). The case of Honiara and Malaita indicates that the increasing demand is not meeting the availability of facilities and that more classrooms should be built. See annex 2, table 2.9.
Pupil to classroom ratio for the NSS has worsened (54.3) in 2011 compared to 44.7 in 2009. This still indicate very crowded classrooms. Guadalcanal has the highest (54.9), followed by Western (50.3) and Malaita (42.6).. This ratio has indicated that the demand for NSS is high, but that these schools have no sufficient classrooms to accommodate all the students who have attended year 9 of the basic education level. This has also resulted in the low GER and NER at the senior secondary education level. See annex 2, table 2.10.
Pupil to desk ratios
The Ministry’s standard ratio is 1:1. However schools provide information on both 2- or 1-seaters, which makes the data a bit unreliable and cannot be calculated based on the infrastructure standards. Pupil to desk ratio in primary schools has improved (2.7) in 2011 compared to 2009 at 3.4(= approximately about more than three children sharing one desk). Makira and Malaita have the higest ratios (more than 3 students per desk). However, there seems to be some improvement in all provinces. See annex 2, table 2.12.
It seems that the pupil to desk ratio in CHS has improved in 2011 (2.4) compared to 2009 (4.0), with Rennel and Bellona showing a worsening and high ratio in 2011 (more than 6 children sharing a desk) and Central (more than 3 children sharing a desk) also show high ratios. See annex 2, table 2.13.
The pupil to desk ratio in PSS has worsened in 2011 (2.4) compared to 2009. Isabel province shows some improvement (3.1) in 2011 compared to 7.1 in 2010 but still has the most negative trend other provinces have shown some positive trend towards achieving the ratio of 1:1 except for Temotu and Guadalcanal. See annex 2, table 2.14
The pupil to desk ratio in NSS improved from 9.3 in 2009 to 3.1 in 2011. However, some NSS report the enrolment but they do not report the number of desks that they have. So no clear conclusions can be drawn from such an incomplete data. The same also applies to other education sectors such as TVET. See annex 2, table 2.15.
Dormitory to boarder ratios
The minimum standard for dormitory to boarder ratio is 40 students to 1 open dormitory with a minimum space of 4m2 per student for single bed dorms and 3m2 for bunk bed

26 Solomon Islands
dorms. However, as found through monitoring visits1, most schools do not meet the required minimum standards as prescribed. Most schools have run down dormitories which do not have enough space and ventilation for the students.
The dormitory to boarder ratio in CHS seems to meet the required minimum standard of 1:40. However, most of these dormitories do not meet the required conditions for space to sleep and for students to put some of their possessions. Most dormitories are crowded and do not have good ventilation. Temotu, Isabel and Guadalcanal province reflect the worst situation. See annex 2, table 2.17.
Dormitory to boarder ratio for PSS (53.6) in 2011 is worsening compared to 2009 (42.5). Only Western and Renbel show ratios that are within and close to the Ministry standard of 1:40. No any other provinces meets the minimum standards. Malaita, Guadalcanal and Temotu have the worst situation compared to other provinces. See annex 2, table 2.18.
The NSS present a worsening situation; from 35.3 in 2009 to 52.3 in 2011. Guadalcanal and Malaita seems to meet the minimum standards but the condition of most of these dormitories has been deteriorating and many are no longer fit for student to inhabit. See annex 2, table 2.19.
Pupil to toilet ratios The definition of what type of toilet seems not clear to most head teachers and principals when they report. The report therefore may not reflect the actual number of toilets that have been in use or are not used. It was found during MEHRD monitoing visits 2that in some provinces the toilet facilities were far below the expected requirements and in many cases were not even available at the school. Students generally therefore use dips, holes and seashores.
For the ECE, the ratio has increased to now 23.2, probably because of enrolment increase. The ratio is worst in Honiara, where more than 35 little children may share one toilet. See annex 2, table 2.21.
In primary education, the pupil to toilet ratio has improved slightly from 79.4 in 2009 to 77.4 in 2011, but it still remains high. Only Renbel province meets the minimum standards of 1/40. . Guadalcanal shows the worsest situation compared to other provinces. See annex 2, table 2.22.
In the CHS the situation has worsened from 75.9 in 2009 to 94.9 in 2010. This means that the sanitation situation for CHS is the worst compared to ECE, Primary or Provincial and National secondary schools. None of the provinces had met the minimum standards over time in this reporting period. Central has the worsest situation even to more than 159 students per toilet. See annex 2, table 2.23.
Though there seems to be some improvements made in the pupil to toilet ratio in PSS, the data reported for this period does not well represented since some PSS only reports
1 Southern region of Malaita monitoring report 2010 and Isabel /Western province monitoring tour report 2011
2 Rennel and Bellona monitoring report 2009, Southern monitoring report, 2010, Western and Isabel monitoring report 2011..

27
on enrolment but not on dormitories. However, Temotu seems to have the worsest situation 1:100 in 2011 compared to 1:46.5 in 2009. See annex 2, table 2.24.
Pupil to toilet ratio for the NSS has reduced in 2011 (17.8) compared to 2009(26.5), but all provinces seems to be still well within the minimum standard required. The toilets are counted but the condition might be very poor and unhygienic to be used by students. See annex 2, table 2.25.
Access to clean and safe water Clean and safe water is defined as a source of reliable water supply which is clean and drinkable by all school children and is available from clean water tanks, wells, streams and boreholes. The children should at least have 3 litres of water per day for day schools and 10 litres of water per day for boarding schools.
The provision of clean and safe water provison to ECE has slightly worsened in the period 2009-2011. However, for the schools that have reported, only 35% have clean and safe water in 2011. This is a concern, in particular with the growing enrolment of small children in ECE. It is clear that the minimum requirement for safe and drinking water as stated in the ECE policy is not met. This situation is the worsest in Central and Renbel in 2011. See annex 2, table 2.26.
The primary schools show a delining negative trend below 50%. This indicates that most primary schools do not have access to clean and safe water. It seems that only Renbel (100%) and Temotu (66%) show reasonable provision of clean and safe water. See annex 2, table 2.27.
Though the CHS have shown improvement (from 51% in 2009 to 54% in 2011), the provision of clean and safe water is just above 50%. The PSS and NSS have indicated a higher percentage of clean and safe water provision than other schools respectively of 94% and 56%. See annex 2, table 2.28.
Workshops
Most NSS and PSS have workshops while most CHS do not have workshops. The number of workshops in CHS grows gradually, but is still insufficient to meet the demands of a growing school population while the number of workshops in PSS and NSS seems to remain the same as in 2009 and 2011. Most schools seems to have lesser number of workshops than the number required to cater for the different specialized subject areas that are taught in the schools overtime in this reporting period. See annex 2, table 2.31, 2.32, and 2.33.

28 Solomon Islands
Chapter three: Quality Indicators Most of the indicators used in this section such as trained and untrained teachers, pupil/teacher ratio, pupil to text book ratios, and access to computers are some of the proxy indicators used to measure quality. However in 2010 and 2011 the results for the Solomon Islands Standardised Test of Achievement 1 and 2 implemented at year four and six in the primary education level was made available to measure the progress in literacy and numeracy.
Trained and Untrained Teachers 3.1: Trained and untrained teacher by sector for 2009-2011
Source: SIEMIS
The percentage of trained teachers in ECE has increased by 49.5% in 2011 compared to 2009. This has indicated that more ECE teachers have been undergoing ECE training in this reporting period and have been successful. However, the share of untrained teachers in this subsector is still the highest compared to other sub sectors. See annex 3, table 3.1.
In the primary, the number of trained teachers increased by only 1.1% in 2011 compared to 2009. However, it declines by 1.3% in 2010 relatively to 2009. The number of untrained teachers reduces by 22.3%, which means in this period EAs have continued to recruit more trained teachers. . See annex 3, table 3.2
The trained teachers atthe secondary education levelhave increased by 18.4% in 2011 compared to 2009 while the untrained teachers alsoincreases by 12.3% in the same reporting period. This has indicated that Education Authorithies continues to recruit both the trained and untrained teachers to meet the teacher demand at the secondary education level.

29
In TVET the percentage of trained teachers reduces by 11.7% in 2011 compared to 2009 while the number of untrained teachers increased by 50.9%. This denotes that more untrained teachers have been recruited to teach in the Rural Training Centres to cater for the teacher demand while some trained teachers are leaving this profession to other jobs.
.
Teachers in management roles
3.2: Total nr. of trained and untrained teachers in management positions, 2009-2011
Source: SIEMIS
The number of primary trained school managers increases by 5.2%in 2011 compared to 2009.. It seems that some schools still managed by untrained teachers in this reporting period and has increased by 42.4% in 2011.. Though there is a slight increase in the female’s participation at the management level the GPI of 0.25 in 2011 has indicated a very low participation by female compared to men.. See Annex 3, table 3.5.
For the secondary level, the trained managers had increased by 6.9% in 2011 while the untrained teachers was reduced by 17.9% for the same period. There has been some improvements in female’s teachers participation at the management level but there is still a very low representation of females in management positions at secondary schools which is indicated by the GPI of 0.08 in 2011. There is also still untrained managers holding the management positions in some secondary schools.See Annex 3, table 3.6.

30 Solomon Islands
Pupil/teacher/Trained/Untrained ratio The pupil/trained/ teacher ratio has been used as a proxy indicator to quantify the quality of teaching in the classroom. Some may argue that some untrained teachers may peformed their duties better than some trained teachers but the analysis here is generally based the assumption that when there are more trained teachers in the system, there is likely to be better and correct delivery of the curriculum materials that can result in effective and efficient measurable learning outcomes in the classroom. 3.3: The ratio of pupil/teacher/trained and untrained ratio by education sector, 2009-2011
Source: SIEMIS
The pupil-teacher ratio for ECE has improved with 17.4 in 2011 compared to 19.8 in 2009. It is just above the ECE-policy target ratio of 1:15 expected to be achieved by 2015. Evidently, some ECE centres are still over crowded and showed high pupil-teacher ratios even up to1:30 observed during MEHRD monitoring visits3. Because the percentage of trained teachers is still very lowconsequently the certified (trained) teacher-student ratio is relatively high. In other words, few children have a certified ECE teacher. See annex 3, table 3.8.
Pupil–teacher ratio for primary schools is well below the expected ratio 1:35 according to the basic education policy. It remains at 23.9 in 2011. However, it varies strongly at the provincial level. Honiara for instance has the highest ratio of 31.4 and Rennel andBellona with the lowest ratio of 18.0. See annex 3, table 3.9.
3 Western provincial monitoring visit report, 2.011,
Isabel provincial monitoing visit report, 2011

31
The pupil-teacher ratio reported in 2011 for secondary education is 1: 23.8, which is improving over this period, but is still below the maximum ratio in the basic education policy of 1:40. However, this ratio also varies at the provincial level with Honiara showing again the highest ratio of 1: 55.5, above the policy maximum ratio. Central province showed the lowest ratio of 1:15.1 in 2011. See annex 3, table 3.9 and table 3.10.
The pupil teacher ratio for TVET has also indicated some progress from 19.9 in 2009 to 15.6 in 2011. This has indicated that the RTC has been expanded to accommodate more of the demand population.
Percentage of schools with libraries A library is defined as a place in which literacy and reading materials such as books, periodicals, news papers, pamphlets, tapes, manuscripts and other materials are made available for students. Based on the infrastructure minimum standards, library shelving should be secure and water resistant. It can be a separate room as stand alone or part of the administration building or a classroom. This definition however, is not always well understood by all teachers when filling in the school census form. It was found that sometimes a storage room is considered as a library by some teachers. Such misunderstanding contributes to the limitation of analyzing information on libraries and storages.
The percentage of libraries at primary schools declined from 76% in 2009 to 65% in 2011 while community high schools showed an upward trend from 58% in 2009 to 60% in 2011, but just over a half of the CHS has a library. It seems that almost all primary schools in Isabel have libraries and Malaita schools have the least number of libraries from 2009 to 2011. See annex 3, table 3.12
88% of the provincial secondary schools and 80% of the national secondary schools have libraries. However, during monitoring tours it became clear that some of these libraries are in poor condition.with no proper updated library materials and resources for teachers and students to use4.
Schools with storage
Although still not every primary and Community High School has a storage, the percentage of schools with stores is growing for all schools, except for PSS where all schools already have storage. In particular the number of stores in CHS’s grew by 17 more stores available compared to 2009.
Pupil to textbook ratios The Ministry’s target is 1 textbook set per subject per student by 2015.
The text book ratio has improved for primary and remains the same for the CHS. However, the ratio increases with the level of education.
Overall, the textbook pupil ratios in 2011 have slightly improved for all levels except for PSS compared to 2009.
4 Rennel and Bellona monitoring report 2009, Southern monitoring report, 2010, Western and Isabel monitoring report 2011

32 Solomon Islands
Access to computers
Very few ECE-centres and primary schools do have computers; only Honiara, Guadalcanal, Malaita, Makira/Ulawa and Western Province have procured or received some in the period 2009-2011.
National secondary, provincial secondary and community high schools have relatively more computers than primary and ECE. The ratio increases with the level of education. However, some of these computers might not be functioning well or not functioning at all. A proper stock take on computers is necessary to make better use of modern information and communication technology in schools.
Literacy and Numeracy Achievement Levels5 The literacy and numeracy rates reported in this PAF are based on the Solomon Islands Standardized Tests of Achievements 1 and 2 of year 4 and 6 in selected schools in November and August 2010 Respectively. The baseline for the SISTA 1 and 2 were set in the year 2005/2006. The detailed report from NESU covers literacy and numeracy by gender, province, strands and skills. However, only the overall data at national level are presented here. There are six levels of achievement that are used to benchmark the pupils’ level of arhievement as outlined below6.
L5: Full mastery of the learning outcome
L4: Substantial mastery of the learning outcome
L3: Moderate mastery of the learning outcome
L2: Minor mastery of the learning outcome
L1: Minimal mastery of the lerning outcome
L0: No mastery of the learning outcome
L1 and L0 are denoted as the Lc (critical underachievement levels). Solomon Islands Standardized Tests of Achievement -SISTA 1
5 Solomon Islands Standardized Tests of Archievement SISTA 2, February 2011, SPBEA, and SPC.
6 Solomon Island Standadized Test of Achievements SISTA 2, p5.

33
3.4: The national overall literacy achievement levels at year 4 in 2010 compared to the baseline year 2005/2006.
Source: NESU, SPBEA,, SPC
The overall national literacy data indicate some improvements on the different literacy achievement levels in 2010 compared to the baseline year 2005/2006 which is reflected in the decrease of the critical levels (Lc) of achievement and an increase in the satisfactory level (L3+). Though there were some improvements made, the overall level of Lc for literacy which is still 47% in 2010 is still a matter of significant concern. This implies that of every pupils who sat for SISTA 1, about 1 in every 2 pupils is struggling with the year 4 English curriculum learning outcomes in certain strands skill areas7. 3.5: The national overall literacy achievement levels by gender at year 4 in 2010 compared to the baseline year
2005/2006.
Source: NESU, SPBEA,, SPC
7 Solomon Islands Standardised Tests of Achievment-SISTA 1, August 2011, NESU, SPC,

34 Solomon Islands
Gender performance in literacy shows little significant difference by levels. On the overall, the females performed better than the males as evident in the overall L3+ level. However, there are still concerns that the Lc values are still higher at 44% and 50% than the L3+ values 35 and 28 respectively for female and male children. 3.6: The national overall literacy achievement by Lc and L3+ at year 4 in 2010 compared to the baseline year
2005/2006.
Source: NESU, SPBEA,, SPC
The results have indiacted that there are decrease in the critical levels (Lc) of underachievement for both the key strands, Reading and Writing. Though there are some significant improvements in the L3+ levels the writing strand still shows higher Lc value of 51% for all achievements. This has implied that that 1 of every 2 pupils still have serious problems in Writing at the end of year 4.
3.7: The national overall numeracy achievement levels at year 4 in 2010 compared to the baseline year 2005/2006.
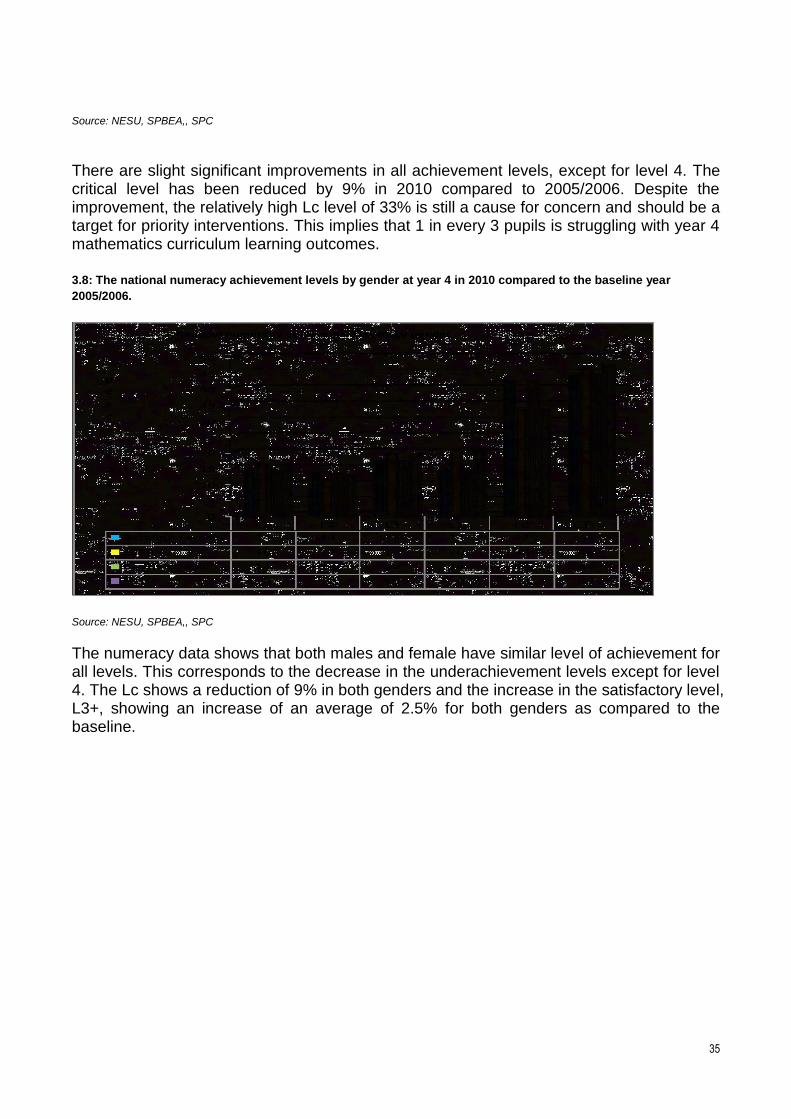
35
Source: NESU, SPBEA,, SPC
There are slight significant improvements in all achievement levels, except for level 4. The critical level has been reduced by 9% in 2010 compared to 2005/2006. Despite the improvement, the relatively high Lc level of 33% is still a cause for concern and should be a target for priority interventions. This implies that 1 in every 3 pupils is struggling with year 4 mathematics curriculum learning outcomes. 3.8: The national numeracy achievement levels by gender at year 4 in 2010 compared to the baseline year
2005/2006.
Source: NESU, SPBEA,, SPC
The numeracy data shows that both males and female have similar level of achievement for all levels. This corresponds to the decrease in the underachievement levels except for level 4. The Lc shows a reduction of 9% in both genders and the increase in the satisfactory level, L3+, showing an increase of an average of 2.5% for both genders as compared to the baseline.

36 Solomon Islands
3.9: The national numeracy achievement levels by strands at year 4 in 2010 compared to the baseline year
2005/2006.
Source: NESU, SPBEA,, SPC
Improvements are evident in terms of the decrease in Lc levels and increase in L3+ levels, which are noted in all the numeracy strands, except a marginal decrease in L3+ for the number strand by 2%. Two strands have shown significant improvements, graphs (11%), measurement (9%), in relation to performance at the satisfactory level of achievements. The increase in L3+ levels are accompanied by decrease in Lc levels for the following strands: Geometry (10%), Graphs (12%), Measurement (17%) and Operation (8%). The Fraction strand has shown ha sshown the high Lc level of 55%. In figure 3.9, the baseline report of 2007 for the \fraction strand was not reported as a separate strand. However, in 2010 it was extracted separately to give a clearer picture of achievement levels in this important area of numeracy. Depite the significant progress made, the Lc levels are still high for Measurement (47%), and fractions (55%). These two strands therefore need to be given priority intervention in order to reduce the Lc levels.

37
Solomon Islands Standarised Tests of Achievement 2-SISTA 2 Literacy Achievement Level 3.10: The national overall literacy achievement levels at year 6 in 2010 compared to the baseline year 2005/2006.
Source: NESU, SPBEA,, SPC
There is positive progress which indicates the reduction of the Lc levels with 12% while at the same time the L3+ levels grows by 11% in 2010 compared to the baseline year. This means an overall improvement in literacy rate at year 6. The disaggregation of this result by province is shown in figure 3.7. Though there is improvement in the literacy rate, there is also still a significant concern for the overall Lc which is 41% in 2010. This reflects that just 59% performs satisfactorily in literacy.
3.11: Achievement levels in the national literacy strands at year 6 in 2010 compared to 2005/2006.
Source: NESU, SPBEA,SPC

38 Solomon Islands
The results shown for the three key strands have indicated that there are some improvements at the L3+ levels for Reading skills (12%), Writing skills (12%) and Language skills (6%) compared to the baseline year. However, at the Lc level, though there are improvements in Reading (17%) and Writing (5%) there is no change in the Language skills which still remains at 7% in 2010. The high level of L3+ achievement for Language skills which is 76% is encouraging but the high Lc level of 62% for Reading skills is a concern. .
3.12: Achievement levels in National Literacy by Sub-Strands at year 6 in 2010 compared to the baseline year
2005/2006.
Source: NESU, SPBEA,SPC
The Lc level for comprehension and vocabulary shows some positive progress by 24% and 8% respectively in 2010 compared to 2005/2006, but these Lc levels are still high indicating that the majority of the learners don’t perform satisfactorily in these areas.
3.13: National Literacy achievement levels by Province at year 6 in 2010 compared to the baseline year 2005/2006.
Source: NESU, SPBEA,SPC

39
While the critical level has been reduced nationally, the results for Central, Choiseul and Isabel indicated a negative trend compared to the baseline year. .
Numeracy Achievement Level
3.14: National Overall Numeracy Achievements levels in 2010 compared to 2005/2006.
Source: NESU, SPBEA,SPC
It is encouraging to note that the L3+ level increased by 5% with L5 (full mastery) showing the greatest improvement of 4%. Overall numeracy results have improved, corresponding with a 6% decrease in the Lc level, yet the Lc level of 41% indicates that there is a large share of students (59%) still underperforming
3.15: National Numeracy Achievements levels by strands in 2010 compared to 2005/2006.
Source: NESU, SPBEA, SPC
A progressive improvement at the Lc level for working with numbers (9%), Measurement (4%), Shapes/Space (15%), and Graphs (17%) is reflected in the graph above. Yet

40 Solomon Islands
there is more work to do for education policy makers and teachers in improving Shapes/Spaces and Measurement where more than half of the students is underperforming.
3.16: National Numeracy Achievements levels by sub-strands in 2010 compared to 2005/2006.
Source: NESU, SPBEA, SPC
The data indicate that Conversions, Time zone, Shape and Space, Ratios Measurement and Percentage have a Lc level of above 50% and relatively a L3+-level. It is important NESU and other responsible divisions in MEHRD identify the reasons behind these scores and identify strategies on how to improve learners’ achievement at year 6.
3.17: National Numeracy achievement levels by Province at year 6 in 2010 compared to the baseline year
2005/2006.
Source: NESU, SPBEA,SPC

41
A general improvement at L3+ level is demonstrated by all provinces with Malaita Province showing the best improvement in 2010 compared to the baseline year. This also corresponds to the general decrease in the Lc level. However, all provinces have indicated a high Lc ranging from 36% to 48% that means that in some provinces just over half of the students do perform satisfactorily (e.g in Guadalcanal and Temotu).

42 Solomon Islands
Chapter Four: Efficiency Indicators The information from the indicators below helps to assess if all the different inputs (funds, teachers, books, buildings, training etc.) have improved the effectiveness and efficiency of education.
Repetition Rates The repetition rate measures the proportion of pupils who repeat years or classes. The pupils repeating rates can cause that already limited school places are occupied by the same pupils limiting the accommodation and access of other eligible children. A high repetition rate therefore implies low internal efficiency in education, as part of the resource inputs are being used by repeaters8. 5.2: Repetition rates for primary, junior secondary and senior secondary for 2009-2011
Source: SIEMIS
There is an improvement in the repetition rate for junior secondary but the repetition rate for primary and senior secondary education increases as reported in figure 5.2. The repetition rate is highest at the primary education level compared to the junior and senior secondary education which has improved greatly over time in 2010 compared to 2008.
Dropout Rates The drop out rate is the proportion of pupils or students in specific education levels who left school without completing a given grade in a given school year. The drop out rate indicates the extent to which pupils leave schooling and correlate with completion rates. High dropout rates imply that despite high and intensive inputs of funds, teachers, books, training, school buildings etc. there are low outcomes (completion) and this leads to low internal efficiency in any education level or the whole education sector9
8 Guidelines for EFA. Monitoring, Evaluation and Assessment. Identifying and Reaching the Unreached.
99 Guidelines for the Asia and Pacific Education for All Mid Decade Assessment; Identifying and Reaching the Unreached, UNESCO.

43
Survival (completion) Rates
Survival rate is the propotion of a cohort of pupils who reached year 6 expressed as a percentage of pupils enrolled in year 1 of a given cycle in a given school year. This indicator is used to show the extent to which the school system can retain pupils, with or without repetition, and indicates the drop out rates. It is also used to measure the impact of repetition and dropout on internal efficiency. The calculation of the survival rate here uses the reconstructed student cohort flow model which is based on the total number of pupils belonging to a pupil cohort who reached each successive year is divided by the number of pupils in the original pupil cohort. Those pupils who enrolled together in the first year of primary education10.High survival rates mean a high level of retention and low drop out rates, hence high internal efficiency.
5.3: National survival rates for all school levels from prep to form six, 2009-2011
10 Ibid

44 Solomon Islands
Source: SIEMIS
The survival rates of more than 100% in form 3 (year 9) in year 2009 and 2010 seems that there are more children enrolling in year 9 in those current report year compared to the enrolment in form 2 (year 8) the previous year. This means that children have repeated and some children that might have been out of school for a while might have re-entered school.
Generally, compared to 2009, survival rates have decreased at all levels in primary and secondary education in 2011.
The survival rate in 2011 for year 6 (STD 6) in relation to year 1 (STD 1) had decreased from 91% in year 1 to 84.7% in year 6 (STD 6). The same trend seems to occure in the secondary level. The survival rate has decreased from 89% in year 7 (form 1) to 28.7% in year 12 (form 6).. This indicates that just a minority completes a full cycle of both primary and secondary education. In 2010 the results were better; 95.8% in year 6, 49.1% in year 11 and 31.6% of the students in year 12 survived these levels.
The survival rate per grades seems highest at (year 9 and lowest at year 12.
Transition Rates The transition rate is the proposition of students that progress from the final grade (year) of one level to the first grade of the next level expressed as a percentage of those enrolled in the final grade of the preceding school year. It indicates the degree of access to the next higher level, measuring the upward mobility intake capacity of the higher next level of education which is considered in this report. Viewed from the lower cycle of level of education, it is considered as an output indicator. For instance, transition rate from primary to secondary. Viewed from the higher educational cycle or level, it is considered an indicator of access. . . Inversely, low transition rates indicate problems in bridging the

45
different levels of education, due to the examination results or inadequate admission capacity in the higher cycle or level of education or both. 5.4: National transition rates for SISEE, SIF3, SISC and PSSC, 2009-2011
Source: Atlas, NESU
The transition rate for SISEE (children who move on from primary to secondary education) increased by 9.3% from 88.1% in 2009 to 96.3% in 2011. However, the transition rate for SIF3 (students who enter into year 10) decreases in the period 2009-2011 (from 71.4 to 70.8%), although there seems to be a significant progress made in 2011 (70.8%) compared to 2010 (63.8%).
The transition rate for SISC decreases in 2011 (29.6%) compared to 2009 (45.3%). This significant drop might indicate that there are not enough adequate spaces at year 12 to accommodate the increasing enrolment in year 11. The transition rate for PSSC also decreases in the period 2009 (21.2%) compared to 2011(18.3%) though there were progress made in 2010 (22.4%) compared to 2009.
The data also show that the higher the level of education or examination, the lower the transition rate. This might indicate the limited capacity at the higher level to retain all the students from the lower previous level. The graph (5.4) shows that fewer children have entered year 12 compared to year 6, 9 and 11.
5.5: GPI for enrolment rates for SISEE, SIF3, SISC and PSSC, 2009-2011

46 Solomon Islands
Source: Atlas, NESU
The GPI for SISEE, SIF3 SISC and PSSC indicates an increase in female participation in 2011 in examinations compared to 2009..
The GPI for enrolment into all examination levels shows that there are still more boys than girls doing examinations, in particular for senior secondary school exams (SISC and PSSC).
5.6: GPI for xtransition rates for SISEE, SIF3, SISC and PSSC, 2009-2011
Source: Atlas, NESU
The GPI transition rate for SISEE, SIF3, and SISC has shown a positive development with more girls getting a placement at year 7, 10 and 12 in 2011 compared to 2009. However, this shows a downward trend for PSSC. This means that more girls are eliminated from the school system as they go higher up the education levels from year 9 to year 13.

47
Chapter Five: Human Resources Development
Teacher establishment
6.1: Number of vacancies for teachers and trainers approved by TSC by Education Authority, 2009-2011
Source: Teacher Master File, TSD
Malaita, Guadalcanal, Choiseul and Seventh Day Adventist Church has the highest number of vacancies for teachers over time while Renbel and Temotu province has the least number of vacancies over time for the same reporting period for the provincial education authorities. However the number of vacancies for all provinces reduces greatly in 2011 compared to 2009.
6.2: Number of vacancies for teachers and trainers approved by TSC for Solomon Islands, 2009-2011
Source: Teacher Master File, TSD

48 Solomon Islands
The number of vacancies for teachers approved by TSC is higher in 2009 compared to 2010 and 2011. The drop in vacancies for 2010 and 2011 was caused by higher recruitment in 2009, who filled many vacant positions.
6.3: Number of teacher establishment posts approved by TSC by Education Authority, 2009-2011
Source: Teacher Master File, TSD
Malaita and Guadalcanal provinces have the highest number of teacher establishment posts compared to other provinces. These two provinces are the most populated in Solomon Islands and have the highest number of schools. In total all number of the establishment for all provinces has reduced in 2011 compared to 2009. 6.4: Number of teachers, trainers and instructors approved by TSC for Solomon Islands, 2008-2010
Source: Teacher Master File, TSD

49
The TSC approved teacher establishment is highest in 2011 compared to 2009 and 2010. These increase (12.85%) is caused by filling many teacher vacant positions in 2009.
MEHRD establishment 6.5. Number of education staff reported by province, 2009-2011
Source: HRD
Malaita and Western Province have the highest number of education staffs. Central and Renbel Province have the least number of education staff. Central also indicates a decline in the number of officers in 2011 (4) compared to 2010 (10).
6.6. Number of vacancies for education staff reported by province, 2009-2011
Source: HRD division
Isabel Province have the highest vacancies in 2011 compared to other provinces. Renbel seems to be fully staffed with no vacancies identified for 2009 to 2011.

50 Solomon Islands
6.6. Number of supernumerary teacher In-service training by Education Authority, 2009-2011
Source: TTD division
Malaita province has the most supernumerary in-service teacher training in 2011 compared to other provinces. It seems that no
teacher from KGVI and Waimapuru goes for in-service training during this reporting period.
Chapter Six: Process Indicators
SIEMIS Return Rate 7.1: Total school census form received from schools and entered into SIEMIS, 2009-2011
Source: SIEMIS
The percentage of SIEMIS-forms received and entere has improved with 9.7% and 15.7% respectively in 2011 compared to 2009.. The overall return rate is still low at 72.4% because of the low return rate of SIEMIS form from the ECE and TVET sector. This is also a result of not all ECE centres recorded in the SIEMIS are registered ECE centres. data entry is also relatively slow because MEHRD does no receive the all survey forms on the 31st of March which has resulted in us not been able to produce the PAF 2009-2011 on time.

51
Over this reporting period return rates and entered rates are not the same because of the technical problem that we had with the system in entering the Rural Training Centres (RTC) school census forms. The RTC forms were received but not entered into the SIEMIS. That is also why TVET-data are not well presented in this PAF.
7.2: Total school census form received by education sector, 2009-2011
Source: SIEMIS
The PSS and NSS have the highest return rate in 2010 and 2011 while the ECE subsector shows the lowest return rate of SIEMIS school census forms which have affected the overal return rate in figure 7.2 above. The return rate for PS and CHS has remained consistently high over time in this reporting period. However, it is still not a 100% return rate.
7.3: Total school census form entered into SIEMIS by education sector, 2009-2011
Source: SIEMIS
All PSS forms were received and entered. However, the RTC school census forms were not entered because of the technical problem that we had with SIEMIS. The entry rate for PS, CHS, PSS and NSS has improved over the reporting period.

52 Solomon Islands
Policies Developed and Approved by Cabinet
The number of policies developed has increased over time. The year 2010 was the best year with 5 policies developed. In 2008 the highest number (5) of policies were approved by Cabinet. A total of 12 new policies were approved by Cabinet in the period 2006-2009.

53
Recommendations Early Childhood Education Primary Education Level Junior Secondary Education Level Senior Secondary Education Level Financial Management Efficiency Human Resources Development Process indicators

54 Solomon Islands
Annex one: Access data tables Number of pupils enrolled by Province, Education Level and Gender 1.1: Number of pupils enrolled in earlychildhood education by province and gender, 2009-2011.
2009 2010 2011
F M T F M T F M T
Central 311 294 605 333 302 635 378 367 745
Choiseul 504 563 1067 509 587 1096 465 549 1014
Guadalcanal 1096 1072 2168 1111 1131 2242 1288 1357 2645
Honiara 1070 1116 2186 1315 1320 2635 1372 1490 2862
Isabel 925 965 1890 897 942 1839 922 970 1892
Makira and Ulawa 1391 1458 2849 1406 1494 2900 1363 1495 2858
Malaita 3686 4048 7734 3739 3996 7735 3327 3562 6889
Rennell and Bellona 131 139 270 78 106 184 76 72 148
Temotu 289 333 622 403 427 830 448 451 899
Western 1303 1398 2701 1351 1448 2799 1380 1485 2865
SI 10706 11386 22092 11142 11753 22895 11019 11798 22817
Source: SIEMIS
1.2: Number of pupils enrolled in primary education by province and gender, 2009-2011.
2009 2010 2011
F M T F M T F M T
Central 2776 3210 5986 2827 3181 6008 2844 3247 6091
Choiseul 2684 2896 5580 2801 3044 5845 2941 3224 6165
Guadalcanal 9463 10288 19751 9589 10345 19934 9747 10410 20157
Honiara 6195 6431 12626 6565 6692 13257 6851 6889 13740
Isabel 2528 2828 5356 2511 2781 5292 2556 2869 5425
Makira and Ulawa 4165 4787 8952 4395 4927 9322 4627 5204 9831
Malaita 17229 19500 36729 17642 19824 37466 17768 20058 37826
Rennell and Bellona 324 349 673 316 321 637 318 346 664
Temotu 2221 2498 4719 2376 2634 5010 2368 2716 5084
Western 7872 8375 16247 7835 8660 16495 8043 8694 16737
SI 55457 61162 116619 56857 62409 119266 58063 63657 121720
Source: SIEMIS

55
1.3: Number of pupils enrolled in junior secondary education by province and gender, 2009-2011.
2009 2010 2011
F M T F M T F M T
Central 452 607 1059 497 598 1095 487 666 1153
Choiseul 554 492 1046 575 551 1126 674 610 1284
Guadalcanal 2146 2501 4647 2178 2384 4562 2173 2381 4554
Honiara 1788 1894 3682 1939 2129 4068 2267 2337 4604
Isabel 601 666 1267 632 695 1327 701 783 1484
Makira and Ulawa 860 1187 2047 997 1200 2197 1097 1210 2307
Malaita 2569 3315 5884 2621 3266 5887 2861 3446 6307
Rennell and Bellona 110 150 260 97 138 235 114 136 250
Temotu 512 589 1101 483 589 1072 526 650 1176
Western 2024 2028 4052 2005 2068 4073 2088 2051 4139
SI 11616 13429 25045 12024 13618 25642 12988 14270 27258
Source: SIEMIS
1.4: Number of pupils enrolled in senior secondary education by province and gender, 2009-2011.
2009 2010 2011
F M T F M T F M T
Central 181 130 311 156 210 366 153 188 341
Choiseul 85 110 195 108 112 220 82 125 207
Guadalcanal 1024 1718 2742 1016 1705 2721 1081 1811 2892
Honiara 1510 2226 3736 1638 2375 4013 1790 2700 4490
Isabel 318 358 676 357 410 767 328 396 724
Makira and Ulawa 407 685 1092 410 652 1062 421 715 1136
Malaita 744 1331 2075 753 1177 1930 874 1587 2461
Rennell and Bellona 44 63 107 65 80 145 71 90 161
Temotu 169 200 369 201 227 428 234 293 527
Western 897 1398 2295 954 1458 2412 1019 1567 2586
SI 5379 8219 13598 5658 8406 14064 6053 9472 15525
Source: SIEMIS
1.5: National summary of enrolment numbers by education level, 2009-2011.
2009 % 2010 % 2011 %
ECE 22092 12.5% 22895 12.6% 22817 12.2%
PRI 116619 65.8% 119266 65.6% 121720 65.0%
JS 25045 14.1% 25642 14.1% 27258 14.6%
SS 13598 7.7% 14064 7.7% 15525 8.3%
SI 177354 100.0% 181867 100.0% 187320 100.0%
Source: SIEMIS
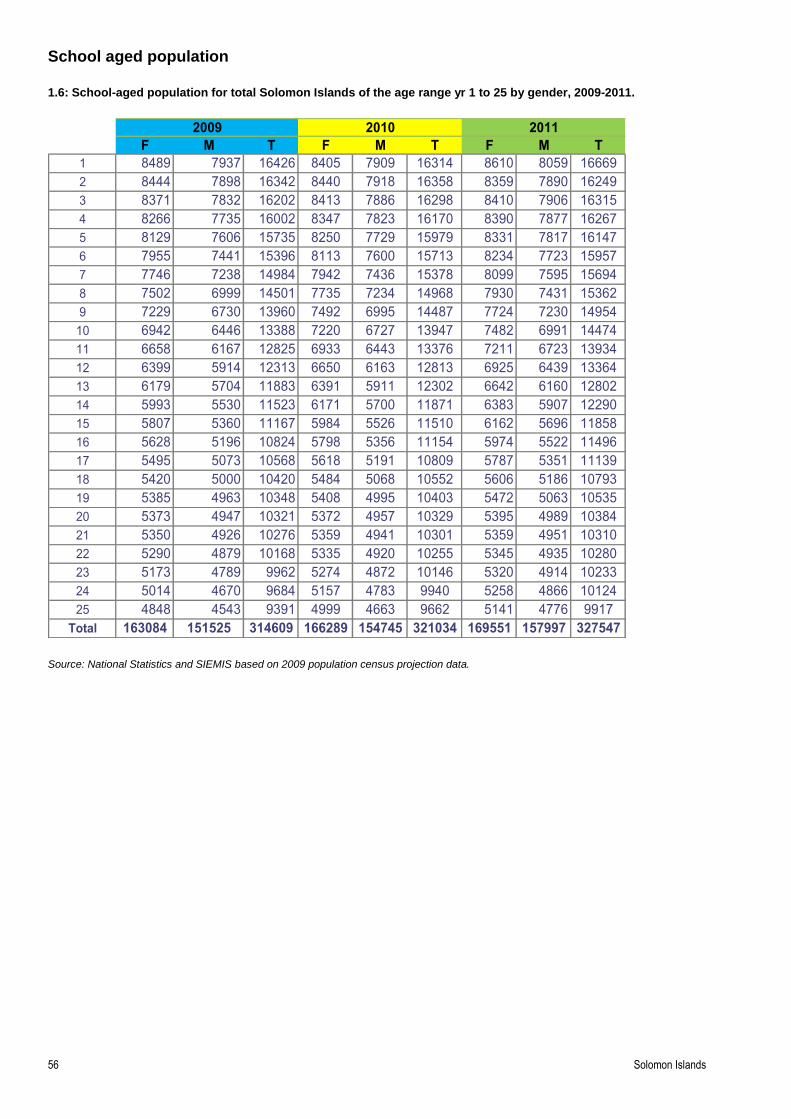
56 Solomon Islands
School aged population 1.6: School-aged population for total Solomon Islands of the age range yr 1 to 25 by gender, 2009-2011.
2009 2010 2011
F M T F M T F M T
1 8489 7937 16426 8405 7909 16314 8610 8059 16669
2 8444 7898 16342 8440 7918 16358 8359 7890 16249
3 8371 7832 16202 8413 7886 16298 8410 7906 16315
4 8266 7735 16002 8347 7823 16170 8390 7877 16267
5 8129 7606 15735 8250 7729 15979 8331 7817 16147
6 7955 7441 15396 8113 7600 15713 8234 7723 15957
7 7746 7238 14984 7942 7436 15378 8099 7595 15694
8 7502 6999 14501 7735 7234 14968 7930 7431 15362
9 7229 6730 13960 7492 6995 14487 7724 7230 14954
10 6942 6446 13388 7220 6727 13947 7482 6991 14474
11 6658 6167 12825 6933 6443 13376 7211 6723 13934
12 6399 5914 12313 6650 6163 12813 6925 6439 13364
13 6179 5704 11883 6391 5911 12302 6642 6160 12802
14 5993 5530 11523 6171 5700 11871 6383 5907 12290
15 5807 5360 11167 5984 5526 11510 6162 5696 11858
16 5628 5196 10824 5798 5356 11154 5974 5522 11496
17 5495 5073 10568 5618 5191 10809 5787 5351 11139
18 5420 5000 10420 5484 5068 10552 5606 5186 10793
19 5385 4963 10348 5408 4995 10403 5472 5063 10535
20 5373 4947 10321 5372 4957 10329 5395 4989 10384
21 5350 4926 10276 5359 4941 10301 5359 4951 10310
22 5290 4879 10168 5335 4920 10255 5345 4935 10280
23 5173 4789 9962 5274 4872 10146 5320 4914 10233
24 5014 4670 9684 5157 4783 9940 5258 4866 10124
25 4848 4543 9391 4999 4663 9662 5141 4776 9917
Total 163084 151525 314609 166289 154745 321034 169551 157997 327547
Source: National Statistics and SIEMIS based on 2009 population census projection data.

57
Gross and Net Enrolment Rates and Age –Specific Net Enrolment Rates Early Childhood Education
1.7: Gross and Net Enrolment Rate for ECE by Gender, 2009-2011
GER NER
F M T GPI F M T GPI
2009 46.0% 45.7% 45.8% 1.01 33.3% 32.7% 33.0% 1.02
2010 47.1% 46.4% 46.7% 1.01 34.0% 33.1% 33.6% 1.03
2011 45.4% 45.7% 45.6% 0.99 32.6% 32.5% 32.5% 1.00
Source: SIEMIS
1.8: Percent Change in GER and NER for ECE by Gender, 2011 compared to 2009
GER NER
F M T GPI F M T GPI
2009 46.0% 45.7% 45.8% 1.01 33.3% 32.7% 33.0% 1.02
2011 45.4% 45.7% 45.6% 0.99 32.6% 32.5% 32.5% 1.00
% Change -0.5% 0.0% -0.3% -1.2% -0.6% -0.2% -0.4% -1.4%
Source: SIEMIS
Primary Education
1.9: Gross intake rate (NIR) and net intake rate (NIR) for Primary Education by gender, 2009-2011
GIR NIR
F M T GPI F M T GPI
2009 110.1% 114.5% 112.3% 0.96 43.8% 41.7% 42.8% 1.05
2010 115.9% 115.4% 115.7% 1.00 42.9% 38.9% 40.9% 1.10
2011 110.2% 112.2% 111.2% 0.98 42.9% 38.9% 40.9% 1.10
Source: SIEMIS
1.10: Gross and Net Enrolment Rate for Primary Education by Gender, 2009-2011
GER NER
F M T GPI F M T GPI
2009 135.1% 138.8% 136.9% 0.97 91.3% 92.3% 91.8% 0.99
2010 133.9% 137.2% 135.6% 0.98 90.4% 91.0% 90.7% 0.99
2011 132.5% 136.0% 134.3% 0.97 89.4% 90.6% 90.0% 0.99
Source: SIEMIS

58 Solomon Islands
1.11: Percent Change in GER and NER for Primary Education by Gender, 2011 compared to 2009
GER NER
F M T GPI F M T GPI
2009 135.1% 138.8% 136.9% 0.97 91.3% 92.3% 91.8% 0.99
2011 132.5% 136.0% 134.3% 0.97 89.4% 90.6% 90.0% 0.99
% Change -2.6% -2.8% -2.7% 0.1% -2.0% -1.7% -1.8% -0.3% Source: SIEMIS
Junior Secondary Education 1.12: Gross and Net Enrolment Rate for Junior Secondary Education by Gender, 2009-2011
GER NER
F M T GPI F M T GPI
2009 67.7% 72.3% 70.0% 0.94 22.0% 21.0% 21.5% 1.05
2010 67.6% 70.9% 69.3% 0.95 21.0% 20.2% 20.6% 1.04
2011 70.2% 71.5% 70.9% 0.98 22.6% 21.0% 21.8% 1.08
Source: SIEMIS
1.13: Percent Change in GER and NER for Junior Secondary Education by Gender, 2011 compared to 2009
GER NER
F M T GPI F M T GPI
2009 67.7% 72.3% 70.0% 0.94 22.0% 21.0% 21.5% 1.05
2011 70.2% 70.9% 69.3% 0.99 22.6% 21.0% 21.8% 1.08
% Change 2.4% -1.5% -0.8% 5.4% 0.5% -0.1% 0.2% 2.8% Source: SIEMIS
Senior Secondary Education 1.14: Gross and Net Enrolment Rate for Senior Secondary Education by Gender, 2009-2011
GER NER
F M T GPI F M T GPI
2009 23.1% 27.4% 25.3% 0.84 16.2% 17.2% 16.7% 0.95
2010 24.4% 29.2% 26.8% 0.83 16.8% 17.5% 17.2% 0.96
2011 25.2% 31.7% 28.4% 0.80 17.0% 17.9% 17.5% 0.95 Source: SIEMIS
1.15: Percent Change in GER and NER for Senior Secondary Education by Gender, 2011 compared to 2009

59
GER NER
F M T GPI F M T GPI
2009 23.1% 27.4% 25.3% 0.84 16.2% 17.2% 16.7% 0.95
2011 25.2% 31.7% 26.8% 0.80 17.0% 17.9% 17.2% 0.95
% Change 2.0% 4.3% 1.5% -4.9% 0.8% 0.8% 0.5% 0.4% Source: SIEMIS

60 Solomon Islands
Number and Percentage of pupils with special needs 1.16: Number and percentage of pupils with special needs enrolled in Primary Education by province, 2009-2011
2009 2010 2011
No. % No. % No. %
Central 67 1% 64 1% 75 1%
Choiseul 183 3% 151 3% 240 4%
Guadalcanal 397 2% 476 2% 530 3%
Honiara 106 1% 140 1% 84 1%
Isabel 57 1% 61 1% 102 2%
Makira and Ulawa 172 2% 161 2% 150 2%
Malaita 689 2% 765 2% 849 2%
Rennell and Bellona 9 1% 3 0% 8 1%
Temotu 63 1% 79 2% 47 1%
Western 281 2% 411 2% 309 2%
SI 2024 2% 2311 2% 2394 2%
Source: SIEMIS
1.17: Number and percentage of pupils with special needs enrolled in Junior Secondary Education by province,
2009-2011
2009 2010 2011
No. % No. % No. %
Central 15 1% 7 1% 10 1%
Choiseul 2 0% 13 1% 31 2%
Guadalcanal 20 0% 60 1% 36 1%
Honiara 8 0% 9 0% 16 0%
Isabel 3 0% 5 0% 9 1%
Makira and Ulawa 14 1% 32 1% 44 2%
Malaita 71 1% 133 2% 113 2%
Rennell and Bellona 0 0% 5 2% 4 2%
Temotu 3 0% 6 1% 7 1%
Western 33 1% 29 1% 35 1%
SI 169 1% 299 1% 305 1%
Source: SIEMIS
1.18: Number and percentage of pupils with special needs enrolled in Senior Secondary education by province,
2009-2011
2009 2010 2011
No. % No. % No. %
Central 1 0% 1 0% 1 0%
Choiseul 0 0% 2 1% 1 0%
Guadalcanal 2 0% 27 1% 16 1%
Honiara 4 0% 8 0% 13 0%
Isabel 1 0% 4 1% 1 0%
Makira and Ulawa 3 0% 56 5% 4 0%
Malaita 5 0% 5 0% 62 3%
Rennell and Bellona 0 0% 0 0% 0 0%
Temotu 3 1% 0 0% 1 0%
Western 10 0% 12 0% 67 3%
SI 29 0% 115 1% 166 1%
Source: SIEMIS

61
Annex two: Infrastructure data tables Number of Schools 2.1: Number of ECE Centers by Province, 2009-2011 2.2: Num of Primary Schools by Province, 2009-2011
2009 2010 2011
Central 13 13 13
Choiseul 25 23 23
Guadalcanal 55 45 43
Honiara 28 34 33
Isabel 61 55 55
Makira and Ulawa 83 72 69
Malaita 204 192 164
Rennell and Bellona 10 7 7
Temotu 21 22 20
Western 59 59 55
SI Total 559 522 482
2009 2010 2011
Central 30 31 31
Choiseul 39 39 39
Guadalcanal 79 79 79
Honiara 12 14 13
Isabel 28 28 28
Makira and Ulawa 59 59 59
Malaita 134 133 132
Rennell and Bellona 9 9 9
Temotu 33 32 32
Western 101 101 101
SI Total 524 525 523 2.3: Number of CHS by Province, 2009-2011 2.4: Number of PSS by Province, 2009-2011
2009 2010 2011
Central 10 10 10
Choiseul 11 11 11
Guadalcanal 28 28 28
Honiara 17 17 18
Isabel 5 5 5
Makira and Ulawa 15 15 15
Malaita 48 50 50
Rennell and Bellona 2 2 2
Temotu 7 8 8
Western 30 30 30
SI Total 173 176 177
2009 2010 2011
Central 1 1 1
Choiseul 1 1 1
Guadalcanal 3 3 3
Honiara 1 1 1
Isabel 2 2 2
Makira and Ulawa 1 1 1
Malaita 3 3 3
Rennell and Bellona 1 1 1
Temotu 1 1 1
Western 2 2 2
SI Total 16 16 16 2.5: Number of NSS by Province, 2009-2011 2.6: Number of RTC by Province, 2009-2011
2009 2010 2011
Central 0 0 0
Choiseul 0 0 0
Guadalcanal 3 3 3
Honiara 1 1 1
Isabel 0 0 0
Makira and Ulawa 2 2 2
Malaita 1 1 1
Rennell and Bellona 0 0 0
Temotu 0 0 0
Western 3 3 3
SI Total 10 10 10
2009 2010 2011
Central 0 0 0
Choiseul 1 1 1
Guadalcanal 7 7 7
Honiara 1 1 1
Isabel 1 1 1
Makira and Ulawa 3 2 2
Malaita 6 6 6
Rennell and Bellona 1 1 1
Temotu 1 1 1
Western 6 6 6
SI Total 27 26 26
Source: SIEMIS

62 Solomon Islands
Number of Classrooms and Pupils-to- Classroom Ratios
2.7: Number of classroom and pupil to classroom ratios for Primary Schools by Province, 2009-2011
PS 2009 2010 2011
Rooms Pupils Ratio Rooms Pupils Ratio Rooms Pupils Ratio
Central 189 3909 20.7 195 4014 20.6 189 4087 21.6
Choiseul 172 3790 22.0 172 3848 22.4 179 3912 21.9
Guadalcanal 480 12176 25.4 486 12233 25.2 506 12652 25.0
Honiara 77 4217 54.8 88 4878 55.4 95 4938 52.0
Isabel 174 4292 24.7 181 4178 23.1 182 4296 23.6
Makira and Ulawa 295 6658 22.6 315 6870 21.8 337 7335 21.8
Malaita 804 22738 28.3 838 22680 27.1 907 24087 26.6
Rennell and Bellona 30 530 17.7 35 527 15.1 44 540 12.3
Temotu 185 3803 20.6 188 3634 19.3 193 3693 19.1
Western 470 10993 23.4 498 11644 23.4 532 11826 22.2
SI Total 2876 73106 25.4 2996 74506 24.9 3164 77366 24.5 Source: SIEMIS
2.8: Number of classroom and pupil to classroom ratios for CHS by Province, 2009-2011
CHS 2009 2010 2011
Rooms Pupils Ratio Rooms Pupils Ratio Rooms Pupils Ratio
Central 96 3163 32.9 99 3135 31.7 100 3188 31.9
Choiseul 42 2788 66.4 114 3071 26.9 130 3471 26.7
Guadalcanal 173 11623 67.2 323 11868 36.7 314 11704 37.3
Honiara 254 13975 55.0 244 14435 59.2 267 15758 59.0
Isabel 36 2139 59.4 71 2356 33.2 65 2552 39.3
Makira and Ulawa 68 4080 60.0 150 4441 29.6 161 4480 27.8
Malaita 434 19959 46.0 588 20740 35.3 591 20228 34.2
Rennell and Bellona 10 327 32.7 14 333 23.8 15 347 23.1
Temotu 63 2108 33.5 65 2463 37.9 83 2600 31.3
Western 155 9015 58.2 240 8833 36.8 271 9034 33.3
SI Total 1331 69177 52.0 1908 71675 37.6 1997 73362 36.7
Source: SIEMIS
2.9: Number of classroom and pupil to classroom ratios for PSS by Province, 2009-2011
PSS 2009 2010 2011
Rooms Pupils Ratio Rooms Pupils Ratio Rooms Pupils Ratio
Central 6 284 47.3 8 320 40.0 8 310 38.8
Choiseul 7 223 31.9 8 252 31.5 8 253 31.6
Guadalcanal 21 1057 50.3 23 986 42.9 25 980 39.2
Honiara 10 901 90.1 10 979 97.9 10 1139 113.9
Isabel 15 844 56.3 16 828 51.8 18 761 42.3
Makira and Ulawa 9 302 33.6 10 320 32.0 10 330 33.0
Malaita 27 963 35.7 25 1005 40.2 19 1153 60.7
Rennell and Bellona 3 151 50.3 5 125 25.0 5 156 31.2
Temotu 8 186 23.3 8 321 40.1 3 402 134.0
Western 23 707 30.7 15 654 43.6 24 970 40.4
SI Total 129 5618 43.6 128 5790 45.2 130 6454 49.6

63
Source: SIEMIS
2.10: Number of classroom and pupil to classroom ratios for NSS by Province, 2009-2011
NSS 2009 2010 2011
Rooms Pupils Ratio Rooms Pupils Ratio Rooms Pupils Ratio
Central 0 0 0.0 0 0 0.0 0 0 0.0
Choiseul 0 0 0.0 0 0 0.0 0 0 0.0
Guadalcanal 34 1500 44.1 30 1483 49.4 27 1483 54.9
Honiara 10 856 85.6 10 951 95.1 10 904 0.0
Isabel 0 0 0.0 0 0 0.0 0 0 0.0
Makira and Ulawa 20 823 41.2 19 823 43.3 22 1002 45.5
Malaita 10 363 36.3 7 393 56.1 10 426 42.6
Rennell and Bellona 0 0 0.0 0 0 0.0 0 0 0.0
Temotu 0 0 0.0 0 0 0.0 0 0 0.0
Western 31 1153 37.2 25 1123 44.9 18 906 50.3
SI Total 105 4695 44.7 91 4773 52.5 87 4721 54.3 Source: SIEMIS
2.11: Number of classroom and pupil to classroom ratios for RTC by Province, 2009-2011
RTC 2009 2010 2011
Rooms Pupils Ratio Rooms Pupils Ratio Rooms Pupils Ratio
Central 0 0 0.0 0 0 0.0 0 0 0.0
Choiseul 0 20 0.0 0 20 0.0 0 20 0.0
Guadalcanal 11 784 71.3 7 647 0.0 11 784 0.0
Honiara 0 95 0.0 0 95 0.0 0 95 0.0
Isabel 1 24 24.0 1 24 0.0 1 24 0.0
Makira and Ulawa 10 228 22.8 8 127 15.9 8 127 15.9
Malaita 14 700 50.0 9 465 51.7 14 700 50.0
Rennell and Bellona 3 32 10.7 3 32 0.0 3 32 0.0
Temotu 4 92 23.0 4 92 0.0 4 92 0.0
Western 7 726 103.7 7 726 0.0 7 726 103.7
SI Total 50 2701 54.0 39 2228 57.1 48 2600 54.2
Source: SIEMIS

64 Solomon Islands
Number of Desks and Pupil-to-desk Ratios 2.12: Number of desks and pupil to desk ratios for Primary Schools by Province, 2009-2011
PS 2009 2010 2011
Desks Pupils Ratio Desks Pupils Ratio Desks Pupils Ratio
Central 883 3909 4.4 1186 4014 3.4 1543 4087 2.6
Choiseul 1489 3790 2.5 1411 3848 2.7 1640 3912 2.4
Guadalcanal 3421 12176 3.6 4205 12233 2.9 4626 12652 2.7
Honiara 942 4217 4.5 1230 4878 4.0 2305 4938 2.1
Isabel 2325 4292 1.8 2319 4178 1.8 2352 4296 1.8
Makira and Ulawa 1887 6658 3.5 2229 6870 3.1 2151 7335 3.4
Malaita 5497 22738 4.1 6280 22680 3.6 7066 24087 3.4
Rennell and Bellona 190 530 2.8 243 527 2.2 206 540 2.6
Temotu 1153 3803 3.3 1398 3634 2.6 1409 3693 2.6
Western 3405 10993 3.2 3769 11644 3.1 5537 11826 2.1
SI Total 21192 73106 3.4 24270 74506 3.1 28835 77366 2.7
Source: SIEMIS
2.13: Number of desks and pupil to desk ratios for CHS by Province, 2009-2011
CHS 2009 2010 2011
Desks Pupils Ratio Desks Pupils Ratio Desks Pupils Ratio
Central 815 3163 3.9 853 3135 3.7 941 3188 3.4
Choiseul 579 2788 4.8 1383 3071 2.2 2032 3471 1.7
Guadalcanal 3034 11623 3.8 3915 11868 3.0 4204 11704 2.8
Honiara 4650 13975 3.0 6042 14435 2.4 6910 15758 2.3
Isabel 624 2139 3.4 1050 2356 2.2 982 2552 2.6
Makira and Ulawa 799 4080 5.1 1955 4441 2.3 2421 4480 1.9
Malaita 4115 19959 4.9 7475 20740 2.8 8040 20228 2.5
Rennell and Bellona 62 327 5.3 39 333 8.5 53 347 6.5
Temotu 476 2108 4.4 744 2463 3.3 857 2600 3.0
Western 2148 9015 4.2 2827 8833 3.1 4166 9034 2.2
SI Total 17302 69177 4.0 26283 71675 2.7 30606 73362 2.4 Source: SIEMIS

65
2.14: Number of desks and pupil to desk ratios for PSS by Province, 2009-2011
PSS 2009 2010 2011
Desks Pupils Ratio Desks Pupils Ratio Desks Pupils Ratio
Central 0 284 0 320 178 310 1.7
Choiseul 122 223 1.8 151 252 1.7 151 253 1.7
Guadalcanal 470 1057 2.2 585 986 1.7 426 980 2.3
Honiara 700 901 1.3 600 979 1.6 0 1139
Isabel 588 844 1.4 116 828 7.1 246 761 3.1
Makira and Ulawa 354 302 0.9 144 320 2.2 210 330 1.6
Malaita 290 963 3.3 733 1005 1.4 877 1153 1.3
Rennell and Bellona 0 151 81 125 1.5 91 156 1.7
Temotu 326 186 0.6 297 321 1.1 144 402 2.8
Western 178 707 4.0 463 654 1.4 353 970 2.7
SI Total 3028 5618 1.9 3170 5790 1.8 2676 6454 2.4 Source: SIEMIS
2.15: Number of desks and pupil to desk ratios for NSS by Province, 2009-2011
NSS 2009 2010 2011
Desks Pupils Ratio Desks Pupils Ratio Desks Pupils Ratio
Central 0 0 0 0 0 0
Choiseul 0 0 0 0 0 0
Guadalcanal 72 1500 20.8 883 1483 1.7 578 1483 2.6
Honiara 0 856 0 951 0 904
Isabel 0 0 0 0 0 0
Makira and Ulawa 0 823 136 823 6.1 222 1002 4.5
Malaita 0 363 292 393 1.3 422 426 1.0
Rennell and Bellona 0 0 0 0 0 0
Temotu 0 0 0 0 0 0
Western 435 1153 2.7 452 1123 2.5 300 906 3.0
SI Total 507 4695 9.3 1763 4773 2.7 1522 4721 3.1
Source: SIEMIS
2.16: Number of desks and pupil to desk ratios for RTC by Province, 2009-2011

66 Solomon Islands
RTC 2009 2010 2011
Desks Pupils Ratio Desks Pupils Ratio Desks Pupils Ratio
Central 0 0 0 0 0 0
Choiseul 0 20 0 20 0 20
Guadalcanal 0 784 0 647 0 784
Honiara 0 95 0 95 0 95
Isabel 0 24 0 24 0 24
Makira and Ulawa 0 228 0 127 0 127
Malaita 0 700 0 465 0 700
Rennell and Bellona 0 32 0 32 0 32
Temotu 0 92 0 92 0 92
Western 0 726 0 726 0 726
SI Total 0 2701 0 2228 0 2600
Source: SIEMIS

67
Number of Dormitories, and Boarder Ratios 2.17: Number of dormitories, number of enrolled boarders in CHS and boarder to dorm ratio by Province, 2009-
2011
CHS 2009 2010 2011
Dorms Boarders Ratio Dorms Boarders Ratio Dorms Boarders Ratio
Central 5 152 30.4 5 93 18.6 6 196 32.7
Choiseul 17 336 19.8 14 373 26.6 19 278 14.6
Guadalcanal 21 428 20.4 13 640 49.2 16 685 42.8
Honiara 0 0 0.0 0 0 0.0 0 0 0.0
Isabel 24 955 39.8 28 1177 42.0 26 1473 56.7
Makira and Ulawa 20 340 17.0 22 1061 48.2 21 752 35.8
Malaita 9 435 48.3 9 208 23.1 11 352 32.0
Rennell and Bellona 3 31 10.3 4 45 11.3 4 36 9.0
Temotu 3 238 79.3 4 238 59.5 4 279 69.8
Western 45 498 11.1 53 1730 32.6 49 1809 36.9
SI Total 147 3413 23.2 152 5565 36.6 156 5860 37.6 Source: SIEMIS
2.18: Number of dormitories, number of enrolled boarders in PSS and boarder to dorm ratio by Province, 2009-
2011
PSS 2009 2010 2011
Dorms Boarders Ratio Dorms Boarders Ratio Dorms Boarders Ratio
Central 6 284 47.3 6 320 53.3 6 310 51.7
Choiseul 6 7 1.2 6 242 40.3 6 254 42.3
Guadalcanal 17 836 49.2 21 881 42.0 14 980 70.0
Honiara 0 0 0.0 0 0 0.0 0 0 0.0
Isabel 14 844 60.3 14 828 59.1 13 760 58.5
Makira and Ulawa 7 296 42.3 5 324 64.8 6 326 54.3
Malaita 18 608 33.8 17 739 43.5 13 1030 79.2
Rennell and Bellona 1 0 0.0 2 68 34.0 2 82 41.0
Temotu 7 186 26.6 8 311 38.9 6 402 67.0
Western 12 680 56.7 13 638 49.1 23 630 27.4
SI Total 88 3741 42.5 92 4351 47.3 89 4774 53.6 Source: SIEMIS
2.19: Number of dormitories, number of enrolled boardersin NSS and boarder to dorm ratio by Province, 2009-
2011

68 Solomon Islands
NSS 2009 2010 2011
Dorms Boarders Ratio Dorms Boarders Ratio Dorms Boarders Ratio
Central 0 0 0.0 0 0 0.0 0 0 0.0
Choiseul 0 0 0.0 0 0 0.0 0 0 0.0
Guadalcanal 26 971 37.3 29 1383 47.7 30 978 32.6
Honiara 8 0 0.0 0 519 0.0 0 494 0.0
Isabel 0 0 0.0 0 0 0.0 0 0 0.0
Makira and Ulawa 19 823 43.3 20 823 41.2 18 927 51.5
Malaita 10 342 34.2 9 0 0.0 10 374 37.4
Rennell and Bellona 0 0 0.0 0 0 0.0 0 0 0.0
Temotu 0 0 0.0 0 0 0.0 0 0 0.0
Western 19 756 39.8 22 1169 53.1 13 942 72.5
SI Total 82 2892 35.3 80 3894 48.7 71 3715 52.3
Source: SIEMIS
2.20: Number of dormitories, number of enrolled boarders in RTC and boarder to dorm ratio by Province, 2009-
2011
RTC 2009 2010 2011
Dorms Boarders Ratio Dorms Boarders Ratio Dorms Boarders Ratio
Central 0 0 0.0 0 0 0.0 0 0 0.0
Choiseul 0 20 0.0 0 20 0.0 3 20 0.0
Guadalcanal 8 217 0.0 4 80 0.0 11 217 0.0
Honiara 0 0 0.0 0 0 0.0 0 0 0.0
Isabel 3 0 0.0 3 0 0.0 3 0 0.0
Makira and Ulawa 11 267 0.0 4 105 26.3 5 105 21.0
Malaita 10 465 0.0 8 230 28.8 11 465 42.3
Rennell and Bellona 2 24 0.0 2 24 12.0 2 24 0.0
Temotu 3 84 0.0 3 84 28.0 3 84 0.0
Western 10 318 0.0 10 318 31.8 20 318 15.9
SI Total 47 1395 0.0 34 861 25.3 58 1233 21.3
Source: SIEMIS

69
Number of Toilets and Pupil to Toilet Ratios 2.21: Pupil to toilet ratio in Early Childhood Education by Province, 2009-2011
ECE 2009 2010 2011
Toilets Pupils Ratio Toilets Pupils Ratio Toilets Pupils Ratio
Central 15 378 25.2 15 341 22.7 18 669 37.2
Choiseul 22 559 25.4 21 657 31.3 21 649 30.9
Guadalcanal 82 1383 16.9 49 1635 33.4 71 1863 26.2
Honiara 55 1737 31.6 58 2393 41.3 81 2831 35.0
Isabel 47 1428 30.4 45 1501 33.4 51 1554 30.5
Makira and Ulawa 123 1948 15.8 87 2136 24.6 77 2168 28.2
Malaita 352 5802 16.5 344 6301 18.3 359 5755 16.0
Rennell and Bellona 47 125 2.7 8 166 20.8 6 104 17.3
Temotu 23 401 17.4 27 517 19.1 22 552 25.1
Western 109 1559 14.3 114 1812 15.9 78 2025 26.0
SI Total 875 15320 17.5 768 17459 22.7 784 18170 23.2
Source: SIEMIS
2.22: Pupil to toilet ratio in Primary Schools Education by Province, 2009-2011
PS 2009 2010 2011
Toilets Pupils Ratio Toilets Pupils Ratio Toilets Pupils Ratio
Central 66 3159 47.9 55 3463 63.0 50 3788 75.8
Choiseul 47 3081 65.6 42 3031 72.2 50 3530 70.6
Guadalcanal 123 11827 96.2 138 11976 86.8 144 12464 86.6
Honiara 50 3353 67.1 45 3857 85.7 59 4938 83.7
Isabel 72 4210 58.5 74 4178 56.5 57 4296 75.4
Makira and Ulawa 103 5848 56.8 84 6104 72.7 83 6486 78.1
Malaita 236 21308 90.3 252 21955 87.1 278 23293 83.8
Rennell and Bellona 8 530 66.3 14 527 37.6 16 540 33.8
Temotu 55 3266 59.4 50 3088 61.8 48 3266 68.0
Western 66 9030 136.8 121 10087 83.4 167 11039 66.1
SI Total 826 65612 79.4 875 68266 78.0 952 73640 77.4
Source: SIEMIS
2.23: Pupil to toilet ratio in CHS by Province, 2009-2011

70 Solomon Islands
CHS 2009 2010 2011
Toilets Pupils Ratio Toilets Pupils Ratio Toilets Pupils Ratio
Central 17 3163 186.1 20 3135 156.8 19 3027 159.3
Choiseul 13 2595 199.6 25 2846 113.8 44 3471 78.9
Guadalcanal 94 11623 123.6 99 11868 119.9 130 11704 90.0
Honiara 116 13975 120.5 106 14435 136.2 154 15758 102.3
Isabel 42 2139 50.9 20 2356 117.8 32 2552 79.8
Makira and Ulawa 28 4080 145.7 26 4441 170.8 39 4480 114.9
Malaita 450 19418 43.2 148 19754 133.5 160 19284 120.5
Rennell and Bellona 4 327 81.8 4 333 83.3 4 347 86.8
Temotu 22 1870 85.0 22 2463 112.0 34 2600 76.5
Western 108 8675 80.3 110 8833 80.3 141 8634 61.2
SI Total 894 67865 75.9 580 70464 121.5 757 71857 94.9
Source: SIEMIS
2.24: Pupil to toilet ratio in PSS by Province, 2009-2011
PSS 2009 2010 2011
Toilets Pupils Ratio Toilets Pupils Ratio Toilets Pupils Ratio
Central 0 284 0 320 0.0 0 310 0.0
Choiseul 0 223 18 252 0.0 18 253 14.1
Guadalcanal 40 1057 26.4 40 986 24.7 88 980 11.1
Honiara 20 901 45.1 20 979 49.0 20 1139 57.0
Isabel 30 844 28.1 34 828 24.4 45 761 16.9
Makira and Ulawa 2 302 151.0 14 320 22.9 0 330
Malaita 23 963 41.9 32 1005 31.4 61 1153 18.9
Rennell and Bellona 2 151 75.5 4 125 31.3 4 156 39.0
Temotu 4 186 46.5 4 321 80.3 4 402 100.5
Western 69 707 10.2 5 654 130.8 22 970 44.1
SI Total 190 5618 29.6 171 5790 33.9 262 6454 24.6
Source: SIEMIS
2.25: Pupil to toilet ratio in NSS by Province, 2009-2011
NSS 2009 2010 2011
Toilets Pupils Ratio Toilets Pupils Ratio Toilets Pupils Ratio
Central 0 0 0.0 0 0 0.0 0 0 0.0
Choiseul 0 0 0.0 0 0 0.0 0 0 0.0
Guadalcanal 68 1500 22.1 74 1483 20.0 111 1483 13.4
Honiara 58 856 14.8 0 0 0 0 0.0
Isabel 0 0 0.0 0 0 0.0 0 0 0.0
Makira and Ulawa 28 823 29.4 28 823 29.4 32 558 17.4
Malaita 0 363 45 393 0.0 41 426 10.4
Rennell and Bellona 0 0 0.0 0 0 0.0 0 0 0.0
Temotu 0 0 0.0 0 0 0.0 0 0 0.0
Western 23 1153 50.1 27 1123 41.6 6 906 151.0
SI Total 177 4695 26.5 174 3822 22.0 190 3373 17.8

71
Source: SIEMIS

72 Solomon Islands
Number and Percentage of Schools with Access to Clean and Safe Water
2.26: Number of ECE centres with access to clean and safe water by Province, 2009-2011
2009 2010 2011
ECE
Central 11 3 27% 12 5 42% 15 10 67%
Choiseul 24 7 29% 23 8 35% 21 6 29%
Guadalcanal 53 14 26% 48 11 23% 52 13 25%
Honiara 22 9 41% 25 10 40% 33 10 30%
Isabel 56 29 52% 57 24 42% 59 22 37%
Makira and Ulawa 74 27 36% 75 30 40% 76 29 38%
Malaita 178 66 37% 187 64 34% 184 64 35%
Rennell and Bellona 12 5 42% 9 5 56% 6 4 67%
Temotu 19 9 47% 20 9 45% 20 11 55%
Western 53 17 32% 54 16 30% 58 14 24%
SI Total 502 186 37% 510 182 36% 524 183 35%
No. of
Schools
No. with
Safe Water
% With Safe
Water
No. of
Schools
No. with
Safe Water
% With Safe
Water
No. of
Schools
No. with
Safe Water
% With Safe
Water
Source: SIEMIS
2.27: Number of PS centres with access to clean and safe water by Province, 2009-2011
2009 2010 2011
PS
Central 30 13 43% 31 12 39% 31 13 42%
Choiseul 39 21 54% 39 19 49% 38 23 61%
Guadalcanal 78 32 41% 79 37 47% 80 28 35%
Honiara 9 7 78% 11 8 73% 14 4 29%
Isabel 27 11 41% 28 16 57% 28 16 57%
Makira and Ulawa 58 30 52% 58 31 53% 58 31 53%
Malaita 126 45 36% 128 43 34% 134 47 35%
Rennell and Bellona 9 8 89% 9 7 78% 9 9 100%
Temotu 34 20 59% 33 21 64% 32 21 66%
Western 97 49 51% 101 41 41% 108 48 44%
SI Total 507 236 47% 517 235 45% 532 240 45%
No. with
Safe Water
% With Safe
Water
No. of
Schools
No. with
Safe Water
No. of
Schools
No. with
Safe Water
% With Safe
Water
No. of
Schools
% With Safe
Water
Source: SIEMIS
2.28: Number of CHS centres with access to clean and safe water by Province, 2009-2011

73
2009 2010 2011
CHS
Central 10 6 60% 10 6 60% 10 6 60%
Choiseul 11 7 64% 11 10 91% 13 9 69%
Guadalcanal 28 13 46% 28 16 57% 28 16 57%
Honiara 17 5 29% 17 10 59% 18 9 50%
Isabel 5 3 60% 5 2 40% 5 2 40%
Makira and Ulawa 15 11 73% 15 8 53% 15 7 47%
Malaita 46 27 59% 49 27 55% 48 28 58%
Rennell and Bellona 2 0 0% 2 1 50% 2 1 50%
Temotu 7 4 57% 8 4 50% 8 2 25%
Western 28 10 36% 30 8 27% 30 16 53%
SI Total 169 86 51% 175 92 53% 177 96 54%
No. of
Schools
No. with
Safe Water
% With Safe
Water
No. of
Schools
No. with
Safe Water
% With Safe
Water
No. of
Schools
No. with
Safe Water
% With Safe
Water
Source: SIEMIS
2.29: Number of PSS centres with access to clean and safe water by Province, 2009-2011
2009 2010 2011
PSS
Central 1 1 100% 1 1 100% 1 1 100%
Choiseul 1 0 0% 1 1 100% 1 1 100%
Guadalcanal 3 3 100% 3 3 100% 3 3 100%
Honiara 1 0 0% 1 0 0% 1 0 0%
Isabel 2 1 50% 2 1 50% 2 2 100%
Makira and Ulawa 1 1 100% 1 1 100% 1 1 100%
Malaita 3 3 100% 3 2 67% 3 3 100%
Rennell and Bellona 1 1 100% 1 1 100% 1 1 100%
Temotu 1 1 100% 1 1 100% 1 1 100%
Western 2 2 100% 2 2 100% 3 3 100%
SI Total 16 13 81% 16 13 81% 17 16 94%
No. of
Schools
No. with
Safe Water
% With Safe
Water
No. of
Schools
No. with
Safe Water
% With Safe
Water
No. of
Schools
No. with
Safe Water
% With Safe
Water
Source: SIEMIS
2.30: Number of NSS centres with access to clean and safe water by Province, 2009-2011

74 Solomon Islands
2009 2010 2011
NSS
Central 0 0 0 0 0 0
Choiseul 0 0 0 0 0 0
Guadalcanal 3 3 100% 3 2 67% 3 2 67%
Honiara 1 1 100% 0 0 0 0
Isabel 0 0 0 0 0 0
Makira and Ulawa 2 2 100% 2 1 50% 2 0 0%
Malaita 1 1 100% 1 1 100% 1 1 100%
Rennell and Bellona 0 0 0 0 0 0
Temotu 0 0 0 0 0 0
Western 3 3 100% 3 2 67% 3 2 67%
SI Total 10 10 100% 9 6 67% 9 5 56%
No. of
Schools
No. with
Safe Water
% With Safe
Water
No. of
Schools
% With Safe
Water
No. with
Safe Water
% With Safe
Water
No. of
Schools
No. with
Safe Water
Source: SIEMIS

75
Number and Percentage of Secondary Schools with Workshops
2.31: Number of CHS with workshops by Province, 2009-2011
2009 2010 2011
CHS
Central 10 0 0.0 10 0 0.0 10 1 0.1
Choiseul 11 3 0.3 11 3 0.3 11 4 0.4
Guadalcanal 28 5 0.2 28 6 0.2 28 8 0.3
Honiara 17 6 0.4 17 8 0.5 18 8 0.4
Isabel 5 3 0.6 5 3 0.6 5 3 0.6
Makira and Ulawa 15 6 0.4 15 6 0.4 15 6 0.4
Malaita 48 4 0.1 50 6 0.1 50 5 0.1
Rennell and Bellona 2 0 0.0 2 0 0.0 2 0 0.0
Temotu 7 1 0.1 8 1 0.1 8 1 0.1
Western 30 7 0.2 30 8 0.3 30 9 0.3
SI Total 173 35 0.2 176 41 0.2 177 45 0.3
No. of
Schools
No. of
W'shop Ratio
No. of
Schools
No. of
Schools
No. of
W'shop Ratio
No. of
W'shop Ratio
Source: SIEMIS
2.32: Number of PSS with workshops by Province, 2009-2011
2009 2010 2011
PSS
Central 1 1 1.0 1 1 1.0 1 1 1.0
Choiseul 1 1 1.0 1 1 1.0 1 1 1.0
Guadalcanal 3 3 1.0 3 3 1.0 3 3 1.0
Honiara 1 1 1.0 1 1 1.0 1 1 1.0
Isabel 2 2 1.0 2 2 1.0 2 2 1.0
Makira and Ulawa 1 1 1.0 1 1 1.0 1 1 1.0
Malaita 3 3 1.0 3 3 1.0 3 3 1.0
Rennell and Bellona 1 0 0.0 1 1 1.0 1 1 1.0
Temotu 1 1 1.0 1 1 1.0 1 1 1.0
Western 2 2 1.0 2 2 1.0 2 3 1.5
SI Total 16 15 0.9 16 16 1.0 16 17 1.1
No. of
W'shop Ratio
No. of
Schools
No. of
Schools
No. of
W'shop
No. of
W'shop Ratio
No. of
Schools Ratio
Source: SIEMIS
2.33: Number of NSS with workshops by Province, 2009-2011

76 Solomon Islands
2009 2010 2011
NSS
Central 0 0 0 0 0 0
Choiseul 0 0 0 0 0 0
Guadalcanal 3 3 1.0 3 3 1.0 3 3 1.0
Honiara 0 0 0 0 0 0
Isabel 0 0 0 0 0 0
Makira and Ulawa 2 2 1.0 2 2 1.0 2 2 1.0
Malaita 1 1 1.0 1 1 1.0 1 1 1.0
Rennell and Bellona 0 0 0 0 0 0
Temotu 0 0 0 0 0 0
Western 3 3 1.0 3 3 1.0 2 2 1.0
SI Total 9 9 1.0 9 9 1.0 8 8 1.0
No. of
Schools
No. of
W'shop Ratio
No. of
Schools
No. of
W'shop Ratio
No. of
Schools
No. of
W'shop Ratio
Source: SIEMIS

77
Annex three: Quality data tables Number of qualified and certified teachers 3.1: Total Number of trained and untrained teachers for ECE by gender and Province, 2009-2011
ECE 2009 2010 2011
F M F M F M F M F M F M F M F M F M
Central 28 1 9 0 19 1 27 1 10 1 17 0 34 4 9 3 25 1
Choiseul 40 3 11 1 29 2 47 3 14 1 33 2 53 4 16 1 37 3
Guadalcanal 110 14 35 2 75 12 106 3 48 3 58 0 123 15 52 5 71 10
Honiara 88 3 49 3 39 0 114 2 71 2 43 0 139 6 93 3 46 3
Isabel 152 4 26 2 126 2 147 4 34 2 113 2 146 7 39 3 107 4
Makira and Ulawa 136 45 65 18 71 27 143 19 66 16 77 3 187 37 100 14 87 23
Malaita 231 80 49 7 182 73 281 36 64 6 217 30 281 70 58 6 223 64
Rennell and Bellona 23 4 1 0 22 4 24 2 3 0 21 2 17 2 1 0 16 2
Temotu 25 3 12 0 13 3 34 1 16 0 18 1 31 5 15 3 16 2
Western 115 10 15 0 100 10 113 3 18 1 95 2 137 15 34 1 103 14
SI Totals 948 167 272 33 676 134 1036 74 344 32 692 42 1148 165 417 39 731 126
Trained UntrainedNo. of Trained and
untrained
Teachers.
Total Teachers Trained Untrained Total Teachers Trained Untrained Total
Source: SIEMIS
3.2: Total Number of trained and untrained teachers for PS by gender and Province, 2009-2011
PRI 2009 2010 2011
F M F M F M F M F M F M F M F M F M
Central 103 263 59 122 44 141 115 180 67 124 48 56 121 164 68 114 53 50
Choiseul 145 101 78 61 67 40 139 113 80 63 59 50 157 118 90 63 67 55
Guadalcanal 395 558 239 255 156 303 360 403 213 232 147 171 398 404 231 222 167 182
Honiara 286 139 202 88 84 51 281 119 202 87 79 32 307 124 204 86 103 38
Isabel 92 229 66 119 26 110 95 133 70 121 25 12 89 142 69 120 20 22
Makira and Ulawa 167 389 98 173 69 216 158 258 94 150 64 108 172 280 99 154 73 126
Malaita 499 989 235 421 264 568 541 848 253 447 288 401 551 869 244 426 307 443
Rennell and Bellona 14 44 3 16 11 28 14 34 5 17 9 17 17 32 8 14 9 18
Temotu 83 229 42 107 41 122 98 175 46 108 52 67 113 172 58 104 55 68
Western 393 386 209 221 184 165 359 331 197 200 162 131 389 367 217 228 172 139
SI Totals 2177 3327 1231 1583 946 1744 2160 2594 1227 1549 933 1045 2314 2672 1288 1531 1026 1141
No. of Trained and
untrained
Teachers.
Total Teachers Trained Untrained Total Teachers Trained Untrained Total Trained Untrained
Source: SIEMIS
3.3: Total Number of trained and untrained teachers for Secondary by gender and Province, 2009-2011

78 Solomon Islands
SEC 2009 2010 2011
F M F M F M F M F M F M F M F M F M
Central 18 75 16 54 2 21 28 70 20 47 8 23 26 73 20 46 6 27
Choiseul 17 35 11 25 6 10 15 34 6 20 9 14 22 50 14 34 8 16
Guadalcanal 68 178 55 139 13 39 77 199 66 150 11 49 88 214 77 172 11 42
Honiara 94 128 71 86 23 42 77 90 68 70 9 20 81 80 68 57 13 23
Isabel 20 81 14 69 6 12 22 76 17 69 5 7 23 94 19 90 4 4
Makira and Ulawa 36 107 29 82 7 25 44 141 29 101 15 40 40 116 28 89 12 27
Malaita 81 247 55 160 26 87 71 218 46 144 25 74 104 298 70 192 34 106
Rennell and Bellona 1 9 1 3 0 6 3 13 2 4 1 9 3 13 3 3 0 10
Temotu 23 53 8 29 15 24 15 34 7 23 8 11 30 60 13 36 17 24
Western 49 112 35 87 14 25 72 138 44 95 28 43 75 164 46 122 29 42
SI Totals 407 1025 295 734 112 291 424 1013 305 723 119 290 492 1162 358 841 134 321
Trained UntrainedNo. of Trained and
Untrained Teachers
Total Teachers Trained Untrained Total Teachers Trained Untrained Total
Source: SIEMIS
3.4: Total Number of trained and untrained teachers for TVET by gender and Province, 2009-2011
TVT 2009 2010 2011
F M F M F M F M F M F M F M F M F M
Central 0 0 0 0 0 0 0 0 0 0 0 0 0 0 0 0 0 0
Choiseul 0 0 0 0 0 0 0 0 0 0 0 0 0 0 0 0 0 0
Guadalcanal 15 16 12 11 3 5 10 11 7 6 3 5 9 5 9 5 4 0
Honiara 0 0 0 0 0 0 0 0 0 0 0 0 0 0 0 0 0 0
Isabel 4 7 0 0 4 7 4 7 0 0 4 7 1 3 1 3 4 0
Makira and Ulawa 6 21 1 5 5 16 7 25 1 6 6 19 1 6 1 6 4 0
Malaita 9 22 8 15 1 7 5 12 4 8 1 4 6 18 6 18 6 0
Rennell and Bellona 2 4 1 2 1 2 2 4 1 2 1 2 0 1 0 1 1 0
Temotu 0 0 0 0 0 0 0 0 0 0 0 0 0 0 0 0 0 0
Western 2 22 1 21 1 1 2 22 1 21 1 1 1 17 1 17 1 0
SI Totals 38 92 23 54 15 38 30 81 14 43 16 38 18 50 18 50 20 0
Untrained Total Trained UntrainedNo. of Trained and
No. of Untrained
Total Teachers Trained Untrained Total Teachers Trained
Source: SIEMIS
Number of qualification of teachers in mangement roles
3.5: Number of Primary Education teacher in management roles by trained and untrained by Province, 2009-2011
PRI 2009 2010 2011
F M F M F M F M F M F M F M F M F M
Central 4 61 4 61 0 0 6 58 6 58 0 0 6 56 6 56 0 0
Choiseul 25 36 25 34 0 2 24 37 24 36 0 1 24 38 24 36 0 2
Guadalcanal 39 111 39 109 0 2 39 114 39 110 0 4 36 122 36 116 0 6
Honiara 20 20 19 19 1 1 25 18 22 17 3 1 24 23 20 20 4 3
Isabel 3 42 3 42 0 0 5 41 5 41 0 0 3 42 3 42 0 0
Makira and Ulawa 8 67 8 67 0 0 8 71 8 71 0 0 8 73 8 73 0 0
Malaita 34 190 31 178 3 12 34 202 31 192 3 10 36 219 32 200 4 19
Rennell and Bellona 1 9 0 7 1 2 1 10 0 9 1 1 5 4 4 4 1 0
Temotu 2 47 2 46 0 1 3 47 3 47 0 0 5 40 5 40 0 0
Western 44 115 42 109 2 6 38 107 36 100 2 7 44 114 39 109 5 5
SI Totals 180 698 173 672 7 26 183 705 174 681 9 24 191 731 177 696 14 35
Untrained Total Trained UntrainedNo. of Teachers in
Management Roles
Total Teachers Trained Untrained Total Teachers Trained
Source: SIEMIS
3.6: Number of Secondary Education teacher in management roles by trained and untrained by Province, 2009-
2011

79
SEC 2009 2010 2011
F M F M F M F M F M F M F M F M F M
Central 0 21 0 20 0 1 0 36 0 18 0 18 0 12 0 11 0 1
Choiseul 5 13 5 11 0 2 ##### #VALUE! 7 #### #### 0 17 0 14 0 3
Guadalcanal 4 48 4 45 0 3 3 94 3 46 0 48 2 53 2 52 0 1
Honiara 5 13 5 4 0 9 6 9 6 3 0 6 4 10 4 7 0 3
Isabel 0 12 0 10 0 2 0 22 0 11 0 11 0 14 0 14 0 0
Makira and Ulawa 0 30 0 30 0 0 2 65 2 32 0 33 1 28 1 28 0 0
Malaita 8 66 8 61 0 5 5 108 5 52 0 56 8 71 8 65 0 6
Rennell and Bellona 0 2 0 1 0 1 0 6 0 2 0 4 0 2 0 0 0 2
Temotu 0 12 0 11 0 1 0 16 0 8 0 8 0 15 0 14 0 1
Western 6 26 4 24 2 2 7 58 6 28 1 30 8 38 6 34 2 4
SI Totals 28 243 26 217 2 26 23 432 22 207 1 225 23 260 21 239 2 21
Total Teachers Trained Untrained Total Trained UntrainedNo. of Teachers in
Management Roles
Total Teachers Trained Untrained
Source: SIEMIS
3.7: Number of TVET teacher in management roles by trained and untrained by Province, 2009-2011
TVT 2009 2010 2011
F M F M F M F M F M F M F M F M F M
Central 0 0 0 0 0 0 0 0 0 0 0 0 0 0 0 0 0 0
Choiseul 0 0 0 0 0 0 0 0 0 0 0 0 0 0 0 0 0 0
Guadalcanal 1 0 1 0 0 0 1 4 1 1 0 3 6 10 5 2 1 8
Honiara 0 0 0 0 0 0 0 0 0 0 0 0 0 0 0 0 0 0
Isabel 0 1 0 0 0 1 0 1 0 0 0 1 0 5 0 1 0 4
Makira and Ulawa 0 5 0 3 0 2 0 9 0 3 0 6 0 8 0 3 0 5
Malaita 0 6 0 3 0 3 0 6 0 2 0 4 0 34 0 12 0 22
Rennell and Bellona 0 1 1 1 -1 0 1 2 1 1 0 1 0 3 0 1 0 2
Temotu 0 0 0 0 0 0 0 0 0 0 0 0 0 0 0 0 0 0
Western 0 3 0 3 0 0 0 6 0 3 0 3 0 5 0 4 0 1
SI Totals 1 16 2 10 -1 6 2 28 2 10 0 18 6 65 5 23 1 42
Untrained Total Trained UntrainedNo. of Teachers in
Management Roles
Total Teachers Trained Untrained Total Teachers Trained
Source: SIEMIS

80 Solomon Islands
Number of pupil/teacher/qualified/certified ratio 3.8: Pupil/teacher rato, pupil trained teacher ratio and pupil untrained teacher ratio for ECE, 2009-2011
2009 2010 2011
ECE
Pupil
Teacher
Ratio
Pupil
Trained
Teacher
Ratio
Pupil
UntrainedTe
acher Ratio
Pupil
Teacher
Ratio
Pupil
TrainedT
eacher
Ratio
Pupil
Untraine
d
Teacher
Pupil
Teacher
Ratio
PupilTrained
Teacher Ratio
Pupil Untrained
Teacher Ratio
Central 20.9 67.2 31.8 21.9 57.7 33.4 19.6 62.1 27.6
Choiseul 24.8 88.9 42.7 21.1 73.1 31.3 17.8 59.6 28.2
Guadalcanal 17.5 58.6 40.9 19.0 44.0 33.0 19.2 46.4 28.8
Honiara 24.0 42.0 37.1 22.5 36.1 31.7 19.7 29.8 26.3
Isabel 12.1 67.5 30.0 11.9 51.1 24.5 12.4 45.0 23.4
Makira and Ulawa 15.7 34.3 27.4 15.9 35.4 27.9 12.8 25.1 18.8
Malaita 24.9 138.1 48.9 21.7 110.5 41.8 19.6 107.6 39.8
Rennell and Bellona 10.0 0.0 0.0 6.8 0.0 0.0 7.8 0.0 0.0
Temotu 22.2 51.8 36.6 23.7 51.9 39.5 25.0 49.9 34.6
Western 21.6 180.1 71.1 22.2 147.3 65.1 18.8 81.9 36.7
SI Totals 19.8 72.4 40.8 19.2 61.0 35.8 17.4 50.1 29.3
Source: SIEMIS
3.9: Pupil/teacher rato, pupil trained teacher ratio and pupil untrained teacher ratio for Primary, 2009-2011
2009 2010 2011
PRI
Pupil
Teacher
Ratio
Pupil
Trained
Teacher
Pupil
Untrained
Teacher
Pupil
Teacher
Ratio
Pupil
Trained
Teacher
Pupil
Untraine
d
Pupil
Teacher
Ratio
Pupil Trained
Teacher Ratio
Pupil Untrained
Teacher Ratio
Central 20.8 33.1 31.3 20.4 31.5 29.9 21.3 33.5 31.1
Choiseul 22.1 40.1 36.0 23.0 40.9 37.5 22.1 40.3 35.4
Guadalcanal 23.2 40.0 36.8 26.2 44.8 41.1 24.5 43.2 39.8
Honiara 29.9 43.5 41.5 32.7 45.9 44.9 31.4 47.4 46.7
Isabel 23.5 29.0 27.3 23.2 27.7 26.6 23.5 28.4 26.5
Makira and Ulawa 19.8 33.0 29.7 22.4 38.2 34.0 21.3 38.1 32.8
Malaita 27.6 56.0 51.7 26.6 53.5 49.9 25.6 55.5 52.7
Rennell and Bellona 12.7 35.4 32.0 12.5 29.0 27.7 13.0 30.2 25.5
Temotu 19.2 31.7 31.0 18.3 32.5 30.9 18.0 32.2 29.9
Western 21.9 37.8 35.0 23.7 41.5 39.3 22.0 37.6 35.7
SI Totals 23.9 41.4 38.5 24.9 43.0 40.2 23.9 42.8 39.8
Source: SIEMIS
3.10: Pupil/teacher rato, pupil trained teacher ratio and pupil untrained teacher ratio for Secondary, 2009-2011
2009 2010 2011
SEC
Pupil
Teacher
Ratio
Pupil
Trained
Teacher
Ratio
Pupil
Untrained
Teacher
Ratio
Pupil
Teacher
Ratio
Pupil
TrainedT
eacher
Ratio
Pupil
Untraine
d
Teacher
Pupil
Teacher
Ratio
Pupil Trained
Teacher Ratio
Pupil Untrained
Teacher Ratio
Central 14.7 19.6 16.3 14.9 21.8 16.4 15.1 21.7 17.0
Choiseul 23.5 33.9 29.1 27.1 51.0 40.2 20.4 30.6 26.7
Guadalcanal 26.8 34.0 32.4 23.8 30.7 27.8 22.1 26.1 23.5
Honiara 32.3 46.6 42.1 47.5 57.9 55.5 55.5 72.0 67.7
Isabel 19.0 23.1 19.8 21.1 24.1 22.5 19.3 20.2 19.3
Makira and Ulawa 20.4 26.2 21.4 16.7 23.9 18.6 18.9 25.1 20.3
Malaita 22.1 33.9 25.1 25.4 38.7 29.6 19.5 30.8 24.9
Rennell and Bellona 33.5 83.8 55.8 21.8 58.0 34.8 22.3 63.2 54.1
Temotu 17.9 36.3 21.5 28.7 46.9 30.6 16.4 33.6 19.6
Western 34.9 46.1 41.9 27.4 41.4 36.2 25.1 35.7 30.9
SI Totals 25.0 34.9 29.2 26.0 36.4 30.5 23.8 32.9 27.9
Source: SIEMIS
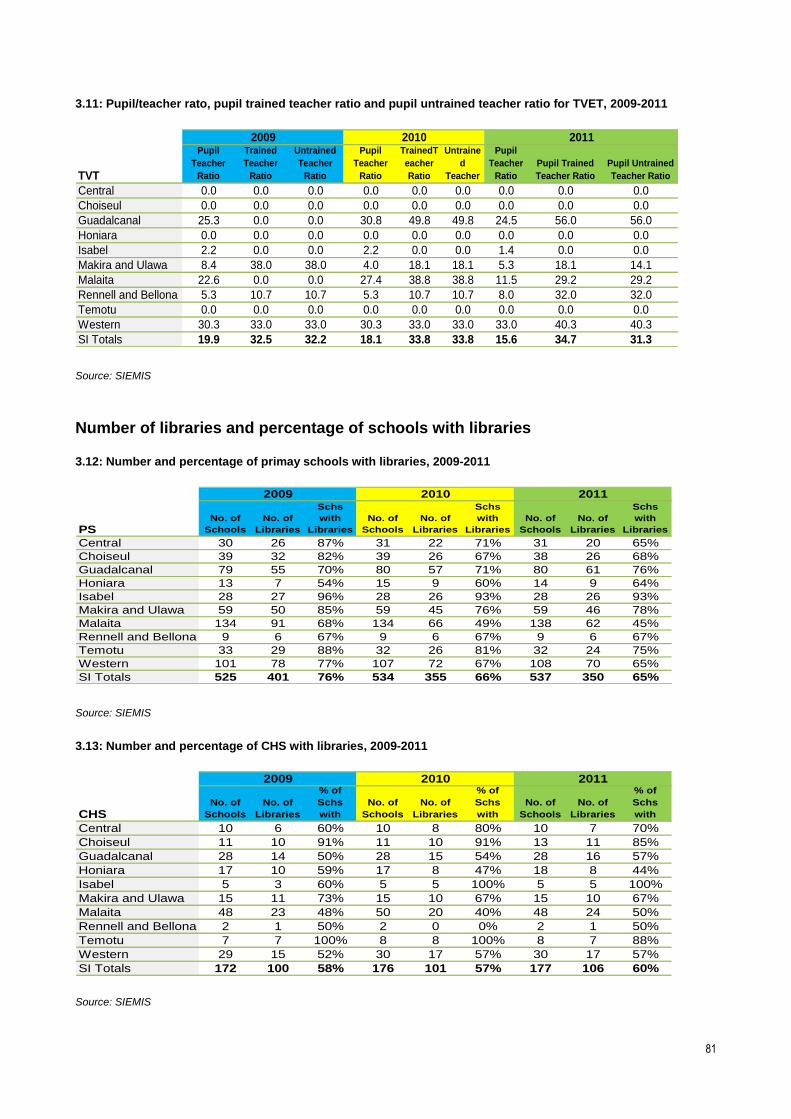
81
3.11: Pupil/teacher rato, pupil trained teacher ratio and pupil untrained teacher ratio for TVET, 2009-2011
2009 2010 2011
TVT
Pupil
Teacher
Ratio
Pupil
Trained
Teacher
Ratio
Pupil
Untrained
Teacher
Ratio
Pupil
Teacher
Ratio
Pupil
TrainedT
eacher
Ratio
Pupil
Untraine
d
Teacher
Pupil
Teacher
Ratio
Pupil Trained
Teacher Ratio
Pupil Untrained
Teacher Ratio
Central 0.0 0.0 0.0 0.0 0.0 0.0 0.0 0.0 0.0
Choiseul 0.0 0.0 0.0 0.0 0.0 0.0 0.0 0.0 0.0
Guadalcanal 25.3 0.0 0.0 30.8 49.8 49.8 24.5 56.0 56.0
Honiara 0.0 0.0 0.0 0.0 0.0 0.0 0.0 0.0 0.0
Isabel 2.2 0.0 0.0 2.2 0.0 0.0 1.4 0.0 0.0
Makira and Ulawa 8.4 38.0 38.0 4.0 18.1 18.1 5.3 18.1 14.1
Malaita 22.6 0.0 0.0 27.4 38.8 38.8 11.5 29.2 29.2
Rennell and Bellona 5.3 10.7 10.7 5.3 10.7 10.7 8.0 32.0 32.0
Temotu 0.0 0.0 0.0 0.0 0.0 0.0 0.0 0.0 0.0
Western 30.3 33.0 33.0 30.3 33.0 33.0 33.0 40.3 40.3
SI Totals 19.9 32.5 32.2 18.1 33.8 33.8 15.6 34.7 31.3 Source: SIEMIS
Number of libraries and percentage of schools with libraries
3.12: Number and percentage of primay schools with libraries, 2009-2011
2009 2010 2011
PSNo. of
Schools
No. of
Libraries
% of
Schs
with
Libraries
No. of
Schools
No. of
Libraries
% of
Schs
with
Libraries
No. of
Schools
No. of
Libraries
% of
Schs
with
Libraries
Central 30 26 87% 31 22 71% 31 20 65%
Choiseul 39 32 82% 39 26 67% 38 26 68%
Guadalcanal 79 55 70% 80 57 71% 80 61 76%
Honiara 13 7 54% 15 9 60% 14 9 64%
Isabel 28 27 96% 28 26 93% 28 26 93%
Makira and Ulawa 59 50 85% 59 45 76% 59 46 78%
Malaita 134 91 68% 134 66 49% 138 62 45%
Rennell and Bellona 9 6 67% 9 6 67% 9 6 67%
Temotu 33 29 88% 32 26 81% 32 24 75%
Western 101 78 77% 107 72 67% 108 70 65%
SI Totals 525 401 76% 534 355 66% 537 350 65% Source: SIEMIS
3.13: Number and percentage of CHS with libraries, 2009-2011
2009 2010 2011
CHSNo. of
Schools
No. of
Libraries
% of
Schs
with
No. of
Schools
No. of
Libraries
% of
Schs
with
No. of
Schools
No. of
Libraries
% of
Schs
with
Central 10 6 60% 10 8 80% 10 7 70%
Choiseul 11 10 91% 11 10 91% 13 11 85%
Guadalcanal 28 14 50% 28 15 54% 28 16 57%
Honiara 17 10 59% 17 8 47% 18 8 44%
Isabel 5 3 60% 5 5 100% 5 5 100%
Makira and Ulawa 15 11 73% 15 10 67% 15 10 67%
Malaita 48 23 48% 50 20 40% 48 24 50%
Rennell and Bellona 2 1 50% 2 0 0% 2 1 50%
Temotu 7 7 100% 8 8 100% 8 7 88%
Western 29 15 52% 30 17 57% 30 17 57%
SI Totals 172 100 58% 176 101 57% 177 106 60%
Source: SIEMIS

82 Solomon Islands
3.14: Number and percentage of PSS with libraries, 2009-2011
2009 2010 2011
PSSNo. of
Schools
No. of
Libraries
% of
Schs
with
Libraries
No. of
Schools
No. of
Libraries
% of
Schs
with
Libraries
No. of
Schools
No. of
Libraries
% of
Schs
with
Libraries
Central 1 0 0% 1 0 0% 1 0 0%
Choiseul 1 1 100% 1 1 100% 1 1 100%
Guadalcanal 3 3 100% 3 3 100% 3 3 100%
Honiara 1 1 100% 1 1 100% 1 1 100%
Isabel 2 2 100% 2 2 100% 2 2 100%
Makira and Ulawa 1 1 100% 1 1 100% 1 1 100%
Malaita 3 1 33% 3 1 33% 3 2 67%
Rennell and Bellona 1 1 100% 1 1 100% 1 1 100%
Temotu 1 1 100% 1 1 100% 1 1 100%
Western 2 2 100% 2 2 100% 3 3 100%
SI Totals 16 13 81% 16 13 81% 17 15 88% Source: SIEMIS
3.15: Number and percentage of NSS with libraries, 2009-2011
2009 2010 2011
NSSNo. of
Schools
No. of
Libraries
% of
Schs
with
Libraries
No. of
Schools
No. of
Libraries
% of
Schs
with
Libraries
No. of
Schools
No. of
Libraries
% of
Schs with
Libraries
Central 0 0 0% 0 0 0% 0 0 0%
Choiseul 0 0 0% 0 0 0% 0 0 0%
Guadalcanal 3 3 100% 3 3 100% 3 3 100%
Honiara 1 0 0% 1 0 0% 1 0 0%
Isabel 0 0 0% 0 0 0% 0 0 0%
Makira and Ulawa 2 2 100% 2 2 100% 2 2 100%
Malaita 1 1 100% 1 1 100% 1 1 100%
Rennell and Bellona 0 0 0% 0 0 0% 0 0 0%
Temotu 0 0 0% 0 0 0% 0 0 0%
Western 3 3 100% 3 3 100% 3 2 67%
SI Totals 10 9 90% 10 9 90% 10 8 80% Source: SIEMIS
Schools with storage
3.16: Number of primary schools with storage, 2009-2011
2009 2010 2011
PSNo. of
Schools
No. of
Store
rooms
% with
Store
room
No. of
Schools
No. of
Store
rooms
% with
Store
room
No. of
Schools
No. of
Store
rooms
% with
Store
room
Central 30 28 93% 31 28 90% 31 29 94%
Choiseul 39 36 92% 39 37 95% 38 36 95%
Guadalcanal 79 69 87% 80 71 89% 80 73 91%
Honiara 13 9 69% 15 9 60% 14 10 71%
Isabel 28 25 89% 28 27 96% 28 27 96%
Makira and Ulawa 59 54 92% 59 56 95% 59 56 95%
Malaita 134 102 76% 134 100 75% 138 110 80%
Rennell and Bellona 9 8 89% 9 8 89% 9 8 89%
Temotu 33 27 82% 32 26 81% 32 27 84%
Western 101 89 88% 107 92 86% 108 92 85%
SI Totals 525 447 85% 534 454 85% 537 468 87%
Source: SIEMIS
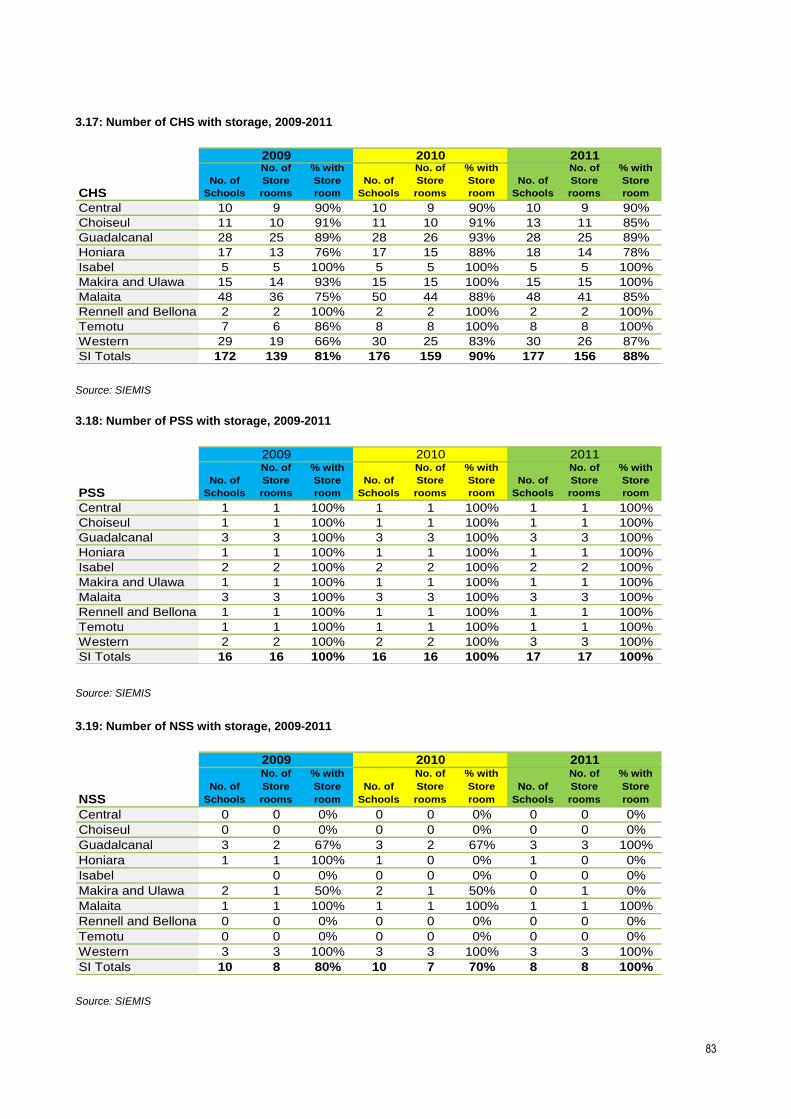
83
3.17: Number of CHS with storage, 2009-2011
2009 2010 2011
CHSNo. of
Schools
No. of
Store
rooms
% with
Store
room
No. of
Schools
No. of
Store
rooms
% with
Store
room
No. of
Schools
No. of
Store
rooms
% with
Store
room
Central 10 9 90% 10 9 90% 10 9 90%
Choiseul 11 10 91% 11 10 91% 13 11 85%
Guadalcanal 28 25 89% 28 26 93% 28 25 89%
Honiara 17 13 76% 17 15 88% 18 14 78%
Isabel 5 5 100% 5 5 100% 5 5 100%
Makira and Ulawa 15 14 93% 15 15 100% 15 15 100%
Malaita 48 36 75% 50 44 88% 48 41 85%
Rennell and Bellona 2 2 100% 2 2 100% 2 2 100%
Temotu 7 6 86% 8 8 100% 8 8 100%
Western 29 19 66% 30 25 83% 30 26 87%
SI Totals 172 139 81% 176 159 90% 177 156 88%
Source: SIEMIS
3.18: Number of PSS with storage, 2009-2011
2009 2010 2011
PSSNo. of
Schools
No. of
Store
rooms
% with
Store
room
No. of
Schools
No. of
Store
rooms
% with
Store
room
No. of
Schools
No. of
Store
rooms
% with
Store
room
Central 1 1 100% 1 1 100% 1 1 100%
Choiseul 1 1 100% 1 1 100% 1 1 100%
Guadalcanal 3 3 100% 3 3 100% 3 3 100%
Honiara 1 1 100% 1 1 100% 1 1 100%
Isabel 2 2 100% 2 2 100% 2 2 100%
Makira and Ulawa 1 1 100% 1 1 100% 1 1 100%
Malaita 3 3 100% 3 3 100% 3 3 100%
Rennell and Bellona 1 1 100% 1 1 100% 1 1 100%
Temotu 1 1 100% 1 1 100% 1 1 100%
Western 2 2 100% 2 2 100% 3 3 100%
SI Totals 16 16 100% 16 16 100% 17 17 100% Source: SIEMIS
3.19: Number of NSS with storage, 2009-2011
2009 2010 2011
NSSNo. of
Schools
No. of
Store
rooms
% with
Store
room
No. of
Schools
No. of
Store
rooms
% with
Store
room
No. of
Schools
No. of
Store
rooms
% with
Store
room
Central 0 0 0% 0 0 0% 0 0 0%
Choiseul 0 0 0% 0 0 0% 0 0 0%
Guadalcanal 3 2 67% 3 2 67% 3 3 100%
Honiara 1 1 100% 1 0 0% 1 0 0%
Isabel 0 0% 0 0 0% 0 0 0%
Makira and Ulawa 2 1 50% 2 1 50% 0 1 0%
Malaita 1 1 100% 1 1 100% 1 1 100%
Rennell and Bellona 0 0 0% 0 0 0% 0 0 0%
Temotu 0 0 0% 0 0 0% 0 0 0%
Western 3 3 100% 3 3 100% 3 3 100%
SI Totals 10 8 80% 10 7 70% 8 8 100%
Source: SIEMIS

84 Solomon Islands
Number of text books and pupil to textbook ratios 3.20: Number of textbooks and pupil to textbook ratio for primary schools, 2009-2011
PS 2009 2010 2011
Books Pupils Ratio Books Pupils Ratio Books Pupils Ratio
Central 26380 3909 0.1 27199 4014 0.1 27597 4087 0.1
Choiseul 62142 3790 0.1 43176 3848 0.1 39545 3912 0.1
Guadalcanal 69015 12176 0.2 59327 12233 0.2 60328 12652 0.2
Honiara 6987 4217 0.6 7133 4878 0.7 10733 4938 0.5
Isabel 40924 4292 0.1 22106 4178 0.2 18355 4296 0.2
Makira and Ulawa 59973 6658 0.1 58019 6870 0.1 53287 7335 0.1
Malaita 121665 22738 0.2 97812 22680 0.2 104253 24087 0.2
Rennell and Bellona 5065 530 0.1 4052 527 0.1 4663 540 0.1
Temotu 46975 3803 0.1 36237 3634 0.1 39094 3693 0.1
Western 121966 10993 0.1 94040 11644 0.1 79959 11826 0.1
SI Total 561092 73106 0.1 449101 74506 0.2 437814 77366 0.2 Source: SIEMIS
3.21: Number of textbooks and pupil to textbook ratio for CHS, 2009-2011
CHS 2009 2010 2011
Books Pupils Ratio Books Pupils Ratio Books Pupils Ratio
Central 14801 3163 0.2 10106 3135 0.3 13770 3188 0.2
Choiseul 19894 2788 0.1 18875 3071 0.2 18882 3471 0.2
Guadalcanal 23995 11623 0.5 33469 11868 0.4 27358 11704 0.4
Honiara 37667 13975 0.4 23686 14435 0.6 19299 15758 0.8
Isabel 6338 2139 0.3 5903 2356 0.4 5339 2552 0.5
Makira and Ulawa 11243 4080 0.4 20257 4441 0.2 21023 4480 0.2
Malaita 82066 19959 0.2 78652 20740 0.3 64269 20228 0.3
Rennell and Bellona 1942 327 0.2 1881 333 0.2 3068 347 0.1
Temotu 9626 2108 0.2 9541 2463 0.3 6290 2600 0.4
Western 31797 9015 0.3 34306 8833 0.3 43157 9034 0.2
SI Total 239369 69177 0.3 236676 71675 0.3 222455 73362 0.3 Source: SIEMIS
3.22: Number of textbooks and pupil to textbook ratio for PSS, 2009-2011
PSS 2009 2010 2011
Books Pupils Ratio Books Pupils Ratio Books Pupils Ratio
Central 0 284 0 320 250 310 1.2
Choiseul 2522 223 0.1 516 252 0.5 2654 253 0.1
Guadalcanal 1299 1057 0.8 1259 986 0.8 1267 980 0.8
Honiara 1337 901 0.7 1404 979 0.7 1404 1139 0.8
Isabel 0 844 200 828 4.1 3844 761 0.2
Makira and Ulawa 1589 302 0.2 813 320 0.4 4646 330 0.1
Malaita 1309 963 0.7 1312 1005 0.8 2046 1153 0.6
Rennell and Bellona 0 151 490 125 0.3 1581 156 0.1
Temotu 525 186 0.4 1257 321 0.3 245 402 1.6
Western 2825 707 0.3 558 654 1.2 1909 970 0.5
SI Total 11406 5618 0.5 7809 5790 0.7 19846 6454 0.3
Source: SIEMIS

85
3.23: Number of textbooks and pupil to textbook ratio for NSS, 2009-2011
NSS 2009 2010 2011
Books Pupils Ratio Books Pupils Ratio Books Pupils Ratio
Central
Choiseul
Guadalcanal 2636 1500 0.6 1713 1483 0.9 1205 1483 1.2
Honiara 0 856 0 951 0 904
Isabel
Makira and Ulawa 900 823 0.9 900 823 0.9 0 1002
Malaita 418 363 0.9 480 393 0.8 591 426 0.7
Rennell and Bellona
Temotu
Western 2934 1153 0.4 4749 1123 0.2 1337 906 0.7
SI Total 6888 4695 0.7 7842 4773 2.8 3133 4721 1.5
Source: SIEMIS
Access to computers
3.24: Number of ECE with access to computer by province, 2009-2011
2009 2010 2011
ECE
Central 13 0 0.0 13 0 0.0 13 0 0.0
Choiseul 25 0 0.0 23 0 0.0 23 0 0.0
Guadalcanal 55 1 0.0 45 0 0.0 43 8 0.2
Honiara 28 2 0.1 34 30 0.9 33 50 1.5
Isabel 61 0 0.0 55 0 0.0 55 0 0.0
Makira and Ulawa 83 0 0.0 72 0 0.0 69 4 0.1
Malaita 204 4 0.0 192 0 0.0 164 2 0.0
Rennell and Bellona 10 0 0.0 7 0 0.0 7 0 0.0
Temotu 21 0 0.0 22 0 0.0 20 0 0.0
Western 59 8 0.1 59 0 0.0 55 4 0.1
SI Total 559 15 0.0 522 30 0.1 482 68 0.1
Ratio
No. of
PCs Ratio
No. of
Schools
No. of
PCs
No. of
Schools
No. of
PCs Ratio
No. of
Schools
Source: SIEMIS
3.25: Number of Primary Schools with access to computer by province, 2009-2011
2009 2010 2011
PS
Central 30 0 0.0 31 0 0% 31 2 0.1
Choiseul 39 0 0.0 39 0 0% 39 0 0.0
Guadalcanal 79 8 0.1 79 5 6% 79 9 0.1
Honiara 12 2 0.2 14 28 200% 13 86 6.6
Isabel 28 0 0.0 28 0 0% 28 4 0.1
Makira and Ulawa 59 0 0.0 59 0 0% 59 2 0.0
Malaita 134 0 0.0 133 11 8% 132 8 0.1
Rennell and Bellona 9 0 0.0 9 3 33% 9 0 0.0
Temotu 33 0 0.0 32 0 0% 32 0 0.0
Western 101 1 0.0 101 7 7% 101 18 0.2
SI Total 524 11 0.0 525 54 10% 523 129 0.2
Ratio
No. of
PCs
No. of
Schools
No. of
PCs Ratio
No. of
Schools
No. of
PCs Ratio
No. of
Schools
Source: SIEMIS

86 Solomon Islands
3.26: Number of CHS with access to computer by province, 2009-2011
2009 2010 2011
CHS
Central 10 9 0.9 10 14 1.4 31 2 0.1
Choiseul 11 11 1.0 11 6 0.5 39 0 0.0
Guadalcanal 28 52 1.9 28 47 1.7 79 9 0.1
Honiara 17 52 3.1 17 53 3.1 13 86 6.6
Isabel 5 3 0.6 5 4 0.8 28 4 0.1
Makira and Ulawa 15 8 0.5 15 9 0.6 59 2 0.0
Malaita 48 1 0.0 50 31 0.6 132 8 0.1
Rennell and Bellona 2 0 0.0 2 0 0.0 9 0 0.0
Temotu 7 5 0.7 8 3 0.4 32 0 0.0
Western 30 18 0.6 30 23 0.8 101 18 0.2
SI Total 173 159 0.9 176 190 1.1 523 129 0.2
No. of
PCs Ratio
No. of
Schools
No. of
PCs Ratio
No. of
Schools
No. of
PCs Ratio
No. of
Schools
Source: SIEMIS
3.27: Number of PSS with access to computer by province, 2009-2011
2009 2010 2011
PSS
Central 1 0 0.0 1 1 100% 1 0 0.0
Choiseul 1 2 2.0 1 6 600% 1 10 10.0
Guadalcanal 3 2 0.7 3 6 200% 3 10 3.3
Honiara 1 14 14.0 1 42 4200% 1 0 0.0
Isabel 2 3 1.5 2 1 50% 2 5 2.5
Makira and Ulawa 1 3 3.0 1 3 300% 1 2 2.0
Malaita 3 1 0.3 3 2 67% 3 2 0.7
Rennell and Bellona 1 0 0.0 1 1 100% 1 2 2.0
Temotu 1 2 2.0 1 0 0% 1 0 0.0
Western 2 0 0.0 2 29 1450% 2 10 5.0
SI Total 16 27 1.7 16 91 569% 16 41 2.6
Ratio
No. of
PCs Ratio
No. of
Schools
No. of
PCs
No. of
Schools
No. of
PCs Ratio
No. of
Schools
Source: SIEMIS
3.28: Number of NSS with access to computer by province, 2009-2011
2009 2010 2011
NSS
Central 0 0 0 0 0 0
Choiseul 0 0 0 0 0 0
Guadalcanal 3 20 6.7 3 45 15.0 3 65 21.7
Honiara 1 0 0.0 1 12 12.0 1 0 0.0
Isabel 0 0 0 0 0 0
Makira and Ulawa 2 0 0.0 2 0 0.0 2 0 0.0
Malaita 1 0 0.0 1 3 3.0 1 4 4.0
Rennell and Bellona 0 0 0 0 0 0
Temotu 0 0 0 0 0 0
Western 3 2 0.7 3 13 4.3 3 64 21.3
SI Total 10 22 2.2 10 73 7.3 10 133 13.3
No. of
Schools
No. of
PCs Ratio
No. of
Schools Ratio
No. of
PCs Ratio
No. of
Schools
No. of
PCs
Source: SIEMIS

87
Literacy and numeracy rates 3.29: National SISTA 1 overall Literacy level of achievements in 2010 compared to baseline year 2005/2006
baseline 2010
L5 5 7
L4 6 9
L3 11 16
L2 18 22
LC 58 47
L3+ 24 32
Source: NESU, SPBEA, SPC
3.30: National SISTA 1 overall Literacy level of achievements in 2010 by gender compared to baseline year
2005/2006
Baseline Female 2010 Baseline Male 2010
L5 5 8 5 5
L4 6 10 6 8
L3 12 17 11 15
L2 18 22 18 22
LC 59 44 59 50
L3+ 23 35 22 28
Source: NESU, SPBEA, SPC
3.31: National SISTA 1 Literacy level of achievements by strand in 2010 compared to baseline year 2005/2006
Baseline 2010 Baseline 2010
Lc 53 44 68 51
L3+ 29 35 13 26
Reading Writing
Source: NESU, SPBEA, SPC
3.32: National SISTA 1 overall numeracy level of achievements in 2010 compared to baseline year 2005/2006
baseline 2010
L5 14 16
L4 13 11
L3 17 19
L2 14 20
LC 42 33
L3+ 44 46
Source: NESU, SPBEA, SPC

88 Solomon Islands
3.33: National SISTA 1 overall numeracy level of achievements in 2010 by gender compared to baseline year
2005/2006
Baseline Female 2010 Baseline Male 2010
L5 14 16 14 16
L4 13 11 13 12
L3 17 19 17 19
L2 14 20 14 20
LC 42 33 42 33
L3+ 44 46 44 47 Source: NESU, SPBEA, SPC
3.34: National SISTA 1 numeracy level of achievements by strand in 2010 compared to baseline year 2005/2006
baseline 2010 baseline 2010 baseline 2010 baseline 2010 baseline 2010 baseline 2010
Lc 55 44 34 34 22 64 47 28 25 29 21
L3+ 23 40 46 58 69 21 30 54 52 56 59
Fractions Geometry Graphs Measurement Numbers Operations
Source: NESU, SPBEA, SPC
3.35: National SISTA 2 overall Literacy level of achievements in 2010 compared to baseline year 2005/2006
Baseline 2010
L5 2 10
L4 11 13
L3 16 17
L2 18 18
L3+ 29 40
Lc 53 41 Source: NESU, SPBEA, SPC
3.36: National SISTA 2 overall Literacy level of achievements in 2010 by strand compared to baseline year
2005/2006
baseline 2010 baseline 2010 baseline 2010
LC 79 66 42 37 7 7
L3+ 10 22 27 39 71 76
Reading Writing Language
Source: NESU, SPBEA, SPC

89
3.37: National SISTA 2 Literacy level of achievements by sub-strand in 2010 compared to baseline year
2005/2006
baseline 2010 baseline 2010 baseline 2010 baseline 2010
LC 84 60 73 65 42 37 7 7
L3+ 4 20 14 22 27 39 71 76
LanguageComprehension Vocabulary Writing
Source: NESU, SPBEA, SPC
3.38: National SISTA 2 overall lietarcy level of achievements by province in 2010 compared to baseline year
2005/2006
Makira Malaita Renbel Temotu Westen
baseline 2010 baseline 2010 baseline 2010 baseline 2010 baseline 2010 baseline 2010 baseline 2010 baseline 2010 baseline 2010 baseline 2010
LC 48 50 58 63 55 52 42 37 54 59 57 51 52 39 45 38 57 54 57 50
L3+ 33 34 25 23 27 33 39 45 29 26 24 32 29 44 34 39 27 29 25 30
Central Choisuel Guadalcanal Honiara Isabel
Source: NESU, SPBEA, SPC
3.39: National SISTA 2 overall numeracy level of achievements in 2010 compared to baseline year 2005/2006
Baseline 2010
L5 12 16
L4 15 14
L3 13 15
L2 12 13
L3+ 40 45
Lc 47 41 Source: NESU, SPBEA, SPC
3.40: National SISTA 2 numeracy level of achievements by main strand in 2010 compared to baseline year
2005/2006
baseline 2010 baseline 2010 baseline 2010 baseline 2010 baseline 2010
LC 23 26 53 44 62 58 77 62 31 14
L3+ 69 66 32 40 24 29 9 24 52 72
working with nrs. Measurement Shapes/Space Graphsoperations
Source: NESU, SPBEA, SPC
3.41: National SISTA 2 numeracy level of achievements by sub-strand in 2010 compared to baseline year
2005/2006
Additions Graphs Subtraction Decimals Fractions Multiplication
Calculation/
Problem solving Division Money Conversions Time Zone
Shape
and
Space Ratios MeasurementPercentage
Lc 8 13 16 20 25 30 34 48 48 53 58 64 65 69 82
L3+ 93 72 79 40 53 63 50 41 30 31 40 24 31 19 10
Source: NESU, SPBEA, SPC

90 Solomon Islands
3.42: National SISTA 2 overall numeracy level of achievements by province in 2010 compared to baseline year
2005/2006
baseline 2010 baseline 2010 baseline 2010 baseline 2010 baseline 2010 baseline 2010 baseline 2010 baseline
Lc 41 40 49 44 47 46 44 41 41 39 51 44 47 38 44
L3+ 46 46 37 45 40 44 45 49 46 49 36 43 40 48 45
RenbelMalaitaMakiraIsabelHoniaraGuadalcanalChoisuelCentral
Source: NESU, SPBEA, SPC
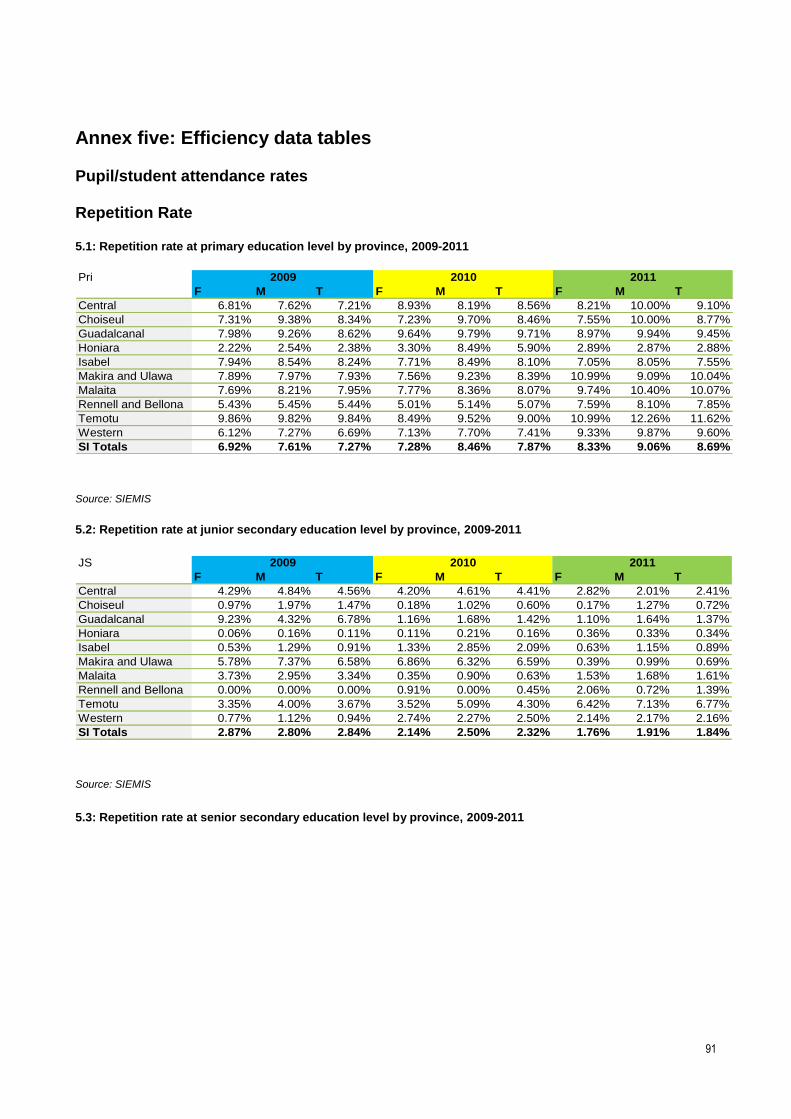
91
Annex five: Efficiency data tables Pupil/student attendance rates Repetition Rate
5.1: Repetition rate at primary education level by province, 2009-2011
Pri 2009 2010 2011
F M T F M T F M T
Central 6.81% 7.62% 7.21% 8.93% 8.19% 8.56% 8.21% 10.00% 9.10%
Choiseul 7.31% 9.38% 8.34% 7.23% 9.70% 8.46% 7.55% 10.00% 8.77%
Guadalcanal 7.98% 9.26% 8.62% 9.64% 9.79% 9.71% 8.97% 9.94% 9.45%
Honiara 2.22% 2.54% 2.38% 3.30% 8.49% 5.90% 2.89% 2.87% 2.88%
Isabel 7.94% 8.54% 8.24% 7.71% 8.49% 8.10% 7.05% 8.05% 7.55%
Makira and Ulawa 7.89% 7.97% 7.93% 7.56% 9.23% 8.39% 10.99% 9.09% 10.04%
Malaita 7.69% 8.21% 7.95% 7.77% 8.36% 8.07% 9.74% 10.40% 10.07%
Rennell and Bellona 5.43% 5.45% 5.44% 5.01% 5.14% 5.07% 7.59% 8.10% 7.85%
Temotu 9.86% 9.82% 9.84% 8.49% 9.52% 9.00% 10.99% 12.26% 11.62%
Western 6.12% 7.27% 6.69% 7.13% 7.70% 7.41% 9.33% 9.87% 9.60%
SI Totals 6.92% 7.61% 7.27% 7.28% 8.46% 7.87% 8.33% 9.06% 8.69%
Source: SIEMIS
5.2: Repetition rate at junior secondary education level by province, 2009-2011
JS 2009 2010 2011
F M T F M T F M T
Central 4.29% 4.84% 4.56% 4.20% 4.61% 4.41% 2.82% 2.01% 2.41%
Choiseul 0.97% 1.97% 1.47% 0.18% 1.02% 0.60% 0.17% 1.27% 0.72%
Guadalcanal 9.23% 4.32% 6.78% 1.16% 1.68% 1.42% 1.10% 1.64% 1.37%
Honiara 0.06% 0.16% 0.11% 0.11% 0.21% 0.16% 0.36% 0.33% 0.34%
Isabel 0.53% 1.29% 0.91% 1.33% 2.85% 2.09% 0.63% 1.15% 0.89%
Makira and Ulawa 5.78% 7.37% 6.58% 6.86% 6.32% 6.59% 0.39% 0.99% 0.69%
Malaita 3.73% 2.95% 3.34% 0.35% 0.90% 0.63% 1.53% 1.68% 1.61%
Rennell and Bellona 0.00% 0.00% 0.00% 0.91% 0.00% 0.45% 2.06% 0.72% 1.39%
Temotu 3.35% 4.00% 3.67% 3.52% 5.09% 4.30% 6.42% 7.13% 6.77%
Western 0.77% 1.12% 0.94% 2.74% 2.27% 2.50% 2.14% 2.17% 2.16%
SI Totals 2.87% 2.80% 2.84% 2.14% 2.50% 2.32% 1.76% 1.91% 1.84%
Source: SIEMIS
5.3: Repetition rate at senior secondary education level by province, 2009-2011

92 Solomon Islands
SS 2009 2010 2011
F M T F M T F M T
Central 4.11% 1.12% 2.62% 1.10% 3.85% 2.48% 9.62% 11.43% 10.52%
Choiseul 0.00% 1.10% 0.55% 1.18% 0.91% 1.04% 3.70% 0.89% 2.30%
Guadalcanal 2.03% 2.09% 2.06% 1.95% 1.86% 1.91% 0.49% 1.00% 0.74%
Honiara 0.43% 0.81% 0.62% 0.60% 1.08% 0.84% 0.43% 0.88% 0.66%
Isabel 0.00% 0.60% 0.30% 3.14% 1.68% 2.41% 1.68% 0.73% 1.21%
Makira and Ulawa 3.22% 4.09% 3.65% 1.72% 0.44% 1.08% 0.47% 2.84% 1.66%
Malaita 2.75% 1.65% 2.20% 2.42% 1.50% 1.96% 1.06% 2.12% 1.59%
Rennell and Bellona 0.00% 0.00% 0.00% 11.36% 4.76% 8.06% 9.23% 12.50% 10.87%
Temotu 3.66% 1.98% 2.82% 3.55% 5.50% 4.53% 13.93% 21.15% 17.54%
Western 0.96% 1.04% 1.00% 1.11% 1.00% 1.06% 1.88% 2.33% 2.11%
SI Totals 1.71% 1.45% 1.58% 2.81% 2.26% 2.54% 4.25% 5.59% 4.92%
Source: SIEMIS

93
Survival (completion) rates and cumulative survival rate. 5. 4: Survival (completion) rate and cumulative survival rate from prep for all Provinces and SI, 2009-2011
Survival rate cumulative survival rate Central 2009 2010 2011
Prep 81.54% 86.06% 93.94%
Std 1 89.01% 97.92% 82.60%
Std 2 90.06% 104.10% 90.45%
Std 3 89.51% 91.54% 87.90%
Std 4 96.79% 95.07% 92.93%
Std 5 86.83% 89.75% 82.17%
Std 6 77.87% 78.77% 80.40%
Form 1 102.62% 88.97% 88.35%
Form 2 85.03% 81.19% 89.10%
Form 3 65.32% 56.04% 74.85%
Form 4 77.96% 59.47% 84.47%
Form 5
Form 6
Form 7
Central 2009 2010 2011
Prep 81.54% 86.06% 93.94%
Std 1 72.58% 84.28% 77.60%
Std 2 65.36% 87.73% 70.18%
Std 3 58.51% 80.31% 61.69%
Std 4 56.63% 76.35% 57.33%
Std 5 49.17% 68.52% 47.11%
Std 6 38.29% 53.98% 37.88%
Form 1 39.29% 48.02% 33.47%
Form 2 33.41% 38.99% 29.82%
Form 3 21.82% 21.85% 22.32%
Form 4 17.01% 13.00% 18.85%
Form 5
Form 6
Form 7 Source: SIEMIS Source: SIEMIS
Choiseul 2009 2010 2011
Prep 95.49% 107.70% 83.48%
Std 1 94.61% 100.80% 91.79%
Std 2 101.74% 102.75% 93.08%
Std 3 102.77% 93.90% 93.96%
Std 4 99.50% 91.00% 90.91%
Std 5 94.60% 88.67% 93.22%
Std 6 79.52% 94.96% 94.97%
Form 1 89.93% 95.32% 79.51%
Form 2 97.50% 90.29% 91.96%
Form 3 49.01% 31.25% 34.20%
Form 4 80.56% 75.00% 85.56%
Form 5 9.84% 16.87% 26.51%
Form 6 25.00% 0.00% 0.00%
Form 7
Choiseul 2009 2010 2011
Prep 95.49% 107.70% 83.48%
Std 1 90.34% 108.56% 76.63%
Std 2 91.91% 111.54% 71.32%
Std 3 94.46% 104.73% 67.01%
Std 4 93.99% 95.31% 60.92%
Std 5 88.91% 84.51% 56.79%
Std 6 70.70% 80.26% 53.93%
Form 1 63.58% 76.50% 42.88%
Form 2 61.99% 69.07% 39.43%
Form 3 30.38% 21.59% 13.49%
Form 4 24.47% 16.19% 11.54%
Form 5 2.41% 2.73% 3.06%
Form 6 0.60% 0.00% 0.00%
Form 7 Source: SIEMIS Source: SIEMIS
Guadalcanal 2009 2010 2011
Prep 81.61% 78.73% 77.31%
Std 1 88.32% 92.76% 89.52%
Std 2 95.68% 97.65% 92.75%
Std 3 92.23% 92.71% 93.77%
Std 4 94.09% 90.37% 89.46%
Std 5 88.68% 91.46% 90.37%
Std 6 96.46% 93.90% 88.18%
Form 1 88.21% 92.18% 87.68%
Form 2 92.14% 87.32% 87.62%
Form 3 112.94% 122.53% 67.26%
Form 4 88.69% 83.26% 71.71%
Form 5 40.90% 40.21% 39.41%
Form 6 23.28% 31.14% 33.88%
Form 7 0.00% 0.00% 0.00%
Guadalcanal 2009 2010 2011
Prep 81.61% 78.73% 77.31%
Std 1 72.08% 73.03% 69.21%
Std 2 68.97% 71.31% 64.19%
Std 3 63.61% 66.11% 60.20%
Std 4 59.85% 59.74% 53.85%
Std 5 53.08% 54.64% 48.66%
Std 6 51.20% 51.31% 42.91%
Form 1 45.16% 47.30% 37.62%
Form 2 41.61% 41.30% 32.97%
Form 3 47.00% 50.60% 22.17%
Form 4 41.68% 42.13% 15.90%
Form 5 17.05% 16.94% 6.27%
Form 6 3.97% 5.28% 2.12%
Form 7 0.00% 0.00% 0.00% Source: SIEMIS Source: SIEMIS

94 Solomon Islands
Survival rate cumulative survival rate Honiara 2009 2010 2011
Prep 104.29% 110.45% 112.51%
Std 1 101.51% 102.48% 96.75%
Std 2 104.56% 100.85% 94.74%
Std 3 102.10% 104.21% 94.36%
Std 4 104.98% 100.65% 90.06%
Std 5 98.09% 93.64% 86.65%
Std 6 92.28% 100.38% 90.67%
Form 1 105.34% 113.37% 97.00%
Form 2 107.08% 107.44% 100.67%
Form 3 133.58% 117.99% 108.83%
Form 4 102.19% 108.89% 101.95%
Form 5 76.09% 78.03% 55.18%
Form 6 39.68% 43.92% 39.86%
Form 7 0.00% 0.00% 0.00%
Honiara 2009 2010 2011
Prep 104.29% 110.45% 112.51%
Std 1 105.87% 113.19% 108.85%
Std 2 110.69% 114.16% 103.13%
Std 3 113.02% 118.97% 97.32%
Std 4 118.65% 119.74% 87.64%
Std 5 116.38% 112.12% 75.94%
Std 6 107.40% 112.54% 68.85%
Form 1 113.14% 127.59% 66.79%
Form 2 121.15% 137.08% 67.23%
Form 3 161.83% 161.74% 73.17%
Form 4 165.36% 176.12% 74.59%
Form 5 125.83% 137.43% 41.16%
Form 6 49.93% 60.35% 16.41%
Form 7 0.00% 0.00% 0.00% Source: SIEMIS Source: SIEMIS
Makira and Ulawa 2009 2010 2011
Prep 93.18% 92.43% 87.18%
Std 1 95.25% 98.08% 94.26%
Std 2 97.14% 97.63% 96.15%
Std 3 95.45% 99.01% 96.36%
Std 4 93.53% 96.98% 85.79%
Std 5 94.30% 90.81% 86.03%
Std 6 96.91% 95.47% 97.74%
Form 1 91.07% 89.83% 93.22%
Form 2 88.19% 89.87% 85.32%
Form 3 100.19% 94.80% 69.30%
Form 4 85.44% 95.60% 88.33%
Form 5 61.07% 45.98% 49.12%
Form 6 0.00% 11.77% 10.71%
Form 7 0.00%
Makira and Ulawa 2009 2010 2011
Prep 93.18% 92.43% 87.18%
Std 1 88.76% 90.66% 82.18%
Std 2 86.22% 88.51% 79.01%
Std 3 82.29% 87.63% 76.13%
Std 4 76.97% 84.98% 65.31%
Std 5 72.58% 77.17% 56.19%
Std 6 70.34% 73.68% 54.92%
Form 1 64.06% 66.18% 51.20%
Form 2 56.49% 59.48% 43.68%
Form 3 56.60% 56.39% 30.27%
Form 4 48.35% 53.91% 26.74%
Form 5 29.53% 24.79% 13.13%
Form 6 0.00% 2.92% 1.41%
Form 7 0.00% 2.92% 0.00% Source: SIEMIS Source: SIEMIS Malaita 2009 2010 2011
Prep 71.61% 72.28% 71.43%
Std 1 92.23% 90.99% 90.95%
Std 2 94.34% 95.54% 90.87%
Std 3 92.90% 88.76% 84.81%
Std 4 91.19% 88.22% 85.24%
Std 5 79.53% 86.69% 79.36%
Std 6 79.46% 80.91% 68.94%
Form 1 87.00% 93.68% 80.09%
Form 2 83.59% 96.15% 81.20%
Form 3 73.10% 90.88% 51.55%
Form 4 79.53% 92.58% 79.59%
Form 5 29.27% 35.61% 29.58%
Form 6 33.06% 26.06% 24.02%
Form 7 0.00% 0.00% 0.00%
Malaita 2009 2010 2011
Prep 71.61% 72.28% 71.43%
Std 1 66.04% 65.76% 64.97%
Std 2 62.31% 62.83% 59.03%
Std 3 57.89% 55.77% 50.07%
Std 4 52.79% 49.20% 42.68%
Std 5 41.98% 42.65% 33.87%
Std 6 33.36% 34.51% 23.35%
Form 1 29.02% 32.33% 18.70%
Form 2 24.26% 31.08% 15.19%
Form 3 17.74% 28.25% 7.83%
Form 4 14.10% 26.15% 6.23%
Form 5 4.13% 9.31% 1.84%
Form 6 1.37% 2.43% 0.44%
Form 7 0.00% 0.00% 0.00% Source: SIEMIS Source: SIEMIS

95
Survival rate cumulative survival rate Rennell and Bellona 2009 2010 2011
Prep 53.86% 92.66% 130.00%
Std 1 78.41% 133.82% 88.68%
Std 2 123.27% 110.96% 94.74%
Std 3 86.48% 95.60% 74.74%
Std 4 98.91% 102.44% 90.43%
Std 5 80.96% 90.48% 81.32%
Std 6 107.69% 116.25% 107.59%
Form 1 91.25% 94.05% 93.55%
Form 2 108.45% 104.17% 69.62%
Form 3 85.19% 122.37% 56.00%
Form 4 86.54% 85.25% 55.74%
Form 5
Form 6
Form 7
Rennell and Bellona 2009 2010 2011
Prep 53.86% 92.66% 130.00%
Std 1 42.23% 124.00% 115.28%
Std 2 52.06% 137.59% 109.22%
Std 3 45.02% 131.54% 81.62%
Std 4 44.53% 134.75% 73.81%
Std 5 36.05% 121.92% 60.02%
Std 6 38.82% 141.73% 64.58%
Form 1 35.43% 133.29% 60.41%
Form 2 38.42% 138.85% 42.06%
Form 3 32.73% 169.90% 23.55%
Form 4 28.32% 144.84% 13.13%
Form 5
Form 6
Form 7 Source: SIEMIS Source: SIEMIS
Temotu 2009 2010 2011
Prep 87.24% 79.52% 84.92%
Std 1 89.92% 84.01% 88.49%
Std 2 113.24% 104.55% 99.42%
Std 3 95.22% 88.97% 82.26%
Std 4 90.54% 90.94% 99.83%
Std 5 87.59% 89.71% 78.77%
Std 6 88.88% 94.77% 98.44%
Form 1 83.29% 93.39% 88.01%
Form 2 87.42% 100.29% 103.96%
Form 3 86.51% 105.90% 69.21%
Form 4 77.78% 105.52% 83.77%
Form 5
Form 6
Form 7
Temotu 2009 2010 2011
Prep 87.24% 79.52% 84.92%
Std 1 78.45% 66.80% 75.15%
Std 2 88.83% 69.84% 74.71%
Std 3 84.58% 62.13% 61.46%
Std 4 76.58% 56.50% 61.36%
Std 5 67.08% 50.69% 48.33%
Std 6 59.62% 48.04% 47.58%
Form 1 49.66% 44.86% 41.87%
Form 2 43.41% 44.99% 43.53%
Form 3 37.56% 47.64% 30.13%
Form 4 29.21% 50.27% 25.24%
Form 5
Form 6
Form 7 Source: SIEMIS Source: SIEMIS
Western 2009 2010 2011
Prep 85.60% 92.78% 98.25%
Std 1 90.83% 95.25% 88.51%
Std 2 100.26% 95.28% 95.64%
Std 3 92.52% 96.17% 91.19%
Std 4 95.00% 102.21% 93.72%
Std 5 97.20% 94.38% 87.79%
Std 6 89.68% 83.94% 83.52%
Form 1 88.94% 90.46% 97.22%
Form 2 83.43% 91.20% 87.76%
Form 3 133.55% 135.35% 95.76%
Form 4 87.77% 94.86% 85.64%
Form 5 42.54% 42.35% 40.28%
Form 6 7.00% 9.96% 9.13%
Form 7 0.00% 0.00% 0.00%
Western 2009 2010 2011
Prep 85.60% 92.78% 98.25%
Std 1 77.74% 88.38% 86.96%
Std 2 77.95% 84.21% 83.17%
Std 3 72.12% 80.98% 75.84%
Std 4 68.51% 82.77% 71.08%
Std 5 66.59% 78.12% 62.41%
Std 6 59.72% 65.58% 52.12%
Form 1 53.12% 59.32% 50.67%
Form 2 44.32% 54.10% 44.47%
Form 3 59.18% 73.22% 42.58%
Form 4 51.94% 69.46% 36.47%
Form 5 22.10% 29.42% 14.69%
Form 6 1.55% 2.93% 1.34%
Form 7 0.00% 0.00% 0.00%
Source: SIEMIS Source: SIEMIS

96 Solomon Islands
Survival rate cumulative survival rate Solomon Islands 2009 2010 2011
Std 1 92.5% 94.8% 91.0%
Std 2 97.6% 98.0% 93.5%
Std 3 94.1% 94.1% 90.1%
Std 4 95.3% 93.9% 89.4%
Std 5 88.8% 90.2% 84.8%
Std 6 88.2% 89.8% 84.7%
Form 1 91.7% 95.8% 89.3%
Form 2 90.6% 93.9% 88.9%
Form 3 103.0% 105.1% 75.7%
Form 4 89.3% 93.8% 86.0%
Form 5 49.8% 49.1% 41.7%
Form 6 27.7% 31.6% 28.7%
Form 7 0.0% 0.0% 0.0%
Solomon Islands 2009 2010 2011
Std 1 92.49% 94.77% 90.99%
Std 2 90.25% 92.90% 85.03%
Std 3 84.96% 87.44% 76.65%
Std 4 80.99% 82.11% 68.51%
Std 5 71.90% 74.07% 58.06%
Std 6 63.39% 66.51% 49.17%
Form 1 58.12% 63.71% 43.90%
Form 2 52.68% 59.86% 39.02%
Form 3 54.27% 62.92% 29.52%
Form 4 48.47% 58.98% 25.39%
Form 5 24.12% 28.96% 10.59%
Form 6 6.68% 9.15% 3.04%
Form 7 0.00% 0.00% 0.00% Source: SIEMIS Source: SIEMIS Transition rate 5.5. Total candidate enrolled, placed to higher level (transitioned) with the GPI enrolled and placed for SISEE by Province, 2009-2011
GPI
enrolled
GPI
Placed
GPI
enrolled
GPI
Placed
F M F M F M F M F M F M F M F M F M F M
Central 208 259 208 259 100.0% 100.0% 0.80 0.80 218 290 218 290 100.0% 100.0% 0.75 0.75 225 251 225 251 100.0% 100.0%
Choisuel 269 253 221 207 82.2% 81.8% 1.06 1.07 283 274 283 274 100.0% 100.0% 1.03 1.03 290 290 290 290 100.0% 100.0%
Guadalcanal 804 804 641 676 79.7% 84.1% 1.00 0.95 839 839 751 725 89.5% 86.4% 1.00 1.04 874 867 787 796 90.0% 91.8%
Honiara City Council 649 662 586 587 90.3% 88.7% 0.98 1.00 728 708 677 644 93.0% 91.0% 1.03 1.05 730 693 685 660 93.8% 95.2%
Isabel 231 263 211 239 91.3% 90.9% 0.88 0.88 264 282 264 282 100.0% 100.0% 0.94 0.94 240 260 240 260 100.0% 100.0%
Makira and Ulawa 377 402 343 359 91.0% 89.3% 0.94 0.96 413 410 351 343 85.0% 83.7% 1.01 1.02 394 420 394 420 100.0% 100.0%
Malaita 1133 1373 1054 1261 93.0% 91.8% 0.83 0.84 1182 1418 1039 1256 87.9% 88.6% 0.83 0.83 1240 1445 1105 1290 89.1% 89.3%
Rennel and Bellona 26 33 26 33 100.0% 100.0% 0.79 0.79 47 27 47 27 100.0% 100.0% 1.74 1.74 34 30 34 30 100.0% 100.0%
Temotu 214 255 201 230 93.9% 90.2% 0.84 0.87 201 222 175 199 87.1% 89.6% 0.91 0.88 208 238 208 238 100.0% 100.0%
Western Province 820 838 673 680 82.1% 81.1% 0.98 0.99 849 859 705 693 83.0% 80.7% 0.99 1.02 851 888 758 779 89.1% 87.7%
SI Total by gender 4731 5142 4164 4531 88.0% 88.1% 0.91 0.91 5024 5329 4510 4733 89.8% 88.8% 1.02 1.03 5086 5382 4726 5014 96.2% 96.4%
SI Total 9873 8695 88.1%
2010
9740 96.3%104688708 7768 89.3%
Transistion rate
Total
enrolled
Total
placed
Total
enrolled
Total
placed Transistion rate
Total
enrolled
Total
placed Transition rate
2009 2011
Source: ATLAS, NESU.
5.6. Total candidate enrolled, placed to higher level (transitioned) with the GPI enrolled and placed for SIF3 by Province, 2009-2011

97
GPI
enrolled
GPI
Placed
GPI
enrolled
GPI
Placed
F M F M F M F M F M F M F M F M F M F M
Central 112 137 76 122 67.9% 89.1% 0.82 0.62 97 119 48 66 49.5% 55.5% 0.82 0.73 113 160 80 128 70.8% 80.0%
Choisuel 122 113 77 77 63.1% 68.1% 1.08 1.00 129 144 61 70 47.3% 48.6% 0.90 0.87 142 145 94 101 66.2% 69.7%
Guadalcanal 346 524 220 352 63.6% 67.2% 0.66 0.63 502 604 298 535 59.4% 88.6% 0.83 0.56 528 590 375 430 71.0% 72.9%
Honiara City Council 637 752 459 564 72.1% 75.0% 0.85 0.81 558 739 367 535 65.8% 72.4% 0.76 0.69 643 677 459 471 71.4% 69.6%
Isabel 143 184 140 180 97.9% 97.8% 0.78 0.78 168 174 108 113 64.3% 64.9% 0.97 0.96 182 165 116 115 63.7% 69.7%
Makira and Ulawa 199 254 122 185 61.3% 72.8% 0.78 0.66 180 293 111 186 61.7% 63.5% 0.61 0.60 242 307 145 176 59.9% 57.3%
Malaita 526 693 364 508 69.2% 73.3% 0.76 0.72 587 782 319 482 54.3% 61.6% 0.75 0.66 641 778 380 529 59.3% 68.0%
Rennel and Bellona 25 20 25 18 100.0% 90.0% 1.25 1.39 16 21 16 21 100.0% 100.0% 0.76 0.76 17 18 16 17 94.1% 94.4%
Temotu 117 114 81 86 69.2% 75.4% 1.03 0.94 94 118 61 97 64.9% 82.2% 0.80 0.63 126 156 89 121 70.6% 77.6%
Western Province 498 487 312 329 62.7% 67.6% 1.02 0.95 511 483 283 283 55.4% 58.6% 1.06 1.00 516 546 318 371 61.6% 67.9%
SI Total by gender 2725 3278 1876 2421 68.8% 73.9% 0.90 0.85 2842 3477 1672 2388 58.8% 68.7% 0.82 0.74 3150 3542 2072 2459 68.9% 72.7%
SIG Total 6003 4297 71.4% 4531 70.8%6692
Total
enrolled
Total
placed Transistion rate
Total
enrolled
Total
placed Transistion rate
Total
enrolled
Total
placed Transition rate
2009 2010 2011
6319 4060 63.8%
Source: ATLAS, NESU.
5.7. Total candidate enrolled, placed to higher level (transitioned) with the GPI enrolled and placed for SISC by Province, 2009-201
GPI
enrolled
GPI
Placed
GPI
enrolled
GPI
Placed
GPI
enrolled
GPI
Placed
F M F M F M F M F M F M F M F M F M F M
Central 44 49 15 18 34.1% 36.7% 0.90 0.83 49 44 10 8 20.4% 18.2% 1.11 1.25 47 64 6 12 12.8% 18.8% 0.73 0.50
Choisuel 23 34 3 8 13.0% 23.5% 0.68 0.38 45 36 3 4 6.7% 11.1% 1.25 0.75 32 36 4 2 12.5% 5.6% 0.89 2.00
Guadalcanal 203 234 85 134 41.9% 57.3% 0.87 0.63 259 364 115 190 44.4% 52.2% 0.71 0.61 297 422 153 234 51.5% 55.5% 0.70 0.65
Honiara City Council 530 729 228 362 43.0% 49.7% 0.73 0.63 465 649 205 249 44.1% 38.4% 0.72 0.82 527 727 244 321 46.3% 44.2% 0.72 0.76
Isabel 101 113 46 66 45.5% 58.4% 0.89 0.70 115 133 24 36 20.9% 27.1% 0.86 0.67 132 141 24 36 18.2% 25.5% 0.94 0.67
Makira and Ulawa 98 156 43 85 43.9% 54.5% 0.63 0.51 130 166 38 60 29.2% 36.1% 0.78 0.63 123 208 45 86 36.6% 41.3% 0.59 0.52
Malaita 185 200 65 99 35.1% 49.5% 0.93 0.66 166 258 64 117 38.6% 45.3% 0.64 0.55 237 324 74 119 31.2% 36.7% 0.73 0.62
Rennel and Bellona 4 6 1 1 25.0% 16.7% 0.67 1.00 8 13 2 2 25.0% 15.4% 0.62 1.00 11 9 3 2 27.3% 22.2% 1.22 1.50
Temotu 47 50 13 20 27.7% 40.0% 0.94 0.65 48 59 11 21 22.9% 35.6% 0.81 0.52 55 64 13 18 23.6% 28.1% 0.86 0.72
Western Province 235 240 95 117 40.4% 48.8% 0.98 0.81 256 294 66 93 25.8% 31.6% 0.87 0.71 321 312 77 96 24.0% 30.8% 1.03 0.80
SI Total by gender 1470 1811 594 910 40.4% 50.2% 0.82 0.68 1541 2016 538 780 34.9% 38.7% 0.84 0.75 1782 2307 643 926 28.4% 30.9% 0.84 0.88
SI Total 3281 1504 45.3% 3557 1318 36.8%
Transistion rate
29.6%
Total
enrolled
Total
placedTransition rateTransition rate
Total
enrolled
Total
placed
Total
enrolled
Total
placed
2010 20112009
Source: ATLAS, NESU.
5.8. Total candidate enrolled, placed to higher level (transitioned) with the GPI enrolled and placed for PSSC by Province, 2009-2011
GPI
enrolled
GPI
Placed
GPI
enrolled
GPI
Placed
GPI
enrolled
GPI
Placed
F M F M F M F M F M F M F M F M F M F M F M F M
Central 0 0 0 0 0.0% 0.0% 0.00 0.00 0 0 0 0 0.0% 0.0% 0.00 0.00 26 21 2 4 7.7% 19.0% 1.24 0.50
Choisuel 2 5 0 0 0.0% 0.0% 0.67 0.00 2 3 0 1 0.0% 33.3% 0.67 0.00 12 12 0 0 0.0% 0.0% 1.00 0.00
Guadalcanal 31 35 1 0 3.2% 0.0% 0.46 0.85 42 92 35 41 83.3% 44.6% 0.46 0.85 109 116 34 58 31.2% 50.0% 0.94 0.59
Honiara City Council 370 655 88 133 23.8% 20.3% 0.64 0.50 395 621 66 131 16.7% 21.1% 0.64 0.50 371 627 85 127 22.9% 20.3% 0.59 0.67
Isabel 19 38 3 14 15.8% 36.8% 0.50 0.55 26 52 6 11 23.1% 21.2% 0.50 0.55 20 39 2 7 10.0% 17.9% 0.51 0.29
Makira and Ulawa 50 79 9 15 18.0% 19.0% 0.73 0.72 65 89 21 29 32.3% 32.6% 0.73 0.72 52 88 15 28 28.8% 31.8% 0.59 0.54
Malaita 46 66 17 26 37.0% 39.4% 0.50 0.68 55 110 13 19 23.6% 17.3% 0.50 0.68 68 79 16 28 23.5% 35.4% 0.86 0.57
Rennel and Bellona 0 0 0 0 0.0% 0.0% 0.00 0.00 0 0 0 0 0.0% 0.0% 0.00 0.00 0 0 0 0 0.0% 0.0% 0.00 0.00
Temotu 0 0 0 0 0.0% 0.0% 0.75 0.00 12 16 0 0 0.0% 0.0% 0.75 0.00 10 18 2 2 20.0% 11.1% 0.56 1.00
Western Province 81 110 10 19 12.3% 17.3% 0.59 0.68 95 162 15 22 15.8% 13.6% 0.59 0.68 98 144 14 31 14.3% 21.5% 0.68 0.45
SI Total by gender 599 988 128 207 21.4% 21.0% 0.48 0.40 692 1145 156 254 22.5% 22.2% 0.48 0.40 766 1144 170 285 15.8% 20.7% 0.70 0.46
SI Total 1910 455 18.3%22.4%1837 410
Total
enrolled
Total
placed Transistion rate
Total
enrolled
Total
placed Transitiont rate
Total
placed Transition rate
Total
enrolled
2009 2010 2011
1837 410 21.2%
Source: ATLAS, NESU

98 Solomon Islands
Annex six: Human Resources Development data tables
6.1. Number of vacancies for teachers approved by TSC for Education Authorities, 2008-2010
2009 2010 2011
Central 34 0 14
Choisuel 87 59 48
Christian fellowship Church 18 1 2
Church of Melanesia 47 6 16
Church of the Living Word 3 3 0
Guadalcanal 134 21 16
Honiara City Council 56 7 6
Isabel 37 11 1
MEHRD-KGVI and Waimapuru NSS 10 7 3
Makira and Ulawa 50 7 22
Malaita 229 26 26
Private School 24 6 16
Rennel and Bellona 3 0 4
Roman Catholic Church 17 1 6
Seventh Day Adventist Church 126 32 68
South Seas Evangelical Church 34 8 16
Temotu 36 1 0
United Church 63 58 27
Western 24 17 9
SI Total 1032 271 300
Source: Teacher master file, TSD

99
6.2: Required number number of teacher establishment approved for education authorities by TSC, 2008-2012.
2009 2010 2011
Central 426 455 482
Choisuel 376 388 399
Christian fellowship Church 125 131 145
Church of Melanesia 239 260 286
Church of the Living Word 21 30 31
Guadalcanal 936 962 984
Honiara City Council 483 520 569
Isabel 361 375 399
MEHRD-KGVI and Waimapuru NSS 73 71 66
Makira and Ulawa 561 590 708
Malaita 1762 1773 1967
Private School 113 135 261
Rennel and Bellona 53 54 66
Roman Catholic Church 150 114 121
Seventh Day Adventist Church 646 648 735
South Seas Evangelical Church 327 227 352
Temotu 380 413 410
United Church 548 585 559
Western 253 281 300
SI Total 7833 8012 8840 Source: Teacher master file, TSD
6.3: Number of Education Staff by Province, 2008-2010.
Central 4 7 4
Choisuel 6 6 6
Guadalcanal 7 7 8
Honiara City Council 6 6 6
Isabel 6 6 8
Makira and Ulawa 6 6 7
Malaita 14 14 16
Rennel Belona 4 4 4
Temotu 5 5 6
Western 9 9 10
SI Total 67 70 75
2009 2010 2011
Source: HRD
6.4: Number of vacancies for other education staff by province requested by MEHRD, 2008-2012.
Central 4 3 2
Choisuel 3 2 1
Guadalcanal 3 3 2
Honiara City Council 1 2 0
Isabel 3 1 3
Makira and Ulawa 2 2 1
Malaita 3 3 2
Rennel Belona 0 0 0
Temotu 3 2 0
Western 3 3 0
SI Total 25 21 11
2009 2010 2011

100 Solomon Islands
Source: HRD
6.5: Number of Vacancies for MEHRD officers requested by MEHRD, 2008-2012.
Head Quarter Adminsitration 1 1 0
Administration or support services 0 2 1
Accounts 0 2 0
Professional and Technical services 2 0 0
Support Service 0 0 0
Secretariate 0 1 0
Teacher training and development division 0 0 1
Secondary division 1 5 0
Primary Division 0 0 0
Curriculum Development Centre (CDC) 8 0 4
National Examinations and Standard Unit 2 1 1
Education Inspection and Monitoring Unit 0 2 0
Teaching Service Unit 0 2 0
Planning Cordination and Research Unit 1 3 0
National Training Unit 2 0 2
National Library Service 4 0 1
Technical Vocational, Education and Training 1 0 0
SI Total 22 19 10
2009 2010 2011
Source: HRD division
6.6: Number of Teachers on In-service supernumerary training 2009-2012.

101
Central 1 9 11
Choisuel 1 7 8
CFC 0 2 2
COM 3 10 10
COLW 0 0 1
Guadalcanal 5 7 20
HCC 9 16 16
Isabel 1 9 9
MEHRD 0 0 0
M/Ulawa 1 4 15
Malaita 10 35 39
Private Schools 1 0 4
Rennel and Bellona 1 1 2
RCC 1 7 7
SDA 3 12 12
SSEC 2 7 8
Temotu 1 8 8
UC 0 2 7
Western 2 6 8
SI Total 42 142 187
2009 2010 2011
Source: TTD Division
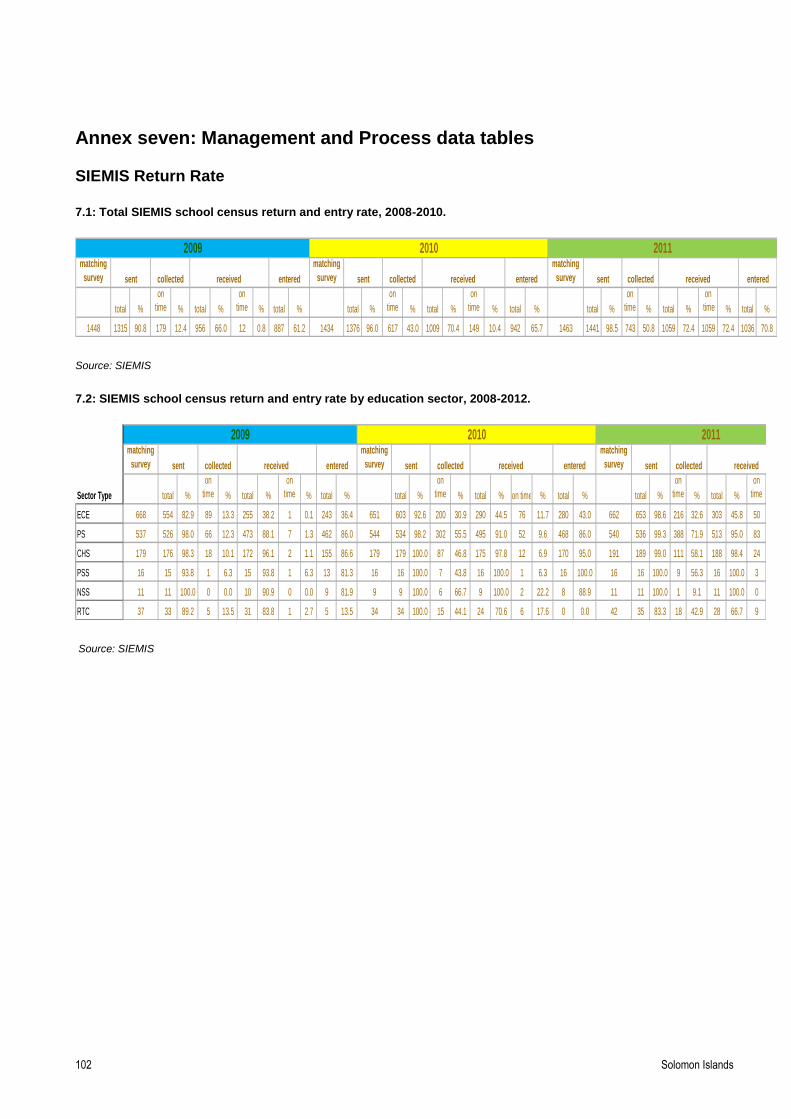
102 Solomon Islands
Annex seven: Management and Process data tables SIEMIS Return Rate 7.1: Total SIEMIS school census return and entry rate, 2008-2010.
matching
survey
matching
survey
matching
survey
total %
on
time % total %
on
time % total % total %
on
time % total %
on
time % total % total %
on
time % total %
on
time % total %
1448 1315 90.8 179 12.4 956 66.0 12 0.8 887 61.2 1434 1376 96.0 617 43.0 1009 70.4 149 10.4 942 65.7 1463 1441 98.5 743 50.8 1059 72.4 1059 72.4 1036 70.8
entered sent collected received entered
2009 2010 2011
sent collected received entered sent collected received
Source: SIEMIS
7.2: SIEMIS school census return and entry rate by education sector, 2008-2012.
matching
survey
matching
survey
matching
survey
Sector Type total %
on
time % total %
on
time % total % total %
on
time % total % on time % total % total %
on
time % total %
on
time
ECE 668 554 82.9 89 13.3 255 38.2 1 0.1 243 36.4 651 603 92.6 200 30.9 290 44.5 76 11.7 280 43.0 662 653 98.6 216 32.6 303 45.8 50
PS 537 526 98.0 66 12.3 473 88.1 7 1.3 462 86.0 544 534 98.2 302 55.5 495 91.0 52 9.6 468 86.0 540 536 99.3 388 71.9 513 95.0 83
CHS 179 176 98.3 18 10.1 172 96.1 2 1.1 155 86.6 179 179 100.0 87 46.8 175 97.8 12 6.9 170 95.0 191 189 99.0 111 58.1 188 98.4 24
PSS 16 15 93.8 1 6.3 15 93.8 1 6.3 13 81.3 16 16 100.0 7 43.8 16 100.0 1 6.3 16 100.0 16 16 100.0 9 56.3 16 100.0 3
NSS 11 11 100.0 0 0.0 10 90.9 0 0.0 9 81.9 9 9 100.0 6 66.7 9 100.0 2 22.2 8 88.9 11 11 100.0 1 9.1 11 100.0 0
RTC 37 33 89.2 5 13.5 31 83.8 1 2.7 5 13.5 34 34 100.0 15 44.1 24 70.6 6 17.6 0 0.0 42 35 83.3 18 42.9 28 66.7 9
received entered sent collected received sent collected received entered sent collected
2009 2010 2011
Source: SIEMIS

103
Policies Developed and Approved by Cabinet
Table 6.10: Total number of policies developed and approved by cabinet in 2006-2010.
2006 2007 2008 2009 2010
Policies developed 1 2 4 4 5
Policies approved 1 0 5 3 3
Policies
Teacher Service
Handbook
Teacher Training and
Development, Early
Childhood
School grants, grants to EA's,
Book distribution, 2 policies of
2007
National Curriculum
Statement, Tertiary
education, Basic Education,
FFBE
Learners Assessment, DEFL,
Language policy, ECE-framework
and National Curriculum
Statement, Review TSHB
Source: Head Quarter/Administration

104 Solomon Islands
Annex Eight: Performance Assessment Framework
Indicators Targets for 2015 Minimum
standards:
Definition and Meaning
I. Access
1
Gross Intake rate (GIR) The total number of new entrants in the first grade primary as a percenatge of all children eligible for
admission at the offcial or statutory age. For the Solomon Islands the statutory age for admission in
primary is 7 years. Only the new entrants are counted excluding the repeaters.
2
Age-Specific Gross in-take
rate (ASGIR)
Age-specific in-take rate
(ASIR)
The ASIR measures the number of new entrants having a given age as a percentage of the total
number of children of this age in the population. It gives a clearer picture of different age groups'access
to the first education level.
It is a special case of the age-specific gross in-take rate. This is the in-take rate for children of the
official age of admission which in the Solomon Islands case is 7 years. It is the number of new entrants
having the official age as a percentage of the total number of children of that age in the popuplation.
3
Gross enrolment rate
(GER)
105% for ECE and
PE
Total enrolment in a specific level of education, regardless of age, expressed as a percentage
of the population in the official age group corresponding to this level of education. For the
tertiary level, the population used is that of the five-year age group following on from the
secondary school leaving age.The GER can exceed 100% due to early or late entry and/or
grade repetition.
4
Net enrolment rate
(NER)
100% for boys and
girls for basic
Education and 40%
for Senior SE
Enrolment of the official age group for a given level of education, expressed as a percentage of
the population in that age group.
5
Age- Specific enrolment
rate (ASER)
The ASER is not assiciated with a particular education level as defined in the NER and GER. It
is a ratio that gives the percentage of young people a given age group who are enrolled in the
education system, irrespective of the level. The difference between the ratio obtained and
100% indicates the percentage of young people in a given age group who are recieving no
education in any form.
MEHRD-Performance Assessment Framework (PAF)
Measuring Partcipation in the Education Sector
Demand -Side Indicators
Measuring Access to the Education Sector

105
Indicators Targets for 2015 Minimum standards:
II Infrastructure6 Nr. of kindy’s, schools, RTC’s, tertiary
institutions
Sufficient schools to cater for a 100% net
enrolment rate for boys and girls for basic
Education and for 40% net enrolment rate for
Senior SE.
School Site - The space provided for all purposes other than school
facilities should be at least equal 3 times the total of the space
occupied by the school facilities of all kinds. For example:
Total area of school facilities: 650m2:
Minimum additional area for the School Site: 650m2 x 3 = 1,950m2
If Agriculture is taught an additional 10m2 of arable land (school
garden) per pupil is required
7 Nr. of classrooms Sufficient schools to cater for a 100% net
enrolment rate for boys and girls for basic
Education and for 40% net enrolment rate for
Senior SE on the basis that the maximum
classroom occupation is for ECE = 15 children,
PE = 35 pupils, SE = 40 pupils and TVET = 25
students.
Exampel PE: 35 pupils x 1.2 m2 = 42 m2; if the width of the
classroom intended to be build is 5.50 m then add 2 m x 5.50 m = 11
m2 + 42 m2 = 53 m2. A classroom with a width of 5.50 meters has
therefore a minimum length of:53 m2 / 5.50m = 9.64 meters.
Exampel SE: 40 pupils x 1.2 m2 = 48 m2; if the width of the
classroom intended to be build is 6.5 m then add 2 m x 6.5 m = 13
m2 + 48 m2 = 61 m2. A classroom with a width of 6.5 meters has
therefore a minimum length of: 61 m2 / 6.5 m = 9.38 meters.
Example ECE: 15 children x 1.6 m2 = 24 m2. A classroom with a
width of 4 meters has therefore a minimum length of: 24 m2 / 4.00 m
= 6.00 meters
7b Classroom/student/pupil ratio 1/15 ECE 1.6 m2 per child
1/35 PE 1.2 m2 per pupil + 2 meters space between 1st row of desks and
blackboard
1/40 SE 1.2 m2 per student + 2 meters space between 1st row of desks and
blackboard
1/25 TVET For classrooms: 1.2 m2 per student + 2 meters space between 1st
row of desks and blackboard. For workshops: 3 m2 per student e.g.
25 student workshop = 25 x 3 m2 = 75 m2
7c One-SE Schools with 120 Students need:
Specialized Classrooms 1 Multipurpose Classroom which is used for Home Economics and
Science classes (min. 2 m2 per student)
1 Workshop (min. 3 m2 per student) which is used for Technology
and Agriculture classes. Per Agriculture student a minimum of 10m2
of arable land (school garden) should to be available.
Two-Stream SE with 240 Students need:
1 Science Laboratory (min. 2 m2 per student)
1 Home Economic Classroom (min. 2 m2 per student)
1 Workshop which is used for Technology and Agriculture classes
(min. 3 m2 per student). Per agriculture student a minimum of 10m2
of arable land (school garden) should to be available.
8 Nr. of desks. 1 Chair and surface to write / work on for each
pupil
PE and SE: 1 Chair and surface to write / work
on for each pupil
Desk / pupil ratio is 1: 1 (single desk, double desk or "form")
ECE: 1 Stackable chair per child or benches for
up to 4 children plus suitable tables
ECE seat : child ratio is 1: 1.
Supply- Side Indicators
86 Desk/student/pupil ratio

106 Solomon Islands
9b Dormitory/student/pupil ratio Maximum 40 students per open room dormitorey
or maximum 10 students per subdivision
(cubicle)
4 m2 floor area per student for single bed dorms and 3 m2 floor area
for bunk bed dorms. Each student should have a locker. Beds
should allow easy affixing of mosquito nets10 Pupils Sanitation Facilities ALL schools fulfil the minimum standards At Day schools: ECE / PE / SE / TVET
ALL schools fulfil the minimum standards Female Students: 1 : 40
ALL schools fulfil the minimum standards Male Students: 1 : 60
ALL schools fulfil the minimum standards 1 Urinal for every 50 Male Students
ALL schools fulfil the minimum standards Minimum 2 Hand Basins (male/female) per School
ALL schools fulfil the minimum standards 1 hand basin for every 60 Students
ALL schools fulfil the minimum standards At Boarding School: PE/SE/TVET
ALL schools fulfil the minimum standards Female Students: 1 : 25
ALL schools fulfil the minimum standards Male Students: 1 : 35
ALL schools fulfil the minimum standards 1 Urinal for every 50 Male Students
ALL schools fulfil the minimum standards Shower Ratio: 1: 25
ALL schools fulfil the minimum standards Minimum 2 Hand Basins (male/female) per School
ALL schools fulfil the minimum standards 1 hand basin for every 35 Students10b Toilet/student/pupil ratio 1/40 per female and 1/60 male students in non-
boarding11 Computer ratio per school 1 per school (and it works) 12 Nr. of textbooks per subject /per child/student 1 textbook “set” per subject per student
13 Nr. of schools with access to safe and clean
water supply
100% Minimum drinkable water supply for Day Students: 3 litres / day. If
water tanks are the only water source then the "Minimum Water
Tank Storage Capacity" is : 3 litres of drinkable Water per pupil per
day for 30 days. E.g. A day school with a total enrolment of 300
students needs: 300 students x 3 litres / student = 900 litres x 30
days = 27,000 litres = 6,000 Gal (6 x 1,000 Gallon Tanks)
Minimum drinkable water supply for Boarding Students: 10 litres /
day. If water tanks are the only source then the "Minimum Water
Tank Storage Capacity" is : 10 litres of drinkable Water per pupil per
day for 30 days. E.g. A boarding school with a total enrolment of 300
students and reliable but, not drinkable water supply needs the
following drinking water storage capacity: 300 students x 10
litres/student = 3,000 litres/day x 30 days = 90,000 litres = 20,000
Gal (10 x 2,000 Gallon Tanks)
13b Percentage of schools with access to safe,
clean water supply
Water harvesting / supply systems in place
14 Nr. of teacher houses/accommodation
provided by province or community
The teachers posted outside of their home
village / town have appropriate accomodation.
Standard 2-bed room house with toilet, kitchen and access to water
for married staff. Bed room and shared facilities for single staff.
14b Percentage of teachers being provided
houses/accommodation15 Nr. of libraries/no. of resources rooms (ECE) 100 % of all ECE, PE, SE and TVET have a
libray or resources room (ECE)
Library / or resources room in a secure and water tight classroom or
in a separate room as part of an administration building / classroom
or as separate stand alone facility depending on the size of the
school
16 Percentage of schools with libraries17 Nr. of storage ECE, PS, SE and TVET have a storage Storage room in a secure and water tight classroom or in a separate
room as part of an administration building / classroom or as separate
stand alone building depending on the size of the school
17b Percentage of schools with storage

107
III. Quality18 Nr. of certified teachers, trainers, instructors Graduated with teaching subject and a qualification in education
18b Percentage of certified (trained) teachers,
trainers, instructors
improved by 40% per sector
19 Nr. of certified head teachers, principals,
directors/heads
Qualified in Education Administration and a teaching subject
19b Percentage of qualified head teachers,
principals, directors/heads
100%
20 Attendance rate of teachers, principals, instructors 100% Attend to school duties and present at school during offical hoursat all
times.
21 Attendance rate of head teachers, principals,
directors/heads
100% Attend to school duties and present at school during offical hoursat all
times.
1/15 ECE
1/35 PE
1/40 SE
1/25 TVET
22 Pupil/student/teacher-instructor ratio
IV. Financial Management23 Total recurrent budget for education sector (in
SBD)23b Share of recurrent education budget within
total SIG recurrent budget (in %)
22%
24 Total development budget for education sector
(in SBD)24b Share of education development budget within
total SIG development budget (in %)
25 Total recurrent budget per education sub
sector (In SBD)
% Basic Education
% Secondary Senior Education
% TVET
% Higher Education26 Total development budget per education sub
sector (in SBD)
% Basic Education
% Secondary Senior Education
% TVET
% Higher Education27 Unit estimates per different sub-sector level
27b Unit costs/expenditures per different sub-sector
level
25b Share of sub sector recurrent budget within
total recurrent education budget (in %)
26b Share of sub sector development budget within
total SIG education development budget (%)

108 Solomon Islands
28 Total recurrent expenditures for education
sector (in SBD)28b Total recurrent education expenditures
compared to SIG total recurrent budget (in %)
29 Total development expenditures in education
(in SBD)29b Total development education expenditures
compared to SIG total development budget (in
%)
30 Total recurrent expenditures per education sub
sector (In SBD)
% Basic Education
% Secondary Senior Education
% TVET
% Higher Education31 Total development expenditures per education
sub sector
(in SBD)
% Basic Education
% Secondary Senior Education
% TVET
% Higher Education31c Disbursement and retirement of school grants All school should receive their school grants on
time
All schools allocation of school grants should based on the exact
number of children enrolled at the school in the current year. All
schools should receive and retire their school grants on time as
stipulated in the school grants policy.31d Disbursement and retirement of education
authority grants
All Education Authorities should receive and retire their grants on
time as stipulated in the Education Authority grants policy.
31b Total development expenditures per education
sub sector compared to SIG sub sector
development budgets (in %)
30b Total recurrent expenditures per education
sub sector compared to SIG total education
recurrent budget (%)

109
V Human Resource Development
32 Required nr. of teachers/trainers, instructors TS handbook
33 Required nr. of other education staff GO/ LCC34 Number of vacancies for teachers, trainers,
instructors approved by TSC
“
35 Number of vacancies for other education staff
approved by Ministry of Public Service
“
36 Percentage of vacancies for
teachers/trainers/instructors
approved by TSC and filled
“
37 Percentage of vacancies for other education
staff approved
by Ministry of Public Service and filled
“
VI Process indicators 38 Policies
38b Nr. of policies developed/reviewed/finalized 3 per year Approved by NEB and Cabinet
38c Nr. of policies approved by NEB
39 Financial management 39 Quarterly recurrent expenditure reporting
produced
for all sub sectors and against account codes
in recurrent budget
4 per year
40 Quarterly development expenditure reporting
produced for
all sub sectors against account codes in
development budget
4 per year
41 MTEF developed 2009
C Organization reform and HRD 42 IOA developed 2009 for provinces
43 Organization reform plan/ HRD-plan produced Annually Semi-annual progress reports
44 Nr. of In-service training for teachers organized
45 Nr. of In-service training for PEA’s organized
46 Teachers ratio in Teacher in Training (TIT)
(compared to total nr. of teachers)
All not certified to attend to training
47 PEA-staff ratio in training (compared to total nr.
Of PEA-staff)
All PEA staff to be trained

110 Solomon Islands
D Monitoring 48 Feedback (return) rate of SIEMIS - forms per
31st of March
100% Completed forms
49 Nr. of inspectorate-visits to schools 1 visit per school per year Evaluation reports produced
50 Nr. Of EA-visits to schools 1 visit per school per year PAWP-progress reports produced bi-annually
51 Nr. Of MEHRD-inspectorate/monitoring visits to
provinces
4 per year Reports produced and distributed to provinces/EA’s
E Curriculum development 52 Syllabi developed for different subjects 100% Text Books and Tr. guides produced for all subjects and levels
F Local management of schools 53 Nr. of school committees ‘functioning* 100% (=number of schools, centres) min. 2 meetings, minutes/year produced and participation from
teachers, community members, students, annually reviewing school
development plan53b Percentage of school committees functioning
compared to total number
100% for all schools
54 Nr. of school boards functioning 100% See above
54b Percentage of school boards functioning
compared to total number
100%
Indicators Targets for 2015 Minimum
standards
Definition and Meaning
Pupil/student
Attentance Rate
1 Promotion Rate (PR) The promotion rate (PR) is the proportion of pupils (or students) who have
succesfully completed a grade and proceeded to the next grade in the
following school year.
2 Repetition Rate (RR) The repetition rate (RR) is the proportion of pupils who repeat a grade. People
who repeat a grade tend to occupy school places which otherwise could be
used to accommodate other eligible children. A high repetition rate therefore
implies a low internal efficiency in education, when a part of the resource
inputs are being used by repeaters.
Measuring the Internal Efficiency of the Education Sector
Efficiency and Output Indicators

111
3
Dropout Rate 0% for universal basic
education
The DropOut Rate (DR) is the proportion of pupils (students) who left
school without completing a given grade in a given school year. This
rate shows the extent to which pupils abandon schooling. High drop out
rates implies high input/output ratios and hence lead to low internal
efficiency in that education level.
4
Survival Rate
(completion rate)
Survival rate to Grade 5 is the estimated proportion of a cohort of pupils who
may reach Grade 6 expressed as a percenatge of pupils enrolled in the first
grade of a given cycle in a given school year. This indicator is used to show
the extent to which the school system can retain pupils in school until grade 6
when they would have acquired the basic literacy and numeracy skills. By
subtracting the rate from 100, it also indicates the proportion of pupils who
may drop out before reaching Grade 6. This indicator is therefore also used to
measure the impact of dropouts and the internal efficiency of the education
sector system.
For ECE and PE 100% Number of pupils and students who have completed their level of
education in each sub education sector out of the total progressive
100% enrolment.
For SE-jun: 100%
For SE-sen:
For TVET: 100% Number of students who have sat for the SISE and SIF3 against the
number of students enrolled for that year.
4
Pupil/Students’
attendance rate
100% for boys and girls
receive universal basic
education
Enrolment of official age group for a given level of education
expressed as a percentatge of the population in that age group.
5
Literacy Rate (LR) The literacy rate is defined as the percentage of the population who can
both read and write with understanding a short simple statement related
to everyday life. It reflects the accumulated achievment of the primary
education system and adult literacy programmes in imparting basic
literacy skills to the population, enabling them to apply such skills in
daily life and to continue learning and communicating using the written
word.5a SISTA 1 Solomon Islands Standardized Test 1 contacted in grade 4
5b SISTA 2 Solomon Islands Standardized Test 1 contacted in grade 6
3
Transition rates (TR) to be discussed The transition rate measures the number of new entrants in a given level of education
as a percenatge of those enrolled the previous year in the final grade of the
percentage level. Only the new entrants to the next education level are counted
excluding the repeaters.
100 % SISEE
80% SIF3
50% SISC Number of students who have sat for the SISC and PSSC against the
number of students enrolled for that year.
50% PSSC
Examination rates
(SISC and PSSC)
3(a)
3(b)
8
Examination rates
(SISE and SIF3)