Embed Size (px)
Citation preview

United States Department of Agriculture
SUMMARY OF PERFORMANCE AND
FINANCIAL INFORMATION
Managing for Results in Performing Its Many Vital Public Functions
FISCAL YEAR
2015
M A N A G I N G F O R R E S U L T S I N P E R F O R M I N G I T S M A N Y V I T A L P U B L I C F U N C T I O N S
U . S . D E P A R T M E N T O F A G R I C U L T U R E 3
About This Summary
The U.S. Department of Agriculture (USDA) Summary of Performance and Financial Information for Fiscal Year (FY) 2015 includes the most relevant performance and financial information in a brief, user-friendly format that is easily understood by a reader with little technical background in these areas. The goal of this summary is to increase accountability of agency heads and program managers by making the financial and performance information more transparent and accessible to Congress, the public, and other key constituencies. USDA’s plans and reports are available at https://www.performance.gov and https://www.usda.gov/performance.
Who We Are and What We Do President Abraham Lincoln founded the USDA in 1862 with the goal of providing effective leadership to the Nation on food, agriculture, natural resources, and related issues. As Americans, you are part of the USDA story, with an over 150-year tradition of excellence in public service.
Since 1862, the dedicated public servants at USDA help hundreds of millions of Americans every day. As Agriculture Secretary Thomas J. Vilsack, using a phrase to describe USDA coined by Abraham Lincoln, said, “We are the People’s Department.”
We would like you to learn more about USDA and the Agencies and Offices that touch every American, every day. More information about the Department, our history, and our leaders can be found here at www.usda.gov.

4 F I S C A L Y E A R 2 0 1 5 S U M M A R Y O F P E R F O R M A N C E A N D F I N A N C I A L I N F O R M A T I O N
Strategic Plan and Program Performance The U.S. Department of Agriculture’s (USDA) mission is to provide leadership on food, agriculture, natural resources, rural development, nutrition, and related issues based on sound public policy, the best available science, and efficient management. Through implementing our mission, the Department aspires to achieve five strategic goals as reflected in USDA’s 2014–2018 Strategic Plan:
• Assist rural communities to create prosperity so they are self-sustaining, re-populating, andeconomically thriving;
• Ensure our national forests and private working lands are conserved, restored, and mademore resilient to climate change, while enhancing our water resources;
• Help America promote agricultural production and biotechnology exports as Americaworks to increase food security;
• Ensure that all of America’s children have access to safe, nutritious, and balanced meals;and
• Create a USDA for the 21st century that is high-performing, efficient, and adaptable.
USDA has also established three Agency Priority Goals (APGs) for fiscal years (FY) 2014 and 2015 that identify near-term goals to help USDA progress toward meeting our longer term strategic goals and objectives. USDA’s APGs are as follows:
• Create new economic opportunities;
• Improve soil health; and
• Reduce foodborne illnesses.
More information and reports on the APGs and quarterly progress can be found at https://www.performance.gov/agency/department-agriculture?view=public#apg.
In FY 2015, USDA had 40 key performance indicators, as reflected in the Department’s FY 2017 Annual Performance Plan (https://www.obpa.usda.gov/perfrpt/2015usdaperfrpt2017plan.pdf ).
The following tables and discussion provide a high-level description of key focus areas for the Department that are being tracked and managed through USDA’s performance management process, in alignment with the Department’s strategic goals and objectives. The tables provide key performance indicator historical results, and includes target and actual results for the year.
Performance information and a detailed discussion of results for the Department’s FY 2015 performance goals, assessment methodologies, metrics, external reviews, and documentation of performance data is presented in the FY 2015 USDA Annual Performance Report (https://www.obpa.usda.gov/perfrpt/2015usdaperfrpt2017plan.pdf).

M A N A G I N G F O R R E S U L T S I N P E R F O R M I N G I T S M A N Y V I T A L P U B L I C F U N C T I O N S
U . S . D E P A R T M E N T O F A G R I C U L T U R E 5
Goal #1: Rural Prosperity A vibrant American economy depends on a prosperous rural America. Our four primary pillars of economic opportunity in agriculture are: (1) exports, (2) local food systems, (3) conservation and outdoor recreation, and (4) enhancing the bio-based economy. USDA is making an impact on persistent poverty, out-migration, and rural income through increases in the number of homeownership opportunities provided in rural communities and the percentage of direct and guaranteed lending to beginning farmers.
Exhibit 1: USDA Strategic Plan Goal #1: Rural Prosperity Key Performance Indicators
Fiscal Year 2011
Actual 2012
Actual 2013
Actual 2014
Actual 2015
Target 2015
Actual
Number of jobs created or saved through USDA financing of businesses
64,935 52,468 44,419 41,202 39,624 52,697
Homeownership opportunities provided
140,100 153,027 170,055 146,388 177,366 141,314
Health Facilities: Percentage of customers who are provided access to new and/or improved essential community facilities
5.2% 7.3% 5.4% 6.8% 4.5% 12%
Safety Facilities: Percentage of customers who are provided access to new and/or improved essential community facilities
4.3% 3.7% 3.4% 3.7% 3.7% 7.2%

6 F I S C A L Y E A R 2 0 1 5 S U M M A R Y O F P E R F O R M A N C E A N D F I N A N C I A L I N F O R M A T I O N
Fiscal Year 2011
Actual 2012
Actual 2013
Actual 2014
Actual 2015
Target 2015
Actual
Educational Facilities: Percentage of customers who are provided access to new and/or improved essential community facilities
3.8% 6.4% 9.3% 6.2% 4.5% 7.9%
Number of borrowers/subscribers receiving new and/or improved electric facilities (millions)
7.1 8.3 8.7 4.6 4.6 5.5
Number of borrowers/subscribers receiving new or improved telecommunications services (millions)
0.181 0.064 0.119 0.084 0.145 0.095
Number of population receiving new or improved service from agency-funded water facilities (millions)
2.9 2.5 1.8 2.2 2.2 2.4
Value of agricultural exports resulting from participation in foreign food and agricultural trade shows ($ billion)
$ 1.26 $ 1.46 $ 1.48 $ 1.50 $ 1.46 $ 1.55
Percentage of Direct and Guaranteed lending to Socially Disadvantaged Farmers (SDA)
13.10% 13.30% 13.60% 14.20% 13.90% 15%
Percentage of Direct and Guaranteed lending to Beginning Farmers (BF)
64.90% 68.80% 70% 79.20% 75.50% 85.6%
M A N A G I N G F O R R E S U L T S I N P E R F O R M I N G I T S M A N Y V I T A L P U B L I C F U N C T I O N S
U . S . D E P A R T M E N T O F A G R I C U L T U R E 7
Fiscal Year 2011
Actual 2012
Actual 2013
Actual 2014
Actual 2015
Target 2015
Actual
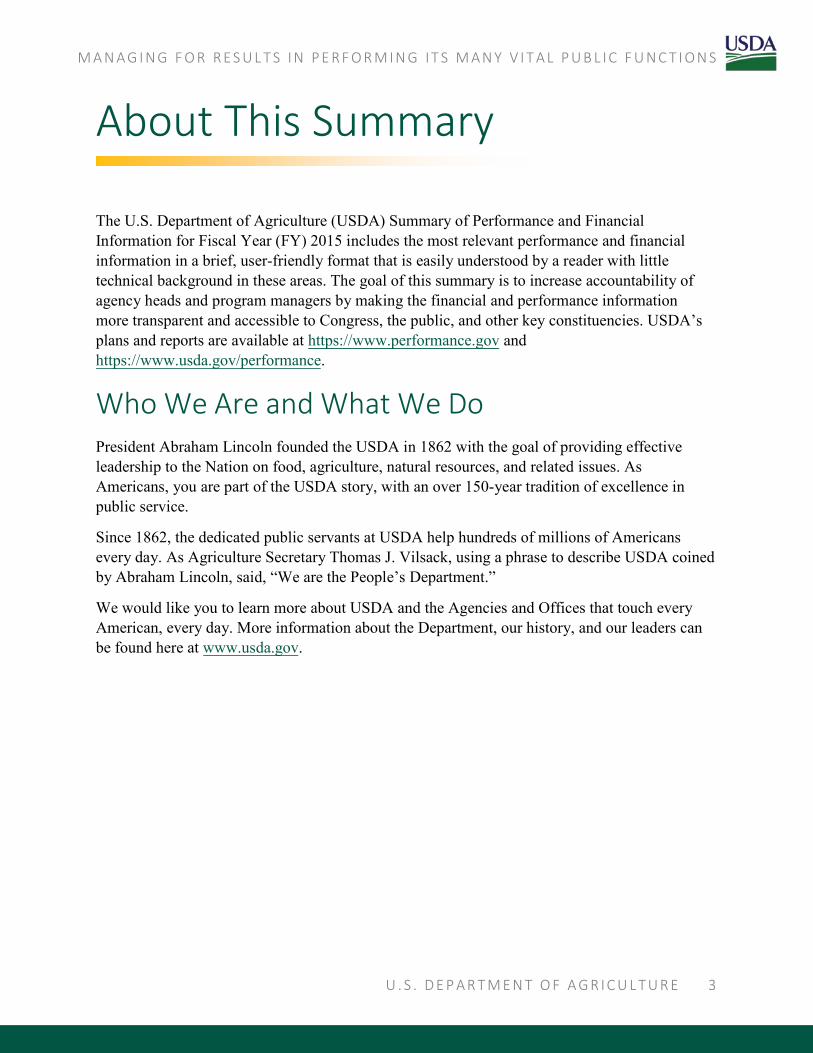
Normalized value of risk protection provided to agricultural producers through the Federal Crop Insurance Program ($ billion)
$56.30 $ 62.10 $ 66.00 $ 67.90 $ 63.00 $ 68.70
Value of trade preserved annually through USDA staff intervention leading to resolution of foreign market access issues such as U.S. export detainment, restrictive Sanitary/ Phytosanitary or Technical Barrier to Trade issues and trade regulations ( $ billion)
$ 4.10 $ 3.70 $ 3.80 $ 6.40 $ 3.90 $ 3.60
8 F I S C A L Y E A R 2 0 1 5 S U M M A R Y O F P E R F O R M A N C E A N D F I N A N C I A L I N F O R M A T I O N
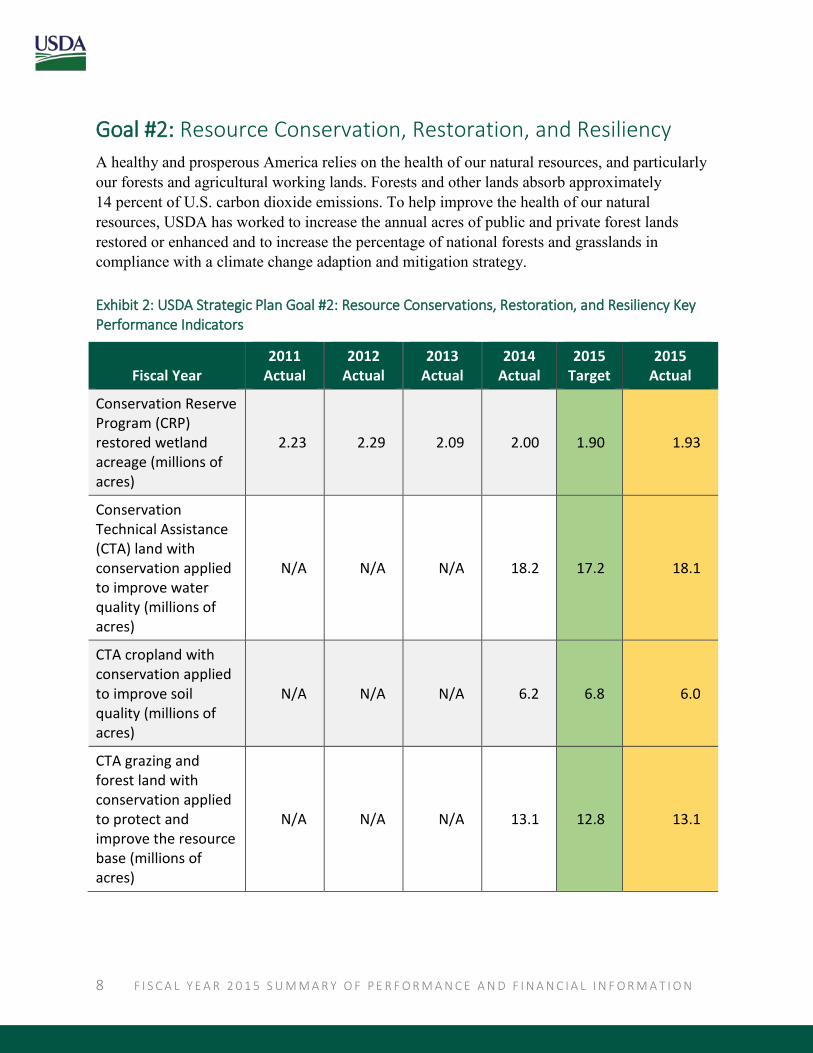
Goal #2: Resource Conservation, Restoration, and Resiliency A healthy and prosperous America relies on the health of our natural resources, and particularly our forests and agricultural working lands. Forests and other lands absorb approximately 14 percent of U.S. carbon dioxide emissions. To help improve the health of our natural resources, USDA has worked to increase the annual acres of public and private forest lands restored or enhanced and to increase the percentage of national forests and grasslands in compliance with a climate change adaption and mitigation strategy.
Exhibit 2: USDA Strategic Plan Goal #2: Resource Conservations, Restoration, and Resiliency Key Performance Indicators
Fiscal Year 2011
Actual 2012
Actual 2013
Actual 2014
Actual 2015
Target 2015
Actual
Conservation Reserve Program (CRP) restored wetland acreage (millions of acres)
2.23 2.29 2.09 2.00 1.90 1.93
Conservation Technical Assistance (CTA) land with conservation applied to improve water quality (millions of acres)
N/A N/A N/A 18.2 17.2 18.1
CTA cropland with conservation applied to improve soil quality (millions of acres)
N/A N/A N/A 6.2 6.8 6.0
CTA grazing and forest land with conservation applied to protect and improve the resource base (millions of acres)
N/A N/A N/A 13.1 12.8 13.1

M A N A G I N G F O R R E S U L T S I N P E R F O R M I N G I T S M A N Y V I T A L P U B L I C F U N C T I O N S
U . S . D E P A R T M E N T O F A G R I C U L T U R E 9
Fiscal Year 2011
Actual 2012
Actual 2013
Actual 2014
Actual 2015
Target 2015
Actual
Environmental Quality Incentives Program (EQIP) land with conservation applied to improve water quality (millions of acres)
N/A N/A N/A 12.3 12.0 12.7
EQIP cropland with conservation applied to improve soil quality (millions of acres)
N/A N/A N/A 3.1 3.4 3.0
EQIP grazing land and forest land with conservation applied to protect and improve the resource base (millions of acres)
N/A N/A N/A 14.8 13.7 13.9
EQIP non-Federal land with conservation applied to improve fish and wildlife habitat quality (millions of acres)
N/A N/A N/A 1.4 1.4 1.4
Annual acres of public and private forest lands restored or enhanced (millions of acres)
2.624 2.570 2.533 2.906 2.900 3.100
Volume of timber sold (billion board feet)
2.533 2.644 2.610 2.831 2.900 2.867

1 0 F I S C A L Y E A R 2 0 1 5 S U M M A R Y O F P E R F O R M A N C E A N D F I N A N C I A L I N F O R M A T I O N
Fiscal Year 2011
Actual 2012
Actual 2013
Actual 2014
Actual 2015
Target 2015
Actual
Percentage of National Forests and Grasslands in compliance with a climate change adaptation and mitigation strategy
16% 36% 49% 64% 100% 89%
Percentage of National Forests and Grassland watersheds in properly (class 1 watersheds) functioning condition
52% 52% 52% 52% 52% 52%
Acres of Wildland Urban Interface hazardous fuels treated to reduce the risk of catastrophic wildfire (millions of acres)
1.611 1.867 1.737 1.725 1.725 1.577

M A N A G I N G F O R R E S U L T S I N P E R F O R M I N G I T S M A N Y V I T A L P U B L I C F U N C T I O N S
U . S . D E P A R T M E N T O F A G R I C U L T U R E 1 1
Goal #3: Increased Exports and Global Food Security Working with other Federal partners, USDA is working toward reducing global food insecurity and increasing agriculture-led economic growth in developing countries. The Department continues to seek new trade opportunities for American agricultural producers and is also striving to bring products with new and emerging technologies to the worldwide marketplace. In addition, USDA is focused on improving efforts to reduce food insecurity across the world by providing technical assistance to people in food-insecure countries.
Exhibit 3: USDA Strategic Plan Goal #3: Increased Exports and Global Food Security
Fiscal Year 2011
Actual 2012
Actual 2013
Actual 2014
Actual 2015
Target 2015
Actual
Cumulative number of biotechnology products deregulated by USDA based on scientific determinations that they do not pose a plant pest risk to agriculture
87 93 102 109 114 117
Number of individuals in food insecure countries assisted by USDA technical assistance
NA 5,909,421 7,417,454 6,606,763 4,961,503 5,034,591
1 2 F I S C A L Y E A R 2 0 1 5 S U M M A R Y O F P E R F O R M A N C E A N D F I N A N C I A L I N F O R M A T I O N
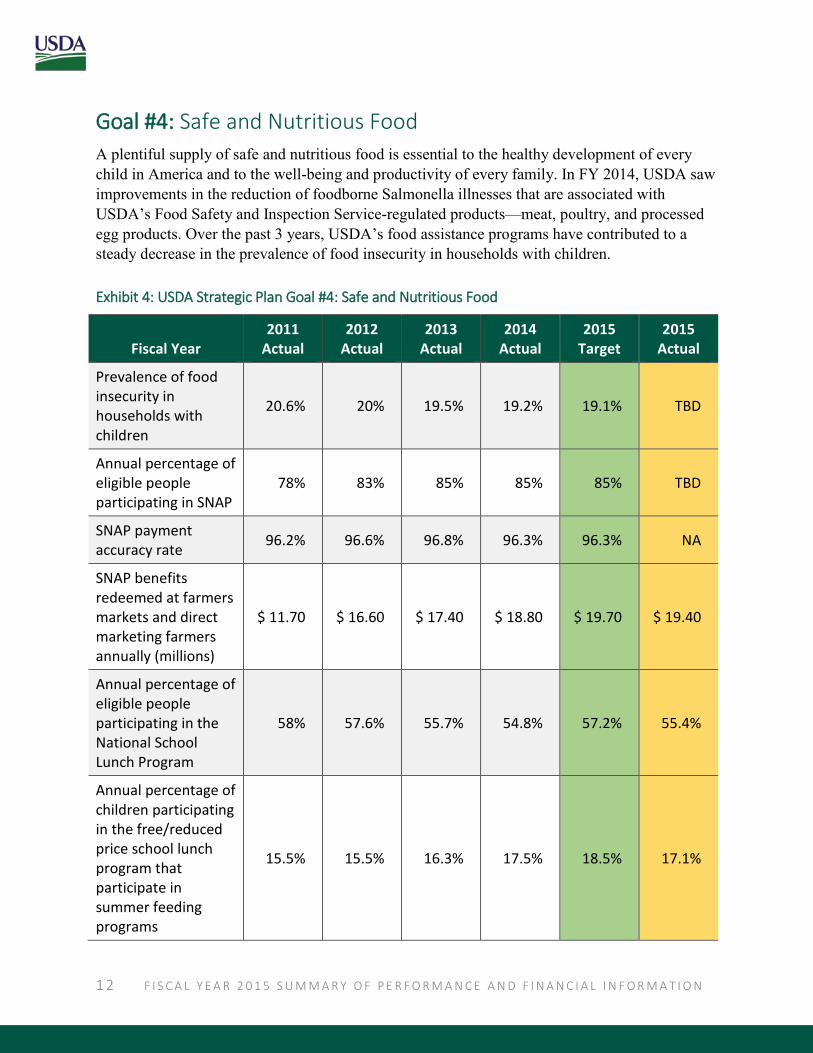
Goal #4: Safe and Nutritious Food A plentiful supply of safe and nutritious food is essential to the healthy development of every child in America and to the well-being and productivity of every family. In FY 2014, USDA saw improvements in the reduction of foodborne Salmonella illnesses that are associated with USDA’s Food Safety and Inspection Service-regulated products—meat, poultry, and processed egg products. Over the past 3 years, USDA’s food assistance programs have contributed to a steady decrease in the prevalence of food insecurity in households with children.
Exhibit 4: USDA Strategic Plan Goal #4: Safe and Nutritious Food
Fiscal Year 2011
Actual 2012
Actual 2013
Actual 2014
Actual 2015
Target 2015
Actual
Prevalence of food insecurity in households with children
20.6% 20% 19.5% 19.2% 19.1% TBD
Annual percentage of eligible people participating in SNAP
78% 83% 85% 85% 85% TBD
SNAP payment accuracy rate 96.2% 96.6% 96.8% 96.3% 96.3% NA
SNAP benefits redeemed at farmers markets and direct marketing farmers annually (millions)
$ 11.70 $ 16.60 $ 17.40 $ 18.80 $ 19.70 $ 19.40
Annual percentage of eligible people participating in the National School Lunch Program
58% 57.6% 55.7% 54.8% 57.2% 55.4%
Annual percentage of children participating in the free/reduced price school lunch program that participate in summer feeding programs
15.5% 15.5% 16.3% 17.5% 18.5% 17.1%
M A N A G I N G F O R R E S U L T S I N P E R F O R M I N G I T S M A N Y V I T A L P U B L I C F U N C T I O N S
U . S . D E P A R T M E N T O F A G R I C U L T U R E 1 3
Fiscal Year 2011
Actual 2012
Actual 2013
Actual 2014
Actual 2015
Target 2015
Actual
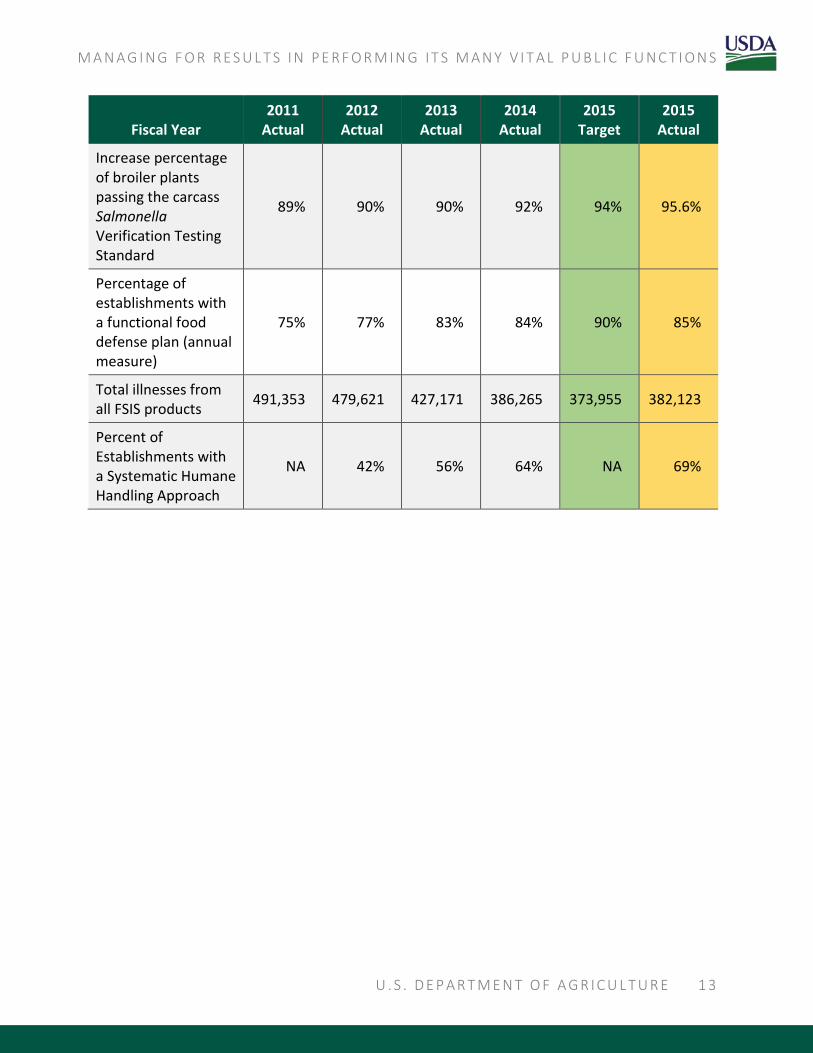
Increase percentage of broiler plants passing the carcass Salmonella Verification Testing Standard
89% 90% 90% 92% 94% 95.6%
Percentage of establishments with a functional food defense plan (annual measure)
75% 77% 83% 84% 90% 85%
Total illnesses from all FSIS products 491,353 479,621 427,171 386,265 373,955 382,123
Percent of Establishments with a Systematic Humane Handling Approach
NA 42% 56% 64% NA 69%

1 4 F I S C A L Y E A R 2 0 1 5 S U M M A R Y O F P E R F O R M A N C E A N D F I N A N C I A L I N F O R M A T I O N
Goal #5: Departmental Modernization Through its Blueprint for Stronger Service, USDA is building and implementing a modern workforce, and exercising good stewardship of the resources entrusted to the Department. During FY 2014, USDA implemented policies to achieve a more efficient use of funds through decreases in the amount of leased office and warehouse space controlled by USDA and to build a more effective workforce through process improvements and increased use of telework.
Exhibit 5: USDA Strategic Plan Goal #5: Departmental Modernization
Fiscal Year 2011
Actual 2012
Actual 2013
Actual 2014
Actual 2015
Target 2015
Actual
Number of employees participating in core telework
8,756 7,926 9,723 10,455 12,000 11,798
Amount of leased office and warehouse space controlled by USDA (millions of square feet)
26.3 26 25.6 24.9 24.0 23.9

M A N A G I N G F O R R E S U L T S I N P E R F O R M I N G I T S M A N Y V I T A L P U B L I C F U N C T I O N S
U . S . D E P A R T M E N T O F A G R I C U L T U R E 1 5
Financial Information The FY 2015 Agency Financial Report (AFR) includes USDA’s audited financial statements and the Independent Auditor’s Report. In addition to the basic financial statements, the AFR includes management’s discussion and analysis, required supplementary information, and other information, such as the Schedule of Spending.
The following table presents a snapshot of USDA’s results of operations and financial position. This information is based on the same underlying data as the financial statements presented in the AFR.
Exhibit 6: A Snapshot of USDA’s Results of Operations and Financial Position (In Millions)
Item Description FY 2015 FY 2014
Gross Costs $152,838 $155,456
Less: Earned Revenue 10,331 10,563 Net Cost of Operations $142,507 $144,893
Assets: Fund Balance with Treasury $113,316 $101,717 Direct Loan and Loan Guarantees, Net 98,894 101,243
5,045 4,881 Total Assets $217,255 $207,841
Liabilities: Debt $114,232 $114,102 Other 46,626 45,233
Total Liabilities $160,858 $159,335
Net Position (Assets Minus Liabilities) $56,397 $48,506
Budgetary Resources $241,704 $234,595
Outlays, Net $137,697 $144,163
Other

1 6 F I S C A L Y E A R 2 0 1 5 S U M M A R Y O F P E R F O R M A N C E A N D F I N A N C I A L I N F O R M A T I O N
Significant Management Challenges The Reports Consolidation Act of 2000 requires the USDA Office of Inspector General (OIG) to report annually on the most serious management challenges facing the Department.
On August 25, 2015, the OIG reported the following major management challenges. A detailed description of the challenges and assessment of the Department’s progress in addressing these challenges may be found in the FY 2015 AFR.
• USDA Needs to Improve Oversight and Accountability for its Programs.
• Information Technology Security Needs Continuing Improvement.
• USDA Needs to Strengthen Program Performance and Performance Measures.
• USDA Needs to Strengthen Controls over Improper Payments and Financial Management.
• USDA Needs to Improve Outreach Efforts.
• Food Safety Inspections Need Improved Controls.
• Food and Nutrition Service (FNS) Needs to Strengthen Supplemental Nutrition Assistance Program (SNAP) Management Controls.