Embed Size (px)
Citation preview

Performance and Progress Report:
UNH/NOAA Joint Hydrographic Center Final Report NOAA Ref No: NA17OG228 Progress Report NOAA Ref No: NA05NOS4001153
Report Period: 01/01/2006 – 12/31/2006
Project Title: Joint Hydrographic Center Principal Investigator: Larry A. Mayer

Performance and Progress Report UNH/NOAA Joint Hydrographic Center Progress Report NOAA Ref No: NA05NOS4001153 Final Report NOAA Ref No: NA17OG228 Report Period: 01/01/2006 – 12/31/2006 Principal Investigator: Larry A. Mayer Executive Summary: Hydrography has undergone dramatic changes over the past decade. Improved sonar and computer technology have revolutionized the types, quantity and quality of data available to create nautical charts. Until recently, water depths were measured by dropping a lead line at periodic intervals to take measurements. These data points were sent to an office where contour lines would be painstakingly sketched out. With the arrival of the first sonars, and then ever more effective multibeam sonar technologies, those offices began to receive millions, rather than tens of new data points for every hour of survey work. Instead of connecting the sparse dots of a puzzle, they were presented with a flood of data points that could inundate them, or, if processed properly, present an unprecedented complete and accurate picture of the seafloor.
One of the fundamental reasons for the establishment of the UNH/NOAA Joint Hydrographic Center was to find ways to process the massive amounts of data coming from these new sonar systems at rates commensurate with data collection; that is, to make the data ready for chart production as rapidly as the data could be collected. As we begin to achieve this goal, our attention is also turning to the wonderful opportunity to utilize this massive flow of information into products that meet a wide range of needs, such as safer navigation, marine habitat assessments, fisheries management and national security.
The NOAA-UNH Joint Hydrographic Center was founded seven years ago to address these issues and to help integrate new techniques and technologies into mainstream hydrography. In this short period of time, we have built a vibrant Center with over 60 employees and an international reputation as the place, “where the cutting edge of hydrography is now located” (Adam Kerr, Past Director of the International Hydrographic Organization in Hydro International).
Since our inception, we have developed new, automated and statistically robust approaches to multibeam sonar data processing. These efforts have come to fruition. Our automated processing algorithm (CUBE) and our new database approach (The Navigation Surface), have, after careful verification and evaluation, been accepted by NOAA and NAVO as well as the UK and Danish hydrographic agencies, as part of their standard processing protocols. Almost every hydrographic software manufacturer has, or is, incorporating these approaches into their products. It is not an understatement to say that these techniques are revolutionizing the way NOAA (and soon the rest of the ocean mapping community) is doing hydrography. These techniques reduce data processing time by a factor of 30 to 70 and provide a quantification of error and uncertainty that has
JHC Performance Report 2 30 January 2007

never before been achievable in hydrographic data. The result is “gained efficiency, reduced costs, improved data quality and consistency, and the ability to put products in the hands of our customers faster.” (Capt. Roger Parsons, Director of NOAA’s Office of Coast Survey).
The acceptance of CUBE and the Navigation Surface has required a paradigm shift for the hydrographic community -- from dealing with individual soundings (reasonable in a world of lead line and single-beam sonar measurements) to the acceptance of gridded depth estimates as a starting point for hydrographic products. The research needed to support this paradigm shift has been a focus of the Center since its inception; to now see it being universally accepted is truly rewarding. It is also indicative of the role that the Center has been playing and will continue to play in establishing new directions in hydrography and ocean mapping.
Statements from senior NOAA managers and the actions of other hydrographic agencies and the industrial sector provide clear evidence that we are making a real contribution to NOAA and the international community. While we believe we have met the initial goals we set, we will certainly not stop there. Both CUBE and the Navigation Surface offer a framework upon which new innovations are being built and new efficiencies gained. Additionally, they provide a starting point for the delivery of a range of non-hydrographic mapping products that set the scene for future research efforts.
This past year we have extended the usefulness of the CUBE through the development of ways to apply this processing approach to the initial calibration tests performed for multibeam sonar systems when deployed at sea (the “patch test”). When CUBE has been applied to patch tests, the overall uncertainty of the survey data have been reduced by at least 5 percent. In another effort to improve survey accuracy we have developed software that takes advantage of a new timing protocol (IEEE-1588) and allows the components of a sonar system to be synchronized within an absolute time accuracy of approximately 100 nanoseconds. This level of timing will greatly enhance the accuracy of hydrographic surveys and is already being implemented by our industrial partners.
Inherent in the Navigation Surface concept is our long-held belief that the “products” of hydrographic data processing can also serve a variety of applications and constituencies beyond hydrography. Another long-held tenet of the Center is that the standard navigation charts produced by the world’s hydrographic authorities do not do justice to the information content of high-resolution multibeam and sidescan sonar data. We also believe that the mode of delivery of these products will inevitably be electronic — thus our initiation of “The Electronic Chart of the Future” project. This effort draws upon our visualization team, our signal and image processors, and our hydrographers and mariners. In doing so, it epitomizes the strength of our Center –- the ability to bring together talented people with a range of skills to focus on problems that are important to NOAA and the nation. The Electronic Chart of the Future project is in its early stages with prototypes being built and tested. An early accomplishment has been the demonstration of the ability to send chart-relevant data via the Automated Information System (AIS)
JHC Performance Report 3 30 January 2007

carried aboard many vessels and to display this information in a Google Earth-like environment.
Whereas much of our visualization effort has been focused on the 3-D interactive display of static features like the seafloor, this past year has seen our visualization efforts expand with the addition of dynamic systems. We are developing three-dimensional, interactive interfaces and control systems for Autonomous Underwater Vehicles (AUV’s) and Remotely Operated Vehicles (ROV’s) as well as software to visualize the behavior of marine mammals. This past year we have integrated multibeam sonar into a small AUV (FETCH) and have begun to explore the viability of collecting hydrographic-quality data from an AUV. Working with NMFS researchers, our visualization of the behavior of humpback whales (derived from motion-sensing tags on the whales) has revealed a never-before-seen consistency in heading associated with side-roles. This behavior is thought to be related to the orientation of sand waves on the seafloor and is providing new insight into feeding behavior of humpback whales. These visualizations have appeared in numerous media and have been used in hearings on the location of offshore natural-gas terminals. These new tools focus on the visualization of systems that change in both space and time, opening up a world of opportunities for studying many components of ocean systems that are important to NOAA and others. Foremost among these have been our interactive 3-D visualization of the Dec. 26 2004 Indian Ocean tsunami that clearly demonstrates the critical role that bathymetry plays in determining run up and inundation, and our efforts to display three-dimensional ocean flow fields. We have teamed up with NOAA (and other) ocean modelers to produce high-resolution visualizations of multi-level flow that can be useful for better understanding local navigation (e.g. a component of the “Chart of the Future” or global circulation and will be creating a visualization of global circulation for the Smithsonian’s new Hall of the Oceans.
One of the most exciting advances of this year has been our adaptation of a new generation of multibeam sonars to allow the real-time visualization of targets in the water column. We have demonstrated this capability in recent survey of the offshore cages of the Open Ocean Aquaculture that have allowed us to image in real time, the fish cages, the anchor lines and even fish. The implications of this capability for the management of pelagic fisheries are immense.
Another long-term theme of our research efforts has been our desire to extract information beyond depth (bathymetry) from the mapping systems used by NOAA and others. This past year we made significant progress in developing a simple-to-use tool (GeoCoder) for generating a sidescan sonar or backscatter “mosaic” -- a critical first step in analyzing the seafloor character. There has been tremendous interest in this software throughout NOAA and from our industrial partners and we have been offering short training workshops in its use. A recent email from one of the attendees (from the Biogeography Team of NOAA’s CCMA) said: “We are so pleased with Geocoder! We jumped in with both feet and made some impressive mosaics. Thanks so much for all the support.” Beyond GeoCoder we have developed an analytical tool (AVO) that uses the variations in the amplitude of the return as a function of the angle of incidence to predict
JHC Performance Report 4 30 January 2007

the nature of the seafloor (sand, silt, clay, etc.). The Office of Naval Research initially funded this work (their interest is in remotely identifying seafloor properties for sonar propagation and mine burial models), yet the application of this technique to fisheries habitat studies is clear and there has been great interest in its use by a number of NOAA labs and researchers. Further development and application of this research to the fisheries habitat problem will be a focus of future research under this grant.
Recognizing that implementing the United Nations Convention on the Law of the Sea (UNCLOS) could confer jurisdiction and management authority over large (and potentially resource-rich) areas of the seabed beyond our current 200 nautical mile limit, Congress (through NOAA) funded the Center to evaluate the content and completeness of the nation’s bathymetric and geophysical data holdings in areas surrounding our Exclusive Economic Zone, or EEZ. The initial portion of this complex study was carried out in less than six months and a report was submitted to Congress on 31 May 2002 (http://www.ccom.unh.edu/unclos.htm Following up on the recommendations made in the UNH study, Congress has funded the Center (through NOAA) to collect new multibeam sonar data for research purposes and that will also support a potential submission under UNCLOS Article 76. Since 2003, Center staff has participated in surveys in the Bering Sea, the Gulf of Alaska, Atlantic margin, the high, ice-covered Arctic, and the Marianas, collecting more than 850,000 sq. km of high-resolution mapping data that have provided an unprecedented new view of the seafloor, revolutionized our understanding of many margin processes, and could result in significant additions to a potential U.S. submission under UNCLOS.
The research highlights outlined above represent just a few of the successes we have had, but are representative of the clear impact that the lab is having on hydrographic and ocean mapping science. Details are presented in the following progress report. It should also be mentioned that the expertise of the lab is often sought by various lines and divisions of NOAA (e.g., advice on protocols for mapping in support of both mid-water targets and essential fish habitat for NMFS, mosaicing video imagery for the Monitor and Macon projects for Sanctuaries, backscatter processing for the Coral Reefs Program of CCMA, advice on multibeam sonar installations for OMAO, surveys in support of ordinance and oil spill mapping for OR&R, etc.). Further evidence of our contribution to state-of-the-art hydrographic research can be found in the steady stream of publications produced by Center personnel in a variety of top journals. Of particular note is the remarkable representation by the lab at recent U.S. Hydrographic Conferences --arguably the premier international venue for the discussion of hydrographic science -- where typically, Center personnel are authors of at least 25% of the papers presented.
JHC Performance Report 5 30 January 2007

Performance and Progress Report UNH/NOAA Joint Hydrographic Center Progress Report NOAA Ref No: NA05NOS4001153 Final Report NOAA Ref No: NA17OG228 Report Period: 01/01/2006 – 12/31/2006 Principal Investigator: Larry A. Mayer Introduction: On 4 June 1999 the Administrator of NOAA and the President of the University of New Hampshire signed a memorandum of understanding describing a Joint Hydrographic Center (JHC) at the University of New Hampshire. On 1 July 1999 a cooperative agreement was awarded to the University of New Hampshire providing the initial funding for the establishment of the Joint Hydrographic Center. This center, the first of its kind to be established in the United States, was formed as a national resource for the advancement of research and education in the hydrographic and ocean mapping sciences. The activities of the center are focused on two major themes: 1- a research theme aimed at developing and evaluating a wide range of state-of-the-art hydrographic and ocean mapping technologies, and; 2- an educational theme aimed at establishing a learning center that will promote and foster the education of a new generation of hydrographers and ocean mapping scientists to meet the growing needs of both government agencies and the private sector. In concert with the Joint Hydrographic Center, the Center for Coastal and Ocean Mapping was also formed in order to provide a mechanism whereby a broader base of support (from the private sector and other government agencies) could be established for ocean mapping activities. This report is the eleventh in a series of what were until, December 2002, bi-annual progress reports. Since December, 2002, the reports have been produced annually; this report highlights the activities of the Joint Hydrographic Center during the period between 1 January and 31 December, 2006. Copies of previous reports can be found on the Center’s web site: http://www.ccom.unh.edu
JHC Performance Report 6 30 January 2007

Infrastructure: Personnel: The success of any organization will be dependent on the skills and talents of the individuals that make it up. Thus the primary task in establishing the Joint Hydrographic Center was to ensure that an appropriate team of people would be brought to the University of New Hampshire. This has been accomplished, and with the arrival of Dr. Christian de Moustier in January 2002, all positions outlined in the original Center proposal have been filled. In 2003 Dr. James V. Gardner, a world-renowned marine geologist and leader of the USGS Pacific Mapping Group, retired from the U.S.G.S. and joined the Center as a research faculty member. In 2004 Nathan Paquin began a full-time position as our computer system manager and Jim Case joined our staff as a database specialist. Following his retirement from NOAA, Dr. Lloyd Huff joined our research faculty and David Monahan joined our faculty as Program Director for the GEBCO Bathymetric Training Program (funded by the Nippon Foundation). In 2005, additions to our staff included Brian Locke as a programmer/information technologist, Briana Sullivan as a programmer and outreach specialist, Shachak Pe’eri as a post-doctoral scholar focusing on LIDAR issues, and Will Fessenden as our assistant system manager. New to the Center in 2006 is Glenn McGillicuddy in the capacity of a research engineer, Dr. Tom Weber as a research faculty member specializing in acoustics and Dr. Kurt Schwehr as a research scientist with our data visualization team. In 2006 we also saw the re-classification of Drs. Barbara Kraft and Luciano Fonseca from Research Scientists to Research Professors. Faculty: Lee Alexander is a Research Associate Professor actively involved in applied research, development, test and evaluation (RDT&E) projects related to the implementation of electronic chart-related technologies. Lee chairs or participates on a number of international committees defining electronic chart standards, and serves as a technical advisor to U.S. Navy, U.S. Army, U.S. Coast Guard, and Coast Survey-NOAA. Brian Calder has a PhD in Computing and Electrical Engineering, completing his thesis on Bayesian methods in sidescan sonar processing in 1997. Since then he has worked on a number of signal processing problems, including real-time grain size analysis, seismic processing, and wave-field modeling for shallow seismic applications. His research interests include methods for error modeling, propagation and visualization, and adaptive sonar backscatter modeling. His work has focused on developing methods for textural analysis of seafloor sonar data, as well as exploring innovative approaches to target detection and seafloor property extraction. Dr. Calder is an Associate Research Professor with the Center and the Dept. of Electrical Engineering focusing on statistically robust automated data cleaning approaches and tracing uncertainty in hydrographic data (the CUBE algorithm) and new approaches for precise timing of measurements. Luciano Fonseca received an undergraduate degree in University of Brasilia and his Ph.D. from the University of New Hampshire (he was the first PhD produced by the Center). Luciano’s research is focused on developing tools for extracting quantitative
JHC Performance Report 7 30 January 2007

seafloor property information from multibeam backscatter and on database support. He is supported by ONR on a project aimed at understanding how multibeam backscatter may be used to remotely predict seafloor properties. The work is focused on local sites (Portsmouth Harbor and Great Bay) where we can take advantage of the Shallow Survey 2001 and 2008 “common data sets” and easily collect ground truth data. More recently he has focused on developing the GEOCODER tool for the rapid production of sidescan sonar and backscatter mosaics. Dr. Fonseca is an Assistant Research Professor in the Center and in the Ocean Engineering Program. Jim Gardner is a world-renowned marine geologist and was leader of the USGS Pacific Mapping Group. He retired from the USGS and joined the center in the late summer of 2003. He presently is also an Emeritus Senior Geologist with the USGS, as well as an Honorary Associate in the School of Geosciences at the University of Sydney, Australia. He was been responsible for the multibeam sonar mapping of a number of areas off California and Hawaii and has pioneered innovative approaches to the dissemination and interpretation of these data. Jim has had a long and illustrious career making important contributions in a number of areas of marine geology and geophysics including leading the U.S. effort to map its EEZ with the GLORIA long-range side-scan sonar. At the Center, Jim is a Research Professor with the Center and the Depts. Of Ocean Engineering as well as Earth Sciences. He is leading our field efforts in support of Law of the Sea studies. Lloyd Huff has over 37 years in private industry and the federal government, working with acoustic instrumentation and oceanographic equipment. He received his Doctorate in Ocean Engineering in 1976 from the University of Rhode Island and was one of the lead professionals in the Office of Coast Survey (OCS) working to bring multibeam side scan sonars and multibeam bathymetric sonars into standard practice for shallow water hydrography. He was Chief of the OCS Hydrographic Technology Programs from 1988-1999. Dr. Huff is working on new approaches for a range of hydrographic activities including the application of RTK techniques. Lloyd is a Research Professor in the Center and in Ocean Engineering. Barbara Kraft received a Ph.D. in Mechanical Engineering at the University of New Hampshire. Her dissertation research used optical tomography and interferometry to spatially resolve 3-D density fields of turbulent jets. She has taught several courses including digital signal processing and experimental measurement and data analysis. Most recently she has worked on the demodulation of voice and data transmissions for digital radio communications. At CCOM she is an Assistant Research Professor in the Center and in Ocean Engineering and is working on the ONR programs analyzing in situ measurements of seafloor acoustic properties and on upgrading our acoustic tank facilities. Larry Mayer is the Director of the Center for Coastal and Ocean Mapping and Co-Director of the Joint Hydrographic Center. Larry’s faculty position is split between the Ocean Engineering and Earth Science Departments. He has a background in marine geology and geophysics with an emphasis on seafloor mapping and the remote
JHC Performance Report 8 30 January 2007

identification of seafloor properties from acoustic data. Before coming to New Hampshire he was the NSERC Chair of Ocean Mapping at the University of New Brunswick where he led a team that developed a worldwide reputation for innovative approaches to ocean mapping problems. Dave Monahan is the Program Director for the Nippon Foundation General Bathymetric Chart of the Oceans (GEBCO) training program in oceanic bathymetry. Prior to joining CCOM, he served 33 years in the Canadian Hydrographic Service, working his way down from Research Scientist to Director. During that time, he established the bathymetric mapping program and mapped most Canadian waters, built the Fifth Edition of GEBCO, led the development of LIDAR, developed and led the CHS Electronic Chart production program, and was Canadian representative on a number of International committees and boards. Christian de Moustier is the newest addition to the senior faculty of the Joint Hydrographic Center/Center for Coastal and Ocean Mapping. His Professor position is split between the Ocean Engineering and Electrical Engineering Departments. He is a world-renowned expert in the theory and engineering aspects of advanced sonar systems for ocean mapping. Christian comes to us from the Scripps Institution of Oceanography where he was responsible for the installation and operation of a number of multibeam and other sonar systems. His research interests focus on development of innovative sonar processing techniques and acoustic seafloor characterization. Yuri Rzhanov, with a Ph.D. in Physics and Mathematics, is an Associate Research Professor in the Center and in the Dept. of Ocean Engineering. He has a very wide range of computing skills and has built a number of applications for higher education that are presently in use at universities around the world. Most importantly Dr. Rzhanov has been developing models for sonar-seabed interaction for bathymetric and sidescan sonars (including the Klein 2000/5000 systems) as well as software for automatic mosaicking of video imagery and sidescan sonar data. Colin Ware is the Director of the Center’s Data Visualization Research Lab and a Professor in the Ocean Engineering and Computer Science Departments. Dr. Ware has a background in human/computer interaction (HCI) and has been instrumental in developing a number of innovative approaches to the interactive 3-D visualization of large data sets. As a member of the UNB Ocean Mapping Group, Dr. Ware was the developer of many of the algorithms that were incorporated into CARIS HIPS, the most commonly used commercial hydrographic processing package. Thomas Weber is an Assistant Research Professor in the Center and in Ocean Engineering. He earned his PhD in Acoustics at Penn State University and has B.S. and M.S. degrees in Ocean Engineering from the University of Rhode Island. His areas of interest include (in no particular order): bubbles in the ocean and their affect on sound propagation and scattering; bubble mediated air-sea gas exchange; underwater optical tomography; the use of multibeam sonar for measurements of fish, bubbles, and other scatterers in the water column; benthic habitat mapping, and; ocean sensor design.
JHC Performance Report 9 30 January 2007

NOAA has demonstrated its commitment to the Center by assigning four NOAA employees to the Center: NOAA Employees: Capt. Andrew Armstrong, Co-Director of the JHC, Captain Armstrong recently retired as an officer in the National Ocean and Atmospheric Administration Commissioned Corps and is now assigned to the Center as a civilian NOAA employee. Captain Armstrong has specialized in hydrographic surveying and served on several NOAA hydrographic ships, including the NOAA Ship Whiting where he was Commanding Officer and Chief Hydrographer. Before his appointment as Co-Director of the NOAA/UNH Joint Hydrographic Center, Captain Armstrong was the Chief of NOAA's Hydrographic Surveys Division, directing all of the agency's hydrographic survey activities. Captain Armstrong has a B.Sc., in Geology from Tulane University and a M.S. in Technical Management from the Johns Hopkins University. Capt. Armstrong is overseeing the hydrographic training program at UNH and organized our successful certification submission to the International Hydrographic Organization. John "CAPT Jack" McAdam is the Executive Director for Wage Mariner Activities NOAA Marine and Aviation Operations. He graduated From Massachusetts Maritime Academy in 1972 and sailed on NOAA Fisheries vessels for 32 years as a civilian wage mariner starting as a Second Mate on the Oregon II in Pascagoula, MS and ending as Master of the Albatross IV in Woods Hole. In April 2005 he started his present position, as an advocate for the civilian wage mariners who sail on the 18 NOAA vessels and liaison between NOAA’s wage mariner employees, Marine Operations Center management, and NOAA’s Workforce Management Office. One of his duties will be to provide the NOAA/UNH Joint Hydrographic Center with assistance in creation of a port office in preparation for deployment of a SWATH vessel to be home-ported at Newcastle, New Hampshire. Dr. John G.W. Kelley is a research meteorologist and coastal modeler with NOAA/National Ocean Service's Marine Modeling and Analysis Programs within the Coast Survey Development Lab. John has a Ph.D. in Atmospheric Sciences from Ohio State Univ. and a M.S. in Meteorology from Penn State Univ. He is involved in the development and implementation of NOS' operational numerical ocean forecast models for estuaries, the coastal ocean, and the Great Lakes. He is also PI for nowCOAST, a NOAA Web mapping portal to real-time coastal observations and forecasts. John will be working with CCOM/JHC personnel on developing the capability to incorporate NOAA's real-time gridded digital atmospheric and oceanographic forecast into the next generation of NOS nautical charts.
Carl Kammerer is an Oceanographer with the National Ocean Services’ Center for Operational Oceanographic Products and Services (CO-OPS) now seconded to the Center. He is a specialist in estuarine and near-shore currents and presently the project lead or manager for two projects; a traditional current survey in Southeast Alaska, and a more robust survey to ascertain the effects of large bulk cargo ships in Las Mareas, Puerto Rico. Working out of the Joint Hydrographic Center, he acts as a liaison between
JHC Performance Report 10 30 January 2007

CO-OPS and the JHC and provides expertise and assistance in the analysis and collection of tides. He has a B.S. in Oceanography from the University of Washington and is an MBA candidate at the University of Maryland. Other Affiliated Faculty: Dave Wells: world-renown in hydrographic circles, Dave Wells is an expert in GPS and other aspects of positioning, providing geodetic science support to the Center. Along with his time at UNH, Dave also spends time at the University of New Brunswick and time at the University of Southern Mississippi where he is participating in their new hydrographic program. Dave also helps UNH in its continuing development of the curriculum in hydrographic training and contributed this spring to a UNH course in Geodesy. Since the end of its first year, the Center has had a program of visiting scholars that allows us to bring some of the top people in various fields to interact with Center staff for periods of between several months and one year: Visiting Scholars: Jorgen Eeg (Oct – Dec, 2000) is a senior researcher with the Royal Danish Administration of Navigation and Hydrography and was selected as our first visiting scholar. Jorgen brought a wealth of experience applying sophisticated statistical algorithms to problems of outlier detection and automated cleaning techniques for hydrographic data. Donald House (Jan – July 2001) spent his sabbatical with our visualization group. He is a professor at Texas A&M University where he is part of the TAMU Visualization Laboratory. He is interested in many aspects of the field of computer graphics, both 3D graphics and 2D image manipulation. Recently his research has been in the area of physically based modeling. He is currently working on the use of transparent texture maps on surfaces. Rolf Doermer (March – September 2002) worked on techniques for creating self-organizing data sets using methods from behavioral animation. The method, called “Anaytic Stimulus Response Animation”, has objects operating according to simple behavioral rules that cause similar data objects to seek one and other and dissimilar objects to avoid one another. Ron Boyd (July – December 2003) spent his sabbatical at the Center. Ron is a professor of marine geology at the University of Newcastle in Australia and an internationally recognized expert on coastal geology and processes. Ron efforts at the Center focused on helping us interpret the complex, high-resolution repeat survey data collected off Martha’s Vineyard as part of the ONR Mine Burial Experiment.
JHC Performance Report 11 30 January 2007

John Hall (August 2003 – Oct 2004) also spent his sabbatical from the Geological Survey of Israel with the Center. John has been a major player in the IBCM and GEBCO compilations of bathymetric data in the Mediterranean, Red, Black and Caspian Seas and is working with the Center on numerous data sets including multibeam sonar data collected in the high Arctic in support of our Law of the Sea work. He is also archiving the 1962 – 1974 data collected from Fletcher’s Ice Island (T-3). LCDR Anthony Withers (July – Dec 2005) was the Commanding Officer of the HMAS Ships LEEUWIN and MELVILLE after being officer in charge of the RAN Hydrographic School in Sydney Australia. He also has a Masters of Science and Technology in GIS Technology and a Bachelors of Science from the University of South Wales. LCDR Withers joined us at sea for the Law of the Sea Survey in the Gulf of Alaska and upon returning to the Center focused his efforts on developing error models for phase comparison sonars. Research Scientists and Staff: Roland Arsenault is a M.Sc. student and part-time research assistant with Human Computer Interaction Lab of the Dept. of Computer Sciences, UNB before coming to UNH. His expertise is in 3-D graphics, force-feedback and other input techniques and networking. He is currently working on the development of the GeoZui3D realtime 3-D environment. Semme Dijkstra holds a Ph.D. in Ocean Mapping from the University of New Brunswick. He is a certified (Cat A) hydrographer from the Netherlands who has several years of hydrographic experience with both the Dutch Navy and industry. From 1996 to 1999 he worked at the Alfred Wegner Institute where he was in charge of their multibeam sonar processing. His thesis work involved artifact removal from multibeam sonar data and development of an echo-sounder processing and sediment classification system. He is now focusing on applications of single beam sonars for seafloor characterization and fisheries habitat. Will Fessenden provides workstation support for CCOM-JHC and its staff. He has a B.A. in Political Science from UNH, and worked previously for the University's department of Computing and Information Services. When he’s not fixing computers, he's playing games on them. Jason Greenlaw has been part of the IT group but recently became a full time NOAA contractor employee working with John Kelley on further development of his nowCOAST project (http://nowcoast.noaa.gov). Jason is a native of Madbury, NH and graduated (Spring 2006) from UNH with a B.S. in Computer Science and a minor in French. Tianhang Hou was a Research Associate with the UNB Ocean Mapping for six years before coming to UNH. He has significant experience with the UNB/OMG multibeam processing tools and has taken part in several offshore surveys. In addition to his work as
JHC Performance Report 12 30 January 2007

a research associate Mr. Hou has also begun a PhD in which he is looking at the application of wavelets for artifact removal and seafloor classification in multibeam sonar data as well as developing algorithms for determining the “foot of the slope” for Law of the Sea issues and developing new techniques for sidescan sonar processing. Martin Jakobsson joined the group in August of 2000 as a Post-Doctoral Fellow. Martin completed a Ph.D. at the University of Stockholm where he combined modern multibeam sonar data with historical single beam and other data to produce an exciting new series of charts for the Arctic Ocean. Martin has been developing robust techniques for combining historical data sets and tracking uncertainty as well as working on developing approaches for distributed database management and Law of the Sea issues. Dr. Jakobsson returned to a prestigious professorship in his native Sweden in April 2004 but will remain associated with the Center and continue to work here during the summers. Brian Locke has an M.S. in Engineering Mechanics, a B.S. in Physics, and a B.S. in Computer Science. He started his career as a Materials Engineer at BF Goodrich Aerospace's Aircraft Sensors Division in Burnsville, MN, where he developed and evaluated ceramics, metals, and plastics for use in pressure, temperature, and icing sensors. More recently, he worked as a Software Engineer at Enterasys Networks in Andover, MA. At Enterasys Networks, Brian developed network management software in C++ and Java, creating innovative user interfaces and network management algorithms. Brian's interests include application and system architecture, software project management, user interface design, and algorithms. Glenn McGillicuddy received his Bachelors of Science Degree in Mechanical Engineering from the University of New Hampshire in 2001 and his MSc. in Ocean Engineering from UNH in 2006. His master's thesis dealt with the classification of pre-weakened rope used to reduce marine mammal entanglements. This was achieved through the design and construction of a rope-testing machine in accordance with guidelines set by the Cordage Institute. He is currently employed with the center as a Research Project Engineer. As a research project engineer Glenn is involved with the design, construction, and operation of the Acoustic Calibration Facility (ACF) at the Chase Ocean Engineering Laboratory, a calibration facility for underwater transducers and sonar systems. His work involves the integration of hardware and software, experimental design, and the acquisition and processing of acoustic data for internal and external personnel. Andy McLeod Andy is our Ocean Engineering Lab manager. Andy spent nine years in the U.S. Navy as a leading sonar technician and then earned a B.Sc. in the Dept. of Ocean Studies at Maine Maritime. He is finishing his Masters degree in Marine Geology from the University of North Carolina. At UNH, Andy is responsible for maintenance and upgrading of the major laboratory facilities including the test tanks, small boat operations, local network administration and assistance with some courses.
JHC Performance Report 13 30 January 2007

Nathan Paquin joined the Center in 2004 taking responsibility for the daily maintenance and upkeep of our ever-growing computer facilities. Nathan comes from a strong background in computing initially gained while serving in the U.S. Army and being responsible for providing secure servers and clients. This experience was expanded through work in the industrial sector for numerous small and large IT companies. Shachak Pe’eri received his Ph.D. and M.Sc. from the Tel Aviv University in Geophysics. His Ph.D. research was on the monitoring the current uplift and deformation of Mt. Sedom salt diapir using Ineterferometric Synthetic Aperture Radar (InSAR). The research was done with Stanford University and the Hebrew University of Jerusalem. His M.Sc. research was measuring the current plate motion across the Dead Sea Fault using continuous GPS monitoring. Dr. Pe'eri’s areas of interest are: Remote Sensing, Geophysics and Geodesy. Currently he is focusing on the Acoustic-LIDAR inter-comparisons. Matt Plumlee became a research scientist with the Center after completing his Ph D. at UNH under Dr. Colin Ware. Matt is continuing his work on data visualization and human computer interaction on a part-time basis. He is focusing his efforts on the Chart of the Future project. Kurt Schwehr received his PhD from Scripps Institution of Oceanography studying marine geology and geophysics and received a B.S. from Stanford University. Before joining CCOM, he worked at JPL, NASA Ames, the Field Robotics Center at Carnegie Mellon, and the USGS Menlo Park. His research has included components of computer science, geology, and geophysics. He looks to apply robotics, computer graphics, and real-time systems to solve problems in marine and space exploration environments. He has been on the mission control teams for the Mars Pathfinder, Mars Polar Lander, and Mars Exploration Rovers. He has designed computer vision, 3D visualization, and on-board driving software for NASA’s Mars exploration program. Fieldwork has taken him from Yellowstone National Park to Antarctica. At CCOM, he is working on a range of projects including the Chart-of-the-Future, visualization techniques for underwater and space applications, and sedimentary geology. He looks forward to participating in the NASA Phoenix Mars Lander. Ben Smith is the Captain of CCOM-JHC research vessel Coastal Surveyor, and a research technician specializing in programming languages and UNIX-like operating systems and services. He has years of both programming and marine experience and built and captains his own 45 foot ketch, Mother of Perl. Briana Sullivan received her undergraduate degree in Computer Science at the University of Massachusetts, Lowell in 2002 and finished her master's in computer science at UNH in 2004. She is now employed at CCOM full-time with two major responsibilities. The first one is in the Data Visualization Research Lab where she is currently working on human factors research and the chart of the future. Her second responsibility is being the CCOM outreach coordinator. In this capacity she is in charge of informing the public of the work going on here at CCOM-JHC. This is done through
JHC Performance Report 14 30 January 2007

the design and maintenance of the web-site, adding an outreach section to the web-site (coming soon), and helping design and build museum exhibits for marine/science centers. In addition to the academic, research and technical staff, Abby Pagan-Allis and Linda Prescott are our Program Managers and keepers of order with the able assistance of Maureen Claussen. Facilities and Equipment: With the startup of the Center, the University provided a new 8000 square foot building. Given the very rapid growth of the Center, space became the limiting factor in our ability to take on new projects. In 2003 we expanded into the second floor of the new building providing greatly needed additional office, graduate student and meeting space. Our computing facilities continue to grow and evolve in order to keep up with our expanding research needs. Center servers are currently in a state of migration with respect to roles and software upgrades. Earlier in the year, all Linux server operating systems were upgraded from Red Hat 9 to Red Hat Enterprise 4 for security and compatibility reasons, but after additional testing, it was decided that the final operating system would be CentOS Linux, which is identical to Red Hat Enterprise Linux, but freely distributed. All remaining Microsoft Windows 2000 servers have been upgraded to Microsoft Windows Server 2003. Our remaining SGI/IRIX server has been decommissioned and replaced with a CentOS server, running on Dell/PC hardware, negating SGI excessive annual maintenance costs. With new students and staff arriving each semester, the Center continues to grow at an accelerated rate. Given the large number of active research projects and academic courses, we have begun development of a Center Intranet website, consisting of an online knowledge base, researcher blogs, and consolidated wiki to encourage collaboration within the Center. In addition, the Intranet will also provide webmail, web calendar, web mapping, purchase authorization tracking and an asset management system for Center users. To compliment the Intranet, we have also upgraded our version control software from CVS to Subversion, making it safer and less difficult for researchers and students to track changes during the development of computer applications. In addition, other core services have been upgraded recently, including email, web services, and FTP. An increase in both the number of research projects and the volume of data collected for each project has put a strain on the Center’s storage resources, and as such, the Center has purchased a Network Appliance FAS960c iSCSI Storage Area Network (SAN). The new SAN provides an additional 24TB of raw storage capacity for the Center, bringing the grand total to approximately 36TB. In addition to the benefit of increased storage capacity, the FAS960c provides higher throughput than conventional disk drives, decreasing processing time for research projects. It also provides the Center with the ability to centralize all research data in a single location. The current plan is to migrate approximately 10TB of research data from our Legacy direct attached storage systems to the SAN. Currently, this process is about 50% complete. Recent projects have increased the need for storage exponentially. To accommodate for the increased network utilization
JHC Performance Report 15 30 January 2007

of the SAN, we have purchased a Foundry BigIron RX-8 enterprise-level network switch. Both the SAN and the network switch have been purchased with future expansion in mind. The SAN can be upgraded to house over 200TB of raw storage, while the switch can be upgraded to 384 x 1Gb Ethernet or 32 x 10Gb Ethernet ports. One of the large projects currently in progress at the Center is the NOAA/Fishpac project, which, due to its data storage-intensive needs, requires its own dedicated server with 28TB of direct-attached storage, cabinet with uninterruptible power supply, and dedicated backup system. In order to house this new equipment, the Center data center was renovated this past summer. The renovation included the installation of a FE-227 fire suppression system, the doubling of the square footage of the room, and an additional air conditioning system for failover. The data center can now house up to seven full height cabinets. All Center servers are consolidated into three full height cabinets with one Uninterruptible Power Supply (UPS) per cabinet. The Fishpac project adds an additional cabinet to our server room, giving us a total of four cabinets. Currently, there are a total of 16 servers and 5 storage arrays. Interface between our internal gigabit local area network (LAN) and the Internet is protected by two NitroSecurity Intrusion Prevention Systems (IPS) and a Linux-based firewall. We are currently in the process of migrating from a Linux-based solution to a Windows-based firewall running Microsoft Internet Security and Acceleration Server. This will provide us with better support for Virtual Private Networking (VPN) and will provide us with the ability to deploy a proxy server to reduce and monitor bandwidth usage. The Center also currently hosts two dedicated web servers for industry-related projects (nowCOAST.unh.edu and OpenECDIS.org). Every office in the Center is wired with gigabit Ethernet and terminated in our data center, which allows us to utilize our own network equipment for enhanced speed, security and management. Two enterprise-level Cisco wireless access points are in place to provide wireless Internet connectivity for employees and visitors. In addition to enterprise level anti-virus scanners deployed on all computer systems in the Center, all inbound and outbound traffic is routed through our firewall and the two IPS devices where it is interrogated for malicious content (Fig. 1). The Center’s computer classroom is populated with ten small form factor computer systems, and a ceiling-mounted NEC high resolution projector. All training that requires the use of a computer system is conducted there. We have continued to upgrade workstations in the Center, as both computing power requirements, and the number of employees and students have increased. This brings the grand total of faculty/student/staff workstations to 122 high-end Windows XP and Linux desktops/laptops, as well as several Macintosh G4/G5 computers and one SGI O2 workstation. The Center continues to operate within a Windows 2003 Active Directory domain environment. It has allowed us to deploy policies to Active Directory objects, thus reducing the IT administrative costs in supporting workstations and servers. This also allows each member of the Center to have a single user account, regardless of computer platform and/or operating system, reducing the overall administrative cost in managing users. In addition, the Center has also upgraded all NOAA laptops with
JHC Performance Report 16 30 January 2007

Safeboot encryption software in accordance with OCS standards. This provides the NOAA-based employees located at the Center with enhanced security and data protection. The Center has added a new research vessel this season, the 34-foot NOAA vessel Cocheco. As with the research vessel Coastal Surveyor, the Center and NOAA have equipped the Cocheco with new computer and networking equipment for onboard navigation, data collection and processing, and wireless communications with land-based wireless access points.
Figure 1 New research vessel R/V COCHECO A robust daily backup system is in place for all computers at the Center. Recently-written tapes are held in a fire-safe, while archived datasets are sent offsite to an Iron Mountain data protection facility where they are stored in an environmentally controlled vault. We have a full suite of commercial software packages for both data processing and presentation. In addition, we are developing a great deal of in-house software. For this software development, a cooperative code development environment is in place (Subversion), which allows concurrent development on different platforms with multiple users. A full suite of peripherals (4mm, 8mm, DLT, LTO, CD-R and DVD±R) are available so that we can re-distribute the data on a range of media. We have a wide array of printers and plotters including both 48 and 60 inch large format color plotters along with the ability to scan documents and charts up to 54 inches using
JHC Performance Report 17 30 January 2007

our wide format, continuous feed, high-resolution scanner. All computers and peripherals are operational and fully integrated into both Center and University networks. All systems are interoperable regardless of host operating system and files are shareable between all systems. The Center also participated in the 2006 Aegean Expedition in conjunction with NOAA, The Mystic Aquarium, The University of Rhode Island, and other universities. This allowed the Center to once again utilize our telepresence console that was initially purchased for the 2005 Lost City Expedition. The master console consists of five Dell Power Edge servers used for data processing workstations, three Tandberg video decoder devices that decode real-time video streams, three 37” Westinghouse LCD displays through which the streams are presented, and a voice over IP (VoIP) communication device used to maintain audio contact with all endpoints. All equipment is connected to two Powerware uninterruptible power supplies (UPS) to protect against power surges and outages.
Fig. 2. Current topology of JHC computer network
Educational Program: The Center, under the guidance of Capt. Armstrong, has developed an ocean-mapping-specific curriculum that has been approved by the University. We offer both M.Sc. and Ph.D. degrees with a specialization in Ocean Mapping through the Dept. of Ocean Engineering, the Dept. of Earth Sciences (now expanded to include the School of Natural Resources), the Dept. of Electrical Engineering, the Dept. of Computer Science, or the Institute for the Study of Earth, Oceans and Space. The path chosen depends on the background of the student with physical scientists typically entering through the Oceanography or Earth Science programs, engineers entering through Ocean or Electrical Engineering programs, and computer scientists through the Computer Science program.
JHC Performance Report 18 30 January 2007

We have also established a post-graduate certificate program in Ocean Mapping. This one-year program has a minimum set of course requirements that can be completed in one year and allows post-graduate students who cannot spend the two years necessary to complete a master’s degree a means of upgrading their education and receiving a certification of completion of the course work. The first student (from NIMA – now NGA) started in the certificate program in September 2003.
In 2004 the Center was selected through an international competition (which included most of the leading hydrographic education centers in the world) to host the Nippon Foundation/GEBCO Bathymetric Training Program. UNH was awarded $1.6 M from the Nippon Foundation to create and host a one-year training program for seven international students (initial funding is for three years). Fifty-seven students from 32 nations applied and in just 4 months (through the tremendous cooperation of the UNH Graduate School and the Foreign Students Office) seven students were selected, admitted, received visas and began their studies. This first class graduated (receiving a “Certificate in Ocean Mapping” in 2005, the second class in 2006, and we are now hosting our third class of GEBCO students. We have also just learned that the Nippon Foundation will extend the program for at least another year. The GEBCO/Nippon Foundation students have added a tremendous dynamic to the Center both academically and culturally. Funding from the Nippon Foundation has allowed us to add Dave Monahan to our faculty in the position of program director for the GEBCO bathymetric training program. Dave brings years of valuable hydrographic, bathymetric and UNCLOS experience to our group and, in the context of the GEBCO training program has added several new courses to our curriculum.
With the establishment of these programs we will now turn to our longer-term goal of establishing the training and certification programs that can serve undergraduates, as well as government and industry employees. We have already begun by offering the Center as a venue for industry and government training courses and meetings (e.g., CARIS, Triton-Elics, SAIC, GEBCO, IBCAO, IVS, the Seabottom Surveys Panel of the U.S./Japan Cooperative Program in Natural Resources (UJNR), FIG/IHO, NAVO, NOAA, USGS). This has proven very useful as our students are allowed to attend and are thus exposed to a range of state-of-the-art systems and important issues. Particularly important have been visits to the Center by a number of members of NOAA’s Coast Survey Development Lab (in order to explore research paths of mutual interest) and the visit of many NOAA scientists to discuss NOAA priorities for multibeam sonar systems and surveys as part of a series of NOAA Multibeam Workshops.
Finally and most importantly, our program was given a Category A certification by the FIG/IHO International Advisory Board of Standard of Competence for Hydrographic Surveyors at their annual meeting in May 2001. While our students have a range of more general science and engineering courses to take as part of the Ocean Mapping Program, the Center teaches several courses specifically designed to support the Ocean Mapping Program.
JHC Performance Report 19 30 January 2007

JHC – originated Courses Course Instructors____________________ Introduction to Ocean Mapping Armstrong, de Moustier, Mayer Ocean Bathymetry Monahan Ocean Mapping Tools Monahan, Gardner, Kraft, and others Hydrographic Field Course Armstrong, Dijkstra Marine Geology and Geophysics Mayer and Gardner Environmental Acoustics (I & II) de Moustier, Baldwin Data Structures Ware Data Visualization Ware Seafloor Characterization Mayer, Calder, Fonseca Geodesy and Positioning for OM Wells, Dijkstra, Huff Special Topics: Law of the Sea Monahan Special Topics: Ocean. Data Analysis Weber Seminars in Ocean Mapping All
We have 25 students currently enrolled in the ocean mapping program, including the GEBCO students, one NOAA Corps officer and a NOAA physical scientist and a NOAA surveyor; we have already produced five PhD’s: (Luciano Fonseca (2001); Anthony Hewitt (2002); Matt Plumlee (2004); Randy Cutter (2005); and Matt Quinn (2006). This past year we have graduated four more Masters students including two NOAA physical scientists.
Student Program Advisor Robert Bogucki Ph.D. OE Ware Daniel Brogan Ph.D. EE de Moustier Chuck Carline M.S. EE de Moustier Rebecca Conrad M.S. OE (recv, Dec 06) Huff Janet Felzenberg M.S. ES Gardiner/Mayer/Ward Nick Forfinski M.S. OE Armstrong Bert Franzheim M.S. EE de Moustier
Jim Glynn M.S. EE de Moustier/Huff Fan Gu M.S. EE Rzhanov Brian Heap Cert/M.S.ES Alexander Tianhang Hou Ph.D. OE (PT) Mayer, Huff Gretchen Imahori (NOAA) M.S. ES (recv, Dec 06) Huff/Armstrong Mike Leo Ph.D. ES Huff Anton Mamaenko M.S. OE Rzhanov Mashkoor Malik Ph.D. ES Mayer, Calder Peter Mitchell M.S. CS (recv, June06) Ware Lynn Morgan M.S. ES Armstrong
JHC Performance Report 20 30 January 2007
Mark Moser M.S. OE Armstrong Brian O’Donnell M.S. EE de Moustier Matt Quinn Ph.D. CS (recv, June 06) Ware Lorraine Robidoux (NOAA) M.S. ES (recv, Dec. 06) Armstrong/Mayer Luis Ruis M.S. ES Mayer Stephan Schaeffer Ph.D. CS Ware Val Schmidt M.S. OE Weber/Mayer Ed Sweeney M.S. ES Gardner, Johnson Nathan Wardwell M.S. ES Gardner/Mayer Michelle Weirathmueller M.S. OE Weber/Mayer
GEBCO Students: (2006-2007) Student Institution Country Jose Gianella Navy Hydrographic Dept. Peru Leonardo Humbert Navy Hydrographic Dept. Mexico Yasutaka Katagiri Coast Guard Japan Vasudev Mahale Inst. Of Oceanography India Nguyen Thanh Dept. of Fisheries Vietnam Muhammad Yazid Navy Hydrographic Dept. Indonesia
JHC Performance Report 21 30 January 2007

Status of Research: Jan – Dec. 2006: In our initial proposal (1999) we identified five research programs, each of which combines long-range research goals designed to make fundamental contributions to the fields of hydrography and ocean mapping with short-term objectives designed to address immediate concerns of the hydrographic community in the United States. As our research has progressed and evolved, the clear boundaries between these themes have become more diffuse. For example, our data processing efforts (e.g. CUBE) are evolving into our data fusion and chart of the future efforts. The data fusion and visualization projects are also blending with our seafloor characterization and chart of the future efforts as we begin to define new sets of “non-traditional products.” This is a natural (and desirable) evolution that slowly changes the nature of the themes and the thrust of our efforts. Nonetheless, for consistency, we will use the original theme categories to review our progress as well as introduce progress made in several new initiatives.
INNOVATIVE SONAR DESIGN AND PROCESSING FOR ENHANCED RESOLUTION AND TARGET RECOGNITION: We continue to make progress in the upgrades to our sonar calibration facility (funded in part by NSF), now one of the best of its kind in New England. The facility is now equipped with a rigid x, y positioning system, computer controlled transducer rotor (with resolution of 0.025 degree) and custom built data acquisition system. Barbara Kraft and Glenn McGillicuddy have reworked the software used for calibration. Measurements that can now be completed include transducer impedance (magnitude and phase) as a function of frequency, beam patterns (transmit and receive), open circuit voltage response (receive sensitivity), and transmit voltage response (transmit sensitivity). In addition, the A/D channel inputs have been optimized as a function of beam angle and the cross-correlation and RMS levels of the transmitted and received channels can be computed in real-time.
In addition graduate student Chuck Carline, working under the supervision of Chris de Moustier, has been developing a precise positioning system for the x, y table that positions the transducers being calibrated. At present he is able to measure the position of one axis of the within 2 mm. The approach will now be expanded to all six axes necessary for complete and precise positioning of the transducer.
In past year the calibration facility, under the supervision of Barbara Kraft was used to better understand capabilities of a number of sonars including:
Atlas Fansweep 30 Measured three-dimensional beam patterns (Tx and Rx)
over one quadrant of the beam pattern. Recorded transmit pulse waveforms with four pulse lengths for a number of configurations (steered and unsteered, shaded and unshaded, coded and continuous) at twelve frequencies.
JHC Performance Report 22 30 January 2007

EAII Lab Measured TVR/OCVR of the ITC3148 (w/ and w/o the inline tuning coil) using the USRD F42C and the Reson TC4014. Measured the impedance of the ITC3148 (w/ and w/o the inline tuning coil). Measured beam patterns (Tx and Rx) of the ITC3148. Measured the interferometric phase of the WESMAR sidescan staves.
USBL (Orion) Measured impedance and beam patterns of PVDF,
commercial fish pingers, diver USBL’s, and Channel Industries ceramic disks. Configurations of the ceramic disks tested include an oil-filled container, various soldering locations, additional matching layers, and aperture reduction.
WASSP Measured beam patterns (Tx and Rx) of the transmit
element and 26 receive elements for several design modifications of an oil-filled container that is used to evaluate backing materials.
USRD E27 Measured impedance and TVR/OCVR upon receipt from
USRD and following damage to coaxial cable. Compared with USRD calibration.
USRD F42C Measured impedance and TVR/OCVR upon receipt from
USRD. Compared with USRD calibration. ITC 1042 Measured impedance and TVR/OCVR upon receipt from
ITC. Compared with ITC calibration. Reson 8111 Measured the transmit beam pattern (across-track) at
ranges of 5 and 14 meters with the USRD E27 receiving. Resolved pitch offset of 1.2 degrees evident in the beam pattern at 14 meters. Verified that the “RxGain” setting increases in 1 dB steps over the available range from 1 to 45. Verified that the “TxPower” setting increases in 3 dB steps over a range from 1 to 17 (“Full”). Verified the source level at “Full” TxPower. Measured the effect of pulse width on the source level for all TxPower settings. Verified the relative TVG.
Simrad EM3002 Measured the transmit beam pattern (across- and along-
track) with the USRD E27 receiving. Examined the repeatability of the transmit beam pattern measurement following displacement of the carriage. Measured the receive beam pattern (across- and along-track) with the
JHC Performance Report 23 30 January 2007

USRD E27 transmitting. Examined the temporal variation in the source level.
Klein 5410 Measured the transmitted signal with the USRD E27 receiving for CW and FM pulses of 132 and 176 μs. Measured receive beam patterns (across- and along-track) of the bathymetric and sidescan channels with the USRD E27 transmitting CW pulses of 132 and 176 μs.
Bathymetry from the Klein 5410: The Center has been involved in exhaustive testing of the transducers on the 5410 so as to better understand the feasibility of using the 5410 sidescan to simultaneously collect hydrographic quality bathymetry. Based on the data collected at the Center, Klein agreed to replace the port transducer under the system warranty. The plan was to conduct Klein’s normal (qualitative) at sea testing of the system followed by qualitative testing to be conducted in the Center acoustic test facility. Although the performance of the new 5410 port transducer for side scan imagery was exceptionally good, the new 5410 port transducer did not function for bathymetry. The problem with the bathy performance was determined to be a wiring error during the manufacturing. Consequently the tank tests were not conducted on that transducer. Klein manufactured another port transducer for the port side of the 5410. Due to ship scheduling both locally on the Gulf Challenger and in Alaska on the NOAA Ship Fairweather, qualitative tank testing was conducted in advance of qualitative testing at sea. The tank tests confirmed that the latest port transducer provided by Klein for the 5410 was wired correctly. The horizontal beam pattern of the port transducer was quite close to that for the starboard transducer; however in the vertical axis there was a noticeable difference wherein the new port transducer has a vertical asymmetry that is not present in the starboard transducer. The tank tests were conducted by Jim Glynn with assistance from Glenn McGillicuddy and Barbara Kraft. Despite the continuing problem with the port transducer, study of 5410 phase-based bathymetric measurements proceeded. The study included developing processing software specifically to handling the phase data from the 5410. The final field work that was conducted this reporting period included a mini-survey in New York Harbor on a launch from the NOAA Ship Thomas Jefferson. Evaluation of the bathymetric function of the 5410 reached its projected plateau during this reporting period. This research is described in the MS thesis of James Glynn. CCOM continues to work with Klein Associates in their attempt to provide a fully operational port transducer for the 5410. A related project is being carried out by graduate student Rebecca Conrad and Lloyd Huff using the Boeing Australia Stabilizing Tail (BAST) – an active tailfin designed by the Australian Navy for the Klein 5000 series sonars and sent to the Center for further testing and improvement. The BAST was put through a sequence of tests which included measurements conducted in the laboratory, in the tow tank, and in the field working from the Gulf Challenger. The BAST must be continuously maintained by a source of pressurized dry air to prevent intrusion of water via porous areas in its aluminum casting. That has caused operational problems and consequently it has been decided not to install a single board computer in the BAST for automatically stabilizing the “flight patterns”.
JHC Performance Report 24 30 January 2007

Rather, the control loop will be closed via communications with a shipboard computer that is connected to the tow cable. Consequently the Cerebella Model Arithmetic Computer (CMAC) Neural Network controller that is being designed by Rebecca Conrad will operate on the topside computer. This research topic was completed during this reporting period and was documented in a MS thesis by Rebecca Conrad.
Finally, Dan Brogan has worked with Chris de Moustier on an NRL-funded project to further develop the capabilities of volume search sonar for the AQS-20 system and on a New Zealand sponsored (ENL) effort to evaluate a small, inexpensive multibeam sonar designed for fisheries applications (WASSP). With respect to the WASSP, this year’s efforts on improving the robustness of both the seafloor detection and ship attitude correction algorithms using data collected in August, 2005. This led up to a trip in March to visit ENL in Auckland, New Zealand for further data collection aboard the M/V Acheron in Bay of Islands, New Zealand. Following preliminary processing of this data, the focus shifted to the application of the Kalman filter for tracking the water column and seafloor echoes within a single ping as the data at successive sample times arrives. Preliminary results from the research on the Kalman filter showed a seafloor detection process that was more robust to bathymetry variations than conventional conjugate-product based seafloor detection techniques. During the summer months, beam-pattern tests were carried out on both potted and un-potted WASSP arrays to analyze potential problems with internal reflections. Another field test with the WASSP system was completed in New Hampshire aboard the R/V COASTAL SURVEYOR in October. With respect to the NRL Volume Search Sonar of the AQS-20 mine countermeasure system, the magnitude and phase based seafloor detection algorithm designed for the WASSP multibeam sonar was adapted for use with the VSS and converted from MATLAB into the C programming language. These algorithms can extract three across-track bathymetric profiles per ping from beam-formed VSS complex data. The code and documentation were delivered to Will Avera (NRL manager for this program) at the end of September 2006. High-precision, High-accuracy Time Synchronization: The ultimate accuracy achievable from a multibeam survey can often be constrained by our ability to synchronize the time-stamps amongst the varied sensors (sonar, GPS, motion-sensor, etc.) associated with a survey. Brian Calder has been investigating the use of the IEEE-1588 ‘Precision Time Protocol’ (PTP) as a solution for low-overhead time synchronization, primarily in survey systems (i.e., to allow local time-stamping at data generation as a way to eliminate latency issues in data capture). He has been able to demonstrate that on low-specification hardware (both computers – 533MHz Pentium III systems – and network – desktop workgroup 100bT Ethernet switches), the National Instruments PCI-1588 cards achieve synchronization and syntonization of clocks within approximate 100ns rms with zero host computer overhead, and low network overhead. Additionally he has demonstrated that a software implementation of the PTP can potentially achieve sub-millisecond accuracy when talking with a hardware master clock; the performance is difficult to quantify because of limitations in observing timing accuracy of the software clock but experiments on this are nearing completion. Limiting
JHC Performance Report 25 30 January 2007

accuracy is likely to be on the order of a few hundred microseconds, depending on computer speed and loading. The uncertainty in developing a timestamp from software, even using hardware oscillators, can be significantly higher than the hardware uncertainty. The estimate of this uncertainty is on the order of 10-20 microseconds depending on computer speed and loading.
Experiments were also done (with Andy McLeod) that demonstrated that an implementation of this approach over commercial wireless is limited in accuracy due to variable latency in the wireless switches, on the order of 1-5ms rms, with some spikes to 10ms. In support of this approach, Calder has developed code, termed the Software Grandmaster (SWGM) Algorithm, to synchronize, syntonize and absolute reference PTP time to a UTC master, in particular the 1PPS and ZDA messages from a GPS or IMU. The short-term accuracy of this system is typically 100-110ns rms from master to slave (slightly better on the master), and the long-term stability is essentially that of the GPS or IMU system itself. That is, SWGM-derived hardware times track UTC time absolutely within 100-110ns rms as long as the system remains in operation. The SWGM algorithm is robust to network packet loss up to ~60% and the a priori uncertainty estimated for timestamps by the SWGM algorithm match the true errors observed in the test environment. The self-timing of software latency is possible using processor register timing and careful control of process priority, but that process priority can significantly affect likely uncertainty in timestamping (by an order of magnitude or more).
This approach was tested in the field using launches from the NOAA Ship THOMAS JEFFERSON and the Klein 5410 phase measuring multibeam sonar in collaboration with work being carried out by de Moustier, Glynn, and Huff. The success of this approach has led to discussions with Industrial Consortium partners (SAIC, Reson and Applanix) on the potential for test implementations of the PTP and SWGM algorithms in their survey systems. An agreement has been reached with NOAA (Brennan), Applanix (Canter) and Reson (Malzone) to test this as a US Hydro 2007 paper, using POS/MV 320 V4, Reson 7125/7-P and the NOAA Ship BAY HYDROGRAPHERS.
NEW APPROACHES TO MULTIBEAM AND SIDESCAN SONAR DATA PROCESSING IMPROVED BATHYMETRIC PROCESSING: CUBE and Improved Uncertainty Management: One of the major efforts of the Center has been to develop improved data processing methods that can provide hydrographers with the ability to very rapidly and accurately process the massive amounts of data collected with modern multibeam systems. This data processing step is one of the most serious bottlenecks in the hydrographic “data processing pipeline” at NOAA, NAVO, and hydrographic agencies and survey companies worldwide. We have explored a number of different approaches for automated data processing (see earlier progress reports for descriptions of these approaches) and, over the past three years focused our effort on a technique developed by
JHC Performance Report 26 30 January 2007

Brian Calder that is both very fast (10’s to 100’s of times faster than the standard processing approaches) and statistically robust. The technique, known as CUBE (Combined Uncertainty and Bathymetric Estimator), is an error-model based, direct DTM generator that estimates the depth plus a confidence interval directly on each node point. In doing this the approach provides a mechanism for automatically “cleaning” most of the data and, most importantly, the technique produces an estimate of uncertainty associated with each grid node. When the automated editing technique fails to make a statistically conclusive decision, it will generate multiple hypotheses, attempt to quantify the relative merit of each hypothesis, as well as present them to the operator for a subjective decision. The key is that the operator interacts only with that small subset of data for which there is some ambiguity rather than going through the current process of subjectively examining all data points.
In 2003, CUBE was subjected to detailed verification studies in a cooperative research effort with NOAA that compared the automated output of CUBE to equivalent products (smooth sheets) produced through the standard NOAA processing pipeline. Verification studies were done in three very different environments (Snow Passage Alaska, Woods Hole, Mass., and Valdez, Alaska) involving surveys in various states of completion and comparisons done by NOAA cartographers. In each case the CUBE-processed data agreed with the NOAA processed data within IHO limits. CUBE processing took from 30 to 50 times less time than the standard NOAA procedures. Based on these verification trials and careful evaluation, Capt. Roger Parsons, director of NOAA’s Office of Coast Survey has notified NOAA employees as well as other major hydrographic organizations in the U.S. (NAVO and NGA) of NOAA’s intent to implement CUBE as part of standard NOAA data processing protocols. As described by Capt. Parsons in his letter to NAVO and NGA, CUBE and its sister development The Navigation Surface (see below) “…promise considerable efficiencies in processing and managing large data sets that result from the use of modern surveying technologies such as multibeam sonar and bathymetric lidar. The expected efficiency gains will reduce cost, improve quality by providing processing consistency and quantification of error, and allow us to put products in the hands of our customers faster.”
In light of NOAA’s acceptance of CUBE, most providers of hydrographic software are now implementing CUBE into their software packages (CARIS, IVS, SAIC, Kongsberg-Simrad, Triton-Imaging, Reson, QINSy, Fugro, GeoAcoustics and Sonartech Atlas, HyPack, QPS, and IFREMER). Dr. Calder continues to work with these vendors to ensure a proper implementation of the algorithms as well as working on new implementations and improvements. In particular, work is underway with GeoAcoustics to extend the principles of CUBE to phase comparison bathymetric sonars and based on a review of the implementation of CUBE on the NOAA vessel THOMAS JEFFERSON, to improve the uncertainty propagation equation for very shallow water and ultra-high resolution sonars. This past year we have continued to advance the usefulness of CUBE through the development of a series of CUBE-related definitions NOAA has adapted for NOAA Field Procedures Manual, and Specifications and Deliverables documents and the development (with Dave Wells) of a “User Guide” for CUBE. Calder has also
JHC Performance Report 27 30 January 2007

developed an error model being applied by the National Marine Fisheries Service for their use of the SM2000 multibeam sonar for fisheries applications.
Inherent in the CUBE approach is the need for a robust error model for the sonar being used. This model should be provided by the manufacturer but unfortunately only a few manufacturers publish an error model for their system. In an attempt to develop approaches to extracting an error model from undocumented sonar as well as checking the manufacturer-provided models, Calder and graduate student Mashkoor Malik have been exploring field calibration methods for extracting error models directly from data. This approach has been applied to an EM3002 with POS/MV and C-Nav and appears to give realistic uncertainties, but further work is required. Within this context, Calder has also developed an “Uncertainty Patch Test” proposal – a methodology for capturing the data required to determine the uncertainties associated with a particular survey system. The proposal consists of a series of survey lines, much like a patch test, designed to isolate (as much as is possible) one component of uncertainty for each line or line-pair. This year, Calder and Malik have used the acoustic test tank to capture data from the Reson 7125/400 kHz and the EM3002 sonars to confirm/extend the estimates of device-specific uncertainty for these systems and have continued the development of motion-related uncertainty models using time-series decomposition of the on-line measured motion series. Additionally, Malik and Huff have developed an approach that uses CUBE to iteratively revise the system of offset parameters during a patch test and thus reduce overall depth uncertainty. This technique was applied to data from the “common data set” collected in Plymouth Harbour, UK with a Reson 8125 MBES. The revised offset parameters obtained using CUBE resulted in reduction of over all depth uncertainties, which scaled with depth, of up to 20 %.
Through our close collaboration (and shared field efforts) with NOAA hydrographers it has become clear that many of the sonar systems (and particularly the Reson systems) used by NOAA survey vessels suffer from a problem when operated in steeply sloping environments due to limitations in the bottom detection algorithm’s ability to deal with low signal to noise ratio situations. Calder has made a concerted effort to address this “Downhill Problem” resulting in several component algorithms that have helped mitigate the problem including a Turning Angles algorithm to utilize phase information in beam-to-beam offset vectors (with ability to run with either GSF or HDCS data). An adaptive fusion system has also been developed to combine the component algorithms’ results in order to improve the overall performance of the approach. The fusion algorithm is configured to automatically tune the weighting given to each of the component algorithms in real-time, and then combine them to give a probabilistic estimate of the best solution. In addition to the algorithmic approach to this problem an experiment was developed to determine the consistency of human operator performance on data affected by the downhill problem (so that the performance of the algorithm could be determined). Testing of these approaches on field data has shown that the fused solution is stronger and more robust than the individual component algorithm solutions. The University’s Office of Intellectual Property Management has deemed the fusion algorithm (now called MASC’D – Multi-Algorithm Swath Consistency Detector) patentable and has filed an
JHC Performance Report 28 30 January 2007

invention disclosure for it. This year MASC’D has been packaged and released to SAIC for implementation in their software and a paper submitted to IHR for publication.
Another critical component of uncertainty management is the error induced by our ability (or inability) to accurately measure the spatial and temporal variability of the variations in water level due to tidal variations. While we can accurately measure the state of the tide at a single location (where we have a tide gauge), our surveys cover broad areas away from these discrete measurement points. Historically NOAA has used a process of tide-zoning, creating discrete steps in the tide correction in regions between tide gauges. This approach is not compatible with modern multibeam sonars and our ability to make continuous maps of seafloor depths as it creates artificial steps in the bathymetry at zone boundaries. To address this issue NOAA is investigating the use of a sophisticated hydrodynamic model – TCARI – Tidal Constituent and Residual Interpolation – to estimate the state of the tide at any point within a survey area. Graduate student and NOAA Corps Officer Rick Brennan focused his thesis project on quantifying the uncertainty components of this model. The result of this effort allow us to use much more realistic estimates when calculating the total propagated error for hydrographic surveys that use TCARI-derived tidal values. Further related to issues of sound-speed profile uncertainty, graduate student (and NOAA physical scientist) Gretchen Imahori, completed and directed research project investigating the sound-speed component of the total propagated uncertainty of multibeam sonar depths as a function of the spatial and temporal variability as well as uncertainty associated with the instruments. Her results have indicated that the temporal and spatial variability can be separated over large areas using current NOAA protocols but that more frequent sampling is necessary to resolve the time and space correlations over small areas. Several modifications in NOAA sound-speed data collection protocols will come out of this effort as well as a method for estimating the sound-speed TPU component of multibeam sonar depths.
The Navigation Surface and BAG’s: Another aspect of the data processing-related research being conducted at the Center involves rethinking of the final output products of a hydrographic survey. We strongly believe that the standard chart product of selected soundings and contours does not at all do justice to the information content of high-resolution multibeam and sidescan sonar data. We are working on a series of new products that will better serve the mariner as well as many other constituencies. In this context, Lt. Shep Smith developed the concept of the “Navigation Surface” as part of his thesis work. The Navigation Surface is a database that maintains bathymetric data sets at full resolution and a rule base for producing a series of derived products. Thus a single database can be the source for hydrographic (safety of navigation) products as well as products for fisheries habitat or other studies that require full-resolution data. CUBE-processed data can be a component of the Navigation Surface and thus the verification exercise described above also involved the navigation surface and tested (positively) the veracity of the navigation surface as a source of hydrographic products. The combination of CUBE and the Navigation Surface set the stage for a new research effort “The Chart of the Future” described later.
JHC Performance Report 29 30 January 2007

In support of the new adoption of CUBE and the Navigation Surface into NOAA and NAVO processing protocols, the Center has organized and hosted two workshops with industry, government and academic researchers to define and maintain an open format for Navigation Surface products that will ensure interoperability amongst the various vendors and agencies. The first workshop (in 2004) workshop defined the specifications for the Bathymetric Attributed Grid (BAG) Object, and obtained the commitment of many of those attending (NOAA, NAVO, CARIS, IVS, SAIC, 7C’s) to provide source code and adopt the approach. Cross platform libraries for digital signatures have been built and tested and an example certificate construction and management scheme (based on HASP network dongles) has been implemented. In 2005, a DLL version of the Open Navigation Surface (ONS) library was created along with a Visual Basic support application to allow demonstration of the security principles of the ONS project in a graphical context. A second meeting of the Open Navigation Surface Working Group (ONSWG) took place in July 2005 resulting in a build-out of the source tree for the BAG and the linking of stand-alone applications to read and write BAG-format files. In addition this meeting adopted the digital signature system for BAG’s (which supports simple XML files) using both private and public keys, with encryption and thus avoiding the need for hardware tokens. The BAG library was demonstrated at the Shallow Survey 2005 Conference in Plymouth England with trial integrations into IVS Fledermaus, CARIS HIPS, and SAIC SABER software packages. ESRI has now expressed interest in integrating the BAG format into their software (and becoming a member of our Industrial Consortium – see below) and NOAA OCS has recommended the BAG as the transmission form of data from OCS to NGDC. A website for the ONSWG has been established: http://www.opennavsurf.org.
This past year, the Calder, who has taken the lead in the ONS development, has completed code development, documentation and a File Specification Document for the ONS project. He also chaired several ONS working group meetings to generate the code-base for a beta-test Candidate Release (CR) and Full Release (FR), established SubVersion software management environment, and updated project website to support this. He also managed CR/FR process, with full source-code being released to the web-site on 14 April 2006 and the initial version 1.0.1 on 2 May 2006. ONS working group members met; with download participants and interested government representatives at the CHC06 meeting on ONS/BAG, chaired by Dave Wells. Calder also presented work on ONS to the IHO Technical Standards Maintenance and Development (TSMAD) working group; BAG has been proposed for adoption as part of the International Hydrographic Organization S-100 suite of standards for hydrographic products (i.e., the successor to S-57).
As a focal point for the broad interest in CUBE and the Navigation Surface amongst the government and the private sector, the Center is fulfilling one of its prime mandates of serving as a national center of focus for ocean mapping activities. In bringing these groups together we facilitate more efficient and collaborative research efforts aimed at solving a national need.
JHC Performance Report 30 30 January 2007

IMPROVED SIDESCAN SONAR AND BACKSCATTER PROCESSING: Geocoder: While our initial data processing efforts focused on improving bathymetric processing, it has become increasingly clear that there is also a great need for improved processing of backscatter data (both from multibeam sonars and sidescan sonars). With this in mind, we began, in 2005, a new effort aimed at improving the suite of backscatter processing tools available to us and NOAA. Our aim was two-fold: 1- to develop easy to use tools that will generate “pretty” images of sidescan sonar or multibeam backscatter that will be suitable for small object detection as well as geologic and habitat interpretation, and; 2- to develop tools that allow for the quantitative analysis of backscatter data in support of seafloor characterization and small object identification. In an effort to meet these two objectives, we started a lab-wide effort to develop a new suite of backscatter processing tools. This effort is being led by Luciano Fonseca with input from many others. The goal is to create an integrated suite of tools that will allow us to import backscatter or sidescan data from a number of sensors (in various formats, including Reson snippet data), convert these data to an internal GFS format, correct these data (where possible) for source levels, beam patterns, gains, area ensonified, attenuation, and local slope, and then either analyze and/or display these data in a georeferenced mosaic. A number of modules have now been developed including GEOCODER, a C++ mosaicking tool that now reads directly from GSF or XTF files (including Reson snippet data), corrects data for gains and removes speckle. Special attention has been given to correcting for beam patterns. Normally, the empirical beam pattern correction is calculated as the residual necessary to flatten the angular response registered by the sonar system, i.e. to normalize the backscatter at 45 degrees, (sometimes adding a Lambertian correction). The new approach now used by Geocoder calculates the beam pattern as the residual to the modeled angular response of the ensonified seafloor which then reveals the actual non-linearity of the transducer angular response. Data is then geocoded in a projected coordinate system using an interpolation scheme that emulates the acquisition geometry. Along with the full time series backscatter data from both Reson and Simrad systems, GEOCODER also fully supports average beam backscatter data from these systems. A feathering algorithm to smooth the transition between overlapping lines has been added along with an anti-aliasing algorithm that makes it possible to produce a lower resolution mosaic that is not degraded by aliasing, a process for slant-range correction based on actual bathymetry, and a trend-adaptive angle-varying gain that helps remove artifacts that appear when different bottom types are found along a single swath. Lines can be removed or remosaicked, and the overlap area between parallel lines can be controlled by filter parameters. GEOCODER also supports a statistical package that identifies patterns in the backscatter response that can be used in support of seafloor characterization (see below). Statistics calculated for backscatter bins include: mean, mode, range, minimum, maximum, standard deviation, variance, percentiles, quartile range, skewness, kurtosis, moments of any order, and also parameters extracted from a gray level co-occurrence matrix (contrast, homogeneity, dissimilarity, entropy and energy). Taking advantage of
JHC Performance Report 31 30 January 2007

the corrections made to the backscatter, Geocoder also serves as the front end for a new approach to using multibeam backscatter data for seafloor characterization called ARA (Angular Range Analysis – formally known as AVO). The ARA tool will be reported on in the seafloor characterization section. This past year we made significant progress in developing Geocoder. It has become a simple-to-use tool (GeoCoder) for generating a sidescan sonar or backscatter “mosaic” and generated much excitement from the community. There has been tremendous interest in this software throughout NOAA and from our industrial partners and this has led to requests for short training workshops in its use. We have now offered two of these short courses. A recent email from one of the attendees (from the Biogeography Team of NOAA’s CCMA) said: “We are so pleased with Geocoder! We jumped in with both feet and made some impressive mosaics. Thanks so much for all the support.” An industrial partner collecting massive amounts of “awful” backscatter data in the Indian Ocean tried Geocoder and it resolved their data quality problems. Specific upgrades to Geocoder made this past year include:
1) Tools to help edit and assemble backscatter mosaics, and to allow the assemblage of mosaics in tiles. For instance, there is now a simple way to add, delete and remosaic lines from an assembled mosaic. It is also possible edit and change the mosaicking style: a) blending among adjacent lines with quadratic filter, b) blending among adjacent lines with Gaussian filter, d) forced overlay of a line, d) fill gaps only, e) excluding nadir if possible. Some tools to visualize and edit the histogram of the assembled mosaic were added to Geocoder, allowing normalization among different mosaic tiles.
2) Major changes were made in data allocation structure which reduced the amount
of allocated memory by half, while still allowing for more layers of data in areas of overlapping lines.
3) The method for assembling backscatter mosaics from beam time series data
(snippets and Simrad time series) was updated. The new method does a formal positioning of all samples and accounts for sample quality and priority.
4) A tool to visualize and edit the “gradient versus offset” plot was added to
Geocoder. This is the key to extracting the fluid factor parameter during the ARA analysis.
5) Specific support for mosaicking the DTRE Fishpac Sonar and NASS Fishpac
Nadir Augmentation sonar was implemented.
6) Support for Klein 3000 and 5000 sonars (XTF and STF formats) was implemented.
7) Initial support for Reson 7000 series was added to Geocoder
JHC Performance Report 32 30 January 2007

8) Support for the phase comparison Benthos C3D sonar in XTF format
9) A tool to visualize the roll angle was added to the package.
10) An algorithm was implemented to calculate the magnetic declination necessary for correction of azimuths.
11) Support of standard sidescan sonar systems -- During the last year there was an
increased interest in sidescan sonar data, from both imaging and interferometric systems, thus a number of tools that are specific for sidescan backscatter processing were added to Geocoder. The navigation can now be read from both the fish and the vessel fields and the logged or edited layback values can be added to the ship navigation. The heading can be read from the gyro or from other sensors. The heading information can be replaced by course-made-good. The navigation fixes and the heading measurements can be interpolated linearly or with the aid of splines and fish altitude can be read from the ship or from any other available sensor. Given that some systems have multiple sidescan channels, often with different frequencies, support was added to Geocoder to read from all the available channels. Also the full angular response analysis and complete beam pattern corrections were extended to sidescan backscatter processing.
A number of test data sets were processed using Geocoder this past year in support of NOAA and others. Some of the more important data sets processed included:
Stanton Bank, Ireland: The acoustic backscatter from a Simrad EM1002 survey of the Stanton Bank, Northern Ireland was processed and analyzed. The data was used as a common dataset for a workshop on the use of backscatter for Seabed Habitat mapping. The original backscatter mosaic showed a noticeable artifact due to the changing of acquisition modes and a strong beam pattern. A correction was made after the identification of an error in the Simrad datagram that did not account for the change in the acquisition mode. The method for extracting empirical beam pattern from the data was simplified and upgraded. Gulf of Maine: The acoustic backscatter from a Reson 8101 survey of Cashes and Platts Ledge, in the Gulf of Maine was processed and mosaics were assembled. The dataset was acquired by SAIC Newport, and presented various issues with saturation of the backscatter values. Some research was done on how to identify a saturated portion of one acquisition line; on how to identify the causes of the problem; and on how to mitigate them. Virgin Islands: A Reson 8101 multibeam sonar dataset from the U.S. Virgin Islands acquired by the NOAA Ship Nancy Foster was processed and analyzed and mosaics for the whole Saint John, Saint Croix, Saint Thomas areas were prepared. The data was acquired without time varying gain (TVG) and with unusual combinations of acquisition parameters,
JHC Performance Report 33 30 January 2007

which made the acoustic backscatter processing very difficult. Research was undertaken on how to account for the lack of TVG and how to reduce the saturation. Based on the analysis of Gulf of Maine, Virgin Islands and other datasets, several recommendations have been made to NOAA and others with respect to RESON system settings and acquisition procedures where the acoustic backscatter is an important component of the survey. For instance, the “TVG off” mode should be avoided, as it compromises the dynamic range of the logged date, and yields non-linear behavior and saturation in the backscatter. The “Auto Gain” mode should be preferred, as changes in gain and power are easily compensated for. To avoid saturation, the gain should always be kept above 1 and below 14, when using “auto gain” mode. This is accomplished by increasing the power setting when the gain in too high, and decreasing the power when the gain is too low. Very long and very short pulse widths should be avoided, as they also result in non-linear behavior in the backscatter and, in the case of long pulse, reduce the sonar resolution. Beyond GeoCoder we have developed an analytical tool (Angular Range Analysis – ARA – formerly called AVO) that uses the variations in the amplitude of the return as a function of the angle of incidence to predict the nature of the seafloor (sand, silt, clay, etc.). The Office of Naval Research initially funded this work (their interest is in remotely identifying seafloor properties for sonar propagation and mine burial models), yet the application of this technique to fisheries habitat studies is clear and there has been great interest in its use by a number of NOAA labs and researchers. ARA analysis will be discussed further under the theme of seafloor characterization. NEW APPROACHES TO DATA VISUALIZATION AND PRESENTATION: GEOZUI-4D: We continue a very strong focus on the development of innovative approaches to data visualization and the application of these approaches to ocean mapping problems. The visualization team (Arsenault, Bogucki, Plumlee, Sullivan, Schaeffer, and Schwehr) under the supervision of Lab Director Colin Ware has developed a novel and innovative 3-D visualization environment, GeoZui3D. GeoZui3D is a highly interactive 3-D visualization system designed to support a number of different research projects and ocean mapping applications. GeoZui3D was described in detail in previous progress reports. In 2005, GeoZui3D evolved to incorporate time-varying data opening up a world of new visualization possibilities evolving into what we now call GeoZui-4D. The GeoZui software has been made available to the public and more than 40 groups have downloaded the software. This past many important enhancements have been made to GeoZui-4D including:
1) Removed Corba support in favor of TCP/IP sockets. 2) Switched from using a static copy of libccom to using an external reference to the
actual maintained copy of libccom.
JHC Performance Report 34 30 January 2007

3) Added support for interacting with Python scripts. 4) Removed a layer of offsets in GeoReferencing objects by eliminating the notion
of a scene reference point. Objects used to be positioned using an offset to this position. Object's now are offset from the origin of the UTM zone in use. The need to determine a scene reference point when the first object loaded lead to problems when data was read in real-time or with dataset spanning a large areas.
5) Added the ability to browse GZ's structure live using a web browser. Gives a very useful perspective when debugging some types of problems.
6) Switched to using Kurt Schwehr’s slogcxx package for printing messages, warnings and debuging information instead of cerr.
7) Separated xml handling code into its own class. It used to be part of Persistence, which is used to load objects. Since XML can be used for much more, such as message passing, it didn't make sense to be tied to an object loading routines.
8) Goto command in objects context menu (Right click in scene or object list) moves the center of workspace to the center of the selected object.
9) Some objects, such as DXF models, can now ignore height exaggeration. 10) Vessel track positions can now be specified in geographic coordinates, in addition
to the usual UTM coordinates. 11) Image textures now support being changed in time. This was done to support
Brian Locke's work in GeoZui4D to support MbFish data. 12) Various tools and scripts to help convert data to GZ formats. 13) Objects may now initiate asynchronous UDP sockets bypassing TCL. This is
meant to allow Python code to interact with GZ objects without too much latency. 14) Gutm can now be loaded from a special netcdf file (.gzn). This allows gutm to
load much more quickly, much improving demoing GZ. 15) Build on 64bit linux as well as 32bit PowerPC linux. 16) Scons build system being phased in. Scons is a more advanced build system
replacing make. It will allows more powerful build configurations, and will potentially handle various platforms (Linux, Windows and Mac) from a single set of build files, eliminating the need to maintain separate build configurations. (Visual Studio for Windows, make for all others.)
17) Lighting parameters exposed to scripts, with a simple Python gui available to control them.
18) Attempting to improve real time NMEA data input. Current implementation seems to be fragile. GZ used to read PosMV data in real time, but does not now. I'm guessing that the work done to supporting the Coastal Surveyor's data feeds for the predictor experiment might be part of the problem. I'm using the more modular approach of having the NMEA parsing done as a script outside of GZ. This would make it simple to have different specialized parsers if necessary for experiments and such.
Additionally important improvements have been made in its ability to create high-quality movies. Initial movie making used screen captures to gather the data for each frame. Many drawbacks, such as the possibility of a window occluding the captured frame, or movie dimensions size being limited by the size of the actual display, were overcome by using frame-buffer objects, a new OpenGL capability, to render the movie frames off
JHC Performance Report 35 30 January 2007

screen. Spatial and temporal anti aliasing have also been added, resulting in the ability to produce quite stunning HDTV movies. The GeoZui-4D task is also blending more and more with the Chart of the Future task – what we call GeoNAV (reported below). We will describe some of the new innovations in GeoZui-4D in this section but those related to the Chart of the Future will be described under that task heading. AUV Mission Planning and Control: Whereas much of our visualization effort has been focused on the 3-D interactive display of static features like the seafloor, last year saw the addition of dynamic, time-varying systems. In collaboration with researchers at Woods Hole Oceanographic and Johns Hopkins University, our visualization group is developing 3-D tools for the planning, monitoring and review of Autonomous Underwater Vehicle (SeaBed) and a Remotely Operated Vehicle (Jason II) missions. Progress has been slow owing to difficulties encountered re-engineering the core of GeoZui4D code base. It was found necessary to abandon this effort and start over with a simple, less ambitious solution. A major milestone took place this fall, however, when field trials of GeoZui-4D’s AUV software were held aboard the research vessel THOMAS THOMPSON, in conjunction with a SeaBed AUV program of Hanu Singh. During these trials the playback and real-time monitoring capability of the GeoZui-4D were demonstrated. A more important milestone will be the use of GeoZui planning tools to plan an actual SeaBed mission; this is scheduled for early 2006. We foresee that the techniques developed for these systems will be directly applicable to the newly acquired NOAA REMUS AUV. We have also begun a close collaboration with Art Trembanis from the University of Delaware. Art is the owner of a FETCH AUV for which we have purchased and interfaced a multibeam sonar (see discussion below). Graduate student Robert Bogucki has familiarized himself with the operations; software and hardware associated with the FETCH and has already developed custom C++ code to interface with the FETCH LABVIEW software framework. Robert will be developing software for adaptive control of the AUV. Whale Tracking: Another particularly exciting aspect of GeoZui-4D has been its application to visualizing the underwater behavior of humpback whales supporting both basic science and policy as humpback whales are an endangered species whose major causes of decline are ship collision and fishing gear entanglement. Understanding their underwater behavior is essential to mitigating both of these causes. NOAA and WHOI scientists have developed suction-cup-mounted tags that are attached to a whale and record depth, pitch, roll, and sound for as long as the tag remains on the whale (the record is now 22 hours). Our visualization team has taken these data and created a fully georeferenced 3-D display of the whale’s diving and swimming behavior in the context of the bathymetry, other vessels, and ambient sounds. A vessel tracking component combines digital data from radar and AIS with visual sightings to better understand the effect of vessels on whale behavior. The result has provided unprecedented insight into the diving and feeding patterns of the whales as well as their response to the approach of vessels. Numerous
JHC Performance Report 36 30 January 2007

papers on, and demos of this technology have been presented at both scientific and policy meetings. This past year, several improvements have been made to the whale tracking software including:
1) The addition of tools to convert EK60 data to GeoZui4D's existing curtain plot format. Two channels are combined using different colors to show how the intensity returns vary between channels.
2) The addition of the ability to display on-screen depth, position and altitude information. When a whale is displayed over bathymetry, an on-screen numeric display of its position, depth and height of the bottom can be shown. This answers the most common questions asked by scientists who are studying whale behavior using GeoZui-4D.
3) Incorporation of DTAG data into GeoZui-4D and the dynamic synchronization of the visualization with specific behavioral sequences.
Ware has also developed and applied tools (Trackplot) for the analysis of whale behavior. New analyses of tracking data collected in 2005 reveals consistency in heading of the whales during side-roles. It is hypothesized that this has to do with the orientation of sand-waves on the bottom. These analyses have also resulted in the classification of a catalogue of hitherto unknown humpback whale behaviors. Visualizations from the Center have appeared in a variety of media and these visualizations are credited with getting continued ship time on the NOAA Ship, NANCY FOSTER for an additional three years. Center visualizations have also been used in numerous hearings on the potential location of offshore natural gas terminals. Flow Visualization: The incorporation of flow visualization models into the GeoZui4D environment has opened of a range of applications and interest from ocean and current modelers both inside and outside of NOAA. Our goal is to provide tools that allow both researchers and members of the public to better understand the output from flow models. This is important to NOAA because of the increase in the number and quality of global, ocean, and estuarine flow models. These models are becoming critical to interpreting and generalizing physical oceanographic data, understanding marine ecologies, understanding weather and climate prediction. The flow visualization work is being carried out by graduate student Quinn, in collaboration with Ware; partial funding for this work has also been provided by NSF. Ware is also building the beginnings of a new flow visualization package to deal with sigma coordinate models. He is working closely with NOAA (and other) modelers and currently the new visualization package can load data from the following models:
Cbofs (Chesapeake Bay) Gbofs (Galveston Harbor)
JHC Performance Report 37 30 January 2007

Nyofs (New York Harbor) Gulf of Mexico
The visualization package can display salinity or temperature profiles and supports an exciting array of particle tracing methods. It also allows for 2D or 3D viewing. There are two other sub-projects within our flow visualization initiative: Museum exhibits: Following on our successful development of a kiosk-based interactive 3-D museum exhibit for Seacoast Science Center (GeoExplorer) which allows an interactive tour through an immersive 3-D environment up and under the Piscataqua River, stopping at interesting sights along the way, Ware gas developed a prototype touch-screen display that that incorporates flow model for the Pisquataqua River, Great Bay and Little Bay Estuary has been built. The display shows the flow of water in the Estuary as a function of tides and currents. Wherever the screen is touched a bright dye is injected into the system and the observer can see the fate of the injected particles over several current and tidal cycles. Additionally, Ware continues to work with Kate Raisz of Northern Lights on the Smithsonian Science-on-a-sphere visualization of global flow patterns (for the new Smithsonian Oceans Hall). NOAA Nowcoast: Colin Ware and NOAA employee John Kelley have initiated a new project to create innovative and more effective ways of presenting NOAA flow model output (from the HYCOM system of models) to the general public. Pete Mitchell’s master’s thesis is the major research component. Briana Sullivan will be helping with evaluation and technology transfer. An evaluation study is currently underway. Mid-water fish: One of the most exciting advances of this year has been our adaptation of a new generation of multibeam sonars to allow the real-time visualization of targets in the water column. While aspects of this fall under our visualization theme, we will discuss this activity in detail under “New Projects”. SEAFLOOR CHARACTERIZATION: We have a number of inter-connected research programs underway aimed at exploring the ability of our mapping systems to provide quantitative information on the make-up and character of the seafloor as well as its depth. These programs deal with a range of sensors (single beam, multibeam and sidescan sonars, lidar, video, etc.) and involve theoretical studies, the collection of remotely sensed data, and “ground-truth” samples. They are particularly relevant for the increasingly important topic of essential fisheries habitat characterization. SINGLE BEAM SONAR AND MAPPING AND CHARACTERIZATION: In general support of our seafloor characterization efforts, Semme Dijkstra has continued the development of several software tools. The TracEd tool provides a robust means of tracking, editing and parsing returns from single beam echosounders. This tool, which
JHC Performance Report 38 30 January 2007

has the potential to be a very useful aid to single-beam hydrographic data processing, has now been ported to the Windows environment. Upgrades to TracEd include changes in the internal data structure to optimize operating speed, the addition of continuous display of the most current trace, the ability to display LIDAR data (see below), and the construction of interfaces for the ODOM and Innerspace 620 echosounders. The Lassoo tool which is used for comparing multivariate data sets to imagery data sets in both geographic and multivariate feature space has also undergone a number of upgrades including the development of a historical database for seafloor characterization and interfaces for the ODOM suite of sonars. MULTIBEAM AND INTERFEROMETRIC SONARS: We have made substantial progress in developing approaches to multibeam seafloor characterization on a number of fronts. These developments have been made using EM 300, 1000, 1002, 3000, 3002, and Reson 8101, 8111, 8160, 8125 and 7125, as well as Klein 5000 and 5410 data collected in support of the ONR, NSF, USGS, and Icelandic-sponsored programs, as well multibeam sonar data collected by NOAA and others in Portsmouth Harbor as part of the Shallow Water Survey 2001 “Common Data Set” (see previous progress reports), and NOAA data collected on the THOMAS JEFFERSON, the NANCY FOSTER, the RANIER and the FAIRWEATHER. With the availability of these data sets, much of our recent effort in terms of seafloor characterization has focused on the enhancing our ability to extract quantitative information from our sonars (through better processing and modeling) and improving our ground-truthing abilities.
If we are to use sonar backscatter data to correctly characterize seafloor properties, we want the backscatter that we measure to represent changes in the seafloor rather than instrumental changes or changes in the geometry of ensonification. While many system and geometric corrections are applied by the manufacturers in their data collection process, some are not (e.g. local slope), and for others, many questions remain about how and where they were applied (see discussion of Backscatter Processing above). As described in the Backscatter Processing section, we have been working closely with NOAA and the manufacturers to fully and quantitatively understand the nature of the backscatter data collected and to develop tools (Geocoder) that can properly make the needed adjustments to the data. Once such corrections are made the resulting backscatter should be much more representative of true sea floor variability and thus be an important contributor to efforts to remotely characterize the seafloor. ARA (formerly AVO) Analysis: The Geocoder software (which is designed to make fully corrected backscatter mosaics and calculate a number of backscatter statistics) has now been integrated with the ARA software package – also developed by Luciano Fonseca – which is designed to analyze the angular response of the backscatter as an approach to remote seafloor characterization. The ARA software has now implemented a fully constrained iterative inversion model that is based on both empirical data sets (Hamilton) and theoretical approaches (Jackson and Biot). There are many advantages derived from this integration, for instance, the prediction of the bottom type provided by the ARA can help remove the backscatter angular response, which is sediment specific, making it possible to assemble backscatter mosaics with fewer angular artifacts.
JHC Performance Report 39 30 January 2007

Additionally, the enhanced backscatter mosaics can be segmented based on texture and statistics, so that it will be possible to calculate an average angular response not just for a stack of consecutive pings, but also for a segmented region in the backscatter mosaic. Another benefit is that, with a certain number of assumptions mainly relating to backscatter offsets and beam pattern, the same ARA seafloor characterization can be applied to Simrad and Reson systems. The new data structure now makes it easier to extend the functionality of the backscatter mosaicking and analysis to other sonar systems. Fonseca has been working with Barbara Kraft and others to better understand the relationship of multibeam backscatter to seafloor properties in the well-controlled and easily accessible environment of Portsmouth Harbor, Great and Little Bays. This work, funded for the most part through ONR’s Geoclutter program has involved the establishment of a GIS-based database of all existing data in the region (existing data includes all the data collected in support of Shallow Survey 2001, as well as data collected as part of our Hydrographic Field Course), the reanalysis of multibeam sonar-derived backscatter data (particularly data from the Simrad EM3000 and 3002 sonar) to correct for true backscatter values (including local slope) and the calculation of ARA parameters. The development of this approach and its adoption is an important component of fisheries habitat mapping. This past year the concept of “theme analysis” was added to Geocoder and the ARA software. With that, average backscatter angular responses can be calculated for specified areas of the seafloor, referred as themes. Previously, analysis in Geocoder was limited to patches of stacked pings in the along-track direction. The average angular response of the theme, and not of the patch, can now be analyzed with the ARA tools, so that an estimate of the seafloor properties of an area can be calculated. Similarly, the average angular response of the theme, and not one along track moving average, can now be used to calculate the angle vs. gain (AVG) tables necessary to build an enhanced backscatter mosaic. With these new AVG tables, the mosaics show fewer artifacts in the along-track direction. The themes can be generated manually with image processing editing tools or can be generated automatically. For that, the theme areas are segmented and clustered directly in the angular response space, and not in the image textural space. A “blind” test of the ARA technique was done this year as part of a symposium on seafloor characterization held in Northern Ireland. Acoustic backscatter from a Simrad EM1002 survey of the Stanton Bank, Northern Ireland was analyzed using the ARA tools with no knowledge of the actual bottom type. The results were then compared to bottom photographs acquired in the same area last summer. The results were compiled in a GIS and showed very good correlation between the bottom type predicted by the ARA and that shown in the photos.
Ground-Truth Studies: In order to better understand the relationship between remotely measured sonar backscatter and the physical properties of the seafloor, we have also developed (with ONR funding) an instrument system designed to make in situ
JHC Performance Report 40 30 January 2007

measurements of sound-speed, sound attenuation, and resistivity (along with video of the seafloor -- ISSAP). In the past year, Barbara Kraft and Glenn McGillicuddy have calibrated the ISSAP transducers (to better understand the measurements made with them) and have written up results from Portsmouth Harbor, Little Bay and the New Jersey Margin. In the case of the Geoclutter work, ISSAP measurements have been compared with the ARA model predictions of Fonseca with very encouraging results (reported above). Graduate student Lorraine Robidoux is compared the results of ARA in Little Bay relative to another commercial seafloor characterization package (QTC-View); in support of this study, Robidoux and Armstrong took another set of ground-truth samples in Little Bay. Another exciting ground-truthing study has been the thesis work of graduate student Luis Soares-Rosa. Luis is looking the degree to which ARA can reduce the need for ground-truth sampling in regions where knowledge of the distribution of seafloor type is essential. His focus is on the Historic Area Remediation Site (HARS), a well-studied region of controlled disposal of hazardous waste and capping. This dataset is important because it provides a wide variety of sediment types ranging from clays to gravel in a relative small area along with a large amount of ground truth and multibeam data. The area was sampled with a wide range of methods (single beam, multibeam, side scan sonar, sub-bottom profiling, grab samples, corers, plan view and profile images) over eight years. This extended dataset allows understanding the sedimentary dynamics of this area and its evolution, which in turn influences the strategy for determining the need for new sediment sampling to fill existing gaps. A GIS has been built and correlations between the visual segmentation of the backscatter mosaic and sediment type were explored. There is a good correlation between grain size and backscatter but the lack of detailed analyses (only at the level of major fractions) only allows a cursory examination. A supervised sampling positioning scheme where sample position is adjusted within the uncertainty range to match the backscatter improves correlations between sediment properties and the backscatter, and allows evaluating if the uncertainty in the sediment sample position is a limiting factor in the correlation with the backscatter. Statistics were calculated for each group of backscatter values within the sample position uncertainty radius and when multimodal backscatter distribution occurred the sample was attributed to one of the modes and a new median was calculated for the backscatter. Amongst the ground-truth samples were Sediment Profile Imager (SPI) camera stations. This device recovers an image of a cross-section of the upper approximately 50 cm of the seafloor. Correlations between parameters determined from the SPI camera (Organism Sediment Index, roughness, major modal grain size, optical prism penetration) and the backscatter were also evaluated. There is a good correlation with the major modal grain size and the penetration of the optical prism but no correlation could be observed with other parameters. In turn, a correlation between grain size determined from sediment samples and estimated from photographs couldn’t be observed due to the lack of detailed grain size analyses.
JHC Performance Report 41 30 January 2007

The collection of new sediment samples and SPI images in August 2006 (with grain size analysis in 0.5 phi steps) roughly at the same time as a new multibeam survey will allow for a better correlation between backscatter and grain size and also the determination of to what extent grain size extracted from profile images is a reliable parameter. Sediment analyses are underway. When these are complete, the ARA analyses will be done and the results compared with the grain size analysis and SPI images. The ARA model will be applied in the standard mode with a fixed number of pings over the entire swath of each multibeam line and also in the supervised segmentation mode (described above), where the mosaic is first segmented in classes and then the ARA model is applied for the each segmented theme independently. LIDAR Waveform Analysis: Finally, we continue our efforts to explore the potential of LIDAR data as a means to characterize the shallow coastal seafloor. Shachack Peeri who has recently been promoted to Research Scientist has led this effort which has included the investigation of the use of special characteristics of the Raman waveform for the robust identification of returns from very shallow waveforms. Peeri has noticed that in very shallow water, the head and rise of the waveform shape are the same as the basic Raman waveform, but along with a decrease in the digital number values of the tail and the fall, the peak shifts toward the head of the waveform and decreases. In support of this research as well is in support of the upcoming Shallow Survey 2008 Conference (see below), we have, in collaboration with NOAA, the Army Corps of Engineers, and our industrial partners LADS/TENIX, collected three new LIDAR datasets in the Portsmouth Harbor region. These data sets include SHOALS 1000, SHOALS 3000 and LADS II data and will play an important role in future study exploring the capabilities of LIDAR as a hydrographic tool. Also in support of this research, a LIDAR simulator project has been initiated. The objective of this study is to simulate both a bathymetric LIDAR system and the realistic environmental factors that might be present in various coastal areas. By conducting this study in a laboratory environment, the relative importance of the various scattering components on LIDAR waveforms can be investigated individually. It is important to note that this study is focusing on both the elastic (Mie) and inelastic (Raman and fluorescence) scattering regimes and the ability to leverage the excitation of the different scattering phenomena. This research will provide the basis for using airborne LIDAR systems to make quantitative measurements of a variety of environmental factors in the coastal areas in addition to the bathymetry. The first step of this study is configuring the LIDAR simulator. At the moment we are using a surplus Copper Vapor Laser (511 nm) that that is similar to but is not precisely the 532 nm Nd: YAG green laser used for bathymetric applications. To date, we have conditioned the laser and conducted two feasibility tests. These tests aid us in understanding what types of instrumentation are needed and the configurations needed for each type of experiment. The preliminary results of the tests show that the spreading of laser beam through the very clear water is linear and that the tank’s bottom scatters light in a manner that upwelling was not noticed by the naked eye. When placing a mirror on the tank’s bottom, the upwelling radiation was visible. The laser beam was captured
JHC Performance Report 42 30 January 2007

by two cameras: an in situ video camera and an 8-bit digital camera that captured the laser beam through side windows of the tank. VIDEO/PHOTO IMAGE MOSAICKING AND QUANTIFICATION: The Hubbard Camera: Yuri Rzhanov, Lloyd Huff, and graduate student Fan Gu have been quite active in the collection of seafloor video data as well as in developing sophisticated algorithms for processing these data. Huff has been particularly active with the development of the “Hubbard Camera” a towed video camera system with a diesel-powered stand-alone winch, which has become a vital part of seabed studies conducted by the UNH Marine Programs, including the Joint Hydrographic Center. Improvements of the Hubbard Camera for 2006 included frosting the inside of the glass ports on the strobe light housings and a total mechanical checkup of the system. A modified attachment bridle was designed and constructed for use when the camera is used in proximity to the cages of the Open Ocean Aquaculture site. The at-sea performance of the modified attachment bridle was as expected. The frosting of the glass ports improved the uniformity of the illumination that is cast on to the seabed; however it is still necessary to employ a diffuse filter to control the intensity of the illumination. In an effort to increase the utility of the Hubbard Camera winch subsystem, a specialized cable coupling was designed that will allow the Klein 5410 Side Scan Sonar to be operated through the Hubbard Camera electromechanical cable and winch. The required materials for the design have been purchased and the cable coupling will be completed in January and field tested in March 2007. Video mosaics and image processing: Yuri Rzhanov has continued the development and application of mosaicking algorithms including porting them to the Windows environment. He has completed the development of software for the global alignment of multiple images in a single mosaic. This software has been used to process still imagery from Alvin dives (Rosebud area) and hand-held video from the Morocco coast (with Lloyd Huff). NSF has funded its further development into a product called ALVIMOS. The use of ALVINMOS was demonstrated to potential users at Woods Hole Oceanographic and the suite of programs was tested in the field on R/V Atlantis cruise 15-12). A User Manual has been written and left on board the vessel (with all the software). Major re-write of the library for acquiring frames from DV-compatible tape player. Upgrades in the software include the development of a generic library for polygon clipping that can be used to determine overlap between frames for the application of graph-cut blending. The polygon-based approach allows for the determination of a minimal set of images required to create a mosaic. Additionally the co-registration of image frames has been improved. It is now to obtain robust registration even when overlap between images is less than 50% of the total area (up to 35%). Finally, the software now produces fully georeferenced output images. Our mosaicking efforts have continued to support the NOAA Ocean Exploration and Sanctuaries programs through our work creating mosaics for the “USS Macon” project and for the “Monitor” project (Dwight Coleman and James Moore - University of
JHC Performance Report 43 30 January 2007

Rhode Island). Initial results were impressive enough to request that we now extract all the imagery from the tapes in DVCAM format and attempt to create a single large mosaic for the “Monitor” site. Our mosaicking work has also supported cooperative research with NMFS and other habitat mapping efforts including those of Bob McConneughey - NOAA Pacific Fisheries. Their groups are now routinely creating mosaics from the seafloor imagery using our video mosaicking software. Other habitat-related projects we have worked on include those with Steve Intelmann, habitat mapping specialist, NOAA, Olympic Coast Sanctuary, WA, and Scott Ferguson and John Rooney (NOAA Pacific Fisheries, Hawaii) where mosaics were created from laser line scan data collected during their western Pacific cruise in October 2006. Research also continues in the stereo reconstruction for seafloor roughness estimation: establishing the dependencies between the scene characteristics and highest spatial frequency that can be resolved by the stereopsis technique (with graduate student Anton Mamaenko) and the investigation of optimal blending algorithms for mosaic creation – feathering, graph-cut, quilting, gradient domain stitching (with graduate student Fan Gu). Fan Gu is also investigating quantitative approaches to estimating mosaic quality either by matching the trend of individual frames to the trend of the corresponding frames back-projected from the median mosaic or by extracting a set of matching features from overlapping individual frames and warping the frames to force the collocation of the features. The results of these efforts will be reported in the theses of Gu and Mamaenko. DATA MANAGEMENT: With the arrival of Jim Case as our full-time data manager, we have begun a serious effort at organizing our data holdings and making them accessible both to internal and external users. Since his arrival Jim has evaluated the hardware and software data infrastructure at the Center. A data management scheme has been designed and in support of this restructure, two new data servers have been purchased. In concert with the data management restructuring, Case and Calder are working on a “Knowledge Repository” database concept that will attempt to capture “expert opinion” form Center domain experts on relevant information in any particular field.
The primary focus of this effort has been developing code and procedures to support the mass migration of data from various locally-attached storage servers to a new Storage Attached Network (SAN – see facilities discussion). The key features of the system are automatic discovery and cataloging of data files by project, the harvesting of metadata whenever possible from well-known data files and the storage of all of the above in a data management schema within Oracle. All new code written for this project is either in C, C++ or C#. C# is being used as the wrapper for all legacy code and the language for all new code related to data management, metadata or Oracle I/O. A pilot project focused on the Portsmouth harbor region was initiated in July. A major component of the project was the development of a Center portal by which all data would be discovered by the users. The technology chosen was Oracle Portal because it is tightly integrated with the data and metadata catalogs and has embedded Web Mapping
JHC Performance Report 44 30 January 2007

technology that leverages the Oracle Spatial data warehoused in the system. Another pilot project was initiated in October in which the USUNCLOS survey metadata is being harvested from OMG-created “merged” files for inclusion in the Center metadata warehouse before being exported for archival at NGDC. This will demonstrate another method for data management and metadata building where the metadata records are built post-survey. It is important to note that field-level metadata was generated during the cruises; however, it does not match the post-processed data files. The majority of the field-level metadata will be reused in the master database template. The procedures and software used to build this post-survey metadata will be used in the field on the next USUNCLOS cruise to minimize the delay of transferring archival data to NGDC.
NEW PROJECTS: The Center tries to be as responsive as possible to national needs and thus we begin new projects that go beyond the scope of our initial themes as the need demands. Several of these new efforts are currently underway: Law of the Sea: Growing recognition that implementation of United Nations Convention on the Law of the Sea Article 76 could confer jurisdiction and management authority over large (and potentially resource-rich) areas of the seabed beyond our current 200 nautical mile (nmi) limit has renewed interest in the potential for a U.S. submission. In this context, Congress (through NOAA) funded the University of New Hampshire’s Joint Hydrographic Center to evaluate the content and completeness of the nation’s bathymetric and geophysical data holdings in areas surrounding the nation’s EEZ with emphasis on assuring their usefulness for substantiating the extension of resource or other national jurisdictions beyond the present 200 nmi limit. The initial portion of this complex study was carried out in less than 6 months and a report submitted to Congress on 31 May 2002 (http://www.ccom.unh.edu). Following up on the recommendations made in the UNH study, Congress funded the Center (through NOAA) to collect new multibeam sonar data for research purposes and that might also support a potential submission under UNCLOS Article 76. In 2003, Center staff participated in two separate cruises. For the first cruise, under the supervision of Dr. Jim Gardner, NOAA contracted with Thales GeoSolutions Inc. to perform the surveys of portions of Bowers Ridge and the Beringian margin that may be claimed for an extension of US territory and a second cruise focused the Chukchi Cap in the high Arctic where permanent ice cover makes the collection of detailed bathymetry very difficult. Summaries of these cruises were presented in the 2003 progress report. In 2004 we returned to the Chukchi Cap and, under very difficult ice conditions mapped another 100 nm of the 2500 m contour as well as a 4500 nmi region of the margin off Barrow Alaska. We also began mapping of the continental margin off the east coast of the U.S., covering approximately 38,000 sq nm in about 60 days of surveying. Details of these surveys can be found in last year’s progress report and at http://www.ccom.unh.edu.
JHC Performance Report 45 30 January 2007

In 2005, we conducted two more Law of the Sea cruises, one representing the completion of our work off the east coast of the U.S (two legs) and the other in the Gulf of Alaska (two legs). The survey work off the U.S. east coast took place on the NAVO vessel USNS Pathfinder, a 329-ft, 5000 ton vessel equipped with a hull-mounted Kongsberg Simrad EM121A multibeam sonar, under the supervision of Dr. Jim Gardner. In addition to the multibeam sonar, the Pathfinder, also carried an ODEC Bathy2000 3.5-kHz chirp sub-bottom profiler and a BGM-5 Bell Gravity Meter. NAVOCEANO was responsible for system calibration, data collection and quality control and overall cruise management whereas Science Applications International Corp. (SAIC) was contracted by NOAA to perform bathymetry processing aboard ship. The overall responsibility of cruise planning, both before and during the cruises, as well as processing MBES acoustic backscatter and 3.5-kHz profiler data were the responsibilities of the UNH/NOAA representative aboard ship. The Atlantic Margin surveys were a continuation of the work (3 legs) completed in 2004 year covering the northern segment of the Atlantic Margin (see last year’s progress report). The first leg of this year’s operations (Leg 4) required a half-day transit to an area mapped in 2004 to perform a patch test prior to mapping operations. A patch test (exclusive of a yaw calibration) was performed in this area and was followed by 31 days of mapping the margin from the point left off in 2004 towards the south. Leg 4 was completed on May 23, 2005 and the ship transited to Charleston, SC for re-supply and a crew change. Leg 4 collected 6423 line km of MBES and 3.5-kHz profiler lines and mapped a total area of ~22,500 nm2. Data collected on Leg 5 have been classified by the U.S. Navy and are not publicly available at this time. The second 2005 Law of the Sea cruise brought us to the Gulf of Alaska. NOAA contracted through NSF-UNOLS (National Science Foundation University National Oceanographic Laboratory System) with the University of Hawaii to conduct the Gulf of Alaska mapping using the 186-ft, 3060-ton RV Kilo Moana, a SWATH (small water area twin hull) vessel with a hull-mounted Kongsberg Simrad EM120 MBES as well as a Knudsen 320 B/R 3.5-kHz chirp sub-bottom profiler and a Carson gravimeter. The planned schedule for the cruise called for 2 legs of approximately 30 days of operations each. The University of Hawaii's Hawaii Mapping Research Group was responsible for systems calibrations, data collection and quality control and overall cruise management whereas the UNH group was responsible for bathymetry, acoustic-backscatter and 3.5-kHz processing. Gravity data were collected and processed by the University of Hawaii group. The first leg of operations required a 7.5-day, 4200 km, transit from Honolulu, HI to an area ~70 km NW of Bowie Seamount. A complete patch test was performed in this area and then the mapping commenced with a dip line run up the margin in the southern portion of the area. Twenty-five days of continuous mapping the margin from south to north followed the patch test. Mapping during Leg 1 was halted on July 27, 2005 and the ship transited to Kodiak, AK for a scheduled re-supply and a crew change. Leg 1 collected 18,135 line km of MBES and 3.5-kHz profiler lines and mapped a total area of 47,586 nm2. Leg 2 of the survey departed Kodiak, AK on August 2, 2005 and collected
JHC Performance Report 46 30 January 2007
8745 line km of MBES and 3.5-kHz profiler lines and mapped a total area of 46,138 nm2. Leg 2 of the survey was completed on August 24, 2005 and the ship transited back to Honolulu, HI. The cruise mapped a total of 93,724 nm2 in 42 days, with an average speed of 10 kts. In 2006 three more Law of the Sea cruises were scheduled: the continuation of our Arctic work on the Chukchi Cap, a cruise in the Gulf of Mexico, and the beginning our work in the western Pacific. Unfortunately a tragic diving accident on board the USCG HEALY led to the ship’s return to Seattle and cancellation of the mission before the completion of the 2006 field season leading to the cancellation of our 2006 Arctic Law of the Sea cruise. This cruise has been rescheduled for the summer of 2007. Additionally, equipment problems with the vessel scheduled to do the Gulf of Mexico work have led to the postponement of that cruise to April 2007. We did, however, begin our work in the Western Pacific with the mapping of the western slope of the West Mariana Ridge. The survey work off the Marinas took place on the NAVO vessel USNS Bowditch, a 329-ft, 5000 ton vessel equipped with a hull-mounted Kongsberg Simrad EM121A multibeam sonar, under the supervision of Dr. Jim Gardner. In addition to the multibeam sonar, the Bowditch, also carried a Knudsen 3.5-kHz chirp sub-bottom profiler and a BGM-5 Bell Gravity Meter. NAVOCEANO was responsible for system calibration, data collection and quality control and overall cruise management. The overall responsibility of cruise planning, both before and during the cruises, as well as processing MBES acoustic backscatter and 3.5-kHz profiler data were the responsibilities of the UNH/NOAA representative aboard ship. In the course of 30 days at sea, approximately 27,000 nm2 of MBES data were collected representing approximately have of the area to be mapped in this region. These cruises have not only provided data that will, unquestionably, add significant territory to the juridical continental shelf should the U.S. choose to file a submission under UNCLOS Article 76, but from a scientific perspective they have provided tremendous new insights into the nature of continental margin processes. These data sets will be an invaluable addition to our fundamental understanding of marine processes and have already become the focus of several student theses. Details of all of these cruises can be found at: http://www.ccom.unh.edu/unclos.htm
Electronic Chart of the Future: In FY2003, we began our “Chart of the Future” an evolution of the Navigation Surface concept that also takes advantage of our expertise in visualization. We are taking a two-pronged approach at trying to define the electronic chart of the future. One track is an evolutionary approach to see how additional, non-standard layers (i.e. the navigation surface bathymetric grid, real-time tide information, etc.) can be added to existing electronic charts. This approach requires careful attention to present day standards and the very restrictive constraints of today’s electronic charts. This work is being done in conjunction with the standards committees (represented by Center faculty member Lee Alexander) and the electronic chart manufacturers and is intended to provide short-term solutions for the need to see updated electronic charts. In concert with this evolutionary development we also have embarked on a revolutionary development with researchers in
JHC Performance Report 47 30 January 2007

our Visualization Lab exploring new paradigms in electronic chart design, unconstrained by existing standards or concepts. This exercise is taking full advantage of the psychology-based human-computer interaction expertise of our visualization researchers to explore optimal designs for displays, the role of 3-D, flow-visualization, stereo, multiple windows, etc. From this research we hope to establish a new approach to electronic charts that will set the standards for the future. Throughout this project (both the evolutionary and revolutionary efforts) our experienced NOAA mariners are playing a key role, ensuring that everything that is developed will be useful and functional. Evolutionary: Within the context of the “evolutionary” approach Lee Alexander and former student NOAA, LCDR. Rick Brennan are working in collaboration with industrial consortium member 7C’s and CARIS to investigate various tools and processing steps required to use the Navigation Surface database to produce a high-density bathymetric ENC. A “Next Generation” ENC (IHO S-57 data incorporating x, y, z, and time) was compiled from past/new hydrographic surveys of the Thimble Shoals Channel in the Port of Norfolk/Hampton Roads. Produced by SevenCs in conjunction with the Industrial Consortium Agreement with CCOM, this dataset was tested at the ECDIS Lab at the University of Southern Mississippi in several ECDIS and ECS. Recommendations for an ENC Product Specification under the future IHO S-100 have been submitted to the IHO TSMAD Working Group. Various options are being considered as to the best means to integrate a tidal model into a “Tide Aware ENC.” In particular is the Tidal Constituent and Residual Interpolation (TCARI) model described in Rich Brennan’s MS Thesis. A related effort is how best to provide time-varying information (e.g., tidal/water level information) to underway vessels via shore-based AIS transponders. This will be based on Kurt Schwehr’s work on developing a format for using XML (Extensible Markup Language) to define the binary content of AIS message (see below). When used with forecast or real-time information, these “Next Generation” ENC using AIS input will be capable of displaying time-variant water levels, current flow, and other tactical or marine information object (MIO) information required both for voyage planning and tactical decision-support. CCOM-JHC will participate in the Elizabeth River Demonstration Project is will be held in conjunction with the 2007 US Hydro Conference in Norfolk, VA. Both “Tide Aware ENC” and the “Chart-of-the-Future” will be demonstrated. The goal is to inform maritime users on the capability/limitations of existing electronic charting systems, and enlighten them about new functional capabilities/innovative developments. Finally, under the theme of the ‘evolutionary’ ENC of the Future is Lee Alexander’s separately funded work with Office of Coast Survey on a project to convert existing Coral Reef habitat data into a suitable format for use as Marine Information Objects (MIOs) with ENCs in ECDIS and ECS. A key focus is to develop new IHO S-57 objects/attributes for biological and regulatory criteria associated with coral reef designation and management. Of particular importance is the display of Particularly
JHC Performance Report 48 30 January 2007

Sensitive Sea Areas (PSSAs) on electronic charts as mandated by the International Maritime Organization (IMO). Revolutionary: Within the context of the “revolutionary” effort, Colin Ware, Kurt Schwehr, Matt Plumlee, Roland Arsenault and Matt Quinn have been extending the capabilities of GeoZui4D (as described above) as well as developing specific applications for the chart of the future. The GeoZui4D version that has become the base for the Chart of the Future project is now called GeoNav4D. Many of the new capabilities were described past reports (and in the description of the flow visualization above). With the arrival of Kurt Schwehr, the Chart of the Future project has undergone a re-evaluation in terms of the immediate focus being taken. During the past few years, the Center has demonstrated a number of charting components that have gained wide notice. For example, these pieces include: • Path planning with time dynamic depth contours for safe, caution, and grounding • Haptic perception of bathymetry • Pseudo-photo realistic renderings with billboards and 360 disk panorama models • Basic ship position decoding from AIS messages • Tide based flow modeling • Multi-ship and marine mammal coordinated displays • Multiple view coordination • Analysis of a predictor for ship behavior to assist novice ship drivers The Center has met with NOAA, the USCG RDC, and the British Admiralty to start evaluating the components separately and in concert for possible test scenarios. As discussed in the previous year’s reports, the Center is working with NOAA on a showcase/demonstration project in the Port of Norfolk/Hampton Roads, VA. The target date is a presentation in conjunction with the US Hydro Conference in Norfolk in spring, 2007. The Center will be deploying an AIS logging station to the area along with processing and correlating the data products for the site. The goal is to show the best possible scenarios with today’s technology when all data types are present and integrated which currently not the case for any port area within the continental US. For the Chart of The Future project, Kurt Schwehr has embarked on an analysis of ship behavior and accidents. Initial work has established logging of the national Automatic Identification System (AIS) network created by the USCG Research and Development Center. This data can then be correlated with incidents and provide specific instances of ship behavior. To complement this data stream, the Center is looking at events listed in reports compiled by the USCG MISLE Marine Casualty database. The Center has developed additional expertise with AIS by deploying an initial AIS receive-only station in Portsmouth, NH for several months along with installing a SOLAS class RM808 AIS unit provided by our industrial consortium partner L3/Klein. In the future, the Center will deploy AIS stations as needed based on coverage holes in the USCG AIS network.
JHC Performance Report 49 30 January 2007

Specification Format for AIS Binary Messages: Kurt Schwehr is working on a technique for using XML (Extensible Markup Language) to define the binary content for maritime-based AIS (Automatic Identification System) messages. He has proposed a Draft Specification Format that will enable hydrographic and maritime safety agencies to define message contents by providing a bit level description in XML. With this format, it will be possible to more clearly specify messages to software engineers implementing communication systems dealing with AIS-related traffic. Along with the XML specification, the draft specification provides a sample implementation of code to generate a sample encoder/decoder of AIS binary message payloads (informally known as the "AIS Binary Decoder Ring"). Although the XML message definition file specifies the order, size, and type of the bit stream, it does not specify semantics or how binary messages should be presented on an ECDIS or other display device. An XML schema and an additional program will provide validation of the XML message definitions. There are number of benefits of developing this format. The specification is intended to be both human and machine-readable. With the addition of test messages both in binary and decoded form, the format will allow automated testing and validation of implementations based on the specification. The XML file provides specification of the order of fields, length of fields, and type of fields. To enable some amount of data compression, message definitions can specify the scaling and offsets to be applied to the field between the application and the AIS network layer (following a subset of that used by the ITU-R.M.1371-1). To reduce issues with accidents and errors caused by miscommunication (e.g., the Mars Climate Orbiter loss in 1999), all units will be declared for the numerical values resulting after removing scaling and offsets. The specification will be independent of programming language (e.g., can be implemented in C, C++, Java, Python) to allow vendors to integrate the system into their individual design requirements. Additionally, implementations may optionally allow a parser to directly use the XML specification rather than code that is based on the specification. This will allow mission critical applications to be upgraded without down time, just by loading the new version of the specification file. Elizabeth River / Hampton Roads demonstration: Kurt Schwehr began working on the Elizabeth River / Hampton Roads demonstration project with NOAA HSTP and NOAA CO-OPS. The projects goals are to pull tide data from the CO-OPS SOAP web server and turn them into Automatic Identification System (AIS) binary messages, transmit them locally from an a AIS transmitter to a simulated bridge at U.S. Hydro 2007 Conference. Once the messages are received by a bridge computer, TCARI will rebuild the water levels for the Hampton Roads area and display the updates in Pydro. To date, the project has started parsing the water level messages from the SOAP server and can generate a draft form of the message using the XML AIS Binary Message format described above. Google Earth for Marine Users: Kurt Schwehr has started working on tools for processing marine data into usable Google Earth visualizations to support planning and data processing tasks at NOAA, CCOM, and
JHC Performance Report 50 30 January 2007

SIO. Initial work has produced AIS time based visualizations, USCG MISLE incident database, and with Briana Sullivan and Jim Gardner, images of multibeam data products. On a November 2006 on board the R/V Revelle, Schwehr demonstrated near automatic generation of cruise tracks and draft multibeam processing using rough MB System output. Future work will look at more optimized workflows using Fledermaus and Caris. MID-WATER MAPPING: One of the most exciting advances of this year has been our adaptation of a new generation of multibeam sonars to allow real-time visualization of targets in the water column. Visualization of these mid-water targets is just the first step as we hope to also extract quantitative information from these returns that can then be used in fisheries and other applications. The focus of this project, led by Tom Weber, has been the visualization of four dimensional data (3 spatial dimensions plus time) in GeoZui through software development by Brian Locke and Roland Arsenault. Additional formatting and analysis code is being developed in “Matlab” by Weber. In June 2006 roughly 500 Gbytes of data on were collected on Cashes Ledge in the Gulf of Maine using a Reson 7125 MBES. This area is thought to be important for juvenile cod, and one of the objectives of surveying the site was to collect mid-water multibeam data that could be used to investigate kelp coverage. During this survey, several fish schools were also observed in the mid-water multibeam data. Both the kelp and fish data will be valuable tools for refining some of the data extraction tools that will be used as the front end to the visualization in GeoZui. This project was undertaken as a subcontract to the Gulf of Maine Research Institute, who paid for rental equipment, survey vessel, and at least part of Weber’s time. In Sept.-Oct. 2006 Weber participated in a multi-institution cruise on Georges Bank in an effort to assess Atlantic herring stocks. Reson loaned the project a 7125, which was mounted on the R/V Hugh Sharp. During this cruise multiple herring schools were imaged with the 7125, one of which is shown on the right (this image created in MATLAB, shows surface of constant backscatter amplitude, a proxy for fish density in this particular case). Colleagues from Norway collected multi-frequency EK60 data at the same time, providing confirmation that the school was herring. This data set shows much promise. To date, it has been used to refine the fish detection algorithm (this is currently being transitioned to MbFish). It is also serving as a testbed for visualization techniques, using both GeoZui4D and other platforms.
JHC Performance Report 51 30 January 2007

The next stage in the development of this project is the application of statistical tools for counting fish using high resolution multibeam backscatter. This method, which was originally applied to counting fish using single beam echo sounders, differs from the more traditional echo integration methods in that it does not require absolute target strengths and is insensitive to target orientation. The method is essentially based on the scintillation of backscatter from fish and shows much promise for high resolution echo sounding sonars, including most multibeam sonars. It is hoped that the Georges Bank herring data (both 7125 and EK60) can be used to test this methodology. AUV WORK AND THE HARBOR TRACKING AND OBSERVATORY PROJECT: In our ongoing effort to explore new approaches to collect hydrographic and other data in critical shallow water environments, we have begun to explore the applicability of using a small Autonomous Underwater Vehicle for collecting critical bathymetric and other data. We have teamed with Art Trembanis of the University of Delaware to obtain use of his FETCH 3 vehicle. We have purchased and integrated small multibeam sonar (Imagenix Delta-T) into this AUV and have begun to explore its applicability for collecting both hydrographic quality bathymetric data and seafloor characterization data. At this point in time we have only had a several days of interaction with the vehicle but we are now in the process of calibrating the sonar and developing control and visualization software for the vehicle. In support of this effort as well as to provide a permanent ability to accurately position this (or any other) AUV as well as cameras, samplers and other devices we have begun a project designed to install a fixed acoustic navigation array in a portion of Portsmouth Harbor. When fully functional, this positioning system may also provide the ability to passively listen to ship-traffic in the harbor as well as to monitor changes in the physical oceanography of the harbor. We have called this component of the project the “Harbor Observatory Project.” Our effort this year has been two-pronged: 1) conducting a study to evaluate COTS hardware for accomplishing this task and 2) developing a home-grown proof-of-concept system. So far our discussions with commercial vendors have led us to believe that there is not a simple COTS solution and thus most of our effort has been focused on developing the proof-of-concept system. This system, whose development is under the supervision of Tom Weber (with collaboration from McGillicuddy, Huff, Weirathmueller, Schmidt, Calder and Mayer) is based on a bearing-bearing system and is essentially a hybrid between an ultra-short baseline system and a long baseline system. We have built a proof-of-concept system (including design and construction of preamps, assembly of hydrophone system, and integration with a data acquisition system) that demonstrates a remarkably accurate bearing measuring capability (σθ ~ 0.1°) in tank testing. A field test of this system (conducted with the help of the Coastal Surveyor and Ben Smith, Michelle Weirathmueller, Val Schmidt, Andy McLeod, and Kurt Schwehr) was conducted in August at the old Coast Guard pier in Portsmouth Harbor. Although data analysis from this experiment is still underway, initial results show that the system
JHC Performance Report 52 30 January 2007

worked reasonable well. That is, it was able to track a pinger located on the Coastal Surveyor. A prototype system is currently being built (it is 90% complete as of Dec 14) for a semi-permanent installation near Portsmouth Harbor Light. This system is a remote data logging sensor located at the end of a 1000’ cable, and has presented some design challenges which appear to have been successfully overcome (the hardware development has mainly been conducted by Glenn McGillicuddy and myself, with contributions from Lloyd Huff, Larry Mayer, Val Schmidt, and Brian Calder). This system is scheduled to be deployed in mid-January 2007, and we are currently on schedule (note that the development for this system – including the micro-controller selection/programming, the interface design between the micro-controller data acquisition and the home-built preamplifiers with selectable gain stages, the communications protocol between the wet-end and the top-side computer, the mount and pressure housings, etc. – essentially began in the end of October 2006, which is a very fast build-up). Spring-time testing is expected to help us determine whether or not the system can be used in Portsmouth harbor for long-range (order 1 km) tracking. If the answer is yes, an accelerated build-up of at least two more systems is expected, with a target installation date of August 2007. In addition to constructing the proof-of-concept and prototype systems, graduate student Michelle Weirathmueller is making great contributions in the analysis and further development of the harbor tracking system. It is also important to note that this project is generally described as the Harbor Observatory project (as opposed to the Harbor Tracking project) in anticipation of various shallow water tomographic-type experiments that will be conducted with this system once it is installed. It is expected that this project will open the doors for a wide variety of other research. OTHER TIDBITS: The Center has also made progress in several other areas that do not necessarily fall into one of the above categories, but that deserve reporting: Tele-presence Console – Real-time Remote processing of Multibeam Sonar Data: In collaboration with Robert Ballard’s Institute for Exploration, the University of Rhode Island, and NOAA’s Ocean Exploration Office, the Center has installed a “telepresence console” which allowed us full two-way high-bandwidth communication (both video and audio) with vessels offshore and other scientists around the country. Multiple high-definition video screens allow an immersive experience for all involved. In 2005 we participated, with the University of Washington in an exploration of the “Lost City” carried out on board the NOAA ship Ron Brown. During this expedition, the chief scientist and most of the scientific party were at the University of Washington (with a similar telepresence console) with UNH providing multibeam sonar processing and data visualization support. A dedicated satellite link plus internet-II connectivity allowed multibeam data to be transferred to UNH where it was processed in a few minutes and returned to the survey vessel as processed 3-D objects. In addition, based on navigation
JHC Performance Report 53 30 January 2007

provided from the survey vessel we were able to position the ROV’s in the context of the 3-D bathymetry. This effort went on for almost two weeks with a regular watch schedule maintained by all centers (i.e., there was someone on watch at all times). Interspersed with the scientific efforts were a number of broadcasts aimed at a much wider audience. This past year we participated (through telepresence) in an NOAA Ocean Exploration-sponsored expedition to the Black Sea and the Aegean. The ramifications for this sort of facility are manifest. Not only does this open up many new opportunities for shore-based scientists to participate in sea-going programs it also has a tremendous outreach component as groups can be brought in (or the video transferred) to share the real-time exploration experience. Most importantly, from a NOAA perspective, it opens up the opportunity for providing real-time support for sea-going programs where a processing (or other) problem arises. Data can be transferred back to shore-based experts, evaluated and feed back provided to the vessel with minimal delay. Training: In addition to the formal training for NOAA and non-NOAA personnel done at the Center, Center staff have also been called upon to provide training or input for a number of groups and organizations within NOAA (e.g., Calder called upon to provide input at the Field Procedures Workshop, Alexander called upon for input to many organizations on ENC standards; IHO held its Open ECDIS forum at the Center, Rzhanov asked to give workshops on imagery mosaicking, Fonseca asked to give workshops on sonar mosaicking, Open NAV Surface meeting at the Center, etc.). Outreach: We have formalized our outreach activities (with the addition of Briana Sullivan to the staff) and are actively working to increase the usefulness of our website (http://www.ccom.unh.edu) as well as develop museum displays (see visualization section above), and materials and programs that will help share the results of our efforts with the broader community. We have hosted a number of community groups (high-school students, marine docents, etc.) and the activities of the Center have, this year, been featured in many other international (and local) media outlets. PARTNERSHIPS AND ANCILLARY PROGRAMS: One of the goals of the JHC is, through its partner organization, the Center for Coastal and Ocean Mapping, to establish collaborative arrangements with private sector and other government organizations. Our involvement with Tyco has been instrumental in the University securing a 5 million dollar endowment; 1 million dollars of this endowment has been earmarked for support of post-doctoral fellows at the Center for Coastal and Ocean Mapping. Our interaction with the private sector has been formalized into an Industrial Associates Program that is continually growing. At present members of the Industrial Associates Program are:
JHC Performance Report 54 30 January 2007
• Benthos • C&C Technologies • CARIS Inc. • ENL • Fugro • GeoAcoustics • HyPACK • IFREMER • IVS-3D Inc. • Kongsberg Simrad • L3/Klein Associates • ODOM • Reson • SAIC • Sonartech Atlas • SevenC’s • QPS • QinetiQ • Quester Tangent • QinSy • SonarTech Atlas • TENIX/LADS • Triton-Elics • Tyco
In addition, grants are in place with the Office of Naval Research, The Naval Research Lab, The Naval Oceanographic Office, IEEE, The National Science Foundation, Fugro, The Nippon Foundation, CICEET and the U.S. Geological Survey (see Appendix E). The USGS supports collaborative projects involving multibeam sonar mapping as well as a post-doctoral fellow at the Center. Funding beyond this grant this past year is on the order of $719K from a total commitment from other sources of approximately $2.45M (see Appendix D).
JHC Performance Report 55 30 January 2007

APPENDIX A: Coastal Surveyor R/V Coastal Surveyor - The Coastal Surveyor is a purpose built vessel designed specifically for coastal multibeam hydrography. It is integrated with a robust, motor-driven ram system that provides and ideal mount for a range of multibeam and other sonar systems. The vessel incorporates an active roll stabilization feature to limit vessel motions detrimental to multibeam operations. Dimensions: 40’ x 12’ x 3.7’ USCG: Designated Research Vessel, subchapter “C” Flag: U.S. Registry: U.S. Coastwise and Registry Official Number: 999206 Tonnage: 16 GRT 11 DWT Lab space: 9’ x 11’ 6’ x 10’ Speed: 10 knots Minimum speed for full Roll stabilization: 5 knots Minimum survey speed: 2.5 knots Propulsion: 1 x Cat 3116; 205 shp cont.”A”; 2.57:1 reduction Auxiliary: 1 x Isuzu/Lima 20 kw; 240/120 V; 60 Hz; Power distribution: 38 ea. 115 volt receptacles 2 ea. 230 volt receptacles 1 ea. 12 volt receptacles 7 ea. 24 volt receptacles Fuel capacity: 400 gallons Potable water: 60 U.S. gallons Roll stabilization: Niad 173 active fins Loran: Micrologic Mariner DGPS: Magellan 1200XL GPS w/ Magellan 19019 DBR Magnetic compass: Ritchie 5” Fluxgate compass: Robertson RFC 300 Radar: Furuno 1930 Depth sounder: Standard DS 50/ODOM Autopilot: Robertson AP 300DL VHF: Standard Omni 25 watt Side Band: Sea 222 Cellular phone: Motorola 5 watt Air conditioning: 3 x 1.25 tons Heating: 3 x 16,000 BTU
JHC Performance Report 56 30 January 2007

Weather Tolerance: Multibeam: Beaufort 6; SS3 Sidescan: Beaufort 5; SS2
Major Projects on Coastal Surveyor in 2006:
Installation and testing of SOLUS-grade AIS system as part of Chart of Future. Project – interfaced with POS-MV and C-NAV, IP and port logger was developed for time stamping and comparison of messages.
Summer Hydro Field Camp-data acquisition in support of LIDAR study. Isle of Shoals survey in support of LIDAR study. Ocean Measurements Class training for graduate student research projects. Harbor Tracking and Observatory Project. WASSP Multibeam trials. Seamanship Class training for graduate student research projects. Benthos C3D trials.
JHC Performance Report 57 30 January 2007

APPENDIX B: Graduate Degrees in Ocean Mapping
The University of New Hampshire offers Ocean Mapping options on the Master of Science and Doctor of Philosophy degrees in Ocean Engineering and in Earth Sciences. These interdisciplinary degree programs are provided through the Center and the respective academic departments of the College of Engineering and Physical Sciences. The University has been awarded recognition as a Category A hydrographic education program by the International Federation of Surveyors (FIG)/International Hydrographic Organization (IHO).Requirements for the Ph.D. in Earth Sciences and Engineering are described in the respective sections of the UNH Graduate School catalog. M.S. degree requirements are described below. Requirements for Master of Science in Ocean Engineering Ocean Mapping Option: Core Requirements: Credit hours ESCI 858, Physical Oceanography 3 OE 990, 991, Ocean Engineering Seminar I, II 1,1 OE 810, Ocean Measurements Lab 4 OE 845, Environmental Acoustics I 4 OE 846 Environmental Acoustics II 4 OE/ESCI 870 Introductory Ocean Mapping 4 OE/ESCI 871 Geodesy and Positioning for Ocean Mapping 3 OE/ESCI 972, Hydrographic Field Course 4 Thesis - in addition to required coursework 6 At least 6 additional credits from the electives below: OE 854, Ocean Waves and Tides 4 ESCI 859, Geological Oceanography 4 ESCI 959, Data Analysis Methods in Ocean and Earth Sciences 4 OE 954, Ocean Waves and Tides II 4 OE/EE 985, Special Topics 3 ESCI 907, Geostatistics 3 OE/ESCI 973, Seafloor Characterization 3 ESCI 895, 6 Special Topics in Earth Science 1-4 ESCI 959 Data Analysis Methods in Ocean and Earth Science 4 ESCI 898 Directed Research 2 EOS 824, Introduction to Ocean Remote Sensing 3 NR 857, Photo Interpretation and Photogrammetry 4 NR 860 Geographic Information Systems in Natural Resources 4 OE/CS 867 Interactive Data Visualization 3 OE 995, Graduate Special Topics 2 - 4 OE 998, Independent Study 1 – 4 Other related courses with approval
JHC Performance Report 58 30 January 2007

Requirements for Master of Science in Earth Sciences Ocean Mapping option: Required: Credit Hours ESCI 858, Introductory Physical Oceanography 3 ESCI 859, Geological Oceanography 4 OE 810, Ocean Measurements Laboratory 4 ESCI/OE 870, Introduction to Ocean Mapping 3 ESCI/OE 871, Geodesy and Positioning for Ocean Mapping 3 ESCI /OE 972, Hydrographic Field Course 4 ESCI 997, Seminar in Earth Sciences 1 ESCI 998, Proposal Development 1 Thesis - in addition to required coursework 6 At least 6 additional credits from the electives below OE 854, Ocean Waves and Tides 4 ESCI 959, Data Analysis Methods in Ocean and Earth Sciences 4 OE 954, Ocean Waves and Tides II 4 OE/EE 985, Special Topics 3 ESCI 907, Geostatistics 3 OE 845, Environmental Acoustics I 4 OE 846 Environmental Acoustics II 4 OE/ESCI 973, Seafloor Characterization 3 ESCI 895, 6 Special Topics in Earth Science 1-4 ESCI 959 Data Analysis Methods in Ocean and Earth Science 4 ESCI 898 Directed Research 2 EOS 824, Introduction to Ocean Remote Sensing 3 NR 857, Photo Interpretation and Photogrammetry 4 NR 860 Geographic Information Systems in Natural Resources 4 OE/CS 867 Interactive Data Visualization 3 OE 995, Graduate Special Topics 2 - 4 OE 998, Independent Study 1 – 4 Other related courses with approval Non-Thesis Option (in addition to courses listed above): ESCI 898, Directed Research 2 Approved Electives 8 Where a course of equivalent content has been successfully completed as an undergraduate, an approved elective may be substituted.
JHC Performance Report 59 30 January 2007

Specific Coursework required too complete FIG/IHO Category “A” Certified Program: (Either Degree Option) University Academic Courses: Credit Hours ESCI 858, Introductory Physical Oceanography 3 ESCI 859, Geological Oceanography 4 OE 990, 991, Ocean Engineering Seminar I, II 2 OE 810, Ocean Measurements Lab 4 OE/ESCI 870 Introductory Ocean Mapping 4 OE/ESCI 871 Geodesy and Positioning for Ocean Mapping 3 OE 895 Special Topics: Seamanship for Ocean Scientists and Engineers* 2 OE/ESCI 972, Hydrographic Field Course 4 OE 990 Ocean Seminar I/or ESCI 997 Seminar in Earth Science 1 OE 991 Ocean Seminar II/or ESCI 998 Proposal Development 1 Non-credit classes: Classroom Hours CARIS HIPS-SIPS Training Course 40 *For students who have not completed NOAA (or equivalent maritime service) Training Class
JHC Performance Report 60 30 January 2007

Coursework Required for the Graduate Certificate in Ocean Mapping Program Requirements: A Graduate Certificate in Ocean Mapping is awarded for completion of three required courses and four elective courses. Basic Certificate Credits Required Courses: ESCI/OE 870 Introduction to Ocean Mapping 4 ESCI/OE 871 Geodesy and Positioning for Ocean Mapping 3 ESCI/OE 972 Hydrographic Field Course 4 OE 810 Ocean Measurements Lab 4 Advanced Certificate: (three additional courses from the following): ESCI 859* Geologic Oceanography 4 ESCI 973 Seafloor Characterization 3 ESCI 858* Introduction to Physical Oceanography 4 EOS/OE 854 Ocean Waves and Tides 4 OE 845 Environmental Acoustics I 4 OE 885 Environmental Acoustics II 4 OE/CS 867 Data Visualization 3 OE Special Topics 4 NR 857 Photo Interpretation and Photogrammetry 4 NR 860 GIS in Natural Resources 4 ESCI 895,896 Topics in Earth Sciences 1-4 OE 895* CARIS Training and Seamanship 4 **Required Advanced Certificate courses for Category “A” Certification
JHC Performance Report 61 30 January 2007

APPENDIX C: 2006 Field Programs
WASSP Field Testing – Bay of Islands, New Zealand, March 13-16, M/V Acheron, Collect field data to test modifications to the WASSP sonar system. (Brogan, de Moustier and team from ENL) CCOM Piscataqua River, April 24, R/V Gulf Challenger, Ambient noise and site investigation for Harbor Tracking / Observatory location. (McGillicuddy, Weber) BAST Engineering Tests, May 18, Portsmouth Harbor and Isles of Shoals NH on the R/V Gulf Challenger, NOAA Grant Number NA04NOS4000259. (Glynn, Huff) FISHPAC Design Verification Testing: May 30-31, Six one-day trips, Cape Anne MA on the R/V Argo Maine, NOAA Grant Number NA04NOS4000259. (Huff) UNH-CCOM Kittery, ME, May 22 – June 23, R/V Coastal Surveyor, Hydrographic Field Methods. (Calder, Dijkstra, Pe’eri, Sweeney, Weirathmueller) UNCLOS mapping in Gulf of Mexico, June 15-18, R/V Northern Resolution. (Gardner) Evaluation of Closed Area: Cashes Ledge as Juvenile Cod Habitat, June 19-24, R/V Ball Breaker, collect mid-water multibeam data from Cashes ledge to evaluate kelp coverage, and for seafloor characterization. (Weber) Oyster Reef Mapping, June 21, R/V Coastal Surveyor, Map Oyster Reefs using Simrad EM3002. (Dijkstra) Collect data from the Fishpac Sonar, June 25, Gloucester R/V Argo Main, calibrate the backscatter from the DTRE sidescan and NASS nadir augmentation system. (Fonseca) Aleutian Islands, 6/30-7/21, R/V Fairweather, Field Test for the Fishpac Sonar Statistical analysis of the Fishpac backscatter sources. (Fonseca) Oyster Reef Mapping, Collection of single beam data on all oyster reefs that are part of the oyster reef characterization, July 2006, R/V Little Bay. (Dijkstra, Grizzle) Underway Evaluation of NOAA ENCs & RNCs, CO-OPS National Current Observation Program, July-Sep 2006, R/V Argo Maine, NCOP Penobscot Bay Project. (Kammerer) FISHPAC Extended Engineering Tests: July 6-7, Portsmouth Harbor NH on the R/V Gulf Challenger, NOAA Grant Number NA04NOS4000259. (Glynn & Huff) Stellwagen National Marine Sanctuary, Whale tagging, Gulf of Maine.
JHC Performance Report 62 30 January 2007

July 6-21, 2006. R/V NOAA Nancy Foster, Multibeam data collection & processing of data. (Malik, Ware) Seneca Lake Survey, July 9-17, R/V NUWC launch (small boat), collect 8101 multibeam bathymetry and backscatter for investigation into observed acoustic anomalies in the region. (Weber) FISHPAC Sonar Testing: July 23-August 25, eastern Bering Sea on NOAA R/V Fairweather, NOAA Grant Number NA04NOS4000259. (Huff) Portsmouth Harbor, August 7-9, R/V Coastal Surveyor, Harbor Observatory- Survey to test bearing accuracy. (Weber, Weirathmueller) Collect sediment grab samples, August 20-23, M/V Beavertail. (Rosa) Transit from Norfolk, VA to Portsmouth, NH, August 21-25, R/V Cocheco. (Alexander, Smith & Armstrong) Understanding observed facies using LIDAR, August 29, One day trip on R/V Cocheco, to Isle of Shoals to sample shoreline geology and take measurements of ground roughness. (Pe’eri) SBNMS Whale Tagging 2006, September 5-20, NOAA R/V Nancy Foster, Visualization and data fusion. (Arsenault) GOM06, September 18 – October 10, R/V Hugh Sharp, multi-ship (Oceanus, Endeavor, Sharp, and Delaware II) and multi-institution (MIT, NE, NMFS, NRL, PSU, UNH, NFESC, WHOI) field experiment to test Makris’ new long range fish finding sonar. Installed and used a Reson 7125 on the Sharp, which was used to collect mid-water column data. (Makris, Weber) Sovereign, Scapa MAP II, 2006 October (Scapa Flow, Orkney & Scotland), R/V Anglian, Repeat survey of WWI German High Seas Fleet wrecks with Reson 7125/400 kHz, including water-column and backscatter. (Calder) Klein-5410 swath bathymetry sea trials in New York Harbor, NY, NOAA R/V Thomas Jefferson, Launch 3102, October 2-6. (de Moustier, Huff & Glynn) WASSP Field Testing – Little Bay / Portsmouth Harbor, New Hampshire, USA, October 9-20, R/V Coastal Surveyor, Collect field data to test modifications to the WASSP sonar system. (Brogan, de Moustier, Sentch from ENL) Fetch Trials, October 19-22, R/V Cocheco; Fetch field trials in high current scenario near UNH JEL. (Weber)
JHC Performance Report 63 30 January 2007

Field testing of ALVIMOS (Alvin Video Mosaicking Suite). October 22-November 18, R/V Atlantis, LADDER 1 cruise Manzanillo, Mexico. (Rzhanov) Little Bay/ Great Bay, R/V Cocheco, AUV Fetch field test October 27-29, Test acquisition parameters and monitor acoustic backscatter from the Delta-T imagenex multibeam. (Fonseca) Vieques Underwater UXO Demonstration Project, November 5-14, R/V NOAA Response Team 7, Vieques Island, Puerto Rico, to locate and identify unexploded ordnance in a shallow water bay. (Dijkstra) Santa Barbara Basin Sediment Deformation, November 11-17, R/V Revelle, Chirp and Multibeam. (Schwehr) DOERRI Cruise, November 14-15, R/V Hugh R. Sharp, DOERRI, DeltaT and GeoZui4D integration. (Arsenault) DOERRI Cruise, December 7-9, R/V Hugh R. Sharp, DOERRI, DeltaT and GeoZui4D integration. (Arsenault)
JHC Performance Report 64 30 January 2007
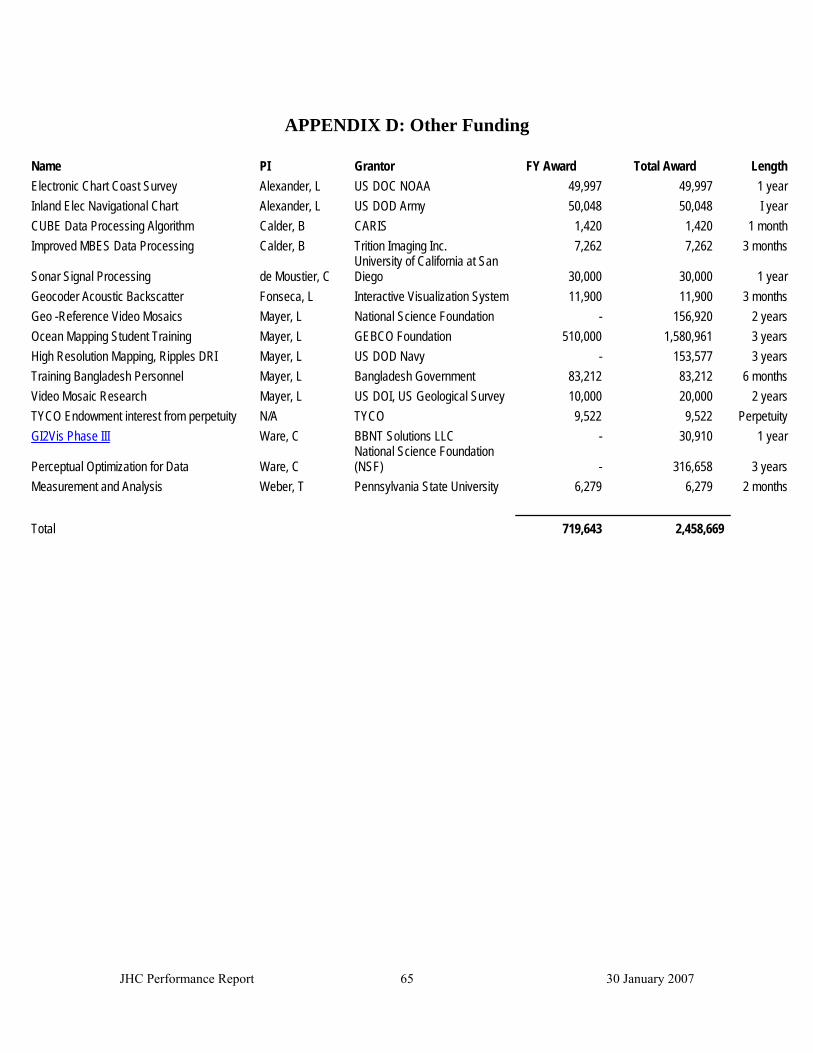
APPENDIX D: Other Funding
Name PI Grantor FY Award Total Award Length Electronic Chart Coast Survey Alexander, L US DOC NOAA 49,997 49,997 1 year Inland Elec Navigational Chart Alexander, L US DOD Army 50,048 50,048 I year CUBE Data Processing Algorithm Calder, B CARIS 1,420 1,420 1 month Improved MBES Data Processing Calder, B Trition Imaging Inc. 7,262 7,262 3 months
Sonar Signal Processing de Moustier, C University of California at San Diego 30,000 30,000 1 year
Geocoder Acoustic Backscatter Fonseca, L Interactive Visualization System 11,900 11,900 3 months Geo -Reference Video Mosaics Mayer, L National Science Foundation - 156,920 2 years Ocean Mapping Student Training Mayer, L GEBCO Foundation 510,000 1,580,961 3 years High Resolution Mapping, Ripples DRI Mayer, L US DOD Navy - 153,577 3 years Training Bangladesh Personnel Mayer, L Bangladesh Government 83,212 83,212 6 months Video Mosaic Research Mayer, L US DOI, US Geological Survey 10,000 20,000 2 years TYCO Endowment interest from perpetuity N/A TYCO 9,522 9,522 Perpetuity GI2Vis Phase III Ware, C BBNT Solutions LLC - 30,910 1 year
Perceptual Optimization for Data Ware, C National Science Foundation (NSF) - 316,658 3 years
Measurement and Analysis Weber, T Pennsylvania State University 6,279 6,279 2 months Total 719,643 2,458,669
JHC Performance Report 65 30 January 2007

APPENDIX E: Papers, Books, Conference Proceedings, Abstracts, Theses, Reports, Talks, and Article
Journal Articles Alexander, L., 2006, Electronic Charts: A Real-Time GIS for Vessel Navigation: GIS Professional, v. Nov-Dec, p. 20-22. Ballard, R., Hammond, S., and Mayer, L.A., 2006, NOAA's OKEANOS EXPLORER and Telepresence Technology: Marine Technology Reporter, v. 49, n. 2, p. 24-33. Calder, B.R., 2006, On the Uncertainty of Archive Hydrographic Datasets: IEEE J. Oceanic Eng, v. 31(2). de Moustier, C.P., 2006, Fred Fisher's high pressure work with eyewash and epsom salts: J. Acoust. Soc. Am, v. 120, p. 3299. de Moustier, C.P., 2006, Manuscript Management: IEEE J. Oceanic Eng, v. 31, p. 1. Dias, G., Coleman, D., El-Rabbany, A., Agi, B., and Alexander, L., 2006, A Process for Producing Ice Coverage Marine Information Objects (MIOs) in IHO S-57 format: International Hydrographic Rev, v. 7, n. 3, p. 55-63. Gardner, J.V., Mayer, L.A., and Armstrong, A.A., 2006, Mapping supports potential submission to U.N. Law of the Sea: Eos. Trans. American Geophysical Union, v. 87, n. 16, p. 157-160. Goff, J., Jenkins, C., and Calder, B.R., 2006, Maximum A Posteriori Resampling of Noisy, Spatially Correlated Data: Geochem.Geophys.Geosyst, v. 7(8). Holland, C.W., Weber, T.C., and Etiope, G., 2006, Acoustic scattering from mud volcanoes and carbonte mounts: J. Acoust. Soc. Am, v. 120, p. 3553-3565. House, D.H., Bair, A.D., and Ware, C., 2006, An Approach to the Perceptual Optimization of Complex Visualizations: IEEE Transactions on Visualization and Computer Graphics, v. 12 (4), p. 509-521. Karlapati, S., Monahan, D., Caceres, H.M., Morishita, T., Mustapha, A.A., Peralta, W.R., Sharma, S., and C, A., 2006, Capacity building in Ocean Bathymetry: International Hydrographic Rev, v. 6 (3), p. 69-75. Kraft, B.J., Overeem, I., Holland, C.W., Pratson, L.F., Syvitski, J.P.M., and Mayer, L.A., 2006, Stratigraphic model predictions of Geoacoustic properties: IEEE J. Oceanic Eng, v. 31, n. 2, p. 266-283.
JHC Performance Report 66 30 January 2007

Mayer, L.A., 2006, Frontiers in seafloor mapping and visualization: Marine Geophysical Researches, v. 27, n. 1, p. 7-17. Plumlee, M., and Ware, C., 2006, Cognitive costs of zooming versus using multiple windows: ACM Transactions on Applied Perception, v. 13, p. 1-31. Schwehr, K.D., Driscoll, N.W., Tauxe, L., and Lee, H., 2006, Detecting Compaction Disequilibrium with Anisotropy of Magnetic Susceptibility: Geochem.Geophys.Geosyst, v. 7, Q11002. Sullivan, B.M., Ware, C., and Plumlee, M., 2006, Linking Audio and Visual Information while Navigating in a Virtual Reality Kiosk Display: Journal of Educational Multimedia and Hypermedia, v. 15, p. 217-241. Ware, C., Arsenault, R., and Plumlee, M., 2006, Visualizing the Underwater Behavior of Humpback Whales: IEEE Computer Graphics and Applications, p. 14-18. Weber, T.C., Lyons, A.P., and Bradley, D.L., 2006, Multiple Frequency Acoustic Propagantion through Clusters of Bubbles: The Journal of the Acoustical Society of America, v. 119, p. 3346-3347. Book Hecht, H., Berking, B., Buttgenbach, G., Jonas, M., and Alexander, L., 2006, The Electronic Chart. Functions, Potential and Limitations of a New Navigation System: Lemmer, The Netherlands, GITV, 293 p. Conference Proceedings Alexander, L., Roman, D., and Casey, M.J., 2006, Comparative Evaluation of Official Electronic Chart Data in U.S. Waters, Canadian Hydrographic Conference: Halifax, NS, Canada. Armstrong, A.A., Mayer, L.A., Case, J., Fonseca, L., Donaldson, P., Infantino, J., and Davis, G., 2006, New Multibeam Mapping of the Gulf of Maine, MIT NOAA Seagrant 2006 GIS Conference: Cambridge, MA. Bashir, M., Bustamante, J.L.H., Hartoyo, D., Heap, B., Lagonsin, A., Monahan, D., Weirathmueller, M., and Yoshida, T., 2006, How rapidly can we respond to an urgent need? Producing a bathymetry map of the 2004 Tsunami area, Bathymetric Science Workshop: Bremerhaven, Germany. Beaulieu, S.E., Shank, T., Soule, S.A., Fornari, D., Rzhanov, Y., and Mayer, L.A., 2006, Automated generation of geo-referenced mosaics from video collected by deep submergence vehicles: an example from Rosebud vent (Galapagos Rift). 11th
JHC Performance Report 67 30 January 2007
International Deep-Sea Biology Symposium: London, UK. Brogan, D.S., and de Moustier, C.P., 2006, Comparison of extended Kalman Filtering with Split-Aperture Processing for angle of Arrival Estimation in Multibeam Echosounding, 151st Acoustical Society of America Meeting: Providence, RI. Calder, B.R., 2006, Uncertainty Patch Test, NOAA Field Procedures Workshop: Seattle, Washington. Curcio, J., McGillivary, P.A., Fall, K., Maffei, A., Schwehr, K.D., Twiggs, B., Kitts, C., and Ballou, P., 2006, Self-Positioning Smart Buoys, The 'Un-Buoy' Solution: Logistic Considerations using Autonomous Surface Craft Technology and Improved Communications Infrastructure, IEEE MTS: Boston, MA. Fonseca, L., 2006, Acoustic Backscatter and Remote Seafloor Characterization, International Marine Technician Symposium: Woods Hole, MA. Fonseca, L., Calder, B.R., and Wetzler, M., 2006, Experiments for Multibeam Backscatter Adjustments on the NOAA Ship Fairweather, Oceans 2006: Boston, MA. Grizzle, R.E., Ward, L.G., Mayer, L.A., Cooper, A.B., Rosenberg, A.A., Brouder, M., Greene, J.K., Abeels, H., and Malik, M.A., 2006, Effects of the Western Gulf of Maine Closure Area on Bottom Habitats: A Preliminary GIS-Based Assessment, GIS and Ocean Mapping in Support of Fisheries Research and Management conference: Cambridge, MA. Gu, F., and Rzhanov, Y., 2006, Optical Image Blending for Underwater Mosaics, Oceans 2006: Boston, MA. Gulick, S., Willems, B., Feymueller, J., Powell, R., Jaeger, J., Kalbas, J., Pavlis, T., Lowe, L., Mayer, L.A., and Gardner, J., 2006, Significant tectonic and climate events for the Yakutat block collision, Gulf of Alaska: Pleistocene flacial intensification in the St. Elias Mountains and the relationship between the Fairweather and Transition faults, Backbone to the Americas Conference: Mendoza, Argentina. Huff, L., 2006, Long Range Side Scan Sonar for Fishery Research, Oceanology International 2006: London, United Kingdom. Malik, M.A., and Mayer, L.A., 2006, Detection of bottom fishing Impacts on Benthic Structure using Multibeam Sonar, Side Scan Sonar, Video and Interactive 3-D GIS, GIS and Ocean Mapping in Support of Fisheries Research and Management Conference: Cambridge, MA. Rzhanov, Y., and Gu, F., 2006, Multi resolution quality improvement for patch-bases texture synthesis in wavelet domain, IASTED Signal and Image Processing Conference: Honolulu, HI.
JHC Performance Report 68 30 January 2007

Rzhanov, Y., Mayer, L.A., Beaulieu, S.E., Shank, T., Soule, S.A., and Fornari, D., 2006, Deep Sea Geo-Referenced Video Mosaics, Ocean 2006: Boston, MA. Rzhanov, Y., Mayer, L.A., Beaulieu, S.E., Soule, S.A., and Fornari, D.J., 2006, Non-iterative global alignment of image sequences, IASTED Visualization Imaging and Image Processing: Palma de Mallorca, Spain. Sullivan, B.M., Ware, C., and Plumlee, M., 2006, Predictive Displays for Survey Vessels, Human Factors and Ergonomic Studies: San Francisco, CA, p. 1-5. Ware, C., 2006, 3D Contour Perception for Flow Visualization, SIGGRAPH Symposium on Applied Perception in Graphics and Visualization: Boston, MA, p. 101-106. Ware, C., and Babrow, R., 2006, Motion Coding for Pattern Detection, ACM SIGGRAPH Symposium on Applied Perception in Graphics and Visualization: Boston, MA, p. 107 - 110. Weber, T.C., and Lyons, A.P., 2006, A Multibeam Sonar Survey of Mid-Seneca Lake: bathymetry, backscatter, and invasive species, 2006 Finger Lakes Research Conference: Geneva, NY. Abstracts Brogan, D.S., and de Moustier, C.P., 2006, Comparison of extended Kalman filtering with split-aperture processing for angel of arrival estimation in multibeam echosounding: The Journal of the Acoustical Society of America, v. 119, p. 3352. Evans, R.L., Kraft, B.J., and Mayer, L.A., 2006, Use of seafloor electromagnetic and acoustic backscatter data for seafloor classification: an example from Martha's Vineyard, Massachusetts: Eos. Trans. American Geophysical Union, v. 87 (52). Kraft, B.J., de Moustier, C.P., Calder, B.R., and Mayer, L.A., 2006, High resolution mapping and backscatter studies in support of the Ripples Program: J. Acoust. Soc. Am, v. 120, p. 3180. Vogt, P.R., Jung, W., Jakobsson, M., Mayer, L., and Williamson, M., 2006, The Alpha-Mendeleev Magmatic Province, Arctic Ocean: A New Synthesis, EOS, Transactions of the American Geophysical Union, v. 87, no. 36, Jt. Assem. Suppl. Abstract No. OS31A-02 Theses Conrad, R., 2006, Development of a Side Scan Sonar Stabilization Device [Master of Science thesis]: Durham, University of New Hampshire.
JHC Performance Report 69 30 January 2007

Schwehr, K.D., 2006, Paleomagnetic and Stratigraphic Techniques for Identifying Sediment Processes on Continental Margins [Dissertation thesis]: San Diego, Scripps Institution of Oceanography, University of California. Reports Alexander, L., 2006, Proposed Test bed Project on Production of Large-scale ENCs in the MACHC Region: Durham, University of New Hampshire. Alexander, L., 2006, Recommendation for Involving the Private Sector in Producing Small-scale ENCs from INT Charts: Durham, University of New Hampshire. Brogan, D.S., and De Moustier, C.P., 2006, Preliminary report on issues affecting the usability of data collected during October 2006 WASSP tests in New Hampshire: Durham, University of New Hampshire, p. 22. Brogan, D.S., and De Moustier, C.P., 2006, Upgraded seafloor detection algorithm for swath bathymetry applications of the Volume Search Sonar: Durham, University of New Hampshire, p. 35. Calder, B.R., and Wells, D.E., 2006, CUBE User Guide: Durham, University of New Hampshire, p. 46. de Moustier, C.P., 2006, WASSP Sea Tests M/V Acheron: Bay of Islands, New Zealand. Gardner, J.V., 2006, UNCLOS mapping of Marianas western margin, technical report: Durham, University of New Hampshire, p. 37. McGillicuddy, G., and Huff, L., 2006, FishPAC Field Report for the Free-Fall Cone Penetrometer: Durham, University of New Hampshire, p. 4. Monahan, D., 2006, Nippon Foundation/GEBCO Training Project at the University of New Hampshire 4/2004-8/2005: Durham, University of New Hampshire, p. 19. Talks Alexander, L., “IHO Digital Data Standards: Present and Future. Seminar presented to ESRI Charting/Navigation Group, Vienna, VA, 18 January 2006. Alexander, L., “Electronic Charting: Current Status, Future Expectations. Seminar presented at The University of Southern Mississippi, Stennis Space Center, MS, 1 February 2006.
JHC Performance Report 70 30 January 2007

Alexander, L., “Importance of Hydrography: Use of Marine Information Objects for Marine Environmental Protection”. Seminar presented to Belize Hydrographic and Oceanographic Commission, Belize City, Belize, 14 March 2006. Alexander, L., “10th IHO Worldwide ENC Database (WEND) Meeting”, IHB, Monaco, 11&14-15 September 2006. Alexander, L., “2nd IHO ECDIS Stakeholders Forum”, IHB Monaco, 12-13 September 2006. Alexander, L., “18th IHO Committee on Hydrographic Resource Information Systems” (CHRIS), Cairns, Australia, 22-30 September 2006. Alexander, L., “7th Mesoamerican – Caribbean Sea Hydrographic Commission Meeting”, Acapulco, MX, 2-7 October 2006. Alexander, L., 3rd Europe – North America – Russian Federation Inland ENC Harmonization Group (IEHG), St. Petersburg, Russia, 10-15 October 2006. Alexander, L., “IHO Digital Data Standards: Present and Future”. Seminar presented to ESRI Charting/Navigation Group, Vienna, VA 18 January 2006. Alexander, L., “Electronic Charting: Current Status, Future Expectations”, Seminar presented at The University of Southern Mississippi, Stennis Space Center, MS, 1 February 2006. Alexander, L., “Importance of Hydrography: Use of Marine Information Objects for Marine Environmental Protection”. Seminar presented to Belize Hydrographic and Oceanographic Commission, Belize City, Belize, 14 March 2006. Alexander, L., “Seminar/Workshop Series on Inland Electronic Charting, Overview of Worldwide Inland ENC Production/Coverage, Inland ENC Standards Development and Implementation, Alignment of Inland ENC standards with Future IHO S-100,Inland ENC Harmonization Group (IEHG), Current Challenges, Future Opportunities: Technical & and Programmatic”, Punta del Este, Uruguay, 27 November – 1 December 2006. Calder, B.R., “Marine Archaeology as Hydrography: ScapaMAP and Normandy”, Navy War College, Newport, RI, 9 May 2006. [Invited]. Calder, B.R., “An Introduction to CUBE and the Navigation Surface”. Center for Coastal and Ocean Mapping, University of New Hampshire, Durham, NH (GEBCO Students Bathymetry Class), 29 March 2006 [Invited]. Calder, B.R., “Seafloor Characterization Class: Texture Analysis and Classification”, Center for Coastal and Ocean Mapping, University of New Hampshire, Durham, NH, Spring 2006.
JHC Performance Report 71 30 January 2007

Calder, B.R., “High-Precision Absolute Time Synchronization in Distributed Data Capture Systems” Center for Coastal and Ocean Mapping, Seminar series, 6 October 2006. Calder, B.R., “The Open Navigation Surface”, IHO TSMAD Working Group, Silver Spring, MD. 27 November 2006. [Invited]. Calder, B.R., “Bathymetric Uncertainty, ONR Quantifying, Predicting and Exploiting Uncertainty DRI Workshop”, San Francisco, CA. 8 December 2006. [Invited]. Fonseca, L., “Remote Estimation of Surficial Sediment Acoustic Properties through the Application of AVO Analysis to Multibeam sonar, Data Workshop: Seabed Habitat mapping: assessing the utility of multibeam backscatter data for habitat discrimination”, Centre for Coastal and Marine Research, University of Ulster, Northern Ireland, 29-31 March 2006. Fonseca, L., “Discussions of backscatter strength, and backscatter corrections. Seafloor Characterization through the application of AVO Analysis to Multibeam data approaches to backscatter Mosaicking”. Center for Coastal and Ocean Mapping, UNH, Durham, February/March 2006. Fonseca, L., “Functionalities of Geocoder Training class” Center for Coastal and Ocean Mapping, University of New Hampshire, Durham NH, March 2006. Fonseca, L., “Geocoder, Methodology and AVO Analysis for backscatter processing and analysis”, Presentation: NOAA Officers, Center for Coastal and Ocean Mapping, University of New Hampshire, Durham, NH, May 2006. Fonseca, L.,” Acoustic Backscatter and Remote Seafloor Characterization”, International Marine Technician Symposium 2006 (INMARTECH2006), 17 October 2006, Woods Hole, MA. [Invited]. Huff, L., “Long Range Side Scan Sonar for Fishery Research” Oceanology International 2006, London UK March 2006. [Invited]. Imahori, G., “Space and time variability study in Dutch Harbor”, Center for Coastal and Ocean Mapping Seminar Presentation Series: University New Hampshire, Durham, NH 11 October, 2006. Imahori, G., “Case Studies of Space and Time Variability in Sound Speed: An investigation into the sound speed component of total depth uncertainty using NOAA Ship FAIRWEATHER data”, Research Project Final Presentation: JHC/CCOM, University New Hampshire, Durham, NH, 29 November, 2006.
JHC Performance Report 72 30 January 2007
Malik, M.A. & L. Huff, “Extended CUBE applications”. NOAA OCS CCOM review, 01 August 2006. Malik, M.A., “Mapping in Gulf of Maine and potential applications of bathymetric data in Fisheries management”. Northeast Charter boat Captain’s Association (NCCA) monthly meeting, Newburyport, MA, 15 November, 2006. Mayer, L.A., Changing Perspectives of the Seafloor: New Approaches to Seafloor Mapping and Data Visualization – Sedimentology Lecture Series, ETH, Zurich, Switzerland, 16 January 2006. Mayer, L.A., ‘New View of the Gulf of Alaska: Mapping a Transitional Margin’, International Symposium on Scientific and Technical Aspects of the of the Outer Limits of the Continental Shelf beyond 200 Nautical Miles, United National University, Tokyo, Japan, 7 March 2006. Mayer, L.A., ‘An Academic Desktop Survey of Existing U.S. Data Holding Relevant to the Definition of the Continental Shelf Limits’, International Symposium on Scientific and Technical Aspects of the of the Outer Limits of the Continental Shelf beyond 200 Nautical Miles, United National University, Tokyo, Japan, 8 March 2006. Mayer, L.A., “New Approaches to Ocean Mapping and Data Visualization”, Ocean Seminar Series, the University of Delaware, Newark, Delaware, 16 March 2006. Mayer, L.A., “Orion-Cyber Infrastructure”, Orion-OOI Meeting, Salt Lake City, Utah, 28 March 2006. Mayer, L.A., “Ocean Mapping”, NSF Advisory Committee-GeoSciences, Washington, DC, 5 May 2006. Mayer, L.A., “New Advances in Ocean Mapping”, New England Mapping Association, University of New Hampshire, Durham, NH, 8 June 2006. [Invited] Mayer, L.A., Series of Lectures on Law of the Sea, Rhodes Academy of Ocean Policy, Athens, Greece, 11-14 July 2006. Mayer, L.A., “Ocean Exploration”, NOAA-Science Advisory Board, Monterey, CA, 25 July 2006. Mayer, L.A., “Seafloor Mapping in Support of Habitat Studies”, NMFS Fish Habitat Workshop, Seattle, WA, 30 August 2006. Mayer, L.A., “Seafloor Mapping and Law of the Sea, Seminar: University of Massachusetts, Boston, MA 18 October 2006.
JHC Performance Report 73 30 January 2007

Mayer, L.A., Fish Memorial Lecture: “New Directions in Seafloor Mapping”, University of Rhode Island, Kingston, RI 3 November 2006. Mayer, L.A., “New Tools for Seafloor Mapping” Lecture New England Consortium, Portsmouth, NH 5 December 2006. McGillicuddy, G., and Kraft, B.J., “Mat lab Training Class for Mapping Tools Class”, CCOM Computer Class Room, University of New Hampshire, Durham, NH., September 2006. Monahan, D., “Lectures and labs on the relationship between UNCLOS and Geomatics”, York University, Dept of Geomatics, Toronto, Canada, 14 March 2006. Monahan, D., “An introduction to using GPS in the woods”, By town Motorcycle Assn, Ottawa, 15 March 2006. Monahan, D., “Geomatics and boundaries in the Law of the Sea”, Department of Geodesy and Geomatics Engineering, University of New Brunswick, Fredericton, NB, Canada, 4 November 2006. Pe’eri, S., “Increasing reliability of shallow-water soundings using the ALB red-channel waveforms”, Department of Geography, the Hebrew University of Jerusalem, Jerusalem, Israel, 2 November 2006. Rzhanov, Y and Smith, W.F., “Graph-cut segmentation of multi-spectral LANDSAT-7 images”, Center for Coastal and Ocean Mapping, University of New Hampshire, Durham, NH, 10 February 2006. Ware, C and Arsenault, R., “Visualization of AUV data Autonomous Undersea Vehicles for Scientific Applications”, AUVSA Workshop Woods Hole Oceanographic Institution, Woods Hole, MA, 6 June 2006. Ware, C., “Putting some perception in Visual Analytics”, Simon Fraser University, Vancouver, Canada, 8 February 2006. Ware, C., “Why Do We Keep Turning Time into Space?” Plenary Speaker, Research Workshop on Computation and Visualization for the Understanding of Dynamics in Geographic Domains, Baltimore, Maryland, 16 October 2006. Ware, C., “Effective Flow Visualization”, Skaggs Research Center, NOAA, Boulder Colorado, 13 October 2006. Ware, C., “Can there be a science of visualization?” IEEE visualization conference Panel. Baltimore, 3 November 2006.
JHC Performance Report 74 30 January 2007

Weber, T., “A scintillating method for counting fish using multibeam sonar”. Center for Coastal and Ocean Mapping Seminar Series, University of New Hampshire, Durham, NH. 2 February 2006. Weber, T., “A scintillating method for counting fish using multibeam sonar”. Seminar Presentation: Panorama of Statistical Sciences Series, Center for Coastal and Ocean Mapping, University of New Hampshire, Durham, NH. 9 March 2006. Article Huff, L., and Malik, M.A., 2006, CUBE: Extended Applications: Hydro International, v. 10.
JHC Performance Report 75 30 January 2007

APPENDIX F: Meetings and Conferences Attended
Alexander, L., Geospatial Symposium 2006, Denver, CO, 22-24 March 2006. Alexander, L., IEC TC80/Working Group 13 (Navigation Display), Arlington, VA 7-9 February 2006. Alexander, L., US Army Corps Inland ENC Program Review, Denver, CO, 22-24 March 2006. Alexander, L., North American – European Inland ENC Harmonization Group, Vienna, Austria, 20-21 April 2006. Alexander, L., IHO TSMAD Working Group, Brest, France, 15-19 May 2006. Alexander, L. 10th IHO Worldwide ENC Database (WEND) Meeting, IHB, Monaco, 11&14-15 September 2006. Alexander, L., 2nd IHO ECDIS Stakeholders Forum, IHB Monaco, 12-13 September 2006. Alexander, L., 18th IHO Committee on Hydrographic Resource Information Systems (CHRIS), Cairns, Australia, 22-30 September 2006. Alexander, L., 7th Mesoamerican – Caribbean Sea Hydrographic Commission Meeting, Acapulco, MX, 2-7 October 2006. Alexander, L., 3rd Europe – North America – Russian Federation Inland ENC Harmonization Group (IEHG), St. Petersburg, Russia, 10-15 October 2006. Arsenault, R., SIGGRAPH2006, Boston, Ma, 3 August, 2006 Case, J., Automated Harvesting of Metadata, La Jolla, CA, 13-16, November 2006. Case, J., Multibeam Metadata Meeting, Boulder, CO, 23-27, January 2006. Conrad, R., “Jacobson Douglas’ Master Thesis Defense Tool Runout Estimation”, University of New Hampshire, 14 April 2006. Conrad, R., ME 952 Advanced Control Systems II, Kingsbury Hall, Spring Semester 2006. de Moustier, C.P., IEEE Oceanic Engineering Society Administrative Committee meetings, Vancouver, BC January 2006.
JHC Performance Report 76 30 January 2007

de Moustier, C.P., IEEE Oceanic Engineering Society Administrative Committee meetings, Houston, TX, April 30 - May 1, 2006. de Moustier, C.P., IEEE Panel of Editors meeting, Montreal, QB April 2006. de Moustier, C.P., Acoustical Society of America (151st meeting), Providence, RI, 6-8 June 2006. de Moustier, C.P., IEEE Oceanic Engineering Society, Executive Committee meetings, Boston, MA, 17 September 2006. de Moustier, C.P., IEEE Journal of Oceanic Engineering, re-elected Editor-in-Chief of the, Boston, MA, 18 September 2006, de Moustier, C.P., IEEE Oceanic Engineering Society, Administrative Committee meeting Falls Church, VA, 4 November 2006. de Moustier, C.P., Acoustical Society of America - Acoustical Society of Japan, (4th joint meeting), Honolulu HI Nov. 28- Dec. 1 2006. Gardner, J.V., UNCLOS meeting State Dept., Washington, DC, 22 February 2006. Gardner, J.V., GIS and Ocean Mapping in support of fisheries research & management, MIT 11 April 2006. Glynn, J., Oceans 2006, Boston, MA, 19 September, 2006. Huff, L., HYDRO-06, Evolutions in Hydrography, the 15th International Congress of the International Federation of Hydrographic Societies, November 2006, Antwerp Belgium. Imahori, G., Autonomous Underwater Vehicles (AUV’s) for Scientific Applications: A Conference to Promote Dialog Between AUV Developers, Engineers and Science Users, Woods Hole, Massachusetts, 6-7, June 2006. Kraft, B. J., 151st Meeting of the Acoustical Society of America, Providence, RI, 6-9 June 2006. Kraft, B. J., ONR Ripples DRI Review, WHOI, Woods Hole, MA 28-29 September, 2006. Monahan, D., Subcommittee on Digital Bathymetry, Alfred Wegner Institute, Bremerhaven Germany, 14-16, June 2006. Monahan, D., CGOM – IOC Consultative Group on Ocean Mapping, Alfred Wegner Institute, Bremerhaven Germany, 17 June 2006.
JHC Performance Report 77 30 January 2007

Monahan, D., Management group for the Nippon Foundation project, Alfred Wegner Institute, Bremerhaven Germany, 18 June 2006. Monahan, D., GEBCO Guiding Committee, Alfred Wegner Institute, Bremerhaven Germany, 19-22, June 2006. Monahan, D., workshop on interactions between Tsunamis and Underwater Geological Processes, Woods Hole Oceanographic Institute, Woods Hole, MA, Oct. 30-31, 2006. Schaeffer, S., IEEE VR 2006 Conference, Alexandria, VA, 25-29, March 2006. Schmidt, V., Autonomous Underwater Vehicle for Scientific Applications, Woods Hole, MA 6-7, June 2006. Schwehr, K. & Schmidt, V., GNHLUG, Nashua, NH, 20 July 2006. Schwehr, K., AIS06, Seattle, WA, 10-11 August 2006. Schwehr, K., SIGGRAPH07, Boston, MA 2 Aug 2006. Schwehr, K., UNH GIS Day, Durham, NH, 1 Aug 2006. (Presented AIS and MISLE in Google Earth). Sullivan, B., UNH Coastal Ocean Observation and Analysis - Education and Outreach Coordinator (COOA), Meeting, Durham, NH, 26 April 2006.
Sullivan, B., 1st Shallow Water Survey Conference, Board Meeting, Durham, NH, 10 October 2006. Sullivan, B., Human Factors and Ergonomic Studies (HFES), San Francisco, CA, 16 - 20 October 2006. Sullivan, B., GIS Day (GIS Day), Meeting, Durham, NH, 23 October 2006. Sullivan, B., Marine Communications Meeting (Marine Communications Meeting), Durham, NH, 23 October 2006.
Sullivan, B., Shallow Water Survey Conference, Graphics Meeting, Durham, NH, 24 October 2006. Sullivan, B., Outreach Meeting (Outreach Meeting), Durham, NH, 25 October 2006. Sullivan, B., 8th GIS Day (GIS Day), Geo-Spatial Science Conference, Durham, NH, 1 November 2006. Sullivan, B., UNH Workshop on Authorship and Copy write, Durham, NH, 17 November 2006. Weirathmueller, M., AUVSA (Autonomous Underwater Vehicles for Scientific Applications) Workshop, Woods Hole, Massachusetts, 6-7 June 2006.
JHC Performance Report 78 30 January 2007

APPENDIX G: Visitors’ Log
Name Date From Visiting Purpose Vicki Ferrinin 1/2/2006 WHOI Arsenault Learn the use of visual Mosaic Brendan Foly 1/2/2006 WHOI Arsenault Learn the use of visual Mosaic Richard Byrd 1/12/2006 Odom Hydrographic
Systems Dijkstra Consulting and technical discussion
Rebecca Quintal
1/10/2006-1/13/2006
SAIC Monahan and Graduate Students
Training sessions in the SABER bathymetric processing software
John B. Keene 1/13/2006-1/17/2006
University of Sydney, Australia
Gardner talk about procedures for deep-sea mapping with multibeam sonars
Bill Earnshaw 1/25/2006 Environmental Systems Research Institute
CCOM Initial visit on becoming Industrial Consortium Member
Jim Ciarrocca 1/25/2006 Environmental Systems Research Institute
CCOM Initial visit on becoming Industrial Consortium Member
Melvin, Gary D. 2/23/2006-2/25/2006
Adjunct Professor, Geodesy and Geomatics Engineering, University of New Brunswick
CCOM Presenter in seminar series: Transition from single to multibeam application in fisheries and ecosystem studies.
Kate Raisz 2/27/2006 Northern Lights Ware Smithsonian display of global Ocean Flow Tom Waddington
3/4/2006 SAIC Rosa, Mayer, Fonseca
HARS 2005 Dataset
Jack Riley 3/13/2006 Office of Coast Survey Fonseca, Mayer, Armstrong
Discussed application of backscatter analysis to NOAA operations.
Richard Brennan
3/13/2006 Office of Coast Survey Fonseca, Mayer, Armstrong
Discussed application of backscatter analysis to NOAA operations.
Shep Smith 3/13/2006 Office of Coast Survey Fonseca, Mayer, Armstrong
Discussed application of backscatter analysis to NOAA operations.
Rob Clerkin 3/27/2006 Klein L3 Schwehr AIS RM808 unit testing Thaddesus Kochanshi
3/27/2006 Sensors Signals Systems Schwehr Sensors for coal mine explosions
Shigeru Kasuga 4/6/2006 Japan Coast Guard Monahan Participation of Japan Coast Guard Employees in the GEBCO program
Amy Cline 4/20/2006 UNH COOA Sullivan, Schwehr
Education and Outreach
Taylor Eighmy 4/21/2006 UNH Environmental Research Group
Sullivan Lend out the Great Bay display to show Governor Lynch while visiting Jackson Lab
Carl Wilson 4/28/2006 Maine Department of Marine Resource
Weber Discussion about data analysis on Monhegan Lobster Conservation Area mapping/trapping project
Patrick Brunet 5/10/2006 ICAN CCOM AIS and Charting Technologies Jonathan Grabowski
5/10/2006 Gulf of Maine Research Institute
Weber, Case Discussions about cod trapping study on Cashes Ledge in Gulf of Maine, select initial trapping sites that were later surveyed with multibeam sonar.
Robert McConnaughey
5/11/2006-5/12/2006
Alaska Fisheries Science Center
Hou, Huff Reviewing and Evaluating the progress of NOAA contract project.
JHC Performance Report 79 30 January 2007

Name Date From Visiting Purpose Alex Caris 5/15/2006-
5/16/2006 CARIS Fonseca,
Mayer Engineers from CARIS discussed technical aspects of licensing agreement for Geocoder and AVO analysis
Bill Lamey 5/15/2006-5/16/2006
CARIS Fonseca, Mayer
Engineers from CARIS discussed technical aspects of licensing agreement for Geocoder and AVO analysis
Drew Carey 5/17/2006 Coastal Vision Gardner Talk about their DAMOS (Disposal and Monitoring System) program in New England dump sites and how CCOM might help with their needs in visualization, outreach and to analyze their historical data.
Steve Wolf 5/17/2006 ENSR's Program Manager
CCOM Talk about their DAMOS (Disposal and Monitoring System) program in New England dump sites and how CCOM might help with their needs in visualization, outreach and to analyze their historical data.
Thomas Fredette
5/17/2006 US Army Corp of Engineers
Gardner Talk about their DAMOS (Disposal and Monitoring System) program in New England dump sites and how CCOM might help with their needs in visualization, outreach and to analyze their historical data.
Captain Ian Turner
5/30/2006-5/31/2006
OBE Hydrographer of the Navy (UK)
Arsenault, Schwer, Mayer and Calder
Discussion of CUBE, Uncertainty Estimation and Chart of the Future
Chris Malzone 6/5/2006 The Reson Group Fonseca, Mayer
Discussion on Sonars
Nuno Gracias 6/7/2006 University of Miami Rzhanov Collaboration Discussions Daren Stephenson
6/12/2006 Tennix, LADS CCOM meeting with Larry and Shachak
Mark Penley 6/12/2006 LADS CCOM discuss matters w/ regards to the collaborative work between LADS and UNH
Honorable Advisor for Foreign Affairs of Bangladesh
6/21/2006 Bangladesh Armstrong, Gardner, Calder and Jakobsson
Discussions of LOTS training being undertaken at CCOM
Stace Beaulie 6/22/2006 WHOI Rzhanov Preparation of presentation for a symposium Admiral Behn 6/27/2006 NOAA's National
Maritime and Aviation Office
Mayer & Armstrong
Center's Progress
Mike Lamplugh 6/27/2006 CHS Calder Discussion of CUBE processing and implementations
Jan Backman 6/30/2006 Dept. of Geology & Geochemistry, University of Stockholm, Sweden
Mayer Visiting Scholar
Lt. Wert 7/6/2006 USCG Schwehr Discussion about AIS in the Portsmouth area Don House 7/10/2006-
7/27/2006 Texas A&M Ware Collaboration Work
Dimiter Nedialkov
7/10/2006-7/28/2006
SonarTech Atlas de Moustier, Kraft, McGillicuddy
Fansweep30 Sonar tests
JHC Performance Report 80 30 January 2007

Name Date From Visiting Purpose Tim Kearns 7/31/2006 ESRI CCOM Discussion of data processing in the ESRI
product suite, their plans for hydrography and future development. Establishment of their CCOM ICA.
Adam Dunbar, Remote Sensing Division, JALBTX
8/1/2006-8/2/2006
National Geodetic Survey CCOM Office of Coast Survey JHC Annual Review
Craig Martin, Engineering Division
8/1/2006-8/2/2006
CO-OPS CCOM Office of Coast Survey JHC Annual Review
Dave Enabnit, Technical Director
8/1/2006-8/2/2006
Office of Coast Survey CCOM Office of Coast Survey JHC Annual Review
Gerd Glang, Chief - Hydrographic Surveys Division
8/1/2006-8/2/2006
Office of Coast Survey CCOM Office of Coast Survey JHC Annual Review
Howard Danley, Chief Navigation Services Division
8/1/2006-8/2/2006
Office of Coast Survey CCOM Office of Coast Survey JHC Annual Review
Jeff Ferguson, Deputy Chief - Hydrographic Surveys Division
8/1/2006-8/2/2006
Office of Coast Survey CCOM Office of Coast Survey JHC Annual Review
Mary Erickson, Chief - Coast Survey Dev. Lab
8/1/2006-8/2/2006
Office of Coast Survey CCOM Office of Coast Survey JHC Annual Review
Meredith Westington, Geographer
8/1/2006-8/2/2006
Office of Coast Survey CCOM Office of Coast Survey JHC Annual Review
Mike Aslakson, Remote Sensing Division
8/1/2006-8/2/2006
National Geodetic Survey CCOM Office of Coast Survey JHC Annual Review
Mike Brown, Chief - Cartographic & Geospacial Technology Program
8/1/2006-8/2/2006
Office of Coast Survey CCOM Office of Coast Survey JHC Annual Review
Rich Patchen, Coast Survey Dev. Lab
8/1/2006-8/2/2006
Office of Coast Survey CCOM Office of Coast Survey JHC Annual Review
Rick Brennan 8/1/2006-8/2/2006
Office of Coast Survey CCOM Office of Coast Survey JHC Annual Review
JHC Performance Report 81 30 January 2007

Name Date From Visiting Purpose Steve Barnum, Director of OCS
8/1/2006-8/2/2006
Office of Coast Survey CCOM Office of Coast Survey JHC Annual Review
Bobby Forbes 8/1/2006 Stromness, Orkney Islands, Scotland ScapaMap II project James A. Thomson
8/3/2006 BP E&P DCT, Houston, TX
CCOM meeting with Larry
Ambassador Colson
9/11/2006 CCOM Consultant to the Bangladesh training project
David Parker 9/13/2006 UKHO CCOM Discussion of grid-based workflow, BAG, CUBE, and LiDAR issues for hydrography
Peter Canter 9/22/2006 ApplAnix CCOM Discussion of future development plans, including implementation of IEEE 1588 (Precision Time Protocol) in the POS/MV.
Justin Manely 9/29/2006 NOAA CCOM Gave talk on Advanced Ocean Technology at NOAA: Programs and Tools for the 21st Century
James Moore 10/8/2006 University of Rhode Island
CCOM Collaboration on Monitor Project
Priscila von Altrock
10/8/2006 Universidade Federal de Santa Catarina, Brazil
David Scharff 10/12/2006 OCS, NOAA Silver Spring, MD
Pe'eri LIDAR research
Gavin Sentch 10/9/2006-10/20/2006
Electronic Navigation Ltd. de Moustier, Brogan
WASSP field testing
Vladimir Kostylev
10/19/2006-10/21/2006
Natural Resources, Canada
CCOM Gave talk on Seabed habitat mapping for Ocean management: keeping your eyes on the goal. Examples from Canadian experience.
Sandi Schaefer 10/23/2006-10/27/2006
ESRI CCOM Conducted Intro ArcGIS Training for GEBCO students and CCOM staff.
Bill Earnshaw 10/23/2006-10/27/2006
ESRI CCOM Conducted Intro ArcGIS Training for GEBCO students and CCOM staff.
Radim Bartos 10/20/2006 UNH Computer Science CCOM Gave talk on "Underwater communication in the fleets of solar autonomous underwater vehicles"
Jonathan Grabowski
10/26/2006 Gulf of Maine Research Institute
Weber to discuss cod trapping study on Cashes Ledge in Gulf of Maine
John Gann 10/30/2006 Chesapeake Technology CCOM Meeting with Larry Barry Doust 11/1/2006 MSI Kraft,
McGillicuddy
MSI
Admiral DeBow 11/4/2006 NOAA CCOM Larry Mayer Chen Zhihai 11/6/2006 Fisheries College,
Zhejiang Ocean University
CCOM Larry Mayer
Conda Yu 11/6/2006 Zhejiang Ocean University
CCOM Meeting with Larry and Pingguo He, Research Associate Professor-Fisheries
Russ Parrot 11/16/2006-11/17/2006
Geological Survey of Canada
Monahan Use of Google Earth for Bathymetry data bases
William Philpot 11/17/2006 Cornell University CCOM Gave talk on "Extracting atmospheric transmission and solar irradiance from sun glint"
Karl Kieniner 11/28/2006 Kongsberg (Norway) CCOM Kongsberg/Simrad CCOM collaboration & industrial consortium membership
JHC Performance Report 82 30 January 2007

Name Date From Visiting Purpose Freddie Pohner 11/28/2006 Kongsberg (Norway) CCOM Kongsberg/Simrad CCOM collaboration &
industrial consortium membership Sverre Tetlie 11/28/2006 Kongsberg (Norway) CCOM Kongsberg/Simrad CCOM collaboration &
industrial consortium membership Berit Horvel 11/28/2006 Kongsberg (Norway) CCOM Kongsberg/Simrad CCOM collaboration &
industrial consortium membership Ron Allen, Geophysical Products Engineering Manager
12/11/2006 Teledyne Benthos, N. Falmouth, MA
CCOM Discussion of processing and testing for the Benthos C3D, including development of uncertainty models.
Fred Hegg, Program Manager Survey & Inspection Systems
12/11/2006 Teledyne Benthos, N. Falmouth, MA
CCOM Discussion of processing and testing for the Benthos C3D, including development of uncertainty models.
Rick Tidd, Staff Research Engineer
12/11/2006 Teledyne Benthos, N. Falmouth, MA
CCOM Discussion of processing and testing for the Benthos C3D, including development of uncertainty models.
Brad Barr 12/13/2006 NOAA's National Marine Sanctuary, Woods Hole, MA
CCOM meeting with Larry
JHC Performance Report 83 30 January 2007