Embed Size (px)
Citation preview
Performance Analysis
Presentation to theNational Capital Region Transportation Planning Board
(NCR-TPB)
December 19, 2012(updated from November 28, 2012)
Adopted: July 18, 2012
Item 10
2
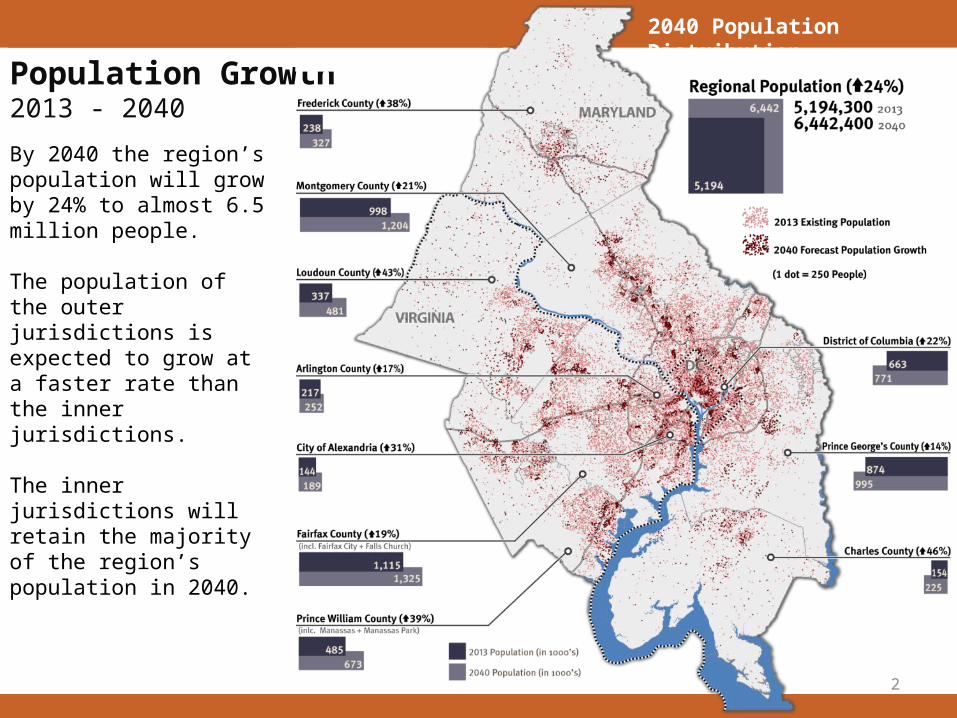
Population Growth2013 - 2040
By 2040 the region’s population will grow by 24% to almost 6.5 million people.
The population of the outer jurisdictions is expected to grow at a faster rate than the inner jurisdictions.
The inner jurisdictions will retain the majority of the region’s population in 2040.
2040 Population Distribution
3
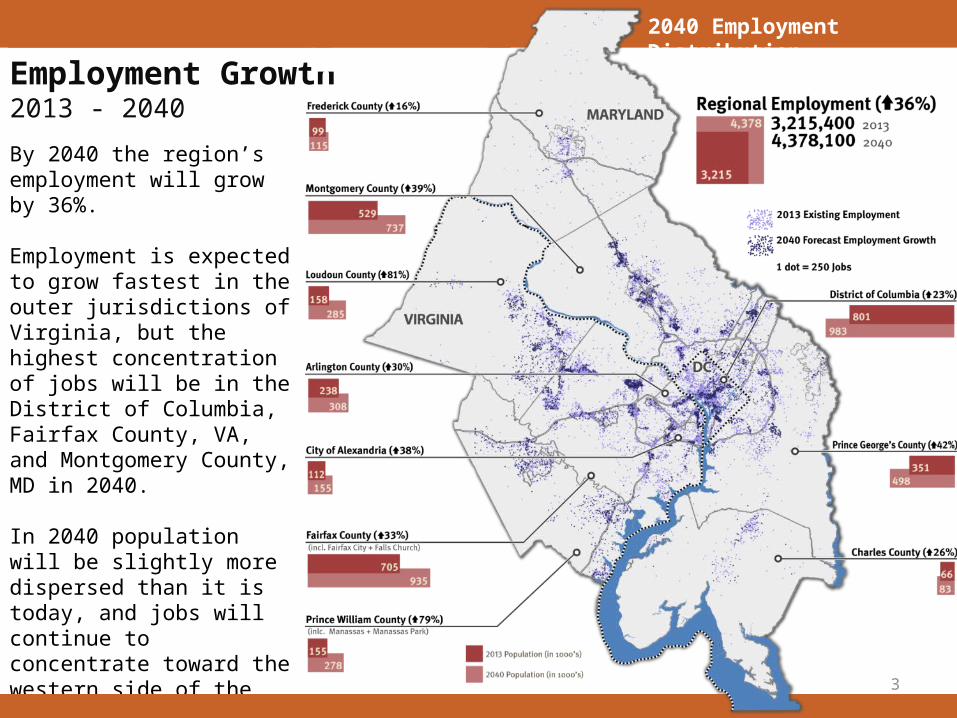
Employment Growth2013 - 2040By 2040 the region’s employment will grow by 36%.
Employment is expected to grow fastest in the outer jurisdictions of Virginia, but the highest concentration of jobs will be in the District of Columbia, Fairfax County, VA, and Montgomery County, MD in 2040.
In 2040 population will be slightly more dispersed than it is today, and jobs will continue to concentrate toward the western side of the region.
2040 Employment Distribution
4
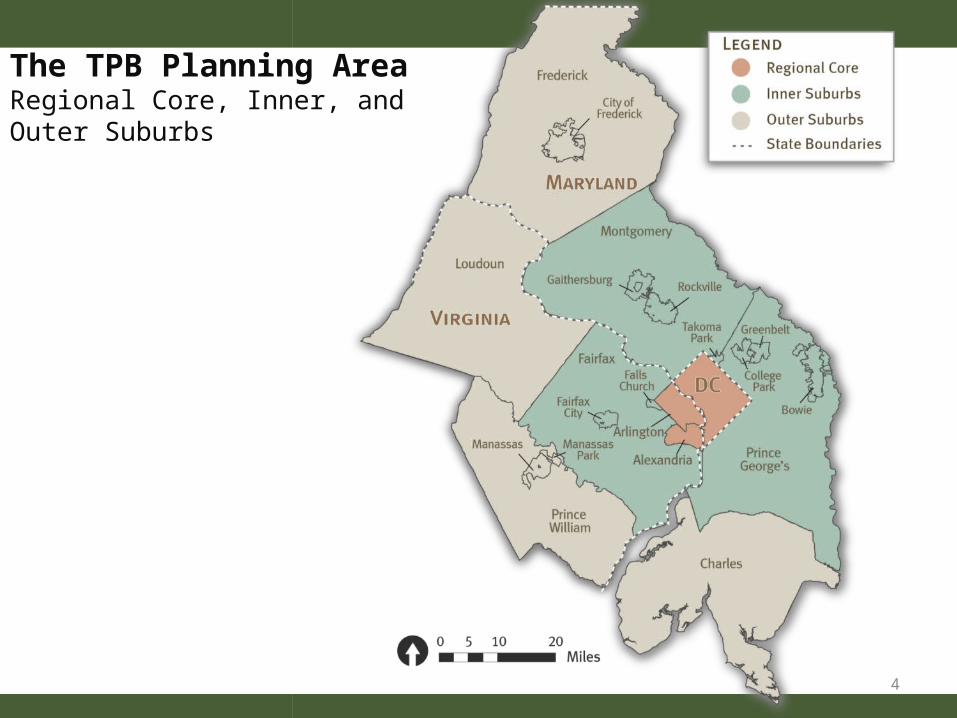
The TPB Planning AreaRegional Core, Inner, and Outer Suburbs
5
Households Population Employment
Jurisdiction: 19901 20102 Percent Growth 19901 20102 Percent
Growth 19901 20102 Percent Growth
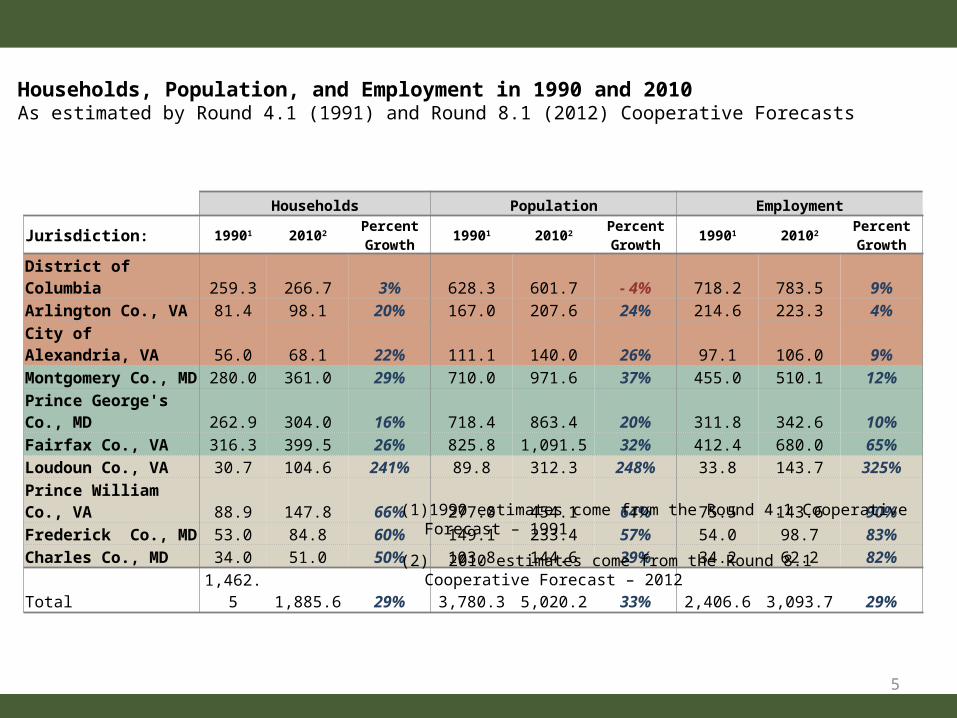
District of Columbia 259.3 266.7 3% 628.3 601.7 - 4% 718.2 783.5 9%Arlington Co., VA 81.4 98.1 20% 167.0 207.6 24% 214.6 223.3 4%City of Alexandria, VA 56.0 68.1 22% 111.1 140.0 26% 97.1 106.0 9%Montgomery Co., MD 280.0 361.0 29% 710.0 971.6 37% 455.0 510.1 12%Prince George's Co., MD 262.9 304.0 16% 718.4 863.4 20% 311.8 342.6 10%Fairfax Co., VA 316.3 399.5 26% 825.8 1,091.5 32% 412.4 680.0 65%Loudoun Co., VA 30.7 104.6 241% 89.8 312.3 248% 33.8 143.7 325%Prince William Co., VA 88.9 147.8 66% 277.0 454.1 64% 75.5 143.6 90%Frederick Co., MD 53.0 84.8 60% 149.1 233.4 57% 54.0 98.7 83%Charles Co., MD 34.0 51.0 50% 103.8 144.6 39% 34.2 62.2 82%Total 1,462.5 1,885.6 29% 3,780.3 5,020.2 33% 2,406.6 3,093.7 29%
(1) 1990 estimates come from the Round 4.1 Cooperative Forecast – 1991
(2) 2010 estimates come from the Round 8.1 Cooperative Forecast – 2012
Households, Population, and Employment in 1990 and 2010As estimated by Round 4.1 (1991) and Round 8.1 (2012) Cooperative Forecasts
6
Households Population Employment
Jurisdiction: Round 4.1 2010
Round 8.1 2010
Ratio (8.1:4.1)
Round 4.1 2010
Round 8.1 2010
Ratio (8.1:4.1)
Round 4.1 2010
Round 8.1 2010
Ratio (8.1:4.1)
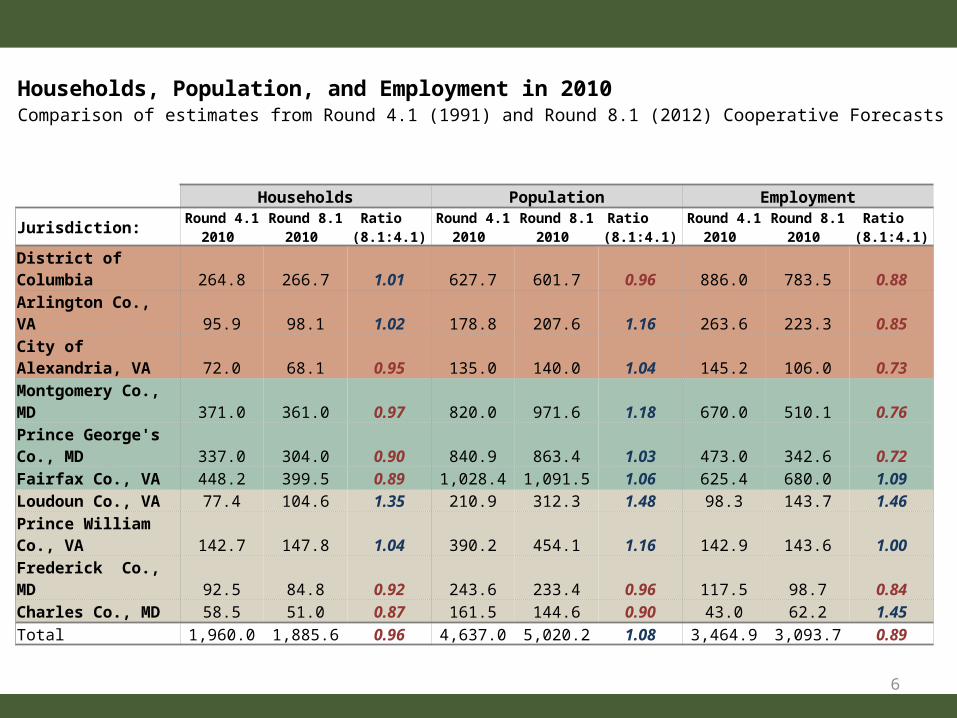
District of Columbia 264.8 266.7 1.01 627.7 601.7 0.96 886.0 783.5 0.88Arlington Co., VA 95.9 98.1 1.02 178.8 207.6 1.16 263.6 223.3 0.85City of Alexandria, VA 72.0 68.1 0.95 135.0 140.0 1.04 145.2 106.0 0.73Montgomery Co., MD 371.0 361.0 0.97 820.0 971.6 1.18 670.0 510.1 0.76Prince George's Co., MD 337.0 304.0 0.90 840.9 863.4 1.03 473.0 342.6 0.72Fairfax Co., VA 448.2 399.5 0.89 1,028.4 1,091.5 1.06 625.4 680.0 1.09Loudoun Co., VA 77.4 104.6 1.35 210.9 312.3 1.48 98.3 143.7 1.46Prince William Co., VA 142.7 147.8 1.04 390.2 454.1 1.16 142.9 143.6 1.00Frederick Co., MD 92.5 84.8 0.92 243.6 233.4 0.96 117.5 98.7 0.84Charles Co., MD 58.5 51.0 0.87 161.5 144.6 0.90 43.0 62.2 1.45Total 1,960.0 1,885.6 0.96 4,637.0 5,020.2 1.08 3,464.9 3,093.7 0.89
Households, Population, and Employment in 2010Comparison of estimates from Round 4.1 (1991) and Round 8.1 (2012) Cooperative Forecasts
7
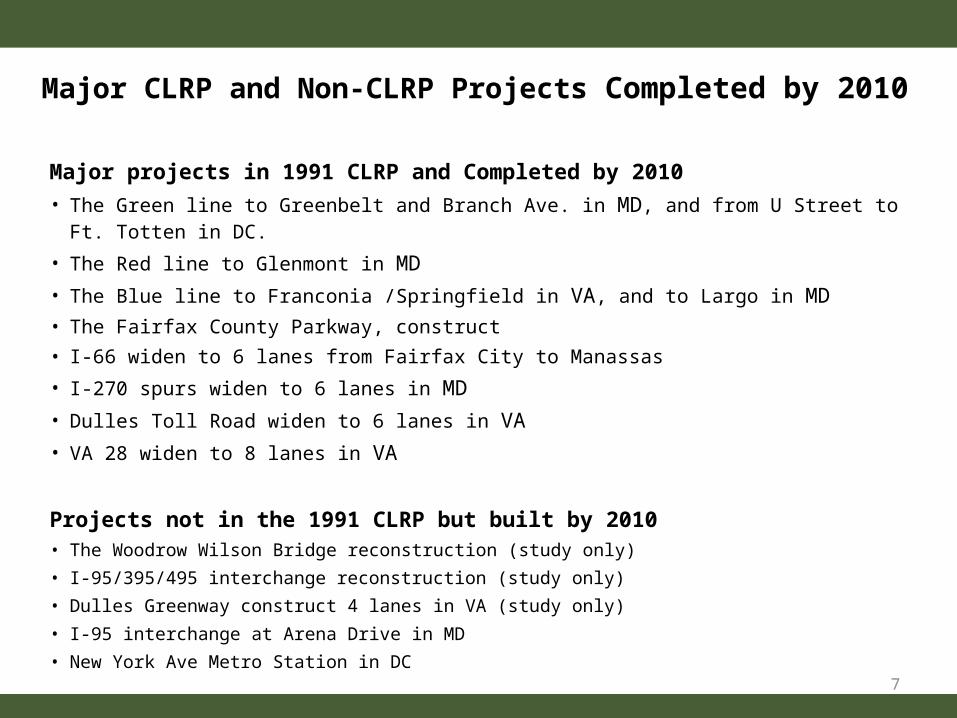
Major projects in 1991 CLRP and Completed by 2010• The Green line to Greenbelt and Branch Ave. in MD, and from U Street to
Ft. Totten in DC. • The Red line to Glenmont in MD • The Blue line to Franconia /Springfield in VA, and to Largo in MD• The Fairfax County Parkway, construct• I-66 widen to 6 lanes from Fairfax City to Manassas• I-270 spurs widen to 6 lanes in MD• Dulles Toll Road widen to 6 lanes in VA• VA 28 widen to 8 lanes in VA
Projects not in the 1991 CLRP but built by 2010• The Woodrow Wilson Bridge reconstruction (study only)• I-95/395/495 interchange reconstruction (study only)• Dulles Greenway construct 4 lanes in VA (study only)• I-95 interchange at Arena Drive in MD• New York Ave Metro Station in DC
Major CLRP and Non-CLRP Projects Completed by 2010
8
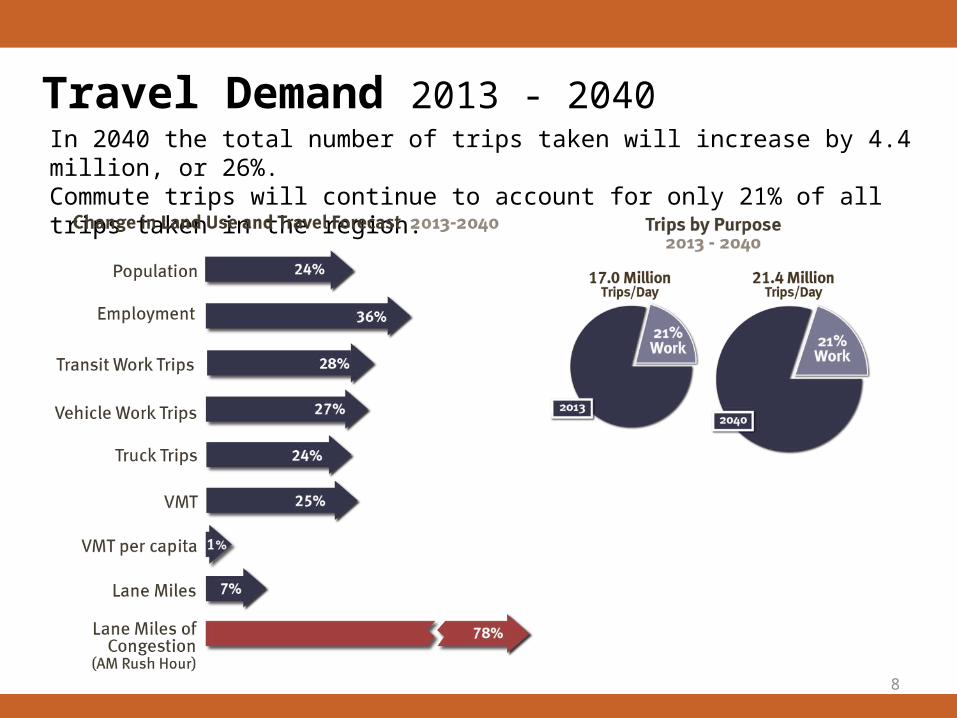
Travel Demand 2013 - 2040In 2040 the total number of trips taken will increase by 4.4 million, or 26%.Commute trips will continue to account for only 21% of all trips taken in the region.
9
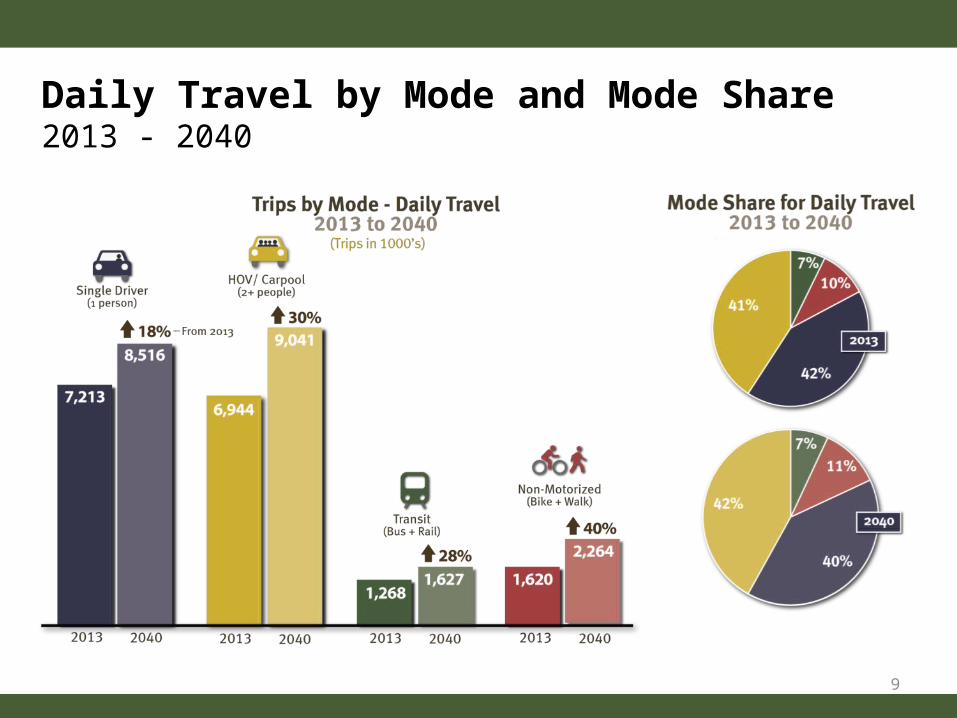
Daily Travel by Mode and Mode Share 2013 - 2040
10
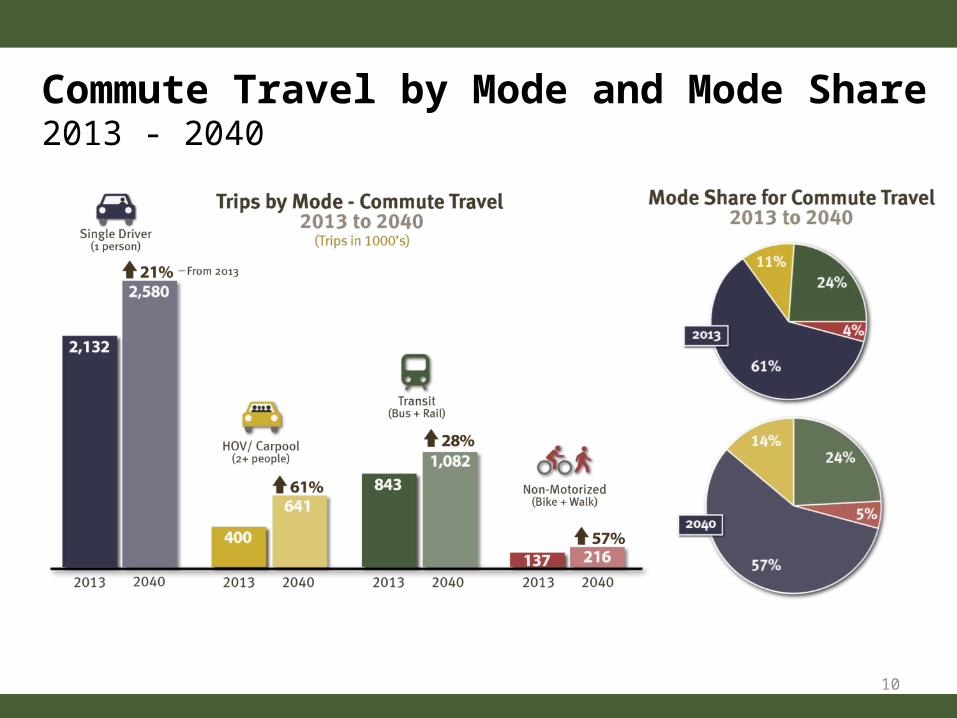
Commute Travel by Mode and Mode Share 2013 - 2040
11
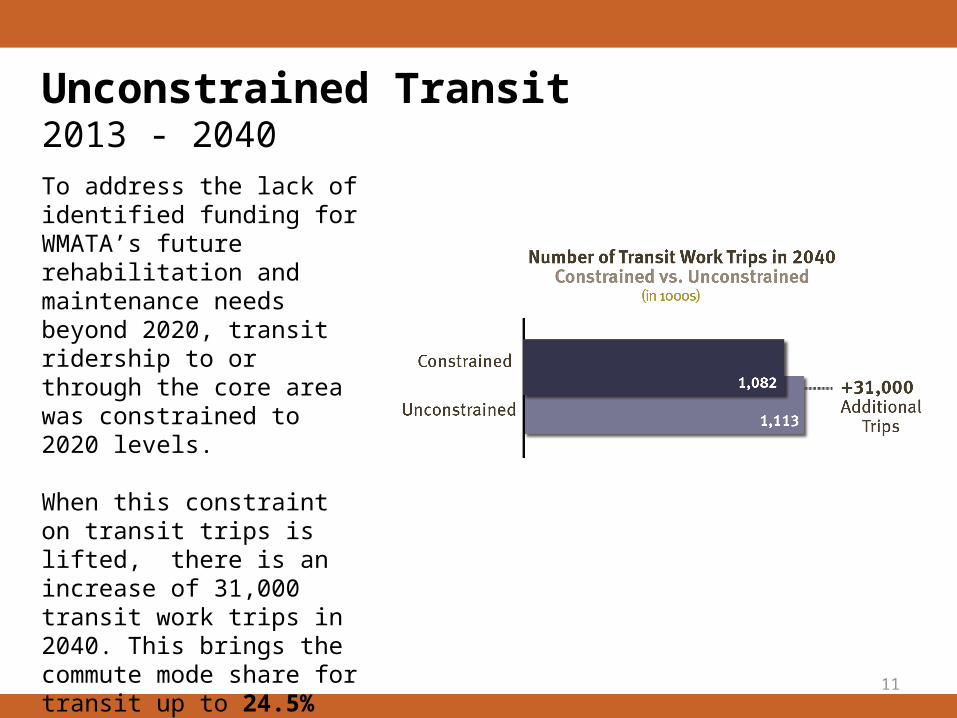
To address the lack of identified funding for WMATA’s future rehabilitation and maintenance needs beyond 2020, transit ridership to or through the core area was constrained to 2020 levels.
When this constraint on transit trips is lifted, there is an increase of 31,000 transit work trips in 2040. This brings the commute mode share for transit up to 24.5% from 24.0%.
Unconstrained Transit 2013 - 2040
12
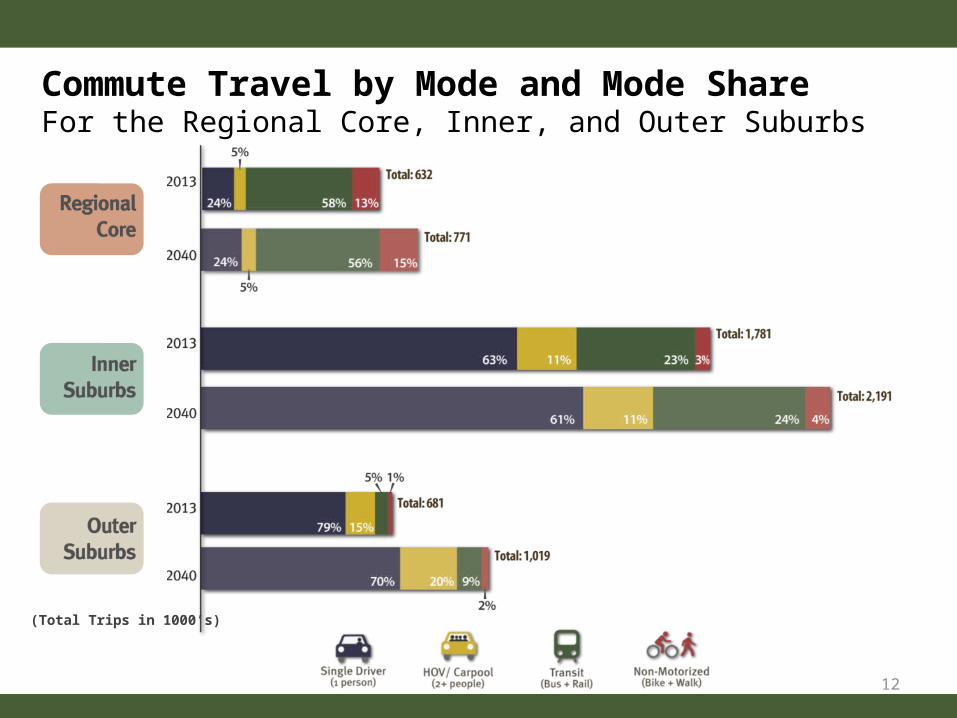
Commute Travel by Mode and Mode ShareFor the Regional Core, Inner, and Outer Suburbs
(Total Trips in 1000’s)
13
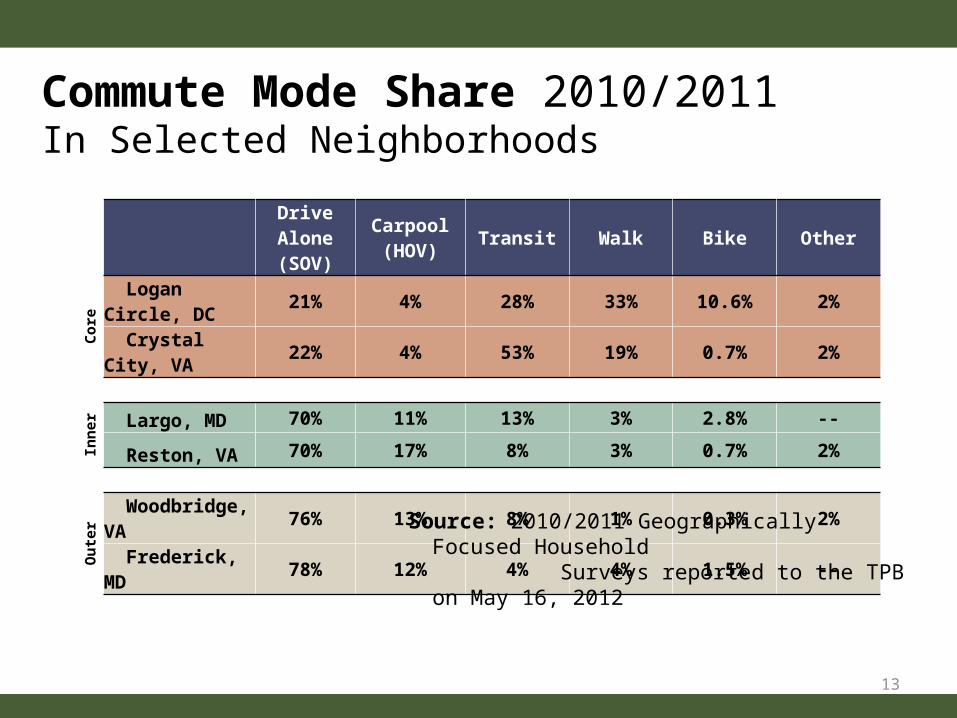
Commute Mode Share 2010/2011In Selected Neighborhoods
Drive Alone (SOV)
Carpool (HOV) Transit Walk Bike Other
Core
Logan Circle, DC 21% 4% 28% 33% 10.6% 2%
Crystal City, VA 22% 4% 53% 19% 0.7% 2%
Inner
Largo, MD 70% 11% 13% 3% 2.8% --
Reston, VA 70% 17% 8% 3% 0.7% 2%
Outer
Woodbridge, VA 76% 13% 8% 1% 0.3% 2%
Frederick, MD 78% 12% 4% 4% 1.5% --
Source: 2010/2011 Geographically Focused Household Surveys reported to the TPB on May 16, 2012

14
Highway Congestion 2013 - 2040
AM Rush Highway
Congestion, 2040
NOTE: I-95 and I-495 in VA illustrates only non-priced lanes. Priced lanes will have free flow traffic.
AM Rush Highway
Congestion, 2013

15
Highway Congestion 2013 - 20401. AM congestion is expected to increase throughout most of the
region in 2040, particularly in the following outer jurisdiction locations:
• I-95 North in Prince William County• I-70 East in Frederick County• I-270 South in Frederick and Montgomery Counties• I-66 East in Prince Williams and Fairfax Counties• The Dulles Toll Rd. Eastbound in Loudoun and Fairfax
Counties
2. Congestion will also increase inside the Capital Beltway along I-395 North, I-295/MD-295 North, and the George Washington Memorial Parkway; however I-66 is expected to be uncongested due to planned HOV-3 restrictions.
3. While the Capital Beltway is expected to be more congested in most locations, congestion along the inner and outer loops in Fairfax County will be somewhat reduced due to the Express Toll Lanes.

16
Transit Congestion 2013 - 2040The Metrorail system will likely reach capacity on trips to and through the regional core, due to lack of funding for capacity enhancements.
Without additional railcars beyond those currently funded, all lines entering the core will become congested by 2040.
17
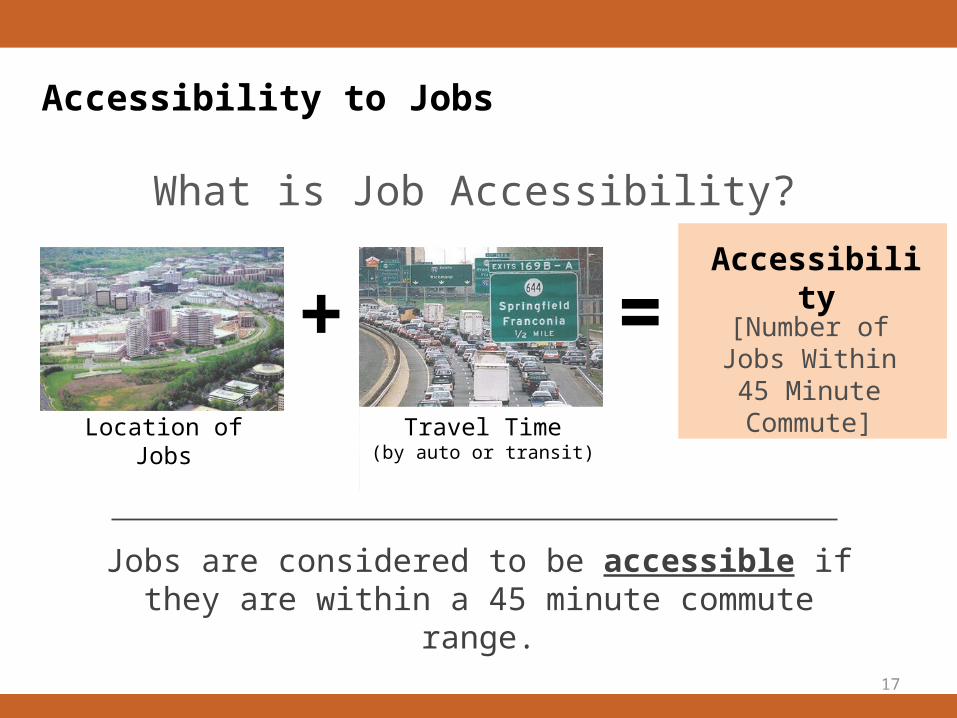
What is Job Accessibility?
+Location of Jobs Travel Time
(by auto or transit)
=Accessibilit
y[Number of Jobs
Within 45 Minute
Commute]
Jobs are considered to be accessible if they are within a 45 minute commute range.
Accessibility to Jobs
18
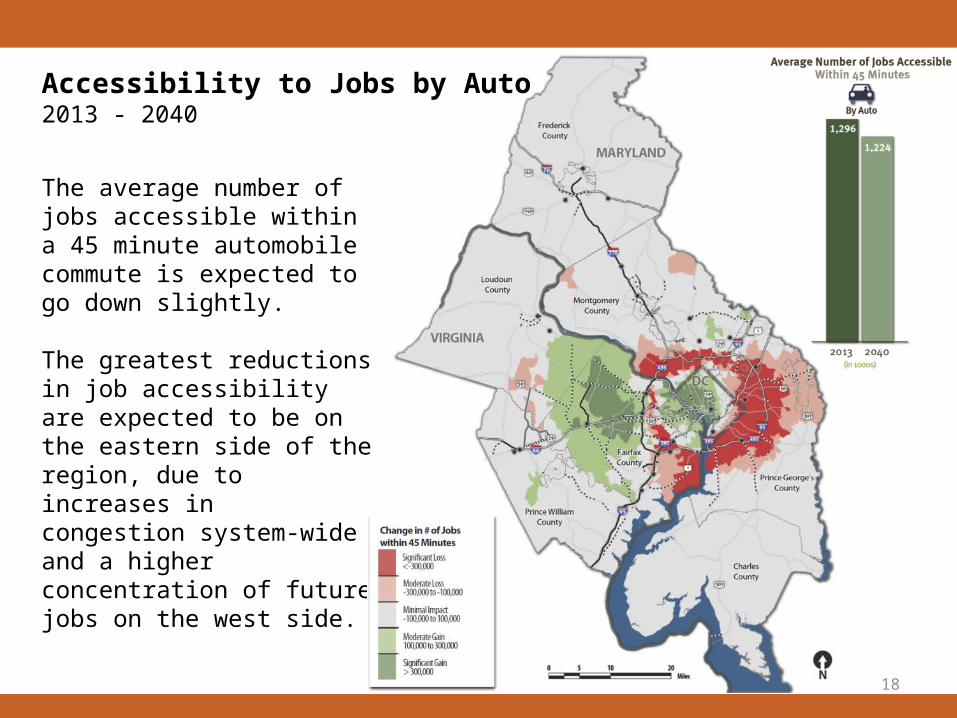
The average number of jobs accessible within a 45 minute automobile commute is expected to go down slightly.
The greatest reductions in job accessibility are expected to be on the eastern side of the region, due to increases in congestion system-wide and a higher concentration of future jobs on the west side.
Accessibility to Jobs by Auto 2013 - 2040
19
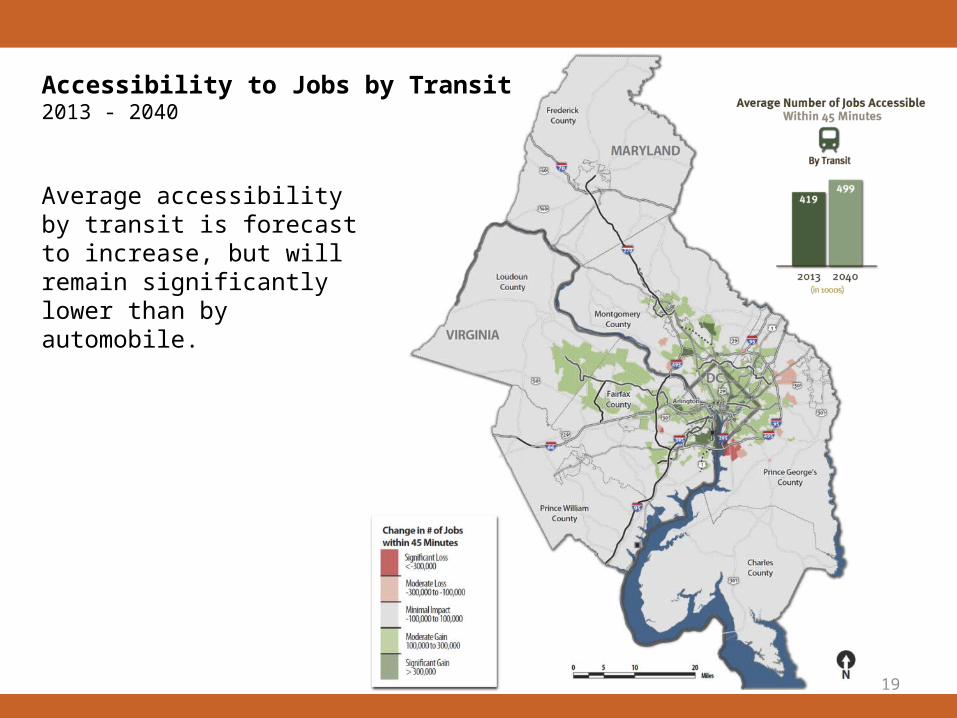
Accessibility to Jobs by Transit 2013 - 2040
Average accessibility by transit is forecast to increase, but will remain significantly lower than by automobile.
20
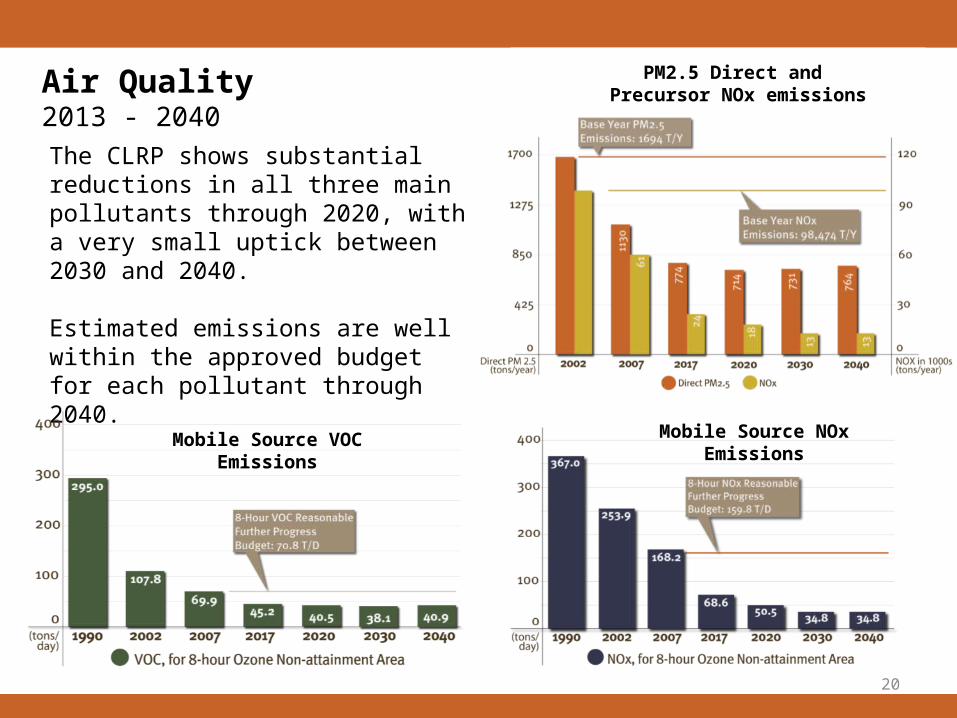
Air Quality2013 - 2040
Mobile Source VOC Emissions
Mobile Source NOx Emissions
PM2.5 Direct and Precursor NOx emissions
The CLRP shows substantial reductions in all three main pollutants through 2020, with a very small uptick between 2030 and 2040.
Estimated emissions are well within the approved budget for each pollutant through 2040.
21
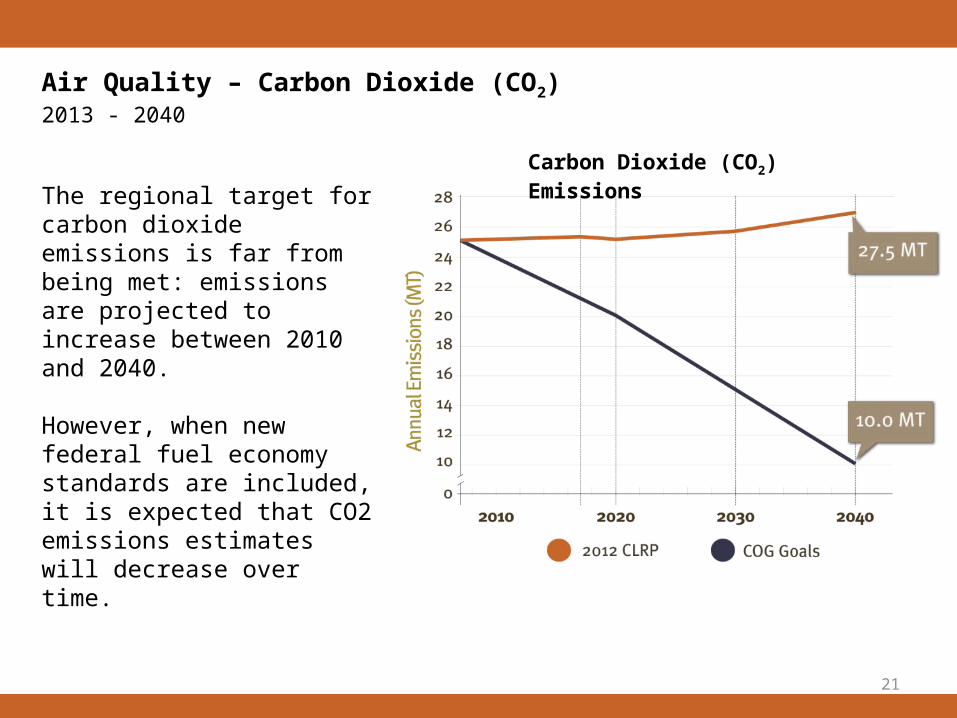
Air Quality – Carbon Dioxide (CO2)2013 - 2040
The regional target for carbon dioxide emissions is far from being met: emissions are projected to increase between 2010 and 2040.
However, when new federal fuel economy standards are included, it is expected that CO2 emissions estimates will decrease over time.
Carbon Dioxide (CO2) Emissions
22
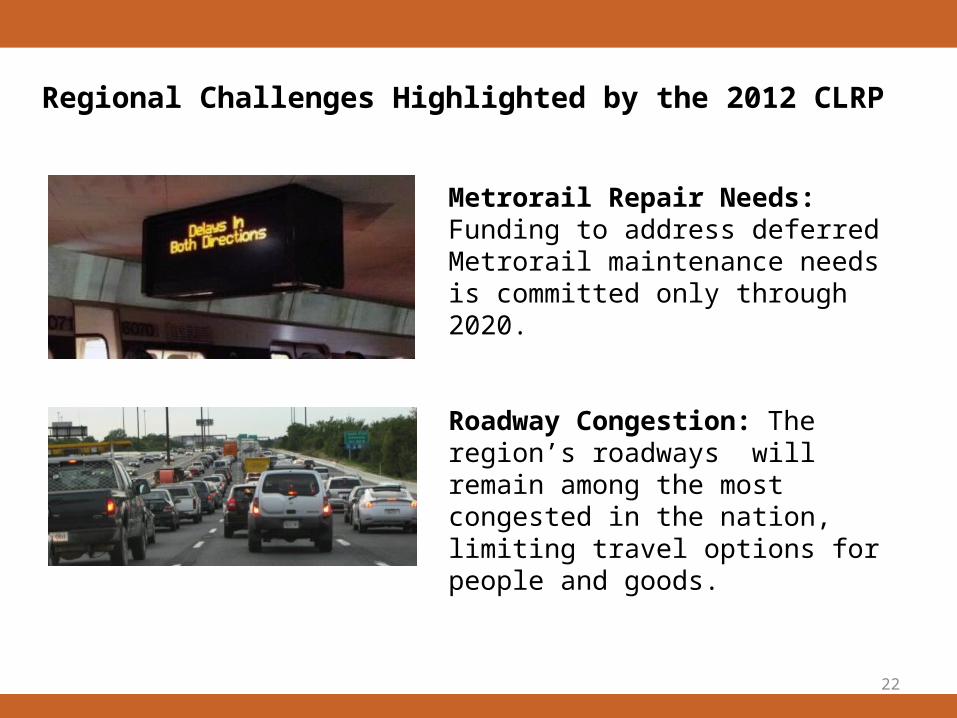
Regional Challenges Highlighted by the 2012 CLRP
Roadway Congestion: The region’s roadways will remain among the most congested in the nation, limiting travel options for people and goods.
Metrorail Repair Needs: Funding to address deferred Metrorail maintenance needs is committed only through 2020.
23
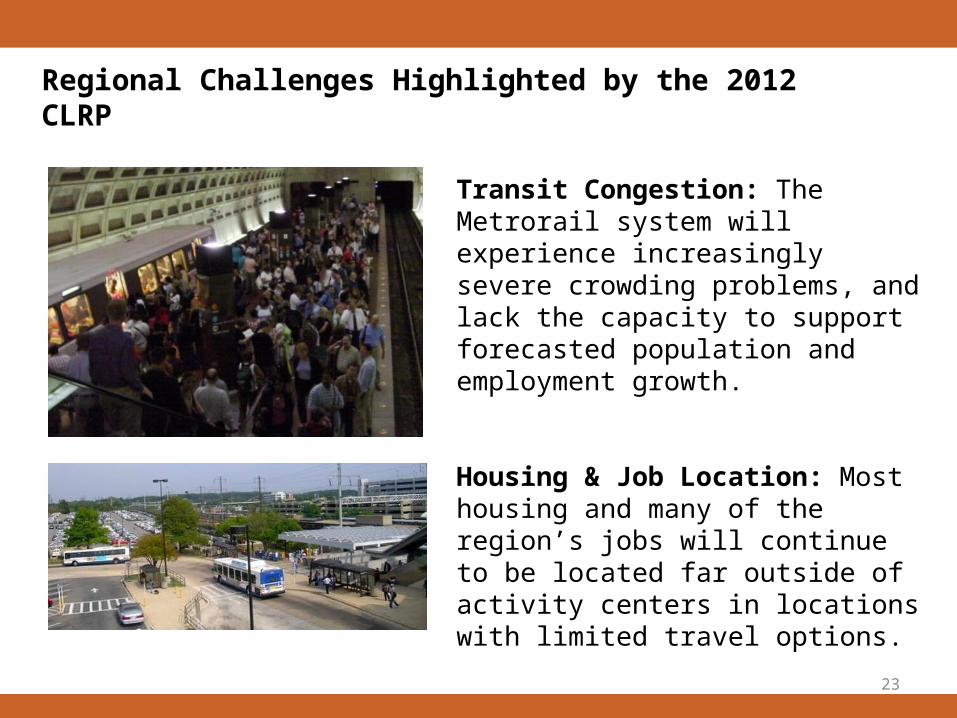
Regional Challenges Highlighted by the 2012 CLRP
Transit Congestion: The Metrorail system will experience increasingly severe crowding problems, and lack the capacity to support forecasted population and employment growth.
Housing & Job Location: Most housing and many of the region’s jobs will continue to be located far outside of activity centers in locations with limited travel options.

24
CLRP Funding and Expenditures
25
Addressing the Challenges Highlighted by the 2012 CLRP
1. Obtain additional funding for both transit and roadways• Transit:
o Funding for Metrorail maintenance and rehabilitation needs beyond 2020
o Funding to expand Metrorail capacity through 8-car trains and other measures
• Roadways:o Sufficient funding to support both road and bridge maintenance
requirements and the capacity improvements needed to accommodate a growing region
2. Improve coordination of transportation and land-use– Take advantage of the many untapped opportunities for mixed-
use development near existing rail stations– Concentrate more of the region’s housing and employment
growth in activity centers and other areas with good transportation options
– Address the imbalance between the east and west sides of the region