Embed Size (px)
Citation preview
Performance analysis of optical OFDMtransmission systems using PAPR
mitigation techniques and alternativetransforms.
byLaia Nadal Reixats
Master thesis directorDr. Michela Svaluto Moreolo
Master thesis assistant directorDr. Gabriel Junyent Giralt
April 2012
A thesis submitted to the Departament of Teoria del Senyal i Comunicacions ofthe Universitat Politècnica de Catalunya
for the degree Master of Science
Optical Networking AreaCentre Tecnològic de Telecomunicacions de Catalunya (CTTC)
Castelldefels, Barcelona


To my family and friends.

Contents
1 Introduction 11.1 Optical communications . . . . . . . . . . . . . . . . . . . . . . . . . . . . . . 2
1.1.1 Optical transmitters . . . . . . . . . . . . . . . . . . . . . . . . . . . . . 31.1.2 Optical fibers . . . . . . . . . . . . . . . . . . . . . . . . . . . . . . . . 61.1.3 Optical amplifiers . . . . . . . . . . . . . . . . . . . . . . . . . . . . . . 91.1.4 Optical receivers . . . . . . . . . . . . . . . . . . . . . . . . . . . . . . 10
1.2 Background of OFDM systems . . . . . . . . . . . . . . . . . . . . . . . . . . . 111.3 Summary of the thesis . . . . . . . . . . . . . . . . . . . . . . . . . . . . . . . 12
2 Optical-Orthogonal frequency division multiplexing 132.1 Optical-Orthogonal Frequency Division Multiplexing . . . . . . . . . . . . . . . 13
2.1.1 Orthogonal Frequency Division Multiplexing . . . . . . . . . . . . . . . 132.1.2 Intensity-Modulation . . . . . . . . . . . . . . . . . . . . . . . . . . . 162.1.3 Direct-Detection and Coherent detection . . . . . . . . . . . . . . . . . . 18
3 Transforms used in O-OFDM 213.1 Fast Fourier Transform . . . . . . . . . . . . . . . . . . . . . . . . . . . . . . . 213.2 Fast Hartley Transform . . . . . . . . . . . . . . . . . . . . . . . . . . . . . . . 233.3 Wavelet Transform . . . . . . . . . . . . . . . . . . . . . . . . . . . . . . . . . 24
3.3.1 Wavelets functions . . . . . . . . . . . . . . . . . . . . . . . . . . . . . 26
4 The peak-to-average power ratio problem 294.1 Peak-to-average power ratio definition . . . . . . . . . . . . . . . . . . . . . . . 294.2 PAPR reduction techniques . . . . . . . . . . . . . . . . . . . . . . . . . . . . . 30
4.2.1 Selective mapping . . . . . . . . . . . . . . . . . . . . . . . . . . . . . 304.2.2 Interleaving . . . . . . . . . . . . . . . . . . . . . . . . . . . . . . . . . 314.2.3 Partial transmit sequence . . . . . . . . . . . . . . . . . . . . . . . . . . 314.2.4 PAPR reduction techniques using precoding . . . . . . . . . . . . . . . . 32
i

5 Simulations results 355.1 PAPR evaluation in O-OFDM systems . . . . . . . . . . . . . . . . . . . . . . . 35
5.1.1 Comparison of PAPR reduction techniques applied to FFT and FHTbased O-OFDM systems . . . . . . . . . . . . . . . . . . . . . . . . . . 36
5.1.2 Precoding for PAPR reduction in FHT-based O-OFDM . . . . . . . . . . 395.1.3 PAPR of OFDM systems based on the DWPT . . . . . . . . . . . . . . . 40
5.2 BER performance of DC biased O-OFDM systems . . . . . . . . . . . . . . . . 425.2.1 DC biased O-OFDM system modeled with AWGN channel . . . . . . . 42
6 Conclusions and future work 456.1 Conclusions . . . . . . . . . . . . . . . . . . . . . . . . . . . . . . . . . . . . . 456.2 Future work . . . . . . . . . . . . . . . . . . . . . . . . . . . . . . . . . . . . . 45
ii
List of Figures
1.1 Optical OFDM communication system . . . . . . . . . . . . . . . . . . . . . . 21.2 Three basic processes of the interaction of light with matter. . . . . . . . . . . . 31.3 Fabry Perot semiconductor laser structure. . . . . . . . . . . . . . . . . . . . . . 41.4 MZM external modulator. . . . . . . . . . . . . . . . . . . . . . . . . . . . . . . 51.5 Transfer function for the optical intensity against the drive voltage. . . . . . . . . 61.6 (a) Refractive index profile for step-index fiber and (b) for graded-index fiber. . . 61.7 Light confinement in step-index fibers through the total internal reflection. . . . . 71.8 Light confinement in graded-index fibers through the total internal reflection. . . 81.9 Optical amplifier principle. . . . . . . . . . . . . . . . . . . . . . . . . . . . . . 91.10 Possible applications of optical amplifier: (a) In-line amplifiers, (b) pre-amplifiers
and (c) Booster or power amplifier. . . . . . . . . . . . . . . . . . . . . . . . . . 101.11 A semiconductor slab used as a photodetector. . . . . . . . . . . . . . . . . . . . 111.12 Historical evolution of OFDM [1] . . . . . . . . . . . . . . . . . . . . . . . . . 12
2.1 OFDM spectrum . . . . . . . . . . . . . . . . . . . . . . . . . . . . . . . . . . 142.2 Time domain signal of one subcarrier for two OFDM frames using CP . . . . . . 142.3 (a) 16-QAM and (b) 16-PSK constellations. . . . . . . . . . . . . . . . . . . . . 152.4 Diagram block of the OFDM transmitter based on the FFT . . . . . . . . . . . . 152.5 Diagram block of the OFDM receiver based on the FFT . . . . . . . . . . . . . . 162.6 Diagram block of a IM/DD system . . . . . . . . . . . . . . . . . . . . . . . . . 172.7 Real-valued OFDM time domain signal with (a) only odd subcarriers modulated
and (b) clipped to zero level (ACO-OFDM) and with (c) all subcarriers modu-lated and (d) clipped to zero level (DCO-OFDM) after adding a bias. . . . . . . . 18
2.8 Diagram block of a IM/DD system using four different transmission architec-tures: (a) RF conversion, (b) DMT modulation, (c) FHT tranform and (d) Hilberttransform. . . . . . . . . . . . . . . . . . . . . . . . . . . . . . . . . . . . . . . 19
2.9 Block diagram of a Coherent Optical-OFDM (CO-OFDM) system. . . . . . . . . 20
3.1 The radix-4 butterfly. . . . . . . . . . . . . . . . . . . . . . . . . . . . . . . . . 223.2 Schematic of DMT modulation. . . . . . . . . . . . . . . . . . . . . . . . . . . 233.3 Synthesis with IDWPT (modulation) and analysis with DWPT (demodulation)
for OFDM systems. . . . . . . . . . . . . . . . . . . . . . . . . . . . . . . . . . 26
iii
4.1 Diagram block of SLM PAPR reduction technique. . . . . . . . . . . . . . . . . 314.2 Diagram block of PTS PAPR reduction technique. . . . . . . . . . . . . . . . . . 32
5.1 CCDF vs. PAPR0 for (a) FHT-based OFDM signals (using BPSK and N =64) with SLM, interleaving, PTS, random PTS and without any PAPR reductiontechnique and for (b) FFT-based OFDM signals (using 4-QAM and N = 64)with and without SLM technique. . . . . . . . . . . . . . . . . . . . . . . . . . 36
5.2 (a) PAPR as a function of the number of subcarriers at a CCDF of 0.1% and (b)CCDF vs. PAPR0 for different oversampling factors for FHT-based O-OFDMsystem. . . . . . . . . . . . . . . . . . . . . . . . . . . . . . . . . . . . . . . . 37
5.3 CCDF vs. PAPR0 for FHT-based OFDM signals (using 4PAM and 16QAMrespectively and N=256) with SLM, interleaving, PTS and random PTS schemes,and without any PAPR reduction technique using 2 and 4 FHT blocks. . . . . . . 38
5.4 CCDF vs. PAPR0 for FHT-based OFDM signals (using 4PAM and N=256subcarriers) with SLM and HT or DCT varying the number of transform blocksand without any PAPR reduction technique. . . . . . . . . . . . . . . . . . . . . 40
5.5 Temporal OFDM signal based on (a) DWPT with Haar wavelet function and (b)FFT. . . . . . . . . . . . . . . . . . . . . . . . . . . . . . . . . . . . . . . . . . 40
5.6 PAPR of OFDM symbols based on FFT and DWPT . . . . . . . . . . . . . . . . 415.7 Block diagram of an O-OFDM IM/DD system based on FHT. The signal is lim-
ited in amplitude. . . . . . . . . . . . . . . . . . . . . . . . . . . . . . . . . . . 425.8 BER performance at two constant values of Eb/N0 versus clipping level for
8PAM O-OFDM (N = 256) with and without SLM technique in AWGN chan-nel. . . . . . . . . . . . . . . . . . . . . . . . . . . . . . . . . . . . . . . . . . 42
5.9 Performance of DC biased O-OFDM based on FHT with symmetrically clippingin AWGN channel. . . . . . . . . . . . . . . . . . . . . . . . . . . . . . . . . . 43
iv

List of Tables
3.1 Properties of some wavelet functions. . . . . . . . . . . . . . . . . . . . . . . . 27
5.1 PAPR reduction at a CCDF of 0.1%, of different PAPR reduction techniques,varying the number of IFHT blocks in transmission for N = 256 compared tothe unmodified signal. . . . . . . . . . . . . . . . . . . . . . . . . . . . . . . . . 37
5.2 PAPR reduction at a CCDF of 0.1%, of SLM and precoding with HT and DCTPAPR reduction techniques, varying the number of IFHT blocks in transmissionfor N = 256 compared to the unmodified signal. . . . . . . . . . . . . . . . . . 39
v


Acknowledgements
I would deeply thank my advisors, Michela Svaluto Moreolo and Gabriel Junyent Giralt for theirsupport and help in the development of this thesis and publications on this topic. I would alsolike to thank all the CTTC staff.
I would also give many thanks to my family, friends and boyfriend, who have always been withme.
Finally many thanks to the Spanish Ministry of Science and Innovation (MICINN), which haspartially supported this work through the project DORADO (TEC2009-07995) and the FPI re-search scholarship grant BES-2010- 031072.
vii

ACO-OFDM Asymmetrically Clipped Optical-OFDM
ADC Analog to Digital Converter
ASE Amplified SpontanEous
AWGN Additive White Gaussian Noise
BER Bit Error Rate
BPSK Binary Phase-Shift Keying
CCDF Complementary Cumulative Density Function
CDF Cumulative Density Function
CD Chromatic Dispersion
CO-OFDM Coherent Optical-OFDM
CP Cyclic Prefix
CWT Continuous Wavelet Transform
DAC Digital Analog Converter
DCT Discrete Cosine Transform
DMT Discrete MultiTone
DSP Digital Signal Processing
DD Direct-Detection
DHT Discrete Hartley Transform
DFT Discrete Fourier Transform
DWT Discrete Wavelet Transform
DWPT Discrete Wavelet Packet Transform
EAM ElectroAbsorption Modulator
EDFA Erbium-Doped Fiber Amplifier
FHT Fast Hartley transform
FFT Fast Fourier transform
FEC Forward Error Correction
viii

GVD Group-Velocity Dispersion
HS Hermitian Symmetry
HT Hadamard Transform
HDSL High-Bit-Rate Digital Subscriber Line
ICWT Inverse Continuous Wavelet Transform
IDFT Inverse Discrete Fourier Transform
IDWPT Inverse Discrete Wavelet Packet Transform
IM Intensity-Modulation
ICI InterCarrier Interference
IFHT Inverse Fast Hartley Transform
IFFT Inverse Fast Fourier Transform
ISI InterSymbol Interference
MZM Mach-Zehnder modulator
MCM MultiCarrier Modulation
MSM Metal-Semiconductor-Metal
NA Numerical Aperture
O-OFDM Optical Orthogonal Frequency Division Multiplexing
OFDM Orthogonal Frequency Division Multiplexing
PAM Pulse Amplitude-Modulation
PAPR Peak-to-average power ratio
PS Parallel to Serial
PMD Polarization Mode Dispersion
PSK Phase Shift Keying
PTS Partial Transmit Sequence
RF Radio Frequency
RDWPT Real Discrete Wavelet Packet Transform
ix

SSB Single Side Band
SOA Semiconductor Optical Amplifier
SSMF Standard Single Mode Fiber
QAM Quadrature Amplitude Modulation
SLM SeLective Mapping
SNR Signal to Noise Ratio
SP Serial to Paralel
WPT Wavelet Packet Transform
WT Wavelet Transform
x
Abstract
Orthogonal Frequency Division Multiplexing (OFDM) has recently been introduced in opticalcommunications because of its robustness against channel dispersion and its high spectral effi-ciency. OFDM is based on the Fast Fourier transform (FFT). In this thesis, we study alternativetransforms to create the OFDM symbols: the Fast Hartley transform (FHT) and the DiscreteWavelet Packet Transform (DWPT). Besides the advantages of using Optical Orthogonal Fre-quency Division Multiplexing (O-OFDM), there are also some disadvantages that must be takeninto account. High Peak-to-average power ratio (PAPR) is one of the major drawbacks of OFDM-based systems that can cause intermodulation among the subcarriers due to the nonlinearities ofthe fiber and devices such as analog-to-digital converters (ADC) and external modulators. Here,PAPR reduction techniques are studied to mitigate the effects of the PAPR. Finally, we demon-strate that applying PAPR reduction techniques to O-OFDM systems using intensity modulationand direct detection (IM/DD) the effects of the clipping noise are mitigated without the need ofadding a higher bias to the signal.
Chapter 1
Introduction
OFDM has emerged as a leading modulation technique [2] and [3] in the optical domain. It is alsoused in wireless and wireline applications and in almost every major communication standards.The use of OFDM in optical communications mitigates transmission impairments and, at thesame time, provides high-data rate transmission across dispersive optical media. The progress inDigital Signal Processing (DSP) technology can make processing at optical data rates feasible.O-OFDM introduces spectral efficiency and tolerance to impairments such as chromatic disper-sion (CD) and polarization mode dispersion (PMD) to the system. It belongs to a broader classof MultiCarrier Modulation (MCM) in which data information is carried over many lower ratesubcarriers. The subcarriers are orthogonal to each other, and their spectra can overlap. Thisresults in a very high spectral efficiency. The insertion of a Cyclic Prefix (CP) makes OFDM aneffective solution to InterSymbol Interference (ISI) and InterCarrier Interference (ICI), causedby a dispersive channel, that can degrade the performance of the system. This CP consists ofan identical copy of the first samples of the frame that are added at the end of it, implying anincrease of the signal bandwidth. The signal processing in the OFDM transmitter/receiver isbased on the FFT to implement the OFDM modulation/demodulation. So the symbols can begenerated in a very computationally efficient way. Other transforms are also suitable to generatethe OFDM symbols. This is the case of the Fast Hartley Transform (FHT) that has recently beenintroduced in Intensity-Modulation (IM)/Direct-Detection (DD) systems [4] because a simplertransmission system can be achieved with real processing. The use of Discrete Wavelet PacketTransform (DWPT) reduces the Peak-to-average power ratio (PAPR), one of the major draw-backs that presents OFDM systems. DWPT doesn’t need the use of the CP because it mitigatesISI effects and it is more robust respect to ICI, due to very high spectral containment propertiesof wavelet filters.
IM/DD is a cost effective solution for O-OFDM systems implementation, where real positivesignals are required. Whereas the OFDM symbols are bipolar and complex. To generate realOFDM signals Hermitian Symmetry (HS) must be forced when using the FFT. As the FHTis a real transform, a real signal is achieved at the output of the transform by previously map-ping the signal into a real constellation such as Binary Phase-Shift Keying (BPSK) or M-Pulse
1
Amplitude-Modulation (PAM) modulation format. On the other hand DC biased O-OFDM isused to achieve positive OFDM signals [5]. It consists of clipping and adding a bias to thesignal. Clipping the signal causes clipping noise that degrades the performance of the system.Indeed, the use of a high bias reduces the clipping noise despite it increases the electrical power.Alternatively, Asymmetrically Clipped Optical-OFDM (ACO-OFDM) can be also used to have apositive signal. ACO-OFDM doesn’t introduce clipping noise but it is less spectral efficient thanDC biased O-OFDM. In fact, the bandwidth of an ACO-OFDM signal is the double of a DCbiased O-OFDM one as half of the subcarriers are set to zero. In addition to clipping noise, thePAPR is a drawback of the OFDM that must be reduced in order to avoid signal distortion. It ex-ists a big effort in developing techniques [6] that can be applied to the OFDM system to mitigatethis effect. In general all the PAPR reduction techniques, have a trade-off between performanceand other parameters such as Bit Error Rate (BER) reduction, power increase, distortion or extrabandwidth requirements.
In this thesis we propose to apply PAPR reduction techniques to mitigate the effects of thePAPR and the clipping noise in DC biased O-OFDM systems.
This chapter gives an introduction on optical communications. Specially, optical transmitters,optical fibers, optical amplifiers and optical receivers will be briefly described. Then we gothrough the OFDM background and finally the outline of the thesis is provided.
1.1 Optical communications
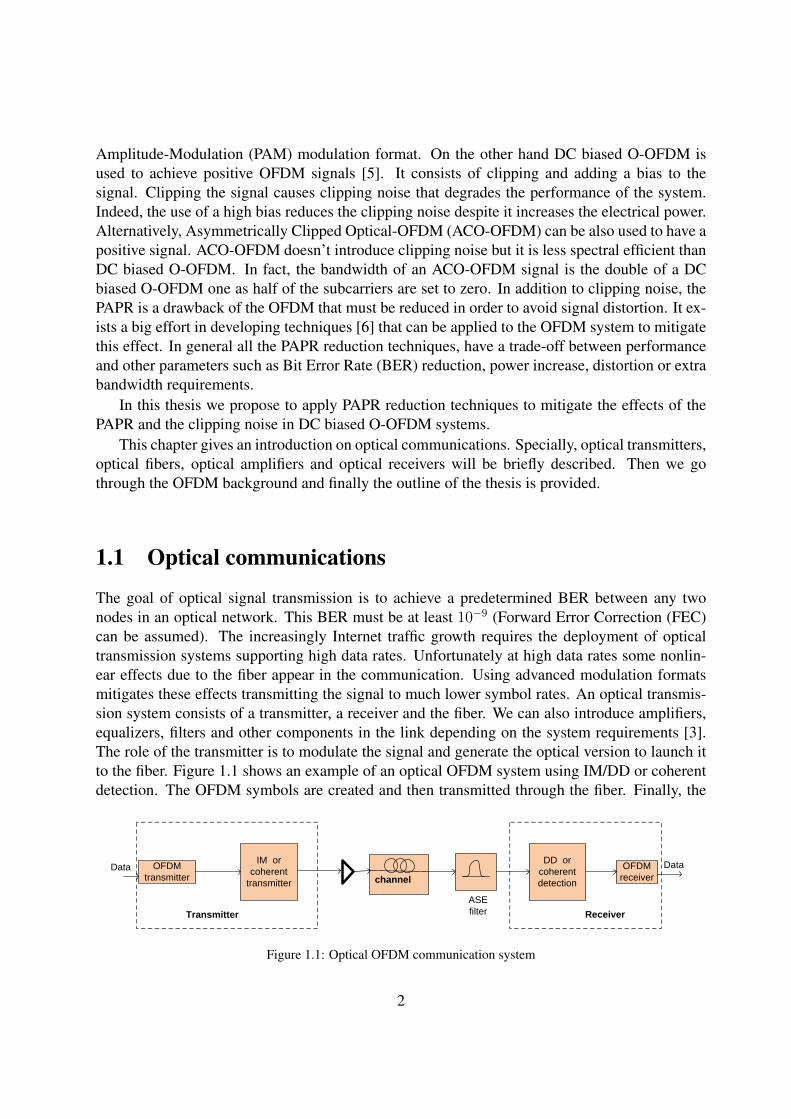
The goal of optical signal transmission is to achieve a predetermined BER between any twonodes in an optical network. This BER must be at least 10−9 (Forward Error Correction (FEC)can be assumed). The increasingly Internet traffic growth requires the deployment of opticaltransmission systems supporting high data rates. Unfortunately at high data rates some nonlin-ear effects due to the fiber appear in the communication. Using advanced modulation formatsmitigates these effects transmitting the signal to much lower symbol rates. An optical transmis-sion system consists of a transmitter, a receiver and the fiber. We can also introduce amplifiers,equalizers, filters and other components in the link depending on the system requirements [3].The role of the transmitter is to modulate the signal and generate the optical version to launch itto the fiber. Figure 1.1 shows an example of an optical OFDM system using IM/DD or coherentdetection. The OFDM symbols are created and then transmitted through the fiber. Finally, the
Data OFDM transmitter channel
OFDM receiver
Data
Transmitter ReceiverASE filter
IM or coherent
transmitter
DD or coherent detection
Figure 1.1: Optical OFDM communication system
2
receiver demodulates the OFDM symbols after detecting them with one or more photodetectors(PD) depending on the type of detection that is used.
1.1.1 Optical transmitters
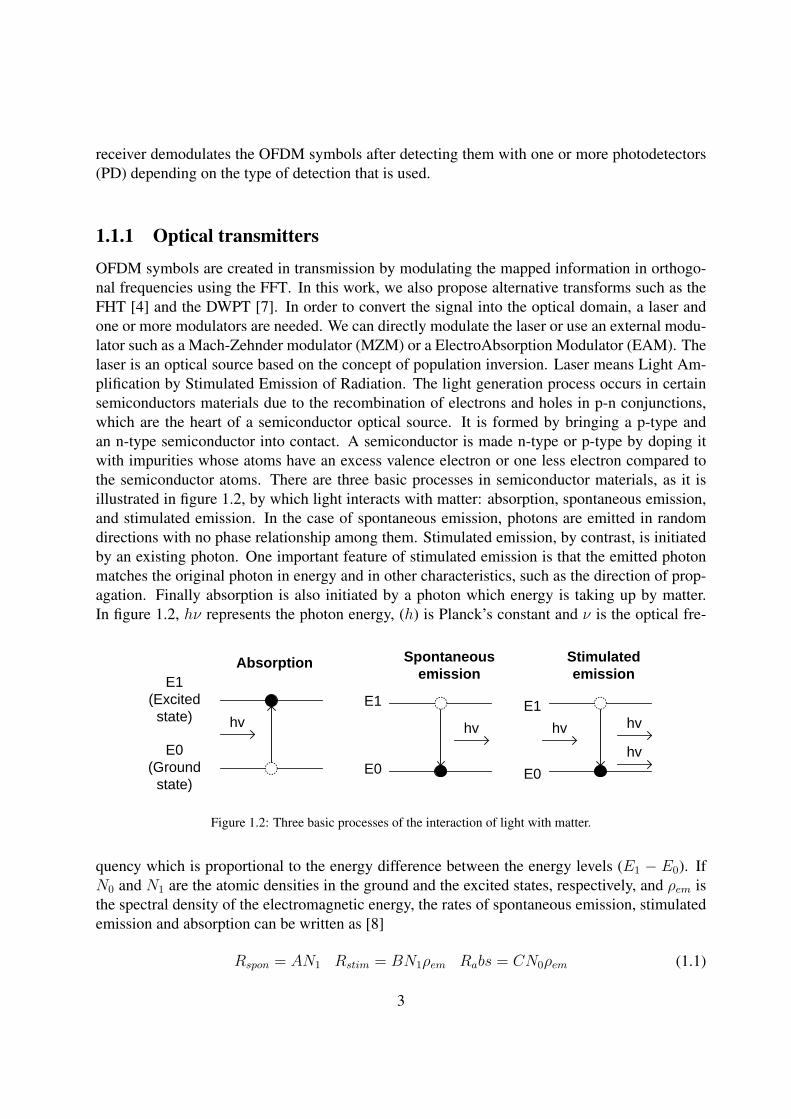
OFDM symbols are created in transmission by modulating the mapped information in orthogo-nal frequencies using the FFT. In this work, we also propose alternative transforms such as theFHT [4] and the DWPT [7]. In order to convert the signal into the optical domain, a laser andone or more modulators are needed. We can directly modulate the laser or use an external modu-lator such as a Mach-Zehnder modulator (MZM) or a ElectroAbsorption Modulator (EAM). Thelaser is an optical source based on the concept of population inversion. Laser means Light Am-plification by Stimulated Emission of Radiation. The light generation process occurs in certainsemiconductors materials due to the recombination of electrons and holes in p-n conjunctions,which are the heart of a semiconductor optical source. It is formed by bringing a p-type andan n-type semiconductor into contact. A semiconductor is made n-type or p-type by doping itwith impurities whose atoms have an excess valence electron or one less electron compared tothe semiconductor atoms. There are three basic processes in semiconductor materials, as it isillustrated in figure 1.2, by which light interacts with matter: absorption, spontaneous emission,and stimulated emission. In the case of spontaneous emission, photons are emitted in randomdirections with no phase relationship among them. Stimulated emission, by contrast, is initiatedby an existing photon. One important feature of stimulated emission is that the emitted photonmatches the original photon in energy and in other characteristics, such as the direction of prop-agation. Finally absorption is also initiated by a photon which energy is taking up by matter.In figure 1.2, hν represents the photon energy, (h) is Planck’s constant and ν is the optical fre-
E1 (Excited
state)
E0 (Ground
state)
hv
Absorption
hv
Spontaneous emission
hv
Stimulated emission
E1
E0 E0
E1
hvhv
Figure 1.2: Three basic processes of the interaction of light with matter.
quency which is proportional to the energy difference between the energy levels (E1 − E0). IfN0 and N1 are the atomic densities in the ground and the excited states, respectively, and ρem isthe spectral density of the electromagnetic energy, the rates of spontaneous emission, stimulatedemission and absorption can be written as [8]
Rspon = AN1 Rstim = BN1ρem Rabs = CN0ρem (1.1)
3
Where A,B,C are constants. In normal conditions, the number of electrons in the ground state(with energy E0) N0 is greater than in the excited state (with energy E1) N1. In thermal equilib-rium their ratio follows the Boltzman’s statistics [8]
N1
N0
= exp
(−hνkBT
)= exp
(−E1 − E0
kBT
), (1.2)
where kB is the Boltzman constant and T is the absolute temperature. Following [8] we can writethe ratio between Rstim and Rspon as
Rstim
Rspon
=
[exp
(hν
kBT− 1
)]−1� 1. (1.3)
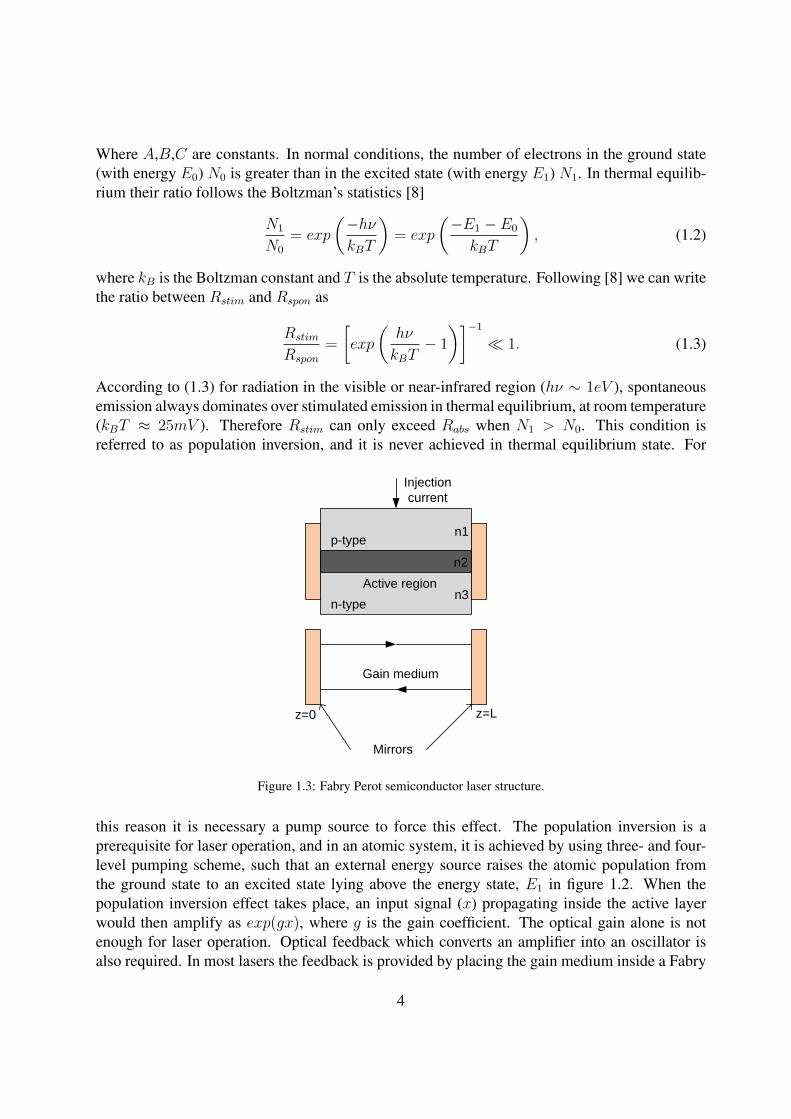
According to (1.3) for radiation in the visible or near-infrared region (hν ∼ 1eV ), spontaneousemission always dominates over stimulated emission in thermal equilibrium, at room temperature(kBT ≈ 25mV ). Therefore Rstim can only exceed Rabs when N1 > N0. This condition isreferred to as population inversion, and it is never achieved in thermal equilibrium state. For
Gain medium
Mirrors
z=0 z=L
p-type
n-typeActive region
n1
n2
n3
Injection current
Figure 1.3: Fabry Perot semiconductor laser structure.
this reason it is necessary a pump source to force this effect. The population inversion is aprerequisite for laser operation, and in an atomic system, it is achieved by using three- and four-level pumping scheme, such that an external energy source raises the atomic population fromthe ground state to an excited state lying above the energy state, E1 in figure 1.2. When thepopulation inversion effect takes place, an input signal (x) propagating inside the active layerwould then amplify as exp(gx), where g is the gain coefficient. The optical gain alone is notenough for laser operation. Optical feedback which converts an amplifier into an oscillator isalso required. In most lasers the feedback is provided by placing the gain medium inside a Fabry
4
Ein(t)
V1(t)
V2(t)
Eout(t)
BiasRF signal
Figure 1.4: MZM external modulator.
Perot cavity formed by using two mirrors. Therefore, there are three basic components to sustainstimulated emission: the pump source, the active medium or cavity and the feedback mirrors.Depending on the active medium, which can be liquid, gaseous or solid we have different lasersuseful for different applications. One typical laser is the semiconductor laser, which emit lightthrough stimulated emission. Figure 1.3 shows the scheme of a Fabry Perot semiconductor laser.
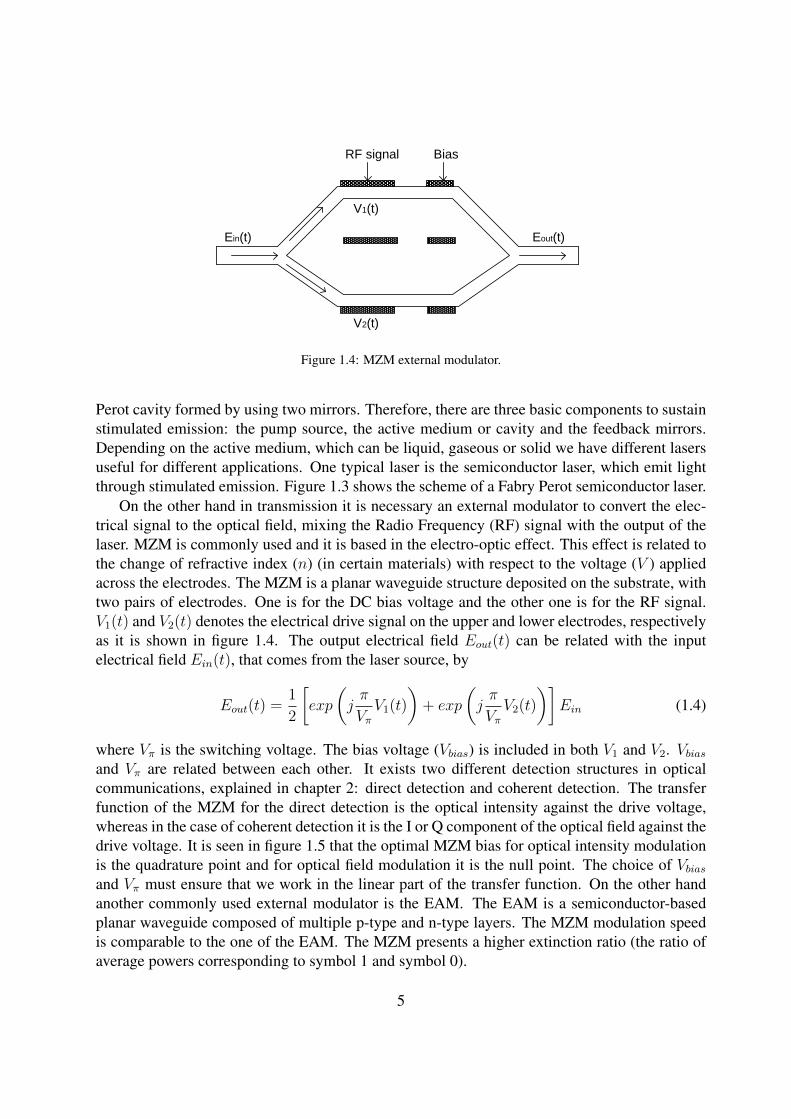
On the other hand in transmission it is necessary an external modulator to convert the elec-trical signal to the optical field, mixing the Radio Frequency (RF) signal with the output of thelaser. MZM is commonly used and it is based in the electro-optic effect. This effect is related tothe change of refractive index (n) (in certain materials) with respect to the voltage (V ) appliedacross the electrodes. The MZM is a planar waveguide structure deposited on the substrate, withtwo pairs of electrodes. One is for the DC bias voltage and the other one is for the RF signal.V1(t) and V2(t) denotes the electrical drive signal on the upper and lower electrodes, respectivelyas it is shown in figure 1.4. The output electrical field Eout(t) can be related with the inputelectrical field Ein(t), that comes from the laser source, by
Eout(t) =1
2
[exp
(jπ
VπV1(t)
)+ exp
(jπ
VπV2(t)
)]Ein (1.4)
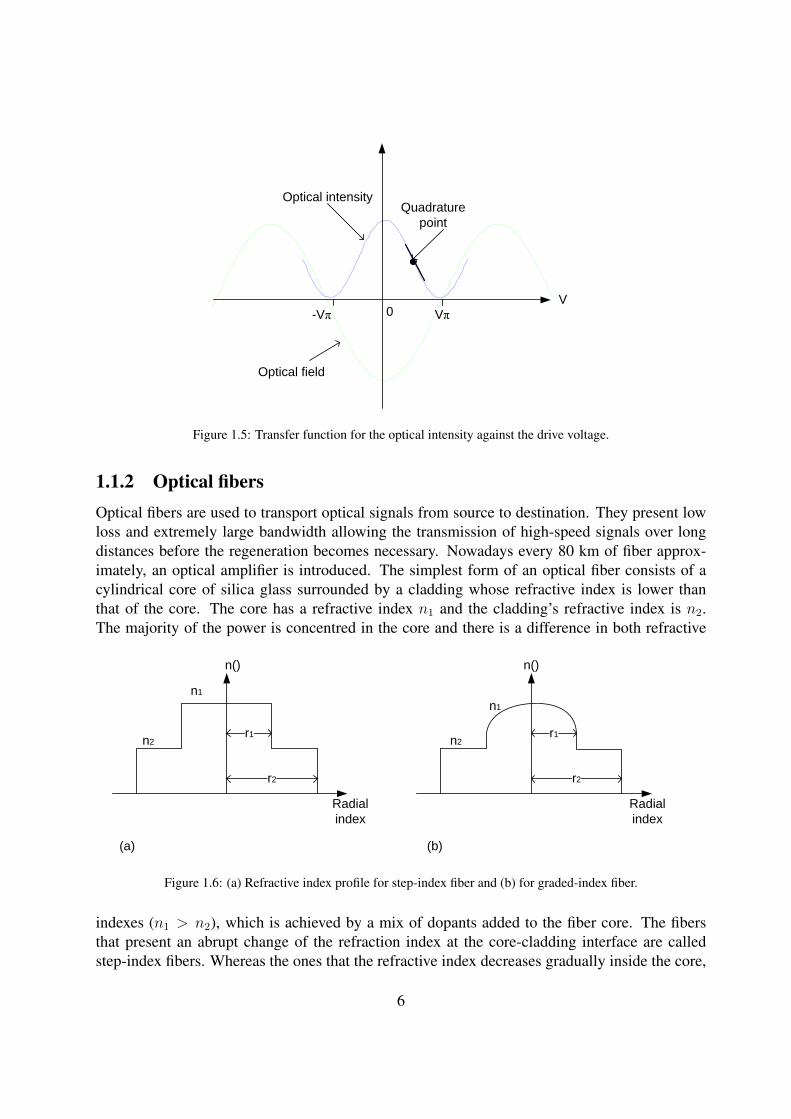
where Vπ is the switching voltage. The bias voltage (Vbias) is included in both V1 and V2. Vbiasand Vπ are related between each other. It exists two different detection structures in opticalcommunications, explained in chapter 2: direct detection and coherent detection. The transferfunction of the MZM for the direct detection is the optical intensity against the drive voltage,whereas in the case of coherent detection it is the I or Q component of the optical field against thedrive voltage. It is seen in figure 1.5 that the optimal MZM bias for optical intensity modulationis the quadrature point and for optical field modulation it is the null point. The choice of Vbiasand Vπ must ensure that we work in the linear part of the transfer function. On the other handanother commonly used external modulator is the EAM. The EAM is a semiconductor-basedplanar waveguide composed of multiple p-type and n-type layers. The MZM modulation speedis comparable to the one of the EAM. The MZM presents a higher extinction ratio (the ratio ofaverage powers corresponding to symbol 1 and symbol 0).
5
-Vπ
Quadrature point
Optical intensity
VVπ0
Optical field
Figure 1.5: Transfer function for the optical intensity against the drive voltage.
1.1.2 Optical fibersOptical fibers are used to transport optical signals from source to destination. They present lowloss and extremely large bandwidth allowing the transmission of high-speed signals over longdistances before the regeneration becomes necessary. Nowadays every 80 km of fiber approx-imately, an optical amplifier is introduced. The simplest form of an optical fiber consists of acylindrical core of silica glass surrounded by a cladding whose refractive index is lower thanthat of the core. The core has a refractive index n1 and the cladding’s refractive index is n2.The majority of the power is concentred in the core and there is a difference in both refractive
n()
n1
n2r1
r2
n()
n1
n2r1
r2
Radial index
Radial index
(a) (b)
Figure 1.6: (a) Refractive index profile for step-index fiber and (b) for graded-index fiber.
indexes (n1 > n2), which is achieved by a mix of dopants added to the fiber core. The fibersthat present an abrupt change of the refraction index at the core-cladding interface are calledstep-index fibers. Whereas the ones that the refractive index decreases gradually inside the core,
6
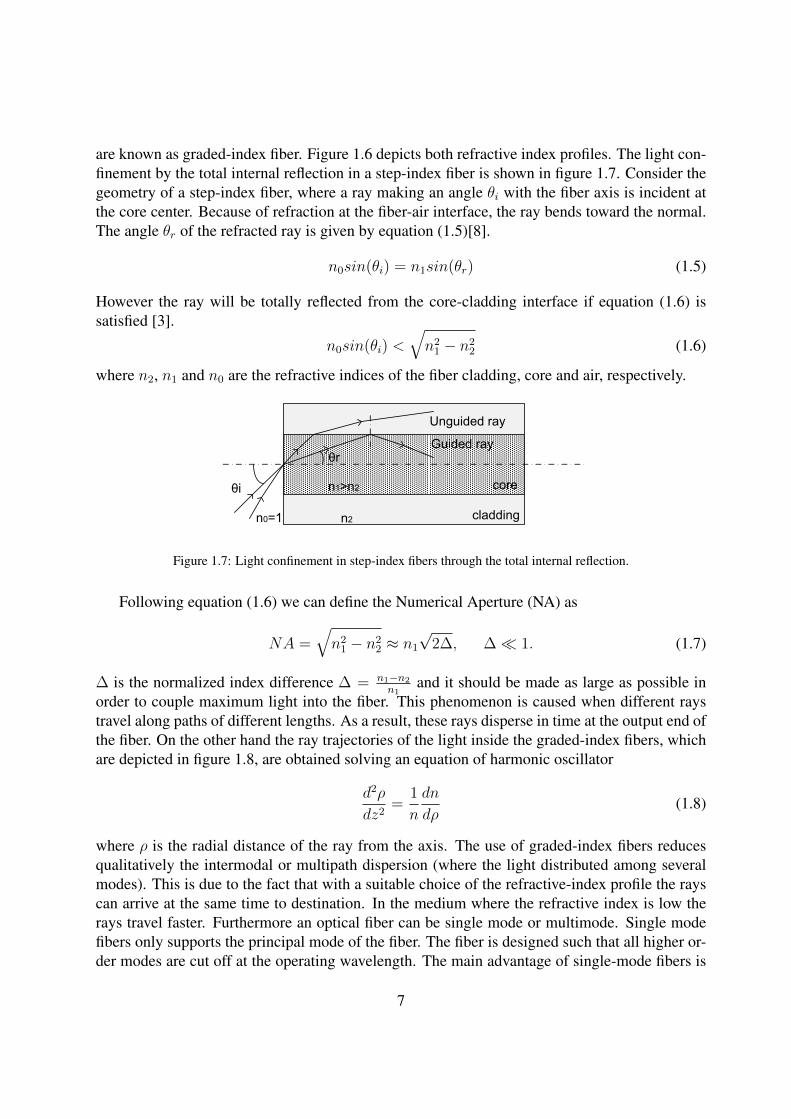
are known as graded-index fiber. Figure 1.6 depicts both refractive index profiles. The light con-finement by the total internal reflection in a step-index fiber is shown in figure 1.7. Consider thegeometry of a step-index fiber, where a ray making an angle θi with the fiber axis is incident atthe core center. Because of refraction at the fiber-air interface, the ray bends toward the normal.The angle θr of the refracted ray is given by equation (1.5)[8].
n0sin(θi) = n1sin(θr) (1.5)
However the ray will be totally reflected from the core-cladding interface if equation (1.6) issatisfied [3].
n0sin(θi) <√n21 − n2
2 (1.6)
where n2, n1 and n0 are the refractive indices of the fiber cladding, core and air, respectively.
θi n1>n2 core
claddingn2n0=1
Guided ray
Unguided ray
θr
Figure 1.7: Light confinement in step-index fibers through the total internal reflection.
Following equation (1.6) we can define the Numerical Aperture (NA) as
NA =√n21 − n2
2 ≈ n1
√2∆, ∆� 1. (1.7)
∆ is the normalized index difference ∆ = n1−n2
n1and it should be made as large as possible in
order to couple maximum light into the fiber. This phenomenon is caused when different raystravel along paths of different lengths. As a result, these rays disperse in time at the output end ofthe fiber. On the other hand the ray trajectories of the light inside the graded-index fibers, whichare depicted in figure 1.8, are obtained solving an equation of harmonic oscillator
d2ρ
dz2=
1
n
dn
dρ(1.8)
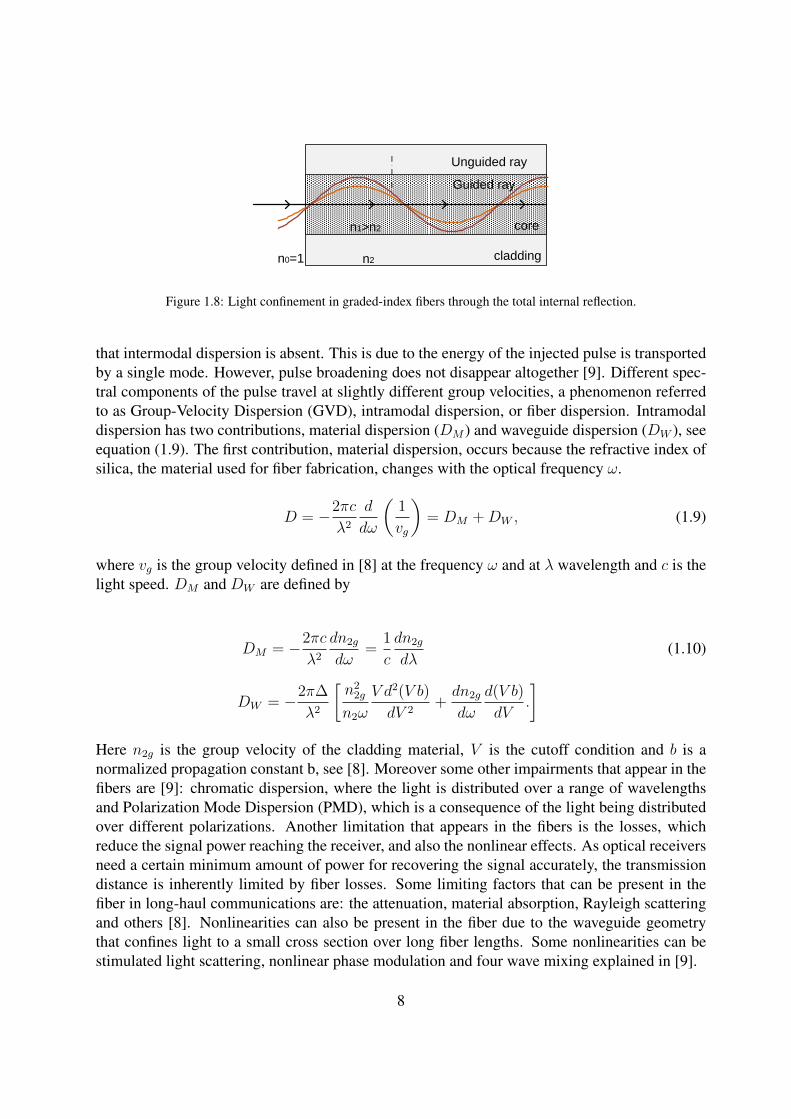
where ρ is the radial distance of the ray from the axis. The use of graded-index fibers reducesqualitatively the intermodal or multipath dispersion (where the light distributed among severalmodes). This is due to the fact that with a suitable choice of the refractive-index profile the rayscan arrive at the same time to destination. In the medium where the refractive index is low therays travel faster. Furthermore an optical fiber can be single mode or multimode. Single modefibers only supports the principal mode of the fiber. The fiber is designed such that all higher or-der modes are cut off at the operating wavelength. The main advantage of single-mode fibers is
7
n1>n2 core
claddingn2n0=1
Guided ray
Unguided ray
Figure 1.8: Light confinement in graded-index fibers through the total internal reflection.
that intermodal dispersion is absent. This is due to the energy of the injected pulse is transportedby a single mode. However, pulse broadening does not disappear altogether [9]. Different spec-tral components of the pulse travel at slightly different group velocities, a phenomenon referredto as Group-Velocity Dispersion (GVD), intramodal dispersion, or fiber dispersion. Intramodaldispersion has two contributions, material dispersion (DM ) and waveguide dispersion (DW ), seeequation (1.9). The first contribution, material dispersion, occurs because the refractive index ofsilica, the material used for fiber fabrication, changes with the optical frequency ω.
D = −2πc
λ2d
dω
(1
vg
)= DM +DW , (1.9)
where vg is the group velocity defined in [8] at the frequency ω and at λ wavelength and c is thelight speed. DM and DW are defined by
DM = −2πc
λ2dn2g
dω=
1
c
dn2g
dλ(1.10)
DW = −2π∆
λ2
[n22g
n2ω
V d2(V b)
dV 2+dn2g
dω
d(V b)
dV.
]Here n2g is the group velocity of the cladding material, V is the cutoff condition and b is anormalized propagation constant b, see [8]. Moreover some other impairments that appear in thefibers are [9]: chromatic dispersion, where the light is distributed over a range of wavelengthsand Polarization Mode Dispersion (PMD), which is a consequence of the light being distributedover different polarizations. Another limitation that appears in the fibers is the losses, whichreduce the signal power reaching the receiver, and also the nonlinear effects. As optical receiversneed a certain minimum amount of power for recovering the signal accurately, the transmissiondistance is inherently limited by fiber losses. Some limiting factors that can be present in thefiber in long-haul communications are: the attenuation, material absorption, Rayleigh scatteringand others [8]. Nonlinearities can also be present in the fiber due to the waveguide geometrythat confines light to a small cross section over long fiber lengths. Some nonlinearities can bestimulated light scattering, nonlinear phase modulation and four wave mixing explained in [9].
8
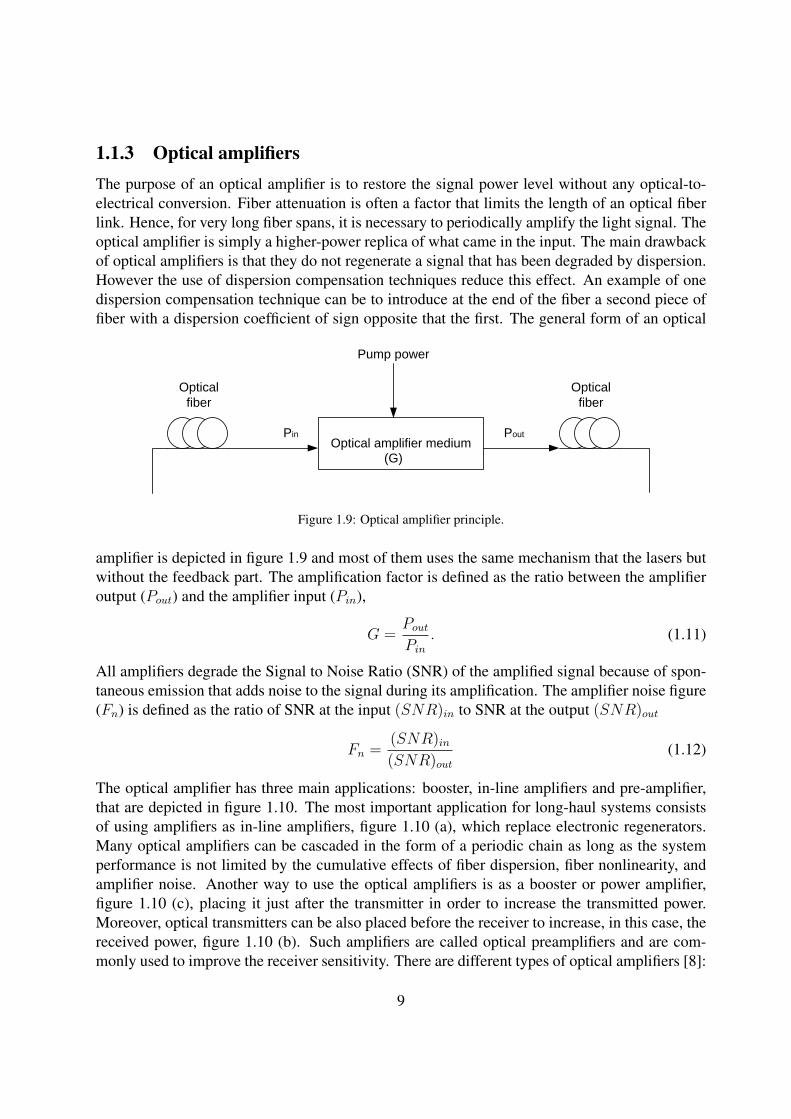
1.1.3 Optical amplifiersThe purpose of an optical amplifier is to restore the signal power level without any optical-to-electrical conversion. Fiber attenuation is often a factor that limits the length of an optical fiberlink. Hence, for very long fiber spans, it is necessary to periodically amplify the light signal. Theoptical amplifier is simply a higher-power replica of what came in the input. The main drawbackof optical amplifiers is that they do not regenerate a signal that has been degraded by dispersion.However the use of dispersion compensation techniques reduce this effect. An example of onedispersion compensation technique can be to introduce at the end of the fiber a second piece offiber with a dispersion coefficient of sign opposite that the first. The general form of an optical
Optical amplifier mediumPin Pout
(G)
Pump power
Optical fiber
Optical fiber
Figure 1.9: Optical amplifier principle.
amplifier is depicted in figure 1.9 and most of them uses the same mechanism that the lasers butwithout the feedback part. The amplification factor is defined as the ratio between the amplifieroutput (Pout) and the amplifier input (Pin),
G =PoutPin
. (1.11)
All amplifiers degrade the Signal to Noise Ratio (SNR) of the amplified signal because of spon-taneous emission that adds noise to the signal during its amplification. The amplifier noise figure(Fn) is defined as the ratio of SNR at the input (SNR)in to SNR at the output (SNR)out
Fn =(SNR)in(SNR)out
(1.12)
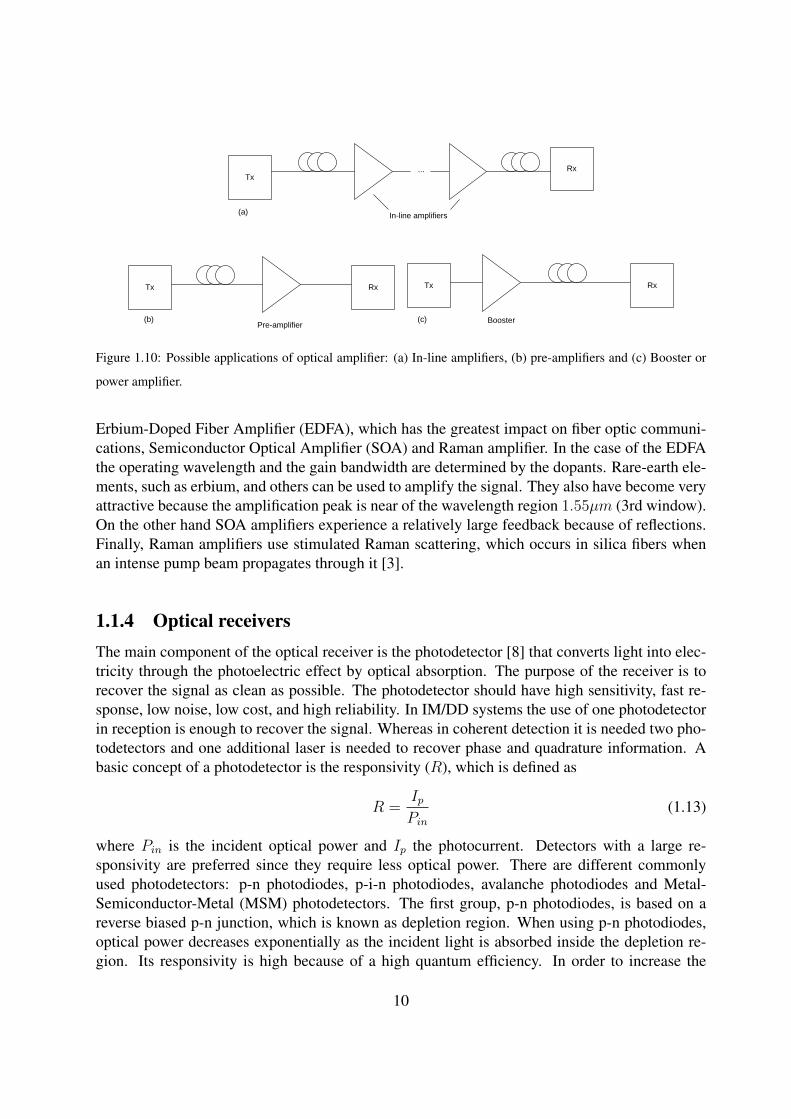
The optical amplifier has three main applications: booster, in-line amplifiers and pre-amplifier,that are depicted in figure 1.10. The most important application for long-haul systems consistsof using amplifiers as in-line amplifiers, figure 1.10 (a), which replace electronic regenerators.Many optical amplifiers can be cascaded in the form of a periodic chain as long as the systemperformance is not limited by the cumulative effects of fiber dispersion, fiber nonlinearity, andamplifier noise. Another way to use the optical amplifiers is as a booster or power amplifier,figure 1.10 (c), placing it just after the transmitter in order to increase the transmitted power.Moreover, optical transmitters can be also placed before the receiver to increase, in this case, thereceived power, figure 1.10 (b). Such amplifiers are called optical preamplifiers and are com-monly used to improve the receiver sensitivity. There are different types of optical amplifiers [8]:
9
(c)
(a)
Tx Rx
(b)
Tx... Rx
Booster
In-line amplifiers
Pre-amplifier
Tx Rx
Figure 1.10: Possible applications of optical amplifier: (a) In-line amplifiers, (b) pre-amplifiers and (c) Booster or
power amplifier.
Erbium-Doped Fiber Amplifier (EDFA), which has the greatest impact on fiber optic communi-cations, Semiconductor Optical Amplifier (SOA) and Raman amplifier. In the case of the EDFAthe operating wavelength and the gain bandwidth are determined by the dopants. Rare-earth ele-ments, such as erbium, and others can be used to amplify the signal. They also have become veryattractive because the amplification peak is near of the wavelength region 1.55µm (3rd window).On the other hand SOA amplifiers experience a relatively large feedback because of reflections.Finally, Raman amplifiers use stimulated Raman scattering, which occurs in silica fibers whenan intense pump beam propagates through it [3].
1.1.4 Optical receiversThe main component of the optical receiver is the photodetector [8] that converts light into elec-tricity through the photoelectric effect by optical absorption. The purpose of the receiver is torecover the signal as clean as possible. The photodetector should have high sensitivity, fast re-sponse, low noise, low cost, and high reliability. In IM/DD systems the use of one photodetectorin reception is enough to recover the signal. Whereas in coherent detection it is needed two pho-todetectors and one additional laser is needed to recover phase and quadrature information. Abasic concept of a photodetector is the responsivity (R), which is defined as
R =IpPin
(1.13)
where Pin is the incident optical power and Ip the photocurrent. Detectors with a large re-sponsivity are preferred since they require less optical power. There are different commonlyused photodetectors: p-n photodiodes, p-i-n photodiodes, avalanche photodiodes and Metal-Semiconductor-Metal (MSM) photodetectors. The first group, p-n photodiodes, is based on areverse biased p-n junction, which is known as depletion region. When using p-n photodiodes,optical power decreases exponentially as the incident light is absorbed inside the depletion re-gion. Its responsivity is high because of a high quantum efficiency. In order to increase the
10
Semico
nduc
tor
Ohmic contact
Figure 1.11: A semiconductor slab used as a photodetector.
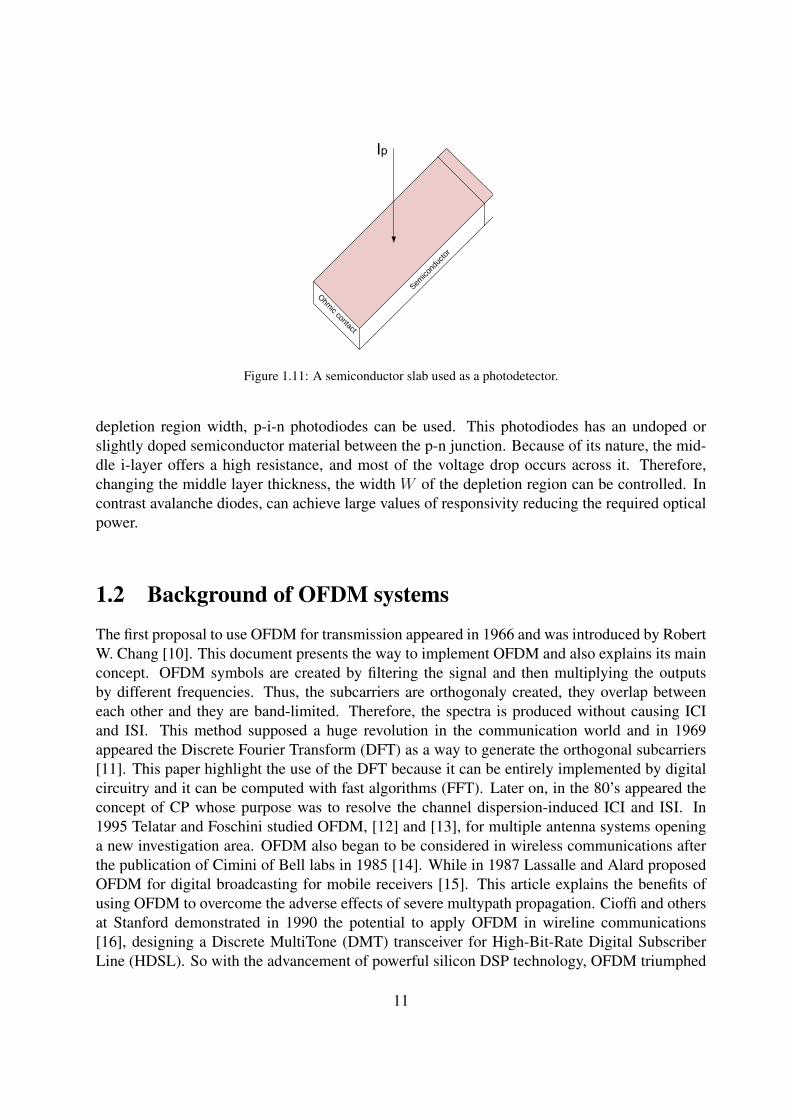
depletion region width, p-i-n photodiodes can be used. This photodiodes has an undoped orslightly doped semiconductor material between the p-n junction. Because of its nature, the mid-dle i-layer offers a high resistance, and most of the voltage drop occurs across it. Therefore,changing the middle layer thickness, the width W of the depletion region can be controlled. Incontrast avalanche diodes, can achieve large values of responsivity reducing the required opticalpower.
1.2 Background of OFDM systems
The first proposal to use OFDM for transmission appeared in 1966 and was introduced by RobertW. Chang [10]. This document presents the way to implement OFDM and also explains its mainconcept. OFDM symbols are created by filtering the signal and then multiplying the outputsby different frequencies. Thus, the subcarriers are orthogonaly created, they overlap betweeneach other and they are band-limited. Therefore, the spectra is produced without causing ICIand ISI. This method supposed a huge revolution in the communication world and in 1969appeared the Discrete Fourier Transform (DFT) as a way to generate the orthogonal subcarriers[11]. This paper highlight the use of the DFT because it can be entirely implemented by digitalcircuitry and it can be computed with fast algorithms (FFT). Later on, in the 80’s appeared theconcept of CP whose purpose was to resolve the channel dispersion-induced ICI and ISI. In1995 Telatar and Foschini studied OFDM, [12] and [13], for multiple antenna systems openinga new investigation area. OFDM also began to be considered in wireless communications afterthe publication of Cimini of Bell labs in 1985 [14]. While in 1987 Lassalle and Alard proposedOFDM for digital broadcasting for mobile receivers [15]. This article explains the benefits ofusing OFDM to overcome the adverse effects of severe multypath propagation. Cioffi and othersat Stanford demonstrated in 1990 the potential to apply OFDM in wireline communications[16], designing a Discrete MultiTone (DMT) transceiver for High-Bit-Rate Digital SubscriberLine (HDSL). So with the advancement of powerful silicon DSP technology, OFDM triumphed
11
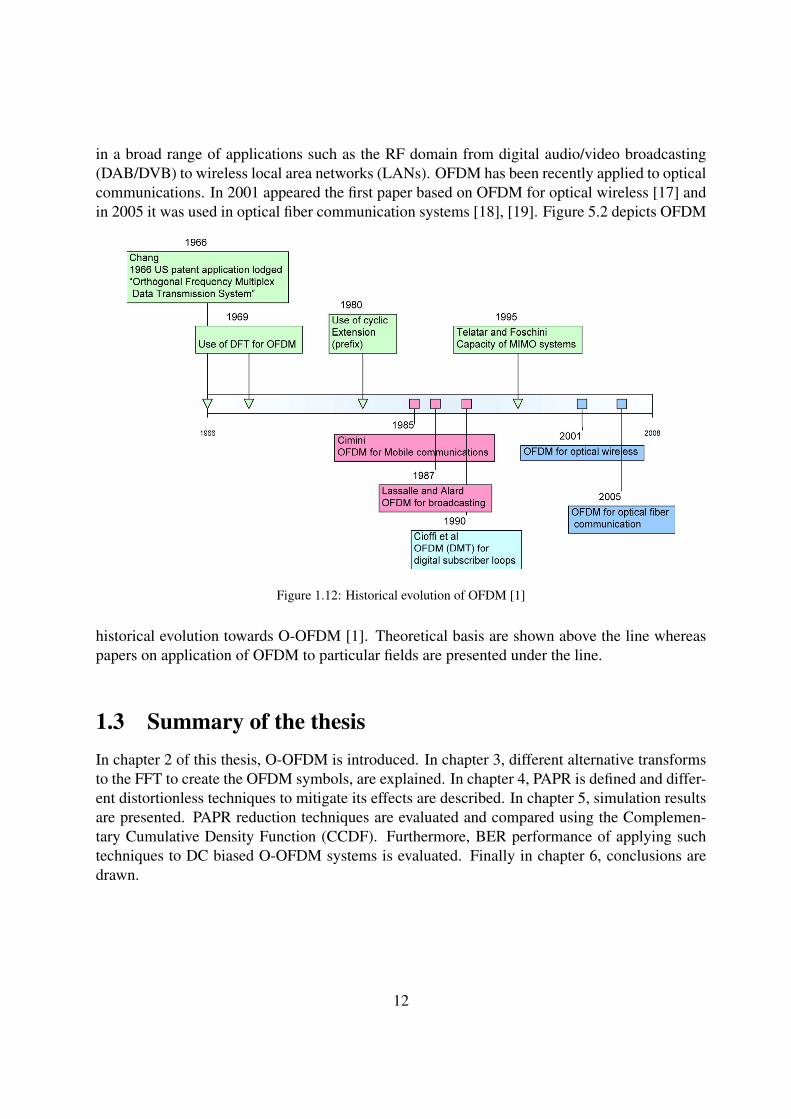
in a broad range of applications such as the RF domain from digital audio/video broadcasting(DAB/DVB) to wireless local area networks (LANs). OFDM has been recently applied to opticalcommunications. In 2001 appeared the first paper based on OFDM for optical wireless [17] andin 2005 it was used in optical fiber communication systems [18], [19]. Figure 5.2 depicts OFDM
Figure 1.12: Historical evolution of OFDM [1]
historical evolution towards O-OFDM [1]. Theoretical basis are shown above the line whereaspapers on application of OFDM to particular fields are presented under the line.
1.3 Summary of the thesisIn chapter 2 of this thesis, O-OFDM is introduced. In chapter 3, different alternative transformsto the FFT to create the OFDM symbols, are explained. In chapter 4, PAPR is defined and differ-ent distortionless techniques to mitigate its effects are described. In chapter 5, simulation resultsare presented. PAPR reduction techniques are evaluated and compared using the Complemen-tary Cumulative Density Function (CCDF). Furthermore, BER performance of applying suchtechniques to DC biased O-OFDM systems is evaluated. Finally in chapter 6, conclusions aredrawn.
12
Chapter 2
Optical-Orthogonal frequency division
multiplexing
In this chapter the OFDM is introduced. Moreover, two different architectures suitable for opticalcommunications are presented: IM/DD and coherent detection.
2.1 Optical-Orthogonal Frequency Division MultiplexingOFDM has recently been applied to optical communications. One major reason is the growingdemand for increased data rates across dispersive optical media [1] and [3]. O-OFDM has beenproposed to cope with upgrades to the next transmission speed in highly reconfigurable networks.It is also a good option for optical long-haul communications specially for the reason that it canbe designed to be extremely tolerant to chromatic dispersion. O-OFDM late appearance in opticswas mainly due to the lack of a mature DSP technology at optical speed and also due to thesignal restrictions in IM/DD systems. Typical OFDM symbols created with the FFT are bipolarand complex. Whereas IM/DD systems requires positive and real signals before the modulator.Therefore, a lot of effort was devoted to adapt OFDM signal to these requirements. The first partof this section introduces the OFDM concept. Then IM/DD systems and different way to achievea positive and real-valued OFDM symbol are explained. Finally in the last section coherentdetection is briefly described.
2.1.1 Orthogonal Frequency Division MultiplexingOFDM is a special class of multicarrier modulation (MCM) that consists of transmitting a signalover several lower-rate orthogonal subchannels [1] and [3]. In figure 2.1, the different subcar-riers that form one OFDM symbol are depicted. The spectrum of an individual subcarrier has
13
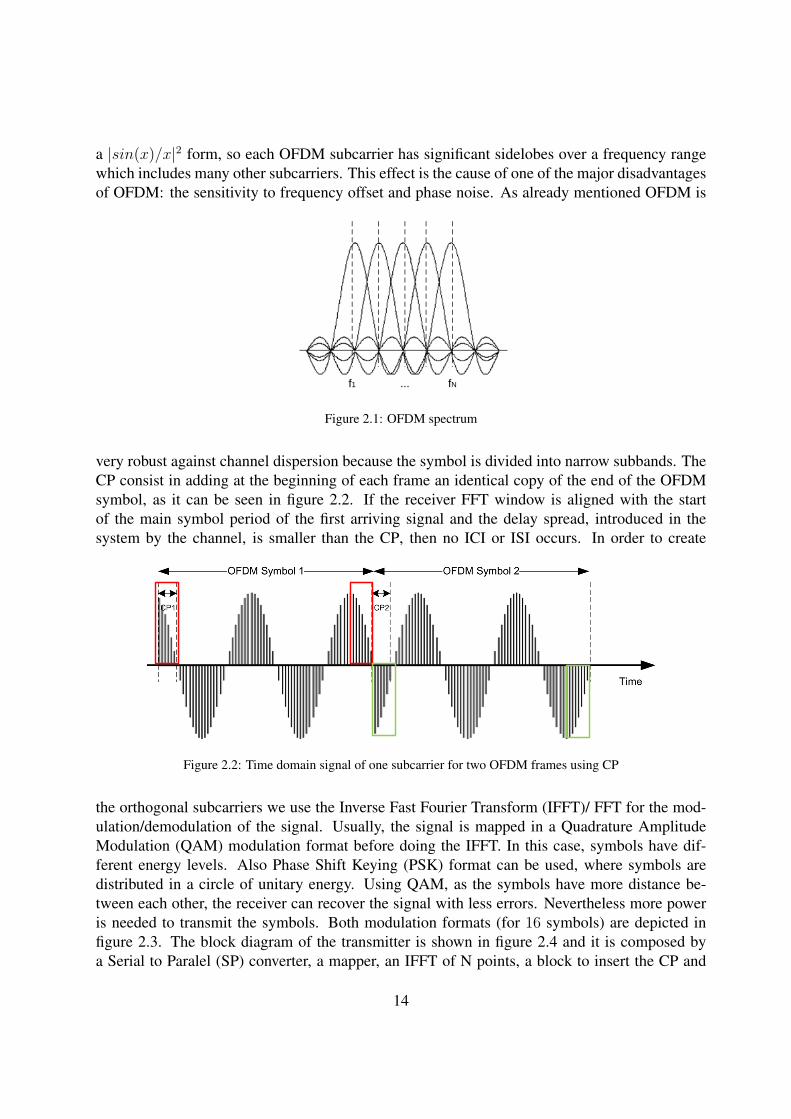
a |sin(x)/x|2 form, so each OFDM subcarrier has significant sidelobes over a frequency rangewhich includes many other subcarriers. This effect is the cause of one of the major disadvantagesof OFDM: the sensitivity to frequency offset and phase noise. As already mentioned OFDM is
f1 fN...
Figure 2.1: OFDM spectrum
very robust against channel dispersion because the symbol is divided into narrow subbands. TheCP consist in adding at the beginning of each frame an identical copy of the end of the OFDMsymbol, as it can be seen in figure 2.2. If the receiver FFT window is aligned with the startof the main symbol period of the first arriving signal and the delay spread, introduced in thesystem by the channel, is smaller than the CP, then no ICI or ISI occurs. In order to create
Figure 2.2: Time domain signal of one subcarrier for two OFDM frames using CP
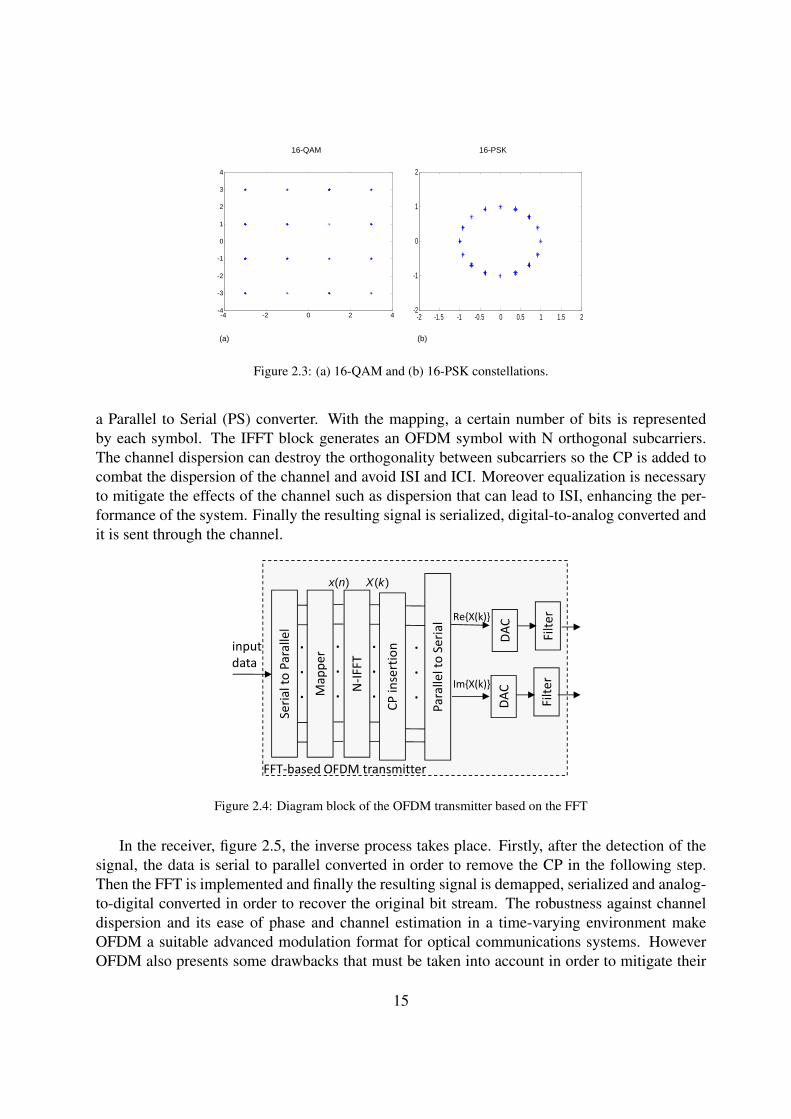
the orthogonal subcarriers we use the Inverse Fast Fourier Transform (IFFT)/ FFT for the mod-ulation/demodulation of the signal. Usually, the signal is mapped in a Quadrature AmplitudeModulation (QAM) modulation format before doing the IFFT. In this case, symbols have dif-ferent energy levels. Also Phase Shift Keying (PSK) format can be used, where symbols aredistributed in a circle of unitary energy. Using QAM, as the symbols have more distance be-tween each other, the receiver can recover the signal with less errors. Nevertheless more poweris needed to transmit the symbols. Both modulation formats (for 16 symbols) are depicted infigure 2.3. The block diagram of the transmitter is shown in figure 2.4 and it is composed bya Serial to Paralel (SP) converter, a mapper, an IFFT of N points, a block to insert the CP and
14
-2 -1.5 -1 -0.5 0 0.5 1 1.5 2-2
-1
0
1
2
-4 -2 0 2 4-4
-3
-2
-1
0
1
2
3
4
16-QAM 16-PSK
(a) (b)
Figure 2.3: (a) 16-QAM and (b) 16-PSK constellations.
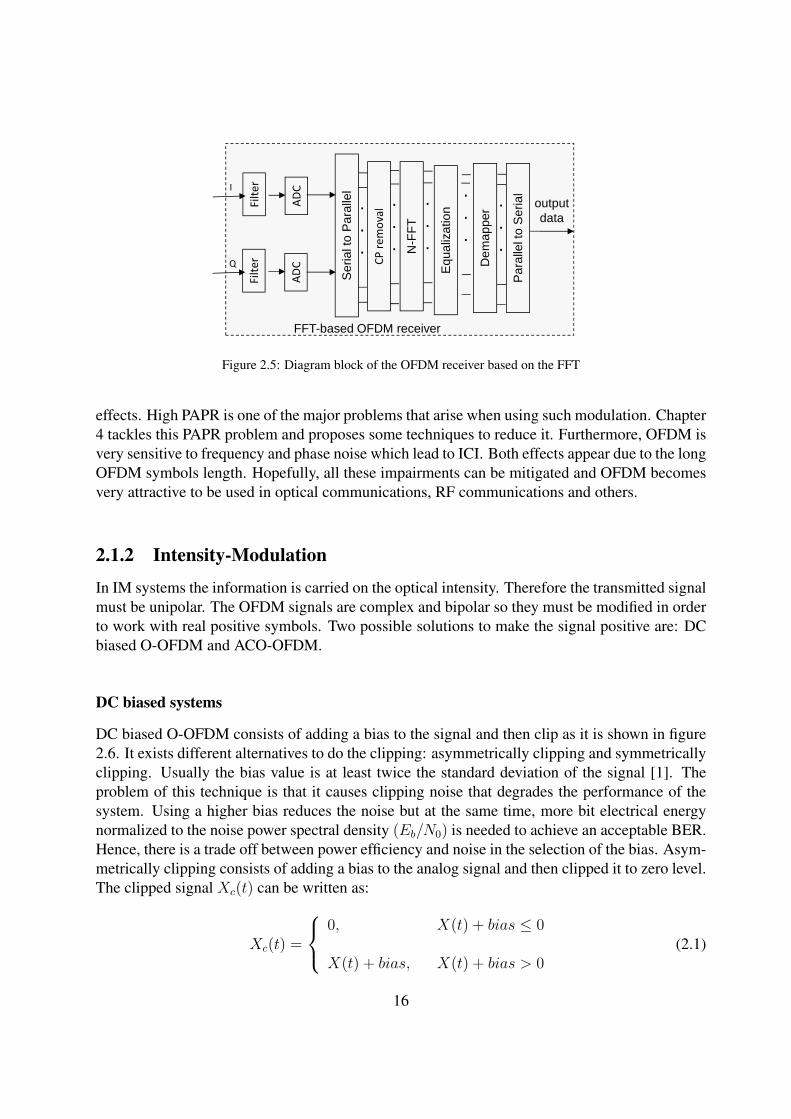
a Parallel to Serial (PS) converter. With the mapping, a certain number of bits is representedby each symbol. The IFFT block generates an OFDM symbol with N orthogonal subcarriers.The channel dispersion can destroy the orthogonality between subcarriers so the CP is added tocombat the dispersion of the channel and avoid ISI and ICI. Moreover equalization is necessaryto mitigate the effects of the channel such as dispersion that can lead to ISI, enhancing the per-formance of the system. Finally the resulting signal is serialized, digital-to-analog converted andit is sent through the channel.
FFT‐based OFDM transmitter
Serial to Parallel
ParalleltoSerial
.
.
.
input data
N‐IFFT
Mapper
.
.
.
.
.
.
( )X k( )x n
CP insertion .
.
.
Re{X(k)}
Im{X(k)}
DAC
DAC
Filter
Filter
Figure 2.4: Diagram block of the OFDM transmitter based on the FFT
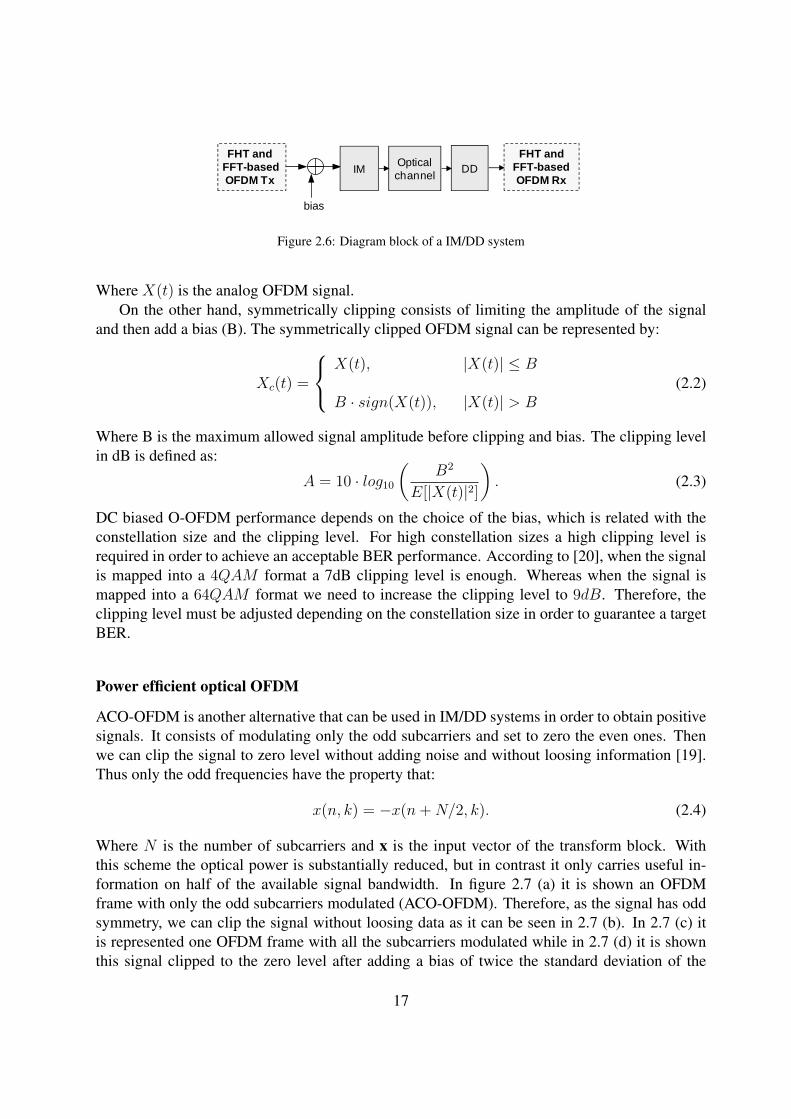
In the receiver, figure 2.5, the inverse process takes place. Firstly, after the detection of thesignal, the data is serial to parallel converted in order to remove the CP in the following step.Then the FFT is implemented and finally the resulting signal is demapped, serialized and analog-to-digital converted in order to recover the original bit stream. The robustness against channeldispersion and its ease of phase and channel estimation in a time-varying environment makeOFDM a suitable advanced modulation format for optical communications systems. HoweverOFDM also presents some drawbacks that must be taken into account in order to mitigate their
15
output data
Ser
ial t
oPa
ralle
l
N-F
FT
Dem
appe
r
Para
llelt
oS
eria
l
FFT-based OFDM receiver
.
.
.
.
.
.
.
.
.
CP removal .
.
.
Equa
lizat
ion
.
.
.
ADC
FilterI
ADC
FilterQ
Figure 2.5: Diagram block of the OFDM receiver based on the FFT
effects. High PAPR is one of the major problems that arise when using such modulation. Chapter4 tackles this PAPR problem and proposes some techniques to reduce it. Furthermore, OFDM isvery sensitive to frequency and phase noise which lead to ICI. Both effects appear due to the longOFDM symbols length. Hopefully, all these impairments can be mitigated and OFDM becomesvery attractive to be used in optical communications, RF communications and others.
2.1.2 Intensity-Modulation
In IM systems the information is carried on the optical intensity. Therefore the transmitted signalmust be unipolar. The OFDM signals are complex and bipolar so they must be modified in orderto work with real positive symbols. Two possible solutions to make the signal positive are: DCbiased O-OFDM and ACO-OFDM.
DC biased systems
DC biased O-OFDM consists of adding a bias to the signal and then clip as it is shown in figure2.6. It exists different alternatives to do the clipping: asymmetrically clipping and symmetricallyclipping. Usually the bias value is at least twice the standard deviation of the signal [1]. Theproblem of this technique is that it causes clipping noise that degrades the performance of thesystem. Using a higher bias reduces the noise but at the same time, more bit electrical energynormalized to the noise power spectral density (Eb/N0) is needed to achieve an acceptable BER.Hence, there is a trade off between power efficiency and noise in the selection of the bias. Asym-metrically clipping consists of adding a bias to the analog signal and then clipped it to zero level.The clipped signal Xc(t) can be written as:
Xc(t) =
0, X(t) + bias ≤ 0
X(t) + bias, X(t) + bias > 0(2.1)
16
bias
IM Opticalchannel DD
FHT andFFT-basedOFDM Tx
FHT and FFT-basedOFDM Rx
Figure 2.6: Diagram block of a IM/DD system
Where X(t) is the analog OFDM signal.On the other hand, symmetrically clipping consists of limiting the amplitude of the signal
and then add a bias (B). The symmetrically clipped OFDM signal can be represented by:
Xc(t) =
X(t), |X(t)| ≤ B
B · sign(X(t)), |X(t)| > B(2.2)
Where B is the maximum allowed signal amplitude before clipping and bias. The clipping levelin dB is defined as:
A = 10 · log10(
B2
E[|X(t)|2]
). (2.3)
DC biased O-OFDM performance depends on the choice of the bias, which is related with theconstellation size and the clipping level. For high constellation sizes a high clipping level isrequired in order to achieve an acceptable BER performance. According to [20], when the signalis mapped into a 4QAM format a 7dB clipping level is enough. Whereas when the signal ismapped into a 64QAM format we need to increase the clipping level to 9dB. Therefore, theclipping level must be adjusted depending on the constellation size in order to guarantee a targetBER.
Power efficient optical OFDM
ACO-OFDM is another alternative that can be used in IM/DD systems in order to obtain positivesignals. It consists of modulating only the odd subcarriers and set to zero the even ones. Thenwe can clip the signal to zero level without adding noise and without loosing information [19].Thus only the odd frequencies have the property that:
x(n, k) = −x(n+N/2, k). (2.4)
Where N is the number of subcarriers and x is the input vector of the transform block. Withthis scheme the optical power is substantially reduced, but in contrast it only carries useful in-formation on half of the available signal bandwidth. In figure 2.7 (a) it is shown an OFDMframe with only the odd subcarriers modulated (ACO-OFDM). Therefore, as the signal has oddsymmetry, we can clip the signal without loosing data as it can be seen in 2.7 (b). In 2.7 (c) itis represented one OFDM frame with all the subcarriers modulated while in 2.7 (d) it is shownthis signal clipped to the zero level after adding a bias of twice the standard deviation of the
17
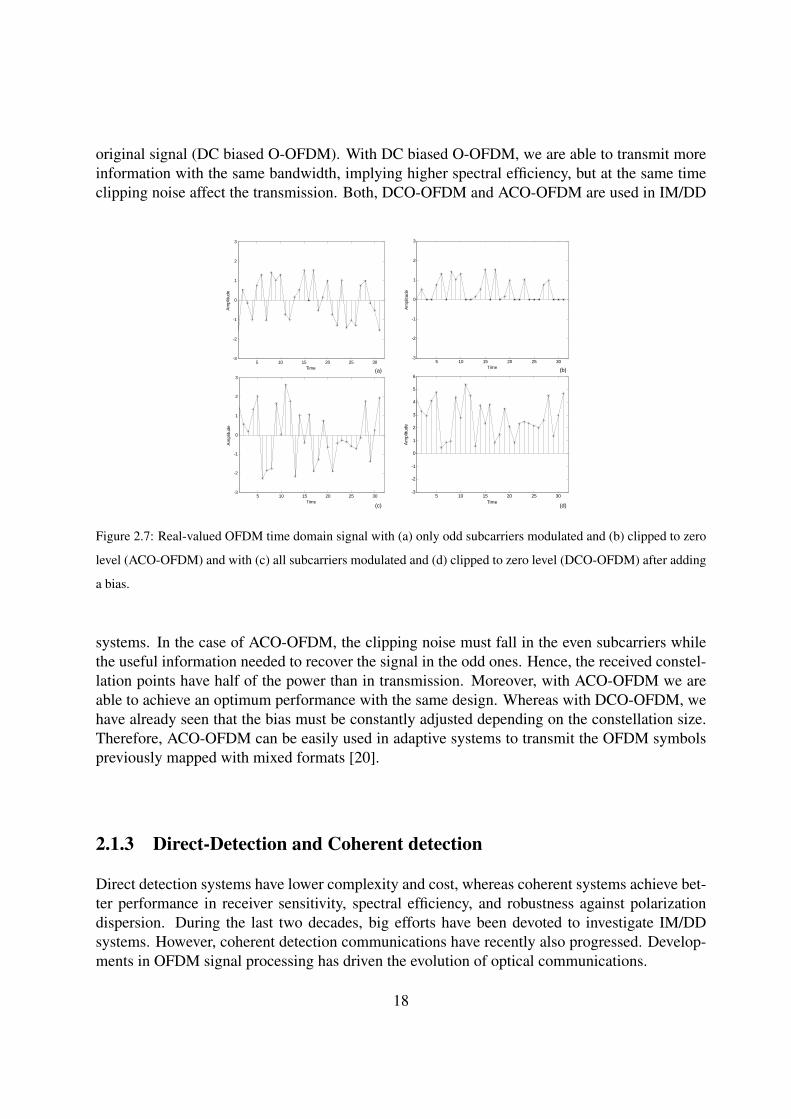
original signal (DC biased O-OFDM). With DC biased O-OFDM, we are able to transmit moreinformation with the same bandwidth, implying higher spectral efficiency, but at the same timeclipping noise affect the transmission. Both, DCO-OFDM and ACO-OFDM are used in IM/DD
5 10 15 20 25 30-3
-2
-1
0
1
2
3
Time
Am
plitu
de
5 10 15 20 25 30-3
-2
-1
0
1
2
3
Time
Am
plitu
de
5 10 15 20 25 30-3
-2
-1
0
1
2
3
Time
Am
plitu
de
5 10 15 20 25 30-3
-2
-1
0
1
2
3
4
5
6
Time
Am
plitu
de
(a) (b)
(c) (d)
Figure 2.7: Real-valued OFDM time domain signal with (a) only odd subcarriers modulated and (b) clipped to zero
level (ACO-OFDM) and with (c) all subcarriers modulated and (d) clipped to zero level (DCO-OFDM) after adding
a bias.
systems. In the case of ACO-OFDM, the clipping noise must fall in the even subcarriers whilethe useful information needed to recover the signal in the odd ones. Hence, the received constel-lation points have half of the power than in transmission. Moreover, with ACO-OFDM we areable to achieve an optimum performance with the same design. Whereas with DCO-OFDM, wehave already seen that the bias must be constantly adjusted depending on the constellation size.Therefore, ACO-OFDM can be easily used in adaptive systems to transmit the OFDM symbolspreviously mapped with mixed formats [20].
2.1.3 Direct-Detection and Coherent detection
Direct detection systems have lower complexity and cost, whereas coherent systems achieve bet-ter performance in receiver sensitivity, spectral efficiency, and robustness against polarizationdispersion. During the last two decades, big efforts have been devoted to investigate IM/DDsystems. However, coherent detection communications have recently also progressed. Develop-ments in OFDM signal processing has driven the evolution of optical communications.
18

Direct-Detection
DDO-OFDM can be used in a broader range of applications and it is very attractive due to itslow cost. DD systems, as it is shown in figure 2.8, uses a laser at the transmitter to create theoptical signal by directly or externally modulating the electrical signal. A typically used externalmodulator is the MZM. Then in the receiver, the signal is recovered using a photodiode that canbe modeled with a square law characteristic. As only real data can be modulated using a single
MZM
Bias
SSB filter channel ASE filterPhotodetector
OFDM receiverfc fc+fifc+fifcfc-fi
Data out
Data in
Electrical OFDM signal
(a)
(b)
Electrical OFDM
transmitter
Re
Imfi 90º
DMT transmitter
0QAM
QAM*0
Real data
1
N
N/2
......
(d)Electrical OFDM transmitter
0QAM
0
1
N
N/2
......
Optical IQ modulator
Re{analytic signal}
Im{analytic signal}
(c)OFDM transmitter
based on the FHT
Real data
1
N
N/2
......
M-PAM
Figure 2.8: Diagram block of a IM/DD system using four different transmission architectures: (a) RF conversion,
(b) DMT modulation, (c) FHT tranform and (d) Hilbert transform.
modulator, it is necessary to manipulate the OFDM symbol. There are different ways to proceed.A first option, figure 2.8(a), is based on a RF modulation of the OFDM base band signal. Oncethe OFDM symbol is created, the real and imaginary part are converted to the analog domainseparately. The next step is to modulate the signal to RF , multiplying the real part by a cosineand the imaginary part by a sine and then adding both signals obtaining a double side real signal.An oscillator to the frequency fi is required in order to implement the modulation. Finally theOFDM signal is modulated. The second, figure 2.8 (b) uses the HS property in order to have areal valued signal at the output of the IFFT. This implementation is called DMT [21] and it isexplained in chapter 3. But basically consists of filling with data the firsts subcarriers (from thesecond input to the (N/2 − 1) input), where N is the total number of subcariers. The Nyquistfrequencies are set to zero and the other transform inputs are filled with conjugated and reflected
19

data in order to implement the HS. Hence, only half of the subcarriers support data symbols.In order to generate a real-valued signal, an alternative transform, the FHT, has been recentlyproposed in [4]. This real trigonometric transform, figure 2.8 (c), supports the double of theinput symbols of a standard real-valued FFT using a simpler implementation. It has the sameDSP in transmission and reception and works with real algebra. The last scheme, figure 2.8(d), uses the properties of the Hilbert transform. Modulating the real and imaginary parts of ananalytic signal, an optical signal with no-negative frequency components is obtained. In order tohave an analytic signal at the output of the IFFT, half of the elements of the input vector mustbe set to zero. Using one of these already presented architectures we are able to have real-valuedOFDM systems and therefore we can work with IM/DD systems.
Once we have real OFDM symbols they are modulated in order to transmit the optical signalto the fiber. To optimize the system performance it has been observed that both the carrier and theOFDM signal must have the same power. The MZM creates a double side band spectrum withrespect to the optical carrier. So in order to ensure that the OFDM subcarriers are representedonly once by the optical frequencies and avoid chromatic dispersion fading, Single Side Band(SSB) modulation can be adopted. In short reach applications double side band can be used.Finally, in reception, the data is detected with a photodetector. Then it is electrically amplified,analogically converted and demaped with the OFDM demodulator in order to recover the originalbit stream.
Coherent detection
CO-OFDM was proposed to combat fiber chromatic dispersion [22]. It shows better performancethan IM/DD based OFDM in terms of bandwidth efficiency, robustness against polarization dis-persion and receiver sensitivity, but it requires higher complexity in the transceiver design thanDD systems [3]. CO-OFDM block diagram is depicted in Fig.2.9. The OFDM is modulated in
Data OFDM transmitter
I
Q
MZM
MZM
MZM
MZM90º
channelOFDM
receiverData+
-+
-
+
-+
-
Local laser
90º Hybrid
Figure 2.9: Block diagram of a CO-OFDM system.
phase and quadrature separately with a laser, so two modulators, for example MZM, are neededin transmission. Then the modulated signal is transmitted to the channel. In reception, one laser,one 90o hybrid and 4 photodetectors are needed to recover the signal, 2 for the quadrature and2 for the phase of the received signal. Finally, both components are filtered and demodulated inthe OFDM receiver.
20
Chapter 3
Transforms used in O-OFDM
In this chapter different transforms to create the OFDM symbols are introduced. The signal pro-cessing in the OFDM transmitter/receiver is usually based on the FFT to implement the OFDMmodulation/demodulation. Here, we present two alternative transforms to create the OFDM sym-bols: the FHT and the DWPT. Moreover we will see the application of both in optical systems.
3.1 Fast Fourier Transform
OFDM systems were previously implemented using oscillators and filters before the Inverse Dis-crete Fourier Transform (IDFT) was proposed to create the different orthogonal subcarriers [3].Later on, it was seen that the N points, IDFT had increasing complexity when the number ofsubcarriers (N ) was large. Therefore in 1965 the FFT was introduced in order to reduce thecomputational cost, and the necessary number of operations needed to implement the OFDMsymbols. The fundamental principle of the FFT algorithm is based on the decomposition of theDFT of a sequence of length N to smaller DFTs. An N points IDFT requires (N2) complexmultiplications, which are phase rotations. It also requires (N2 − 1) complex additions (withouttaking into account the evaluation of the base functions: sines and cosines). The hardware re-quired to implement an addition has lower complexity than the one used for a multiplication. TheIFFT drastically reduces the amount of calculations. Hence it is used to implement the OFDMsymbols. The FFT can be seen as a bank of modulators, whose narrowband channels have mu-tually orthogonal subcarriers equally separated by 1
Ts. Where Ts is the symbol period. Using
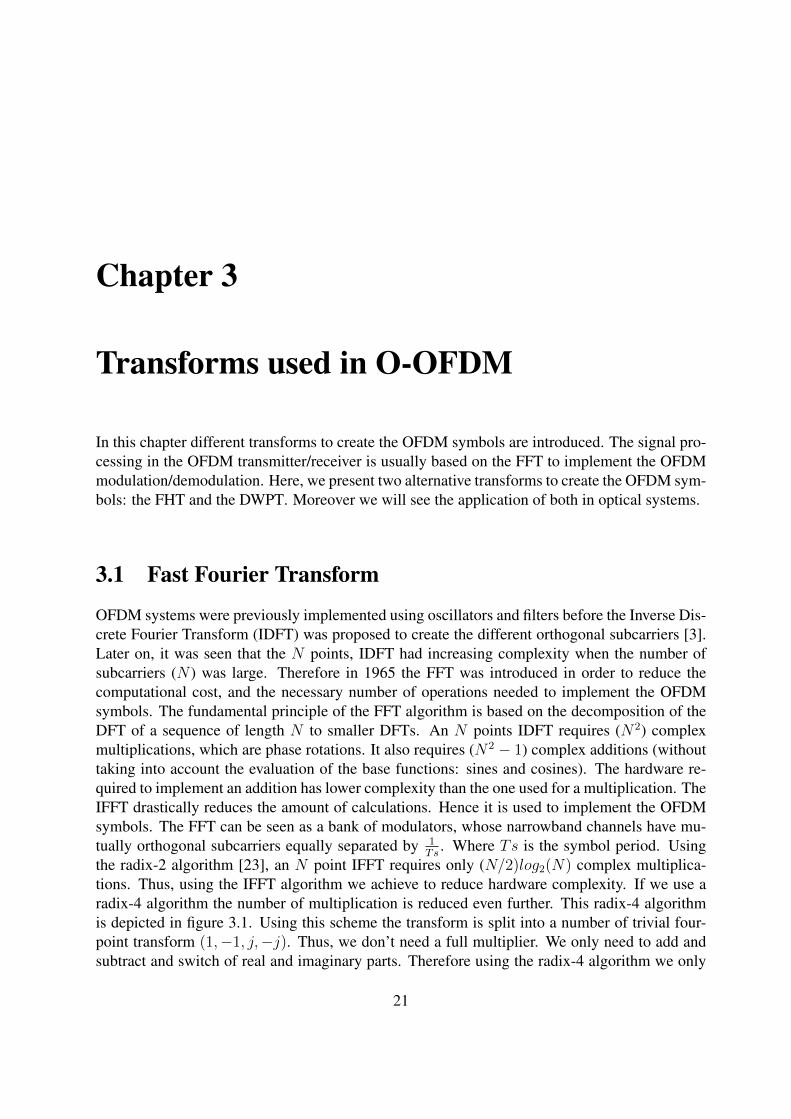
the radix-2 algorithm [23], an N point IFFT requires only (N/2)log2(N) complex multiplica-tions. Thus, using the IFFT algorithm we achieve to reduce hardware complexity. If we use aradix-4 algorithm the number of multiplication is reduced even further. This radix-4 algorithmis depicted in figure 3.1. Using this scheme the transform is split into a number of trivial four-point transform (1,−1, j,−j). Thus, we don’t need a full multiplier. We only need to add andsubtract and switch of real and imaginary parts. Therefore using the radix-4 algorithm we only
21
x1
x2
x3
x0 y0=x0+x1+x2+x3
y1=x0+jx1-x2-jx3+j
-1
-j-1
-1-j
-1
+j
y2=x0-x1+x2-x3
y3=x0-jx1-x2+jx3
Figure 3.1: The radix-4 butterfly.
require ((3/8)(Nlog2N−2)) phase rotations or complex multiplications and (Nlog2N ) complexadditions.
The spectrum of an individual OFDM subcarrier has a |sin(x)/x|2 form and it overlaps withthe spectra of other subcarriers. Moreover, if the channel is linear the orthogonality betweensubcarriers is preserved and they can be recovered in reception without interference and withoutusing analog filtering techniques. The inverse fast Fourier transform (IFFT) is defined as:
X(k) =1√N
N−1∑n=0
x(n)exp(2jπkn/N) k = 0, 1, ..., N − 1, (3.1)
where x(n) indicates the symbol sequence, previously mapped with a m-QAM or M-PSK format,and N represents the number of subcarriers. The FFT is defined by:
x(n) =1√N
N−1∑k=0
X(k)exp(−2jπkn/N) n = 0, 1, ..., N − 1. (3.2)
These forms of the IFFT and FFT transform pair, of equations (3.1) and (3.2) respectively, havethe advantage that the discrete signals at the input and the output of the transform for eachsymbol have the same total energy and average power, simplifying the analysis of many OFDMfunctions. To model the probability distribution of X it is need N ≥ 64 to assume Gaussianity.Moreover, the FFT has been used to implement O-OFDM in optical communications, allowingthe transmission to high data rates. We have already seen that a possible architecture to workin optics, is IM-DD, where the information is carried in the optical intensity. Therefore a realpositive version of the original signal is needed and the FFT must be adapted. The most commonsolution is to implement DMT, which is based on the HS property [21].
Discrete Multitone Modulation DMT consists on allocating the information in the input ofthe FFT such a way that real data is obtained at the output. The IFFT is a complex transform
22
0
X(1)
N/2
N/2+1
N-1
Complexconjugate
N-IFFT
1
X(N/2-1)N/2-1
X*(N/2-1)
0
0
X*(1)
X(2)
X*(2)
Real data
Real data
Real data
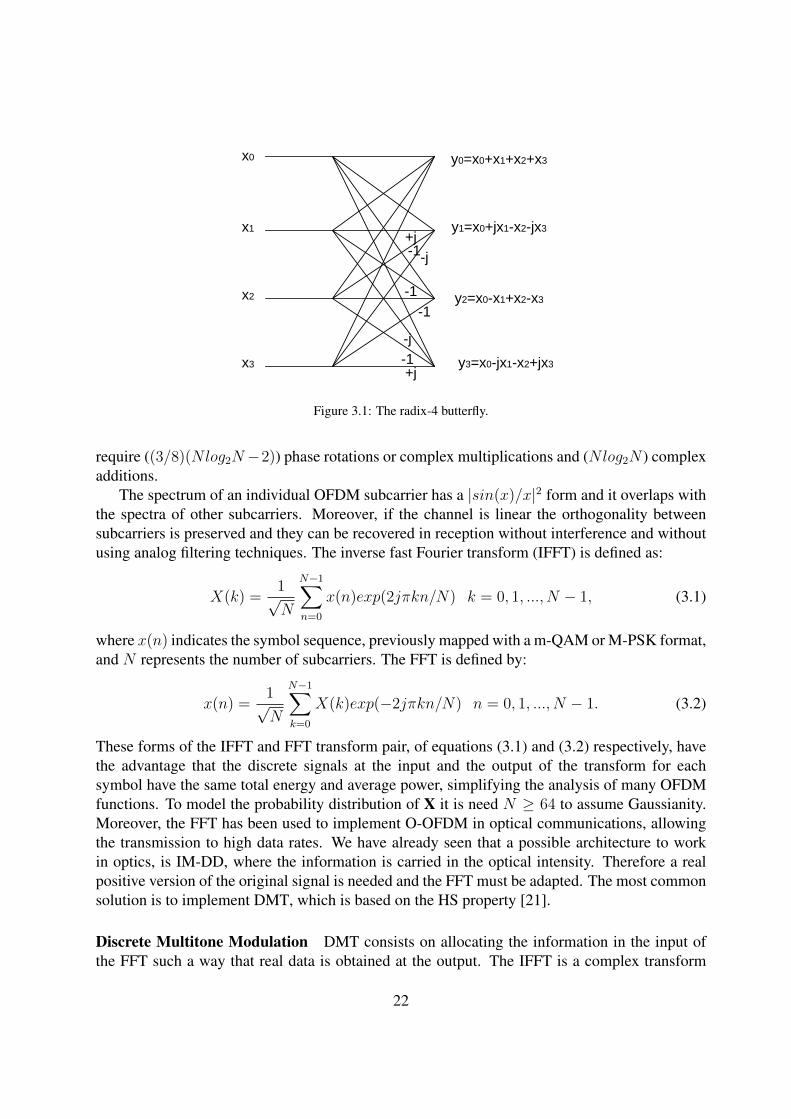
Figure 3.2: Schematic of DMT modulation.
which output symbols have real and imaginary components. The use of DMT allows to workwith real-valued signals using the IFFT. The principle of DMT is depicted in figure 3.2. Themapped symbols are divided into N subcarriers. The first half, from input 1 to input N/2 − 1of the IFFT, carry useful data. Whereas the first and the N/2 inputs, the Nyquist frequencies,are set to zero. Then following the HS property, defined in (3.3), the second half of the availableinputs carry the flipped complex conjugate version of the first half.
x(N − n) = x∗(n) (3.3)
Therefore only half of the inputs of the IFFT carry information, but at the output we obtain a real-valued signal. DMT allows us to work with real valued O-OFDM signals, which is a prerequisiteof cost effective IM/DD systems.
3.2 Fast Hartley TransformThe FHT is particulary attractive because it has the same DSP in transmission and receptionand works with real algebra [4]. Moreover, it is a real trigonometric transform. Hence, if theinput data of the transform is mapped in a real constellation such as M-PAM or BPSK, theoutput will be also real. Furthermore, the Discrete Hartley Transform (DHT) kernel only differsto the DFT in the imaginary unit. An OFDM symbol obtained with the Inverse Fast HartleyTransform (IFHT) can be written as:
H(k) =1√N
N−1∑n=0
h(n)cas(2πkn/N) k = 0, 1, ..., N − 1. (3.4)
23
In equation (3.4) we define,
cas(2πkn/N) = cos(2πkn/N) + sin(2πkn/N). (3.5)
h(n) represents the real data modulated with a BPSK modulation or M-PAM. The FHT has thesame routine in transmission and reception. Therefore, the reconstructed signal at the output ofthe FHT is also defined by equation 3.4. Using the FHT, we don’t need to force HS. Thus, itsupports the double of the input symbols of a standard real-valued FFT using a simpler imple-mentation. Hence, the use of the FHT becomes very attractive in IM/DD systems, where it isnecessary to work with real and positive signals. In order to compare the performance of both theFFT and the FHT we must transmit the same data signal. Therefore, if we modulate the signalwith a M -PAM format using the FHT, we must map the information in a M2-QAM format tobe able to compare the results. In terms of computational cost, when we work with IM/DD sys-tems and the FFT exploits the HS property of the transform, the FHT algorithm require about thesame number of multiplications but more additions. On the other hand, additional resources mustbe used for calculating the complex conjugate vector to deal with real-valued FFT. Bracewellpresented in [24] a radix-2 decimation-in-time FHT algorithm. In 1986, Duhamel and Vetterliproposed the fastest algorithm implementing the DHT. Later on an improved version which re-quired only two more additions than the FFT algorithms for real-valued signal appeared [25].This last improvement increased the computationally speed.
Here in this thesis, we will study the application of these transforms in IM/DD optical sys-tems. The FHT has been investigated in the literature. For example, simulations in AdditiveWhite Gaussian Noise (AWGN) channel have been developed in [4] and in [26] for high modu-lation formats demonstrating similar performance with the FFT based O-OFDM system. More-over, performance simulations of FHT based O-OFDM signals, have been done for both IM/DD[27] and coherent systems [28].
3.3 Wavelet TransformThe Wavelet transform has been proposed to be used as an alternative of the FFT for O-OFDMsystems. It consists of decomposing a signal of interest into a set of basis waveforms, calledwavelets. The wavelet transform is a multi-resolution analysis mechanism where an input signalis decomposed into different frequency components, and then each component is studied withresolutions matched to its scales. This process is similar to the Fourier transform but with the dif-ference that the basis functions used are not sines and cosines. Sinusoids have infinitely lengths,whereas wavelets have finite duration. Therefore wavelets have both frequency and time local-ization. Thanks to this, wavelets can combat better ISI without being necessary to use the CP.Moreover it gives good time resolution and poor frequency resolution at high frequencies and agood frequency resolution and poor time resolution at low frequencies. In contrast, they are verysensitive to the PMD. Wavelet transform is classified in Continuous Wavelet Transform (CWT)and Discrete Wavelet Transform (DWT) [29]. On the one hand CWT of a continuous signal y(t)is defined as the sum of all time of the signal multiplied by scaled, shifted versions of the wavelet
24
ϕ(t):
Y (s, τ) =1√s
∫ ∞−∞
y(t)ϕ∗(t− τs
)dt. (3.6)
In equation (3.6), s is the scale factor and τ is the translation factor. y(t) is the time domainsignal to be modulated, ϕ(t) is the wavelet scaling function and Y (s, τ) is the resulting signalafter the wavelet transformation.The DWT analyzes the signal at different frequency bands withdifferent resolutions by decomposing the signal into an approximation and detail. DWT employstwo sets of functions, known as scaling (ϕ[n]) and wavelet functions (ψ[n]), which are associatedwith low pass and high pass filters. So according to [30] we define:
Y [k] =∞∑
n=−∞
y[n]ϕn[k] k = 0, 1, ..., N − 1. (3.7)
DWT is applied to create filter banks and using quadrature mirror filters. Quadrature mirrorfilters are commonly used in signal processing, and they satisfy,
h1[L− 1− k] = (−1)kh0[k]. (3.8)
In equation (3.8) h0 and h1 are the impulse responses of the low pass and high pass filters re-spectively. The complete scheme of transmission is decomposed in two parts: the analysis andsynthesis. In the analysis we create the approximation of the original signal filtering with a lowpass filter (h0) and then downsampling by a factor of 2. Consequently the details are createdwith a high pass version of the filter (h1) and with the same downsampling factor. Therefore theanalysis basis are:
ϕ2n[k] = H0[2n− k] (3.9)ϕ2n+1[k] = H1[2n− k]
In the synthesis the opposite scheme of the analysis is followed. Firstly the approximation isupsampled with a factor of 2 and then filtered with a low pass filter. Whereas the details are alsoupsampled by the same factor and the filtered with a high pass filter. Consequently the synthesisbasis are defined as:
ϕ̃2n[k] = G0[k − 2n] (3.10)ϕ̃2n+1[k] = G1[k − 2n]
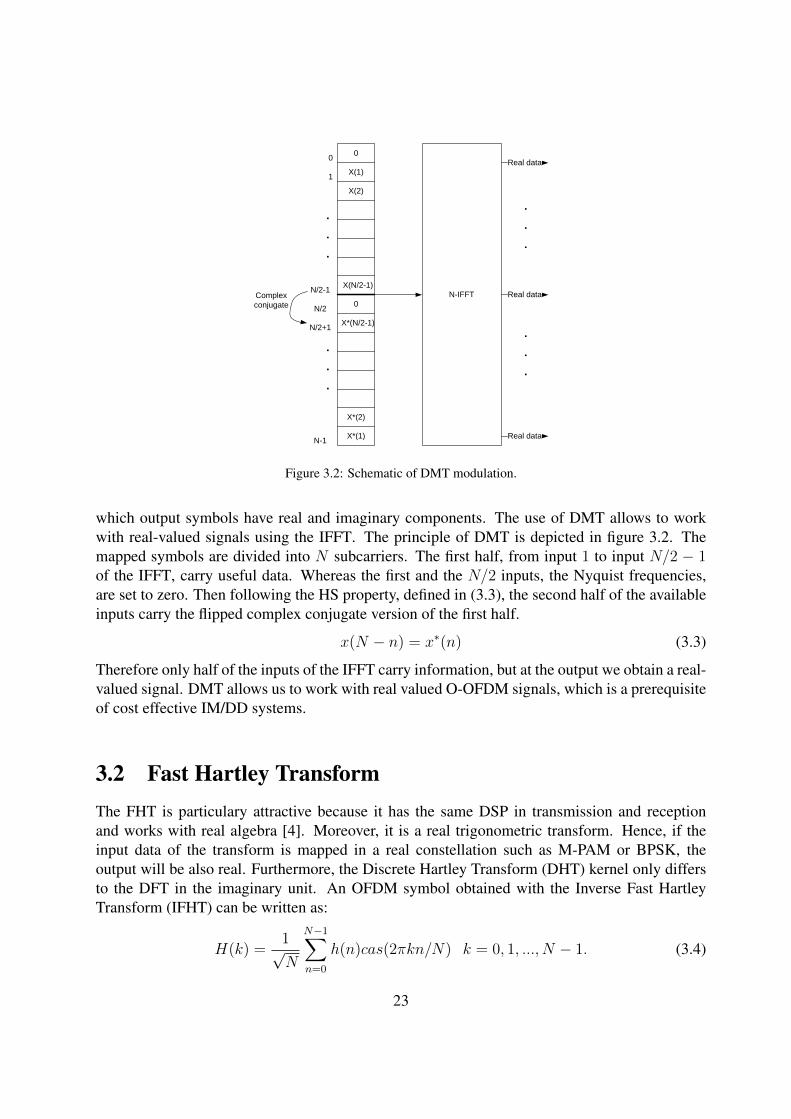
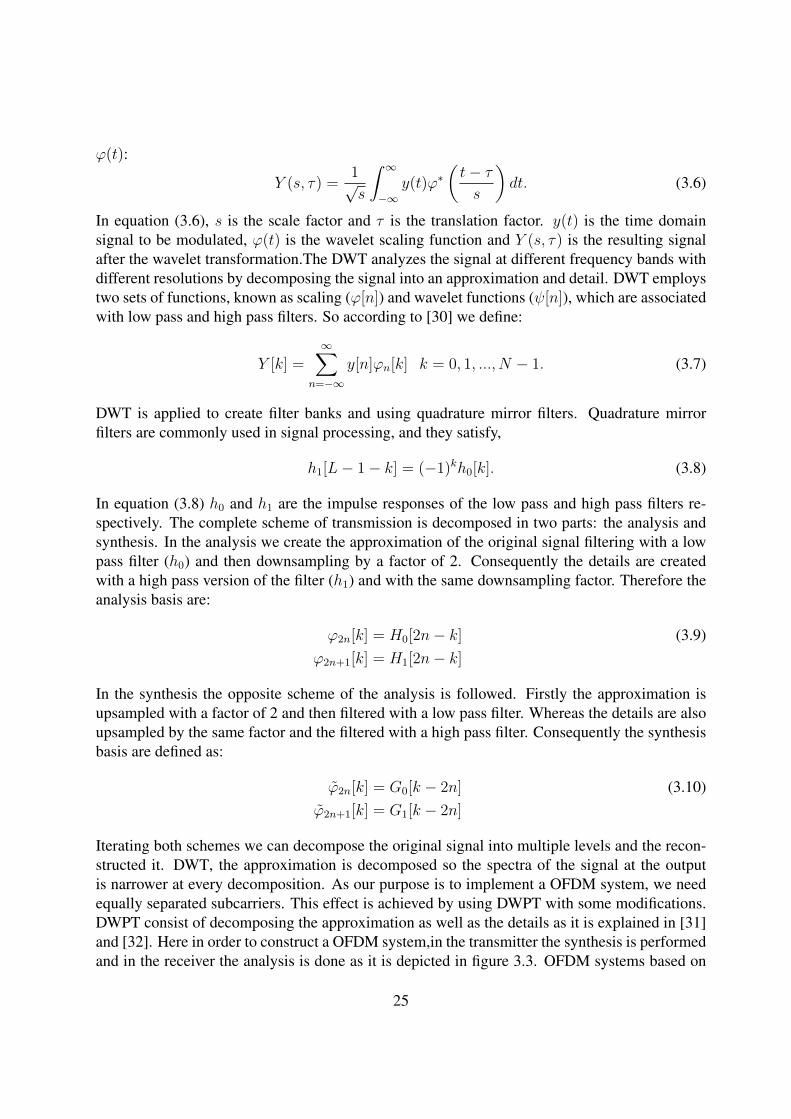
Iterating both schemes we can decompose the original signal into multiple levels and the recon-structed it. DWT, the approximation is decomposed so the spectra of the signal at the outputis narrower at every decomposition. As our purpose is to implement a OFDM system, we needequally separated subcarriers. This effect is achieved by using DWPT with some modifications.DWPT consist of decomposing the approximation as well as the details as it is explained in [31]and [32]. Here in order to construct a OFDM system,in the transmitter the synthesis is performedand in the receiver the analysis is done as it is depicted in figure 3.3. OFDM systems based on
25
2
2 H1
H0
2
2 H1
H0
2
2 H1
H02
2H1
H0
2
2 H1
H0
2 H1
H0
2
2 H1
H0
2
G1
G0 G1
G0
G1
G0
G1
G0
G1
G0
G1
G0
G1
G0
2
2
2
2
2
2
2
2
2
2
2
2
2
2
Figure 3.3: Synthesis with IDWPT (modulation) and analysis with DWPT (demodulation) for OFDM systems.
DWPT combat ISI effects better than the ones based on the FFT or the FHT. Moreover they aremore robust respect to ICI, due to very high spectral containment properties of wavelet filters.Wavelet Packet Transform (WPT) have recently been used in optical communications. In [7],WPT-OFDM is used instead of the conventional FFT in a CO-OFDM system. They comparethe performance of both transforms, concluding that WPT systems are very sensitive to the PMDbut they have better performance than FFT for short haul transmission. Using WPT a ChromaticDispersion (CD) of 3.380ps/nm at 112 Gb/s can be mitigated without adding a CP.
3.3.1 Wavelets functionsIt exists a large set of wavelet functions. Haar is the simplest wavelet system that exists. Itsscaling and wavelet functions are defined respectively by
ϕ(t) =
{1 if 0 < t < 10 otherwise
ψ(t) =
1 if 0 ≤ t < 1
2
−1 12≤ t < 1
0 otherwise(3.11)
Wavelet functions can have different properties like: biorthogonality, orthogonality, linear phaseand others. If the scaling function and wavelet are symmetric, then the filters have generalizedlinear phase. Moreover depending of the number of zeros of the wavelet function and its order,they have different vanishing moments. Orthonormal basis are defined as,
< ϕn, ϕl >= δ(n− l) (3.12)
αn =< f, ϕn > f(t) =∑
n αnϕn(t). (3.13)
By the same way biorthogonal bases can be written as
< ϕn, ψl >= δ(n− l) (3.14)
26

αn =< f, ϕn > βn =< f, ψn > f(t) =∑
n αnψn(t) =∑
n βnϕn(t). (3.15)
In Table 3.1 some wavelets properties are summarized. Db. M is the Daubechies wavelet oforder M. Whereas Bior. Mr Md is the biorthogonal wavelet with orders Mr for reconstructionand Md for decomposition.
WAVELET Orthogonality Biorthogonality Linear Phase Vanishing moments
Haar Yes Yes Yes 1
Db M Yes Yes No M
Bior. Mr Md No Yes Yes Mr
Symlet M Yes Yes No M
Coiflet M Yes Yes No 2M-1
Table 3.1: Properties of some wavelet functions.
27

28
Chapter 4
The peak-to-average power ratio problem
OFDM modulation allows to transmit information with high data rate through an optical fiberlink. However, OFDM can present high signal peaks that can distort the signal. This effect iscalled PAPR and it is presented and studied in this chapter. Moreover, some PAPR reductiontechniques to mitigate its effects are proposed and analyzed for IM/DD systems based on boththe FFT and the FHT.
4.1 Peak-to-average power ratio definition
High peak-to-average power ratio is one of the major drawbacks of OFDM signals. The PAPR isdefined as the ratio between the maximum peak power and the average power of the transmittedOFDM signal:
PAPR =max
0≤k≤NL−1|F (k)|2
E[|F (k)|2]. (4.1)
In equation (4.1),N is the number of subcarriers, L is the oversampling factor, F is the modulatedsignal and E[.] denotes the expectation. The PAPR is calculated from the digital signal, meaningthat the true maximum value of the O-OFDM signal may not be included in the sampled points.Therefore, we need to introduce an oversampling factor in order to provide sufficiently accurateresults in the measure of it [6]. A fourfold oversampling factor (L = 4) is enough to considerthe missing peaks. The theoretical limit of PAPR can be derived from equation (4.1) consideringk = 0. It can be written in dB as:
PAPR = 10log10N. (4.2)
Therefore this theoretical limit only depends on the number of subcarriers, and it is fortunatelyrarely obtained. On the other hand, one of the more common techniques used to measure the
29
PAPR is the Complementary Cumulative Density Function (CCDF). The CCDF is defined as:
CCDF = P (PAPR > PAPR0)
= 1− P (PAPR ≤ PAPR0) = 1− CDF, (4.3)
and gives the probability that the PAPR exceeds a threshold (PAPR0). The CDF is the cumula-tive density function. With the CCDF we are able to evaluate the performances of the differentPAPR reduction techniques presented in the following section. Expression (4.3) is valid only fora large number of subcarriers (N ≥ 64). For low number of subcarriers, it is not accurate sincewe can not assume a Gaussian distribution.
4.2 PAPR reduction techniquesA lot of effort has been developed to mitigate the effects of the PAPR. Therefore a numberof approaches have been proposed in the literature to deal with this problem [6]. They canintroduce distortion to the signal, reduce the available bandwidth or suppose a power increase.So depending on the application, one PAPR reduction technique is more suitable than another[6]. As our purpose is to apply PAPR reduction techniques in IM/DD systems, we must transmita real signal. Therefore, when the FFT is used the HS must be preserved after applying PAPRreduction techniques. In contrast if the FHT is used, HS must not to be preserved and PAPRreduction techniques are easier to implement.
In this section different distortionless PAPR reduction techniques are analyzed. Firstly, weintroduce SeLective Mapping (SLM) PAPR reduction technique for both the FFT and the FHT.Afterwards we describe the interleaving technique, Partial Transmit Sequence (PTS) and precod-ing techniques based on Hadamard Transform (HT) and Discrete Cosine Transform (DCT) onlyfor the FHT as it has reduced complexity.
4.2.1 Selective mappingSLM is a PAPR reduction technique suitable for a wide range of applications. This method con-sists of generating OFDM frames representing the same information by multiplying the mappeddata by a vector P(u) with u = 1, 2, ..., U [33]. Then IFFT or IFHT is applied to the differentsignal representations in order to select the one with minimum PAPR. Therefore, U is the num-ber of IFHT or IFFT blocks. In figure 4.1, X(u) and H(u) indicate the u-th OFDM sequence F(u),modulated by using the IFFT and IFHT, respectively. Vector P(u) (with u = 1, 2, ..., U ), has Nelements belonging to the set {±1} as we are working with IM/DD systems. All the elementsof P(1) are always set to 1, in order to consider also the original OFDM frame. So when FHTis used we continue having a real signal after multiplying by the vector P(u). In the case of thereal-valued FFT the vector P(u) must preserve HS so we have less freedom in the constructionof this vector. The PAPR reduction depends on the number of vectors (U ): increasing this setincreases the peak power reduction, but also the number of required IFFT or IFHT blocks and
30
Input data S/P
IFFT IFHT
IFFT IFHT
IFFT IFHT
(1)P(2)P
(3)P
( )UP...
.
.
.
Minimum PAPR
selection
M-QAM
m-PAM
IFFT IFHT
X(1)/H(1)
X(U)/H(U)
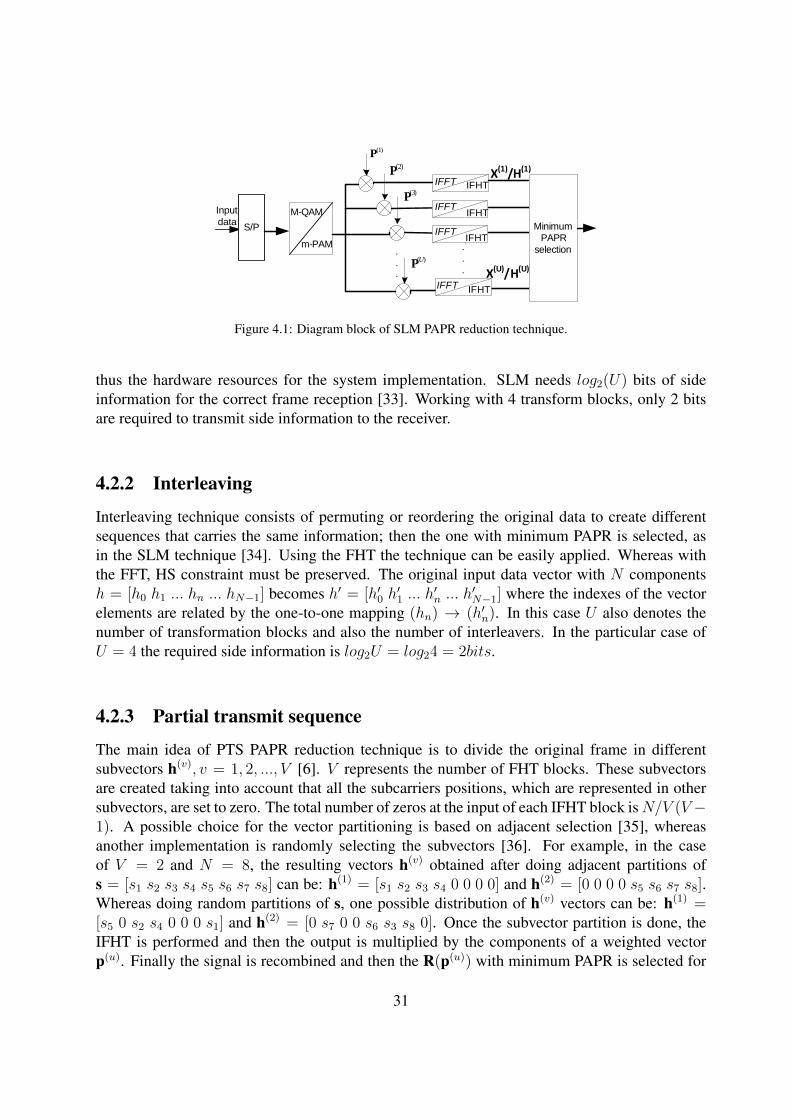
Figure 4.1: Diagram block of SLM PAPR reduction technique.
thus the hardware resources for the system implementation. SLM needs log2(U) bits of sideinformation for the correct frame reception [33]. Working with 4 transform blocks, only 2 bitsare required to transmit side information to the receiver.
4.2.2 Interleaving
Interleaving technique consists of permuting or reordering the original data to create differentsequences that carries the same information; then the one with minimum PAPR is selected, asin the SLM technique [34]. Using the FHT the technique can be easily applied. Whereas withthe FFT, HS constraint must be preserved. The original input data vector with N componentsh = [h0 h1 ... hn ... hN−1] becomes h′ = [h′0 h
′1 ... h
′n ... h
′N−1] where the indexes of the vector
elements are related by the one-to-one mapping (hn) → (h′n). In this case U also denotes thenumber of transformation blocks and also the number of interleavers. In the particular case ofU = 4 the required side information is log2U = log24 = 2bits.
4.2.3 Partial transmit sequence
The main idea of PTS PAPR reduction technique is to divide the original frame in differentsubvectors h(v), v = 1, 2, ..., V [6]. V represents the number of FHT blocks. These subvectorsare created taking into account that all the subcarriers positions, which are represented in othersubvectors, are set to zero. The total number of zeros at the input of each IFHT block isN/V (V −1). A possible choice for the vector partitioning is based on adjacent selection [35], whereasanother implementation is randomly selecting the subvectors [36]. For example, in the caseof V = 2 and N = 8, the resulting vectors h(v) obtained after doing adjacent partitions ofs = [s1 s2 s3 s4 s5 s6 s7 s8] can be: h(1) = [s1 s2 s3 s4 0 0 0 0] and h(2) = [0 0 0 0 s5 s6 s7 s8].Whereas doing random partitions of s, one possible distribution of h(v) vectors can be: h(1) =[s5 0 s2 s4 0 0 0 s1] and h(2) = [0 s7 0 0 s6 s3 s8 0]. Once the subvector partition is done, theIFHT is performed and then the output is multiplied by the components of a weighted vectorp(u). Finally the signal is recombined and then the R(p(u)) with minimum PAPR is selected for
31
transmission. Due to the linearity of the IFHT we can write:
R(p(u)) = IFHT{V∑v=1
p(u)v · h(v)}
=V∑v=1
p(u)v · IFHT{h(v)} =V∑v=1
p(u)v ·H(v)
u = 1, ..., U. (4.4)
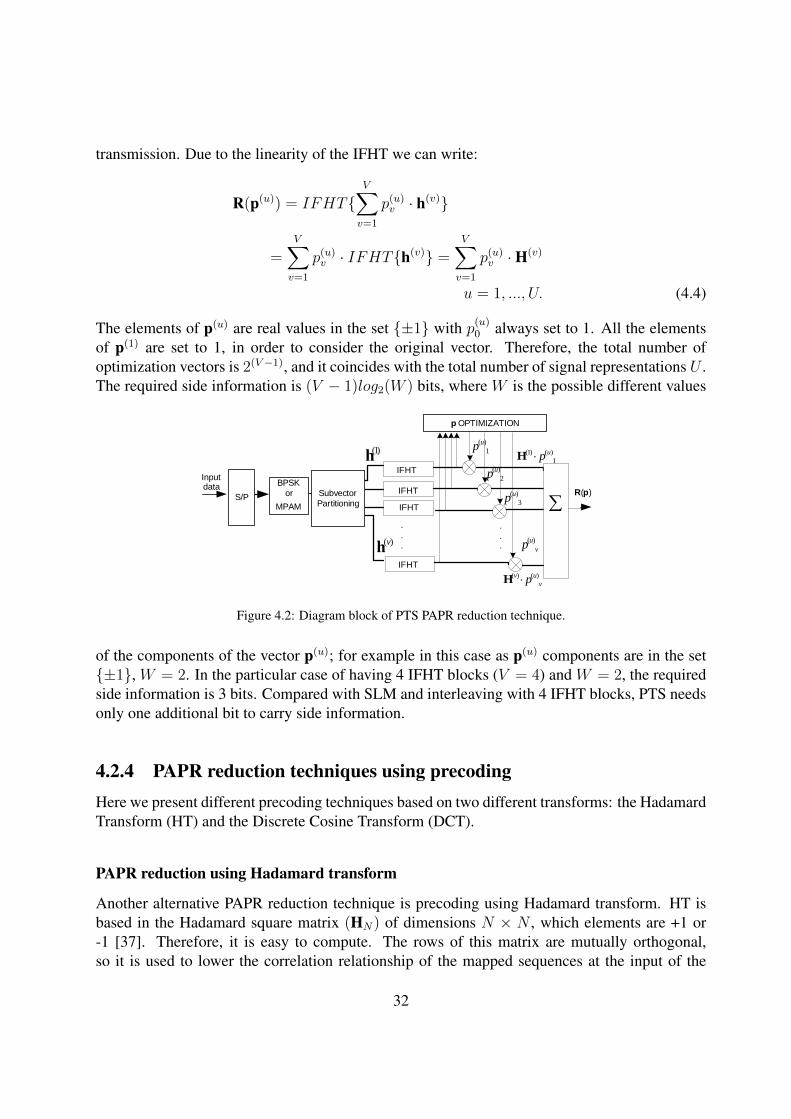
The elements of p(u) are real values in the set {±1} with p(u)0 always set to 1. All the elementsof p(1) are set to 1, in order to consider the original vector. Therefore, the total number ofoptimization vectors is 2(V−1), and it coincides with the total number of signal representations U .The required side information is (V − 1)log2(W ) bits, where W is the possible different values
Input data x/h
IFHT
IFHT
IFHT
IFHT
( )2
up
( )1
up
( )uvp
p OPTIMIZATION
( )vh
(1)h (1) ( )1
upH
( ) ( )v uvpH
R(p)
.
.
.
( )3
up
.
.
.
SubvectorPartitioning
BPSK or
MPAMS/P
Figure 4.2: Diagram block of PTS PAPR reduction technique.
of the components of the vector p(u); for example in this case as p(u) components are in the set{±1}, W = 2. In the particular case of having 4 IFHT blocks (V = 4) and W = 2, the requiredside information is 3 bits. Compared with SLM and interleaving with 4 IFHT blocks, PTS needsonly one additional bit to carry side information.
4.2.4 PAPR reduction techniques using precodingHere we present different precoding techniques based on two different transforms: the HadamardTransform (HT) and the Discrete Cosine Transform (DCT).
PAPR reduction using Hadamard transform
Another alternative PAPR reduction technique is precoding using Hadamard transform. HT isbased in the Hadamard square matrix (HN) of dimensions N × N , which elements are +1 or-1 [37]. Therefore, it is easy to compute. The rows of this matrix are mutually orthogonal,so it is used to lower the correlation relationship of the mapped sequences at the input of the
32
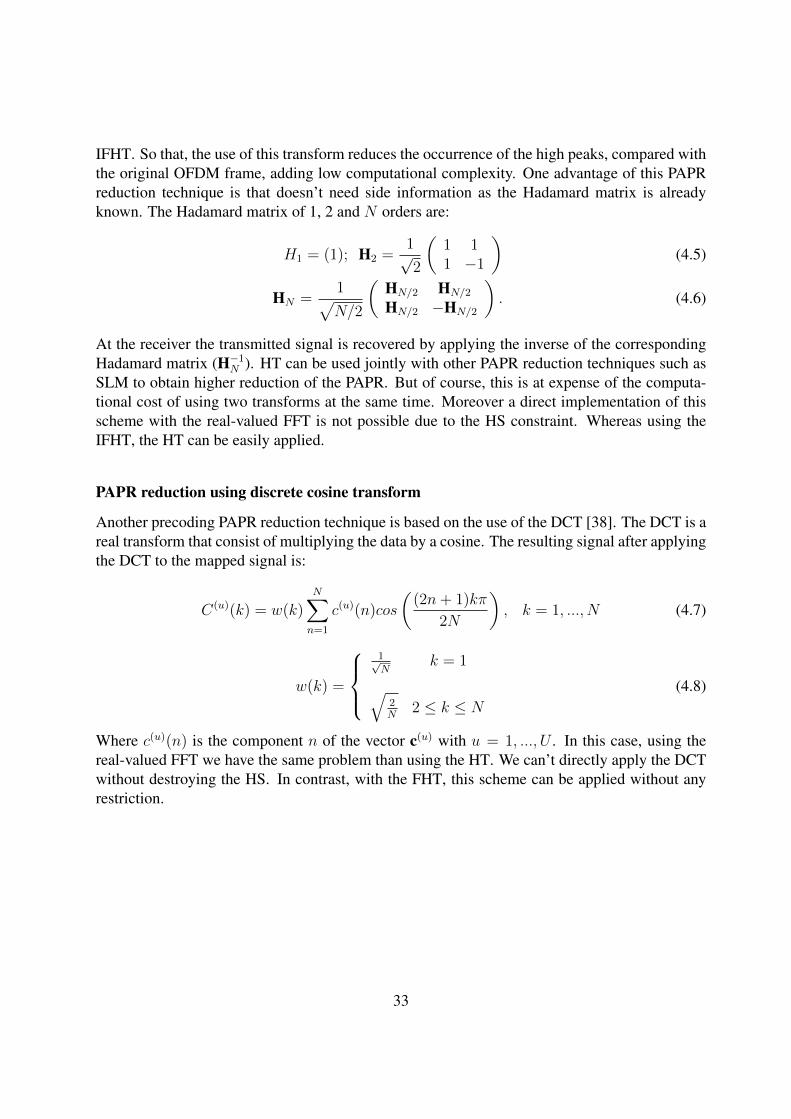
IFHT. So that, the use of this transform reduces the occurrence of the high peaks, compared withthe original OFDM frame, adding low computational complexity. One advantage of this PAPRreduction technique is that doesn’t need side information as the Hadamard matrix is alreadyknown. The Hadamard matrix of 1, 2 and N orders are:
H1 = (1); H2 =1√2
(1 11 −1
)(4.5)
HN =1√N/2
(HN/2 HN/2
HN/2 −HN/2
). (4.6)
At the receiver the transmitted signal is recovered by applying the inverse of the correspondingHadamard matrix (H−1N ). HT can be used jointly with other PAPR reduction techniques such asSLM to obtain higher reduction of the PAPR. But of course, this is at expense of the computa-tional cost of using two transforms at the same time. Moreover a direct implementation of thisscheme with the real-valued FFT is not possible due to the HS constraint. Whereas using theIFHT, the HT can be easily applied.
PAPR reduction using discrete cosine transform
Another precoding PAPR reduction technique is based on the use of the DCT [38]. The DCT is areal transform that consist of multiplying the data by a cosine. The resulting signal after applyingthe DCT to the mapped signal is:
C(u)(k) = w(k)N∑n=1
c(u)(n)cos
((2n+ 1)kπ
2N
), k = 1, ..., N (4.7)
w(k) =
1√N
k = 1√2N
2 ≤ k ≤ N
(4.8)
Where c(u)(n) is the component n of the vector c(u) with u = 1, ..., U . In this case, using thereal-valued FFT we have the same problem than using the HT. We can’t directly apply the DCTwithout destroying the HS. In contrast, with the FHT, this scheme can be applied without anyrestriction.
33

34

Chapter 5
Simulations results
In this section we evaluate the performance of different distortionless PAPR reduction techniquesfor IM/DD systems based on the FFT and the FHT using the CCDF. We also introduce the useof wavelets and we study the PAPR of different wavelet functions. Additionally, we evaluate theBER performance of DC biased O-OFDM. Finally, we show the BER performance of distortion-less PAPR reduction techniques in O-OFDM systems affected by AWGN noise.
5.1 PAPR evaluation in O-OFDM systemsHere we evaluate distortionless PAPR reduction techniques using the CCDF. We firstly analyzethe O-OFDM system depicted in figure 5.7 based on both the FFT and the FHT. For comparisonpurpose, when the FFT is used, the signal is mapped into M2-QAM format, whereas with theFHT scheme a M -PAM format is required, according to [4]. Firstly, we evaluate transformsof N = 64 subcarriers without oversampling and with 4-QAM format when the FFT is used,whereas with the FHT scheme we use a simple BPSK format [39]. Later on, we increase thenumber of subcarriers to N = 256 with an oversampling factor of 4 (L = 4). With these lastparameters, we will evaluate in section (5.2) the performance of distortionless PAPR reductiontechniques using the FHT. Finally, we study the PAPR of different wavelet functions for a OFDMsystem.
35
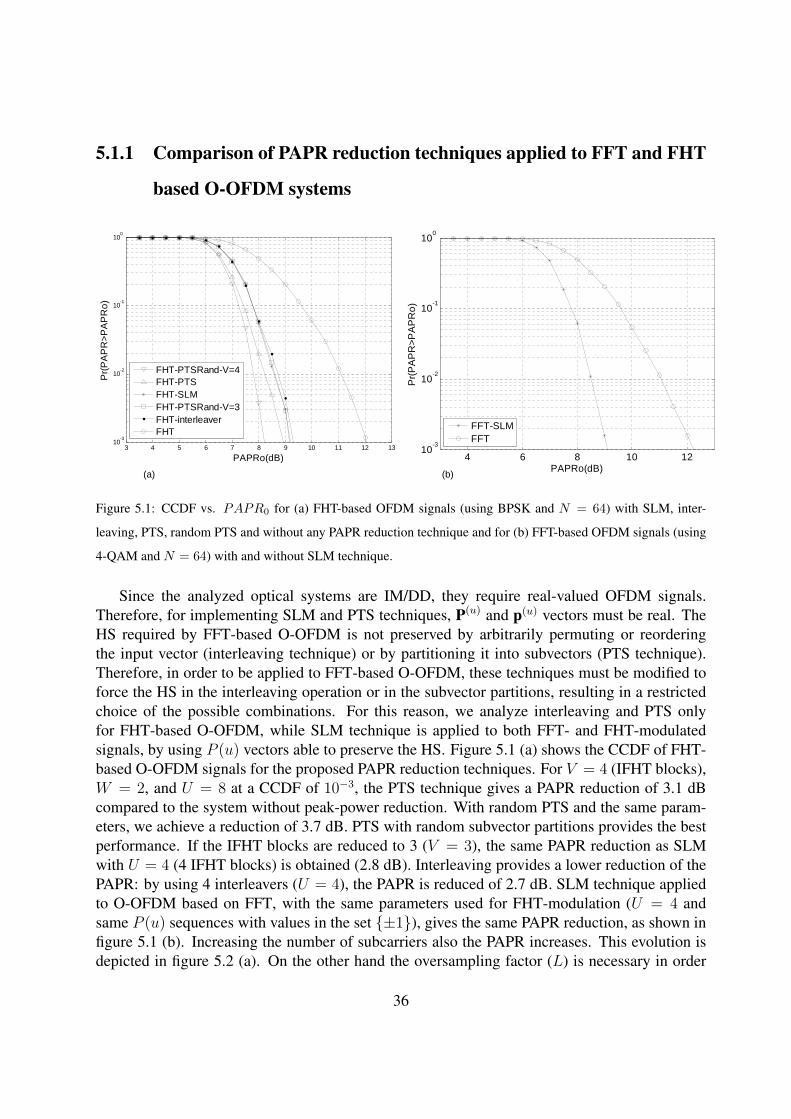
5.1.1 Comparison of PAPR reduction techniques applied to FFT and FHT
based O-OFDM systems
(a)
3 4 5 6 7 8 9 10 11 12 1310
-3
10-2
10-1
100
PAPRo(dB)
Pr(P
AP
R>P
AP
Ro)
FHT-PTSRand-V=4FHT-PTSFHT-SLMFHT-PTSRand-V=3FHT-interleaverFHT
4 6 8 10 1210-3
10-2
10-1
100
PAPRo(dB)
Pr(P
AP
R>P
AP
Ro)
FFT-SLMFFT
(b)
Figure 5.1: CCDF vs. PAPR0 for (a) FHT-based OFDM signals (using BPSK and N = 64) with SLM, inter-
leaving, PTS, random PTS and without any PAPR reduction technique and for (b) FFT-based OFDM signals (using
4-QAM and N = 64) with and without SLM technique.
Since the analyzed optical systems are IM/DD, they require real-valued OFDM signals.Therefore, for implementing SLM and PTS techniques, P(u) and p(u) vectors must be real. TheHS required by FFT-based O-OFDM is not preserved by arbitrarily permuting or reorderingthe input vector (interleaving technique) or by partitioning it into subvectors (PTS technique).Therefore, in order to be applied to FFT-based O-OFDM, these techniques must be modified toforce the HS in the interleaving operation or in the subvector partitions, resulting in a restrictedchoice of the possible combinations. For this reason, we analyze interleaving and PTS onlyfor FHT-based O-OFDM, while SLM technique is applied to both FFT- and FHT-modulatedsignals, by using P (u) vectors able to preserve the HS. Figure 5.1 (a) shows the CCDF of FHT-based O-OFDM signals for the proposed PAPR reduction techniques. For V = 4 (IFHT blocks),W = 2, and U = 8 at a CCDF of 10−3, the PTS technique gives a PAPR reduction of 3.1 dBcompared to the system without peak-power reduction. With random PTS and the same param-eters, we achieve a reduction of 3.7 dB. PTS with random subvector partitions provides the bestperformance. If the IFHT blocks are reduced to 3 (V = 3), the same PAPR reduction as SLMwith U = 4 (4 IFHT blocks) is obtained (2.8 dB). Interleaving provides a lower reduction of thePAPR: by using 4 interleavers (U = 4), the PAPR is reduced of 2.7 dB. SLM technique appliedto O-OFDM based on FFT, with the same parameters used for FHT-modulation (U = 4 andsame P (u) sequences with values in the set {±1}), gives the same PAPR reduction, as shown infigure 5.1 (b). Increasing the number of subcarriers also the PAPR increases. This evolution isdepicted in figure 5.2 (a). On the other hand the oversampling factor (L) is necessary in order
36
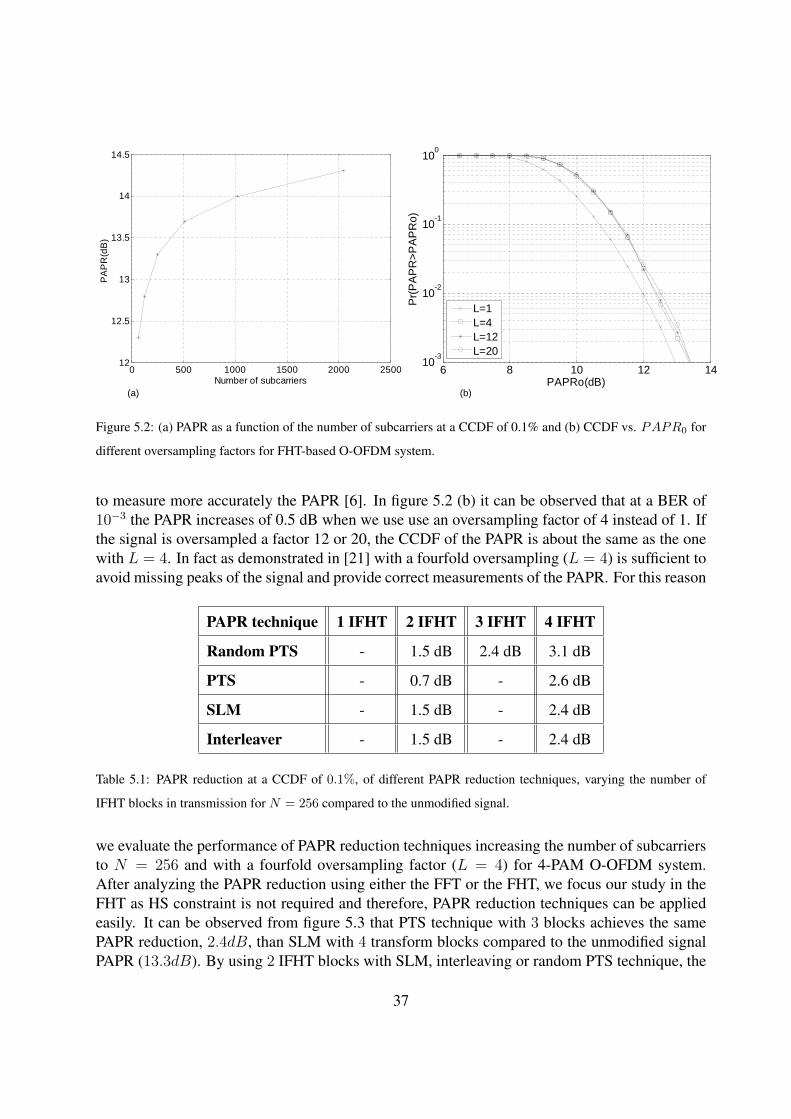
(a) (b)
6 8 10 12 1410-3
10-2
10-1
100
PAPRo(dB)
Pr(P
AP
R>P
AP
Ro)
L=1L=4L=12L=20
0 500 1000 1500 2000 250012
12.5
13
13.5
14
14.5
PA
PR
(dB
)
Number of subcarriers
Figure 5.2: (a) PAPR as a function of the number of subcarriers at a CCDF of 0.1% and (b) CCDF vs. PAPR0 for
different oversampling factors for FHT-based O-OFDM system.
to measure more accurately the PAPR [6]. In figure 5.2 (b) it can be observed that at a BER of10−3 the PAPR increases of 0.5 dB when we use use an oversampling factor of 4 instead of 1. Ifthe signal is oversampled a factor 12 or 20, the CCDF of the PAPR is about the same as the onewith L = 4. In fact as demonstrated in [21] with a fourfold oversampling (L = 4) is sufficient toavoid missing peaks of the signal and provide correct measurements of the PAPR. For this reason
PAPR technique 1 IFHT 2 IFHT 3 IFHT 4 IFHT
Random PTS - 1.5 dB 2.4 dB 3.1 dB
PTS - 0.7 dB - 2.6 dB
SLM - 1.5 dB - 2.4 dB
Interleaver - 1.5 dB - 2.4 dB
Table 5.1: PAPR reduction at a CCDF of 0.1%, of different PAPR reduction techniques, varying the number of
IFHT blocks in transmission for N = 256 compared to the unmodified signal.
we evaluate the performance of PAPR reduction techniques increasing the number of subcarriersto N = 256 and with a fourfold oversampling factor (L = 4) for 4-PAM O-OFDM system.After analyzing the PAPR reduction using either the FFT or the FHT, we focus our study in theFHT as HS constraint is not required and therefore, PAPR reduction techniques can be appliedeasily. It can be observed from figure 5.3 that PTS technique with 3 blocks achieves the samePAPR reduction, 2.4dB, than SLM with 4 transform blocks compared to the unmodified signalPAPR (13.3dB). By using 2 IFHT blocks with SLM, interleaving or random PTS technique, the
37
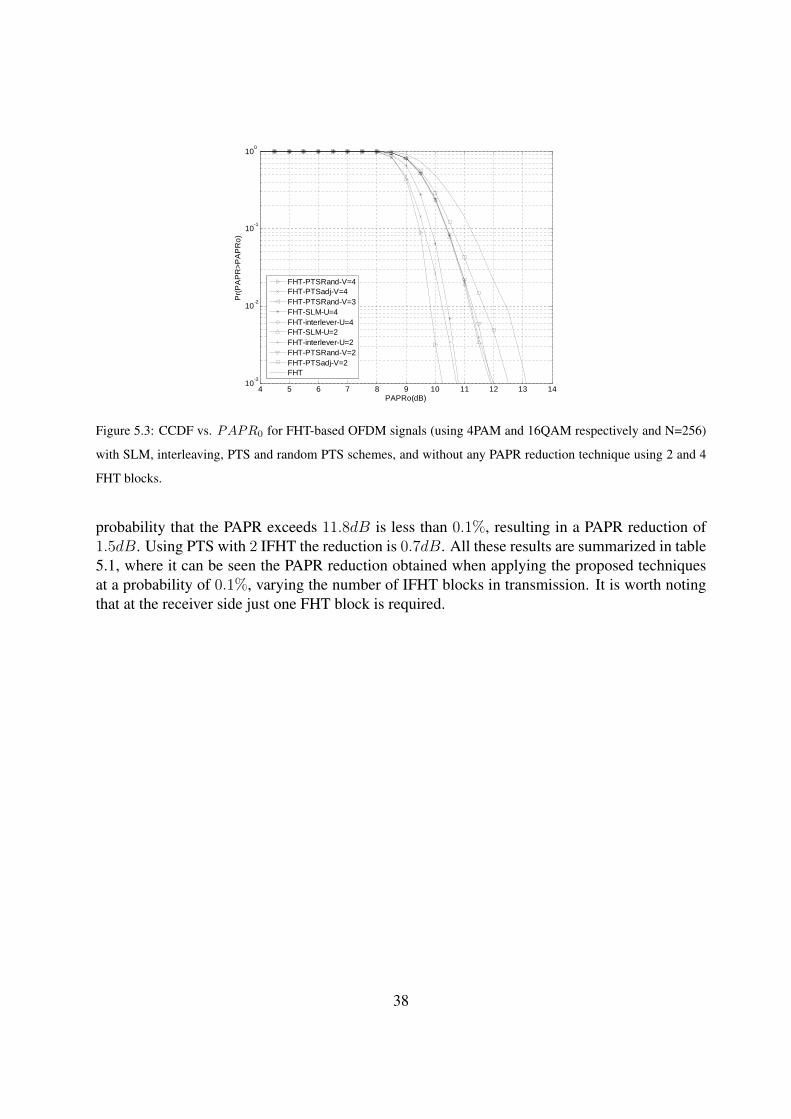
4 5 6 7 8 9 10 11 12 13 1410-3
10-2
10-1
100
PAPRo(dB)
Pr(P
AP
R>P
AP
Ro)
FHT-PTSRand-V=4FHT-PTSadj-V=4FHT-PTSRand-V=3FHT-SLM-U=4FHT-interlever-U=4FHT-SLM-U=2FHT-interlever-U=2FHT-PTSRand-V=2FHT-PTSadj-V=2FHT
Figure 5.3: CCDF vs. PAPR0 for FHT-based OFDM signals (using 4PAM and 16QAM respectively and N=256)
with SLM, interleaving, PTS and random PTS schemes, and without any PAPR reduction technique using 2 and 4
FHT blocks.
probability that the PAPR exceeds 11.8dB is less than 0.1%, resulting in a PAPR reduction of1.5dB. Using PTS with 2 IFHT the reduction is 0.7dB. All these results are summarized in table5.1, where it can be seen the PAPR reduction obtained when applying the proposed techniquesat a probability of 0.1%, varying the number of IFHT blocks in transmission. It is worth notingthat at the receiver side just one FHT block is required.
38
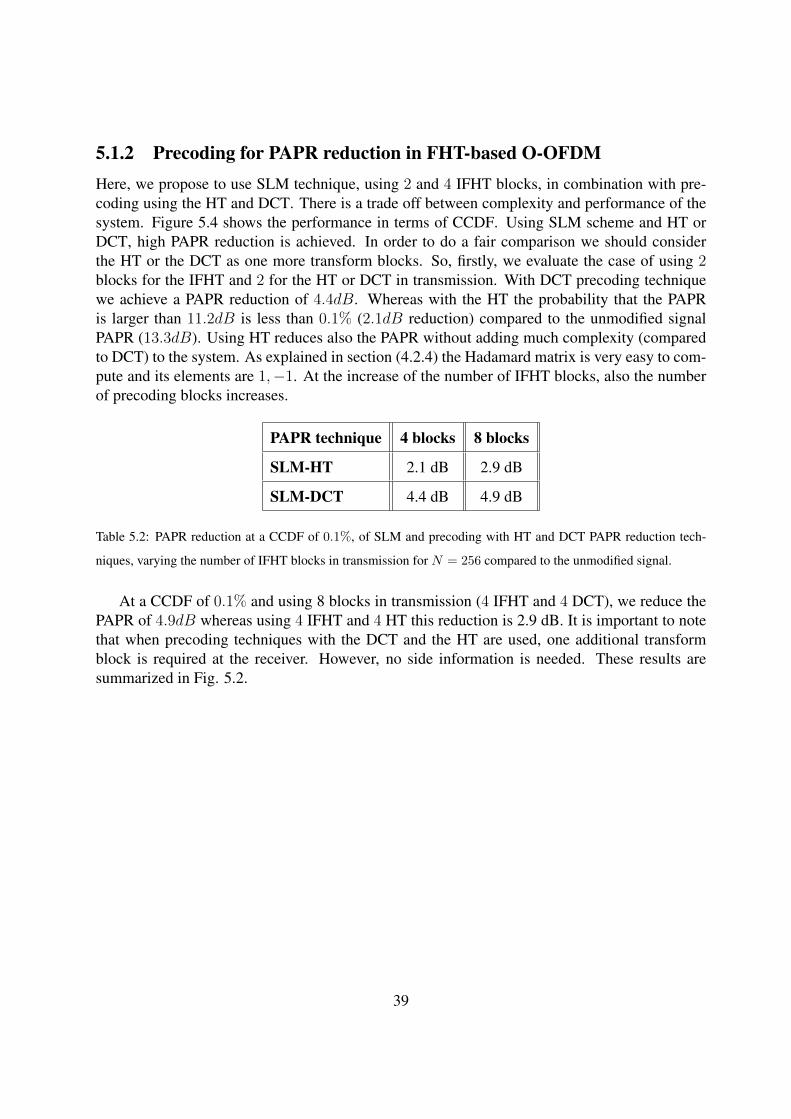
5.1.2 Precoding for PAPR reduction in FHT-based O-OFDMHere, we propose to use SLM technique, using 2 and 4 IFHT blocks, in combination with pre-coding using the HT and DCT. There is a trade off between complexity and performance of thesystem. Figure 5.4 shows the performance in terms of CCDF. Using SLM scheme and HT orDCT, high PAPR reduction is achieved. In order to do a fair comparison we should considerthe HT or the DCT as one more transform blocks. So, firstly, we evaluate the case of using 2blocks for the IFHT and 2 for the HT or DCT in transmission. With DCT precoding techniquewe achieve a PAPR reduction of 4.4dB. Whereas with the HT the probability that the PAPRis larger than 11.2dB is less than 0.1% (2.1dB reduction) compared to the unmodified signalPAPR (13.3dB). Using HT reduces also the PAPR without adding much complexity (comparedto DCT) to the system. As explained in section (4.2.4) the Hadamard matrix is very easy to com-pute and its elements are 1,−1. At the increase of the number of IFHT blocks, also the numberof precoding blocks increases.
PAPR technique 4 blocks 8 blocks
SLM-HT 2.1 dB 2.9 dB
SLM-DCT 4.4 dB 4.9 dB
Table 5.2: PAPR reduction at a CCDF of 0.1%, of SLM and precoding with HT and DCT PAPR reduction tech-
niques, varying the number of IFHT blocks in transmission for N = 256 compared to the unmodified signal.
At a CCDF of 0.1% and using 8 blocks in transmission (4 IFHT and 4 DCT), we reduce thePAPR of 4.9dB whereas using 4 IFHT and 4 HT this reduction is 2.9 dB. It is important to notethat when precoding techniques with the DCT and the HT are used, one additional transformblock is required at the receiver. However, no side information is needed. These results aresummarized in Fig. 5.2.
39
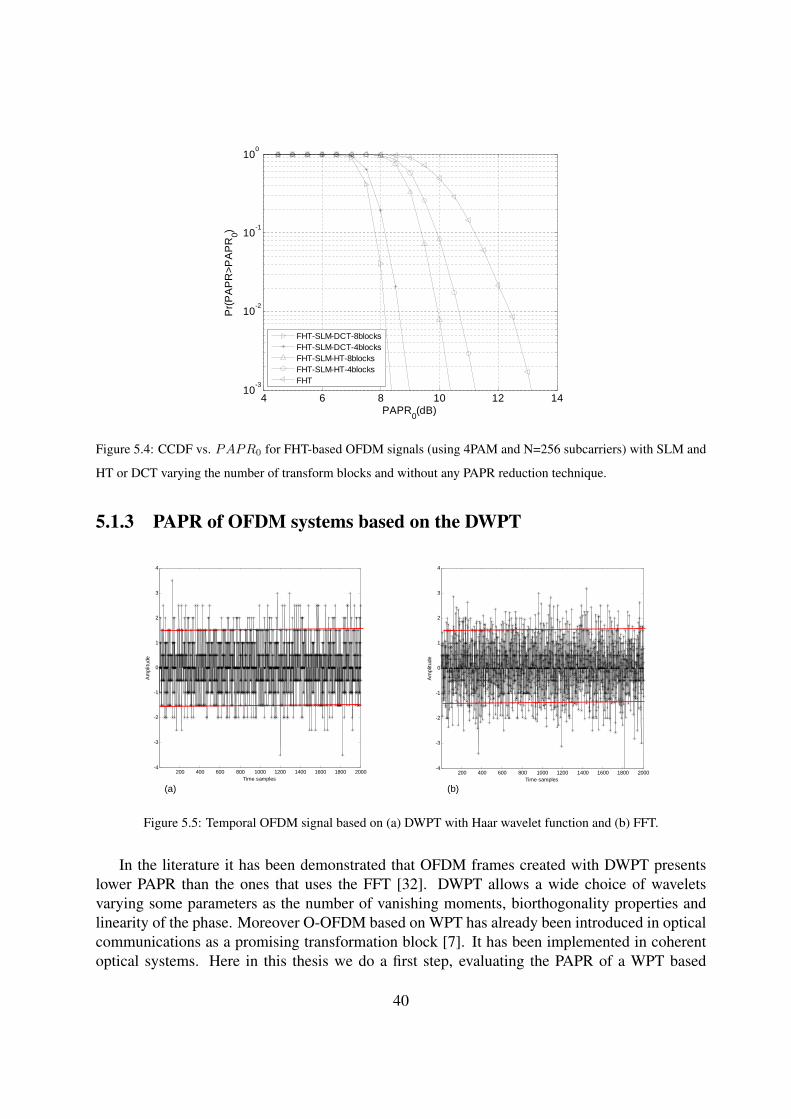
4 6 8 10 12 1410-3
10-2
10-1
100
PAPR0(dB)
Pr(P
AP
R>P
AP
R0)
FHT-SLM-DCT-8blocksFHT-SLM-DCT-4blocksFHT-SLM-HT-8blocksFHT-SLM-HT-4blocksFHT
Figure 5.4: CCDF vs. PAPR0 for FHT-based OFDM signals (using 4PAM and N=256 subcarriers) with SLM and
HT or DCT varying the number of transform blocks and without any PAPR reduction technique.
5.1.3 PAPR of OFDM systems based on the DWPT
200 400 600 800 1000 1200 1400 1600 1800 2000-4
-3
-2
-1
0
1
2
3
4
Time samples
Am
plitu
de
200 400 600 800 1000 1200 1400 1600 1800 2000-4
-3
-2
-1
0
1
2
3
4
Time samples
Am
plitu
de
(a) (b)
Figure 5.5: Temporal OFDM signal based on (a) DWPT with Haar wavelet function and (b) FFT.
In the literature it has been demonstrated that OFDM frames created with DWPT presentslower PAPR than the ones that uses the FFT [32]. DWPT allows a wide choice of waveletsvarying some parameters as the number of vanishing moments, biorthogonality properties andlinearity of the phase. Moreover O-OFDM based on WPT has already been introduced in opticalcommunications as a promising transformation block [7]. It has been implemented in coherentoptical systems. Here in this thesis we do a first step, evaluating the PAPR of a WPT based
40
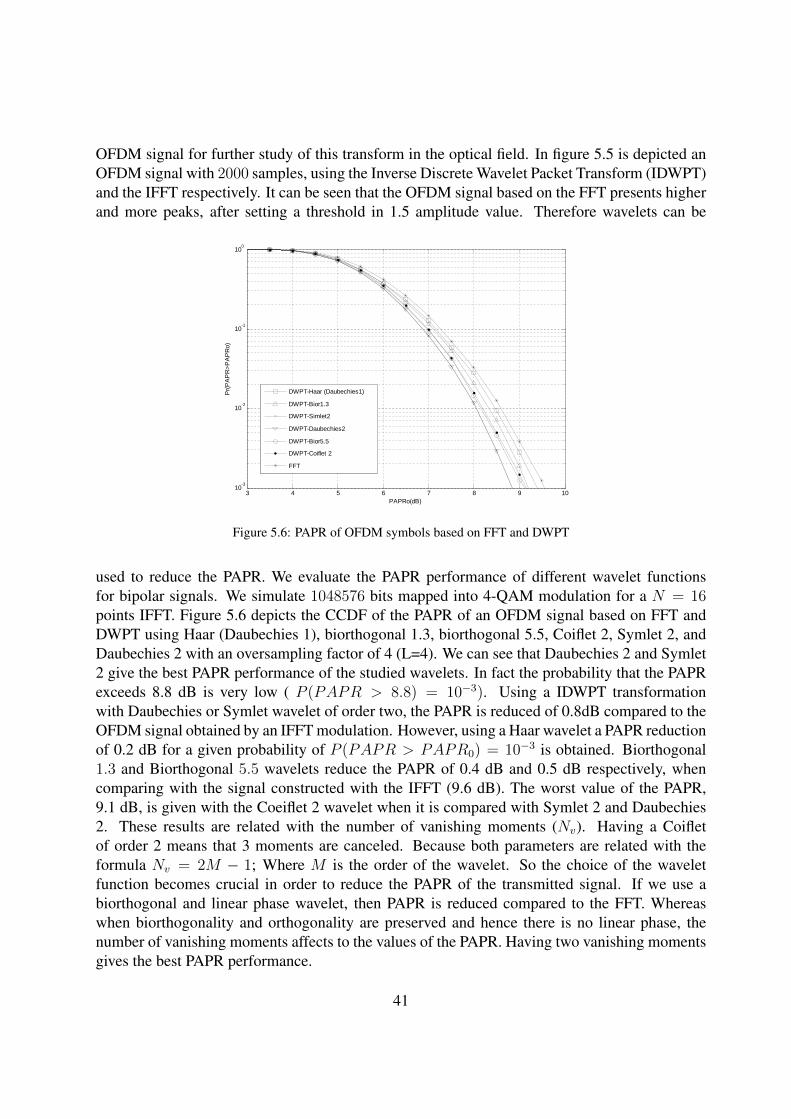
OFDM signal for further study of this transform in the optical field. In figure 5.5 is depicted anOFDM signal with 2000 samples, using the Inverse Discrete Wavelet Packet Transform (IDWPT)and the IFFT respectively. It can be seen that the OFDM signal based on the FFT presents higherand more peaks, after setting a threshold in 1.5 amplitude value. Therefore wavelets can be
3 4 5 6 7 8 9 1010-3
10-2
10-1
100
PAPRo(dB)
Pr(P
AP
R>P
AP
Ro)
DWPT-Haar (Daubechies1)
DWPT-Bior1.3
DWPT-Simlet2
DWPT-Daubechies2
DWPT-Bior5.5
DWPT-Coiflet 2
FFT
Figure 5.6: PAPR of OFDM symbols based on FFT and DWPT
used to reduce the PAPR. We evaluate the PAPR performance of different wavelet functionsfor bipolar signals. We simulate 1048576 bits mapped into 4-QAM modulation for a N = 16points IFFT. Figure 5.6 depicts the CCDF of the PAPR of an OFDM signal based on FFT andDWPT using Haar (Daubechies 1), biorthogonal 1.3, biorthogonal 5.5, Coiflet 2, Symlet 2, andDaubechies 2 with an oversampling factor of 4 (L=4). We can see that Daubechies 2 and Symlet2 give the best PAPR performance of the studied wavelets. In fact the probability that the PAPRexceeds 8.8 dB is very low ( P (PAPR > 8.8) = 10−3). Using a IDWPT transformationwith Daubechies or Symlet wavelet of order two, the PAPR is reduced of 0.8dB compared to theOFDM signal obtained by an IFFT modulation. However, using a Haar wavelet a PAPR reductionof 0.2 dB for a given probability of P (PAPR > PAPR0) = 10−3 is obtained. Biorthogonal1.3 and Biorthogonal 5.5 wavelets reduce the PAPR of 0.4 dB and 0.5 dB respectively, whencomparing with the signal constructed with the IFFT (9.6 dB). The worst value of the PAPR,9.1 dB, is given with the Coeiflet 2 wavelet when it is compared with Symlet 2 and Daubechies2. These results are related with the number of vanishing moments (Nv). Having a Coifletof order 2 means that 3 moments are canceled. Because both parameters are related with theformula Nv = 2M − 1; Where M is the order of the wavelet. So the choice of the waveletfunction becomes crucial in order to reduce the PAPR of the transmitted signal. If we use abiorthogonal and linear phase wavelet, then PAPR is reduced compared to the FFT. Whereaswhen biorthogonality and orthogonality are preserved and hence there is no linear phase, thenumber of vanishing moments affects to the values of the PAPR. Having two vanishing momentsgives the best PAPR performance.
41
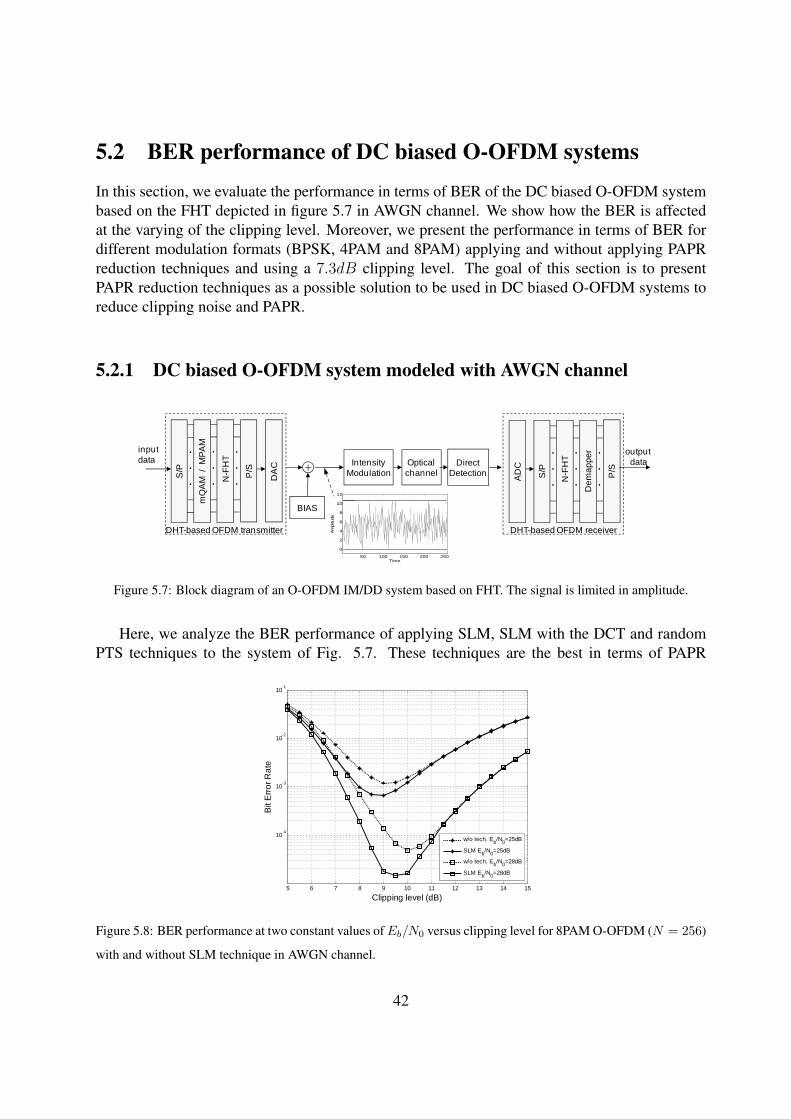
5.2 BER performance of DC biased O-OFDM systems
In this section, we evaluate the performance in terms of BER of the DC biased O-OFDM systembased on the FHT depicted in figure 5.7 in AWGN channel. We show how the BER is affectedat the varying of the clipping level. Moreover, we present the performance in terms of BER fordifferent modulation formats (BPSK, 4PAM and 8PAM) applying and without applying PAPRreduction techniques and using a 7.3dB clipping level. The goal of this section is to presentPAPR reduction techniques as a possible solution to be used in DC biased O-OFDM systems toreduce clipping noise and PAPR.
5.2.1 DC biased O-OFDM system modeled with AWGN channel
50 100 150 200 250
0
2
4
6
8
10
12
Time
Ampl
itude
output data
DHT-based OFDM transmitter
IntensityModulation
OpticalchannelS
/P
P/S
DA
C
S/P
N-F
HT
Dem
appe
r
P/S
AD
C
.
.
.
DHT-based OFDM receiver
input data
N-F
HT
mQ
AM
/ M
PAM
.
.
.
.
.
.
.
.
.
.
.
.
.
.
.
BIAS
DirectDetection
Figure 5.7: Block diagram of an O-OFDM IM/DD system based on FHT. The signal is limited in amplitude.
Here, we analyze the BER performance of applying SLM, SLM with the DCT and randomPTS techniques to the system of Fig. 5.7. These techniques are the best in terms of PAPR
5 6 7 8 9 10 11 12 13 14 15
10-4
10-3
10-2
10-1
Clipping level (dB)
Bit
Erro
r Rat
e
w/o tech. Eb/N0=25dB
SLM Eb/N0=25dB
w/o tech. Eb/N0=28dB
SLM Eb/N0=28dB
Figure 5.8: BER performance at two constant values of Eb/N0 versus clipping level for 8PAM O-OFDM (N = 256)
with and without SLM technique in AWGN channel.
42
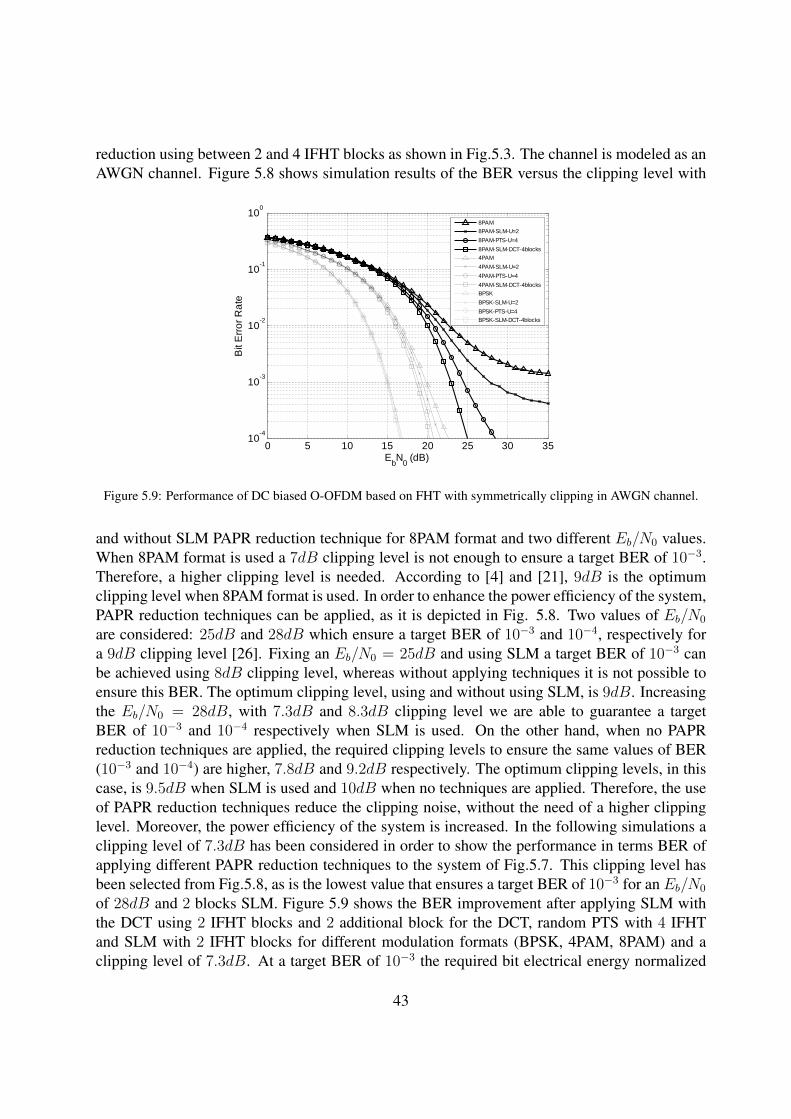
reduction using between 2 and 4 IFHT blocks as shown in Fig.5.3. The channel is modeled as anAWGN channel. Figure 5.8 shows simulation results of the BER versus the clipping level with
0 5 10 15 20 25 30 3510-4
10-3
10-2
10-1
100
EbN0 (dB)
Bit
Erro
r Rat
e
8PAM8PAM-SLM-U=28PAM-PTS-U=48PAM-SLM-DCT-4blocks4PAM4PAM-SLM-U=24PAM-PTS-U=44PAM-SLM-DCT-4blocksBPSKBPSK-SLM-U=2BPSK-PTS-U=4BPSK-SLM-DCT-4blocks
Figure 5.9: Performance of DC biased O-OFDM based on FHT with symmetrically clipping in AWGN channel.
and without SLM PAPR reduction technique for 8PAM format and two different Eb/N0 values.When 8PAM format is used a 7dB clipping level is not enough to ensure a target BER of 10−3.Therefore, a higher clipping level is needed. According to [4] and [21], 9dB is the optimumclipping level when 8PAM format is used. In order to enhance the power efficiency of the system,PAPR reduction techniques can be applied, as it is depicted in Fig. 5.8. Two values of Eb/N0
are considered: 25dB and 28dB which ensure a target BER of 10−3 and 10−4, respectively fora 9dB clipping level [26]. Fixing an Eb/N0 = 25dB and using SLM a target BER of 10−3 canbe achieved using 8dB clipping level, whereas without applying techniques it is not possible toensure this BER. The optimum clipping level, using and without using SLM, is 9dB. Increasingthe Eb/N0 = 28dB, with 7.3dB and 8.3dB clipping level we are able to guarantee a targetBER of 10−3 and 10−4 respectively when SLM is used. On the other hand, when no PAPRreduction techniques are applied, the required clipping levels to ensure the same values of BER(10−3 and 10−4) are higher, 7.8dB and 9.2dB respectively. The optimum clipping levels, in thiscase, is 9.5dB when SLM is used and 10dB when no techniques are applied. Therefore, the useof PAPR reduction techniques reduce the clipping noise, without the need of a higher clippinglevel. Moreover, the power efficiency of the system is increased. In the following simulations aclipping level of 7.3dB has been considered in order to show the performance in terms BER ofapplying different PAPR reduction techniques to the system of Fig.5.7. This clipping level hasbeen selected from Fig.5.8, as is the lowest value that ensures a target BER of 10−3 for an Eb/N0
of 28dB and 2 blocks SLM. Figure 5.9 shows the BER improvement after applying SLM withthe DCT using 2 IFHT blocks and 2 additional block for the DCT, random PTS with 4 IFHTand SLM with 2 IFHT blocks for different modulation formats (BPSK, 4PAM, 8PAM) and aclipping level of 7.3dB. At a target BER of 10−3 the required bit electrical energy normalized
43

to the noise power spectral density (Eb/N0) for BPSK is 15dB, approximately the same for thethree techniques. For 4-PAM when SLM with DCT is used, the (Eb/N0) required to ensure atarget BER of 10−3 is reduced of 1.2dB compared to the BER curve obtained without applyingPAPR reduction techniques (Eb/N0 = 19.8dB) . When using random PTS with 4 IFHT blocksthis reduction is 1dB. Moreover, if we reduce the number of blocks to 2 IFHT, using SLM,this reduction becomes 0.5dB. Finally, for 8PAM, with SLM-DCT and random-PTS, the floorinduced by clipping noise doesn’t occur up to 10−4 BER with only 7.3dB clipping level. It isseen that the techniques perform better for higher modulation orders.
44
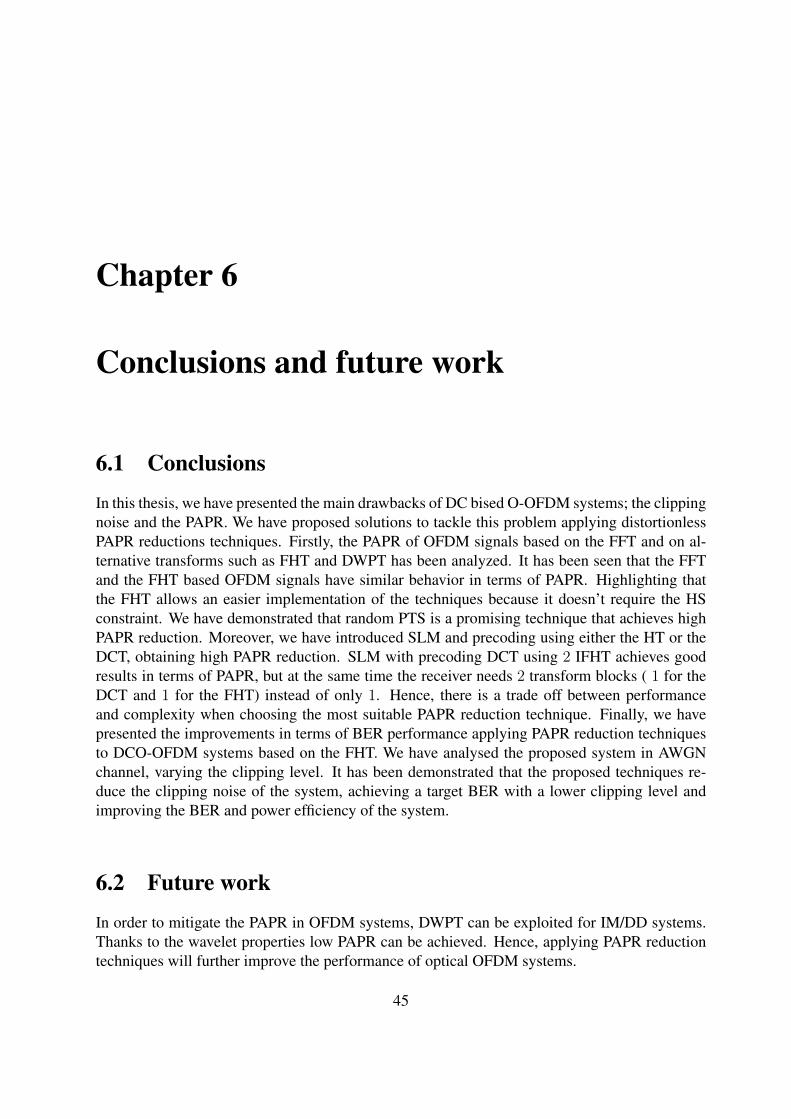
Chapter 6
Conclusions and future work
6.1 Conclusions
In this thesis, we have presented the main drawbacks of DC bised O-OFDM systems; the clippingnoise and the PAPR. We have proposed solutions to tackle this problem applying distortionlessPAPR reductions techniques. Firstly, the PAPR of OFDM signals based on the FFT and on al-ternative transforms such as FHT and DWPT has been analyzed. It has been seen that the FFTand the FHT based OFDM signals have similar behavior in terms of PAPR. Highlighting thatthe FHT allows an easier implementation of the techniques because it doesn’t require the HSconstraint. We have demonstrated that random PTS is a promising technique that achieves highPAPR reduction. Moreover, we have introduced SLM and precoding using either the HT or theDCT, obtaining high PAPR reduction. SLM with precoding DCT using 2 IFHT achieves goodresults in terms of PAPR, but at the same time the receiver needs 2 transform blocks ( 1 for theDCT and 1 for the FHT) instead of only 1. Hence, there is a trade off between performanceand complexity when choosing the most suitable PAPR reduction technique. Finally, we havepresented the improvements in terms of BER performance applying PAPR reduction techniquesto DCO-OFDM systems based on the FHT. We have analysed the proposed system in AWGNchannel, varying the clipping level. It has been demonstrated that the proposed techniques re-duce the clipping noise of the system, achieving a target BER with a lower clipping level andimproving the BER and power efficiency of the system.
6.2 Future work
In order to mitigate the PAPR in OFDM systems, DWPT can be exploited for IM/DD systems.Thanks to the wavelet properties low PAPR can be achieved. Hence, applying PAPR reductiontechniques will further improve the performance of optical OFDM systems.
45

On the other hand, the FHT offers a wide range of possibilities to implement an IM/DD sys-tem. Thanks to its properties, PAPR reduction techniques can be easily applied. For this reason,our work is focused on O-OFDM systems based on the FHT. Our idea is to continue studying thePAPR reduction for all actual implementation in optical OFDM schemes, reducing the requiredresources and improving the transmission performance. Moreover we are also interested in adap-tively modulation techniques that enable to transmit at different bit rates filling the subcarrierswith different modulation formats.
46
Bibliography
[1] J. Armstrong, “OFDM: From copper and wireless to optical,” in Conference on Opti-cal Fiber communication/National Fiber Optic Engineers Conference (OFC/NFOEC), feb.2008, pp. 1 –27.
[2] ——, “OFDM for optical communications,” J. Lightw. Technol., vol. 27, no. 3, pp. 189–204, feb.1, 2009.
[3] D. I. Shieh, W., OFDM for Optical Communications. Elsevier,USA, 2010.
[4] M. Moreolo, R. Muñoz, and G. Junyent, “Novel power efficient optical OFDM based onhartley transform for intensity-modulated direct-detection systems,” J. Lightw. Technol.,vol. 28, no. 5, pp. 798 –805, march 2010.
[5] J. Armstrong and A. Lowery, “Power efficient optical OFDM,” Electron. Lett., vol. 42,no. 6, pp. 370 – 372, march 2006.
[6] S. H. Han and J. H. Lee, “An overview of peak-to-average power ratio reduction techniquesfor multicarrier transmission,” Wireless Communications, IEEE, vol. 12, no. 2, pp. 56 – 65,april 2005.
[7] S. W. Li, A. and R. Tucker, “Wavelet packet transform-based OFDM for optical communi-cations,” J. Lightw. Technol., vol. 28, no. 24, pp. 3519 –3528, dec.15 2010.
[8] G. P. Agrawal, Fiber-Optic Communication Systems. Wiley-Interscience, oct. 2010.
[9] R. S. Quimby, Photonics and lasers. Wiley-Interscience.
[10] R. Chang, “Orthogonal frequency multiplex data transmission system,” in USA U.S. Patent3488445, 1966.
[11] J. Salz and S. B. Weinstein, “Fourier transform communication system,” in Proceedingsof the first ACM symposium on Problems in the optimization of data communicationssystems. New York, NY, USA: ACM, 1969, pp. 99–128. [Online]. Available:http://doi.acm.org/10.1145/800165.805240
47
[12] E. T. Ar and I. E. Telatar, “Capacity of multi-antenna gaussian channels,” European Trans-actions on Telecommunications, vol. 10, pp. 585–595, 1999.
[13] G. Foschini and M. Gans, “On limits of wireless communications in a fad-ing environment when using multiple antennas,” Wireless Personal Communica-tions, vol. 6, pp. 311–335, 1998, 10.1023/A:1008889222784. [Online]. Available:http://dx.doi.org/10.1023/A:1008889222784
[14] X. Liang, W. Li, W. Ma, and K. Wang, “A simple peak-to-average power ratio reductionscheme for all optical orthogonal frequency division multiplexing systems with intensitymodulation and direct detection,” Opt. Exp., vol. 17, no. 18, pp. 15 614–15 622, 2009.[Online]. Available: http://www.opticsexpress.org/abstract.cfm?URI=oe-17-18-15614
[15] R. Laselle and M. Alard, “Principles of modulation and channel coding for digital broad-casting for mobile receivers,” EBU Tech. Rev., pp. 168–190, 1987.
[16] J. Chow, J. Tu, and J. Cioffi, “A discrete multitone transceiver system for hdsl applications,”IEEE Journal on Selected Areas in Communications, vol. 9, no. 6, pp. 895 –908, aug 1991.
[17] X. Liang, W. Li, W. Ma, and K. Wang, “A simple peak-to-average power ratio reductionscheme for all optical orthogonal frequency division multiplexing systems with intensitymodulation and direct detection,” Opt. Exp., vol. 17, no. 18, pp. 15 614–15 622, 2009.[Online]. Available: http://www.opticsexpress.org/abstract.cfm?URI=oe-17-18-15614
[18] B. Schmidt, A. Lowery, and J. Armstrong, “Experimental demonstrations of electronicdispersion compensation for long-haul transmission using direct-detection optical OFDM,”J. Lightw. Technol., vol. 26, no. 1, pp. 196 –203, jan.1, 2008.
[19] X. Liang, W. Li, W. Ma, and K. Wang, “A simple peak-to-average power ratio reductionscheme for all optical orthogonal frequency division multiplexing systems with intensitymodulation and direct detection,” Opt. Exp., vol. 17, no. 18, pp. 15 614–15 622, 2009.[Online]. Available: http://www.opticsexpress.org/abstract.cfm?URI=oe-17-18-15614
[20] J. Armstrong and B. Schmidt, “Comparison of asymmetrically clipped optical OFDM andDC-biased optical OFDM in AWGN,” Communications Letters, IEEE, vol. 12, no. 5, pp.343 –345, may 2008.
[21] Lee, Breyer, Randel, Boom, and Koonen, “High-speed transmission over multimode fiberusing discrete multitone modulation,” J. Opt. Netw., vol. 7, no. 2, p. 183, 2008. [Online].Available: http://repository.tue.nl/649709
[22] W. Shieh and C. Athaudage, “Coherent optical orthogonal frequency division multiplex-ing,” Electron. Lett., vol. 42, no. 10, pp. 587 – 589, may 2006.
[23] R. Van Nee and P. R., OFDM for wireless multimedia communications. Artech HouseUniversal Personal Communications, 2000.
48
[24] R. N. Bracewell, “The fast hartley transform,” Proc. IEEE, vol. 72, no. 8, pp. 1010–1018,aug 1984.
[25] P. Duhamel and M. Vetterli, “Improved fourier and hartley transform algorithms: Applica-tion to cyclic convolution of real data,” IEEE Transactions on Acoustics, Speech and SignalProcessing, vol. 35, no. 6, pp. 818–824, 1987.
[26] M. Moreolo, “Performance analysis of DHT-based optical OFDM using large-size con-stellations in AWGN,” IEEE Communications Letters, vol. 15, no. 5, pp. 572 –574, may2011.
[27] F. J. Svaluto Moreolo, M. and G. Junyent, “Characterization of fast and power efficientoptical OFDM transmission system based on hartley transform,” in Conference on Lasersand Electro-Optics (CLEO), may 2011, pp. 1 –2.
[28] M. M. Fabrega, J.M. and G. Junyent, “Constant envelope coherent optical OFDM based onfast hartley transform,” in 13th International Conference on Transparent Optical Networks(ICTON), june 2011, pp. 1 –4.
[29] G. W. Pan, Wavelets in Electromagnetics and Device Modeling. Wiley Series in Microwaveand Optical Engineering, 2003.
[30] X. Liang, W. Li, W. Ma, and K. Wang, “A simple peak-to-average power ratio reductionscheme for all optical orthogonal frequency division multiplexing systems with intensitymodulation and direct detection,” Optics Express, vol. 17, no. 18, pp. 15 614–15 622, 2009.[Online]. Available: http://www.opticsexpress.org/abstract.cfm?URI=oe-17-18-15614
[31] M. Gautier, M. Arndt, and J. Lienard, “Efficient wavelet packet modulation for wirelesscommunication,” in The Third Advanced International Conference on TelecommunicationsAICT, may 2007, p. 19.
[32] A. Lindsey, “Wavelet packet modulation for orthogonally multiplexed communication,”Signal Processing, IEEE Transactions on, vol. 45, no. 5, pp. 1336 –1339, may 1997.
[33] R. Bauml, R. Fischer, and J. Huber, “Reducing the peak-to-average power ratio of multi-carrier modulation by selected mapping,” Electron. Lett., vol. 32, no. 22, pp. 2056 –2057,oct 1996.
[34] A. Jayalath and C. Tellambura, “Reducing the peak-to-average power ratio of orthogonalfrequency division multiplexing signal through bit or symbol interleaving,” Electron. Lett.,vol. 36, no. 13, pp. 1161 –1163, jun 2000.
[35] S. Muller and J. Huber, “OFDM with reduced peak-to-average power ratio by optimumcombination of partial transmit sequences,” Electron. Lett., vol. 33, no. 5, pp. 368 –369, feb1997.
49
[36] ——, “A novel peak power reduction scheme for OFDM,” in Personal, Indoor and MobileRadio Communications, ’Waves of the Year 2000’ PIMRC, vol. 3, sep 1997, pp. 1090 –1094vol.3.
[37] S.-W. Kim, J.-K. Chung, and H.-G. Ryu, “PAPR reduction of the OFDM signal by theSLM-based WHT and DSI method,” in IEEE Region 10 Conference TENCON, nov. 2006,pp. 1 –4.
[38] I. Baig and V. Jeoti, “DCT precoded SLM technique for PAPR reduction in OFDM sys-tems,” in International Conference on Intelligent and Advanced Systems (ICIAS), june2010, pp. 1 –6.
[39] L. Nadal, M. Svaluto Moreolo, J. M. Fabrega, and G. Junyent, “Comparison of peak powerreduction techniques in optical OFDM systems based on FFT and FHT,” in In Proc. Trans-parent Optical Networks (ICTON), jun 2011.
50