Embed Size (px)
Citation preview
Performance Analysis of Feature Extraction and Selection of Region
of Interest by Segmentation in Mammogram Images between the
Existing Meta-heuristic Algorithms and Monkey Search
Optimization (MSO)
S.KANIMOZHI SUGUNA1, DR.S.UMA MAHESWARI
2
1. Teaching Assistant, Department of Computer Applications,
Anna University Regional Centre – Coimbatore, Coimbatore -641 047
TAMIL NADU, INDIA
+91 9941968423, [email protected] 2.
Associate Professor, Department of Electronics and Communications Engineering,
Coimbatore Institute of Technology, Coimbatore – 641 014
TAMIL NADU, INDIA
+91 9944756014,[email protected]
Abstract: In medical image processing, feature selection and extraction is an important task for
performing image classification and recognition which is performed through the image segmentation
process. This paper proposes a different approach; Monkey Search Optimization (MSO) which is based
on Metaheuristic Algorithm is presented for selecting region of interest in mammogram image. Monkey
Search Optimization (MSO) algorithm is considered as a new algorithm searching for optimum solution
based on the foraging behavior of monkeys. Pectoral region removed image is given as input for feature
extraction. The proposed algorithm can be implemented for various applications as the time consumption
for the process is reduced greatly. In this paper the proposed algorithm is compared with few other meta-
heuristics algorithms such as Ant Colony Optimization (ACO), Artificial Bee Colony Optimization
(ABC) and Particle Swarm Optimization (PSO); from the results that the proposed approach can be
considered to be an appropriate algorithm for image segmentation. Results are presented based on
simulation made with the implementation in MATLAB which is tested on the images of MIAS database.
Key-Words: MSO, ACO, ABC, PSO, Climb, Watch – Jump and Co-operation.
1 Introduction Breast Cancer is where cancerous (Malignant)
cells are found in the breast tissue. Radiograph
of the breast tissue is called mammogram.
Getting a mammogram is an effective way to
detect breast cancer in its early stages. Breast
Cancer is the second leading cancer next to
Cervical Cancer.
Breast Cancer is most common in women
than men worldwide. The early symptoms of
breast cancer is often not recognized or
perceived by the patient. The only way to avoid
breast cancer in women is early detection either
through self – examination or approaching the
doctor.
X-ray mammography is the most common
investigation technique used by radiologists in
the screening, and diagnosis of breast cancer
they could help the radiologists in the
interpretation of the mammograms and could be
useful for an accurate diagnosis. To perform a
semi-automated tracking of the breast cancer, it
is necessary to detect the presence or absence of
lesions from the mammograms.
1.1 Related Works The preprocessing technique is also known as
background suppression. Before getting into the
presence or absence of lesions preprocessing is
done to remove the pectoral region, as it is not in
need of the whole image [5]. In most conditions
any of the filter is used as in [8, 9]. Next to the
preprocessing is selecting the Region of Interest
or Feature Extraction and Feature Selection
WSEAS TRANSACTIONS on INFORMATION SCIENCE and APPLICATIONS S. Kanimozhi Suguna, S. Uma Maheswari
E-ISSN: 2224-3402 72 Volume 11, 2014
through segmentation process. It focuses on the
relevant feature extraction and possible removal
of irrelevant features [6]. The advantage of
doing feature extraction is to compress the input
space for classification which reduces the
overhead of the classifier.
1.2 Overview of Metaheuristic
Algorithms This paper explains a new algorithm called
Monkey Search Optimization for extracting the
feature in mammogram image. This MSO is a
Nature-Inspired Evolutionary Algorithm. Rest of
the paper is organized as follow. Overview of
the problem is explained in Section 2. Basic of
the Monkey Search Optimization is focused in
Section 3. Monkey Search Optimization for the
problem (selecting the region of interest) is
presented in Section 4. Experimental Results are
performed in Section 5. Conclusion is drawn in
Section 6.
2 Overview of the Problem
In this paper we focus on the selection of
region of interest also known as feature
extraction in image processing is the last stage
in preprocessing of mammogram images [2].
Feature extraction refers to the presence of the
parts of an object within the image in terms of
appearance, structure and arrangement. The
region which contains label and other detail
regarding the mammogram image in X-ray
image of the breast is the pectoral muscle
region. Preprocessing technique involves
background removal, noise removal and
enhancing the image. The preprocessed and
pectoral region removed image is given as
input to the process of feature extraction.
In [1] comparison is made based on the
behaviors of three different monkey species
such as Howler, Spider, and Squirrel Monkeys.
The behaviors of monkeys differ from each
other based on the food type, movement,
searching for food, resting, watching, and doing
other activities. Types of food are leaf, fruits,
and insects. Howler monkey depends on leaves,
Spider monkey focuses on leaves and fruits,
whereas Squirrel monkeys have both fruits and
insects. Mammogram image is considered as
forest. Forest will have both edible and non-
edible foods. This paper presumes the region of
interest part as the edible food for monkeys,
which is available in abundant. Hence the
feature is selected and extracted.
3 Basic of the MSO MSO focuses on the foraging behavior of
monkey. Monkeys go in search of foods
available in the branches of the trees. Each
branch is considered as feasible solution.
Selection of the branch is based on the
probability mechanism. The process of MSO is
organized in three processes such as climb,
watch-jump and somersault processes. Climb
process is further classified as climb up and
climb down along with either long or short step
climb process [3, 4, 5, 10, 11].
3.1 Climb Process Let assume the concept by having the decision
variable vector ( ) and
the objective function for minimization as ( ). ( )
is a randomly
generated vector. The pseudo-gradient of
function ( ) at the point R can be expressed
as( ( )
( ) ( ))
, where
( )
( ) ( )
{ }(1)
As the generations of are repeated, local
optimum is found by the decrease in the
objective function ( ) based on the sign
caused as a result of slow replacement of
with or .
3.2 Watch-Jump Process This process is made once the monkey reaches
the tip of the tree. Since the monkey has to
move on to find availability of any other
feasible solution in the forest. Besides
searching for food the monkey has to be aware
of the presence of enemies. If there is any
feasible solution, then it is replaced with the
current solution [3, 4, 5, 10, 11].
3.3 Cooperation Process This process focuses on the cooperation among
monkeys. Hence the monkeys at better solution
will communicate with monkeys at poor
solution and make them to climb to the better
of the area [10].
WSEAS TRANSACTIONS on INFORMATION SCIENCE and APPLICATIONS S. Kanimozhi Suguna, S. Uma Maheswari
E-ISSN: 2224-3402 73 Volume 11, 2014
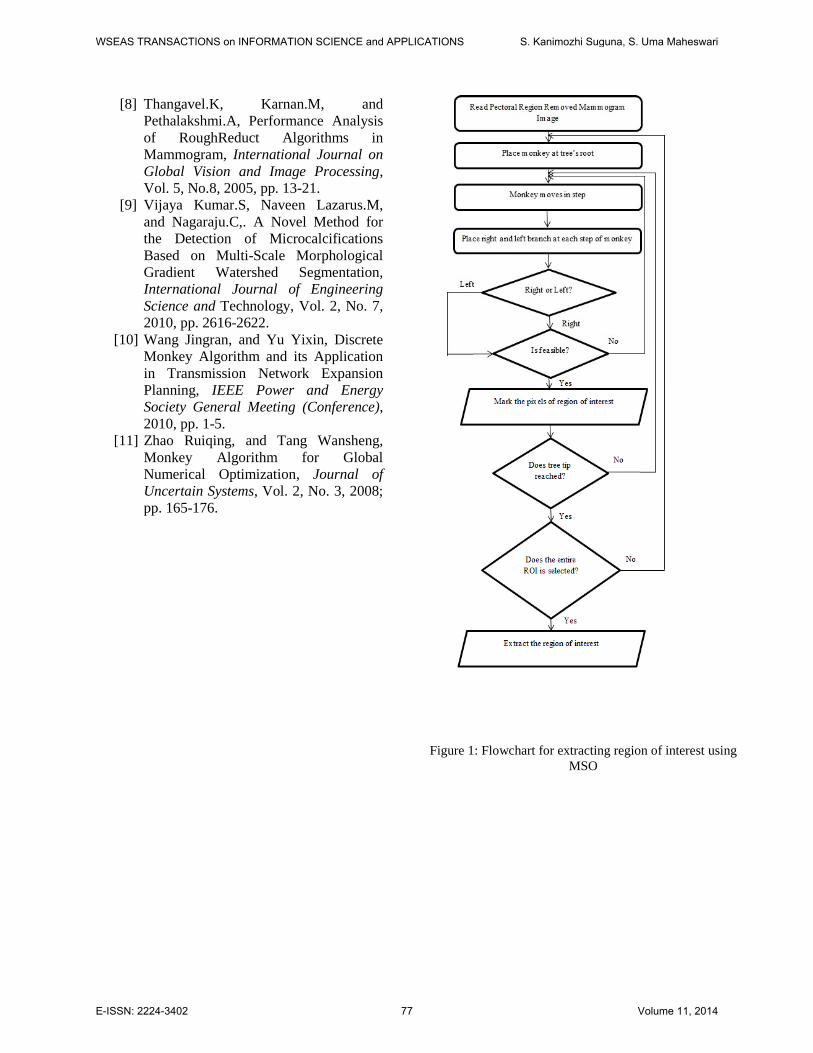
3.4 Somersault Process In this phase monkeys will move from one
position to another position to find the
availability of new solution [10] in the given
forest area. Figure 1 depicts the MSO for
feature extraction in mammogram image.
4 Implementation of MSO to
the Problem
Given the details of the image, removal of
pectoral muscle region in the mammogram
image problem can be defined as:
Energy of Monkeys is represented as
‖ ‖ √∫ ( )
(2)
Where ( ) ( ) (3)
Where is the energy required by each
monkey for moving from one place to another.
Total energy is calculated based on
( ) ‖ ‖ ( )
‖ ‖ ∑ ( ) (4)
With the following conditions:
(5)
(6)
{ } (7)
Solution Representation:
The solution for the problem is represented in
the following equation.
( )
Objective function:
The objective function is modified as
follows:
( )
{
∑ ( )
∑ { | | }
Generate initial population for M monkeys
( )
While (t<MaxGeneration) or
(segmentation completed).
Where , image matrix,
, pixel value,
, total energy,
, active pixels in the image,
, gravitational force when
monkey jumps from one tree to another,
, penalty if monkey is
unreachable,
, maximum of how many
pixels affected in the image,
, original image,
, number of monkeys in correct
position,
, maximum number of monkeys,
, set of existing path for
movement, and
, set of new path for movement.
4.1 Climb Process Initialize random position for M monkeys as
( ) evaluate its
current position to reach the border for which
select either of large-step or small-step climb
process:
(a) The large-step climb process: Generate
(i) ( )
Interval [ ] where is the
length of large-step climb process.
WSEAS TRANSACTIONS on INFORMATION SCIENCE and APPLICATIONS S. Kanimozhi Suguna, S. Uma Maheswari
E-ISSN: 2224-3402 74 Volume 11, 2014
(ii) Calculate ( ) ( ) (iii) If ( ) ( ) and
( ) ( )
Then
Else if ( ) ( ) and ( ) ( )
Then
(iv) Repeat (i) to (iii) of large-step climb
until has been reached.
(b) The small-step climb process: Generate
(i) ( )
where { } and is
a non-zero integer with an
interval of [ ] where
is the length of small-
step climb process.
(ii) and (iii) steps for small-step
climb process is similar to
the (ii) and (iii) steps in
large-step climb process.
(iv) Repeat (i) to (iii) of small-step
climb process until
has been reached.
4.2 Watch-Jump Process
Check whether there is higher position when
compared to current position based on the
eyesight b.
(i) If higher position is available,
Then generate an integer for an
interval of [ ] randomly,
where { }.
Let (
) .
(ii) If ( ) ( ), let
.
(iii) Repeat (i) to (ii) until maximum
allowable number has been reached.
4.3 Co-operation Process
Assume optimal solution in one iteration as
(
) .
Initial position
is ( ) .
(i) Generate real number in [ ] randomly.
(ii) Calculate (
(
) ) { }.
Let ( ) .
(iii) Set and repeat the climb
process.
4.4 Somersault Process
(i) Generate the real number in [ ].
(ii) Calculate
∑
{ },
where ̂ ( ) as pivot of
Somersault process.
(iii) For { } { },
Calculate (| |)
Let (
)
.
(iv) Set and repeat climb process.
If is new position > upper limit
,
Then
Else if
Then
4.5 Stochastic Perturbation Mechanism
When is same for all monkeys,
Then,
and hence for
monkey , { },
Let , where is a
uniformly distributed integer from is [ ]
5 Experimental Results
MSO algorithm is carried out for MIAS database
of 322 images for removing the pectoral muscle
WSEAS TRANSACTIONS on INFORMATION SCIENCE and APPLICATIONS S. Kanimozhi Suguna, S. Uma Maheswari
E-ISSN: 2224-3402 75 Volume 11, 2014
region in the mammogram image. Figures 3 and
4 represents the pectoral region removed image
and the Region of Interest segmented image by
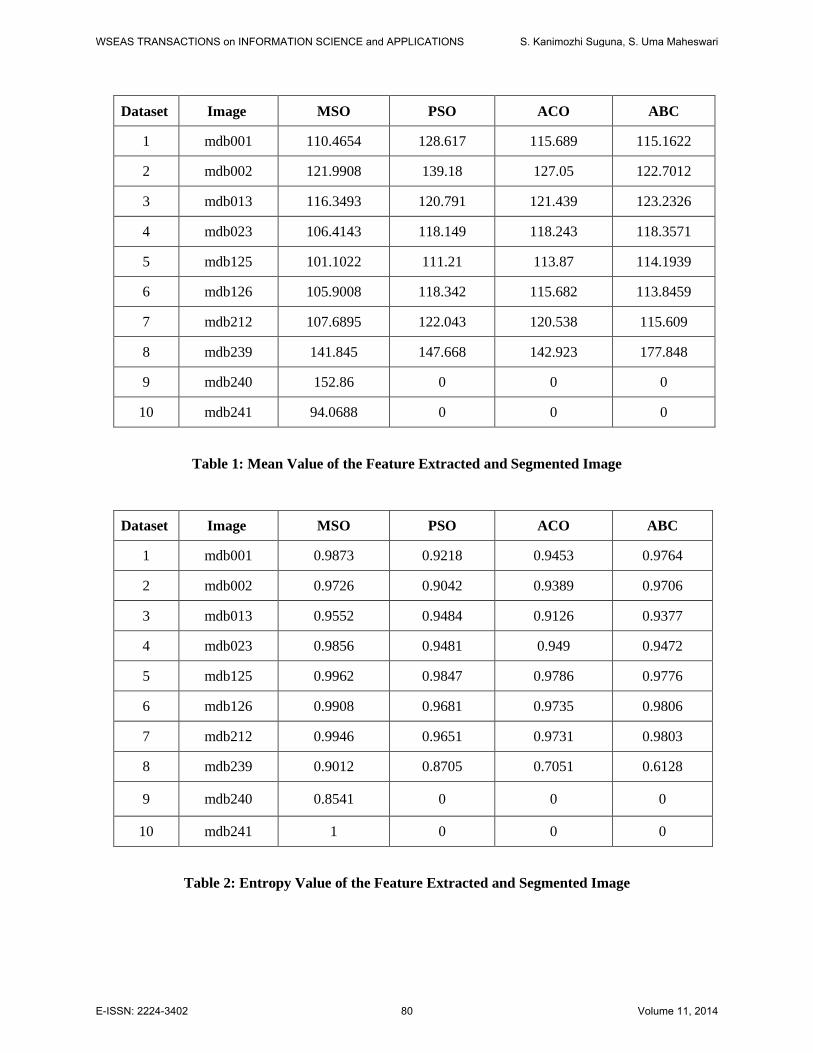
the algorithms respectively. Table 1, 2, 3, 4, 5
and 6 focuses on the details regarding the image
dataset. The graphical figures made for the
Tables 1, 2, 3 and 4 shows the variations in the
values of the datasets based on the algorithms:
MSO, PSO, ACO and ABC.
Among the sample image datasets shown in
tables and graphs, region of interest for all the
abnormal images are identified only by MSO
algorithms, whereas the other algorithms has
failed to identify it. As the algorithms are unable
to identify the region of interest, the values of
mean and entropy are zero, whereas Skewness
and Kurtosis has resulted in NaN, besides
having the higher CPU Time. For the image
mdb241, MSO was unable to obtain the values
for the parameter Skewness and Kurtosis besides
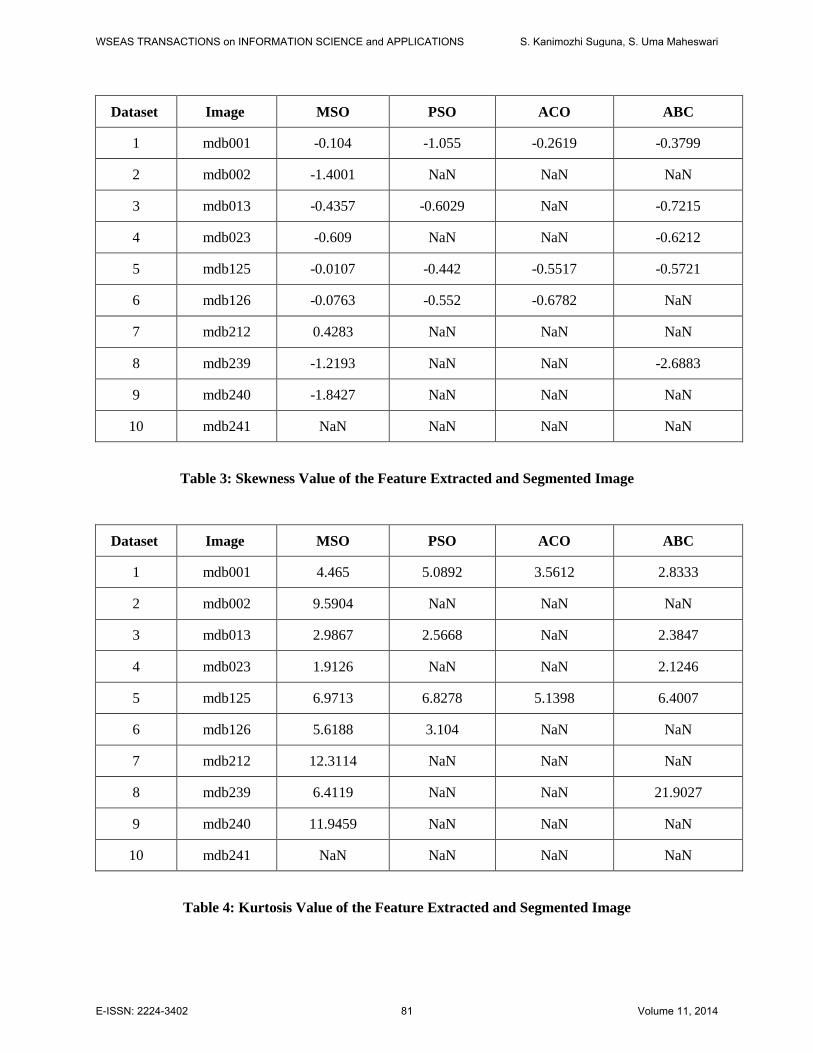
segmenting the image as abnormal. Table 5
focuses on the time taken by CPU for Feature
Selection, Extraction and Segmentation of the
image. For all the images it is observed that
MSO takes less time when compared to other
algorithms. The graphical representation of
Table 5 is represented in Fig 7. As the
algorithms PSO, ACO and ABC has not
identified the region of interest, there is no
pixels to be displayed, hence the values are
represented as 0 (Table 6).
6 Conclusion and Future
Enhancement In this paper, a novel approach for extracting
region of interest in mammogram image is
proposed with Monkey Search Algorithm. The
segmented image is given as input for
classification. From the results it is observed that
besides the segmented region is similar in all the
techniques, the proposed MSO covers larger
area of the image that are likely to contain
masses, which is comparatively higher than the
algorithms of PSO, ACO and ABC. In 95.6% of
the cases, the region segmented by the Monkey
Search Optimization (MSO), contains the actual
mass which is 1% higher than the other
algorithms. The main conclusion is that,
accuracy rate can be increased if the proposed
algorithm is trained more.
7 References [1] Amato Katherine R, Onen Dunya, Emel
Sarah L, and Christina H, Comparison
of Foraging Behavior Between Howler
Monkeys, Spider Monkeys, and Squirrel
Monkeys, Ecology, 2007; 28-31.
[2] Moussa H.Abdallah, Ayman
A.AbuBaker, Rami S.Qahwaji, and
Mohammed H. Saleh, Efficient
Technique to Detect the Region of
Interests in Mammogram Images,
Journal of Computer Science, Vol. 4,
No.8, 2008, pp. 652-662.
[3] Mucherino Antonio, and Seref Onur,
Monkey Search: a novel metaheuristic
search for global optimization.
[4] Mucherino.A, Seref.O, and
Pardalos.P.M, Simulating Protein
Conformations through Global
Optimization, Optimization and Control
(math.OC) 2013, arXiv:0811.3094
[math.OC].
[5] Ramirez – Villegas Juan F., Lam-
Espinosa Eric, and Ramirez-Moreno
David.F, Microcalcification Detection in
Mammograms Using Difference of
Gaussians Filters and a Hybrid
Feedforward – Kohonen Neural
Network, SIBGRAPI’09 Proceedings of
the 2009 XXII Brazilian Symposium on
Computer Graphics and Image
Processing, 186-193
[6] Roselin.R, Thangavel.K, and
Velayutham.C, Fuzzy-Rough Feature
Selection for Mammogram
Classification, Journal of Electronic
Science & Technology, Vol. 9, No. 2,
2011.pp. 124-132.
[7] Serra Pablo, Stanton Aaron F., and Kais
Sabre. Pivot Method for Global
Optimization. Physical Review E 1997;
55(1).
WSEAS TRANSACTIONS on INFORMATION SCIENCE and APPLICATIONS S. Kanimozhi Suguna, S. Uma Maheswari
E-ISSN: 2224-3402 76 Volume 11, 2014
[8] Thangavel.K, Karnan.M, and
Pethalakshmi.A, Performance Analysis
of RoughReduct Algorithms in
Mammogram, International Journal on
Global Vision and Image Processing,
Vol. 5, No.8, 2005, pp. 13-21.
[9] Vijaya Kumar.S, Naveen Lazarus.M,
and Nagaraju.C,. A Novel Method for
the Detection of Microcalcifications
Based on Multi-Scale Morphological
Gradient Watershed Segmentation,
International Journal of Engineering
Science and Technology, Vol. 2, No. 7,
2010, pp. 2616-2622.
[10] Wang Jingran, and Yu Yixin, Discrete
Monkey Algorithm and its Application
in Transmission Network Expansion
Planning, IEEE Power and Energy
Society General Meeting (Conference),
2010, pp. 1-5.
[11] Zhao Ruiqing, and Tang Wansheng,
Monkey Algorithm for Global
Numerical Optimization, Journal of
Uncertain Systems, Vol. 2, No. 3, 2008;
pp. 165-176.
Figure 1: Flowchart for extracting region of interest using
MSO
WSEAS TRANSACTIONS on INFORMATION SCIENCE and APPLICATIONS S. Kanimozhi Suguna, S. Uma Maheswari
E-ISSN: 2224-3402 77 Volume 11, 2014

Fig 3: Pectoral Region removed mammogram
image mdb240.png
Fig 4: Region of Interest for the mammogram
image mdb240.png
Figure 2: Algorithm for MSO
WSEAS TRANSACTIONS on INFORMATION SCIENCE and APPLICATIONS S. Kanimozhi Suguna, S. Uma Maheswari
E-ISSN: 2224-3402 78 Volume 11, 2014
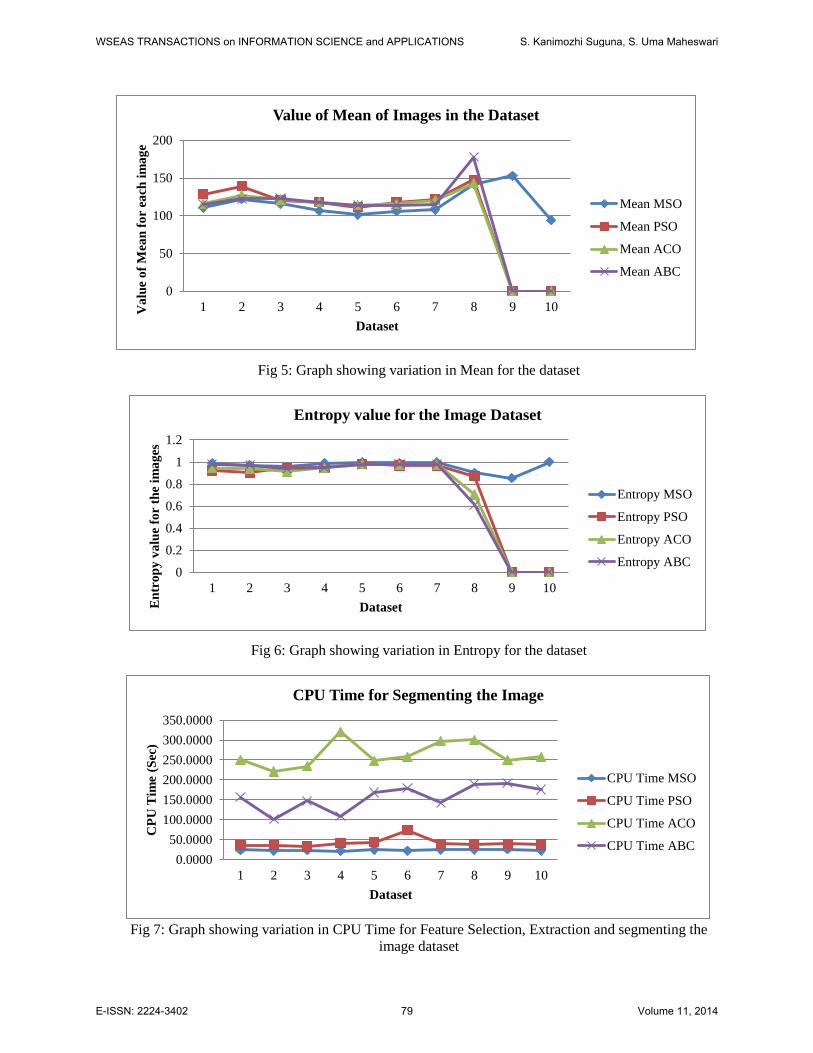
Fig 5: Graph showing variation in Mean for the dataset
Fig 6: Graph showing variation in Entropy for the dataset
Fig 7: Graph showing variation in CPU Time for Feature Selection, Extraction and segmenting the
image dataset
0
50
100
150
200
1 2 3 4 5 6 7 8 9 10Va
lue
of
Mea
n f
or
each
im
ag
e
Dataset
Value of Mean of Images in the Dataset
Mean MSO
Mean PSO
Mean ACO
Mean ABC
0
0.2
0.4
0.6
0.8
1
1.2
1 2 3 4 5 6 7 8 9 10
En
tro
py
va
lue
for
the
ima
ges
Dataset
Entropy value for the Image Dataset
Entropy MSO
Entropy PSO
Entropy ACO
Entropy ABC
0.0000
50.0000
100.0000
150.0000
200.0000
250.0000
300.0000
350.0000
1 2 3 4 5 6 7 8 9 10
CP
U T
ime
(Sec
)
Dataset
CPU Time for Segmenting the Image
CPU Time MSO
CPU Time PSO
CPU Time ACO
CPU Time ABC
WSEAS TRANSACTIONS on INFORMATION SCIENCE and APPLICATIONS S. Kanimozhi Suguna, S. Uma Maheswari
E-ISSN: 2224-3402 79 Volume 11, 2014
Dataset Image MSO PSO ACO ABC
1 mdb001 110.4654 128.617 115.689 115.1622
2 mdb002 121.9908 139.18 127.05 122.7012
3 mdb013 116.3493 120.791 121.439 123.2326
4 mdb023 106.4143 118.149 118.243 118.3571
5 mdb125 101.1022 111.21 113.87 114.1939
6 mdb126 105.9008 118.342 115.682 113.8459
7 mdb212 107.6895 122.043 120.538 115.609
8 mdb239 141.845 147.668 142.923 177.848
9 mdb240 152.86 0 0 0
10 mdb241 94.0688 0 0 0
Table 1: Mean Value of the Feature Extracted and Segmented Image
Dataset Image MSO PSO ACO ABC
1 mdb001 0.9873 0.9218 0.9453 0.9764
2 mdb002 0.9726 0.9042 0.9389 0.9706
3 mdb013 0.9552 0.9484 0.9126 0.9377
4 mdb023 0.9856 0.9481 0.949 0.9472
5 mdb125 0.9962 0.9847 0.9786 0.9776
6 mdb126 0.9908 0.9681 0.9735 0.9806
7 mdb212 0.9946 0.9651 0.9731 0.9803
8 mdb239 0.9012 0.8705 0.7051 0.6128
9 mdb240 0.8541 0 0 0
10 mdb241 1 0 0 0
Table 2: Entropy Value of the Feature Extracted and Segmented Image
WSEAS TRANSACTIONS on INFORMATION SCIENCE and APPLICATIONS S. Kanimozhi Suguna, S. Uma Maheswari
E-ISSN: 2224-3402 80 Volume 11, 2014
Dataset Image MSO PSO ACO ABC
1 mdb001 -0.104 -1.055 -0.2619 -0.3799
2 mdb002 -1.4001 NaN NaN NaN
3 mdb013 -0.4357 -0.6029 NaN -0.7215
4 mdb023 -0.609 NaN NaN -0.6212
5 mdb125 -0.0107 -0.442 -0.5517 -0.5721
6 mdb126 -0.0763 -0.552 -0.6782 NaN
7 mdb212 0.4283 NaN NaN NaN
8 mdb239 -1.2193 NaN NaN -2.6883
9 mdb240 -1.8427 NaN NaN NaN
10 mdb241 NaN NaN NaN NaN
Table 3: Skewness Value of the Feature Extracted and Segmented Image
Dataset Image MSO PSO ACO ABC
1 mdb001 4.465 5.0892 3.5612 2.8333
2 mdb002 9.5904 NaN NaN NaN
3 mdb013 2.9867 2.5668 NaN 2.3847
4 mdb023 1.9126 NaN NaN 2.1246
5 mdb125 6.9713 6.8278 5.1398 6.4007
6 mdb126 5.6188 3.104 NaN NaN
7 mdb212 12.3114 NaN NaN NaN
8 mdb239 6.4119 NaN NaN 21.9027
9 mdb240 11.9459 NaN NaN NaN
10 mdb241 NaN NaN NaN NaN
Table 4: Kurtosis Value of the Feature Extracted and Segmented Image
WSEAS TRANSACTIONS on INFORMATION SCIENCE and APPLICATIONS S. Kanimozhi Suguna, S. Uma Maheswari
E-ISSN: 2224-3402 81 Volume 11, 2014
Dataset Image MSO PSO ACO ABC
1 mdb001 23.9900 36.0713 250.6445 156.4445
2 mdb002 21.9097 35.9097 220.9097 101.9877
3 mdb013 23.3747 32.8611 234.3747 147.3737
4 mdb023 21.5101 40.8960 320.5101 108.5121
5 mdb125 24.2245 43.4184 248.2245 168.2245
6 mdb126 22.3154 73.7922 258.3154 179.7459
7 mdb212 24.6301 40.0419 296.6301 142.1649
8 mdb239 25.5000 38.5000 300.5000 189.3240
9 mdb240 25.9000 39.9000 249.9000 191.9030
10 mdb241 22.8000 37.8000 257.8000 175.7871
Table 5: CPU Time (sec) – Time Taken for Feature Selection, Extraction and Segmentation
Dataset Image MSO PSO ACO ABC
1 mdb001 52513 52345 51194 51100
2 mdb002 83056 83000 82900 83032
3 mdb013 100533 99742 98510 100252
4 mdb023 123389 122118 122200 122621
5 mdb125 94195 93398 93205 93037
6 mdb126 171699 170666 170548 170787
7 mdb212 54498 54177 54160 54023
8 mdb239 218352 206104 205490 188165
9 mdb240 186946 0 0 0
10 mdb241 80515 0 0 0
Table 6: Number of Pixels obtained after Segmentation of Mammogram Images
WSEAS TRANSACTIONS on INFORMATION SCIENCE and APPLICATIONS S. Kanimozhi Suguna, S. Uma Maheswari
E-ISSN: 2224-3402 82 Volume 11, 2014