Embed Size (px)
Citation preview
Performance Analysis of Android Platform
Jawad Manzoor EMDC
21-Nov-2010

Table of Contents
1. Introduction .......................................................................................................................................... 3
2. Android Architecture ............................................................................................................................ 3
3. Dalvik Virtual Machine .......................................................................................................................... 4
3.1 Architecture of Dalvik VM ................................................................................................................... 4
3.2 Dalvik Byte Code ................................................................................................................................. 4
3.3 Dalvik optimizations ............................................................................................................................ 4
3.4 Comparison of Dalvik VM with Java VM ............................................................................................. 5
3.5 Size Comparison of Dex & Jar Files ..................................................................................................... 5
4. Android Performance Monitoring Tools ............................................................................................... 5
4.1 Android Debug Bridge ......................................................................................................................... 6
4.1.1 procrank ....................................................................................................................................... 6
4.1.2 dumpsys meminfo........................................................................................................................ 7
4.1.3 vmstat .......................................................................................................................................... 8
4.2 Dalvik Debug Monitor ......................................................................................................................... 9
5. Experiment and Performance Results .................................................................................................. 9
5.1 CPU utilization ............................................................................................................................. 10
5.2 Memory usage ............................................................................................................................ 11
References .................................................................................................................................................. 11
1. Introduction Android is the first comprehensive open source mobile software stack introduced in the market by Open Handset Alliance (OHA - A global alliance of leading technology and mobile industries)[1]. It consists of complete mobile operating system supported by Linux kernel, a newly built Dalvik virtual machine, and some modern day mobile applications.
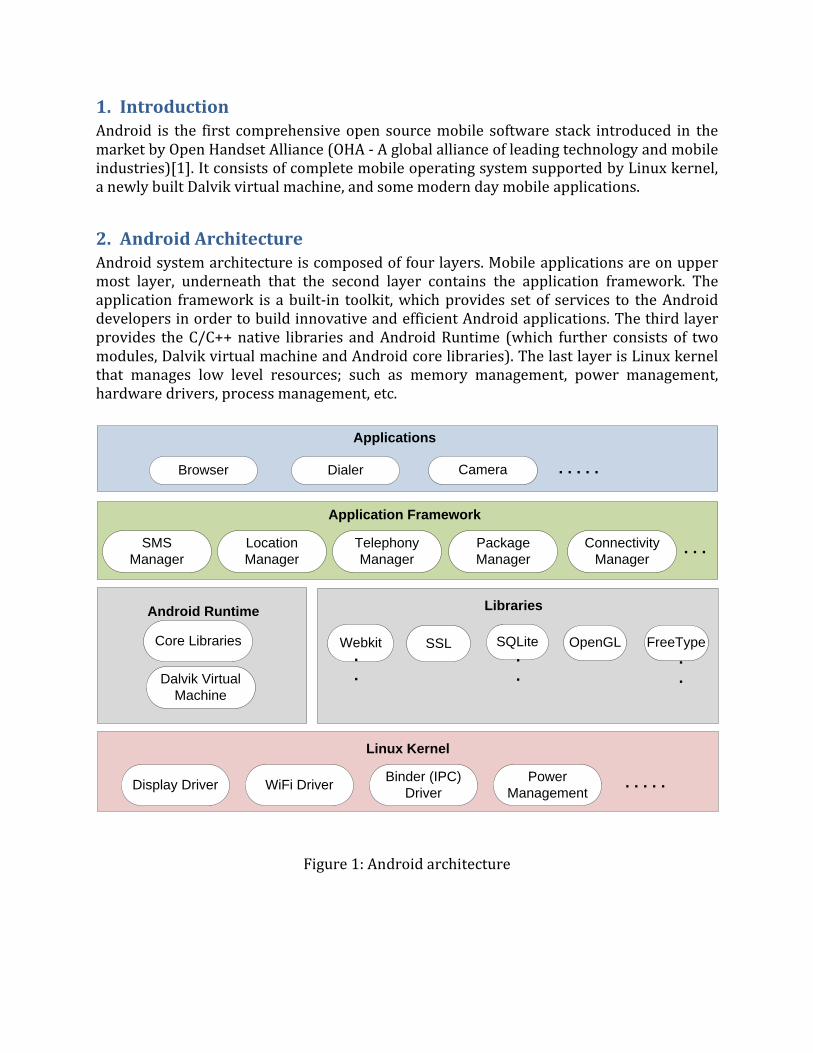
2. Android Architecture Android system architecture is composed of four layers. Mobile applications are on upper most layer, underneath that the second layer contains the application framework. The application framework is a built-in toolkit, which provides set of services to the Android developers in order to build innovative and efficient Android applications. The third layer provides the C/C++ native libraries and Android Runtime (which further consists of two modules, Dalvik virtual machine and Android core libraries). The last layer is Linux kernel that manages low level resources; such as memory management, power management, hardware drivers, process management, etc.
Location
Manager
Telephony
Manager
Connectivity
Manager
Package
Manager
Application Framework
SMS
Manager. . .
Dalvik Virtual
Machine
Core Libraries
Android Runtime
Linux Kernel
Display Driver WiFi DriverPower
Management
Binder (IPC)
Driver. . . . .
Applications
Browser Dialer . . . . . Camera
SSL SQLiteWebkit
Libraries
OpenGL FreeType.
.
.
..
.
Figure 1: Android architecture
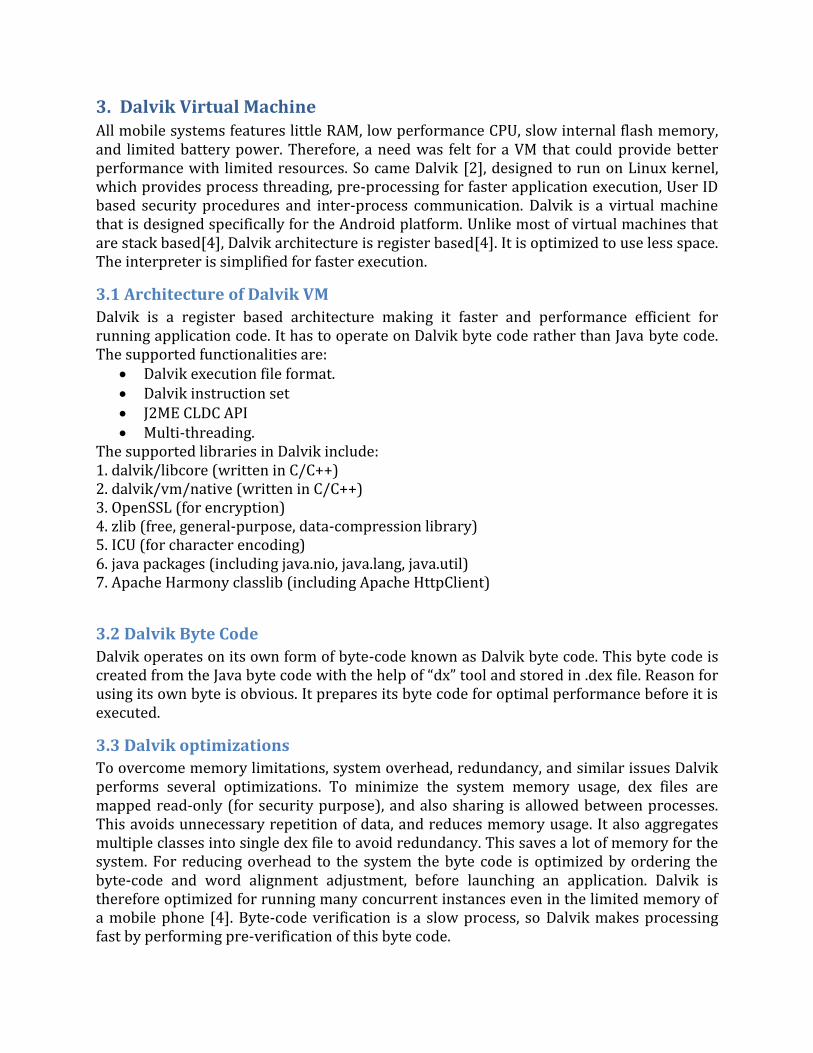
3. Dalvik Virtual Machine All mobile systems features little RAM, low performance CPU, slow internal flash memory, and limited battery power. Therefore, a need was felt for a VM that could provide better performance with limited resources. So came Dalvik [2], designed to run on Linux kernel, which provides process threading, pre-processing for faster application execution, User ID based security procedures and inter-process communication. Dalvik is a virtual machine that is designed specifically for the Android platform. Unlike most of virtual machines that are stack based[4], Dalvik architecture is register based[4]. It is optimized to use less space. The interpreter is simplified for faster execution.
3.1 Architecture of Dalvik VM
Dalvik is a register based architecture making it faster and performance efficient for running application code. It has to operate on Dalvik byte code rather than Java byte code. The supported functionalities are:
Dalvik execution file format. Dalvik instruction set J2ME CLDC API Multi-threading.
The supported libraries in Dalvik include: 1. dalvik/libcore (written in C/C++) 2. dalvik/vm/native (written in C/C++) 3. OpenSSL (for encryption) 4. zlib (free, general-purpose, data-compression library) 5. ICU (for character encoding) 6. java packages (including java.nio, java.lang, java.util) 7. Apache Harmony classlib (including Apache HttpClient)
3.2 Dalvik Byte Code
Dalvik operates on its own form of byte-code known as Dalvik byte code. This byte code is created from the Java byte code with the help of “dx” tool and stored in .dex file. Reason for using its own byte is obvious. It prepares its byte code for optimal performance before it is executed.
3.3 Dalvik optimizations
To overcome memory limitations, system overhead, redundancy, and similar issues Dalvik performs several optimizations. To minimize the system memory usage, dex files are mapped read-only (for security purpose), and also sharing is allowed between processes. This avoids unnecessary repetition of data, and reduces memory usage. It also aggregates multiple classes into single dex file to avoid redundancy. This saves a lot of memory for the system. For reducing overhead to the system the byte code is optimized by ordering the byte-code and word alignment adjustment, before launching an application. Dalvik is therefore optimized for running many concurrent instances even in the limited memory of a mobile phone [4]. Byte-code verification is a slow process, so Dalvik makes processing fast by performing pre-verification of this byte code.
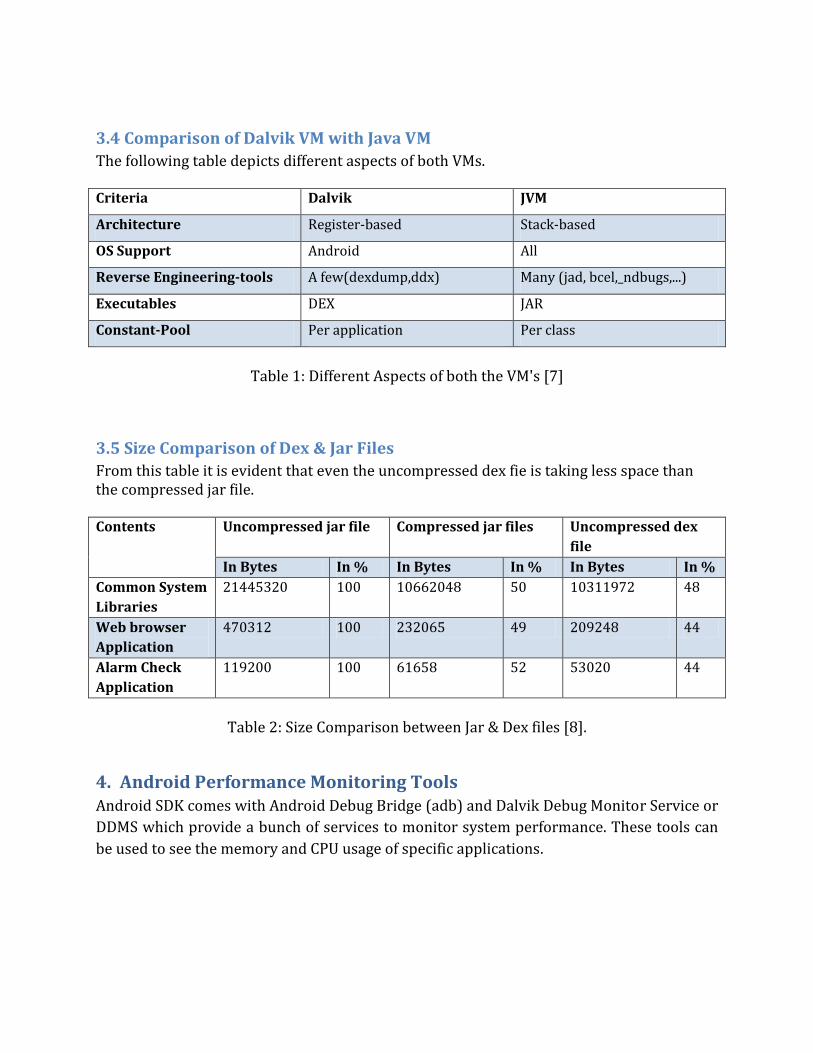
3.4 Comparison of Dalvik VM with Java VM
The following table depicts different aspects of both VMs. Criteria Dalvik JVM
Architecture Register-based Stack-based
OS Support Android All
Reverse Engineering-tools A few(dexdump,ddx) Many (jad, bcel,_ndbugs,...)
Executables DEX JAR
Constant-Pool Per application Per class
Table 1: Different Aspects of both the VM's [7]
3.5 Size Comparison of Dex & Jar Files
From this table it is evident that even the uncompressed dex fie is taking less space than the compressed jar file. Contents
Uncompressed jar file Compressed jar files Uncompressed dex
file
In Bytes In % In Bytes In % In Bytes In %
Common System
Libraries
21445320 100 10662048 50 10311972 48
Web browser
Application
470312 100 232065 49 209248 44
Alarm Check
Application
119200 100 61658 52 53020 44
Table 2: Size Comparison between Jar & Dex files [8].
4. Android Performance Monitoring Tools Android SDK comes with Android Debug Bridge (adb) and Dalvik Debug Monitor Service or
DDMS which provide a bunch of services to monitor system performance. These tools can
be used to see the memory and CPU usage of specific applications.
4.1 Android Debug Bridge
Android Debug Bridge (adb) is a versatile tool which facilitates managing the state of an
emulator instance or Android-powered device. Adb provides an ash shell that can be used
to run a variety of commands on an emulator or device.
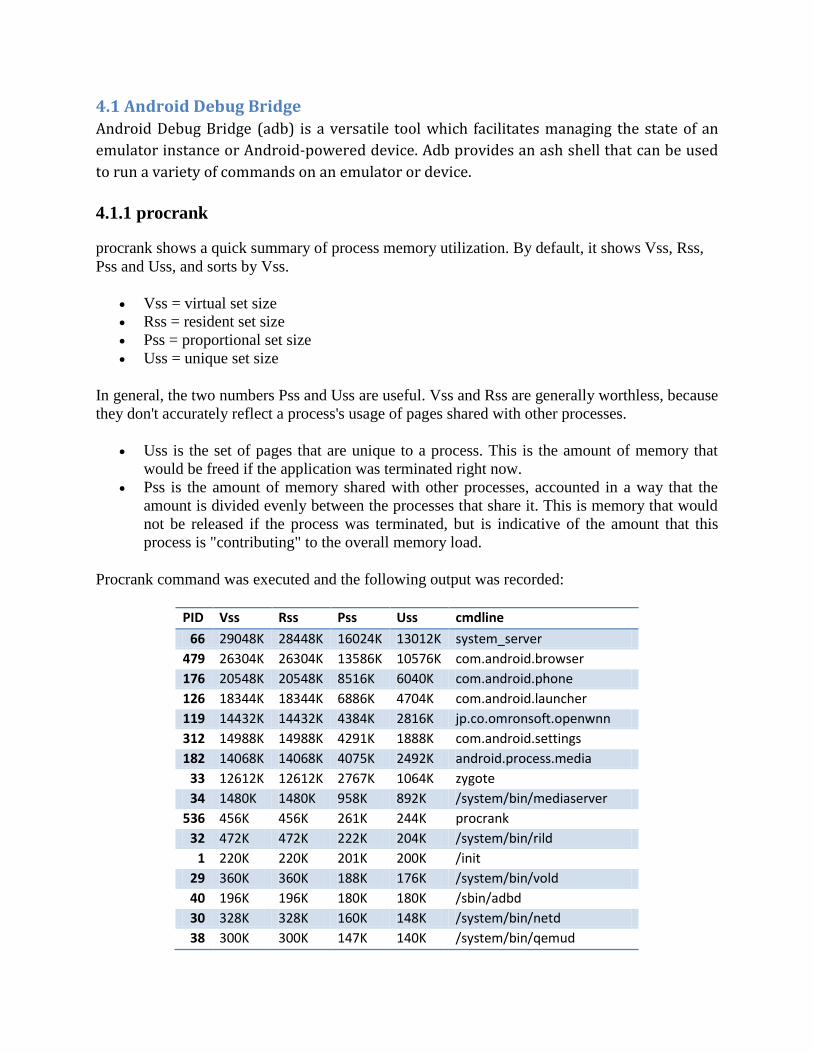
4.1.1 procrank
procrank shows a quick summary of process memory utilization. By default, it shows Vss, Rss,
Pss and Uss, and sorts by Vss.
Vss = virtual set size
Rss = resident set size
Pss = proportional set size
Uss = unique set size
In general, the two numbers Pss and Uss are useful. Vss and Rss are generally worthless, because
they don't accurately reflect a process's usage of pages shared with other processes.
Uss is the set of pages that are unique to a process. This is the amount of memory that
would be freed if the application was terminated right now.
Pss is the amount of memory shared with other processes, accounted in a way that the
amount is divided evenly between the processes that share it. This is memory that would
not be released if the process was terminated, but is indicative of the amount that this
process is "contributing" to the overall memory load.
Procrank command was executed and the following output was recorded:
PID Vss Rss Pss Uss cmdline
66 29048K 28448K 16024K 13012K system_server
479 26304K 26304K 13586K 10576K com.android.browser
176 20548K 20548K 8516K 6040K com.android.phone
126 18344K 18344K 6886K 4704K com.android.launcher
119 14432K 14432K 4384K 2816K jp.co.omronsoft.openwnn
312 14988K 14988K 4291K 1888K com.android.settings
182 14068K 14068K 4075K 2492K android.process.media
33 12612K 12612K 2767K 1064K zygote
34 1480K 1480K 958K 892K /system/bin/mediaserver
536 456K 456K 261K 244K procrank
32 472K 472K 222K 204K /system/bin/rild
1 220K 220K 201K 200K /init
29 360K 360K 188K 176K /system/bin/vold
40 196K 196K 180K 180K /sbin/adbd
30 328K 328K 160K 148K /system/bin/netd
38 300K 300K 147K 140K /system/bin/qemud

477 344K 344K 136K 112K logcat
474 328K 328K 112K 60K /system/bin/sh
264 328K 328K 112K 60K /system/bin/sh
28 236K 236K 86K 80K /system/bin/servicemanager
36 208K 208K 81K 76K /system/bin/keystore
54 240K 240K 80K 72K /system/bin/qemu-props
35 228K 228K 79K 72K /system/bin/installd
37 192K 192K 65K 60K /system/bin/sh
27 192K 192K 65K 60K /system/bin/sh
31 176K 176K 57K 52K /system/bin/debuggerd
Table 3: Output of procrank command
4.1.2 dumpsys meminfo
This command dumps system data to the screen. The pss field is the same pss you would
see in procrank, shared dirty are dirty pages (unable to be paged from disk) that are shared
with other processes, and private dirty are dirty pages entirely private to the process. The
following is the output of the command for browser application.
dumpsys meminfo 479
Applications Memory Usage (kB):
Uptime: 7258613 Realtime: 7258613
** MEMINFO in pid 479 [com.android.browser] **
native dalvik other total
size: 6148 3207 N/A 9355
allocated: 6052 2739 N/A 8791
free: 43 468 N/A 511
(Pss): 3609 3334 6123 13066
(shared dirty): 1400 4008 1516 6924
(priv dirty): 3428 1144 1452 6024
Table 4: Output of dumpsys meminfo command
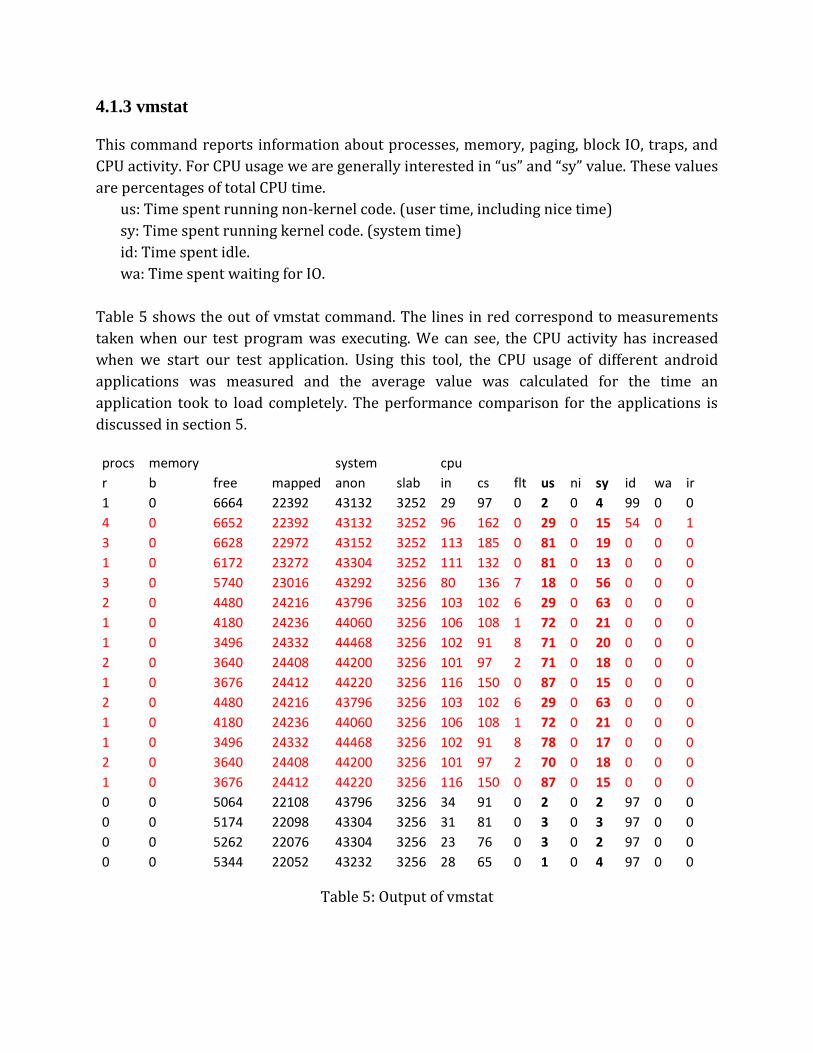
4.1.3 vmstat
This command reports information about processes, memory, paging, block IO, traps, and
CPU activity. For CPU usage we are generally interested in “us” and “sy” value. These values
are percentages of total CPU time.
us: Time spent running non-kernel code. (user time, including nice time)
sy: Time spent running kernel code. (system time)
id: Time spent idle.
wa: Time spent waiting for IO.
Table 5 shows the out of vmstat command. The lines in red correspond to measurements
taken when our test program was executing. We can see, the CPU activity has increased
when we start our test application. Using this tool, the CPU usage of different android
applications was measured and the average value was calculated for the time an
application took to load completely. The performance comparison for the applications is
discussed in section 5.
procs memory
system
cpu
r b free mapped anon slab in cs flt us ni sy id wa ir
1 0 6664 22392 43132 3252 29 97 0 2 0 4 99 0 0
4 0 6652 22392 43132 3252 96 162 0 29 0 15 54 0 1
3 0 6628 22972 43152 3252 113 185 0 81 0 19 0 0 0
1 0 6172 23272 43304 3252 111 132 0 81 0 13 0 0 0
3 0 5740 23016 43292 3256 80 136 7 18 0 56 0 0 0
2 0 4480 24216 43796 3256 103 102 6 29 0 63 0 0 0
1 0 4180 24236 44060 3256 106 108 1 72 0 21 0 0 0
1 0 3496 24332 44468 3256 102 91 8 71 0 20 0 0 0
2 0 3640 24408 44200 3256 101 97 2 71 0 18 0 0 0
1 0 3676 24412 44220 3256 116 150 0 87 0 15 0 0 0
2 0 4480 24216 43796 3256 103 102 6 29 0 63 0 0 0
1 0 4180 24236 44060 3256 106 108 1 72 0 21 0 0 0
1 0 3496 24332 44468 3256 102 91 8 78 0 17 0 0 0
2 0 3640 24408 44200 3256 101 97 2 70 0 18 0 0 0
1 0 3676 24412 44220 3256 116 150 0 87 0 15 0 0 0
0 0 5064 22108 43796 3256 34 91 0 2 0 2 97 0 0
0 0 5174 22098 43304 3256 31 81 0 3 0 3 97 0 0
0 0 5262 22076 43304 3256 23 76 0 3 0 2 97 0 0
0 0 5344 22052 43232 3256 28 65 0 1 0 4 97 0 0
Table 5: Output of vmstat
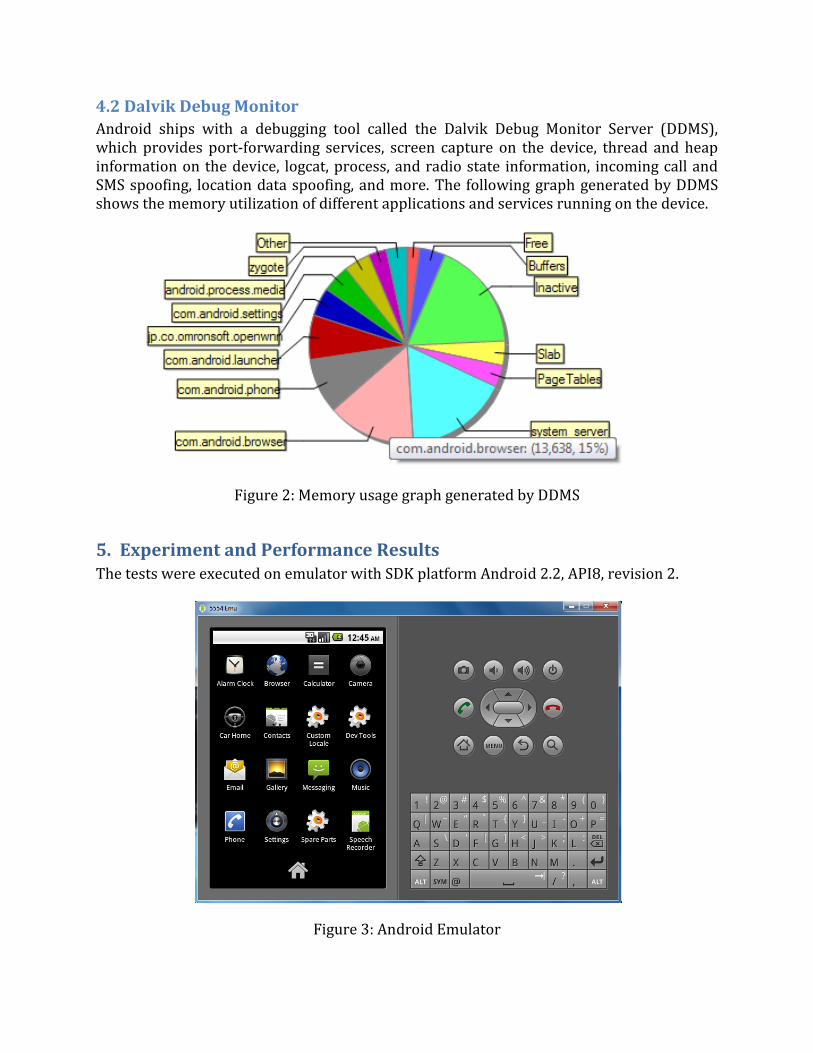
4.2 Dalvik Debug Monitor
Android ships with a debugging tool called the Dalvik Debug Monitor Server (DDMS), which provides port-forwarding services, screen capture on the device, thread and heap information on the device, logcat, process, and radio state information, incoming call and SMS spoofing, location data spoofing, and more. The following graph generated by DDMS shows the memory utilization of different applications and services running on the device.
Figure 2: Memory usage graph generated by DDMS
5. Experiment and Performance Results The tests were executed on emulator with SDK platform Android 2.2, API8, revision 2.
Figure 3: Android Emulator

Four applications provided by android including browser, dialer, SMS and camera, were
monitored. The following metrics were selected:
- The memory usage of applications.
- The CPU utilization for loading the applications.
The tools used for measuring memory and CPU usage are “dumpsys meminfo” and
“vmstat” respectively.
5.1 CPU utilization
The following table shows the average CPU utilization of applications using vmstat tool.
The results show that the most CPU intensive application is camera, followed by browser,
phone dialer and SMS application.
Application CPU Usage (%)
Browser 66
SMS 57
Camera 71
Dialer 60
Table 6: CPU utilization of applications
Figure 4: CPU utilization comparison
0
10
20
30
40
50
60
70
80
Browser SMS Camera Dialer
CP
U u
sage
(%)
Application

5.2 Memory usage
The following table shows the average memory usage of applications using “dumpsys
meminfo” tool. The results show that the most memory intensive application is browser,
followed by phone dialer, SMS application and camera.
Application Memory Usage (KB)
Browser 9355
SMS 6455
Camera 6363
Dialer 7851
Table 7: Memory usage of applications
Figure 5: Memory usage comparison
References [1] Homepage: Android. Available at: http://www.android.com/. [2] Homepage: Dalvik Virtual Machine. Available at: http://www.dalvikvm.com/.
[3]Ryan Slobojan. Dalvik, android's virtual machine, generates significant debate. Available at: http://www.infoq.com/news/2007/11/dalvik.
0
1000
2000
3000
4000
5000
6000
7000
8000
9000
10000
Browser SMS Camera Dialer
Me
mo
ry U
sage
(KB
)
Application

[4] J.E. Smith and R. Nair. Virtual machines: versatile platforms for systems and processes. Morgan Kaufmann Pub, 2005. [5] T. Suganuma, T. Ogasawara, M. Takeuchi, T. Yasue, M. Kawahito, K. Ishizaki, H. Komatsu, and T. Nakatani. Overview of the IBM Java just-in-time compiler. IBM Systems Journal, 39(1):175_193, 2000.
[6] Jeff Wilcox. Android performance 2: Loop speed and the dalvik vm. Available at: http://occipital.com/blog/tag/dalvik/. [7] Marc Schonefeld. Reconstructing dalvik applications. Available at: http://cansecwest.com/csw09/csw09-schoenefeld.pdf. [8] Dan Bornstein. Dalvik virtual machine: Internals. Available at: http://sites.google.com/site/io/dalvik-vm-internals/2008-05-29-Presentation-Of-Dalvik-VM-Internals.pdf.