Embed Size (px)
Citation preview

VOL. 11, NO. 15, AUGUST 2016 ISSN 1819-6608
ARPN Journal of Engineering and Applied Sciences ©2006-2016 Asian Research Publishing Network (ARPN). All rights reserved.
www.arpnjournals.com
8992
PERFORMANCE ANALYSIS OF A VERTICAL WELL WITH A FINITE-
CONDUCTIVITY FRACTURE IN GAS COMPOSITE RESERVOIRS
Yu Long Zhao
1, Freddy Humberto Escobar
2, Claudia Marcela Hernandez
2 and Chao Ping Zhang
3
1State Key Laboratory of Oil and Gas Reservoir Geology and Exploitation, Southwest Petroleum University, Chengdu,
Sichuan, P.R. China 2Universidad Sur colombiana/CENIGAA, Avenida Pastrana, Neiva, Huila, Colombia
3Northeast Sichuan Gas Production Branch of Southwest China Oil and Gas Field, Petro China, P.R. China
E-Mail: [email protected]
ABSTRACT
It is well known that hydraulic fracturing can efficiently be applied to develop both low permeability and
unconventional gas reservoir. Sometimes, the formations cannot be fully fractured and, then, the resulting fracture does not
end up with infinite conductivity. Besides, for either tight or unconventional gas reservoir, a fracture network will be
developed around the well during the fracturing process. This paper presents a semi-analytical model governing fluid flow
in porous material for a finite-conductivity-fractured well in a composite gas reservoir, considering the fractures as either
partially or fully penetrated. By nature, a fracture-network system around the well is always induced in tight gas
formations, then, a composite model with inner dual-porosity to describe stimulated reservoir volume is established.
Solutions for both constant-production rate and constant-bottom hole pressure are obtained by using the point-source
function and the Laplace transformation techniques which are used along with the Stehfest algorithm to obtain the
numerical inversion of the pressure and rate variables. The pressure-time and rate-time behaviours are then analyzed by
careful observation to both transient-pressure and the rate-decline type curves. The models and type curves introduced in
this work possess both theoretical and practical valuable application in the field of well test interpretation for the system
under consideration.
Keywords: fracture conductivity, gas reservoirs, well testing, rate decline, composite systems.
1. INTRODUCTION
Hydraulic fracturing has been an efficient tool to
develop low-permeability reservoir, such as tight
hydrocarbon formations and coal seam gas. Besides, gas
shale formation only can be produced by means of
hydraulically-fractured wells. In the mentioned situations,
well stimulation by fracturing is only conducted once in
the life of the well and greatly enhances fluid removal and
well productivity. Hydraulic fracturing occurs when the
effective stress has overcome sufficiently by an increase in
the fluid pressure within the rock, so that the minimum
principle stress becomes tensile and exceeds the tensile
strength of the material. Fractures formed under this
procedure will mainly be oriented in the plane
perpendicular to the minimum principal stress, and for this
reason, induced hydraulic fractures in wellbores are
sometimes used to determine the orientation of stresses,
Fjaer (2008).
From experience and rock mechanics analyses, it
has been found that the fracture height is often determined
by the existence and position of barriers above and below
the fracturing zone. So a partially-penetrated fracture will
be formed when the reservoir has some hard limited scale
among interlayer’s or barriers. During the fracturing
process, the fracturing high-pressure fluid pumped down
into the formation always flows into the porous medium in
which a damage zone around the well may be present. The
damage zone with the outer zone always can be treated as
a radial composite system. Moreover, the fractured-radial-
composite system can also occur naturally or may be
artificially created. Aquifers with two different perm
abilities, oil and water regions or gas and oil regions with
different reservoir properties are typical examples of
naturally occurring. Other examples of composite systems
include secondary and tertiary recovery projects in oil
reservoirs and produced water reinjection gas reservoirs.
Since transient pressure and rate decline analysis
methods are of important application to hydrocarbon
industry so engineers can recognize the formation and
fracturing characteristics, many models have been
proposed to describe the fluid seepage flow theory from
the formation to the well and developed many detailed
semi-analytical solutions for both finite and infinite-
fracture conductivity as described by Prats (1961),
Gringarten, Ramey, Raghavan (1974a, 1974b), Cinco-Ley
and Samaniego (1981), Cinco-Ley, Samaniego and
Dominguez (1978), Hanley and Bandyopadhyay (1979),
Ahmed (1982) and Mohammed (1993).
Prats (1961) analyzed the performance of a finite-
conductivity vertical fractured-well performance. Cinco-
Ley and Samaniego (1977) investigated the effects of
wellbore storage and fracture damage on the well
performance and indicated that these effects should be
taken into account in well test analysis. Cinco-Ley,
Samaniego and Rodriguez (1989) presented a semi-
analytical model and type curves for the analysis of
pressure data of wells intersected by finite- conductivity
vertical fractures in infinite slab reservoirs. Hanley and
Bandyopadhyay (1979) presented a simple semi-analytical
model for a well in a square reservoir with a uniform flux
fracture fully penetrating the formation in the horizontal
direction. Ahmed (1982) presented a detailed study on all
the available specialized plots used to analyze various
types of hydraulic fractures and formation flow regimes.

VOL. 11, NO. 15, AUGUST 2016 ISSN 1819-6608
ARPN Journal of Engineering and Applied Sciences ©2006-2016 Asian Research Publishing Network (ARPN). All rights reserved.
www.arpnjournals.com
8993
Cinco-Ley, Samaniego and Rodriguez (1989) observed a
flow regime “pseudo-linear” to distinguish it from the real
linear flow characterizing the infinite-conductivity
fracture. Mohammed (1993) developed a mathematical
model to analyze the pressure behavior of a fractured well
located in a multilayered reservoir. Mohammed and
Kassem (1997) presented a mathematical model for
describing the pressure behavior of a vertical-fractured
well located in a stratified, bounded, square reservoir.
For fractured wells in composite reservoir, Chu
and Shank (1993) presented a mathematical model for a
vertical-fractured well having either finite conductivity or
uniform flux in a composite system. Chen and Raghavan
(1995) developed a model for a fractured well producing
in a composite reservoir. They also addressed some
computational issues during the computation of the
products In(x)∙ Kn(x). Feng, Luo and Cheng (2009)
proposed a seepage flow model for fractured
heterogeneous composite reservoirs using equivalent
flowing resistance method. However, a few of them have
taken into account the effect of wellbore storage and skin
factor in their modeling. Besides, no consideration of
partial penetrating fractures has been reported by these
researchers. Zhao (2011) derived a continuous point-
source solution in radial-composite gas reservoir and,
later, the transient pressure of fully and partially fractured
well with finite-conductivity in a radial composite
reservoir is analyzed Zhao et al. (2013).
As mentioned above, the various methods and
models presented in the literature mostly aimed at the well
with infinite or finite conductivity in homogeneous
reservoir, and only a few of them reported the pressure and
rate transient performance of partially fractured wells with
finite conductivity in composite reservoir as well as the
multi-porosity media composite models. The main
objective of this paper is to fill this gap and to investigate
the pressure behavior and rate decline performance of a
radial-composite gas reservoir containing either a partially
or fully penetrating hydraulic fracture with finite
conductivity. The solution is achieved by combining the
continuous point source with the fracture flow model, and
then the semi-analytical solution is obtained by the
Laplace transformation method and boundary element
integral method. Finally, the performance of a new
composite model with inner dual porosity to describe the
fracture network (stimulated reservoir volume) created by
massive hydraulic fracturing is analyzed. This
mathematical model was used by Escobar, Zhao and
Zhang (2014) to provide an interpretation solution using
characteristic points and lines found on the pseudopressure
and pesudopressure derivative plot.
Figure-1. Schematic representation of a finite-
conductivity fractured well in bi-zonal
gas reservoir.
2. MATHEMATICAL MODEL
2.1 Reservoir flow model
The transient pressure behavior in the reservoir
can be studied by considering the fracture as a plane
source of height, hf, length 2xf and flux density qf(x,t), see
Figure-1. According to the continuous point-source
function of the inner region in bi-zonal gas reservoir as
presented by Zhao (2011) the solution for the partially
penetrating fractured well can be easily obtained by
integrating the continuous source function obtained before
with respect to xwD and zwD over the penetrating interval,
which is:
2 20 D D rD
2 20 0 D D rD
fD1
2 2D D1D fD 0 D D
12 1
2 210 D D
fDD fzmD
K ( )
4I ( )
π1
( , , ) ( , ) dK ( )2M
I ( )
cos( π ) cos( π ) sin( π )2
n
nn n
x y s
D x y sh
x y s q s x y s
D x y s
hn z n h n
(1)
where,
n
nnD
(n = 0, 1, 2, ⋯) (2)
nn 0 mD n 0 mD n
n12 0 mD n 0 mD n
K r s K r s A
M K r s K r s B
(3)
nn 12 0 mD n 0 mD n
n0 mD n 0 mD n
M I K B
I K A
r s r s
r s r s
(4)
For the lateral infinite boundary:
n nA B 0 (5)
For lateral closed boundary:
VOL. 11, NO. 15, AUGUST 2016 ISSN 1819-6608
ARPN Journal of Engineering and Applied Sciences ©2006-2016 Asian Research Publishing Network (ARPN). All rights reserved.
www.arpnjournals.com
8994
n1 eD
nn 0 mD
n1 eD
K r sA I r s
I r s
,
n1 eD
nn 0 mD
n1 eD
KB I
I
r sr s
r s
(6)
For lateral constant-pressure boundary:
n0 eD
nn 0 mD
n0 eD
K r sA I r s
I r s
n0 eD
nn 0 mD
n0 eD
KB I
I
r sr s
r s
(7)
2 2
rD 2D
πn
ns s
h 7(a)
2 2
2
D
πn
ns s
h (8)
Dimensionless parameters
Agarwal (1979) introduced a pseudotime function
to account for the time dependence of gas viscosity and
total system compressibility as follows:
o
a
g
1d
( )c ( )
t
t
t tt t
(9)
For compressible fluids, the pseudopressure,
(p), introduced by Agarwal (1979) is given by:
0
( ) 2 d( ) ( )
pp
p pp Z p
(10)
Define the dimensionless quantities as follows:
r2 aD 2
1 f
3.6k tt
x (11)
ffD
hh
h (12)
fzmfzmD
hh
h (13)
D
zz
h (14)
mmD
f
rr
x (15)
r112
r2
Mk
k (16)
r2 1rD
r1 2
k
k
(17)
r1D
f z1
khh
x k (18)
r1 z2D D
r2 z1
k kh h
k k (19)
r2 scD 3
sc sc3.684 10
k hT
q p T
(20)
f f D DfD D D
sc
2 ( , )( , )
x q x tq x t
q (21)
2.2 Fracture flow model
The fracture is considered as a homogeneous,
finite, slab, porous medium of height, hf, length 2xf and
width, wf, fluid enters the fracture at a rate qf(x, t) per unit
of fracture length, and flow across the edge of this porous
medium is negligible because the fracture width is very
small compared to the fracture length. The assumptions
allow us to consider a linear flow regime in the fracture
and permits simulation of well production by a uniform-
flux plane source of hf and w, located at the wellbore axis.
Define the dimensionless fracture conductivity,
CfD, and the dimensionless fracture width, wfD as follows:
f ffD
r2 f
w kC
k x (22)
ffD
f
ww
x (23)
According to the researches of previous Cinco-
Ley et al. (1978, 1989), the dimensionless model of the
fluid flow in fracture system becomes:
fDD
2
fD 1D12D2
D fD D2
2M0 ,0 1
wy
xx C y
(24)
D
fD
D fD fD0xx sC h
(25)
fD
D
1DfD 12DfD
D2
2 M,
wy
hq x s
y
(26)
The solution of Equation (32) subjected to the
conditions established by Equations (33) and (34) can be
solved and the wellbore pressure can be obtained as:
D
1
wD DfD
12 0
D D DfD
fD fD 0 0
1( , ) θ( , , )d
2M
, d
x
q s x s
x s q x s x dsC h
(27)
where,

VOL. 11, NO. 15, AUGUST 2016 ISSN 1819-6608
ARPN Journal of Engineering and Applied Sciences ©2006-2016 Asian Research Publishing Network (ARPN). All rights reserved.
www.arpnjournals.com
8995
D 0 D rD
0 0 D rD
0 D
1fD0 D
fDD fzmD
θ( , , ) K
I
K4
π I
cos( π ) cos( π ) sin( π )2
n
nn n
x s x s
D x s
x s
h D x s
hn z n h n
(28)
Now, Equation (36) can be numerically solved. If
the fracture length is divided into N segments (Figure-2)
and the flux in each element is assumed to be constant,
then we can have:
Di+1
Di
1
DfD
0
DjfDi
1
( , ) θ( , , )d
( , ) θ( , , )dxN
i x
q s x s
q s x s
(29)
where xDj is the midpoint of the observation segment.
Figure-2. Sketch of the half-fracture discrete element.
The second integral in Equation 37 is a Fredholm
function, which can be directly solved with the boundary
element method, which was presented by Cinco-Ley and
Meng (1988):
D
D DfD
0 0
212 DDfD fD
1
, d d
8
x
j
i j
i
q x s x
xq s j i x q s
(30)
In addition to the above expressions, by
considering steady-state flow, we have
D fD
1
1N
i
i
x q ss
(31)
Equations 25-31 constitute the system of
equations that need to be solved for obtaining the
unknowns fDi
q (i=1, 2…N) and wD .
2.3 Constant-bottom hole-pressure case
When the fractured well produced at a constant
pressure, the solution in Laplace space to the well can be
expressed by:
D 2
wD
1q
s (32)
And the definition of the dimensionless
production rate is:
3
sc scD
r2 sc i wf
3.684 10 p q Tq
k hT
(33)
2.4 Wellbore storage and skin effects
When the effects of wellbore storage as skin
factor are taken into account, the dimensionless wellbore
pressure in Laplace space is changed by using the
Duhamel’s theorem, van Everdingen and Hurst (1949) as follows:
wDN kin
wD 2
wDND kin
s S
s C s s S
(34)
Being CD the dimensionless wellbore storage
coefficient, D 2
2 t2 f2πC
Cc hx
3. TRANSIENT-PRESSURE AND RATE-
TRANSIENT BEHAVIORS
The dimensionless bottomhole pseudopressure
(ψwD) and pseudopressure derivative (dψwD/dtDa) can be
obtained using the Stehfest algorithm, Stehfest (1970) to
convert the wD back into ψwD. So, the standard log-log
type curves of well test analysis of ψwD and wD’tDa / CD
versus tDa / CD are obtained.
The standard log-log type curves for rate-
transient analysis or rate-decline analysis. Blasingame,
McCray, and Lee (1991), Blasingame and Lee (1994),
Marhaendrajana, and Blasingame (2001) and Pratikno,
Rushing, and Blasingame (2003), can be obtained by
defining the following expressions:
Dimensionless decline time
Da
Dd 2
eD eD0.5 1 ln 0.5
tt
r r
(35)
Dimensionless decline rate function
Dd D eDln( ) 0.5q q r (36)
Dimensionless decline rate integral Da
Dd0
Ddi
Da
( )dt
t
(37)
Dimensionless decline rate integral derivative
DdiDdi
Da
d
d ln( )
t (38)

VOL. 11, NO. 15, AUGUST 2016 ISSN 1819-6608
ARPN Journal of Engineering and Applied Sciences ©2006-2016 Asian Research Publishing Network (ARPN). All rights reserved.
www.arpnjournals.com
8996
The data provided in Table-1 are used to obtain
both the pressure response and the rate decline of the
mathematical model derived in this work.
Table-1. Synthetic data used for the discussion of the
results.
Parameter Value
Formation thickness, h , m 100
Wellbore radius, rw , m 0.1
Fracture height, hf ,m 50
The radius of inner region, rm 250
Bottomhole pressure, pwf, MPa 25
Gas viscosity, μ, cp 0.02
Skin factor, skin 0.1
Inner region
Horizontal permeability, kr1, mD 10
Vertical permeability, kz1, mD 0.5
porosity, ∅1 0.1
Total compressibility, Ct , MPa-1
1.0E-04
Initial reservoir pressure, pi, MPa 30
Half-fracture length, xf, m 50
The height of the mid-point of the
fracture, hfz, m 50
Reservoir temperature, T, K 353
Fracture permeability, kf, D 200
Molecular weight, Mg, kg/mol 16
Wellbore storage coefficient, C , m3/MPa 0.001
Outer region
Horizontal permeability, kr2, mD 5
Vertical permeability, kz2, mD 0.25
porosity, ∅2 0.2
Total compressibility, C2 , MPa-1 2.0E-04
It is well known that there are five main flow
periods taken place during a transient test of a finite-
conductivity fractured well: fracture linear flow, bilinear
flow period, formation linear flow period, pseudo-radial
flow period and the boundary dominated flow period,
Cinco-Ley and Samaniego (1981). For both partially and
fully penetrated fractured wells in a composite
homogeneous system, the following flow periods can be
observed as seen in Figure-3. (1) Fracture linear flow
period (see label 1 in Figure-3). This behavior occurs at
very small values of dimensionless time, and it can be
masked by wellbore storage and skin effects. During this
flow period, most of the fluid entering the wellbore comes
from the expansion of the fluid in the fracture. The ψwD
and ψ'wD*tD vs. tD on log-log curves both for fully and
partially fractured well yields a straight line with a slope
of one half. (2) Bilinear flow period (see label 2 in Figure-
3). The pressure behavior for this flow period exhibits a
straight line which slope is equal to one fourth and the
duration of this flow period depends on CfD. (3) Formation
linear flow period (see label 3 in Figure-3). This flow
period is characterized by a half slope in both pseudo
pressure and pseudo pressure derivatives curves on log-log
scale. (4) Spherical flow period or the pseudo radial flow
period in the inner region (see label 4 in Figure-3). For
fully penetrated fractured well, the pseudo pressure
derivative curve is characterized by a horizontal straight
line with the value of “1/(2*M12)”. The duration of this flow period is mainly determined by the inner region
radius; for partially fractured well, which is characterized
by a negative one-half slope line, and the pseudo radial
flow in inner region always be masked by this period. (5)
Transition period between inner region and outer region
radial flow period (see label 5 in Figure-3). (6) Radial flow
period in the outer region (see label 6 in Figure-3). For all
the dimensionless parameters defined by the outer region
characteristics, the derivative curve of this flow period is
characterized by a horizontal well with the value of one
half but not “1/2*M12”. (7) Boundary effect flow period. When the lateral boundary is infinite, this period will not
exit. For closed or constant-pressure boundary reservoir,
rapid up- or down- curving can be seen on the type curves
(see label 7 in Figure-3).
Figures-3 and 4 also show the effects of
penetrating ratio (hfD) on type curves of pressure and rate
transients. As it can be seen from Figure-3, hfD mainly
affects the early flow period in the inner region. When the
well produces at a constant flow rate, the smaller hfD the
bigger the pressure drop and longer duration of spherical
flow period,which reflects a much lower position on the
pseudo pressure and its derivative curves. And, when the
well produces at a constant bottom hole pressure, high
values of hfD represents a large contact face and volume of
well with the formation, so no matter what the outer
boundary conditions are, the bigger hfD will results into a
larger production rate. So, we should obtain fully
penetrated fractures as far as possible for the upper and
lower boundaries closed reservoir.
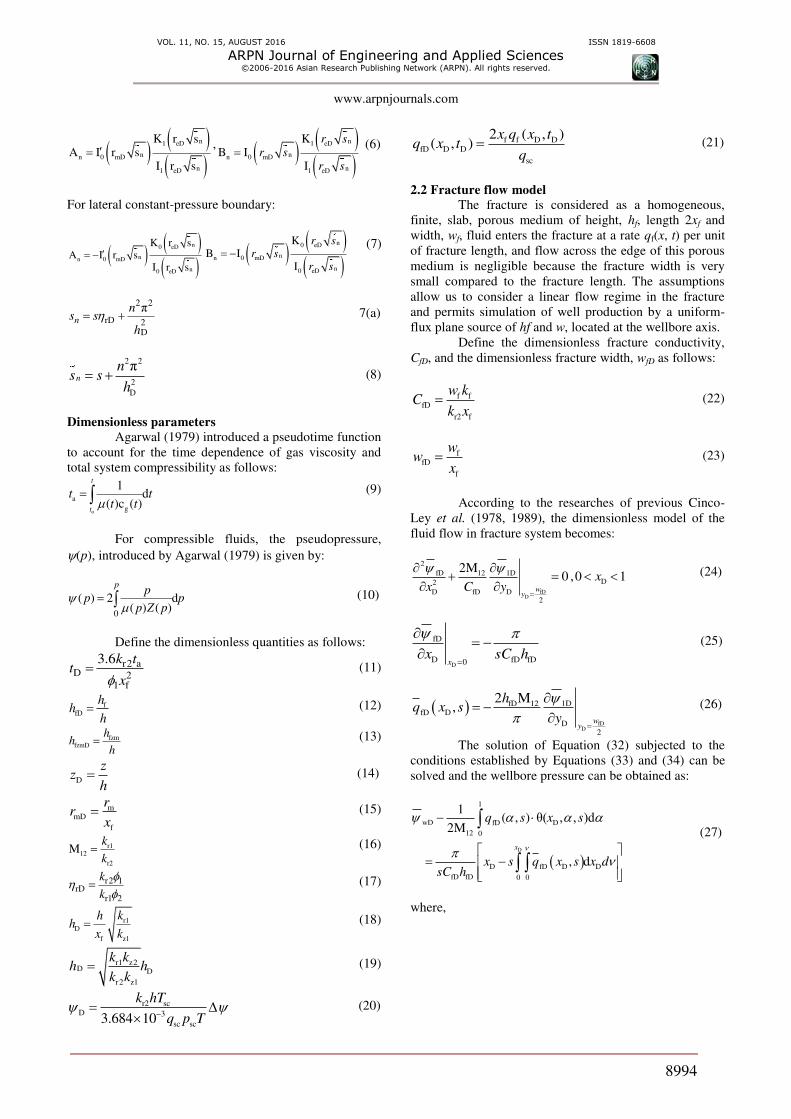
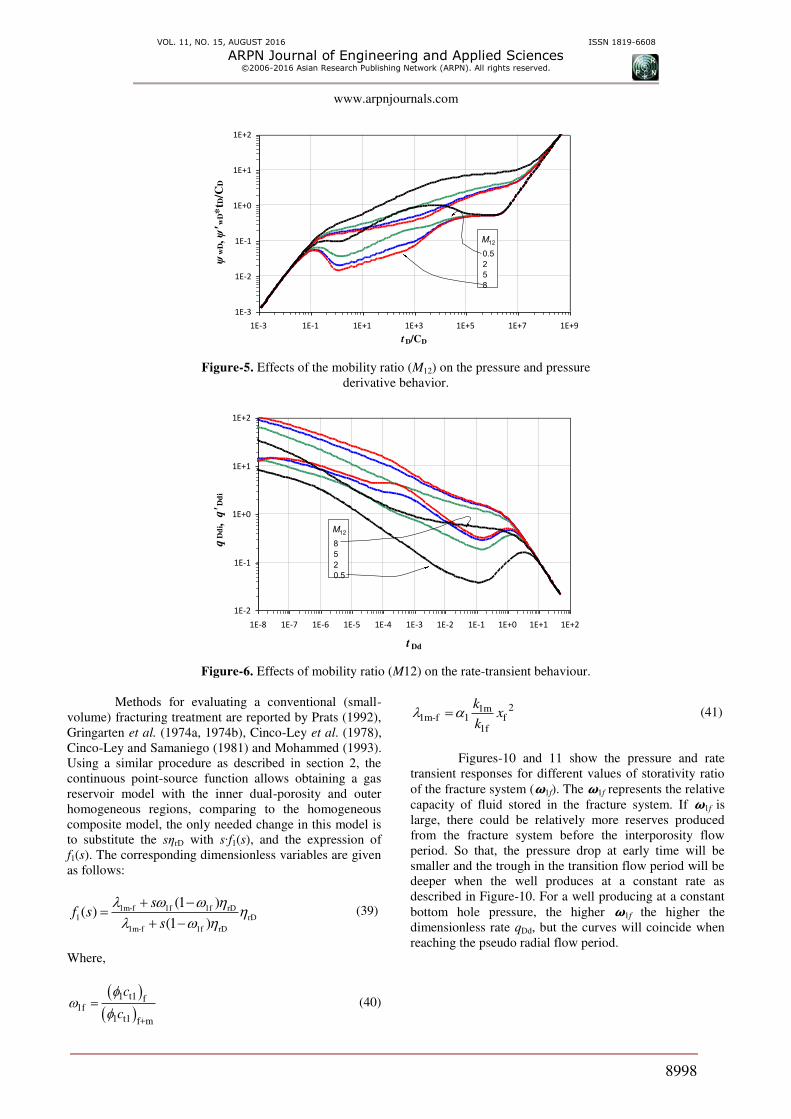
Figures-5 and 6 present the effect of the mobility
ratio (M12) on the transient pressure and transient rate
behavior, respectively. The mobility ratio is defined as the
ratio of the inner- region mobility to the outer-region
mobility which presents the flow capability of the inner
region to the outer. High values of M12 allow to recognize
that either the micro-fractures around the well are induced
or an acidizing stimulation treatment has been conducted.
On the contrary, small values of M12 can occur by the
damage of fracturing fluid or the gas field water re-
injected into the abandoned fractured well. It can be seen
from Figure-5 if the remaining parameters are kept
constant, the mobility ratio has a primary effect on the
early line flow and the pseudo radial flow periods. The
higher the values of M12 is, the lower the pressure drop
needed for well production at a constant rate. When the
pressure transient reaches the outer region, all the curves

VOL. 11, NO. 15, AUGUST 2016 ISSN 1819-6608
ARPN Journal of Engineering and Applied Sciences ©2006-2016 Asian Research Publishing Network (ARPN). All rights reserved.
www.arpnjournals.com
8997
with different M12 will coincide. For a well producing at a
constant bottomhole pressure, high values of M12 will
result into a large production rate obeying Darcy’s law as shown in Figure-6.
1E-3
1E-2
1E-1
1E+0
1E+1
1E+2
1E-6 1E-4 1E-2 1E+0 1E+2 1E+4 1E+6
t D
ψw
D, ψ'
wD*
tD
closed lateral boundary
infinite lateral boundary
constant pressure lateral
boundary
hfD
0.1
0.5
1
1
2 3
4
5 6
7
Figure-3. Effect of penetrating ratio (hfD) on the pressure and pressure
derivative behaviour.
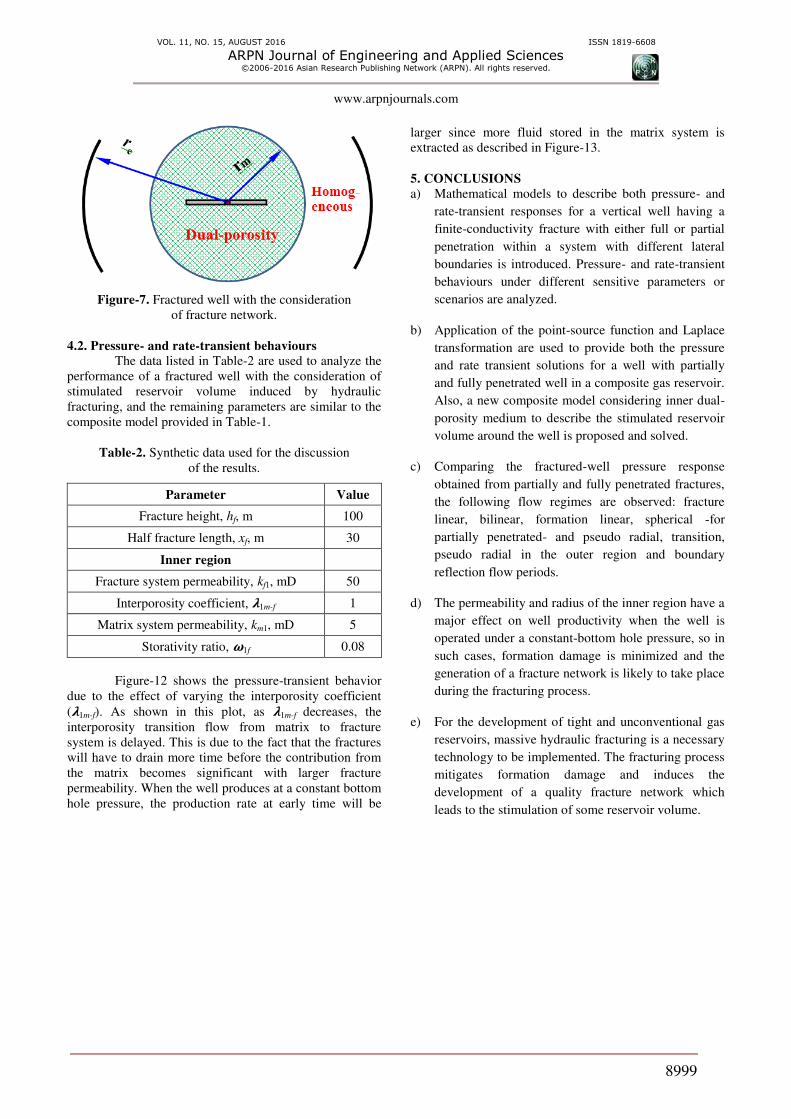
4. CONSIDERATION A FRACTURE NETWORK
INDUCED BY HYDRAULIC FRACTURING
4.1 Model solution
Sometimes, to efficiently develop a low-
permeability or an unconventional gas reservoir, massive
hydraulic fracturing (MHF) has been widely used around
the world which also is a proven technique for developing
commercial wells in such formations. The purpose of
MHF is to expose a large surface area of the low
permeability formation to flow into the wellbore. Massive-
scale fracturing fluid and high fluid pressure are the
essential requirements for MHF, which activate and
connect existing discrete or micro-seismic natural
fractures so as to generate large fracture networks. The
volume of a reservoir containing the fracture network and
the main hydraulic fractures have to be effectively
stimulated to increase the well performance. This is
referred as Stimulated Reservoir Volume (SRV). In order
to describe the SRV in the mathematical model of
fractured wells, researchers usually treat the SRV as a
dual-porosity system around the well, Ozkan et al. (2009,
2011), Chu and Shank (1993), Stalgorov and Mattar
(2012a, 2012b) and Apaydin, Ozkan and Raghavan
(2012). So, in order to include in this work the pressure
and rate transient performance of a MHF well with SRV,
the formation is simplified into a composite model with an
inner dual-porosity region and an outer homogeneous
region with the fractured well centered in the inner region,
as depicted in Figure-9.
1E-2
1E-1
1E+0
1E+1
1E+2
1E-8 1E-7 1E-6 1E-5 1E-4 1E-3 1E-2 1E-1 1E+0 1E+1 1E+2
t Da
qD
di,
q' D
di
closed lateral boundary
infinite lateral boundary
constant pressure lateral
`
hfD
1
0.5
0.1
Figure-4. Rate-transient behavior affected by penetrating ratio (hfD).
VOL. 11, NO. 15, AUGUST 2016 ISSN 1819-6608
ARPN Journal of Engineering and Applied Sciences ©2006-2016 Asian Research Publishing Network (ARPN). All rights reserved.
www.arpnjournals.com
8998
1E-3
1E-2
1E-1
1E+0
1E+1
1E+2
1E-3 1E-1 1E+1 1E+3 1E+5 1E+7 1E+9
t D/CD
ψw
D, ψ'
wD*
tD/C
D
M12
0.5
2
5
8
Figure-5. Effects of the mobility ratio (M12) on the pressure and pressure
derivative behavior.
1E-2
1E-1
1E+0
1E+1
1E+2
1E-8 1E-7 1E-6 1E-5 1E-4 1E-3 1E-2 1E-1 1E+0 1E+1 1E+2
t Dd
qD
di,
q'D
di
M12
8
5
2
0.5
Figure-6. Effects of mobility ratio (M12) on the rate-transient behaviour.
Methods for evaluating a conventional (small-
volume) fracturing treatment are reported by Prats (1992),
Gringarten et al. (1974a, 1974b), Cinco-Ley et al. (1978),
Cinco-Ley and Samaniego (1981) and Mohammed (1993).
Using a similar procedure as described in section 2, the
continuous point-source function allows obtaining a gas
reservoir model with the inner dual-porosity and outer
homogeneous regions, comparing to the homogeneous
composite model, the only needed change in this model is
to substitute the sηrD with s∙f1(s), and the expression of
f1(s). The corresponding dimensionless variables are given
as follows:
1m-f 1f 1f rD1 rD
1m-f 1f rD
(1 )( )
(1 )
sf s
s
(39)
Where,
1 t1 f1f
1 t1 f+m
c
c
(40)
21m1m-f 1 f
1f
kx
k (41)
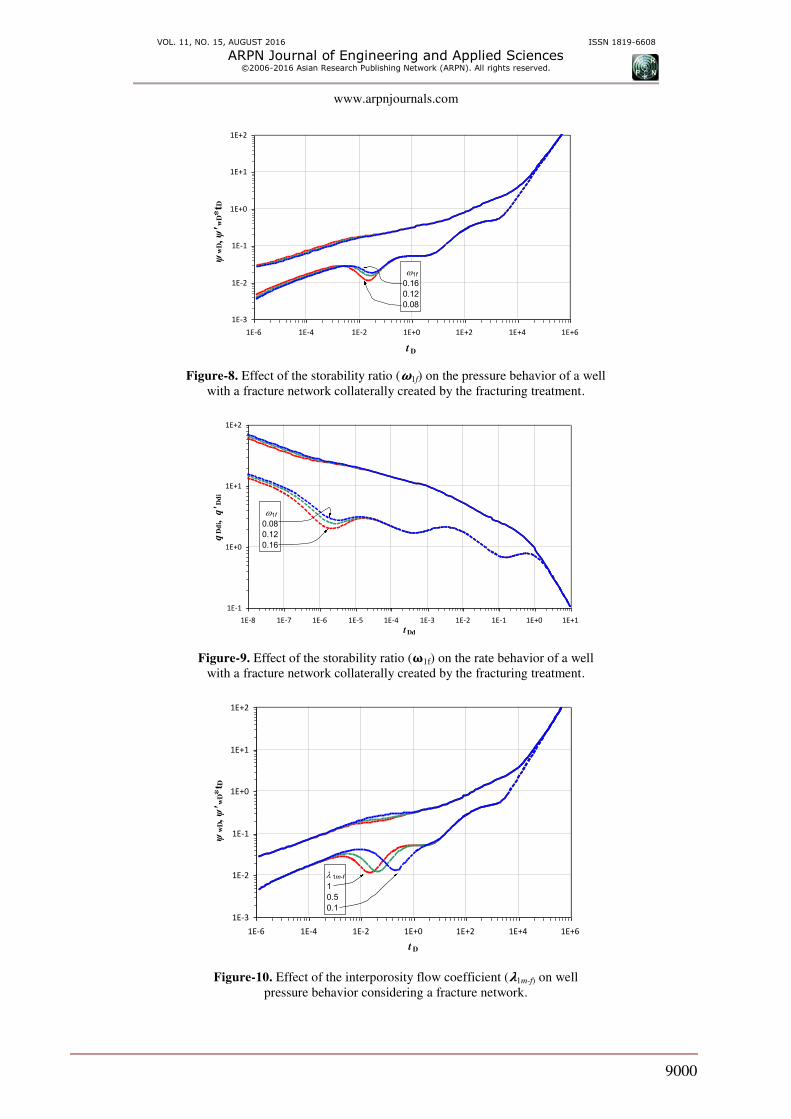
Figures-10 and 11 show the pressure and rate
transient responses for different values of storativity ratio
of the fracture system (�1f). The �1f represents the relative
capacity of fluid stored in the fracture system. If �1f is
large, there could be relatively more reserves produced
from the fracture system before the interporosity flow
period. So that, the pressure drop at early time will be
smaller and the trough in the transition flow period will be
deeper when the well produces at a constant rate as
described in Figure-10. For a well producing at a constant
bottom hole pressure, the higher �1f the higher the
dimensionless rate qDd, but the curves will coincide when
reaching the pseudo radial flow period.
VOL. 11, NO. 15, AUGUST 2016 ISSN 1819-6608
ARPN Journal of Engineering and Applied Sciences ©2006-2016 Asian Research Publishing Network (ARPN). All rights reserved.
www.arpnjournals.com
8999
Figure-7. Fractured well with the consideration
of fracture network.
4.2. Pressure- and rate-transient behaviours
The data listed in Table-2 are used to analyze the
performance of a fractured well with the consideration of
stimulated reservoir volume induced by hydraulic
fracturing, and the remaining parameters are similar to the
composite model provided in Table-1.
Table-2. Synthetic data used for the discussion
of the results.
Parameter Value
Fracture height, hf, m 100
Half fracture length, xf, m 30
Inner region
Fracture system permeability, kf1, mD 50
Interporosity coefficient, �1m-f 1
Matrix system permeability, km1, mD 5
Storativity ratio, �1f 0.08
Figure-12 shows the pressure-transient behavior
due to the effect of varying the interporosity coefficient
(�1m-f). As shown in this plot, as �1m-f decreases, the
interporosity transition flow from matrix to fracture
system is delayed. This is due to the fact that the fractures
will have to drain more time before the contribution from
the matrix becomes significant with larger fracture
permeability. When the well produces at a constant bottom
hole pressure, the production rate at early time will be
larger since more fluid stored in the matrix system is
extracted as described in Figure-13.
5. CONCLUSIONS
a) Mathematical models to describe both pressure- and
rate-transient responses for a vertical well having a
finite-conductivity fracture with either full or partial
penetration within a system with different lateral
boundaries is introduced. Pressure- and rate-transient
behaviours under different sensitive parameters or
scenarios are analyzed.
b) Application of the point-source function and Laplace
transformation are used to provide both the pressure
and rate transient solutions for a well with partially
and fully penetrated well in a composite gas reservoir.
Also, a new composite model considering inner dual-
porosity medium to describe the stimulated reservoir
volume around the well is proposed and solved.
c) Comparing the fractured-well pressure response
obtained from partially and fully penetrated fractures,
the following flow regimes are observed: fracture
linear, bilinear, formation linear, spherical -for
partially penetrated- and pseudo radial, transition,
pseudo radial in the outer region and boundary
reflection flow periods.
d) The permeability and radius of the inner region have a
major effect on well productivity when the well is
operated under a constant-bottom hole pressure, so in
such cases, formation damage is minimized and the
generation of a fracture network is likely to take place
during the fracturing process.
e) For the development of tight and unconventional gas
reservoirs, massive hydraulic fracturing is a necessary
technology to be implemented. The fracturing process
mitigates formation damage and induces the
development of a quality fracture network which
leads to the stimulation of some reservoir volume.
VOL. 11, NO. 15, AUGUST 2016 ISSN 1819-6608
ARPN Journal of Engineering and Applied Sciences ©2006-2016 Asian Research Publishing Network (ARPN). All rights reserved.
www.arpnjournals.com
9000
1E-3
1E-2
1E-1
1E+0
1E+1
1E+2
1E-6 1E-4 1E-2 1E+0 1E+2 1E+4 1E+6
t D
ψw
D, ψ'
wD*
tD
1f
0.16
0.12
0.08
Figure-8. Effect of the storability ratio (�1f) on the pressure behavior of a well
with a fracture network collaterally created by the fracturing treatment.
1E-1
1E+0
1E+1
1E+2
1E-8 1E-7 1E-6 1E-5 1E-4 1E-3 1E-2 1E-1 1E+0 1E+1
t Dd
qD
di,
q'D
di
1f
0.08
0.12
0.16
Figure-9. Effect of the storability ratio (�1f) on the rate behavior of a well
with a fracture network collaterally created by the fracturing treatment.
1E-3
1E-2
1E-1
1E+0
1E+1
1E+2
1E-6 1E-4 1E-2 1E+0 1E+2 1E+4 1E+6
t D
ψw
D, ψ
' wD*
t D
1m-f
1
0.5
0.1
Figure-10. Effect of the interporosity flow coefficient (�1m-f) on well
pressure behavior considering a fracture network.

VOL. 11, NO. 15, AUGUST 2016 ISSN 1819-6608
ARPN Journal of Engineering and Applied Sciences ©2006-2016 Asian Research Publishing Network (ARPN). All rights reserved.
www.arpnjournals.com
9001
1E-1
1E+0
1E+1
1E+2
1E-8 1E-7 1E-6 1E-5 1E-4 1E-3 1E-2 1E-1 1E+0 1E+1
t Dd
qD
di,
q' D
di
1m-f
1
0.5
0.1
Figure-11. Effect of the interporosity flow coefficient (�1m-f) on rate-transient
response including a fracture network presence.
ACKNOWLEDGEMENT
This work was supported by Scientific Research
Starting Project of SWPU (No. 2015QHZ003). The
authors would also like to appreciate the reviewers and
editors whose critical comments were very helpful in
preparing this article.
Nomenclature
ct1, ct2 total system compressibility, MPa-1
C wellbore storage coefficient, m3/MPa
h formation thickness, m
hf fracture height, m
hfzm distance from the fracture middle point to the
reservoir’s bottom boundary, m
I0(x), K0(x) modified Bessel function of first and
second kind respectively, zero order
I’0(x), K’0(x) modified Bessel function derivative of
first and second kind respectively, zero order
k1, k2 effective permeability of regions 1 and 2, D
kr1, kr2 horizontal permeability of regions 1 and 2, D
kz1, kz2 vertical permeability of regions 1 and 2, D
kf fracture permeability, D
M12 mobility ratio between regions 1 and 2
psc pressure at standard state condition, psc
0.10325 MPa
p pressure, MPa
pf pressure in hydraulic fracture, MPa
qsc gas flow rate at standard condition, m3/d
q continuous point source withdraw rate, m/d
qDd dimensionless decline rate function, defined in
Eq.(45)
qDdi dimensionless decline rate integral, defined in
Eq.(46)
q’Ddi dimensionless decline rate integral derivative,
defined in Eq.(47)
rm discontinuity radius for region 1, m
rw well radius, m
s Laplace variable
Skin skin factor
T temperature at reservoir state condition, K
Tsc temperature at standard state condition, Tsc=293K
t production time, h
ta(p) pseudo-time function, MPa*h/cp
tDd dimensionless decline rate, defined in Eq.(44)
wf fracture width, m
W12 storativity ratio between region 1 and 2
x, y, z distance in the Cartesian coordinate system, m
xf fracture half length, m
Z gas deviation factor, sm3/m
3
η12 diffusivity ratio between regions 1 and 2
ω1m-f storability ratio of fracture system for fracture
network model
λ1m-f interporosity coefficient from matrix system to
fracture system for fracture
network model
μ gas viscosity, cp ∅1,∅2 porosity of region 1 and region 2
REFERENCES
[1] Ahmed U. 1982. Transient pressure analysis of
hydraulically fractured wells in the Western tight
sands. SPE 10878 presented at SPE Rocky Mountain
Regional Meeting, 19-12 May, Billing, Montana.
[2] Apaydin O.G., Ozkan E. and Raghavan R. 2012.
Effect of discontinuous microfractures on ultratight
matrix permeability of a dual-porosity medium. SPE
Reservoir Evaluation and Engineering. 15(4): 473-
485.
[3] Agarwal G. 1979. Real gas pseudo-time a new
function for pressure buildup analysis of MHF gas
wells. Paper SPE 8279 presented at the 54th
technical
conference and exhibition of the Society of Petroleum
Engineers of AIME, Sep. 23-26, Las Vegas, NV.
[4] Blasingame T.A., Mccray T.L. and Lee W.J. 1991.
Decline curve analysis for variable pressure
drop/variable flow rate systems. Paper SPE-21513-

VOL. 11, NO. 15, AUGUST 2016 ISSN 1819-6608
ARPN Journal of Engineering and Applied Sciences ©2006-2016 Asian Research Publishing Network (ARPN). All rights reserved.
www.arpnjournals.com
9002
MS presented at SPE Gas Technology Symposium,
22–24 January, Houston, Texas.
[5] Blasingame T.A. and Lee W.J. 1994. The variable-
rate reservoir limits testing of gas wells. Paper SPE
17708-MS presented at SPE Gas Technology
Symposium, 13-15 June, Dallas, Texas.
[6] Brown M., Ozkan E. and Raghavan R. 2011. Practical
solutions for pressure-transient responses of fractured
horizontal wells in unconventional reservoirs. SPE
Reservoir Evaluation and Engineering. 14(6): 663-
676.
[7] Chu W.C. and Shank G.D. 1993. A new model for a
fractured well in a radial, composite reservoir
(includes associated papers 27919, 28665 and 29212)
SPE Formation Evaluation. 8(3): 225-232.
[8] Chen C.C. and Raghavan R. 1995. Modeling a
fractured well in a composite reservoir. SPE
Formation Evaluation, 10(4): 241-246.
[9] Cinco-Ley H. and Samaniego V., F. 1977, January 1.
Effect of Wellbore Storage and Damage on the
Transient Pressure Behavior of Vertically Fractured
Wells. Society of Petroleum Engineers.
doi:10.2118/6752-MS.
[10] Cinco-Ley H. and Samaniego F. 1981. Transient
pressure analysis for fractured wells. Journal of
Petroleum Technology. 33(9): 1749-1766.
[11] Cinco-Ley H., Samaniego F. and Dominguez N.
1978. Transient pressure behavior for a well with a
finite-conductivity vertical fracture. SPE Journal.
18(4):.253-264.
[12] Cinco-Ley H., Samaniego F., Rodriguez F. 1989.
Application of the pseudolinear-flow model to the
pressure-transient analysis of fractured wells. SPE
Formation Evaluation. 4(3): 438-444.
[13] Cinco-Ley H. and Meng H. Z. 1988, January 1.
Pressure Transient Analysis of Wells with Finite
Conductivity Vertical Fractures in Double Porosity
Reservoirs. Society of Petroleum Engineers.
doi:10.2118/18172-MS.
[14] Escobar F.H., Zhao Y.L. and Zhang L.H. 2014.
Interpretation of Pressure Tests in Hydraulically-
Fractured Wells in Bi-Zonal Gas Reservoirs.
Ingeniería e Investigación. ISSN 0120-5609. Vol. 34.
Nro. 4. pp. 76-84. 2014.
[15] Feng J.D., Luo R.L. and Chen L.S. 2009. A composite
seepage model for fractured reservoir. Paper
SPE119255 presented at SPE Annual Technical
Conference and Exhibition, 15-18 March, Bahrain.
[16] Fjaer E. 2008. Mechanics of hydraulic fracturing.
Petroleum related rock mechanics. Developments in
petroleum science (2nd
Ed.). Elsevier. pp. 369.
Retrieved 2012-05-14.
[17] Gringarten A.C., Ramey Jr., H.J., Raghavan R. 1974a.
Unsteady state pressure distribution created by a well
with a single infinite conductivity vertical fracture.
SPE Journal. 347-360 (August).
[18] Gringarten A.C., Ramey Jr., H.J., Raghavan R. 1974b.
Unsteady state pressure distribution created by a well
with a single infinite conductivity vertical fracture.
SPE Journal. 14(4): 347-360.
[19] Hanley E.J. and Bandyopadhyay P. 1979. Pressure
transient behavior of the uniform flux finite capacity
fracture. SPE 8278 presented at the SPE Annual
Technical Conference and Exhibition, 23-26
September, Las Vegas, Nevada.
[20] Marhaendrajana T. and Blasingame T.A. 2001.
Decline curve analysis using type curves-evaluation
of well performance behavior in a multiwell reservoir
system. Paper SPE-71517-MS presented at SPE
Annual Technical Conf. and Exhibition, 30
September-3 October 2001, New Orleans, LA.
[21] Mohammed E.O. and Kassem J.H.A. 1997. A new
method for pressure test analysis of a vertically
fractured well producing commingled zones in
bounded square reservoirs. Journal of Petroleum
Science and Engineering. 18(1-2): 131-145.
[22] Mohammed E.O. 1993. Pressure analysis of a
fractured well in multilayered reservoirs. Journal of
Petroleum Science and Engineering. 9(1): 49-66.
[23] Ozkan E., Brown M., Raghavan R. and Kasemi H.
2009. Comparison of fractured horizontal-well
performance in conventional and unconventional
reservoirs. SPE 121290-MS presented at SPE Western
Regional Meeting, San Jose, California, 24-16 March.
[24] Ozkan E., Brown M., Raghavan R. and Kasemi H.
2011. Comparison of Fractured-Horizontal-Well
Performance in Tight Sand and Shale Reservoirs. SPE
Reservoir Evaluation and Engineering. 14(2): 248-
259.

VOL. 11, NO. 15, AUGUST 2016 ISSN 1819-6608
ARPN Journal of Engineering and Applied Sciences ©2006-2016 Asian Research Publishing Network (ARPN). All rights reserved.
www.arpnjournals.com
9003
[25] Prats M. 1961. Effect of vertical fractures on reservoir
behavior-incompressible fluid case. Society of
Petroleum Engineering Journal. 1(2): 105-118.
[26] Pratikno H., Rushing J.A. and Blasingame T.A. 2003.
Decline curve analysis using type curves-fractured
wells. SPE 84278-MS presented at SPE Annual
Technical Conference and Exhibition, 5-8 October,
Denver, Colorado.
[27] Stalgorova E. and Mattar L. 2012a. Practical
Analytical model to simulate production of horizontal
wells with branch fractures. SPE 162515 presented at
SPE Canadian Unconventional Resource Conference,
30 Oct.-1 Nov, Calgary, Alberta, Canada.
[28] Stalgorova E. and Mattar L. 2012b. Analytical model
for history matching and forecasting production in
multifrac composite systems. SPE 162516-MS
presented at SPE Canadian Unconventional Resource
Conference, 30 October.-1 November, Calgary,
Alberta, Canada.
[29] Stehfest H. 1970. Numerical inversion of Laplace
transform, Communication ACM. 13: 47-49.
[30] Van Everdingen V. and Hurst A.F. 1949. The
application of the Laplace transformation to flow
problem in reservoirs. Journal of Petroleum
Technology. 1(12): 305-327.
[31] Zhao Y.L. 2011. The theory and application of source
functions in bi-zonal gas reservoirs. MSc. Thesis.
Southwest Petroleum University. China. (In:
Chinese).
[32] Zhao Y.L., Zhang L.H., Hu S.Y., Zhao J.Z. and Zhang
B.N. 2013. Transient pressure analysis of fractured
well in bi-zonal gas reservoirs. Journal of Hydrology.
524: 89-99.