Embed Size (px)
Citation preview
PERFORMANCE ANALYSIS OF A DOWNDRAFT
AND FLUIDIZED BED BIOMASS GASIFICATION
USING THERMODYNAMIC EQUILIBRIUM
MODEL
GAN GEK HIAN
BACHELOR OF CHEMICAL ENGINEERING (PURE)
UNIVERSITI MALAYSIA PAHANG
©GAN GEK HIAN (2015)

VIII
ABSTRACT
Gasification is a process of producing fuel gas or synthesis gas from biomass using
gasifier. The gas produced through this process particularly hydrogen will be utilized
further as an input for power generation in order to produce energy. Due to the
environmental concern and sustainability issues, energy from biomass has become one
of the most promising renewable sources of energy. Current research points to improve
the gasifier performance in order to elevate more economical product from the gasifier.
For this purpose, the thermodynamic equilibrium model can be employed to predict the
gas composition and to optimize important gasifier parameters for various kinds of
gasifiers as well as utilizing various types of biomasses. In this work, the biomasses
consisting of wood, rice husk, saw dust and empty fruit brunch are selected considering
their low cost and availabilities as an abundant resource in Malaysia. These biomass
sources are then served as the inputs for downdraft and fluidized bed gasifier for
producing the hydrogen gas and through this study, the performance analysis in terms of
the optimal parameters and gas output composition are then carried out. Here the air is
used as an input reactant for downdraft gasifier and the fluidized bed gasifier is
employing steam for the gasification process. In this work, the model validation is
carried out first where the gas composition data obtained from thermodynamic
equilibrium model show good agreement with experimental result from Zainal et al.
(2001) for downdraft gasifier employing wood and Karmakar and Datta (2011) for
fluidized bed gasifier using rice husk. Afterwards the performance analysis is performed
to investigate the optimum parameters for downdraft and fluidized bed gasifiers. Based
on this analysis, the optimum parameters obtained are at temperature 7700C with
moisture content of 0.2 and steam biomass ratio 1.32, the hydrogen gas produced from
wood, rice husk, sawdust and empty fruit bunch in downdraft gasifier is 16.38%,
17.02%, 16.30% and 50.12 % respectively, while in the fluidized bed gasifier is
38.75%, 50.00%, 73.30% and 71.77% respectively. The result of the performance
analysis shows that the fluidized bed gasifier is more efficient than downdraft gasifier in
term of hydrogen gas production.

IX
ABSTRAK
Pengegasan adalah satu proses untuk menghasilkan gas bahan api atau gas sintesis
daripada biomas menggunakan penggas. Gas yang dihasilkan melalui proses ini
terutamanya hidrogen akan digunakan lagi sebagai input bagi penjanaan kuasa untuk
menghasilkan tenaga. Disebabkan oleh kebimbangan dan kemampanan isu-isu alam
sekitar, tenaga daripada biojisim telah menjadi salah satu sumber yang boleh
diperbaharui yang paling menjanjikan tenaga. Titik penyelidikan semasa untuk
meningkatkan prestasi penggas untuk meningkatkan produk lebih menjimatkan
daripada penggas. Untuk tujuan ini, model keseimbangan termodinamik boleh
digunakan untuk meramalkan komposisi gas dan untuk mengoptimumkan parameter
Penggas penting untuk pelbagai jenis gasifiers serta menggunakan pelbagai jenis
biomasses. Dalam karya ini, biomas yang terdiri daripada kayu, sekam padi, habuk
papan dan buah tandan kosong dipilih memandangkan cos yang rendah dan sumber
didapati di Malaysia. Sumber-sumber biomas kemudiannya bertindak sebagai input
untuk penggas downdraft dan fluidized untuk menghasilkan gas hidrogen dan melalui
kajian ini, analisis prestasi dari segi parameter optimum dan komposisi pengeluaran gas
kemudiannya dijalankan. Di sini udara digunakan sebagai bahan tindak balas input
untuk penggas downdraft manakala penggas fluidized menggunakan stim untuk proses
pengegasan ini. Dalam projek ini, pengesahan model yang dilakukan dahulu di mana
data komposisi gas yang diperolehi daripada model keseimbangan termodinamik
menunjukkan persamaan dengan hasil eksperimen dari Zainal et al. (2001) untuk
penggas downdraft menggunakan kayu dan Karmakar dan Datta (2011) untuk penggas
fluidized menggunakan sekam padi. Selepas itu analisis prestasi dilaksanakan untuk
menyiasat parameter optimum untuk penggas downdraft dan fluidized. Berdasarkan
analisis ini, parameter optimum diperolehi adalah pada suhu 7700C dengan kandungan
lembapan sebanyak 0.2 dan stim dengan biomas rasio 1.32, gas hidrogen yang
dihasilkan daripada kayu, sekam padi, habuk papan dan buah tandan kosong dalam
penggas downdraft adalah masing-masing 16,38%, 17,02%, 16.30% dan 50,12% ,
manakala di penggas fluidized masing-masing adalah 38,75%, 50,00%, 73,24% dan
71,77%. Hasil analisis prestasi menunjukkan bahawa penggas fluidized adalah lebih
cekap daripada penggas downdraft dari segi pengeluaran gas hidrogen.

X
TABLE OF CONTENTS
SUPERVISOR’S DECLARATION ............................................................................... IV
STUDENT’S DECLARATION ...................................................................................... V
Dedication ....................................................................................................................... VI
ACKNOWLEDGEMENT ............................................................................................. VII
ABSTRACT ................................................................................................................. VIII
ABSTRAK ...................................................................................................................... IX
TABLE OF CONTENTS ................................................................................................. X
LIST OF FIGURES ....................................................................................................... XII
LIST OF TABLES ....................................................................................................... XIV
LIST OF ABBREVIATIONS ...................................................................................... XVI
1 INTRODUCTION .................................................................................................... 1
1.1 Motivation, problem statement and brief review ............................................... 1
1.2 Objectives .......................................................................................................... 3
1.3 Scope of this research ........................................................................................ 4
1.4 Main contribution of this work .......................................................................... 4
1.5 Organisation of this thesis .................................................................................. 4
2 LITERATURE REVIEW ......................................................................................... 6
2.1 Overview ............................................................................................................ 6
2.2 Gasification Process ........................................................................................... 6
2.3 Types of Gasifier ............................................................................................... 7
2.4 Thermodynamic Equilibrium Model ............................................................... 10
2.5 Type of Biomasses ........................................................................................... 19
2.6 Summary .......................................................................................................... 20
3 METHODOLOGY ................................................................................................. 21
3.1 Overview .......................................................................................................... 21
3.2 Problem definition (Step 1) .............................................................................. 21
3.3 Process and Product Specification (Step 2) ..................................................... 22
3.4 Thermodynamic Equilibrium Model (Step 3) ................................................. 23
3.4.1 The process and product specification ...................................................... 24
3.4.2 Heat capacity ............................................................................................. 26
3.4.3 Determination of x1, x2 and x3 using Newton-Raphson method. .............. 27
3.4.4 Determination of x4 and x5. ....................................................................... 28
3.4.5 Composition of the Hydrogen in the Product. .......................................... 28
3.5 Validation by Comparing with Experimental Data (Step 4) ............................ 29
3.6 Performance Evaluation(Step 5) ...................................................................... 29
4 EXCEL CALCULATION OF PERFORMANCE ANALYSIS ............................. 30
4.1 The Steps in the Performance Analysis……………………………………30
4.1.1 Problem definition .................................................................................... 30
4.1.2 The process and product specification ...................................................... 30
4.1.3 Heat capacity ............................................................................................. 32
4.1.4 Determination of x1, x2 and x3 using Newton-Raphson method...……… .34
4.1.5 Composition of the Hydrogen in the Product ................................……... 36
4.2 Summary of Performance Analysis...…………………………….............37
4.2.1 Overall Steps in Performance Analysis…..………………...………..………....37
4.2.2 Problem Definition (Step 1)……………..……………………………...........38
4.2.3 Process and Product Specification (Step 2)………………….………...............39

XI
4.2.4 Model Evaluation (Step 3)………………………………………….…..39
4.2.5 Performance Analysis (Step 4)…………………………………….…...41
4.2.6 Overall Summary of Performance Analysis……………………….…...43
5 PERFORMANCE ANALYSIS OF BIOMASS GASIFICATION ........................ 44
5.1 Overview .......................................................................................................... 44
5.2 Model Evaluation of Downdraft Gasifier ........................................................ 44
5.3 Model Evaluation of Fluidized Bed Gasifier. .................................................. 45
5.4 Performance Analysis for Downdraft Gasifier. ............................................... 48
5.4.1 Performance Analysis by Varying Temperature in Downdraft Gasifer...48
5.4.2 Performance Analysis by Varying Moisture Content in Downdraft
Gasifier. ............................................................................................................ 50
5.5 Performance Analysis for Fluidized bed Gasifier……………….............51
5.5.1 Performance Analysis by Varying Temperature in Fluidized Bed Gasifier.
...............……………………………………………………………..........51
5.5.2 Performance analysis by Varying Moisture Content in Fluidized Bed
Gasifier. ............................................................................................................ 53
5.5.3 Performance Analysis by Varying Steam Biomass Ratio ........................ 54
5.6 Comparison of Performance Analysis of both types of gasifier…………56
6 CONCLUSION ............................................................................................................ 60
6.1 Conclusion ....................................................................................................... 60
6.2 Future Works ................................................................................................... 62
REFRENCES .................................................................................................................. 63
APPENDIX...………………………………………………………………………………................66

XII
LIST OF FIGURES
Figure 2-1: Moving Bed Gasifier ( adopted from Garcia et al., 2009) ............................. 8
Figure 2-2: Fluidized Bed Gasifier (Adopted from Garcia et al., 2009) .......................... 8
Figure 2-3: Downdraft Gasifier(adopted from Sadaka., 2013) ......................................... 9
Figure 3-1: Process Flow Diagram for Analysis Gasifier Performance. ........................ 21
Figure 3-2: Step by Step of the Thermodynamic Equilibrium Calculation. ................... 24
Figure 4-1: Ultimate Analysis of Biomass Materials. .................................................... 32
Figure 4-2: Energy Conversion Calculation for Downdraft Gasifier. ............................ 32
Figure 4-3: The Derivation of Equation K1 in term of Temperature for Downdraft
Gasifier. ........................................................................................................................... 33
Figure 4-4: The Derivation of Equation K2 in term of Temperature in Downdraft
Gasifier. ........................................................................................................................... 34
Figure 4-5: Calculation of A, B, C, D and E of Wood in Downdraft Gasifier. .............. 35
Figure 4-6 : The Newton Raphson Calculation for Wood in Downdraft Gasifier. ........ 36
Figure 4-7: The Gas Composition produced by Wood in Downdraft Gasifier. ............. 37
Figure 4-8: The methodology in the first page of the summaries. .................................. 38
Figure 4-9: Problem Definition in Performance Analysis of Biomass Gasification
Process. ........................................................................................................................... 39
Figure 4-10: Process and Product Specification in Performance Analysis of Biomass
Gasification. .................................................................................................................... 39
Figure 4-11: Overall Process and Product Specification from Downdraft and Fluidized
Bed Gasifier. ................................................................................................................... 40
Figure 4-12: Comparison of Gas Produce in the Model with Experimental Data in
Zainal et al.,2001. ........................................................................................................... 40
Figure 4-13: Comparison of Gas Produce in Model with Experimental Data in
Karmakar and Datta et al., 2011at different Temperature. ............................................. 41
Figure 4-14: Comparison of Gas Produce in Model with Experimental Data in
Karmakar and Datta et al., 2011at different Steam Biomass Ratio. ............................... 41
Figure 4-15: Summaries of Performance Analysis in Downdraft and Fluidized Bed
Gasifier at different Temperature. .................................................................................. 42
Figure 4-16: Summaries of Performance Analysis in Downdraft and Fluidized Bed
Gasifier at different Moisture Content. ........................................................................... 42
Figure 4-17: Summaries of Comparison of Performance Analysis in Downdraft and
Fluidized Bed Gasifier at different Temperature and Moisture Content. ....................... 43
Figure 5-1: Comparison of Model Data with the Experimantal Data taken from
Kamarkar and Datta(2011) at different temperature. ...................................................... 47
Figure 5-2: Comparison of Model Data with the Experimantal Data taken from
Kamarkar and Datta(2011) at different Steam Biomass Ratio. ...................................... 47

XIII
Figure 5-3 : Hydrogen Gas Composition Produced by Each Types of Biomass at
Different Temperature. ................................................................................................... 49
Figure 5-4: Hydrogen Gas Composition Produced by Each Types of Biomass at
Different Temperature. ................................................................................................... 51
Figure 5-5: Hydrogen Gas Composition Produced by Each Types of Biomass at
Different Temperature. ................................................................................................... 52
Figure 5-6 : Hydrogen Gas Composition Produced by Each Types of Biomass at
Different Moisture Content. ............................................................................................ 54
Figure 5-7: Hydrogen Gas Composition Produced by Each Types of Biomass at
Different Steam Biomass Ratio. ..................................................................................... 55
Figure 5-8: The comparison of downdraft and fluidized bed gasifier at different
temperature. .................................................................................................................... 57
Figure 5-9: Downdraft and fluidized bed gasifiers comparison at different moisture
content. ............................................................................................................................ 59

XIV
LIST OF TABLES
Table 2-1: Advantage and Disadvantages of Each Type of Gasifier. ............................... 9
Table 3-1: Process and Product Specification. ............................................................... 23
Table 3-2: Ultimate Analysis for Various Biomass Material chosen. ............................ 24
Table 3-3: Molecular Weight of Each Component. ........................................................ 25
Table 3-4: The Chemical Formula for Rice Husk, Empty Fruit Bunch and Sawdust. ... 25
Table 3-5: Heat Capacity (constant A, B,C and D)(Smith et al., 2005) ......................... 26
Table 3-6: Heat of Formation at 298K (kJ/kmol)( Smith et al.,2005) ............................ 27
Table 4-1: Process and Product Specification. ............................................................... 31
Table 5-1: Process and Product Specification of Downdraft Gasifier for Model
Evaluation. ...................................................................................................................... 44
Table 5-2: Comparison of Experimental Value in the Zainal et al.,(2011) with the Model
Data. ................................................................................................................................ 45
Table 5-3: Process and Product Specification of Fluidized Bed Gasifier for Model
Evaluation. ...................................................................................................................... 45
Table 5-4: Composition of Gas taken from Model Calculation. .................................... 46
Table 5-5: Experimental Value from Karmakar and Datta., (2011). .............................. 46
Table 5-6: The Comparison of Model Data and Experimental Data of Gas Composition
Produce from Rice Husk in Fluidized Bed Gasifier. ...................................................... 48
Table 5-7 : Process and Product Specification for Temperature Different in Downdraft
Gasifier. ........................................................................................................................... 48
Table 5-8: Composition of Hydrogen Gas Produced by each types of Biomass at
Different Temperature. ................................................................................................... 49
Table 5-9: Process and Product Specification for Moisture Content Different in
Downdraft Gasifier. ........................................................................................................ 50
Table 5-10: Composition of Hydrogen Gas Produced by each types of Biomass at
Different Moisture Content. ............................................................................................ 50
Table 5-11: Process and Product Specification for Temperature Different in Fluidized
Bed Gasifier. ................................................................................................................... 51
Table 5-12: Composition of Hydrogen Gas Produced by each types of Biomass at
Different Temperature. ................................................................................................... 52
Table 5-13: Process and Product Specification for Moisture Content Different in
Fluidized Bed Gasifier. ................................................................................................... 53
Table 5-14: Composition of Hydrogen Gas Produced by each types of Biomass at
Different Moisture Content. ............................................................................................ 53
Table 5-15: Process and Product Specification for Steam Biomass Ratio Different in
Fluidized Bed Gasifier. ................................................................................................... 54

XV
Table 5-16: Composition of Hydrogen Gas Produced by each types of Biomass at
Different Steam Biomass Ratio. ..................................................................................... 55
Table 5-17: The specification for the comparison of downdraft and fluidized bed
gasifiers at different temperature. ................................................................................... 56
Table 5-18: Hydrogen gas composition produced by each type of biomasses at different
temperature in downdraft gasifier. .................................................................................. 56
Table 5-19: Hydrogen gas composition produced by each type of biomasses at different
temperature in fluidized bed gasifier. ............................................................................. 56
Table 5-20: Process and Product Specification for Moisture Content Different in
Fluidized Bed Gasifier. ................................................................................................... 58
Table 5-21: Hydrogen gas composition produced by each type of biomasses at different
moisture content in downdraft gasifier. .......................................................................... 58
Table 5-22: Hydrogen gas composition produced by each type of biomasses at different
moisture content in fluidized bed gasifier. ...................................................................... 58

XVI
LIST OF ABBREVIATIONS
C Carbon
CH4 Ethane
CO Carbon Monoxide
CO2 Carbon Dioxide
Cp Heat Capacity
EFB Empty Fruit Bunch
G Gas phase
H2 Hydrogen
H2O Water
HHV High Heating Value
L Liquid phase
LHV Low Heating Value
MC Moisture Content
O2 Oxygen
P Pressure
R Universal gas constant
T Temperature
Tam Ambient Temperature
𝛥H Enthalpy change

1
1 INTRODUCTION
1.1 Motivation, problem statement and brief review
Energy is an essential source for application in domestic and industrial activities.
However, the energy production and usage can lead to environmental, economic and
social impacts. The production of energy through combustion of fuel like coals
normally lead to the problem of global warming caused by the rapidly increasing
emissions of greenhouse gases such as carbon dioxide (CO2) and methane.
Previously, one of the approaches to produce energy is by burning coals through
combustion or gasification processes (Boqiang and Ouyang, 2014). The combustion and
gasification processes utilizing coal leads to the increased carbon dioxide emissions and
over ash accumulation which leads to the greenhouse effect (Salleh et al., 2009). The
coal is one of the types of fossil fuels which is non-renewable type of fuels. Therefore,
the coal can be short-run sometimes in the future and also affecting the environment
through the mass production of carbon dioxide. Since some of the electric utilities are
consumed of fossil fuels from the coal, therefore an alternative for the energy
production is then necessary (Patrik, 2001).
Increasing of global concern on the environmental issues and decreasing the
dependence to the fossil fuels leads to the use of renewable energy (Galindo et al.,
2014). Renewable energy becomes an alternative energy technologies which use feed
stocks like biomass, biogas or, solar to meet the future energy demand (Galindo et al.,
2014). It will not give adverse effect on the environment when compare to the fossil
fuels (Canbing et al., 2014).
Currently, enormous efforts have been done to recycle waste materials to produce
energy where the major proportions of waste materials are the biomass materials.
Gasification process is not a new technology but it is quite new technology for most of
the peoples and thus, the introduction of the technology requires research to identify the
potential benefits, and the potential risks to convince people to use this type of
technology. For the analysis, there is a need to consider a detail characteristics and
potential of the technology which may include the amount of energy can be produced

2
from the production and the effect of any condition change on the energy production
rate.
Biomass becomes one of the most promising renewable energy sources due to its
abundance, energy content, and the low emissions of carbon dioxide to the atmosphere
(Gao et al., 2008). Usually, the energy from biomass materials may come from plant
sources, such as wood from natural forests, waste from agricultural, forestry processes
and industrial or human and animal wastes (Twidell, 1998). Biomass gasification
produces syngas through thermo chemical conversion of biomass, usually involving
partial oxidation of feedstock in the presence of air, oxygen or steam (Li et al., 2004). In
Malaysia particularly, the biomass materials such as wood, rice husk, empty fruit bunch
and sawdust are cheap abundant resources and therefore can be utilized for energy
production using biomass gasification process. Here, the biomass gasification is one of
the approaches to convert these biomass materials to energy where it is an attractive
solution to solve both waste disposal and energy problems by producing fuel gas like
hydrogen (Karmakar and Datta, 2011). Hydrogen is one of the clean energy sources and
a potential alternative fuel. The combustion of hydrogen does not negatively affect the
environment.
Nowadays, many gasification technologies to exploit biomass abundances such as
downdraft and fluidized bed gasifier are used to produce of electricity, heat, chemicals
and liquid fuels. Technically, there are two groups of biomass gasification models to
represent downdraft or fluidized bed gasifications which are equilibrium approach and
kinetic approach. Kinetic models predict the progress and product composition at
different positions along a reactor, whereas equilibrium model predicts the maximum
achievable yield of a desired product from a reacting system (Li et al., 2004).
Kinetic models concern on the chemical kinetics of the main reactions and the transfer
phenomena among phases, estimating the composition of each species on any point of
space and time of a system. The kinetics models are specified in general for each
process by providing important considerations on the chemical mechanisms and to
increase the reaction rates and the overall process performance. However, the kinetic
models always contain parameters which make them hardly applicable to different
plants (Schuster et al., 2001). An accurate description of the chemical kinetic rate

3
expression is a key issue. The choice of chemical kinetic laws is difficult because there
are as many kinetic laws as kinetic studies. A large discrepancy can be observed
between them and it is highly hazardous to extrapolate literature results obtained under
different operating conditions (Avdhesh, 2008). For example, the steam and carbon
dioxide reforming reactions of char are kinetically limited at temperatures lower than
1000°C (Koroneos and Lykidou, 2011).
Although kinetic models provide essential information on mechanisms and rates,
equilibrium models are more suitable as it can predict thermodynamic limits to design,
evaluation and improve a process. Equilibrium model also provides a useful design aid
in evaluating the limiting possible behaviour of a complex reacting system which is
difficult or unsafe to reproduce experimentally or in commercial operation. It provides
the greatest possible conversion of each species regardless the system size and the time
needed to reach equilibrium. These models do not require details of system geometry
neither estimate the necessary time to reach that equilibrium (Karmakar and Datta,
2011).
The increase of global concern on environmental issues had led to the finding of
alternative ways to produce energy. One of the most promising ways of energy
production is through the use of renewable energy like biomass gasification process.
Since the gasification models can be divided into two groups that are equilibrium
approach and kinetic approach, the comparison between both types of model had been
done. Among them the most effective and applicable model is the equilibrium model
due to its behaviour and operation system.
1.2 Objectives
The following are the objectives of this research:
i) To investigate and analyse the performance of downdraft biomass
gasification using thermodynamic equilibrium model using wood, rice husk,
empty fruit bunch and sawdust.
ii) To investigate and analyse the performance of fluidized bed biomass
gasification using thermodynamic equilibrium model using wood, rice husk,
empty fruit bunch and sawdust.

4
iii) To optimize the important parameters in term of gasifier temperature,
moisture content, steam biomass ratio and carbon conversion for downdraft
and fluidized bed gasification.
iv) To compare the performance of downdraft and fluidized bed biomass
gasification under nominal operating condition and optimal condition.
1.3 Scope of this research
The following are the scope of this research:
i) Analysis of the performance downdraft biomass gasification using
thermodynamic equilibrium model using wood, rice husk, empty fruit bunch
and sawdust.
ii) Analysis of the performance fluidized bed biomass gasification using
thermodynamic equilibrium model using wood, rice husk, empty fruit bunch
and sawdust.
iii) Optimization of the parameters in the downdraft and fluidized bed
gasification for better and improved performance.
iv) Performance comparison analysis between downdraft and fluidized bed
biomass gasification under nominal operating condition and optimal
condition.
1.4 Main contribution of this work
The following are the contributions
a) Development a generic equilibrium thermodynamic model that is capable to
apply for a wide range of biomasses
b) The optimum condition for biomass gasifier such as downdraft and fluidized bed
can be determined to maximize the hydrogen production
c) Performance validation between experimental data from journal and the
developed equilibrium model
1.5 Organisation of this thesis
The structure of the reminder of the thesis is outlined as follow:

5
Chapter 2 provides a description of the gasification, the type of gasifier, thermodynamic
equilibrium model and previous studies on biomass. For gasification part, the process
and the product from gasification will be described. The comparison on the gasifier types
is made and reviewed to provide the best types of gasifier to be used. Thermodynamic
model will be reviewed and the model used to represent the biomass gasification is
analysed. A summary of the previous work on various type of biomass give an overview
on the type of biomasses used.
Chapter 3 is the explanation on the step by step on how the whole procedures were done
in this work. These procedures were implemented in order to analyse the performance of
gasification process.
Chapter 4 shows the excel calculation of thermodynamic model and summaries of the
work done. Excel is use since it is user friendly where here user can easily make decision
on the type of gasifier, type of biomass, and operating condition in order gets the
composition of gas produced.
Chapter 5 is the result of performance analysis that had been done in excel sheet. In this
chapter, the thermodynamic model validation is made by comparing the model data with
the work in Zainal et al., (2001) for downdraft gasifier and Karmakar and Datta.,(2011)
for fluidized bed gasifier. The biomass is then tested in downdraft and fluidized bed
gasifier at different condition to find out the most optimum condition and most efficient
biomass in both gasifier.
Chapter 6 is the conclusion of this final year project includes the overview on the
previous work, objective, scope of studies, contribution, the whole procedure on how the
work is to be done, the result of this analysis and the summaries of the work.

6
2 LITERATURE REVIEW
2.1 Overview
This paper presents the review of gasifier using different type of biomasses. The main
purpose of this analysis is to review the performance of gasifier in order to facilitate the
selection of the gasifier in term of the energy production. The analysis is based on many
factors like type of gasifier, the biomasses used and the parameter used to test the
performance.
2.2 Gasification Process
The use of the forest biomass, agricultural or animal residues as a source of energy
contribute to lower energy dependency on fossil fuels and in such a way reducing
greenhouse gases emissions (McKendry, 2002). Gasification is one of the ways to
produce energy from the biomass. Typically, gasification is a thermo-chemical
conversion technology or partial combustion process to convert biomass materials into
energy through partial oxidation where solid fuel are transform into gas product (Bi and
Liu, 2010). A limited amount of air that supplied to biomass gasifier will leads to
burning of a relatively small part of biomass which generates heat to maintain a series
of thermochemical processes. During gasification four main processes occur inside the
reactor which is drying, pyrolysis, oxidation and reduction, and each of these processes
has certain physical and chemical features (Felipe., 2012). During gasification process,
the biomass is heated to a high temperature, which causes a series of physical and
chemical changes that result in the production of volatile products and carbonaceous
solid residues. The gasification process uses an agent, either air, oxygen, hydrogen or
steam to convert carbonaceous materials into gaseous products. Steam may be added
from an external source or from the dehydration reactions of crop residues. Compared to
air gasification, steam gasification produces a higher energy based on the gas produced.
(Sadaka, 2013).
The main gas produced by gasification is the synthesis gas or syngas which is a mixture
of carbon monoxide, hydrogen, methane, carbon dioxide and nitrogen (Chen et al.,
2007). The composition of this gas depends on several factors such as the type of
biomass used in the process, the temperature and the type of gasification agent

7
(McKendry., 2002). The syngas can be directly used as a gaseous fuel and can be
processed further to produce electricity and heat. Usually, this gas is burned to produce
heat and steam or used in the gas turbines to produce electricity (Babu and Sheth.,
2006). The efficiency of gasification is based on the biomass material, particle size, gas
flow rate and design of the gasifier. Gasifier can be grouped based on the direction of
gas flow such as updraft, downdraft, cross draft and fluidized bed (Avdhesh., 2008).
2.3 Types of Gasifier
The differences of properties in chemical, physical and morphological of biomass lead
to the different methods of gasification or gasification technologies (Karmakar and
Datta, 2011). The study of biomass gasification has been conducted extensively by
researchers around the world. The selection of gasifier is determined by their different
features. Different gasifiers have different operation mechanism. In gasifiers, as air or
steam passed through the fuel bed, fairly discrete drying, pyrolysis, gasification and
oxidation zones develop along the reactor. The location of these zones in the gasifier
depends on the relative movement of the fuel and air (Sadaka., 2013).
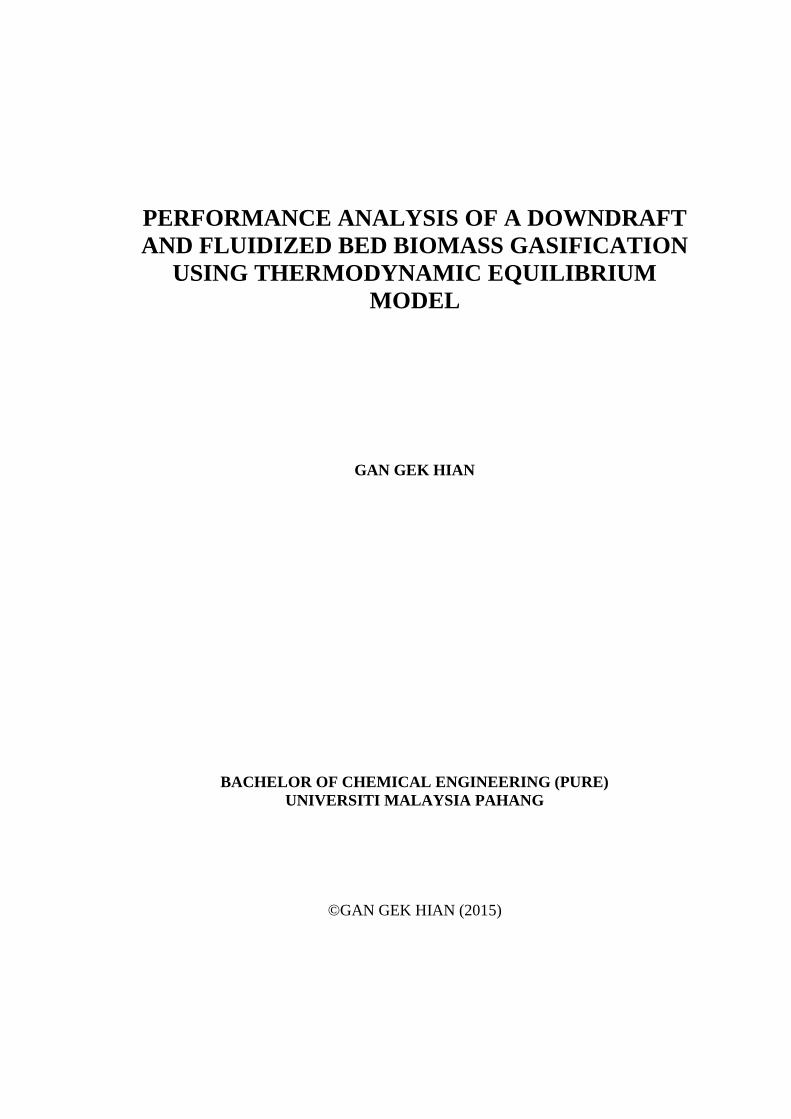
Figure 2-1 illustrates the flow of the fuel and gases in the moving bed gasifier. Most of
these types of gasifiers are used with oxygen and steam injected into the bottom of the
reactor while the biomass material is fed at the top, producing a counter-current flow.
The raw fuel gas flows relatively slowly upward through the bed of biomass feed and
cools by drying the biomass. This process allows a lower syngas temperature at the
output (400 °C -500 °C), avoiding the needing of an expensive cooling system. Ash
may be either dry or slag depending on the steam/oxygen ratio and the melting
characteristics of the mineral matter. This gasifier produced syngas has a high heating
value due to the high methane content and the consumption of oxygen in the reactor is
very low. As a result, the thermal efficiency of the process is very high.
8
Figure 2-1: Moving Bed Gasifier ( adopted from Garcia et al., 2009)
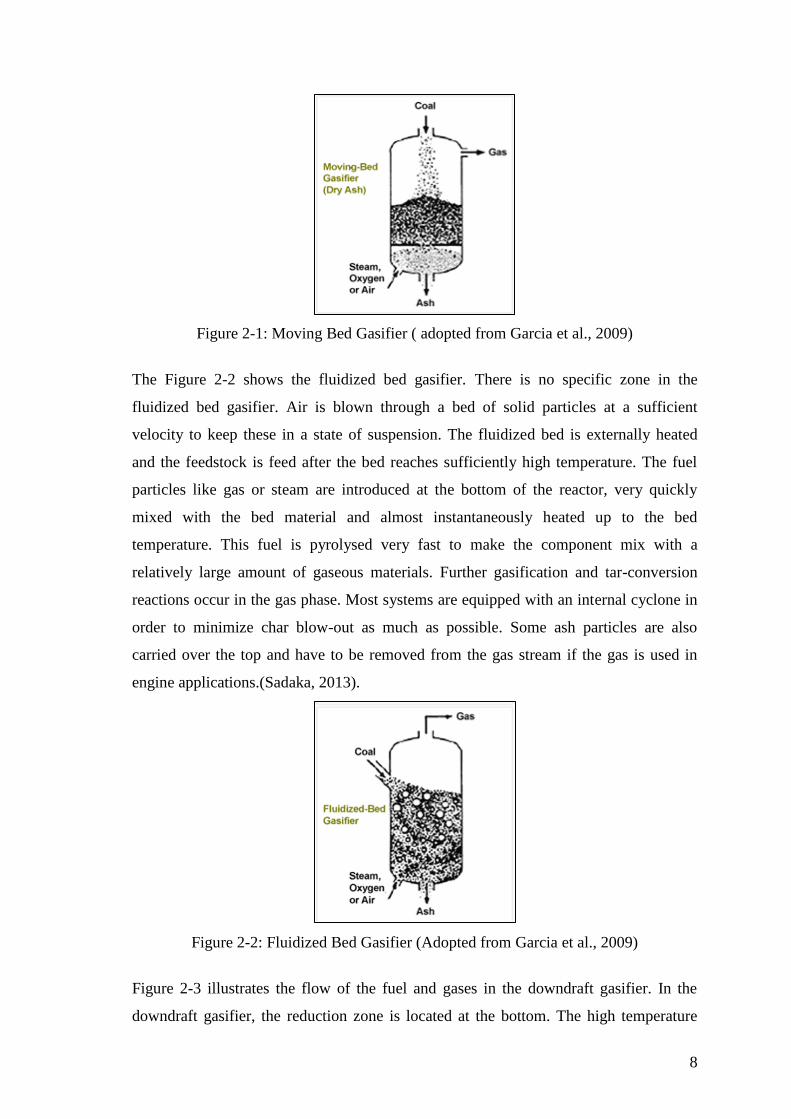
The Figure 2-2 shows the fluidized bed gasifier. There is no specific zone in the
fluidized bed gasifier. Air is blown through a bed of solid particles at a sufficient
velocity to keep these in a state of suspension. The fluidized bed is externally heated
and the feedstock is feed after the bed reaches sufficiently high temperature. The fuel
particles like gas or steam are introduced at the bottom of the reactor, very quickly
mixed with the bed material and almost instantaneously heated up to the bed
temperature. This fuel is pyrolysed very fast to make the component mix with a
relatively large amount of gaseous materials. Further gasification and tar-conversion
reactions occur in the gas phase. Most systems are equipped with an internal cyclone in
order to minimize char blow-out as much as possible. Some ash particles are also
carried over the top and have to be removed from the gas stream if the gas is used in
engine applications.(Sadaka, 2013).
Figure 2-2: Fluidized Bed Gasifier (Adopted from Garcia et al., 2009)
Figure 2-3 illustrates the flow of the fuel and gases in the downdraft gasifier. In the
downdraft gasifier, the reduction zone is located at the bottom. The high temperature

9
oxidation zone is located at the above the reduction zone of the gasifier where part of
the fuel is burned. The gasifying agent is injected at the bottom of the reactor and
ascends from the bottom to the top while the feedstock is introduced at the top of the
reactor and descends from the top to the bottom. The fuel descends through three zones
which are drying, pyrolysis and oxidation zone of progressively increasing temperatures.
The oxidation zone lies at above the injected air of the gasifier and the combustion gas
passes through this zone reacting with the char produce heat. The produced gases, tar
and other volatiles disperse at the top while ashes are removed at the bottom of the
reactor. Part of the fuel is burned in the oxidation zone. The high tar content is not a
major problem if the producer gas is used for direct heat applications. However, it
requires thorough cleaning for internal combustion engine applications.
Figure 2-3: Downdraft Gasifier(adopted from Sadaka., 2013)
Table 2-1: Advantage and Disadvantages of Each Type of Gasifier.
Type of
Gasifier
Advantages Disadvantages
Moving-bed
Gasifier
• Lower the pressure drop • Suffer from high tar yields
• inability to maintain uniform
radial
• poor response to load
change(Beenackers, 1999; Babu,
1995).
Fluidized
beds Gasifier
• High Heating value (HHV) (Schuster et al., 2001).
• increase the bunker flow
• lower the pressure drop
• poor response to load
change(Kent.A.J .,
10
• lower the slagging
• Feedstock steam are flexible
• High heat and mass transfer
rates(Salleh et al., 2009).
Downdraft
Gasifier
• comparatively cheaper
• produces relatively low tar during
gasification
• can achieve a higher hydrogen
content (Giltrap et al., 2003)
• High ash content(Sadaka. , 2013)
From the comparison, moving bed had less advantages and more disadvantages
compare to the other gasifiers. The fluidized bed gasifier and downdraft gasifier is
seems to be more applicable when compare with moving bed gasifier. The fluidized bed
had poor response to load change which this problem also faced by the moving bed
gasifier so it is better to choose gasifier with more advantages. The high ash content in
downdraft will not be a big problem if there are consistent waste management of the
remains ash.
Many researchers investigated hydrogen production from biomass gasification in a
fluidized bed and only a few studies explore hydrogen-rich gas production in a
downdraft gasifier (Pengmei Lva et al., 2007). More studies should be done on the
downdraft since both type of gasifier has an ability of hydrogen gas production and a
proper comparison between these two types of gasifier should be done to analyse the
performance of these gasifier.
2.4 Thermodynamic Equilibrium Model
Traditionally, the simulation of gasifier may be carried out by thermodynamic
equilibrium modelling, kinetic modelling, numerical modelling and artificial neural
network (Budhathoki et al., 2013). The important parameters such as moisture content,
equivalence ratio, producer gas composition and heating value of gas have been
analysed in chemical equilibrium approach (Pitchandi, 2012). A mathematical model is
developed to predict performance of a biomass gasifier. The model is mostly used to
study of process parameters such as reactor temperature, steam biomass ratio and
moisture content which generally influence the percentage of hydrogen content in the
product gas (Avdhesh, 2008).

11
Thermodynamic equilibrium never takes place in real gasification process (Chowdhury
et al., 1994) but many works demonstrate the use of equilibrium model. Researchers
used the equilibrium model based on the minimization of Gibbs free energy to analyses
the gasification process and also to solve the optimization and non-linear equation
problems based on the gasification process. Equilibrium model can also based on the
equilibrium constant. However, equilibrium model based on the minimization of Gibbs
free energy and equilibrium constants are of the same concept (Li et al., 2001; Altafini
et al., 2003). Some of the models have been developed based on thermodynamic and
chemical kinetics to find out the temperature and rate of feedstock consumption in the
pyrolysis zone (Sharma, 2008; Kaosol and Sohgrathok, 2013). Schuster et al. (2001)
also developed a model for steam gasification of biomass applying thermodynamic
equilibrium calculations that combined heat and power station based on a dual fluidized
bed steam gasifier.
Zainal et al. (2001) used the equilibrium constant equilibrium model to predict the
performance of gasifier. It was observed that the calorific value of the producer gas
decreases with increase in moisture content and the gasification temperature. The
amount of oxygen in that model was eliminated by defining it to some components in
producer gas. This model can predict the reaction temperature by knowing the amount
of oxygen, and vice versa. The coefficients determined from the comparison of the
predicted results with the experimental results from other works can be multiplied with
the equilibrium constants to improve the model. Equilibrium models convert species
regardless of the system size and the time needed to reach equilibrium (Rodrigues et al.,
2009).
From Zainal et al. (2001), the equilibrium model assumes that all the reaction are in
thermodynamic equilibrium. It is expected that the pyrolysis product burns and achieves
equilibrium in the reduction zone before leaving the gasifier, hence an equilibrium
model can be used in the downdraft gasifier.
The reaction involve in the gasification process are as follows:
Steam gasification
C +CO2 =2CO (1)
Boudouard reaction
C+H2O =CO +H2 (2)
12
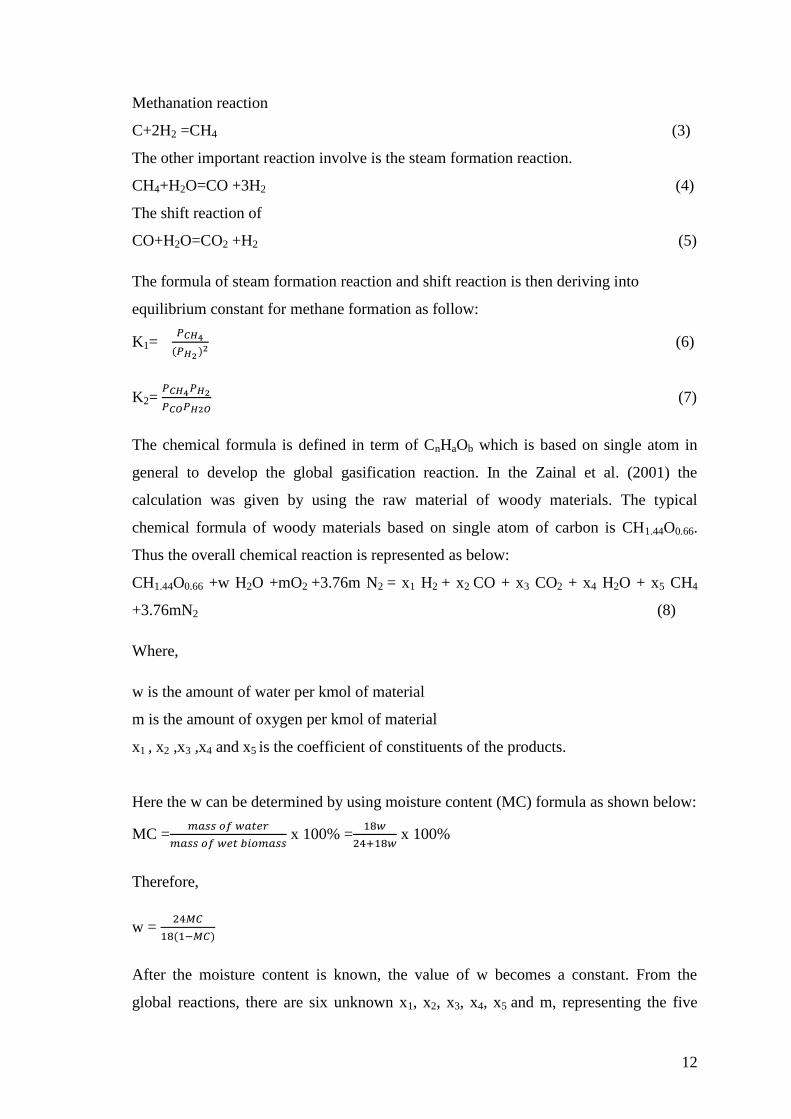
Methanation reaction
C+2H2 =CH4 (3)
The other important reaction involve is the steam formation reaction.
CH4+H2O=CO +3H2 (4)
The shift reaction of
CO+H2O=CO2 +H2 (5)
The formula of steam formation reaction and shift reaction is then deriving into
equilibrium constant for methane formation as follow:
K1=
(6)
K2=
(7)
The chemical formula is defined in term of CnHaOb which is based on single atom in
general to develop the global gasification reaction. In the Zainal et al. (2001) the
calculation was given by using the raw material of woody materials. The typical
chemical formula of woody materials based on single atom of carbon is CH1.44O0.66.
Thus the overall chemical reaction is represented as below:
CH1.44O0.66 +w H2O +mO2 +3.76m N2 = x1 H2 + x2 CO + x3 CO2 + x4 H2O + x5 CH4
+3.76mN2 (8)
Where,
w is the amount of water per kmol of material
m is the amount of oxygen per kmol of material
x1 , x2 ,x3 ,x4 and x5 is the coefficient of constituents of the products.
Here the w can be determined by using moisture content (MC) formula as shown below:
MC =
x 100% =
x 100%
Therefore,
w =
After the moisture content is known, the value of w becomes a constant. From the
global reactions, there are six unknown x1, x2, x3, x4, x5 and m, representing the five

13
unknown species of the product and the oxygen content for the reaction. Therefore, six
equations are required, which are formulated below:
Carbon balance:
1= x1 + x2 + x3 + x4 + x5 (9)
Hydrogen balance:
2w + b= 2x1 + 2x4 + 4x5 (10)
Oxygen balance:
w + a +2m = x2 + 2x3 + x4 (11)
Equilibrium constant from methane formation (Equation (6)):
K1=
(12)
Equilibrium constant from shift reaction (Equation (7)):
K2 =
(13)
In order to find the value for the unknown most of the equation had been derived in
term of heat change in term of temperature. The first stage of derivation is to find the
value of K1 and K2 in term of temperature.
The heat of formation equation for the formation of 1mol of solid biomass (CH1.44O0.66)
from solid carbon, hydrogen and oxygen is:
C (sol) +0.72 H2 (g) + 0.33O2 CH1.44O0.66 (14)
and in the reality, the reaction cannot occur. The formation of CH1.44O0.66 is based on
the following reactions:
C + O2 CO2 𝛥Hc= -393509
0.72 H2 +0.36 O2 0.72 H2O 𝛥Hc= -241818 x(0.72)
CO2 + 0.72 H2O CH1.44O0.66+ 2.06 O2 𝛥Hc= 449568
C + 0.72 H2O + 0.33 O2 CH1.44O0.66 𝛥Hf =-118050 kJ/kmol
Therefore, the heat of formation of materials is -118050kJ/kmol. Hence, the heat of
formation for any biomass material can be determined if the ultimate analysis and the

14
heating values of the material are known. The heating value can be determined
experimentally by bomb calorimeter, the heat of formation of any biomass material can
be calculated with good accuracy from the following:
𝛥Hc =HHV (kJ/kmol) =0.2326(146.58 C+56.878 H -51.53 O - 6.58 A + 29.45) (15)
Where C, H, O, and A are the mass fractions of carbon, hydrogen, oxygen and ash,
respectively, in the dry biomass. The chemical formula of any biomass material can be
determined if the ultimate analysis is known. At constant pressure, the specific heat can
be written as:
Cp = (
)P (16)
Or
dH = CpdT (17)
𝛥 H=∫
dT (18)
Where H is the enthalpy and T is the temperature.
Equation (18) can be written as
𝛥 H =Cpmh (T2 - T1) (19)
Where Cpmh is the average specific heat over the temperature change 𝛥T = T2 – T1 with
T2 is the gasification temperature at reduction zone and T1 is the ambient temperature at
the reduction zone.
Cpmh = ∫
) (20)
The dependence of specific heat on the temperature is given by an empirical equation
and the most simplified version is:
Cpmh =R (A +BTam + C/3 (4 –T1T2)+
) (21)
Where Tam = (T1 +T2) /2 is the arithmetic mean temperature and R is the universal gas
constant (8.314 J/mol K).The constant A, B, C and D for Cp is taking from the Smith et
al. (2005). The enthalpy changes, 𝛥H, can be obtained using Equation (19). The
equilibrium constant K is a function of temperature only and is written as follows:
-RTln K=𝛥G0, (22)