Embed Size (px)
Citation preview
Annual Performance Analysis
FY10
JULY 1, 2009 ‐ JUNE 30, 2010
FY10 Annual Performance Analysis Page 1 of 51
Table of Contents 1. MANAGEMENT SUMMARY ........................................................................................................................... 5 2. STRATEGIC GOALS AND STRATEGIC PLANNING ..................................................................................................... 5 Summary of Agency FY 10 Strategic Initiatives ............................................................................................ 6 New Strategic Initiatives for FY 11 .............................................................................................................. 7
3. FY 10 PROGRAM INITIATIVES ........................................................................................................................ 8 Administration ......................................................................................................................................... 8 Clinical and Prevention Services ................................................................................................................. 9 Community Support Services ................................................................................................................... 10
4. AGENCY OUTCOMES AND PERFORMANCE IMPROVEMENT MEASURES ...................................................................... 10 Administration ....................................................................................................................................... 10 Outcomes........................................................................................................................................... 10 Objectives for the Coming Year ............................................................................................................ 11
Clinical and Prevention Services ............................................................................................................... 11 Adolescent Substance Abuse ............................................................................................................... 11 Outcomes ..................................................................................................................................................11 Objectives for the Coming Year.................................................................................................................12
Adult Substance Abuse ........................................................................................................................ 13 Outcomes ..................................................................................................................................................13 Objectives for the Coming Year.................................................................................................................14
Adult Mental Health............................................................................................................................ 14 Outcomes ..................................................................................................................................................14 Objectives for the Coming Year.................................................................................................................15
Charles City/ New Kent........................................................................................................................ 15 Outcomes ..................................................................................................................................................15 Objectives for the Coming Year.................................................................................................................16
Children and Family............................................................................................................................. 16 Outcomes ..................................................................................................................................................16 Objectives for the Coming Year (all Y & F) ................................................................................................18
Court Assessment and Treatment ........................................................................................................ 18 Outcomes ..................................................................................................................................................18 Objectives for the Coming Year.................................................................................................................19
Dialectical Behavior Therapy (DBT) ....................................................................................................... 19 Outcomes ..................................................................................................................................................20 Objectives for the Coming Year.................................................................................................................21
Emergency Services............................................................................................................................. 21 Outcomes ..................................................................................................................................................22 Objectives for the Coming Year.................................................................................................................22
Lakeside Center .................................................................................................................................. 22 Outcomes ..................................................................................................................................................22 Objectives for the Coming Year.................................................................................................................24
MH Case Management ........................................................................................................................ 24 Outcomes ..................................................................................................................................................24 Objectives for the Coming Year.................................................................................................................25
MH Vocational Services ....................................................................................................................... 25
FY10 Annual Performance Analysis Page 2 of 51
Outcomes ..................................................................................................................................................25 Objectives for the Coming Year.................................................................................................................26
MH PACT............................................................................................................................................ 27 Outcomes ..................................................................................................................................................27 Objectives for the Coming Year.................................................................................................................28
MH Residential ................................................................................................................................... 28 Outcomes ..................................................................................................................................................28 Objectives for the Coming Year.................................................................................................................29
MH Support Services ........................................................................................................................... 29 Outcomes ..................................................................................................................................................29 Objectives for the Coming Year.................................................................................................................30
Prevention.......................................................................................................................................... 30 Outcomes ..................................................................................................................................................30 Objectives for the Coming Year.................................................................................................................32
Community Support Services ................................................................................................................... 33 CSS Intake .......................................................................................................................................... 33 Outcomes ..................................................................................................................................................33 Objectives for the Coming Year.................................................................................................................33
CSS Day Services ................................................................................................................................. 34 Outcomes ..................................................................................................................................................34 Objectives for the Coming Year.................................................................................................................36
CSS Case Management ........................................................................................................................ 36 Outcomes ..................................................................................................................................................36 Objectives for the Coming Year.................................................................................................................37
CSS Individual Supported Employment ................................................................................................. 37 Outcomes ..................................................................................................................................................37 Objectives for the Coming Year.................................................................................................................38
CSS Residential ................................................................................................................................... 38 Outcomes ..................................................................................................................................................38 Objectives for the Coming Year.................................................................................................................39
Parent‐Infant Program......................................................................................................................... 39 Outcomes ..................................................................................................................................................39 Objectives for the Coming Year.................................................................................................................40
5. POST DISCHARGE INFORMATION FOR CARF SERVICES ............................................................................................ 40 6. SATISFACTION ............................................................................................................................................ 41 Adult Services‐ MHSIP ............................................................................................................................. 41 Youth Services‐ YSSF ............................................................................................................................... 41 Intellectual disability Services‐ Family Satisfaction Survey .......................................................................... 42 Agency Satisfaction surveys ..................................................................................................................... 42
7. FY 11 MANAGEMENT, ADMINISTRATIVE AND PROGRAM INITIATIVES....................................................................... 43 Management.......................................................................................................................................... 43 Administration ....................................................................................................................................... 43 Clinical and Prevention Services ............................................................................................................... 44 Community Support Services ................................................................................................................... 44
8. QUALITY HEALTH INFORMATION................................................................................................................... 45 Outcomes .............................................................................................................................................. 45
FY10 Annual Performance Analysis Page 3 of 51
Objectives for the coming year ................................................................................................................ 45 9. RISK MANAGEMENT / INCIDENTS AND COMPLAINTS ........................................................................................... 45 Outcomes .............................................................................................................................................. 45 Objectives for the coming year ................................................................................................................ 46
10. STAFF TRAINING .................................................................................................................................. 47 Outcomes .............................................................................................................................................. 47 Objectives for the coming year ................................................................................................................ 47
11. CULTURAL AWARENESS AND COMPETENCY .................................................................................................. 47 Outcomes .............................................................................................................................................. 47 Objectives for the coming year ................................................................................................................ 48
12. DEMOGRAPHICS .................................................................................................................................. 49 13. BUDGET ............................................................................................................................................ 51
FY10 Annual Performance Analysis Page 4 of 51
1. MANAGEMENT SUMMARY Despite an economy that presents many challenges, the Board and staff of Henrico Area Mental Health and Developmental Services are committed to maintaining the high level of quality for which the agency is known and exercising the stewardship of public resources that is expected. In the past year we have taken several positive steps in promoting the vision of a recovery oriented system of care, better integrating mental health and substance abuse treatment services, and preserving and expanding employment opportunities for persons with intellectual disabilities. The Board has been actively engaged in developing successful strategies for maintaining employment options for people with intellectual disabilities in a down economy. Recent job development efforts have included use of social networking sites. We have also significantly expanded and improved day services for adults with a mental illness by renovating and expanding Lakeside Center. We continue to expand the use of evidence based and promising practices. Staff and Board members continue to have an active presence in the Virginia Association of Community Services Boards and the National Association of County Behavioral Health & Developmental Disabilities Directors. As we prepare for the future, we are focused on creating increased efficiencies through a totally electronic health record and the expanded use of technology. We will continue to improve clinical and rehabilitative services based on outcomes, consumer and family feedback and new research in our fields. We foresee a growing role in coordinating behavioral health and intellectual disability services with primary healthcare. In this way we can begin to lessen the health outcome disparities experienced by many of the people we serve. We continue to be proud of the work we do that promotes public safety. Through partnerships with the Divisions of Police and Fire and the Sheriff, the Crisis Intervention Team provides a coordinated response to persons in crisis from specially trained law enforcement, EMS and mental health staff. Over 230 first responders from the four agencies have already been trained. Of the 1555 emergency mental health evaluations conducted this year, 804 were performed while the individual was in police custody. Henrico Area Mental Health & Developmental Services continues to serve a large number of our citizens. In this fiscal year, 8,377 individuals were served. None of our work could be done without the support and commitment of the Henrico County Board of Supervisors and the Boards of Supervisors of Charles City and New Kent Counties. Their ongoing support and commitment enables us to provide essential services to the community’s most vulnerable citizens and their families with a dedicated and well trained staff. Karen Grizzard Michael D. O’Connor, L.C.S.W. Board Chairperson Executive Director
2. STRATEGIC GOALS AND STRATEGIC PLANNING In FY10 the agency continued their evolving road map process for a high performing learning organization. Progress on FY10 initiatives was assessed and incorporated within agency procedures. In addition, the agency underwent a strategic planning process to update our strategic plan. Due to the passing of National Healthcare Reform by the Obama administration, proposed changes to funding by a new Governor and the anticipated rapidity of changes that are to follow, an expedited strategic planning process was initiated to
FY10 Annual Performance Analysis Page 5 of 51
develop our working Strategic Plan for FY 11– 13. The process included review of input received from stakeholders throughout the year, a SWOT analysis, and Leadership Group discussion to identify strategic directions. The resulting goals were endorsed by the Community Services Board. SUMMARY OF AGENCY FY 10 STRATEGIC INITIATIVES Below outlines the results of the progress made on the three FY10 initiatives:
Goal 1: Enhance Accountability: To develop and implement the most efficient means possible to meet extensive new and anticipated regulatory, code driven and policy driven requirements including various system and client assessment requirements, performance contract driven continuous quality improvement (CQI) activities and current and expected code mandated activities.
Strategies:
• Implement new approach to Person Centered Planning (PCP) using the new assessment instrument Support Intensity Scale, (SIS)
• Implement preauthorization for Medicaid SPO services • Implement Quality Improvement Measures as required in the State Performance Contract
Outcomes: Community Support Services case managers, day program and residential staff were trained in person centered planning requirements. Case Managers were trained as Support Intensity Scale administrators. Processes were put in place to implement the new PCP and SIS requirements for all individuals receiving ID and DS waiver funding. One third of consumers funded through these waivers were assessed using the SIS and further assessment of remaining individuals is in process. Business processes were developed to initiate and manage utilization for prior authorization of Mental Health State Plan Option services. These services include Mental Health Support Services, Intensive Community Treatment, Psychosocial Services and Intensive In‐home services. The prior authorization process began with quarterly reviews in August 2009, with a completed implementation date of January 1, 2010. The quality improvement measures required in the performance contract were implemented and included: 1) telephone access to a qualified pre‐screener within 15 minutes, 2) face‐to‐face prescreening when needed within 1 hour, 3) ESP staff attendance at all commitment hearings, 4) face‐to‐face contact with all persons discharged from hospitals and preferring services from
HAMHDS, 5) completion of COMPASS self assessment tool for integrated treatment of co‐occurring mental
health and substance use disorders and CQI plans based on outcome developed, 6) completion of ROSI administrative and client assessment of agency recovery orientation for
adults with serious mental illness and CQI plan based on outcome developed These quality improvement measures were institutionalized within agency practices.
FY10 Annual Performance Analysis Page 6 of 51
Goal 2: Assure State of the Art Facilities: To develop a plan and strategy to meet major facility needs over the next 10 years.
Strategies: • Replace existing rental facility [East Center] and meet program and growth needs over the next
10 years • More efficiently meet program needs and address inadequate space in Central and Western
Henrico County [Woodman, Radford, ID Case Mgt] and accommodate growth over the next 10 years
Outcomes: A strategy and plan was outlined to address this goal. Yearly strategies were developed for the identified locations to include Capital Improvement Plan (CIP) applications for feasibility and program studies and construction. The plan includes building a facility for the East Center and expanding the Woodman Road location to house the Hermitage case management offices and the Radford office. Pending CIP approval, a cost study and general feasibility of interim rental space will be considered. This objective will continue as an Agency Strategic Initiative.
Goal 3: Improve Transportation: To evaluate and improve the efficiency and effectiveness of transportation services, including staff local travel and a variety of means of client transportation.
Strategies:
• Evaluate alternatives to current contracted transportation to day programs • Evaluate cost/benefit of becoming a Medicaid provider of transportation • Evaluate alternative systems of fleet management
Outcomes: The workgroup charged to research and evaluate the above objectives identified significant costs for all options explored. Consequently the goal was downsized to seeking to improve the efficiency of use and lower the cost of use of agency and personal vehicles. Monthly reports on agency vehicle usage are provided and staff has developed strategies that have significantly improved use. Due to this activity, one vehicle was surrendered to the County and several vehicles were reassigned.
NEW STRATEGIC INITIATIVES FOR FY 11 In early 2010, the agency completed a cycle of planning that included a SWOT [Strengths, Weakness, Opportunities, and Threats] analysis, stakeholder feedback, and an environmental scan, and discussed what successful implementation of these initiatives would look like. The information was collected and reviewed by the agency Leadership group, and the following four strategic initiatives were developed:
Goal 1. Develop a fully compliant electronic health record by 2013. • Strategies will include: mobile access for field based staff, electronic consumer signatures,
document scanning, and Anasazi upgrades. Goal 2. Assure readiness in all areas for the impact of healthcare reform.
FY10 Annual Performance Analysis Page 7 of 51
• Strategies will include closely tracking the implementation of healthcare reform in Virginia. Implications are not fully known but the following are anticipated: huge increase in Medicaid enrollees; increased emphasis on primary care integration; increased emphasis on coordination of care; increased use of managed care; increased emphasis on outcomes and comparative effectiveness. We will need to be proactive in influencing implementation in Virginia.
Goal 3. Assure continued provision of high quality outcome oriented service. • Strategies will include: a review of all programs where there are defined evidence‐based or
promising practices to be sure we are up to date; more closely linking outcomes to program decisions; supervisory development; assuring competitiveness; and evaluating any lines of business we should discontinue.
Goal 4. Meet facility related needs of the agency for the next 10 years. • Strategies will include: replacing an existing rental facility (East Center) to meet program and
growth needs over the next 10 years; more efficiently meeting program needs and address inadequate space in central and Western Henrico County (Woodman, Radford, ID Case Mgt) and accommodate growth over the next 10 years; and studying the cost, need and general feasibility in the current environment of obtaining interim rental space to meet our needs pending CIP approval of the plan outlined above.
Workgroups and champions were identified for each initiative. The groups were tasked with developing objectives, educating leadership, and establishing implementation plans and timelines with regular progress reports to the agency and Community Services Board.
3. FY 10 PROGRAM INITIATIVES ADMINISTRATION
Financial management Reduced office supply costs with a business supply recall initiative, where the agency asked for unused office supplies to be returned to a central place which reduced the number of office supply orders for the year
Worked with MH and ID to assist 19 consumers, with a total of 45 family members, to prevent eviction from their homes by providing short term rent or utility assistance through the Federal Homelessness Prevention and Rapid‐Rehousing Program
Implemented monthly vehicle usage reports; resulted in more efficient use of vehicles and one vehicle returned to County of Henrico
Reimbursement
Began submitting more claims electronically, thus saving on paper cost and staff time In response to new State pre‐authorization requirements, Reimbursement worked with IS to expand the Chart Tracker system to include a Pre‐Authorization Tracking System which facilitates processing Medicaid authorization requests in a timely and complete manner
Information Services
FY10 Annual Performance Analysis Page 8 of 51
Completed the Chart Tracker system; developed an Intranet database for Administrative staff to review and track charts in both the open and closed chart rooms, which virtually eliminated missing charts
Converted to a SQL Database Platform which significantly improved the reliability of the system, virtually eliminated the system “going down”, and efficiently managed the increased data housed on the system
Facilities
Reduced energy costs by implementing numerous suggestions, e.g. decreased number of lights on during business hours
Human Resources
Worked with the Agency’s Oracle Workgroup to review 24 position classifications. Major revisions were made to 11 position classifications and minor changes including agency name change were made to 11 classifications
Business Support
Implemented complex administrative support functions related to the Part C Transformation Initiative
Health Information Management
Worked with IS to expand the Chart Tracker system to include electronic chart review and reporting. All but one program now answer Chart review questions online, replacing the previous paper‐based review process. The reviews are automatically tabulated in the database and can be compared with previous years. This facilitates trending, teaching and ultimately improved compliance
Implemented an effective purging process which significantly thins active charts and removes old information which is then housed in the Closed Chart Room
CLINICAL AND PREVENTION SERVICES Adult Substance Abuse/ Adult Mental Health Services
Combined Adult SA with Adult MH; expanded co‐occurring treatment services for clients with both mental health and substance abuse diagnoses
Organized a community Cross Systems Mapping process to identify opportunities to keep appropriate persons with mental illness out of the correctional system
Long Term Mentally Ill Services
Completed expansion of Lakeside Center, doubling the square footage and increasing capacity
Embedded a clinician in CrossOver Ministry providing mental health services to the uninsured
Opened a new mental health support home for 4 individuals with serious mental illness
Emergency Services Initiated Henrico Crisis Intervention Team [CIT] with over 230 first responders trained
FY10 Annual Performance Analysis Page 9 of 51
Prevention Received the Department of Alcohol Beverage Control’s Community Coalitions grant for the Henrico Too Smart 2 Start Coalition and implemented the nationally recognized “Parents Who Host Lose the Most” campaign to prevent underage drinking
COMMUNITY SUPPORT SERVICES
Residential Services Changing from live‐in to 24 hour model
Parent Infant Program
Implementing System Transformation To expand treatment options, all therapists were trained in the Beckman Protocol to assess and develop treatment techniques for infants and toddlers with oral motor and feeding difficulties
Case Management Services
Implemented SIS and PCP Provided dental care to 40 individuals through a regional project
4. AGENCY OUTCOMES AND PERFORMANCE IMPROVEMENT MEASURES ADMINISTRATION Outcomes
Efficiency Objective: Complete non‐communication facility work orders in 5 days.
Results: Average of 9 days
Analysis/ Action Taken: Factors that affect work order and CSR turn around include: obtaining competitive quotes; purchase order process; scheduling conflicts with vendors and contractors; work orders that have been submitted late Friday evening are sometimes 3 days old before they are acknowledge or addressed by facilities on Monday; our current system has no way of separating business/working days from weekends; One Stop has lost 8 men in the last 12 months and has not rehired (they currently have 5 technicians covering all county buildings and have been informed that our priorities are not always their priorities); One Stop techs close work orders in their system once they have outsourced the job to an outside vendor or contractor even though the work has not been completed (This is one of the factors that make it difficult for us to obtain accurate number); One Stop techs turn in their completed work orders one to two times per week ; Communications require 7 business days for any work orders (CSRs) we send them; Blackberries take at least a week to order and receive from Verizon.
Performance Improvement: Work order turnaround time may be unrealistic taking into consideration the many factors and challenges. May need to increase turn around time to 7‐10 business days.
FY10 Annual Performance Analysis Page 10 of 51
Efficiency Objective: Unresolved return mail is less than 5% of total returned mail/open accounts (for open client accounts/client statements)
Results: 34%
Analysis/ Action Taken: The overall score for the year was 34% of returned mail for open cases that could not be forwarded. This was great improvement from the baseline of 63%. The front desk routinely verifies consumer addresses and there is an increase in verification during financials. The goal was not met primarily because of MH Case Management and SA Groups. There is not a formal process of checking in CM consumers at present. When they go on the Scheduler, this should improve this area. As of July, SA Groups are verifying addresses once a month, so this should improve the outcome in the coming year. Performance Improvement: This outcome will continue to be measured twice a year to ensure that we continue to move toward the 5% goal.
Objectives for the Coming Year Effectiveness Objective: 93% of SA Walk‐in clients will receive a financial on the day they walk in. Efficiency Objective: 95% of openings, closing, transfers will be accurate in Chart Tracker.
CLINICAL AND PREVENTION SERVICES
Adolescent Substance Abuse Outcomes
Effectiveness Objective: 10% increase in score on Outcome Rating Scale (ORS) between initial and fourth session.
Results: 11%
Analysis/ Action Taken: Adolescent Services explored client’s self‐rating improvements in areas of life functioning during this year. The objective that staff will address their client’s needs appropriately as evidenced by a 10% increase in score on Outcome Rating Scale (ORS) between initial and fourth session was met and exceeded. Overall progress made was show to be an 11% increase in ORS score between first and 4th sessions. Our sample size was based on 86 completed sets of the ORS. With this increase, scores indicated that clinicians are effectively addressing problems that clients are presenting with during the initial interview. Data also indicated that adolescents tended to rate problems minimally, especially when client was referred via court ordered or group home placement. 136 ORS scales were collected at initial assessment; however, no 4th session ORS was completed. Factors that could attribute to lack of follow up are: 1) failure of clinician to collect data, 2) client discontinued services/prematurely discontinued. Performance Improvement: In the upcoming year, Adolescent Services will participate in a pilot program of My Outcomes. ORS will be collected by every client at every session to track and monitor treatment progress. The expectation is that our programs can target potential drop‐out cases as well as monitor effectiveness of services more accurately.
FY10 Annual Performance Analysis Page 11 of 51
Efficiency Objective: 35 or higher on Session Rating Scale (SRS) at both initial and fourth session.
Results: 1st session = 37.79; 4th session = 34.75 Analysis/ Action Taken: Adolescent Services was interested in measuring clients’ self‐evaluation of therapeutic alliance. The objective that Staff will engage clients and monitor therapeutic alliance as evidenced by a score of 35 or higher on Session Rating Scale (SRS) at both initial and fourth session was met at 1st session and nearly met at the 4th session. In the first two quarters, SRS collected indicated a small sample of court‐ordered clients that scored clinicians low during 4th session. SRS in the second two quarters showed an increase in rating clinicians at the clinical cut‐off level of 35. Trainings, staff meetings, and increased awareness around engagement were factors that contributed to increase scoring. Staff highlighted that training on ORS/SRS with Scott Miller was helpful in administering the tool. Performance Improvement: In the upcoming year, SRS will be administered at every session and scored in real time in order for clinicians to use data with their clients to discuss any issues that could impact therapeutic alliance. It is a goal that using My Outcomes, SRS can help guide the therapist in approach/method, relationship builders, and goals and topics that are relevant and suitable for the clients.
Access Objective: Non‐crisis consumers will be seen within 5 business days of initial attempt to access services.
Results: 9.53 days average Analysis/ Action Taken: Adolescent Services did not meet the goal of seeing non‐crisis consumers within 5 business days of their initial attempt to access services during the 2010 fiscal year. The overall number of days to the 1st appointment averaged at 9.53 days. The overall number of days to the 1st appointment averaged at 13.1 days in the 2009 fiscal year. Efforts to improve rapid access to our services improved from last year to this year, indicating efforts to address deficits as being effective. In addition, our commitment to provide contract services to Crime Control and Henrico County Public Schools impacts the overall availability for accessing traditional outpatient services within our team. Performance Improvement: In the upcoming year, our team will explore ways to increase availability of outpatient initial interview slots.
Objectives for the Coming Year Effectiveness Objective: 10% increase in score on Outcome Rating Scale (ORS) between initial and fourth session. Efficiency Objective: 35 or higher on Session Rating Scale (SRS) at both initial and fourth session Access Objective: Non‐crisis consumers will be seen within 5 business days of initial attempt to access services.
FY10 Annual Performance Analysis Page 12 of 51
Adult Substance Abuse
Outcomes Effectiveness Objective: 60% of consumers will finish at least 16 sessions of the Building Abstinence group
Results: 49% Analysis/ Action Taken: At year’s end, 49% of participants completed 16 or more sessions of the Building Abstinence Group. This was below our baseline from last year of 56% and our overall goal of 60%. The following factors are likely to have contributed to the decrease: significant change in staffing in our program including the elimination of one position and a long term vacancy in another position. As a result of this, a staff member was moved to another location in an attempt to provide adequate coverage in services. Also, clients are faced with even greater barriers to getting to treatment given the current economy. Lack of jobs/income both personally and among family members and friends make it difficult to get into the office for appointments. Access to transportation to get into the office is a challenge for our clients under the best of circumstances. Performance Improvement: Based, in part, on these results we will be looking at possible changes in programming in an attempt to increase engagement and retention as well as assisting clients in meeting basic needs.
Efficiency Objective: 40% of consumers participating in the Building Abstinence groups will graduate from the program.
Results: 28% Recommendations/ Action Taken: 28% of eligible clients graduated from the Building Abstinence Group over the last year. This is lower than our baseline of 32% and lower than the national average of 40% successful completion in treatment. As discussed under Objective A, it is likely that the economy has had a large part to play in a lower rate of graduates this year. Both lost and vacant positions have meant less staff to provide services as well as the ongoing economic challenges and hardships faced by our clients and their families have likely contributed to fewer people being able to finish treatment. Performance Improvement: We will be looking at how programming changes may be able to address some of these issues in the fall of 2010.
Access Objective: 85% of clients admitted to the program will be seen within 5 days for the next available appointment following the initial walk‐in intake.
Results: 6.5 days
FY10 Annual Performance Analysis Page 13 of 51
Recommendations/ Action Taken: Annual results yield a 6.5 days average between the walk in date and the date of the second appointment for clients. Given the immediate access of the walk‐in clinic, a 6.5 day wait until the next appointment is viewed as positive. Performance Improvement: No changes to processes or programming will be made at this time based on these results.
Objectives for the Coming Year Effectiveness Objective: 10% of clients will show change on at least one NOMS data element during each treatment episode from July 1, 2010 to June 30, 2011. Access Objective: 85% of clients admitted to the program will be seen within 5 days for the next available appointment following the initial walk‐in intake.
Adult Mental Health
Outcomes Effectiveness Objective: Staff will actively engage clients in the treatment planning process as evidenced by client’s signature on ISP
Results: 78% Recommendations/ Action Taken: Staff follow through with creating an ISP that serves as a working document to guide therapy was variable. When we made it a priority to demonstrate at least a review of treatment goals as evidenced by a client signature on the ISP, staff responded to this requirement. Performance Improvement: Continue this objective, as it may require ongoing oversight to ensure adherence to this standard.
Effectiveness Objective: Clients will benefit from brief therapy as evidenced by increased GAF scores at the time of discharge.
Results: 63% Recommendations/ Action Taken: GAF scores are a subjective, therapist guided measure of client well being. While this measure does show that clients’ functioning does improve after participating in treatment, it may be beneficial to use the ORS/SRS scores from My Outcomes to get a better understanding of how clients benefit from individual therapy. Performance Improvement: Use the ORS/SRS scores from My Outcomes to get a better understanding of how clients benefit from individual therapy.
Efficiency Objective: Staff will engage clients and address their needs appropriately as evidenced by an increase in planned discharges
FY10 Annual Performance Analysis Page 14 of 51
Results: 69% Recommendations/ Action Taken: When a discharge is planned, we can infer that the therapy process was intentional. Goals were identified that clients and clinicians focus on in treatment. A planned discharge is a sign that the clinician engaged the client and then met their needs over the course of 10‐12 sessions. Performance Improvement: We will look at issues of retention and engaging clients through the discharge process in an attempt to increase the number of planned discharges and prevent dropping out of treatment prematurely.
Objectives for the Coming Year Effectiveness Objective: Staff will actively engage clients in the treatment planning process as evidenced by client’s signature on ISP. Effectiveness Objective: Staff will engage clients and address their needs appropriately as evidenced by an increase in planned discharges Effectiveness Objective: Clients will benefit from brief therapy as evidenced by increased GAF scores at the time of discharge.
Charles City/ New Kent
Outcomes Effectiveness Objective: Staff will actively involve clients in the treatment planning process as indicated by the client’s signature on the treatment plan within 30 days of case opening.
Results: 91.6% Recommendations/ Action Taken: This outcome was designed to address clinician’s timeliness on going over the treatment plan and getting client signatures. Once an administrative system was in place to identify ISP’s that needed signatures, this helped the process immensely. One area that needs attention is documentation of clinician going over ISP and client signature in progress note. Additionally, there is a small percentage of signatures that “slip through the cracks” as a result of cancellations/no shows and chart being place in filing before a clinician can address the ISP with a client. Performance Improvement: Address documentation of review of ISP with client in progress notes.
Efficiency Objective: 100% of children and adolescents seen for services will be assessed for and provided case management as indicated.
Results: 100% Recommendations/ Action Taken: Case management is a needed service in Providence Forge, Having the availability of time to provide services and document adequately is very difficult to juggle with heavy caseloads and outpatient services.
FY10 Annual Performance Analysis Page 15 of 51
Performance Improvement: We are looking at scheduling more efficiently in the next year.
Objectives for the Coming Year Effectiveness Objective: Show rate for appointments will increase by 10% following implementation of My Outcomes program. Effectiveness Objective: Planned discharges will increase by 10% following implementation of My Outcomes.
Children and Family
Outcomes
Effectiveness Objective: Staff will address their client’s needs appropriately as evidenced by a 10% increase in score on the Outcome Rating Scale (ORS) between the initial session and the fourth session.
Results: 20% Recommendations/ Action Taken: The Child and Family outpatient clinicians distributed the My Outcomes ‐ Outcomes Rating Scale (ORS) to clients during the 1st and 4th session in order to asses and address client’s needs more effectively during the FY 2010 reporting period. The team accomplished and surpassed the goal of a 10% increase between 1st and 4th session scores with an average increase of 20% over the year. This data suggests that clinicians are effectively addressing problem areas and goals as they are identified by clients. There was a significant increase in data collection as clinicians appeared to gain a better awareness of the clinical significance and use of the instrument following a training given by Scott Miller on the My Outcomes Program. However, there continued to be a significantly greater number of ORS forms collected during the 1st session as compared to the 4th session. Possible contributing explanations could have been that clients did not return for follow‐up sessions and/or clinicians failed to give the instrument at the follow‐up session. Performance Improvement: The Youth and Family Unit along with others in the agency will be piloting the My Outcomes Program in its entirety in the coming year. ORS will be collected during every session to track and monitor treatment progress. The expectation is that our programs can target potential drop‐out cases as well as monitor effectiveness of services more accurately.
Effectiveness Objective: Clinicians will address their clients’ needs appropriately and more effectively as evidenced by10% increase in overall scores on Case Discharge/Outcomes Form completed on each family at discharge. Results: 3.2%
Recommendations/ Action Taken: The intensive in‐home clinicians on the Child and Family Team used the Case Discharge/Outcomes Form to appropriately and more effectively
FY10 Annual Performance Analysis Page 16 of 51
address client needs. The overall goal was to achieve a 10% increase over a score of 67.8% achieved in the 1st quarter. The Case Discharge/Outcomes Form was actually completed by the clinician on each family at discharge with the idea that this would raise and maintain awareness of the expected outcomes. Although the team did not make the goal with an increase in scores of 3.2%, outcomes were favorable for families who completed treatment at an average of 79.55%. Other families either dropped out of treatment before engaging, discontinued treatment prematurely, were sent to detention early in treatment, funds were discontinued and the child was moved to a different location, or the child was moved to foster care after the family did not comply with a medical regimen. Data shows that the team is very effective with families who engage in and complete treatment, however, it is clear that the team could benefit continued focus and training regarding particularly challenging to engage cases. Performance Improvement: The team could benefit continued focus and training regarding particularly challenging to engage cases.
Efficiency Objective: Staff will engage clients and monitor therapeutic alliance as evidenced by a score of 35 or higher on Session Rating Scale (SRS) at both initial and fourth session.
Results: 1st session = 33; 4th session = 34
Recommendations/ Action Taken: The Child and Family outpatient clinicians distributed the My Outcomes – Session Rating Scale (SRS) to clients during the 1st and 4th session in order to engage clients and monitor therapeutic alliance during the FY 2010 reporting period. The team collected an average score of 34 at 4th session on the SRS for the year, 1 point below the established goal of 35. This data suggests that clinicians are effectively engaging clients and building therapeutic rapport. Therapeutic rapport has consistently been shown to be an essential ingredient in successful client outcomes in many studies and these scores may contribute to the positive outcomes achieved on the Outcome Rating Scale (ORS). Performance Improvement: The Child and Family Team will participate in piloting the My Outcomes Program in its entirety in the coming year. The SRS will be collected during every session with the goal of monitoring and enhancing therapeutic alliance, thereby improving client outcomes overall.
Access: Non‐crisis consumers will be seen within 5 business days of initial attempt to access services.
Results: 7.36 days average Recommendations/ Action Taken: The Child and Family Team did not meet the goal of seeing non‐crisis consumers within 5 business days of the initial attempt to access services. Although the average days to access services feel 2.36 days above the goal of 5 days, this was an improvement since the FY09 average by 2.34 days. The team has continued to monitor the number of days to access services throughout the year and has added initial
FY10 Annual Performance Analysis Page 17 of 51
intake slots when necessary. The highest number of days occurred when the team was actually down by one clinician for a number of months.
Performance Improvement: The team remains committed to lowering the number of days to access services and will continue to investigate ways to achieve this goal in the coming year.
Objectives for the Coming Year (all Y & F) Effectiveness Objective: With use of My Outcomes (SRS/ORS/CORS), staff participating in pilot will address their client’s needs appropriately as evidenced by a 10% decrease in no‐show/cancellation rates. Effectiveness Objective: Child and Family Team In‐Home Clinicians will address their clients’ needs appropriately and more effectively as evidenced by a 10% increase in overall scores on Case Discharge/Outcome Form completed on each family at discharge. Efficiency Objective: There will be a 10% increase in planned/successful outpatient discharges following the implementation of My Outcomes. Access Objective: Adolescent non ‐crisis consumers will be seen within 10 business days of initial attempt to access services. Access Objective: MST Therapists will see the client and family no later than 5 days after the first appointment. Access Objective: Child and Family non‐crisis consumers will be seen within 10 business days of initial attempt to access services.
Court Assessment and Treatment
Outcomes Effectiveness Objective: MST therapists will turn in TAMs (therapist adherence measure) monthly at a return rate of 80%
Results: 55%
Recommendations/ Action Taken: The Multisystemic Therapy (MST) program goal was to improve the Therapist Adherence Measure (TAM) return rate to 80%. The base line was 50%. There was overall not much change in the return rate over the last year. The rate remained around 55%. Barriers continued to be therapist would forget and families would not follow through with completion of the form. Several strategies have been implemented to improve the return rate including providing the therapist with reminders (weekly) in supervision, training staff on how to explain the TAM process, adding TAM collection to staff performance evaluations and having other therapists from the team attempt to collect the data. These strategies will continue to be used. Overall, the therapist adherence to the model and outcomes have been strong. Performance Improvement: The MST program will continue to implement strategies for improvement around TAM collection as part of the program goals for 2010‐2011. Strategies to be implemented include weekly reminders to the therapist, follow‐up with families
FY10 Annual Performance Analysis Page 18 of 51
immediately when TAMS are over due, completion of a “FIT” assessment when a therapist fails to complete a TAM, and addition of TAMS completion rate to the staff performance evaluations. This goal will not continue to be reported out in the next year but will be tracked at the program level to assure continued adherence to the evidence‐based model. Implementation of My Outcomes in Y&F will take its place.
Efficiency Objective: Therapist will complete SAM (supervisor adherence measure) bi monthly at a return rate of 80%
Results: 55% Recommendations/ Action Taken: The goal for the Multisystemic Therapy (MST) program was to have the therapists will complete SAMs (supervisor adherence measure) bi monthly at a return rate of 80%. The current SAM return rate or base line was less then 50%. Some of the initial barriers were that therapists were forgetting to complete them, they didn’t buy‐in to why they were important and there was no system for reminding them. As the MST team began to address this issue a system for providing reminders and holding staff accountable was implemented and the return rate stayed at 100%. Supervisor Adherence Scores also remained high and with in the target range. Performance Improvement: MST program will continue to implement the above strategies to continue to meet this goal. This objective will not continue to be reported out in the next year but will be tracked at the program level as required by the evidence‐based model.
Access Measure: MST therapists will see the client and family no later then 5 days after the first appointment. Results: Average 2 days
Recommendations/ Action Taken: This performance goal for Multisystemic Therapy tracks to see if the therapist sees the client and family no later then 5 days after the first appointment. Current time to second appointment rate is 3 days. The program has met this goal for each reporting period. Drivers to its success continue to be that most families are court ordered, services are provided in the home and engagement and adherence to the model has continued to be high. Performance Improvement: The MST program has met this objective due to the above noted drivers and will continue to monitor this goal next year as part of the access to services program goal. Rapid access to and engagement with services is an essential component of MST services.
Objectives for the Coming Year See Children and Family
Dialectical Behavior Therapy (DBT)
FY10 Annual Performance Analysis Page 19 of 51
Outcomes Effectiveness Objective: The number of inpatient days will stay equal to or below the average baseline collected last year.
Results: Average: 461 bed days per 1000 Recommendations/ Action Taken: The average number of bed days used for the entire year was 461 bed days per 1000. Our goal was to stay equal to or below the average collected from last year (519 bed days per 1000). This exceeded the goal for this objective and shows the ongoing work of staff to help clients learn how to cope with stressors in their lives in their own natural environments. Performance Improvement: The team will continue to work with clients to help them learn alternative ways to cope.
Effectiveness Objective: The number of times clients engage in self‐harm behaviors will be reduced by 10% by the end of the year using last year’s average as a baseline.
Results: Average 2.41 acts per client Recommendations/ Action Taken: The average number of acts of self‐harm per client for the year was 2.41. Our goal was to reduce acts of self‐harm by 10% from last year’s average. This goal was not achieved this year. Though not clearly demonstrated in the data, month to month averages for clients who did engage in self‐harm behaviors did reduce throughout their course of DBT treatment. Performance Improvement: In reviewing the data it has become clear that more useful information can be gathered by tracking self‐harm behaviors for one group of clients throughout their treatment year instead of collecting an average per client. This will provide the ability to track progress with clients over time and will be a more useful measure of effectiveness.
Effectiveness Objective The intensity of symptoms identified on the Borderline Symptom List 23 (BSL‐23) will show a reduction each quarter.
Results: Average sum scores showed a 12.57 point drop for the year.
Average mean scores showed a .54 drop for the year. Recommendations/ Action Taken: This is the first year the DBT team has used the Borderline Symptom Checklist (BSL‐23) as a client self‐report measure of symptoms of Borderline Personality Disorder. The BSL‐23 was administered to 14 clients when they started treatment at the beginning of the year and every month thereafter for their time in treatment. At the end of the year, 50% of the original sample group was still in treatment and all clients reported a reduction in their experienced symptoms of Borderline Personality Disorder.
FY10 Annual Performance Analysis Page 20 of 51
Performance Improvement: The team will continue to administer the BSL on a monthly basis to all clients opened within the first quarter and discuss results with clients as a way to help engage them in focusing on their recovery.
Efficiency Objective: DBT staff will maintain 50% direct service time with clients. Results: 46% Recommendations/ Action Taken: The annual average for direct service fell just short of the 50% mark. There was an overall increase in direct service hours for the year and two of the three clinicians had significant increases in their overall productivity. As a whole, the DBT team is consistently within 5% of the goal and continues to work towards achieving the 50% mark on a more regular basis. Performance Improvement: The team will continue to address productivity on a monthly basis and assess for ways to increase it.
Access Objective: DBT staff will contact clients within 5 business days of the referral being assigned in DBT Team Consultation meeting to schedule the first commitment session.
Results: Average 1.38 days
Recommendations/ Action Taken: Annual results for this data show that the DBT staff consistently exceeds expectations in terms of contacting clients to schedule their first commitment session. DBT staff average just over one day until they make contact with clients and this demonstrates the dedication of staff to engage clients in services as quickly as possible. Performance Improvement: No changes to programming or processes at this time due to the excellent results of this outcome.
Objectives for the Coming Year Effectiveness Objective: Clients will show a reduction in the use of inpatient hospitalizations by the end of their treatment year. Effectiveness Objective: Clients will report a reduction in the number of times they engage in SH behaviors by the end of their treatment year. Effectiveness Objective: Clients will show a reduction in the reported number of suicide attempts by the end of their treatment year. Effectiveness Objective: The intensity of symptoms identified on the Borderline Symptom List 23 (BSL‐23) will show a reduction each quarter. Access Objective: DBT staff will contact clients within 5 business days of assigning the referral in DBT Team Consultation meeting to schedule the first commitment session.
Emergency Services
FY10 Annual Performance Analysis Page 21 of 51
Outcomes Efficiency Objective: ESP will respond to request for face‐to‐face assessment within one hour 100% of the time.
Results: 96.6
Recommendations/ Action Taken: This outcome is a requirement from the State Department of Behavioral Health and Developmental Services, and is defined in the performance contract with the CSB. It will be a required outcome for next year as well. The information has proven useful to demonstrate to police and other agencies that the ESP response time is approximately 30 minutes for emergency field evaluations. This is significant given the concerns from police and emergency rooms around the length of the bed search and other variables that are not controlled by the ESP staff. Performance Improvement: Continue to track and re port as required.
Efficiency Objective: Persons not open to the agency hospitalized through the civil involuntary admissions will attend a non‐emergency discharge appointment within 7 days of their discharge 75% of the time.
Results: 66% Recommendations/ Action Taken: This is also a required outcome for the State Performance Contract. Through the tracking of this process, the ESP and LTMI programs developed a “fast track” admission and transfer process for persons who have multiple hospitalizations and require additional support to engage with the agency. The limitations of outpatient services for adults at this agency and in our community continue to create difficulty for persons who need this service. Performance Improvement: Continue to track and re port as required. Continue to work with other service areas to facilitate timely access to services.
Objectives for the Coming Year Effectiveness Objective: ESP will respond to request for face to face assessment within one hour 100% of the time Access Objective: Persons not open the agency hospitalized through the civil involuntary admissions will attend a non emergency discharge appointment within 7 days of their discharge 75% of the time Lakeside Center
Lakeside Center
Outcomes Effectiveness Objective: Ten consumers will participate in a WRAP group and complete their own Wellness Recovery Action Plan.
Results: 4
FY10 Annual Performance Analysis Page 22 of 51
Recommendations/ Action Taken: While this objective was not met, we are excited to now have a member who has been formally trained to be a WRAP facilitator. She will begin a WRAP group this coming fall. This year there were four members who were successful in completing their WRAP and while this was under our goal of ten, we are pleased that since we began offering WRAP groups a total of 18 members having completed their WRAP. Performance Improvement: Continue to track clients’ participation in WRAP groups. Explore feasibility of developing a group for people who have completed WRAP plans but need ongoing support and encouragement to keep them current.
Effectiveness Objective: 50% of consumers will rate respond with an 8‐10 rating on the group satisfaction survey.
Results: 96% Recommendations/ Action Taken: This objective was met throughout the year. The scores were high on the group satisfaction survey with a year end score of 97%. This survey not only rated the information that members learned in the group, but also rated the group facilitator. Members played a key role in providing feedback and suggestions about the groups that interested them. During the fourth quarter a former member and peer counselor facilitated groups on recovery and wellness. Both groups had a high attendance rate. Performance Improvement: Continue to track clients’ participation and planning of groups.
Efficiency Objective: Decrease consumer social isolation by increasing the average daily attendance to 55 consumers per day.
Results: 64 Recommendations/ Action Taken: Throughout this reporting period Lakeside Center has been under construction and there have been two moves, first into the new space, and the second included returning to the existing space. Despite the construction and two moves, LSC maintained a high census and have far exceeded the objective. This speaks to the importance of the program to the members that the program serves. Performance Improvement: We will continue to track average daily census, but will not work on increasing the census beyond current levels. The current census pushes at the staffing and space capacity limits.
Access Objective: Clients will be offered orientation to LSH within 15 days from receipt of the referral.
Results: Average 23 days
FY10 Annual Performance Analysis Page 23 of 51
Recommendations/ Action Taken: Due to Lakeside Center being under construction throughout this reporting period, it is not a surprise that we were unable to meet our objective of admitting consumers to the program within 15 days of receipt of the referral. Because of the construction and limited amount of space that program had to operate in, we had to limit the number of consumers to the program. Performance Improvement: The program will continue to strive to admit new members within 15 days of receipt of the referral.
Objectives for the Coming Year Effectiveness Objective: Ten consumers will participate in a WRAP group and complete their own Wellness Recovery Action Plan. Effectiveness Objective: There will be a 25% decrease in the drop‐out rate (consumers closed to the program due to lack of attendance for 2 months or longer despite outreach efforts). Efficiency Objective: There will be improved coordination of care with other providers as evidenced by a score of 95% on the record review. Access Objective: Clients will be offered orientation to LSC within 15 days from receipt of the referral
MH Case Management
Outcomes Efficiency Objective: 60% of clients missing their intake appointment will be successfully outreached and result in intake.
Results: 18%
Recommendations/ Action Taken: Outreach to clients with serious mental illness is an important aspect of service delivery. When clients missed initial intake appointments, the unit implemented new protocols to address this, namely, providing three outreach attempts. These attempts resulted in 18% of those clients who did not show for the initial appointment to be seen face‐to‐face by staff in order to engage them in services. While this percentage didn’t meet our goal, it does represent many more clients engaged that would not have been otherwise. Performance Improvement: Have initiated additional process of having peer counselors calling clients after completion of their initial interview. We anticipate that this contact from a peer along with outreach efforts will result in higher percentage of clients engaging in treatment.
Efficiency Objective: 35% of case manager/clinician time will be spent in direct face to face service and 40% of intensive case management time will be spent in direct service
Results: 36% ‐ case managers/clinicians; 43% ‐ intensive case managers
FY10 Annual Performance Analysis Page 24 of 51
Recommendations/ Action Taken: It is important for staff to meet productivity standards as it demonstrates that client needs are being attended to. For this year, the overall goal was to meet a productivity rate of 35% for case managers/clinicians and 40% for intensive case managers. Both of these goals were met. The case manager/clinician productivity for the year was 36% and the productivity for the year for the intensive case managers was 43%. Performance Improvement: Continue to track productivity rates on a monthly basis for all staff.
Access Objective: 100% of all referrals to the unit from access will be seen within 5 business days of request.
Results: 4.8 days Recommendations/ Action Taken: Because the agency recognizes that expeditious access to services is a very important part of quality services, we targeted this as an outcome again this year. The average wait from the time of request for services until the client is seen face to face is 4.8 days this year. This objective has been met and has surpassed our average from the previous year. Performance Improvement: Continue to monitor wait times until first appointment to ensure rapid access to services.
Objectives for the Coming Year Effectiveness Objective: 90% of clients will rate their initial engagement with the case manager/clinician favorably. (rating questions at a 4 or higher). Efficiency Objective: Compliance with completing paperwork with newly opened clients will improve by 15%. Access Objective: 30% of clients missing their intake appointment will be successfully outreached and result in intake.
MH Vocational Services
Outcomes Effectiveness Objective: 75% of assigned participants will become employed during the evaluation period (7/1/09‐6/30/10).
Results: 41% Recommendations/ Action Taken: Based on recent employment trends, it is evident this objective was set high. The team has discussed the need to be more active with job search strategies and to encourage the program participants to be ‘job‐ready” especially with interview skills, prompt application completion and follow‐up.
FY10 Annual Performance Analysis Page 25 of 51
Performance Improvement: Continue to monitor the number of clients that we are able to assist in finding employment.
Efficiency Objective: Increase the number of participants that have received employment services by 20.
Results: 29 Recommendations/ Action Taken: Twenty‐nine participants were added fro the year. This is indicative of the increased interest in employment services possibly due to the sluggish economy. Performance Improvement: Continue to track the number of clients referred to vocational services.
Efficiency Objective: LTMI Vocational Program will record at least 1400 direct service hours for the year.
Results: 1697
Recommendations/ Action Taken: The objective was reached with regard to direct service hours. However, it was realized that our goal was not very representative to what the projected numbers should have been. The next year we are looking at revamping the objective to a more individualized concept. Performance Improvement: Will track staff productivity through the agency’s monthly productivity report.
Access Objective: 95% of persons referred will be contacted within five business days of receiving referral.
Results: 99%; Average 2.46 days Recommendations/ Action Taken: Overall, the objective was helpful in gauging the length of time to contact individuals that were interested in services. Also, here has been an Increase in referrals. Performance Improvement: Continue to track the time to first contact as we realize rapid access to services is an important factor in the client following through with services.
Objectives for the Coming Year Effectiveness Objective: Twenty‐four (24) additional assigned program participants will become employed during the evaluation period. Efficiency Objective: LTMI Vocational Program staff will meet 40% productivity. Access Objective: Increase the number of participants that have received employment services by 30.
FY10 Annual Performance Analysis Page 26 of 51
Access Objective: 95% of persons referred will be contacted within five business days of receiving referral.
MH PACT
Outcomes
Effectiveness Objective: The number of consumers who are engaged in paid or volunteer work and/or school for at least 20 hours per week will increase by 5% over the next year.
Results: East PACT‐ 9.4% ; West PACT‐7.7% Recommendations/ Action Taken: The data show an overall and steady decline in the number of consumers who were engaged in work and/or school at least 20 hours per week. As mentioned in quarterly summaries, the local economy and job market made it difficult for consumers to find employment over the past year. It should be noted, however, that some consumers work fewer than 20 hours per week but do not get counted in the data. Perhaps the 20‐hour criterion is too high. Meaningful work remains an important part of recovery, and both the East and West PACT teams continue to encourage interested consumers to consider employment or continuing with educational pursuits. Performance Improvement: Will continue to track the number of clients working but will consider counting clients who are involved in any consistent employment rather than just those working 20 hrs per week or more.
Efficiency Objective: 40% of staff time will be spent in providing direct services to consumers. Results: East PACT: 31%; West PACT: 28% Recommendations/ Action Taken: On initial glance, the reported data suggest that neither team met its goal of 40% direct service time, nor, for that matter, was even very close. When the data are evaluated considering 1) full‐time clinical staff members (which removes the error introduced by including .5 FTE staff and supervisory staff) , who 2) were in their positions for the entire year (which removes the “new staff member penalty” as well as the penalty for staff members who retired or left the teams), then the results are East PACT 42.07% and West PACT 41.10%. These figures are probably much more representative of actual time staff spend in providing services to consumers.
Performance Improvement: Continue to track staff productivity through the agency monthly productivity report..
Access Objective: 90% of consumers referred to PACT through the LTMI supervisors’ group will be seen within 7 days of acceptance into the program.
Results: East‐ 50% 5 of 10 seen within 7 days; West‐ 2 of 5
FY10 Annual Performance Analysis Page 27 of 51
Recommendations/ Action Taken: These results and discussion are presented in a way that doesn’t directly address the stated objective. The results are reported in terms of the average number of days for a consumer to be seen by the team once he or she is accepted into PACT services. However, the objective is to see 90% of consumers within 7 days of acceptance. The East PACT Team, for example, had ten referrals over the past year. The average number of days to be seen was 8, yet of the ten referrals, only five (or 50%) were seen within 7 days. The West PACT had a total of 5 new referrals and the average number of days seen was 8, 2 of the 5 referrals the new referrals needed to be seen more than 1 time to complete the opening paperwork. For PACT staff to see a new referral within 7 days represents a near‐perfect, best‐case scenario, and is often difficult to achieve. This is further complicated by having vacant nurse positions on both teams, as the PACT model requires that nurses make the initial contact with new referrals.
Performance Improvement: The PACT teams continue to believe that it is important for new referrals to become engaged in PACT services quickly, and will keep this objective in the coming year, although stated differently to more accurately match the way the data are reported.
Objectives for the Coming Year Effectiveness Objective: New referrals to PACT services will experience a decrease in the number of hospitalizations during their first year of PACT services as compared to the year immediately prior to their receiving PACT services. Efficiency Objective: The seven‐part PACT Assessments will be completed within 6 months on all new referrals accepted into PACT services. Access Objective: Consumers referred for PACT services through the LTMI Supervisors’ Group will be seen, on average, within 7 days of acceptance into PACT services.
MH Residential
Outcomes Effectiveness Objective: 70% of consumers will maintain or experience an increase in four areas of independent living.
Results: 64% Recommendations/ Action Taken: Residents were rated in 4 areas of independent living which included: personal hygiene, meal preparation, laundry and general housekeeping. Residents were scored on a scale from one to five, with one indicating need for physical prompts with completion of a specific task and 5 indicating complete independence. These scores represent the average level of functioning across the 4 targeted areas of independent living for each resident served. Of the six residents in the program this year that could be compared to the previous year’s results, 50% demonstrated increased independence. Performance Improvement: Residents who demonstrate greater needs will receive additional support in indentified areas from Group home staff.
Efficiency Objective: 85% of Consumers will independently complete weekly pillbox with 75% accuracy within 3‐months of admission to program and 90% accuracy thereafter.
FY10 Annual Performance Analysis Page 28 of 51
Results: 71.4% of consumers completed pillbox with 90% accuracy or 75% accuracy within 3 months of admission. Recommendations/ Action Taken: For this fiscal year, 71.4% of consumers completed pillbox with 90% accuracy or 75% accuracy within 3 months of admission. As a result, the target of 85% accuracy was not achieved. Five of the seven total residents at the Family care homes completed pillboxes with greater than 85% accuracy for the year. Group home staff will continue to provide education and support to all residents with completing weekly pillboxes to attempt achieving standard for the next fiscal year. All pillboxes were reviewed and errors corrected prior to medications being administered by Group Staff. Performance Improvement: Staff will provide increased supports to individuals demonstrating greater need in an effort to increase independence and promote recovery.
Access Objective: Vacancies in the program will be offered and accepted within 30 days of receipt of referral.
Results: 35 days Recommendations/ Action Taken: For the entire year, there was only one planned discharge with this one vacancy lasting a total of 35 days. Since the objective was to have vacancies be less than 30 days, this objective was not achieved for the year. As indicated previously, the length of this vacancy was the direct result of an unplanned absence of staff responsible for the admission process of the family care homes. Despite this unusual circumstance, this objective was only missed by five days. Performance Improvement: Since this result is based on only one admission, no recommendation can be gleamed from these results.
Objectives for the Coming Year Effectiveness Objective: 85% of Consumers will independently complete weekly pillbox with 75% accuracy within 3‐months of admission to program and 90% accuracy thereafter. Efficiency Objective: 70% of consumers will maintain or experience an increase in four areas of independent living. Access Objective: Vacancies in the program will be offered and accepted within 30 days of receipt of referral.
MH Support Services Outcomes
Effectiveness Objective: The residents of the support homes will attend the recovery classes at least 85% of the time.
Results: 85.25%
FY10 Annual Performance Analysis Page 29 of 51
Recommendations/ Action Taken: Attendance rates ranged from 77% to 89%. This objective was achieved all four quarters except the first. The average attendance rate for the year was barely met at 85.25%.
Performance Improvement: Based on these results, next year’s standard will be increased to remain unchanged.
Efficiency Objective: 60% of staff time will be spent providing direct services.
Results: 58.64% Recommendations/ Action Taken: The first quarter yielded the highest productivity (62%), while the third quarter yielded the lowest productivity (56%). The first quarter was the only quarter which achieved the new standard. The average productivity for the year was 58.64 % which did not achieve the goal of 60%. When this was raised last year from 50%, MHSS did not have nearly the amount of paperwork demands that consumed staff time (i.e. MHHS staff doing pre‐authorizations; MHSS doing annual assessments to drive ISPs; MHSS adjusting to Anasazi). Although in the future MHSS may not have to contend with assessments and/or authorizations due to recent Medicaid changes, MHSS may begin doing shortened ISPs and quarterlies to conform with CM&A ISPs and quarterlies which will again add time needed for charting. Performance Improvement: Since this objective was achieved only one quarter, the standard for next year should be reset to 55%.
Access Objective: All clients on the referral list will be opened within 30 days of a vacant opening.
Results: 100% Recommendations/ Action Taken: For the year, the average wait period for consumers to receive MHSS was 15 days with 100% of consumers being opened within 30 days of the authorization/assessment date. Performance Improvement: Continue to monitor to ensure timely access.
Objectives for the Coming Year Effectiveness Objective: The residents of the support homes will attend the recovery classes at least 85% of the time. Efficiency Objective: MHSS staff will collaborate and then document monthly notes regarding coordinating care with case managers. Access Objective: MHSS will open 8 consumers each quarter.
Prevention
Outcomes Effectiveness Objective: 95% of CONNECT participants shall be on reading level or above by 3rd grade.
FY10 Annual Performance Analysis Page 30 of 51
Results: 85 %
Recommendations/ Action Taken: Building reading skills is an essential component of the Connect program since research shows that reading skills are a predictor of later success in school and life. All of the 5 Connect programs participate in the Henrico Bookmobile Reading Program and give attention to reading in daily programming. Due to transition in communities served by Connect, three 3rd graders left the program over the course of the school year. 15/16 whose data was collected at the first report card maintained on grade level. The same two students who were below grade level at the beginning of the school year continued to struggle with reading skills. Both of these students received special education services. Performance Improvement: Computer‐based reading enrichment programs have been purchased and will be available for all Connect participants’ use over the next school year.
Effectiveness Objective: Students will show a decrease in favorable attitudes towards Alcohol, Tobacco and other Drugs (ATOD) as demonstrated by the evaluation outcomes of evidence‐based curriculums implemented in the community.
Results: Pre = 60; Post = 48 Recommendations/ Action Taken: Overall, outcomes for evidence‐based curriculums this year showed mixed results. There is variability in outcomes based on the curriculum and the developmental age of the participant group. Many factors can influence participant responses on pre and post test measures (e.g., fatigue, lack of comprehension, misreading, and actual negative effect). However, the Connect middle school participants had the strongest positive outcomes for the Life Skills Training curriculum, which teaches “personal and social skills in combination with drug resistance skills and normative education”. These outcomes are quite encouraging for this group of Connect youth who often experience many risk factors and fewer protective factors in their immediate communities. Performance Improvement: The Prevention program now has the capability to longitudinally track and compare individual participant outcomes and outcomes across the 5 Connect sites. This capability facilitates quality improvement in programming.
Efficiency Objective: The Henrico Too Smart to Start Community Coalition shall implement community‐level prevention strategies as measured by the delivery of 4 events annually.
Results: 15 events Recommendations/ Action Taken: FY’10 was a very busy year for Prevention in the community, implementing 15 community‐level prevention activities. New working relationships were developed with VCU (Honors College and School of Education, Service Learning Program), and the Dept. of Alcohol Beverage Control through funding from their Community Coalitions Grant. These partnerships and funds from ABC afforded Prevention
FY10 Annual Performance Analysis Page 31 of 51
the opportunity to significantly expand its community‐level prevention activities. Three of the host schools for the Town Hall meetings on Underage Drinking experienced notable decreases in alcohol‐related suspensions from the prior year and the fourth maintained a zero record. Moreover, educational information from the nationally recognized Parents Who Host Lose the Most Campaign was disseminated throughout Henrico Public Schools. Performance Improvement: Prevention Services will continue its collaboration with both Henrico Schools and VCU, although the activities will vary for the upcoming year to include a more holistic approach to prevention.
Efficiency Objective: The Charles City Community Coalition shall implement community‐ level prevention strategies as measured by the delivery of 2 events annually.
Results: 5 events Recommendations/ Action Taken: Although FY10 was primarily a year of transition and regrouping, the young Charles City Coalition implemented 5 community ‐ level prevention activities. The internationally recognized FAST program (a school‐ community collaboration) had the largest number of graduates from Charles City Elementary since the program began. Project Sticker Shock, a regional project to educate the community about Virginia Under‐age Drinking Laws, was expanded to all of the Charles City convenience stores. Performance Improvement: The Charles City Prevention Coalition, while continuing to build a strong infrastructure, will take on some new activities in the upcoming year through additional funding support from the Dept. of Alcohol and Beverage Control.
Access Objective: Consumers will be enrolled in the CONNECT program within 2 business days of request for services.
Results: 3.1 days Recommendations/ Action Taken: Registrations for the Connect program are completed at the respective Connect sites in the community. Upon registration of the child, parents determine the start date for participation. Factors affecting the child’s start date in the programs are illness, vacations, and early summer/fall registration. Performance Improvement: In the upcoming year youth will be enrolled at the time of registration as program capacity permits. Start dates for participation will no longer determine enrollment status.
Objectives for the Coming Year Effectiveness Objective: 95% of CONNECT participants shall be on reading level or above by 3rd grade. Effectiveness Objective: Students will show a decrease in favorable attitudes towards Alcohol, Tobacco and other Drugs (ATOD) as demonstrated by the evaluation outcomes of evidence‐based curriculums implemented in the community.
FY10 Annual Performance Analysis Page 32 of 51
Efficiency Objective: The Henrico Too Smart to Start Community Coalition shall implement community‐level prevention strategies as measured by the delivery of 4 events annually. The Charles City Community Coalition shall implement community‐ level prevention strategies as measured by the delivery of 2 events annually. Access Objective: Consumers will be approved for admission into the CONNECT program within 5 business days of request for services.
COMMUNITY SUPPORT SERVICES
CSS Intake
Outcomes Access Objective: 90% of individuals referred to the agency for services will have a face to face intake meeting within 10 business days of the first contact.
Results: 91% Recommendations/ Action Taken: The ID intake unit averages 4‐6 intake slots that are available most weeks for individuals seeking services from the CSS Division. These slots are offered at varied times during the day and staff have also worked with families to accommodate their schedules. This process has worked well over the past year to make sure that individuals are seen in a timely manner. All of the instances where more than 10 days lapsed before the face to face appointment were due to the family needing to reschedule or the family choosing to schedule outside of the preferred 10 days. Performance Improvement: Staff will continue to offer regular intake slots and remain flexible in meeting the scheduling needs of new referrals.
Access Objective: 90% of individuals receiving intake for MR Services will have eligibility resolved within 60 days from initial face‐to‐face visit. Results: 100%
Recommendations/ Action Taken: The ID intake unit has consistently been able to process individuals through eligibility within 60 days. Families are being encouraged to take a more active role in helping to secure proper documentation. Relationships with community psychologists are constantly being nurtured to make sure that we are getting reports timely and with all of the required elements. Performance Improvement: Intake staff will continue to develop relationships with community psychologists and education families and professions on eligibility requirements.
Objectives for the Coming Year Effectiveness Objective: 90% of individuals referred to the agency for services will have a face to face intake meeting within 10 business days of the first contact. Access Objective: 90% of individuals receiving intake for ID Services will have eligibility resolved
FY10 Annual Performance Analysis Page 33 of 51
within 60 days from initial face‐to‐face visit..
CSS Day Services
Outcomes Effectiveness Objective: The variety of volunteer options will be increased by developing at least two new sites during the year from a different sector than those currently being used.
Results: 2 Recommendations/ Action Taken: Over the course of the year, we developed two new volunteer sites. One of these was a one time event, although we are continuing to talk to the organization and hope that it will lead to more opportunities. We have now developed an on‐going relationship with the Ronald McDonald House and this has been a viable volunteer activity which involves multiple steps – from developing a menu to shopping to cooking to delivering the food. We met the objective this year and have learned that it will take considerable time and effort to continue to develop positive and on‐going volunteer sites that meet the needs of consumers. Performance Improvement: Staff have agreed to continue this effort.
Effectiveness Objective: New program routines will be developed by the end of the first quarter that includes work and non‐work activities. Once developed, the routines will be implemented with 90% compliance for each of the next three quarters.
Results: 100%
Recommendations/ Action Taken: Over the course of the year, the consumers identified activities that they enjoyed and staff integrated these choices into opportunities that were available whenever there was downtime. This is especially important due to the cyclical nature of the contract work that is available. Performance Improvement: The use of scheduled activities will now be incorporated into the calendar of the workshop unit and will be offered consumers with the goal being that consumers are engaged in either work or a recreational/leisure activity of their choice on a daily basis.
Effectiveness Objective: Each enclave site will hold one skill building activity per quarter with a career development theme for the consumers who work at the site.
Results: Met 3 of 4 quarters
Recommendations/ Action Taken: This objective was met during 3 of the 4 quarters of the year. By holding these conversations, it did allow staff and employees to discuss why maintaining a job was important and opened up the discussion that just because you have a
FY10 Annual Performance Analysis Page 34 of 51
successful job now does not mean this is the only job you can have. It opened up the idea of job advancement and continuing to grow one’s skills in order to make more money. Performance Improvement: This idea will be further explored in the 2011 outcomes as the concentration shifts on how working and earning money impacts one’s benefits and ways to use incentives so you can keep working and expanding job opportunities.
Effectiveness Objective: 10 of the 12 (83%) of the consumers will participate in community activities at least 2 times per month.
Results: Met 11 of 12 months of the year Recommendations/ Action Taken: This objective was met 11 of the 12 months during the year. By emphasizing everyone getting out two times per month, there was an increased effort on making sure the vans for wheelchair transport were accessible and a real effort to ensure that activities were developed that would appeal to each individual. Performance Improvement: This objective has now become part of the expectation and will continue to be monitored by program staff.
Efficiency Objective: 100% of the plans completed by Training Specialists will be completed prior to the effective date of the plan.
Results: 88% Recommendations/ Action Taken: This objective was developed to help us determine if staff are able to complete all their paperwork requirements within the required time frame in the amount of time they are given off the floor. Our results show that while the majority of our work is completed timely, we are not at 100%. We learned several things. We need to do a better job of ensuring staff are using the most current instructions. Several issues arose when staff were still operating under old standards. Second, staff need specific time set aside for paperwork without interruptions and that continues to be a challenge, particularly for the work programs. In these programs, production demands vary and at times creates conflicts for staff to work off the work floor. Finally, we need to refine our system of checks and balances for supervisors so that they have system assistances that will help them monitor the details in the large number of charts they are responsible to monitor. Compliance average over the four quarters was 88% which did not meet the objective of 100%. Performance Improvement: This monitoring will be continued as part of the Manager’s review of the records. Our objective is to be at 100% compliance. Our concentration for staff will be data collection and improvement in this area of compliance.
Efficiency Objective: Will complete two major marketing initiatives during the year.
Results: 3
FY10 Annual Performance Analysis Page 35 of 51
Recommendations/ Action Taken: We completed three different marketing initiatives with one of those resulting in work. We increased our customer base for lawn care in the New Kent County area following the distribution of a flyer advertising our work. We also developed a pricing structure which we will use in the future when bidding on Henrico County lawn care contracts. The final initiative was in New Kent County schools and we were able to determine that the best way of marketing this project for school supplies will be through the local PTA organizations. While unable to sell any product this year, we have established a business plan and will pursue this further into the next fiscal year. Overall, this outcome was successful because we developed ideas and were able to expand our base of employment possibilities for the individuals we serve. Performance Improvement: The marketing efforts will continue and we will be pursuing both of the ideas from last year that did not result in work yet.
Access Objective: Individuals referred will start the program within 90 days of the date of referral.
Results: 3 of 4 for 75% Recommendations/ Action Taken: There were a total of 4 new individuals who started one of the Day Services programs of the workshops, LEP, STEP or the enclaves in the FY 2010. Of those 3 began within 90 days of their referral. One individual took 102 days. Of the four individuals, the average was 67 days from referral to opening. Performance Improvement: There are many factors which impact the length of time and we will continue to monitor this objective to ensure that the delays are not created by our processes and our lack of customer interactions, but rather are a result of allowing and responding to consumer choice.
Objectives for the Coming Year Effectiveness Objective: 30 different individuals will participate in activities of their choice within another unit of day services each quarter. Effectiveness Objective: 50% of the individuals enrolled in Enclaves will be provided a “Work World Assessment” and/or a complete benefit analysis. Efficiency Objective: Utilization Peer Review scores on the DATA section will reflect an average of 95% compliance for all waiver charts. Access Objective: 90% of the individuals referred will start the program within 90 days of the date of referral.
CSS Case Management
Outcomes Access Objective: Consumers will be seen within 15 business days of verification of eligibility.
Results: 13.6 average
FY10 Annual Performance Analysis Page 36 of 51
Recommendations/ Action Taken: This objective was met for the year with an average of 13.6 days from eligibility verification to first face‐to‐face with assigned SC/CM. There continue to be occasional outlying face‐to‐face numbers although the over all average is improved from last year. The change is that this year Team Leaders sent a letter to the individual/family as soon as the chart was received with the SC/CM name and phone number and a statement about the importance of responding to the SC/CMs phone calls to set up the first visit. Individuals who do not respond to the initial and 1 subsequent letter requesting contact are closed. They are given instructions on what to do if they decide they want services. Performance Improvement: This objective will be continued at the same level of standard over the next year. The initial letter is sent even before contact with the SC/CM is assisting with the adherence to required timeframes.
Objectives for the Coming Year Access Objective: Individuals will be seen within 15 business days of receipt of chart by Team Leader.
CSS Individual Supported Employment Outcomes
Effectiveness Objective: 50% of unemployed individuals attending the Career Network Club will be employed by the end of the year.
Results: 75% Recommendations/ Action Taken: The objective was met with a total of 75% of individuals who started out unemployed at the beginning of the new CNC fiscal year becoming employed. This employment rate supports the Job Coach observation that those who attend the CNC meetings benefit from the peer support and topics discussed. The Career Network Club continues to be a valuable part of the Individual Supported Employment program. Performance Improvement: Job Coaches are working on enhancing the experience through long range planning of topics, development of methods to increase attendance for those who could benefit most and alternating locations between east and west to make attendance for CC/NK and eastern Henrico residents easier.
Efficiency Objective: SE Staff will meet with local business organizations once per quarter to provide education about benefits to employers.
Results: 4 Recommendations/ Action Taken: This objective was met in the total number of presentations done but not spread out over 4 quarters. Job Coaches attended the meetings and did quick presentations with the goal of providing general education to employers about Supported Employment.
FY10 Annual Performance Analysis Page 37 of 51
Performance Improvement: This objective will not be continued this coming fiscal year as it seems that allocation of time spent in forming relationships with individual employers through the placement process are bringing the most opportunity for individual consumers.
Access Objective: Individuals will be seen within 10 business days from the time of acceptance to the employment program to the first face to face meeting with the Job Coach.
Results: 7 days average Recommendations/ Action Taken: This objective was met with an average of 7 days from acceptance to the first face to face meeting with the Job Coach. As soon as the individual is accepted in the program Job Coaches immediately begin efforts to contact the individual to set up the first meeting. Performance Improvement: This objective will be continued with an adjustment of measurement from acceptance into the program to the first face‐to‐face meeting being within 6 business days.
Objectives for the Coming Year Effectiveness Objective: 50% of unemployed individuals in the Individual SE program will receive an offer of employment within 2 months of requesting a job. Efficiency Objective: 90% of SE staff who attend best practice training will articulate how they used this information in their practice. Access Objective: Individuals will be seen within 6 business days from the time of acceptance to the employment program to the first face to face meeting with the Job Coach.
CSS Residential Outcomes
Effectiveness Objective: 85% of the residents will identify and implement at least one new outcome from their new ISP by the end of the fiscal year.
Results: 80% Recommendations/ Action Taken: Over this year all residents were converted to the new Person Center Planning process. It has been a learning curve for the staff and residents. This process sparked lots of discussion about individual strengths, choice making and creativity. The other discovery was that many of our residents struggled with being able to independently identify areas of interest to them beyond their normal daily routine. They base their choices on what they know and what is comforting to them. Staff were encouraged throughout the year to introduce new activities and give plenty of options in the hopes of opening up the experiences of those we support. Where we did not meet the goal this past year, we did learn some new information about the residents and embarked on new ways to support the individuals in our program.
FY10 Annual Performance Analysis Page 38 of 51
Performance Improvement: Residential staff will continue to encourage participation in an array of activities both new and preferred.
Objectives for the Coming Year Effectiveness Objective: 100 % of service delivery verifications forms will meet criteria.
Parent‐Infant Program
Outcomes Efficiency Objective: All IFSP’s will be signed by their primary pediatrician within 30 days the IFSP is signed by the parent/guardian.
Results: 1 Medicaid IFSP was not signed by a pediatrician within 30 days of the first date of service. Recommendations/ Action Taken: Since the 3rd quarter, the Part C and Medicaid regulations have changed to state that only one provider can obtain physician signatures. This new regulation will change our process significantly. Performance Improvement: We will continue to evaluate our tracking system and will need to develop processes to inform treating agencies that physician signatures were obtained in a timely fashion. We will continue to monitor this objective as it will be the responsibility of the Local Lead Agency to obtain the pediatrician signatures for Medicaid IFSPs.
Access Objective: Children will be seen for an Intake within 5 business days of referral to central point of entry.
Results: 10.9 Average business days from referral to central point of entry. Recommendations/ Action Taken: Our program encountered a major system transformation this year. Prior to the system transformation, all intakes were able to be scheduled within 5 business days of referral. Since the first quarter of the year, the amount of days from referral to intake has more than tripled. In addition to changing our program from the central point of entry to the single point of entry, the system transformation created a more detailed intake process. Due to the new processes, the length of the intake visit has increased. The Part C regulations state that a child must receive an intake, assessment, and the development of an Individualized Family Services Plan within 45 days of referral. The increased amount of children being referred has impacted our program greatly. Performance Improvement: In an effort to ensure that families receive all of the required and entitled services, (intake, assessment, and the development of an Individual Family Services Plan) our program will monitor the Part C 45 day timeline for next fiscal year. The 45 day timeline will be monitored within the Early Intervention database system (ITOTS).
Access Objective: Referrals will be scheduled for intake within 24 hours of receipt.
FY10 Annual Performance Analysis Page 39 of 51
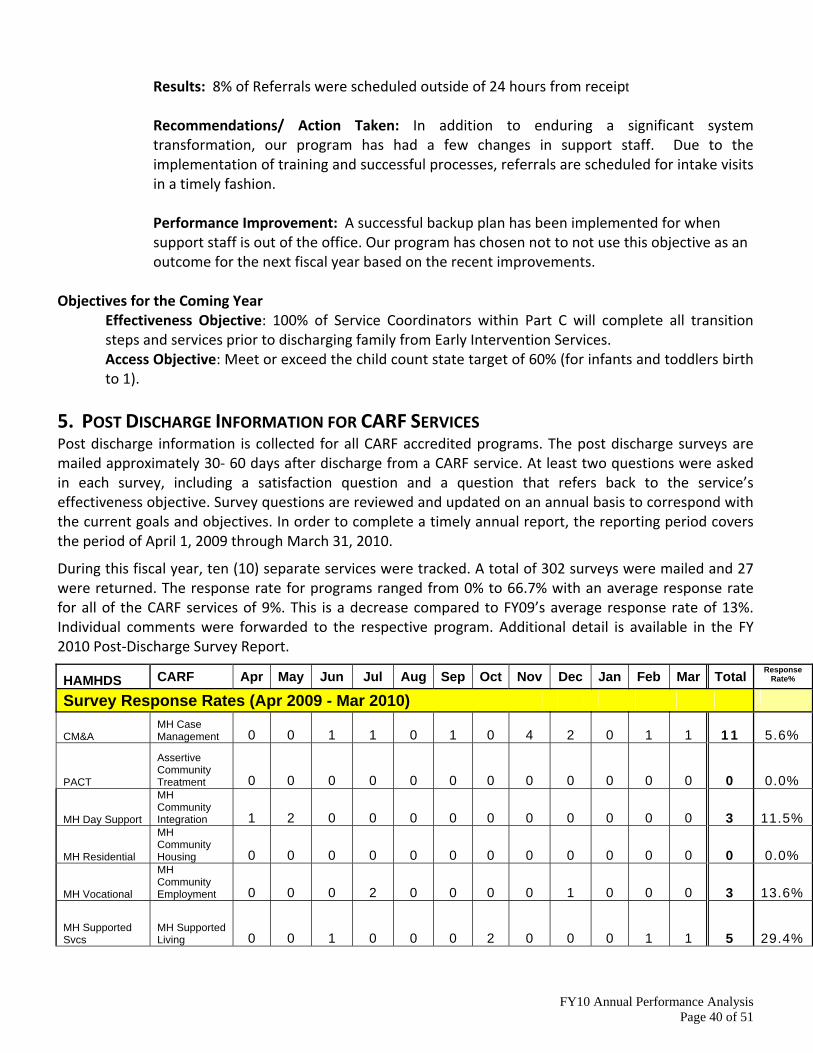
Results: 8% of Referrals were scheduled outside of 24 hours from receipt Recommendations/ Action Taken: In addition to enduring a significant system transformation, our program has had a few changes in support staff. Due to the implementation of training and successful processes, referrals are scheduled for intake visits in a timely fashion. Performance Improvement: A successful backup plan has been implemented for when support staff is out of the office. Our program has chosen not to not use this objective as an outcome for the next fiscal year based on the recent improvements.
Objectives for the Coming Year Effectiveness Objective: 100% of Service Coordinators within Part C will complete all transition steps and services prior to discharging family from Early Intervention Services. Access Objective: Meet or exceed the child count state target of 60% (for infants and toddlers birth to 1).
5. POST DISCHARGE INFORMATION FOR CARF SERVICES Post discharge information is collected for all CARF accredited programs. The post discharge surveys are mailed approximately 30‐ 60 days after discharge from a CARF service. At least two questions were asked in each survey, including a satisfaction question and a question that refers back to the service’s effectiveness objective. Survey questions are reviewed and updated on an annual basis to correspond with the current goals and objectives. In order to complete a timely annual report, the reporting period covers the period of April 1, 2009 through March 31, 2010.
During this fiscal year, ten (10) separate services were tracked. A total of 302 surveys were mailed and 27 were returned. The response rate for programs ranged from 0% to 66.7% with an average response rate for all of the CARF services of 9%. This is a decrease compared to FY09’s average response rate of 13%. Individual comments were forwarded to the respective program. Additional detail is available in the FY 2010 Post‐Discharge Survey Report.
HAMHDS CARF Apr May Jun Jul Aug Sep Oct Nov Dec Jan Feb Mar Total Response Rate%
Survey Response Rates (Apr 2009 - Mar 2010)
CM&A MH Case Management 0 0 1 1 0 1 0 4 2 0 1 1 11 5.6%
PACT
Assertive Community Treatment 0 0 0 0 0 0 0 0 0 0 0 0 0 0.0%
MH Day Support
MH Community Integration 1 2 0 0 0 0 0 0 0 0 0 0 3 11.5%
MH Residential
MH Community Housing 0 0 0 0 0 0 0 0 0 0 0 0 0 0.0%
MH Vocational
MH Community Employment 0 0 0 2 0 0 0 0 1 0 0 0 3 13.6%
MH Supported Svcs
MH Supported Living 0 0 1 0 0 0 2 0 0 0 1 1 5 29.4%
FY10 Annual Performance Analysis Page 40 of 51
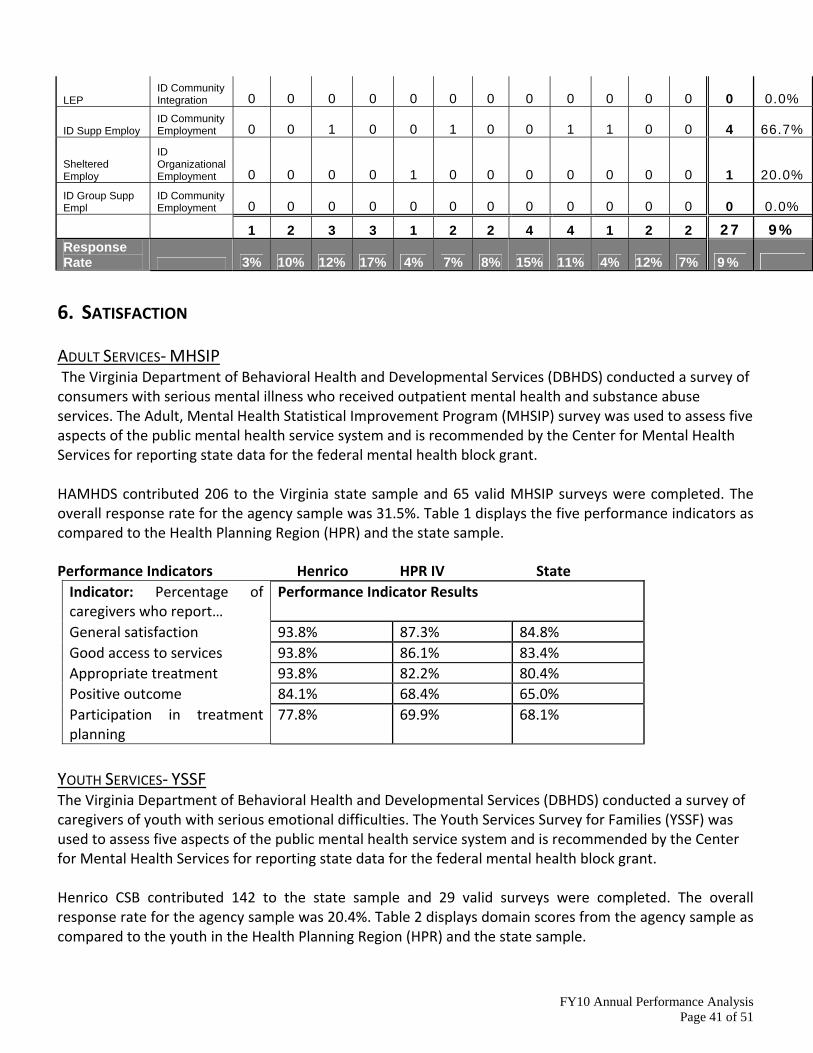
LEP ID Community Integration 0 0 0 0 0 0 0 0 0 0 0 0 0 0.0%
ID Supp Employ ID Community Employment 0 0 1 0 0 1 0 0 1 1 0 0 4 66.7%
Sheltered Employ
ID Organizational Employment 0 0 0 0 1 0 0 0 0 0 0 0 1 20.0%
ID Group Supp Empl
ID Community Employment 0 0 0 0 0 0 0 0 0 0 0 0 0 0.0%
1 2 3 3 1 2 2 4 4 1 2 2 27 9% Response Rate 3% 10% 12% 17% 4% 7% 8% 15% 11% 4% 12% 7% 9%
6. SATISFACTION ADULT SERVICES‐ MHSIP The Virginia Department of Behavioral Health and Developmental Services (DBHDS) conducted a survey of consumers with serious mental illness who received outpatient mental health and substance abuse services. The Adult, Mental Health Statistical Improvement Program (MHSIP) survey was used to assess five aspects of the public mental health service system and is recommended by the Center for Mental Health Services for reporting state data for the federal mental health block grant. HAMHDS contributed 206 to the Virginia state sample and 65 valid MHSIP surveys were completed. The overall response rate for the agency sample was 31.5%. Table 1 displays the five performance indicators as compared to the Health Planning Region (HPR) and the state sample. Performance Indicators Henrico HPR IV State Indicator: Percentage of caregivers who report…
Performance Indicator Results
General satisfaction 93.8% 87.3% 84.8% Good access to services 93.8% 86.1% 83.4% Appropriate treatment 93.8% 82.2% 80.4% Positive outcome 84.1% 68.4% 65.0% Participation in treatment planning
77.8% 69.9% 68.1%
YOUTH SERVICES‐ YSSF The Virginia Department of Behavioral Health and Developmental Services (DBHDS) conducted a survey of caregivers of youth with serious emotional difficulties. The Youth Services Survey for Families (YSSF) was used to assess five aspects of the public mental health service system and is recommended by the Center for Mental Health Services for reporting state data for the federal mental health block grant. Henrico CSB contributed 142 to the state sample and 29 valid surveys were completed. The overall response rate for the agency sample was 20.4%. Table 2 displays domain scores from the agency sample as compared to the youth in the Health Planning Region (HPR) and the state sample.
FY10 Annual Performance Analysis Page 41 of 51
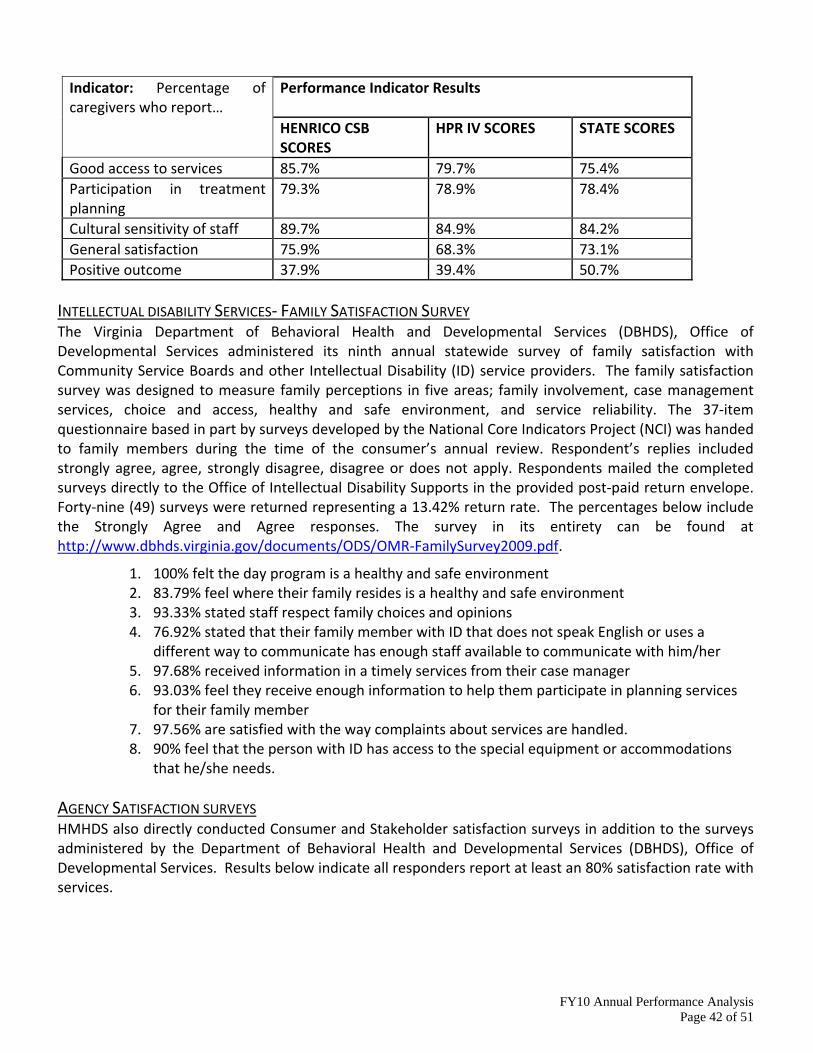
Indicator: Percentage of caregivers who report…
Performance Indicator Results
HENRICO CSB SCORES
HPR IV SCORES STATE SCORES
Good access to services 85.7% 79.7% 75.4% Participation in treatment planning
79.3% 78.9% 78.4%
Cultural sensitivity of staff 89.7% 84.9% 84.2% General satisfaction 75.9% 68.3% 73.1% Positive outcome 37.9% 39.4% 50.7%
INTELLECTUAL DISABILITY SERVICES‐ FAMILY SATISFACTION SURVEY The Virginia Department of Behavioral Health and Developmental Services (DBHDS), Office of Developmental Services administered its ninth annual statewide survey of family satisfaction with Community Service Boards and other Intellectual Disability (ID) service providers. The family satisfaction survey was designed to measure family perceptions in five areas; family involvement, case management services, choice and access, healthy and safe environment, and service reliability. The 37‐item questionnaire based in part by surveys developed by the National Core Indicators Project (NCI) was handed to family members during the time of the consumer’s annual review. Respondent’s replies included strongly agree, agree, strongly disagree, disagree or does not apply. Respondents mailed the completed surveys directly to the Office of Intellectual Disability Supports in the provided post‐paid return envelope. Forty‐nine (49) surveys were returned representing a 13.42% return rate. The percentages below include the Strongly Agree and Agree responses. The survey in its entirety can be found at http://www.dbhds.virginia.gov/documents/ODS/OMR‐FamilySurvey2009.pdf.
1. 100% felt the day program is a healthy and safe environment 2. 83.79% feel where their family resides is a healthy and safe environment 3. 93.33% stated staff respect family choices and opinions 4. 76.92% stated that their family member with ID that does not speak English or uses a
different way to communicate has enough staff available to communicate with him/her 5. 97.68% received information in a timely services from their case manager 6. 93.03% feel they receive enough information to help them participate in planning services
for their family member 7. 97.56% are satisfied with the way complaints about services are handled. 8. 90% feel that the person with ID has access to the special equipment or accommodations
that he/she needs. AGENCY SATISFACTION SURVEYS HMHDS also directly conducted Consumer and Stakeholder satisfaction surveys in addition to the surveys administered by the Department of Behavioral Health and Developmental Services (DBHDS), Office of Developmental Services. Results below indicate all responders report at least an 80% satisfaction rate with services.
FY10 Annual Performance Analysis Page 42 of 51
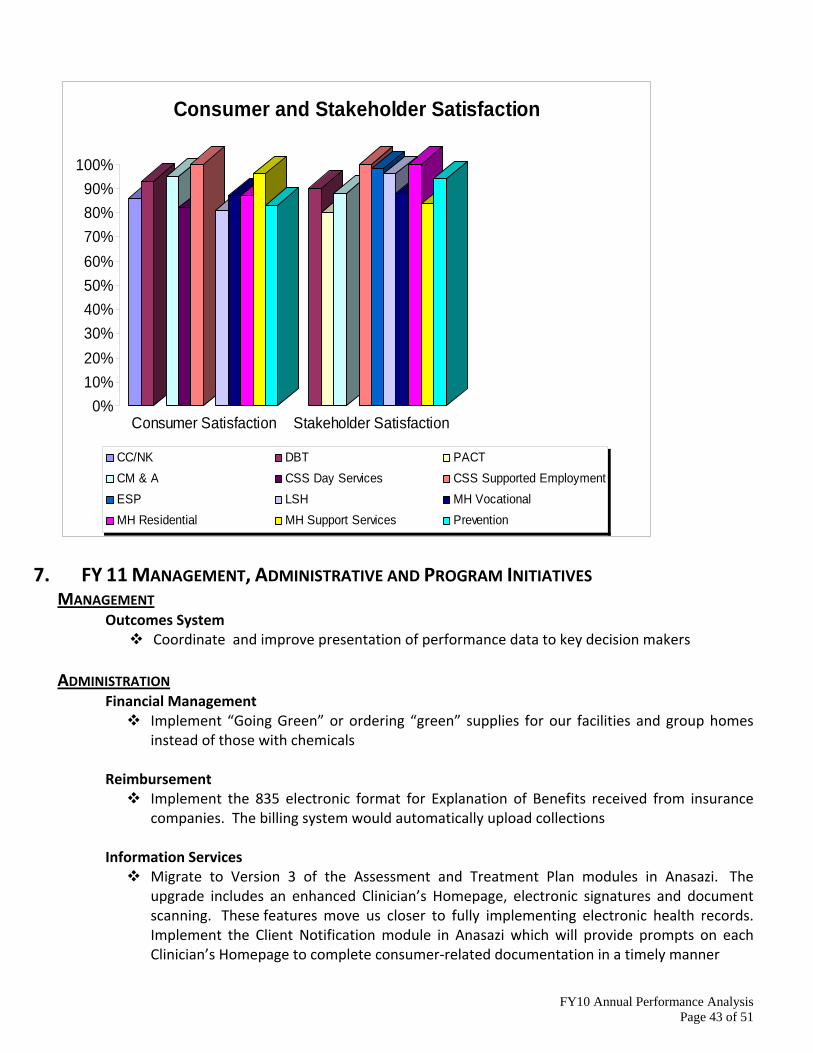
0%10%20%30%40%50%60%70%80%90%
100%
Consumer Satisfaction Stakeholder Satisfaction
Consumer and Stakeholder Satisfaction
CC/NK DBT PACTCM & A CSS Day Services CSS Supported EmploymentESP LSH MH VocationalMH Residential MH Support Services Prevention
7. FY 11 MANAGEMENT, ADMINISTRATIVE AND PROGRAM INITIATIVES MANAGEMENT Outcomes System
Coordinate and improve presentation of performance data to key decision makers
ADMINISTRATION Financial Management
Implement “Going Green” or ordering “green” supplies for our facilities and group homes instead of those with chemicals
Reimbursement
Implement the 835 electronic format for Explanation of Benefits received from insurance companies. The billing system would automatically upload collections
Information Services
Migrate to Version 3 of the Assessment and Treatment Plan modules in Anasazi. The upgrade includes an enhanced Clinician’s Homepage, electronic signatures and document scanning. These features move us closer to fully implementing electronic health records. Implement the Client Notification module in Anasazi which will provide prompts on each Clinician’s Homepage to complete consumer‐related documentation in a timely manner
FY10 Annual Performance Analysis Page 43 of 51
Develop a database to automate calculating key performance measures (such as days to first appointment) which will then upload to the Intranet in a user friendly Dashboard. Using the same technology, automate the Manager’s Monthly Service report to be available on the intranet as well.
Facilities
Develop a new work order process to reduce the time it takes to resolve a work order and improve status communication between the customer and Facilities
Human Resources
Working with the Agency’s Oracle Workgroup, will review and revise all 343 job descriptions
Business Support Formalize key quality assurance processes to ensure smooth and efficient front desk and front end activities (including Chart Tracker accuracy)
Begin to report key front desk volume statistics, show rates and reschedule rates to the Program Divisions, to maximize clinician productivity
Health Information Management
Expand electronic chart reviews in the Chart Tracker System to include remaining programs
CLINICAL AND PREVENTION SERVICES Access
Implement Access Services 20 hours/week at East Center Adult Substance Abuse/ Adult Mental Health Services
Implement reimbursement through third ‐party payers Long Term Mentally Ill Services
Increase use of Peer Counselors Emergency Services
Implement outreach effort including joint CIT trained police officers and ESP staff to follow up with high risk individuals, providing education and consultation to nursing homes in area, and the family recourse group to aid families dealing with persons with mental illness
Youth & Family
Increase use of evidence‐based practices COMMUNITY SUPPORT SERVICES
Residential Services Complete change from live‐in to 24 hour model
Parent Infant Program
Complete implementation of System Transformation
FY10 Annual Performance Analysis Page 44 of 51
Case Management Services
Complete implementation of SIS and PCP
8. QUALITY HEALTH INFORMATION OUTCOMES Record reviews were completed on approximately 20% of Medicaid and 10% of non‐Medicaid charts; 1046 Quality Reviews and 405 Administrative Reviews were conducted. During the past year, further improvements were made to the Chart Tracking System which is utilized to input record reviews. In addition, training and supervision needs were identified and implemented from record review results.
OBJECTIVES FOR THE COMING YEAR
Continue improvements of the Utilization Review process Establish and implement improved agency‐wide QHI reporting Continue to evaluate the implementation of the Person Centered Planning documentation for CSS CM, Residential and Day Services
9. RISK MANAGEMENT / INCIDENTS AND COMPLAINTS OUTCOMES During this past year, the Risk Management Committee developed a new agency Risk Management Plan, updated the annual Accessibility Plan, ensured all facilities remained current with mandatory inspections and drills, and ensured that the agency remained current with all health and safety standards for Licensure and CARF. In addition, the committee provided additional review of critical incident reporting, with the primary responsibility being handled by the Critical Incident Committee. Critical incidents were regularly reviewed, analyzed and addressed as appropriate. For example, each fall was analyzed in terms of the specific incident, but also in relation to other incidents, to address any procedural or facility related issues that needed to be addressed to reduce risk. No specific trends were noted requiring significant or organization wide interventions.
FY10 Annual Performance Analysis Page 45 of 51
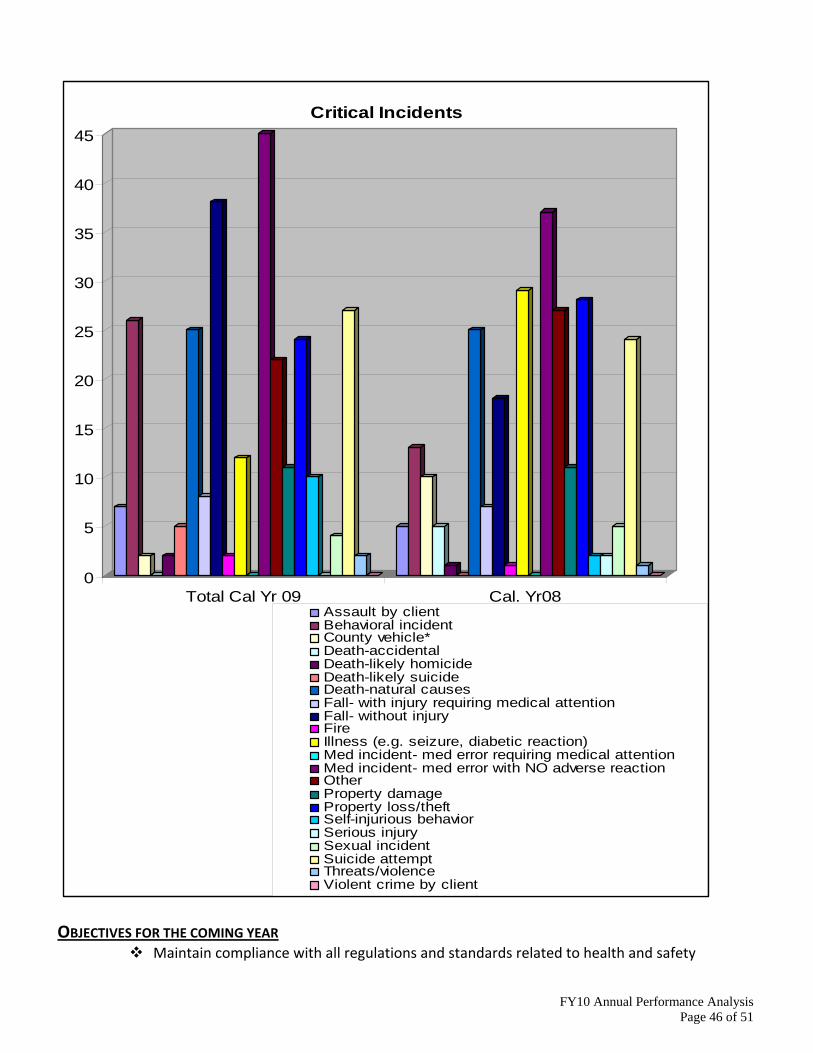
0
5
10
15
20
25
30
35
40
45
Total Cal Yr 09 Cal. Yr08
Critical Incidents
Assault by clientBehavioral incidentCounty vehicle*Death-accidentalDeath-likely homicideDeath-likely suicideDeath-natural causesFall- with injury requiring medical attentionFall- without injuryFireIllness (e.g. seizure, diabetic reaction)Med incident- med error requiring medical attentionMed incident- med error with NO adverse reactionOtherProperty damageProperty loss/theftSelf-injurious behaviorSerious injurySexual incidentSuicide attemptThreats/violenceViolent crime by client
OBJECTIVES FOR THE COMING YEAR
Maintain compliance with all regulations and standards related to health and safety
FY10 Annual Performance Analysis Page 46 of 51
Incorporate revised disaster procedures into emergency procedures
10. STAFF TRAINING OUTCOMES The agency maintains a list of required training for all staff. Staff members have a number of options in the manner in which the training can be obtained; options include attending training provided directly by the agency, on‐line through the agency Intranet, County of Henrico, self study or outside of the agency and County. The agency maintains a group of 23 staff trainers that provides training in a variety of areas such as First Aid, CPR, Prevention of Violence, Therapeutic Options, Prevention of Infectious Diseases, Cultural Awareness and Anasazi training. The group meets twice a year to plan the schedule for the next calendar year and to provide input into the management of the agency training program. On‐line training courses available to staff include: the Code of Ethics; Fraud Awareness; Pharmacy Fraud, Waste and Abuse; Fire Suppression; Agency Compliance; Prevention of Violence annual refresher course; and Professional Ethics Training. On line competency‐based training is provided for all staff annually in the areas of Human Rights and the Reporting of Critical Incidents, and the options were expanded this year to include Confidentiality Training and HIPAA Breach Notification. A self‐study course is available for Prevention of Infectious Diseases. The County of Henrico’s Employee Development and Training (ED & T) department produces a yearly catalog of classes that are available to employees as well, which include innovative training courses, leadership and customer service certification programs, and career enrichment coaching. The foundation for all of ED&T’s programs is the County’s nine core competencies. The County of Henrico also offers National Incident Management System (NIMS) 700 training to all employees and Incident Command System (ICS) 100 and ICS 200 training to all supervisors. Defensive Driving courses are available through the County Risk Management department for staff who drive a County vehicle. The agency also supports training as part of ongoing professional development, to the degree financially possible. Professional training is provided through In‐Service training, with agency staff conducting the training, or by outside presenters brought in for presentations. In addition, some external training is attended by staff members with financial support by the agency. OBJECTIVES FOR THE COMING YEAR
Enhance tools to facilitate the provision of and monitoring of staff training Strategies: o Develop online training modules through which staff may fulfill their annual
requirements to review major agency policies o Develop training reports through the intranet staff training tracking system to better
monitor staff compliance to required training
11. CULTURAL AWARENESS AND COMPETENCY OUTCOMES The Cultural Awareness and Competency Committee (CACC) conducted an agency‐wide assessment using CLAS standards and the Building Bridges Tools for Developing an Organization’s Cultural Competence. This process included focus groups of clients, family members, supervisory staff and cross functional staff groups. Input and recommendations were shared with staff, the leadership group and became part of the FY11 CACC plan. CACC members also participated in 100% of Agency orientations of new staff. Committee
FY10 Annual Performance Analysis Page 47 of 51
members provided an overview of the Annual Plan, reviewed CLAS standards and shared cultural and linguistic initiatives and activities within the Agency. The committee also continued the expectation for all staff to participate in at least one cultural awareness activity per year, and sponsored two sensitivity and awareness classes for new staff, 15 brown bags, special activities for African American History Month, and supported the Area Planning and Services Committee for Individuals Aging with Developmental Disabilities.
OBJECTIVES FOR THE COMING YEAR
Increase awareness and adherence to CLAS standards Finalize interpreter use guidelines Translate Key Agency Forms in Spanish Translate Client Rights and Code of Ethics brochure in Spanish Create printed educational brochures on mental illnesses using Network of Care and other free sites
Ensure signage regarding the availability of interpreters is visible at all locations where clients have first appointments
Develop Language Books for ESP and Access so that they can identify what language a person is speaking
Create phone messages in Spanish Draft a plan to provide Internet message in Spanish regarding how to access services Provide year end program demographic information to all staff Ensure all staff attend at least one diversity training per year Increase cultural and linguistic awareness Provide education about agency’s value and commitment to cultural competency at every agency orientation
Provide Sensitivity and Awareness training to all new employees Support State Cultural and Linguistic Steering Committee efforts Maintain diversity bulletin boards in at least three locations Offer additional educational activities during Black History Month Inform staff of cultural competent activities, information and training Increase staff networking to support agency value of partnering and sharing Track data and statistics Increase CACC’s tool kit Continue to support Network of Care
FY10 Annual Performance Analysis Page 48 of 51
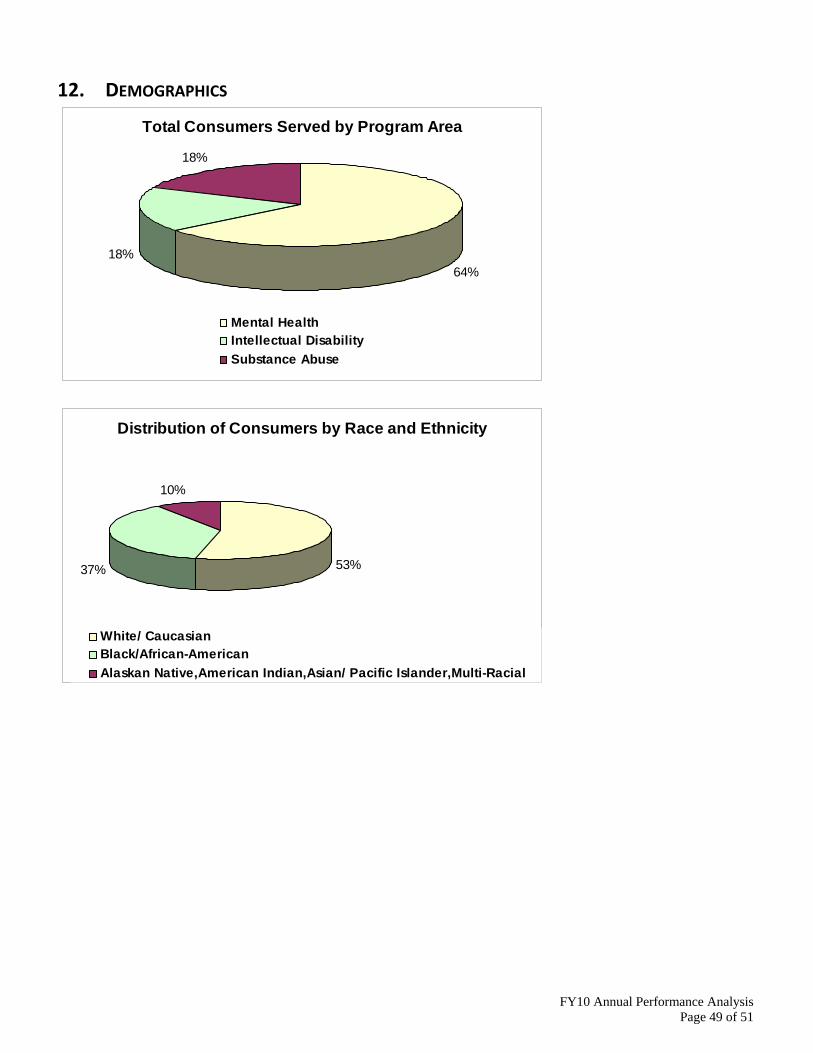
12. DEMOGRAPHICS
Total Consumers Served by Program Area
18%
18%64%
Mental HealthIntellectual DisabilitySubstance Abuse
Distribution of Consumers by Race and Ethnicity
53%37%
10%
White/ CaucasianBlack/African-AmericanAlaskan Native,American Indian,Asian/ Pacific Islander,Multi-Racial
FY10 Annual Performance Analysis Page 49 of 51
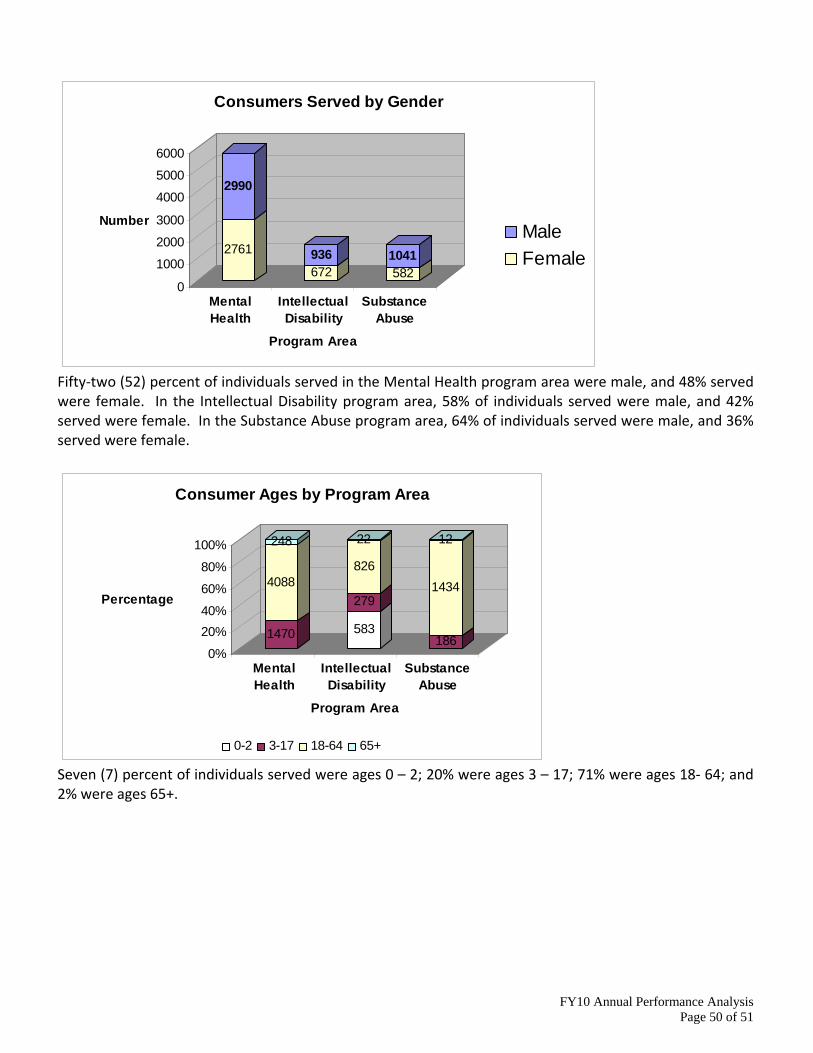
2761
2990
672936
5821041
0
1000
2000
3000
4000
5000
6000
Number
MentalHealth
IntellectualDisability
SubstanceAbuse
Program Area
Consumers Served by Gender
MaleFemale
Fifty‐two (52) percent of individuals served in the Mental Health program area were male, and 48% served were female. In the Intellectual Disability program area, 58% of individuals served were male, and 42% served were female. In the Substance Abuse program area, 64% of individuals served were male, and 36% served were female.
1470
4088
248
583
279
826
22
186
1434
12
0%
20%40%
60%
80%
100%
Percentage
MentalHealth
IntellectualDisability
SubstanceAbuse
Program Area
Consumer Ages by Program Area
0-2 3-17 18-64 65+
Seven (7) percent of individuals served were ages 0 – 2; 20% were ages 3 – 17; 71% were ages 18‐ 64; and 2% were ages 65+.
FY10 Annual Performance Analysis Page 50 of 51
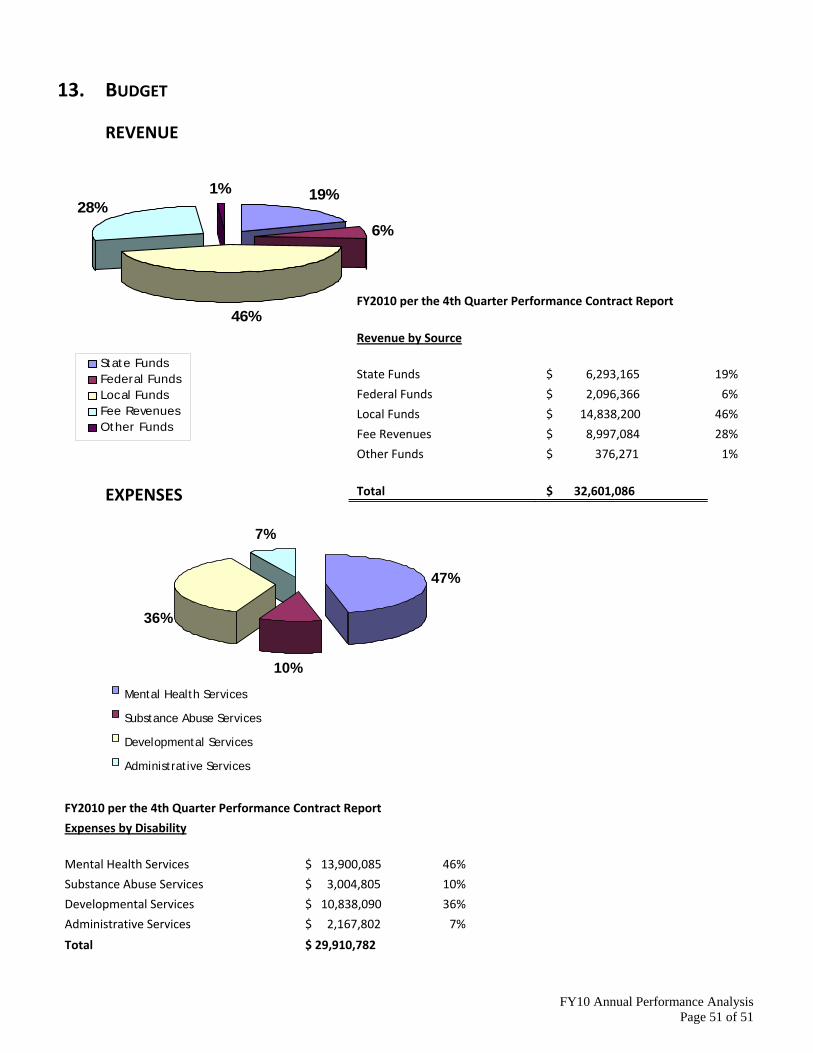
13. BUDGET
REVENUE
19%
6%
46%
28%1%
State FundsFederal FundsLocal FundsFee RevenuesOther Funds
FY2010 per the 4th Quarter Performance Contract Report
Revenue by Source
State Funds $ 6,293,165 19%
Federal Funds $ 2,096,366 6%
Local Funds $ 14,838,200 46%
Fee Revenues $ 8,997,084 28%
Other Funds $ 376,271 1%
Total $ 32,601,086
EXPENSES
FY10 Annual Performance Analysis Page 51 of 51
FY2010 per the 4th Quarter Performance Contract Report
Expenses by Disability
Mental Health Services $ 13,900,085 46%
Substance Abuse Services $ 3,004,805 10%
Developmental Services $ 10,838,090 36%
Administrative Services $ 2,167,802 7%
Total $ 29,910,782
7%
36%
10%
Administrative Services Developmental Services Substance Abuse Services Mental Health Services
47%