Embed Size (px)
Citation preview
Proceedings World Geothermal Congress 2015
Melbourne, Australia, 19-25 April 2015
1
Performance Analysis and Stimulation of Dry Steam Wells in Mak-Ban Geothermal Field,
Philippines
Frederick Libert1 and Ryan Alvarez
2
1Chevron Geothermal Indonesia, 26F Sentral Senayan Tower 2, Jalan Asia Afrika No. 8, Jakarta 10270, Indonesia
2Philippine Geothermal Production Company, Inc., 14F 6750 Building, Ayala Avenue, Makati City, Philippines
[email protected]; [email protected]
Keywords: Mak-Ban, Wellbore model, Scale, Clean out, Injection stimulation, Dry steam, Deliverability
ABSTRACT
There are 11 wells in the Mak-Ban field that have or are producing dry steam from the shallow steam cap. It had been noticed that
the historical steam flowrate decline in some of these wells was higher than in others but it had been assumed that this was due to
pressure decline associated with an increase in shallow production. The wells were recently analyzed using Wellhist, a Chevron in-
house application that uses wellbore simulation to calibrate well hydraulic models to match production history. By comparing the
expected well capability calculated with WellHist with actual production, it is possible to recognize changes in well performance
due to mechanical well constraints or other flow assurance issues that could be used for trouble shooting or provide the basis for a
more in depth performance analysis and possibly remedial wellwork.
The WellHist analysis strongly suggested that the production performance of three wells namely Bul-20, Bul-23, and Bul-60 are
below expectations, based on the estimated pressure changes in the reservoir, suggesting that other factors, such as changes in
wellbore geometry and/or reduction in effective permeability are causing the reduced performance. The data from these three wells
were also further analyzed using the method developed by Acuna (2008) where data from well deliverability tests or from records
of wellhead pressure and production rate can be used to solve two parameters; the Wellbore Coefficient (CWB) and the Productivity
Index (PI) that should not change with time unless there is a variation in wellbore geometry or effective permeability. For the case
of Bul-20, 23, and 60 it was found that the CWB and PI do change with time which indicates that these wells have experienced
changes/reduction in wellbore geometry, probably associated with scaling in the wellbore of some type. It is also possible that the
wells may have experienced permeability reduction due to scaling in the formation. Based on the analysis, successful work overs
on these wells could recover 205 kilo pound per hour (kph) (26 kg/s) of steam production.
The primary result from this evaluation was to provide a recommendation to conduct necessary recovery works to return the wells
to their expected performance. A series of diagnostic works were performed and it was decided to initially try and improve well
performance by injecting cold condensate. This was applied to Bul-23 with the intention of exposing the casing to a cold
environment thus inducing a thermal shock to the casing that is expected to contract the casing and spall-off the deposited scale.
Based on the results, it appears that this technique was successful in recovering the well to its expected performance.
1. INTRODUCTION
For dry steam wells, the variation of steam flowrate with time is essentially a function of steam cap pressure performance since the
fluid enthalpy of the feed zone(s) is constant. This also assumes that the well has 100% reliability and no flow assurance issues.
Any reservoir related process such as change in mass extraction rate, influence of recharge, etc. will be manifested as a variation of
the steam cap pressure trend. Therefore, if there are wells showing a significant difference in flow rate decline trend when
compared to similar wells in the field, then it is a strong indication that a wellbore (and/or near wellbore/formation) related process
is affecting the production.
The historical well data can also be analyzed using a process involving wellbore simulation to estimate the flow rate changes based
on knowledge of the steam zone pressure changes with time. Chevron has developed an in-house procedure called “Wellhist” to
provide this type of analysis and the steps followed are summarized in Figure 1. The first step of this evaluation is to establish the
reservoir steam zone pressure trend based on available static Pressure-Temperature (PT) surveys from wells and shut-in wellhead
pressure data. The next step is to use Wellhist to construct time-series wellbore hydraulic models of the dry steam wells, using the
wellbore geometry, pressure and enthalpy evolution at the feedzone(s) depth from established steam zone pressure trend and
feedzone information (feedzone depth, initial PI – productivity index) from Pressure-Temperature-Spinner (PTS) surveys. For wells
with no PTS information it is assumed that the well has a single feedzone at the center of the productive zone. For a dry steam well,
using one feedzone in the center of the feedzone locations and summing the PI value to perform wellbore simulation will have
relatively the same result as using multiple feedzones (Acuna (2010); Grant and Bixley (2011)).
Wellhist evaluation is then performed by calibrating the PI to match the well’s measured production data. During the calibration
process, it is assumed that well geometry and permeability is unchanged throughout the entire period of well production. With this
assumption, PI distribution for a well with more than one feedzone is constant. The Wellhist run output is then compared against
measured historical production data. For a well with 100% reliability and no flow assurance issue, it should be possible to reach a
solution where the Wellhist output will match the historical data, while any differences observed indicate that variation in wellbore
geometry and/or permeability is occurring. This process had been initially applied to wells in the Salak geothermal field, Indonesia
and found to provide useful results (Libert and Pasikki, 2010) and it was therefore decided to also apply it to the Mak-Ban wells.
Libert and Alvarez
2
2. “WELLHIST” ANALYSIS APPLIED TO MAK-BAN STEAM WELLS
The Mak-Ban geothermal field, which is operated by Philippine Geothermal Production Company, Inc. (PGPC), has ~70
production wells and 11 of these wells have or are producing only dry steam from the shallow steam cap. The Wellhist process
(Figure 1) was applied to these 11 wells with the purpose of checking their performance to see if there were any that were showing
indications of flow assurance issues and could therefore be candidates for wellwork to improve their production. Among the 11
wells evaluated, four wells showed strong indications of variation in wellbore geometry and/or permeability during their production
history; one of these wells (Bul-64) was suspended in 2005, two (Bul-20 and Bul-23) were shut-in due to low productivity and one
(Bul-60) was on production.
Further analysis was then performed on Bul-20, Bul-23 and Bul-60 by applying an improved method for dry steam well decline
analysis using Acuna’s Equation (Acuna, 2008) in order to distinguish the type of variation that has caused the difference between
the Wellhist output and historical data. This evaluation suggested that these wells most likely experienced changes/reduction in
wellbore geometry although it is also possible that there has been some permeability reduction in the near-wellbore region, even if
it was only minimal.
Figure 1. Flow chart of WellMak-Ban Dry Steam Well Evaluation
2.1 Mak-Ban Steam Cap Pressure Trend
The precision and quality of the Wellhist process is highly dependent on the accuracy of steam cap pressure evolution data, since
dry steam well performance is driven primarily by the steam cap pressure evolution.
The reservoir steam cap pressure trend for Mak-Ban was established by combining the measurements from static PT surveys of dry
steam wells, and shallow two-phase wells with Total Depth (TD) less than 4500 ftMD that are not disturbed by the effects of
interzonal flow and shut-in wellhead pressures of wells with steam zone that were gravity corrected to reservoir depth.
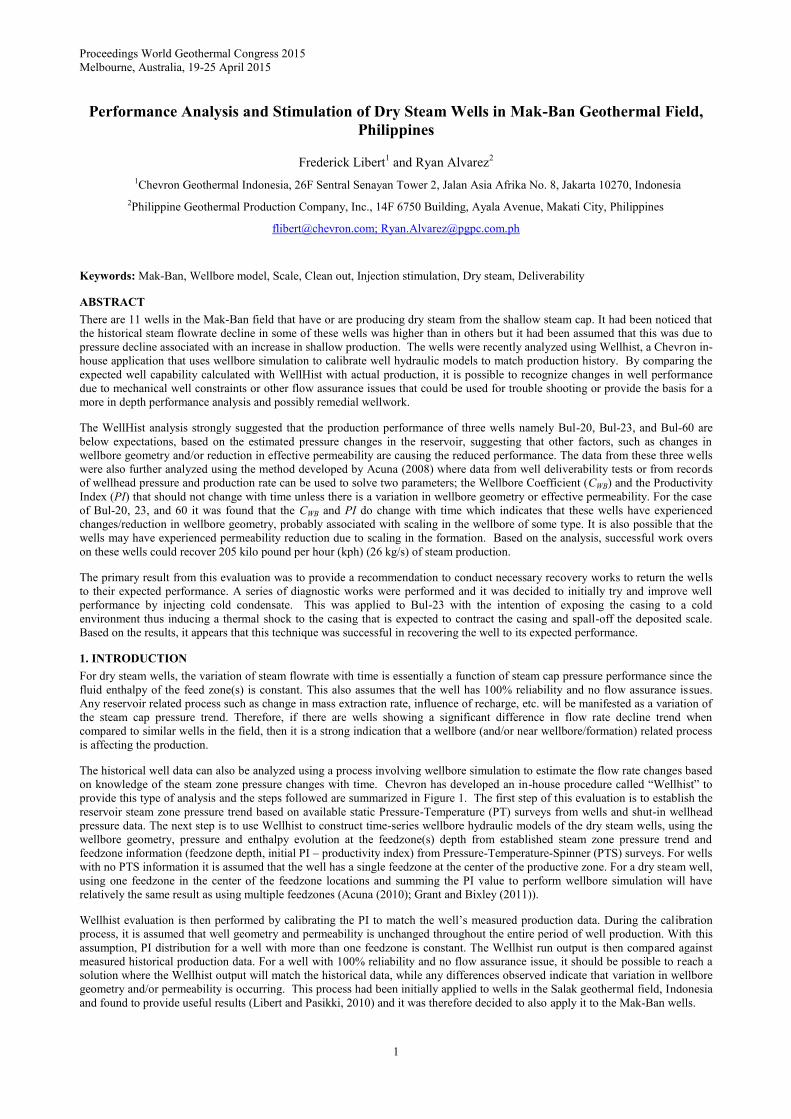
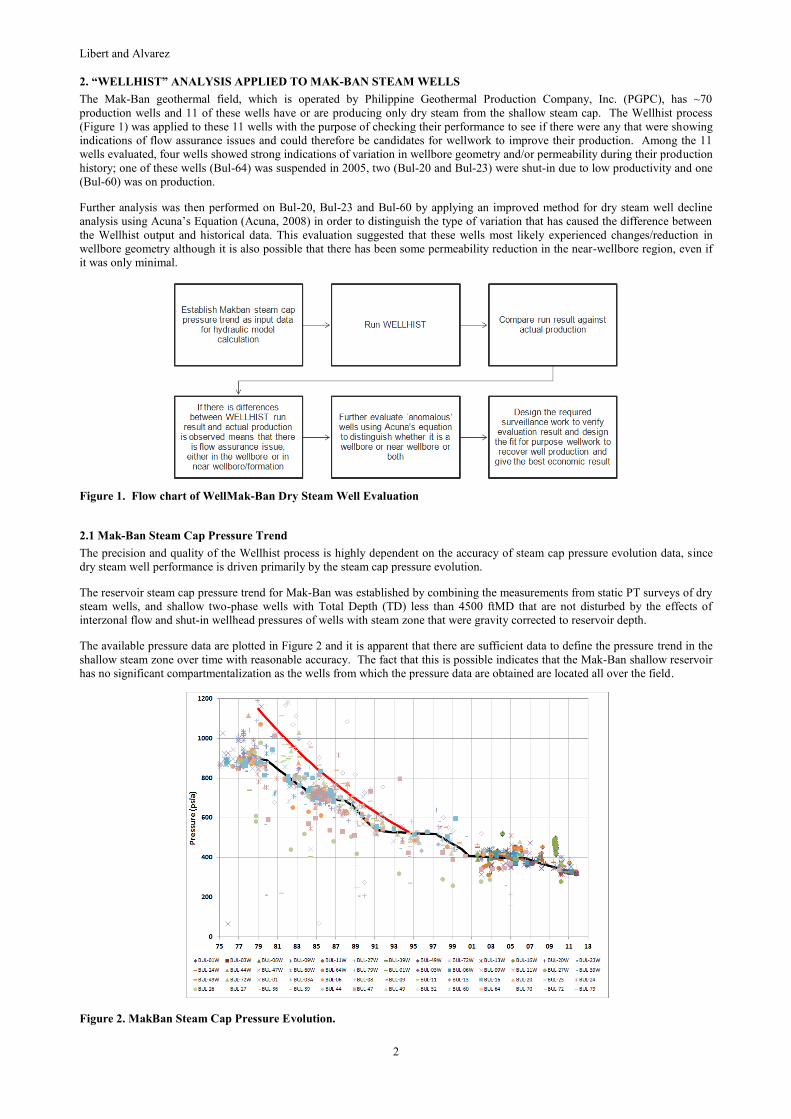
The available pressure data are plotted in Figure 2 and it is apparent that there are sufficient data to define the pressure trend in the
shallow steam zone over time with reasonable accuracy. The fact that this is possible indicates that the Mak-Ban shallow reservoir
has no significant compartmentalization as the wells from which the pressure data are obtained are located all over the field.
Figure 2. MakBan Steam Cap Pressure Evolution.
Libert and Alvarez
3
2.2 Wellhist Evaluation
The wellbore hydraulic models for the Mak-Ban steam wells were constructed using the following variables:
Wellbore geometry from well completion information
Feedzone(s) location(s) and initial PI from PTS survey(s) or by assuming a single feedzone at the center of the productive
zone for wells with no PTS information
Feedzone(s) pressure evolution based on established reservoir steam cap trend (Figure 2)
Feedzone enthalpy assumed to be saturated steam
Well historical production data records, including flow rate and wellhead pressure
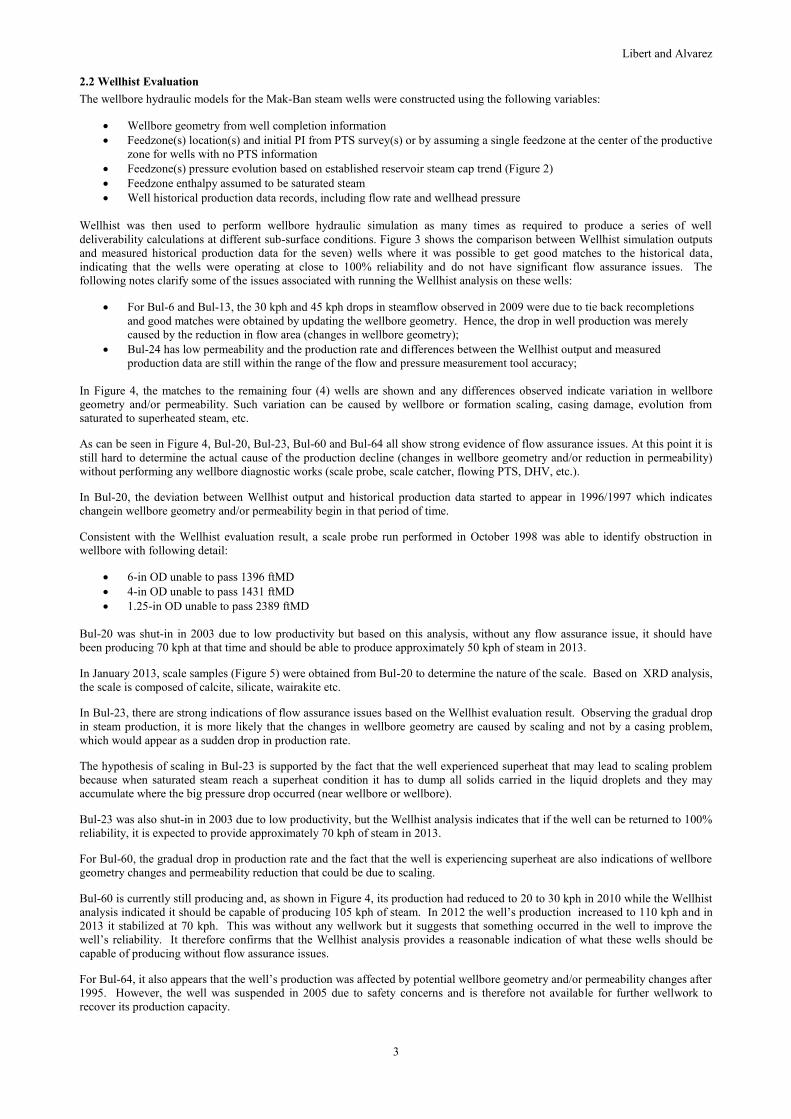
Wellhist was then used to perform wellbore hydraulic simulation as many times as required to produce a series of well
deliverability calculations at different sub-surface conditions. Figure 3 shows the comparison between Wellhist simulation outputs
and measured historical production data for the seven) wells where it was possible to get good matches to the historical data,
indicating that the wells were operating at close to 100% reliability and do not have significant flow assurance issues. The
following notes clarify some of the issues associated with running the Wellhist analysis on these wells:
For Bul-6 and Bul-13, the 30 kph and 45 kph drops in steamflow observed in 2009 were due to tie back recompletions
and good matches were obtained by updating the wellbore geometry. Hence, the drop in well production was merely
caused by the reduction in flow area (changes in wellbore geometry);
Bul-24 has low permeability and the production rate and differences between the Wellhist output and measured
production data are still within the range of the flow and pressure measurement tool accuracy;
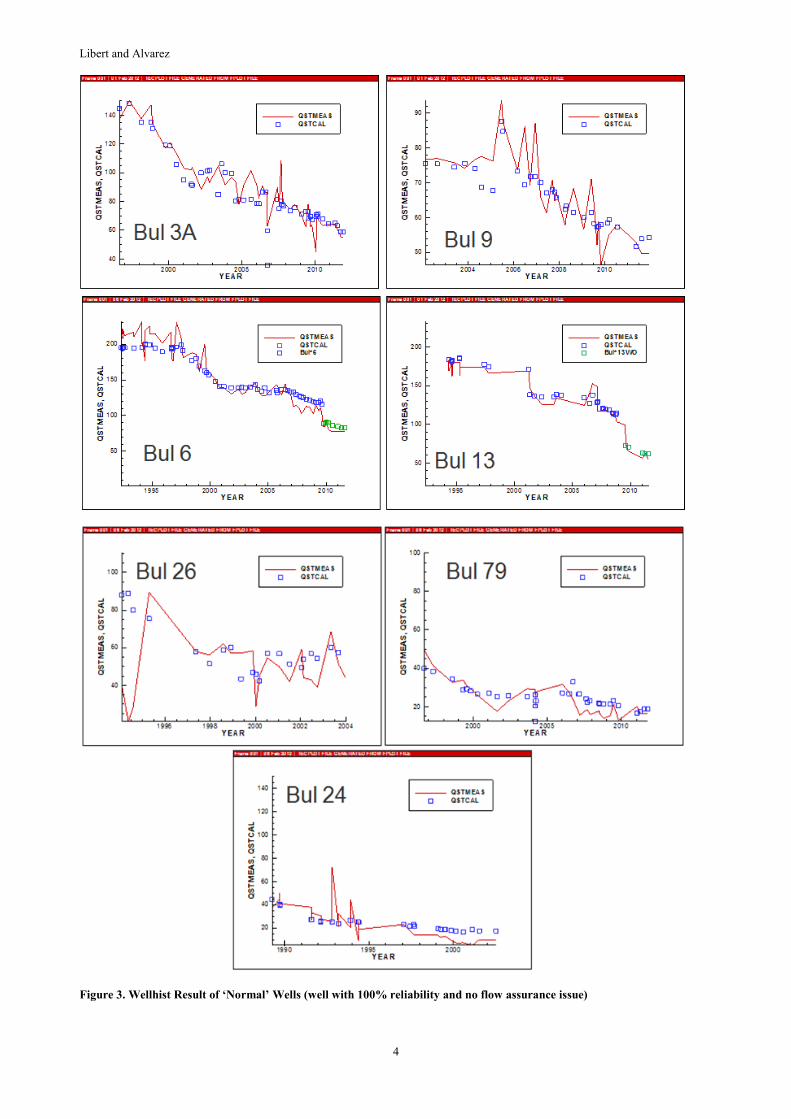
In Figure 4, the matches to the remaining four (4) wells are shown and any differences observed indicate variation in wellbore
geometry and/or permeability. Such variation can be caused by wellbore or formation scaling, casing damage, evolution from
saturated to superheated steam, etc.
As can be seen in Figure 4, Bul-20, Bul-23, Bul-60 and Bul-64 all show strong evidence of flow assurance issues. At this point it is
still hard to determine the actual cause of the production decline (changes in wellbore geometry and/or reduction in permeability)
without performing any wellbore diagnostic works (scale probe, scale catcher, flowing PTS, DHV, etc.).
In Bul-20, the deviation between Wellhist output and historical production data started to appear in 1996/1997 which indicates
changein wellbore geometry and/or permeability begin in that period of time.
Consistent with the Wellhist evaluation result, a scale probe run performed in October 1998 was able to identify obstruction in
wellbore with following detail:
6-in OD unable to pass 1396 ftMD
4-in OD unable to pass 1431 ftMD
1.25-in OD unable to pass 2389 ftMD
Bul-20 was shut-in in 2003 due to low productivity but based on this analysis, without any flow assurance issue, it should have
been producing 70 kph at that time and should be able to produce approximately 50 kph of steam in 2013.
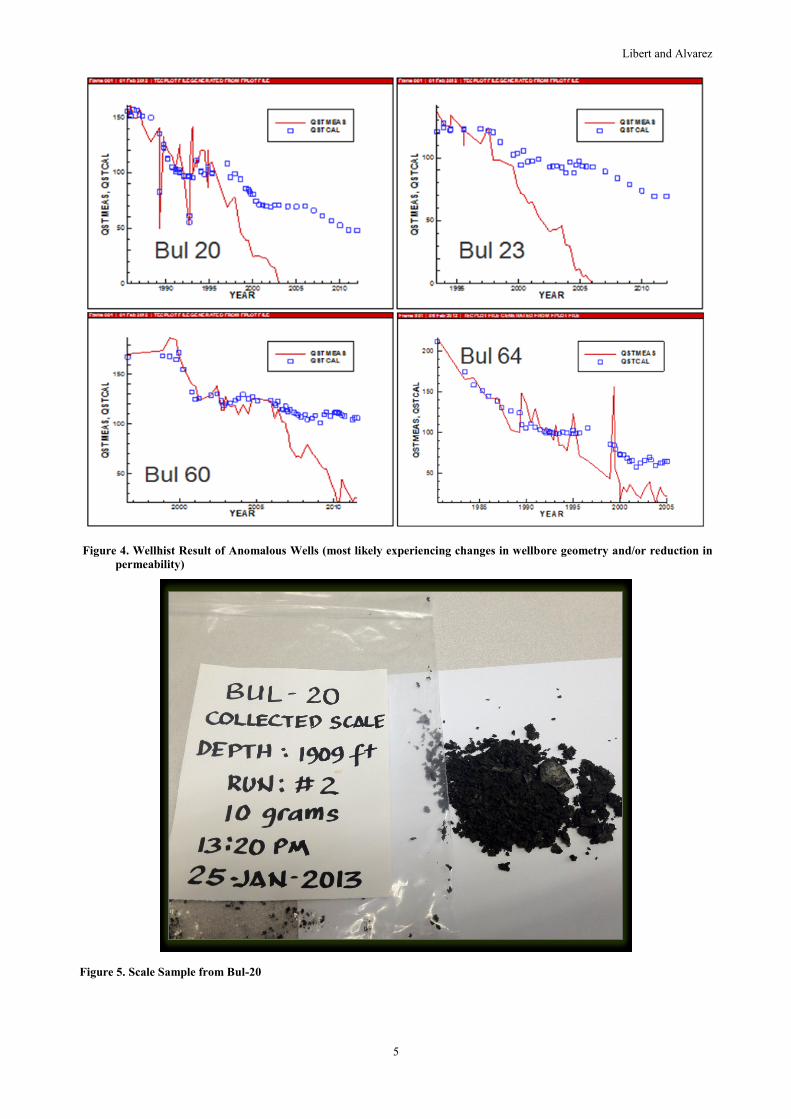
In January 2013, scale samples (Figure 5) were obtained from Bul-20 to determine the nature of the scale. Based on XRD analysis,
the scale is composed of calcite, silicate, wairakite etc.
In Bul-23, there are strong indications of flow assurance issues based on the Wellhist evaluation result. Observing the gradual drop
in steam production, it is more likely that the changes in wellbore geometry are caused by scaling and not by a casing problem,
which would appear as a sudden drop in production rate.
The hypothesis of scaling in Bul-23 is supported by the fact that the well experienced superheat that may lead to scaling problem
because when saturated steam reach a superheat condition it has to dump all solids carried in the liquid droplets and they may
accumulate where the big pressure drop occurred (near wellbore or wellbore).
Bul-23 was also shut-in in 2003 due to low productivity, but the Wellhist analysis indicates that if the well can be returned to 100%
reliability, it is expected to provide approximately 70 kph of steam in 2013.
For Bul-60, the gradual drop in production rate and the fact that the well is experiencing superheat are also indications of wellbore
geometry changes and permeability reduction that could be due to scaling.
Bul-60 is currently still producing and, as shown in Figure 4, its production had reduced to 20 to 30 kph in 2010 while the Wellhist
analysis indicated it should be capable of producing 105 kph of steam. In 2012 the well’s production increased to 110 kph and in
2013 it stabilized at 70 kph. This was without any wellwork but it suggests that something occurred in the well to improve the
well’s reliability. It therefore confirms that the Wellhist analysis provides a reasonable indication of what these wells should be
capable of producing without flow assurance issues.
For Bul-64, it also appears that the well’s production was affected by potential wellbore geometry and/or permeability changes after
1995. However, the well was suspended in 2005 due to safety concerns and is therefore not available for further wellwork to
recover its production capacity.
Libert and Alvarez
4
Figure 3. Wellhist Result of ‘Normal’ Wells (well with 100% reliability and no flow assurance issue)
Libert and Alvarez
5
Figure 4. Wellhist Result of Anomalous Wells (most likely experiencing changes in wellbore geometry and/or reduction in
permeability)
Figure 5. Scale Sample from Bul-20
Libert and Alvarez
6
3. IMPROVED METHOD FOR DECLINE ANALYSIS IN A DRY STEAM WELL
The Wellhist evaluation result revealed that Bul-20, Bul-23 and Bul-60 may have approximately 205 kph of stranded steam as a
negative result from changes in wellbore geometry and/or reduction in permeability. By taking into consideration the gradual
production drop at the period where Wellhist output and historical data starts to deviate, it could be speculated that it is a scaling
process, as any casing damage progression is expected to be a rapid/sudden event.
Further evaluation on these anomalous wells was then performed by applying Acuna’s Equation (Acuna, 2010) with the objective
of being able to distinguish the source or major cause of identified flow assurance issue, whether it is changes in wellbore geometry
only, changes in permeability, or combination of both.
Acuna’s Equation expresses deliverability of a steam well as:
5.0
222
f
rgrg
rgWB pPI
WppCW
Where PI is the well productivity index corrected for mobility and ECF, CWB is wellbore coefficient, prg is gravity corrected
reservoir pressure, pf is wellhead pressure, and νrg is kinematic viscosity
The derivation of Acuna’s Equation is described in detail in Acuna (2010). This document will focus on the application of Acuna’s
Equation to further understand the major cause of production drop of the three anomalous wells in order to effectively design the
required surveillance work that will result in recommendations of the appropriate recovery works.
Data from well deliverability tests or from records of wellhead pressure, shut-in wellbore pressure, and flow rate can be used to
calculate the two unknown in Acuna’s Equation which are the CWB and PI. These parameters should not change with time unless
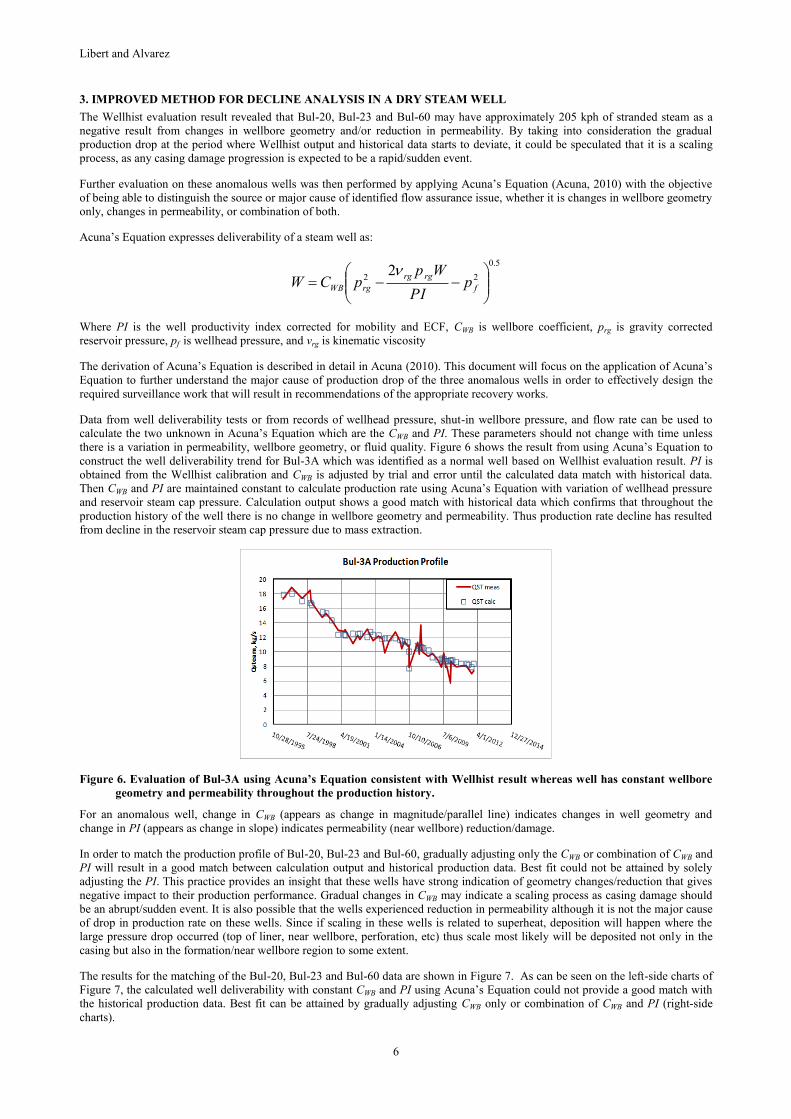
there is a variation in permeability, wellbore geometry, or fluid quality. Figure 6 shows the result from using Acuna’s Equation to
construct the well deliverability trend for Bul-3A which was identified as a normal well based on Wellhist evaluation result. PI is
obtained from the Wellhist calibration and CWB is adjusted by trial and error until the calculated data match with historical data.
Then CWB and PI are maintained constant to calculate production rate using Acuna’s Equation with variation of wellhead pressure
and reservoir steam cap pressure. Calculation output shows a good match with historical data which confirms that throughout the
production history of the well there is no change in wellbore geometry and permeability. Thus production rate decline has resulted
from decline in the reservoir steam cap pressure due to mass extraction.
Figure 6. Evaluation of Bul-3A using Acuna’s Equation consistent with Wellhist result whereas well has constant wellbore
geometry and permeability throughout the production history.
For an anomalous well, change in CWB (appears as change in magnitude/parallel line) indicates changes in well geometry and
change in PI (appears as change in slope) indicates permeability (near wellbore) reduction/damage.
In order to match the production profile of Bul-20, Bul-23 and Bul-60, gradually adjusting only the CWB or combination of CWB and
PI will result in a good match between calculation output and historical production data. Best fit could not be attained by solely
adjusting the PI. This practice provides an insight that these wells have strong indication of geometry changes/reduction that gives
negative impact to their production performance. Gradual changes in CWB may indicate a scaling process as casing damage should
be an abrupt/sudden event. It is also possible that the wells experienced reduction in permeability although it is not the major cause
of drop in production rate on these wells. Since if scaling in these wells is related to superheat, deposition will happen where the
large pressure drop occurred (top of liner, near wellbore, perforation, etc) thus scale most likely will be deposited not only in the
casing but also in the formation/near wellbore region to some extent.
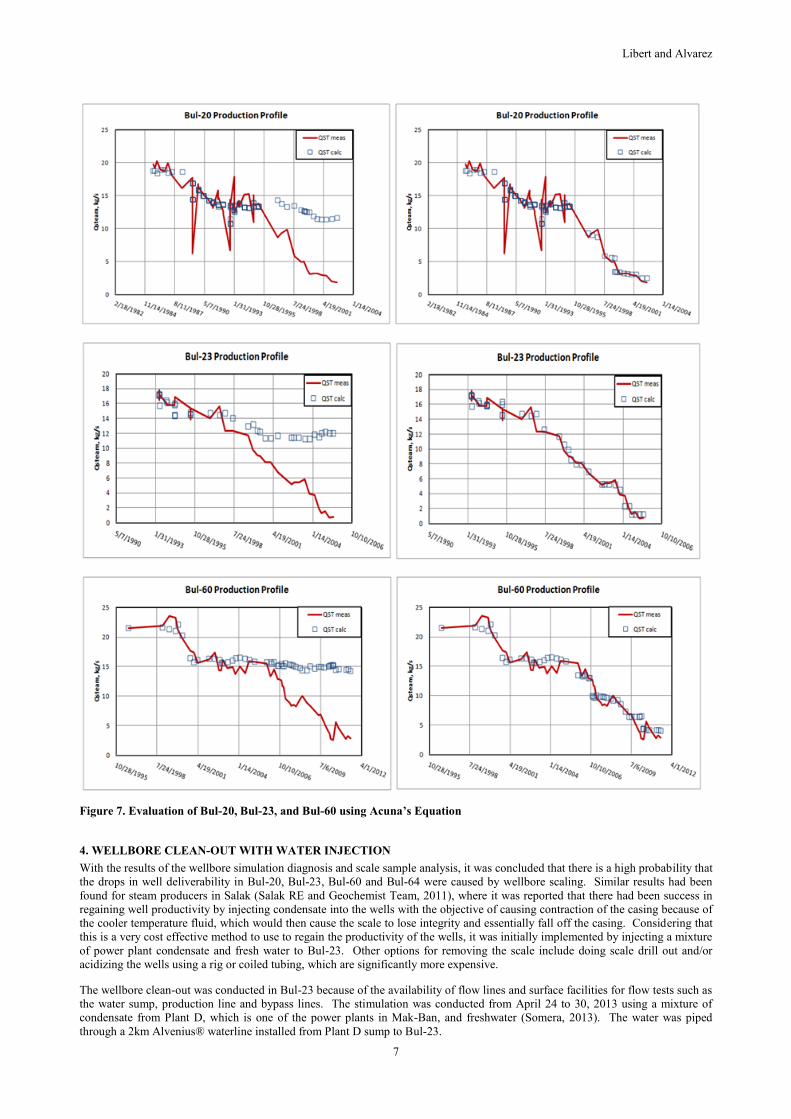
The results for the matching of the Bul-20, Bul-23 and Bul-60 data are shown in Figure 7. As can be seen on the left-side charts of
Figure 7, the calculated well deliverability with constant CWB and PI using Acuna’s Equation could not provide a good match with
the historical production data. Best fit can be attained by gradually adjusting CWB only or combination of CWB and PI (right-side
charts).
Libert and Alvarez
7
Figure 7. Evaluation of Bul-20, Bul-23, and Bul-60 using Acuna’s Equation
4. WELLBORE CLEAN-OUT WITH WATER INJECTION
With the results of the wellbore simulation diagnosis and scale sample analysis, it was concluded that there is a high probability that
the drops in well deliverability in Bul-20, Bul-23, Bul-60 and Bul-64 were caused by wellbore scaling. Similar results had been
found for steam producers in Salak (Salak RE and Geochemist Team, 2011), where it was reported that there had been success in
regaining well productivity by injecting condensate into the wells with the objective of causing contraction of the casing because of
the cooler temperature fluid, which would then cause the scale to lose integrity and essentially fall off the casing. Considering that
this is a very cost effective method to use to regain the productivity of the wells, it was initially implemented by injecting a mixture
of power plant condensate and fresh water to Bul-23. Other options for removing the scale include doing scale drill out and/or
acidizing the wells using a rig or coiled tubing, which are significantly more expensive.
The wellbore clean-out was conducted in Bul-23 because of the availability of flow lines and surface facilities for flow tests such as
the water sump, production line and bypass lines. The stimulation was conducted from April 24 to 30, 2013 using a mixture of
condensate from Plant D, which is one of the power plants in Mak-Ban, and freshwater (Somera, 2013). The water was piped
through a 2km Alvenius® waterline installed from Plant D sump to Bul-23.
Libert and Alvarez
8
For the first part of the stimulation, a high discharge pressure and low discharge flow rate pump was used to kill Bul-23 as the
well’s shut in well head pressure (SIWHP) and temperature were 320 psi and 400ºF respectively. The objective of the well killing
was to lower the well head pressure in order to start the injection of the mixture of condensate and freshwater using three high
discharge flow rate, low discharge pressure pumps.
To determine the effectiveness of the condensate injection stimulation, wellbore surveys (downhole temperature / pressure and
scale probes), injectivity tests and flow tests were conducted at various times during the stimulation.
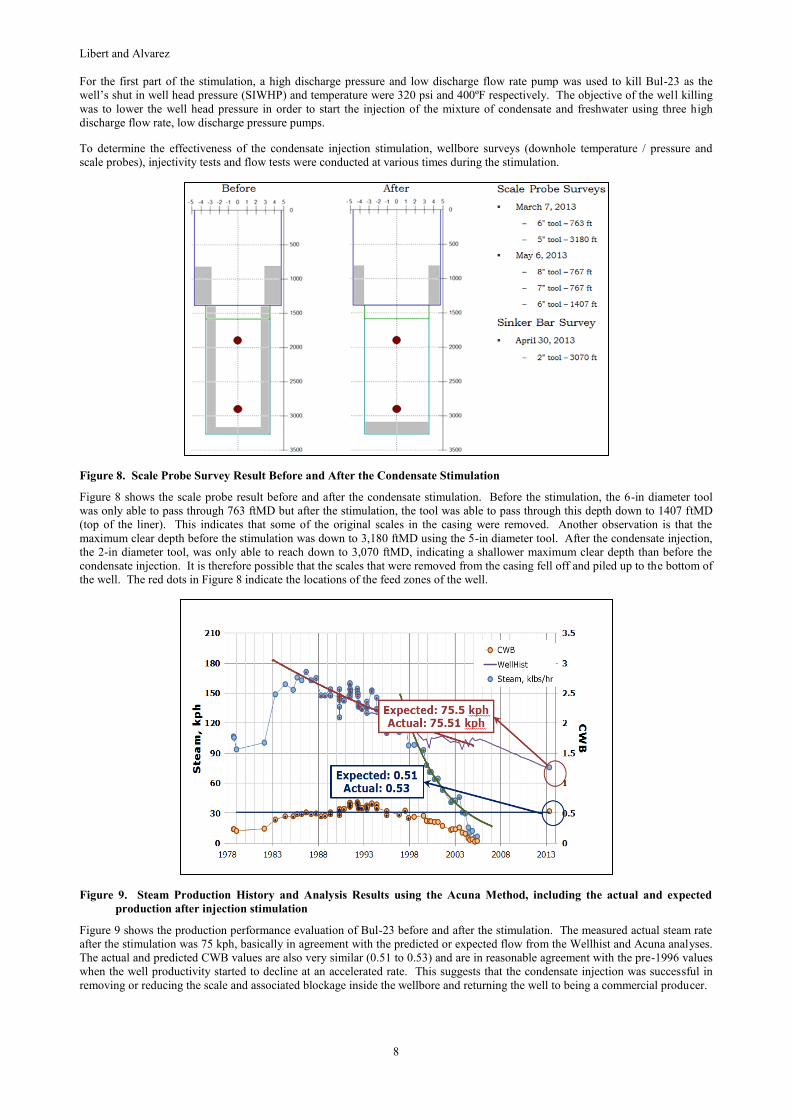
Figure 8. Scale Probe Survey Result Before and After the Condensate Stimulation
Figure 8 shows the scale probe result before and after the condensate stimulation. Before the stimulation, the 6-in diameter tool
was only able to pass through 763 ftMD but after the stimulation, the tool was able to pass through this depth down to 1407 ftMD
(top of the liner). This indicates that some of the original scales in the casing were removed. Another observation is that the
maximum clear depth before the stimulation was down to 3,180 ftMD using the 5-in diameter tool. After the condensate injection,
the 2-in diameter tool, was only able to reach down to 3,070 ftMD, indicating a shallower maximum clear depth than before the
condensate injection. It is therefore possible that the scales that were removed from the casing fell off and piled up to the bottom of
the well. The red dots in Figure 8 indicate the locations of the feed zones of the well.
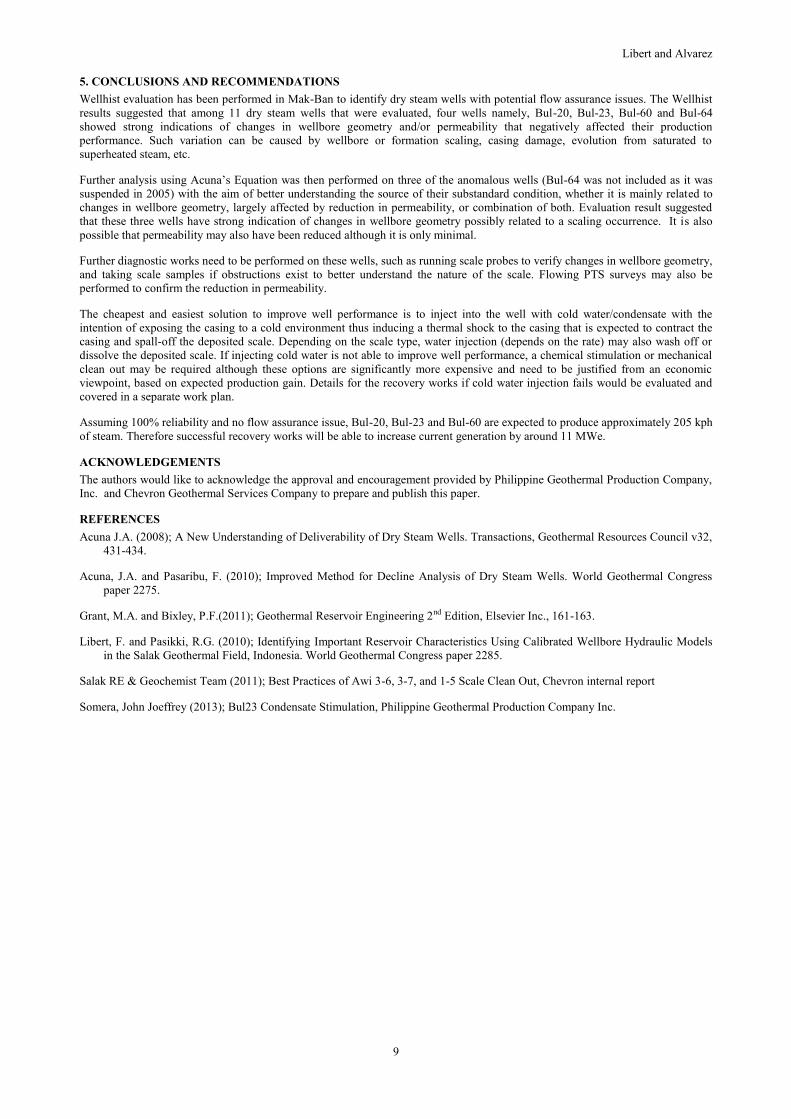
Figure 9. Steam Production History and Analysis Results using the Acuna Method, including the actual and expected
production after injection stimulation
Figure 9 shows the production performance evaluation of Bul-23 before and after the stimulation. The measured actual steam rate
after the stimulation was 75 kph, basically in agreement with the predicted or expected flow from the Wellhist and Acuna analyses.
The actual and predicted CWB values are also very similar (0.51 to 0.53) and are in reasonable agreement with the pre-1996 values
when the well productivity started to decline at an accelerated rate. This suggests that the condensate injection was successful in
removing or reducing the scale and associated blockage inside the wellbore and returning the well to being a commercial producer.
Libert and Alvarez
9
5. CONCLUSIONS AND RECOMMENDATIONS
Wellhist evaluation has been performed in Mak-Ban to identify dry steam wells with potential flow assurance issues. The Wellhist
results suggested that among 11 dry steam wells that were evaluated, four wells namely, Bul-20, Bul-23, Bul-60 and Bul-64
showed strong indications of changes in wellbore geometry and/or permeability that negatively affected their production
performance. Such variation can be caused by wellbore or formation scaling, casing damage, evolution from saturated to
superheated steam, etc.
Further analysis using Acuna’s Equation was then performed on three of the anomalous wells (Bul-64 was not included as it was
suspended in 2005) with the aim of better understanding the source of their substandard condition, whether it is mainly related to
changes in wellbore geometry, largely affected by reduction in permeability, or combination of both. Evaluation result suggested
that these three wells have strong indication of changes in wellbore geometry possibly related to a scaling occurrence. It is also
possible that permeability may also have been reduced although it is only minimal.
Further diagnostic works need to be performed on these wells, such as running scale probes to verify changes in wellbore geometry,
and taking scale samples if obstructions exist to better understand the nature of the scale. Flowing PTS surveys may also be
performed to confirm the reduction in permeability.
The cheapest and easiest solution to improve well performance is to inject into the well with cold water/condensate with the
intention of exposing the casing to a cold environment thus inducing a thermal shock to the casing that is expected to contract the
casing and spall-off the deposited scale. Depending on the scale type, water injection (depends on the rate) may also wash off or
dissolve the deposited scale. If injecting cold water is not able to improve well performance, a chemical stimulation or mechanical
clean out may be required although these options are significantly more expensive and need to be justified from an economic
viewpoint, based on expected production gain. Details for the recovery works if cold water injection fails would be evaluated and
covered in a separate work plan.
Assuming 100% reliability and no flow assurance issue, Bul-20, Bul-23 and Bul-60 are expected to produce approximately 205 kph
of steam. Therefore successful recovery works will be able to increase current generation by around 11 MWe.
ACKNOWLEDGEMENTS
The authors would like to acknowledge the approval and encouragement provided by Philippine Geothermal Production Company,
Inc. and Chevron Geothermal Services Company to prepare and publish this paper.
REFERENCES
Acuna J.A. (2008); A New Understanding of Deliverability of Dry Steam Wells. Transactions, Geothermal Resources Council v32,
431-434.
Acuna, J.A. and Pasaribu, F. (2010); Improved Method for Decline Analysis of Dry Steam Wells. World Geothermal Congress
paper 2275.
Grant, M.A. and Bixley, P.F.(2011); Geothermal Reservoir Engineering 2nd Edition, Elsevier Inc., 161-163.
Libert, F. and Pasikki, R.G. (2010); Identifying Important Reservoir Characteristics Using Calibrated Wellbore Hydraulic Models
in the Salak Geothermal Field, Indonesia. World Geothermal Congress paper 2285.
Salak RE & Geochemist Team (2011); Best Practices of Awi 3-6, 3-7, and 1-5 Scale Clean Out, Chevron internal report
Somera, John Joeffrey (2013); Bul23 Condensate Stimulation, Philippine Geothermal Production Company Inc.