Embed Size (px)
Citation preview
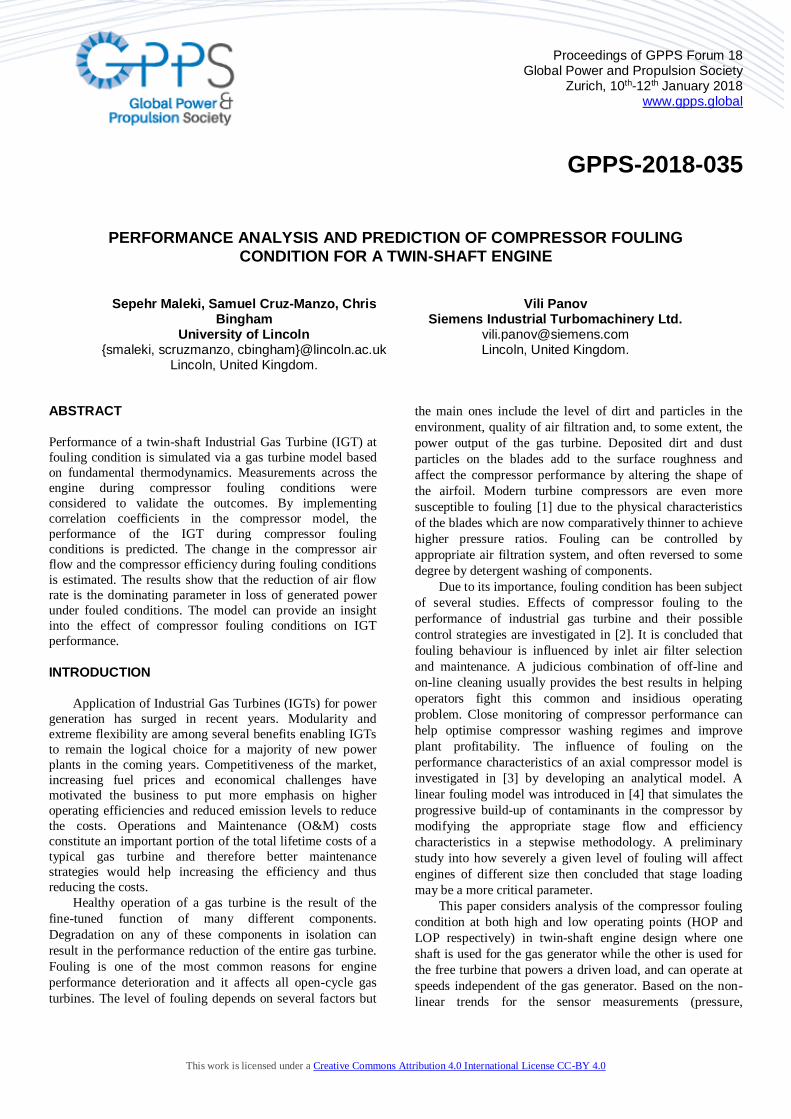
Proceedings of GPPS Forum 18 Global Power and Propulsion Society
Zurich, 10th-12th January 2018 www.gpps.global
This work is licensed under a Creative Commons Attribution 4.0 International License CC-BY 4.0
GPPS-2018-035
PERFORMANCE ANALYSIS AND PREDICTION OF COMPRESSOR FOULING CONDITION FOR A TWIN-SHAFT ENGINE
Sepehr Maleki, Samuel Cruz-Manzo, Chris Bingham
University of Lincoln {smaleki, scruzmanzo, cbingham}@lincoln.ac.uk
Lincoln, United Kingdom.
Vili Panov Siemens Industrial Turbomachinery Ltd.
[email protected] Lincoln, United Kingdom.
ABSTRACT
Performance of a twin-shaft Industrial Gas Turbine (IGT) at
fouling condition is simulated via a gas turbine model based
on fundamental thermodynamics. Measurements across the
engine during compressor fouling conditions were
considered to validate the outcomes. By implementing
correlation coefficients in the compressor model, the
performance of the IGT during compressor fouling
conditions is predicted. The change in the compressor air
flow and the compressor efficiency during fouling conditions
is estimated. The results show that the reduction of air flow
rate is the dominating parameter in loss of generated power
under fouled conditions. The model can provide an insight
into the effect of compressor fouling conditions on IGT
performance.
INTRODUCTION
Application of Industrial Gas Turbines (IGTs) for power
generation has surged in recent years. Modularity and
extreme flexibility are among several benefits enabling IGTs
to remain the logical choice for a majority of new power
plants in the coming years. Competitiveness of the market,
increasing fuel prices and economical challenges have
motivated the business to put more emphasis on higher
operating efficiencies and reduced emission levels to reduce
the costs. Operations and Maintenance (O&M) costs
constitute an important portion of the total lifetime costs of a
typical gas turbine and therefore better maintenance
strategies would help increasing the efficiency and thus
reducing the costs.
Healthy operation of a gas turbine is the result of the
fine-tuned function of many different components.
Degradation on any of these components in isolation can
result in the performance reduction of the entire gas turbine.
Fouling is one of the most common reasons for engine
performance deterioration and it affects all open-cycle gas
turbines. The level of fouling depends on several factors but
the main ones include the level of dirt and particles in the
environment, quality of air filtration and, to some extent, the
power output of the gas turbine. Deposited dirt and dust
particles on the blades add to the surface roughness and
affect the compressor performance by altering the shape of
the airfoil. Modern turbine compressors are even more
susceptible to fouling [1] due to the physical characteristics
of the blades which are now comparatively thinner to achieve
higher pressure ratios. Fouling can be controlled by
appropriate air filtration system, and often reversed to some
degree by detergent washing of components.
Due to its importance, fouling condition has been subject
of several studies. Effects of compressor fouling to the
performance of industrial gas turbine and their possible
control strategies are investigated in [2]. It is concluded that
fouling behaviour is influenced by inlet air filter selection
and maintenance. A judicious combination of off-line and
on-line cleaning usually provides the best results in helping
operators fight this common and insidious operating
problem. Close monitoring of compressor performance can
help optimise compressor washing regimes and improve
plant profitability. The influence of fouling on the
performance characteristics of an axial compressor model is
investigated in [3] by developing an analytical model. A
linear fouling model was introduced in [4] that simulates the
progressive build-up of contaminants in the compressor by
modifying the appropriate stage flow and efficiency
characteristics in a stepwise methodology. A preliminary
study into how severely a given level of fouling will affect
engines of different size then concluded that stage loading
may be a more critical parameter.
This paper considers analysis of the compressor fouling
condition at both high and low operating points (HOP and
LOP respectively) in twin-shaft engine design where one
shaft is used for the gas generator while the other is used for
the free turbine that powers a driven load, and can operate at
speeds independent of the gas generator. Based on the non-
linear trends for the sensor measurements (pressure,
2
temperature, rotational speed across the IGT), inputs are fed
into a SIMULINK model to estimate the compressor
efficiency and the discharged airflow in fouling conditions.
METHODOLOGY Sensor measurements for a twin-shaft IGT indicating a
performance reduction due to compressor fouling condition
are considered. The measurements are obtained for three
cycles of steady state operation at high and low operating
points by various physical sensors across the engine (e.g.,
temperature, rotational speed, and pressure). The three cycles
are chosen such that they indicate operation of the engine
from clean to a highly fouled compressor condition.
Measurements obtained from the engine exhibit high
frequency variations and therefore a filtering stage is
necessary before the data is further processed. Here, a low
pass finite impulse response filter with a length of 200
minutes is applied to smoothen the measurements.
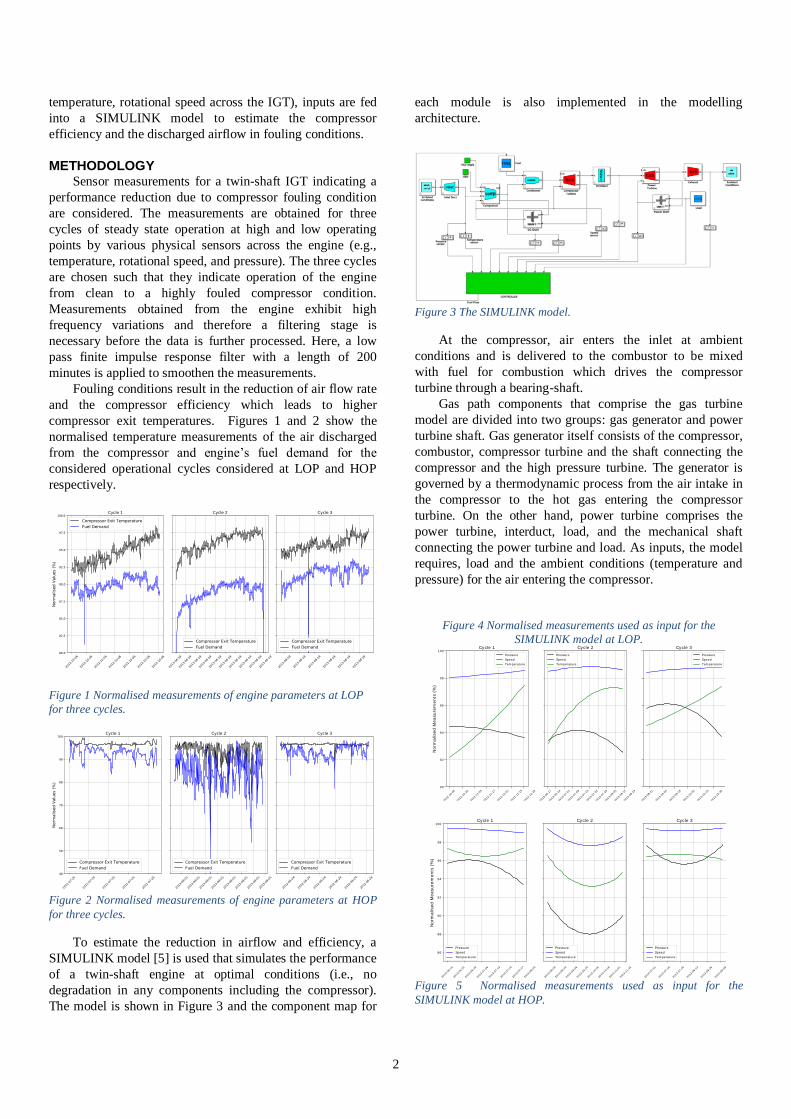
Fouling conditions result in the reduction of air flow rate
and the compressor efficiency which leads to higher
compressor exit temperatures. Figures 1 and 2 show the
normalised temperature measurements of the air discharged
from the compressor and engine’s fuel demand for the
considered operational cycles considered at LOP and HOP
respectively.
Figure 1 Normalised measurements of engine parameters at LOP
for three cycles.
Figure 2 Normalised measurements of engine parameters at HOP
for three cycles.
To estimate the reduction in airflow and efficiency, a
SIMULINK model [5] is used that simulates the performance
of a twin-shaft engine at optimal conditions (i.e., no
degradation in any components including the compressor).
The model is shown in Figure 3 and the component map for
each module is also implemented in the modelling
architecture.
Figure 3 The SIMULINK model.
At the compressor, air enters the inlet at ambient
conditions and is delivered to the combustor to be mixed
with fuel for combustion which drives the compressor
turbine through a bearing-shaft.
Gas path components that comprise the gas turbine
model are divided into two groups: gas generator and power
turbine shaft. Gas generator itself consists of the compressor,
combustor, compressor turbine and the shaft connecting the
compressor and the high pressure turbine. The generator is
governed by a thermodynamic process from the air intake in
the compressor to the hot gas entering the compressor
turbine. On the other hand, power turbine comprises the
power turbine, interduct, load, and the mechanical shaft
connecting the power turbine and load. As inputs, the model
requires, load and the ambient conditions (temperature and
pressure) for the air entering the compressor.
Figure 4 Normalised measurements used as input for the
SIMULINK model at LOP.
Figure 5 Normalised measurements used as input for the
SIMULINK model at HOP.
90
92
94
96
98
100
No
rma
lise
d M
ea
su
rem
en
ts (
%)
Cycle 1
Pressure
Speed
Tem perature
Cycle 2
Pressure
Speed
Tem perature
Cycle 3
Pressure
Speed
Tem perature
2012-10-0
6
2012-10-2
0
2012-11-0
3
2012-11-1
7
2012-12-0
1
2012-12-1
5
2012-12-2
9
2013-06-1
7
2013-06-2
4
2013-07-0
1
2013-07-0
8
2013-07-1
5
2013-07-2
2
2013-07-2
9
2013-08-0
5
2013-08-1
2
2013-08-1
9
2013-08-2
1
2013-09-0
4
2013-09-1
8
2013-10-0
2
2013-10-1
6
2013-10-3
0
86
88
90
92
94
96
98
100
No
rma
lise
dM
ea
su
rem
en
ts (
%)
Cycle 1
Pressure
Speed
Tem perature
Cycle 2
Pressure
Speed
Tem perature
Cycle 3
Pressure
Speed
Tem perature
2013-06-1
5
2013-06-2
2
2013-06-2
9
2013-07-0
6
2013-07-1
3
2013-07-2
0
2013-07-2
7
2013-08-0
3
2013-08-0
9
2013-08-2
3
2013-09-0
6
2013-09-2
0
2013-10-0
4
2013-10-1
8
2013-11-0
1
2013-11-1
5
2012-07-0
1
2012-07-1
5
2012-07-2
9
2012-08-1
2
2012-08-2
6
2012-09-0
9
3
Fuel demand is worked out via a controller unit that
considers as inputs the shaft speeds and measurements at
several stations across the engine.
A simplified representation of fuel flow control logic has
been considered. The following control limiting loops have
been implemented in simulation model:
• Power Turbine speed controller
• Turbine Temperature limit controller
• Power output limit
The outputs of control loops are the input in a minimum
value selector, so that the loop which takes control, is the one
whose output is the lowest. Power turbine speed control is
the main control loop during normal operating conditions,
and input to this control logic is the PT speed deviation.
Temperature limit controls the fuel flow to limit the turbine
operating temperature, and usually is active when engine is
running at high operating point. Power limit provides a
maximum continuous fuel flow limit for the engine for the
present ambient temperature. This limit may however be
exceeded for a short duration. (See [5] for a more detailed
description of the controller).
Analysis of the fouling condition requires performance
simulation of the IGT at fouling conditions over certain
periods. To reduce computational complexity during the
simulation, the model is converted to a stand-alone
executable which enables simulation of 83 days operation in
only 65 hours.
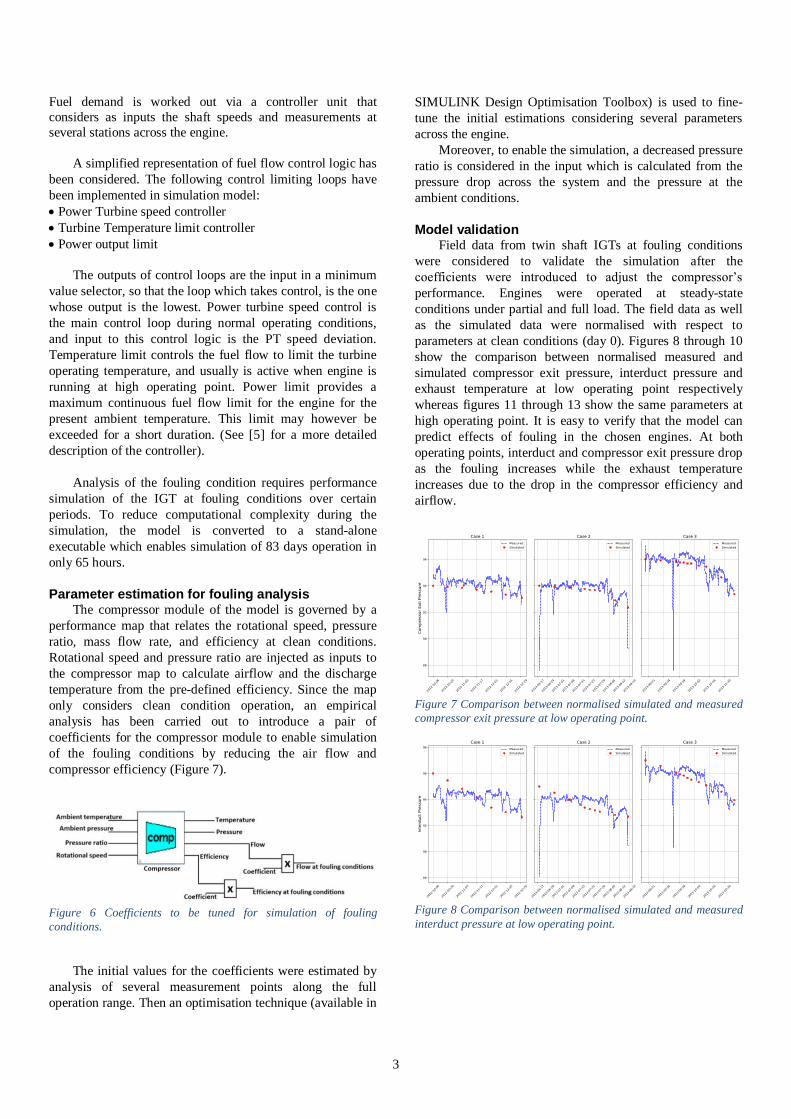
Parameter estimation for fouling analysis The compressor module of the model is governed by a
performance map that relates the rotational speed, pressure
ratio, mass flow rate, and efficiency at clean conditions.
Rotational speed and pressure ratio are injected as inputs to
the compressor map to calculate airflow and the discharge
temperature from the pre-defined efficiency. Since the map
only considers clean condition operation, an empirical
analysis has been carried out to introduce a pair of
coefficients for the compressor module to enable simulation
of the fouling conditions by reducing the air flow and
compressor efficiency (Figure 7).
Figure 6 Coefficients to be tuned for simulation of fouling
conditions.
The initial values for the coefficients were estimated by
analysis of several measurement points along the full
operation range. Then an optimisation technique (available in
SIMULINK Design Optimisation Toolbox) is used to fine-
tune the initial estimations considering several parameters
across the engine.
Moreover, to enable the simulation, a decreased pressure
ratio is considered in the input which is calculated from the
pressure drop across the system and the pressure at the
ambient conditions.
Model validation Field data from twin shaft IGTs at fouling conditions
were considered to validate the simulation after the
coefficients were introduced to adjust the compressor’s
performance. Engines were operated at steady-state
conditions under partial and full load. The field data as well
as the simulated data were normalised with respect to
parameters at clean conditions (day 0). Figures 8 through 10
show the comparison between normalised measured and
simulated compressor exit pressure, interduct pressure and
exhaust temperature at low operating point respectively
whereas figures 11 through 13 show the same parameters at
high operating point. It is easy to verify that the model can
predict effects of fouling in the chosen engines. At both
operating points, interduct and compressor exit pressure drop
as the fouling increases while the exhaust temperature
increases due to the drop in the compressor efficiency and
airflow.
Figure 7 Comparison between normalised simulated and measured
compressor exit pressure at low operating point.
Figure 8 Comparison between normalised simulated and measured
interduct pressure at low operating point.
4
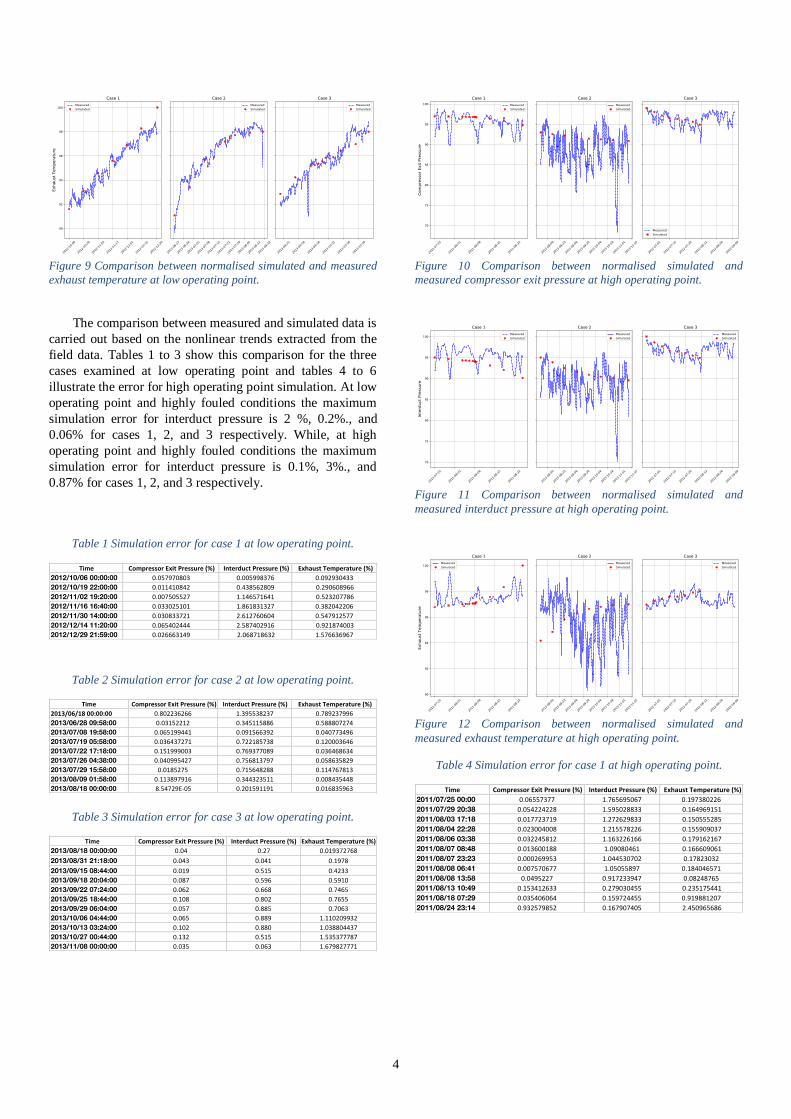
Figure 9 Comparison between normalised simulated and measured
exhaust temperature at low operating point.
The comparison between measured and simulated data is
carried out based on the nonlinear trends extracted from the
field data. Tables 1 to 3 show this comparison for the three
cases examined at low operating point and tables 4 to 6
illustrate the error for high operating point simulation. At low
operating point and highly fouled conditions the maximum
simulation error for interduct pressure is 2 %, 0.2%., and
0.06% for cases 1, 2, and 3 respectively. While, at high
operating point and highly fouled conditions the maximum
simulation error for interduct pressure is 0.1%, 3%., and
0.87% for cases 1, 2, and 3 respectively.
Table 1 Simulation error for case 1 at low operating point.
Table 2 Simulation error for case 2 at low operating point.
Table 3 Simulation error for case 3 at low operating point.
Figure 10 Comparison between normalised simulated and
measured compressor exit pressure at high operating point.
Figure 11 Comparison between normalised simulated and
measured interduct pressure at high operating point.
Figure 12 Comparison between normalised simulated and
measured exhaust temperature at high operating point.
Table 4 Simulation error for case 1 at high operating point.
5
Table 5 Simulation error for case 2 at high operating point.
Table 6 Simulation error for case 3 at high operating point.
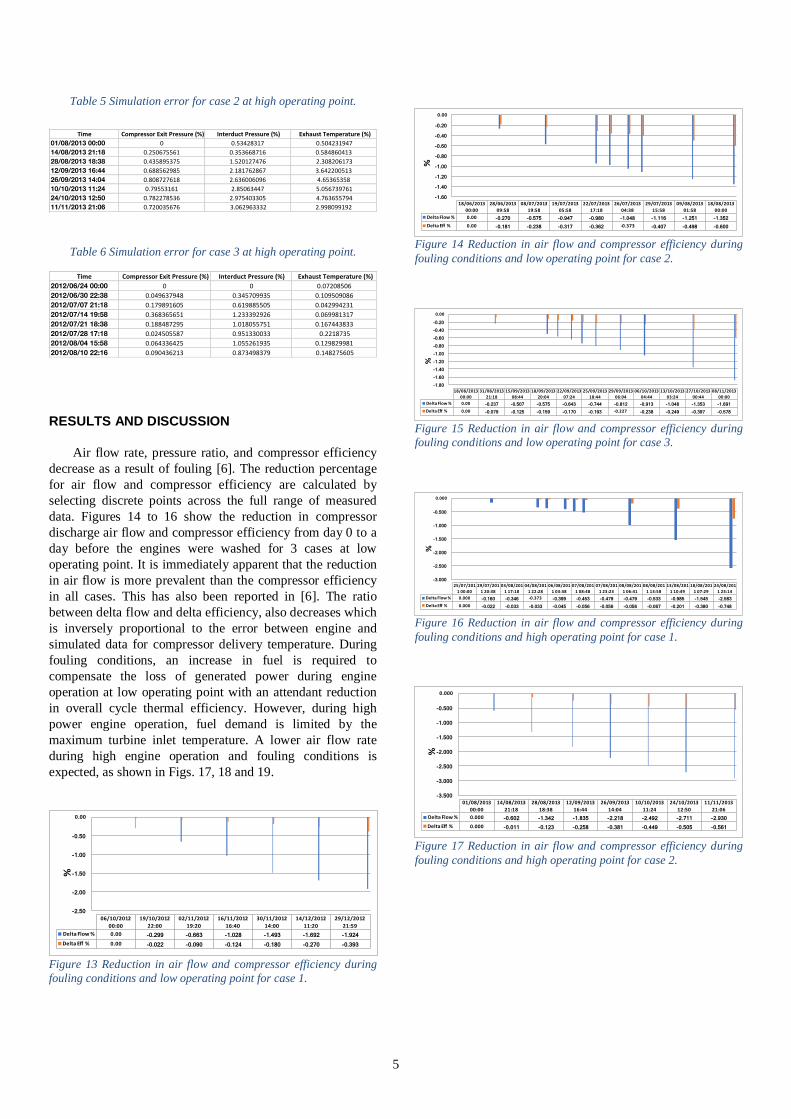
RESULTS AND DISCUSSION
Air flow rate, pressure ratio, and compressor efficiency
decrease as a result of fouling [6]. The reduction percentage
for air flow and compressor efficiency are calculated by
selecting discrete points across the full range of measured
data. Figures 14 to 16 show the reduction in compressor
discharge air flow and compressor efficiency from day 0 to a
day before the engines were washed for 3 cases at low
operating point. It is immediately apparent that the reduction
in air flow is more prevalent than the compressor efficiency
in all cases. This has also been reported in [6]. The ratio
between delta flow and delta efficiency, also decreases which
is inversely proportional to the error between engine and
simulated data for compressor delivery temperature. During
fouling conditions, an increase in fuel is required to
compensate the loss of generated power during engine
operation at low operating point with an attendant reduction
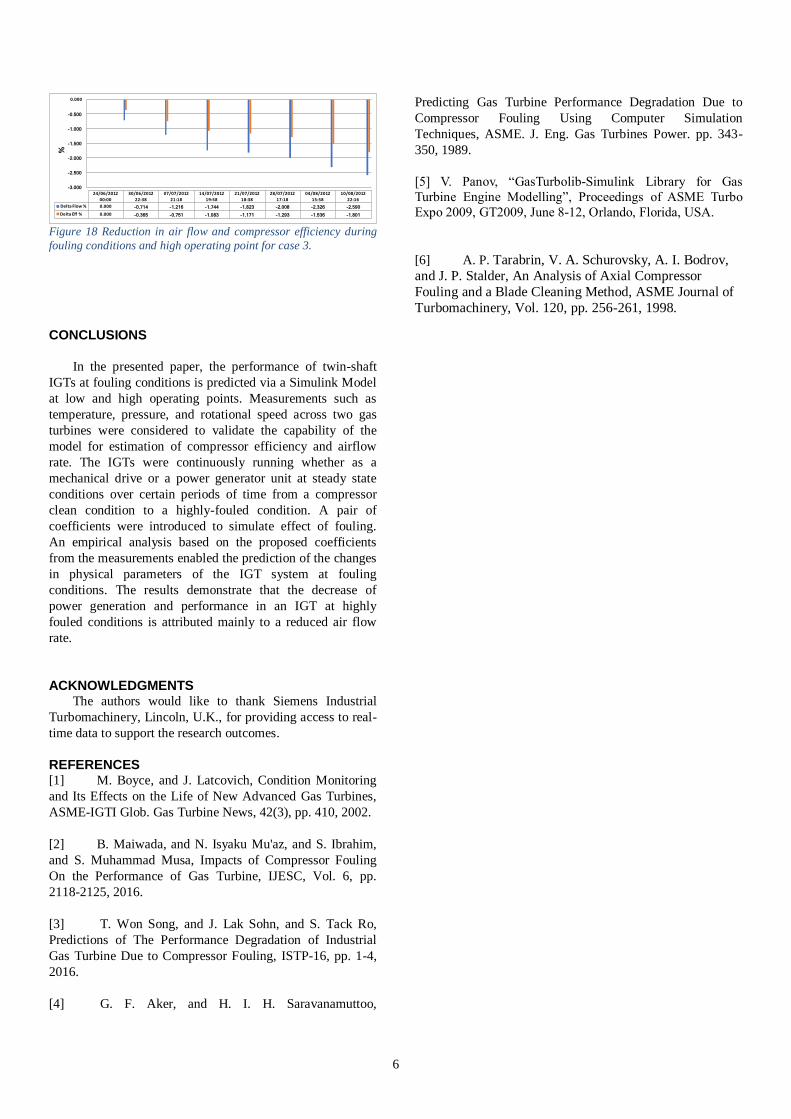
in overall cycle thermal efficiency. However, during high
power engine operation, fuel demand is limited by the
maximum turbine inlet temperature. A lower air flow rate
during high engine operation and fouling conditions is
expected, as shown in Figs. 17, 18 and 19.
Figure 13 Reduction in air flow and compressor efficiency during
fouling conditions and low operating point for case 1.
Figure 14 Reduction in air flow and compressor efficiency during
fouling conditions and low operating point for case 2.
Figure 15 Reduction in air flow and compressor efficiency during
fouling conditions and low operating point for case 3.
Figure 16 Reduction in air flow and compressor efficiency during
fouling conditions and high operating point for case 1.
Figure 17 Reduction in air flow and compressor efficiency during
fouling conditions and high operating point for case 2.
6
Figure 18 Reduction in air flow and compressor efficiency during
fouling conditions and high operating point for case 3.
CONCLUSIONS
In the presented paper, the performance of twin-shaft
IGTs at fouling conditions is predicted via a Simulink Model
at low and high operating points. Measurements such as
temperature, pressure, and rotational speed across two gas
turbines were considered to validate the capability of the
model for estimation of compressor efficiency and airflow
rate. The IGTs were continuously running whether as a
mechanical drive or a power generator unit at steady state
conditions over certain periods of time from a compressor
clean condition to a highly-fouled condition. A pair of
coefficients were introduced to simulate effect of fouling.
An empirical analysis based on the proposed coefficients
from the measurements enabled the prediction of the changes
in physical parameters of the IGT system at fouling
conditions. The results demonstrate that the decrease of
power generation and performance in an IGT at highly
fouled conditions is attributed mainly to a reduced air flow
rate.
ACKNOWLEDGMENTS The authors would like to thank Siemens Industrial
Turbomachinery, Lincoln, U.K., for providing access to real-
time data to support the research outcomes.
REFERENCES [1] M. Boyce, and J. Latcovich, Condition Monitoring
and Its Effects on the Life of New Advanced Gas Turbines,
ASME-IGTI Glob. Gas Turbine News, 42(3), pp. 410, 2002.
[2] B. Maiwada, and N. Isyaku Mu'az, and S. Ibrahim,
and S. Muhammad Musa, Impacts of Compressor Fouling
On the Performance of Gas Turbine, IJESC, Vol. 6, pp.
2118-2125, 2016.
[3] T. Won Song, and J. Lak Sohn, and S. Tack Ro,
Predictions of The Performance Degradation of Industrial
Gas Turbine Due to Compressor Fouling, ISTP-16, pp. 1-4,
2016.
[4] G. F. Aker, and H. I. H. Saravanamuttoo,
Predicting Gas Turbine Performance Degradation Due to
Compressor Fouling Using Computer Simulation
Techniques, ASME. J. Eng. Gas Turbines Power. pp. 343-
350, 1989.
[5] V. Panov, “GasTurbolib-Simulink Library for Gas
Turbine Engine Modelling”, Proceedings of ASME Turbo
Expo 2009, GT2009, June 8-12, Orlando, Florida, USA.
[6] A. P. Tarabrin, V. A. Schurovsky, A. I. Bodrov,
and J. P. Stalder, An Analysis of Axial Compressor
Fouling and a Blade Cleaning Method, ASME Journal of
Turbomachinery, Vol. 120, pp. 256-261, 1998.