Embed Size (px)
Citation preview

Performance Analysis and Compiler Optimizations
Kevin London [email protected]
Philip Mucci [email protected]://www.cs.utk.edu/~mucci/MPPopt.html
Credits
• http://techpubs.sgi.com• http://www.sun.com/hpc• http://www.mhpcc.edu • http://www.psc.edu• John Levesque (IBM)
• Ramesh Menon (SGI)
• Lots of other people. Thanks!
Overview
• Compiler Flags
• Performance Tools
• Features of Fortran 90
• OpenMP optimization
• MPI tools and tricks

Not Getting the Performance You Want
• Ever feel like beating your computer?
• Hopefully the compiler will relieve some of that stress

Using the Compiler to Optimize Code
• Extra performance in very little time
• Start with a conservative set of flags and gradually add more
• Compiler should do all the optimization but it usually doesn’t so keep good code practices in mind
• Always link in optimized libraries

Compiler Specific Flags
• Understanding the flags that are available and when to use them
• Knowing about optimized libraries that are available and using them
• These are the keys to success
SP2 Flags and Libraries
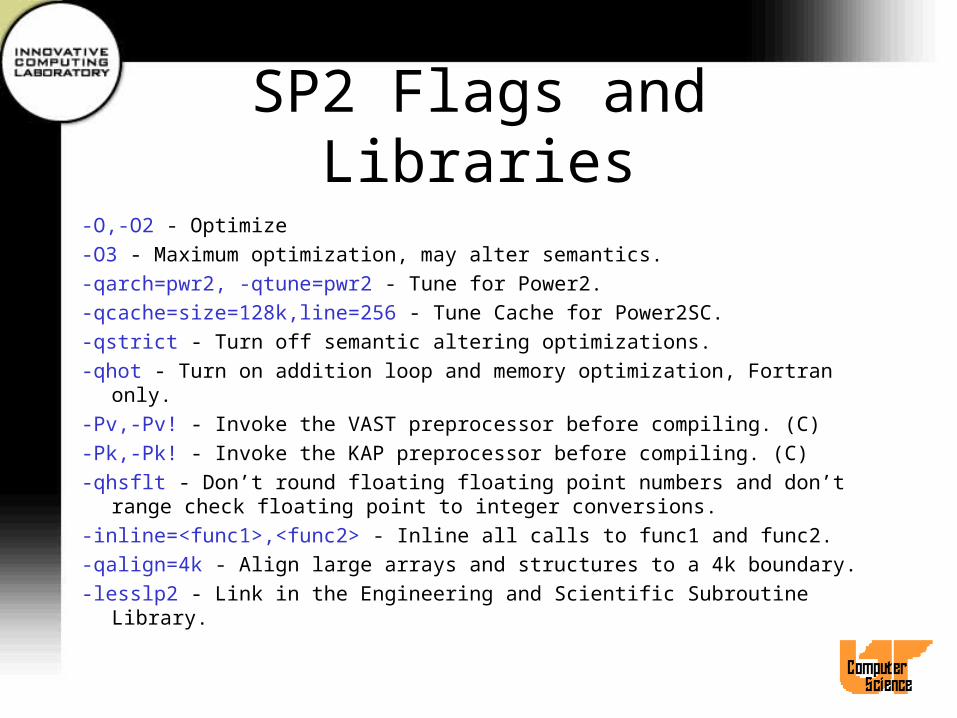
-O,-O2 - Optimize
-O3 - Maximum optimization, may alter semantics.
-qarch=pwr2, -qtune=pwr2 - Tune for Power2.
-qcache=size=128k,line=256 - Tune Cache for Power2SC.
-qstrict - Turn off semantic altering optimizations.
-qhot - Turn on addition loop and memory optimization, Fortran only.
-Pv,-Pv! - Invoke the VAST preprocessor before compiling. (C)
-Pk,-Pk! - Invoke the KAP preprocessor before compiling. (C)
-qhsflt - Don’t round floating floating point numbers and don’t range check floating point to integer conversions.
-inline=<func1>,<func2> - Inline all calls to func1 and func2.
-qalign=4k - Align large arrays and structures to a 4k boundary.
-lesslp2 - Link in the Engineering and Scientific Subroutine Library.
Recommended flags for IBM SP
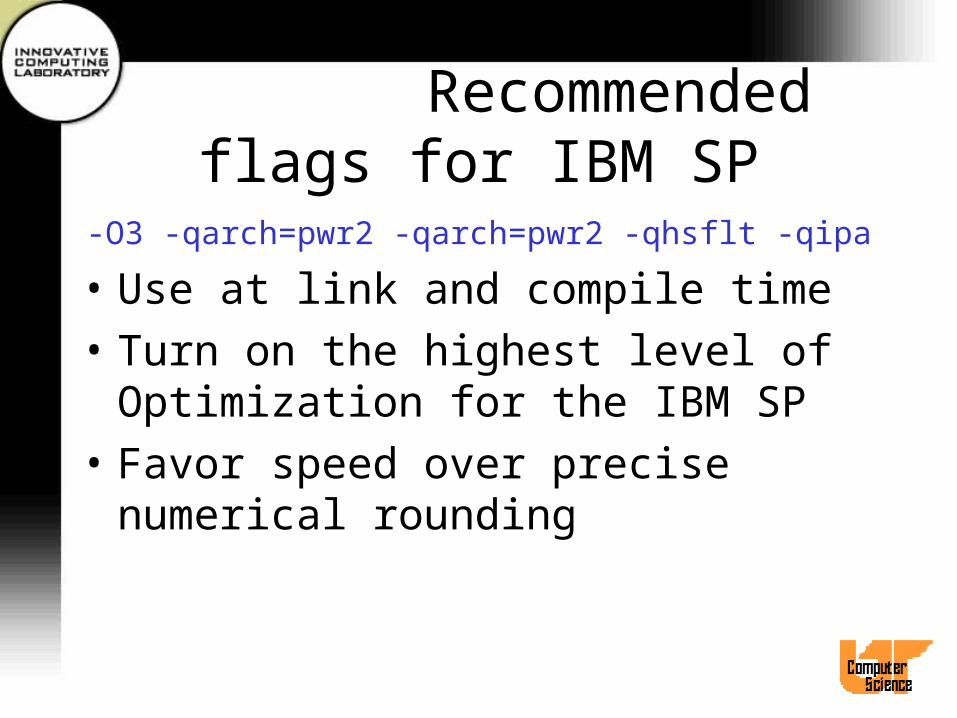
-O3 -qarch=pwr2 -qarch=pwr2 -qhsflt -qipa
• Use at link and compile time
• Turn on the highest level of Optimization for the IBM SP
• Favor speed over precise numerical rounding
Accuracy Considerations
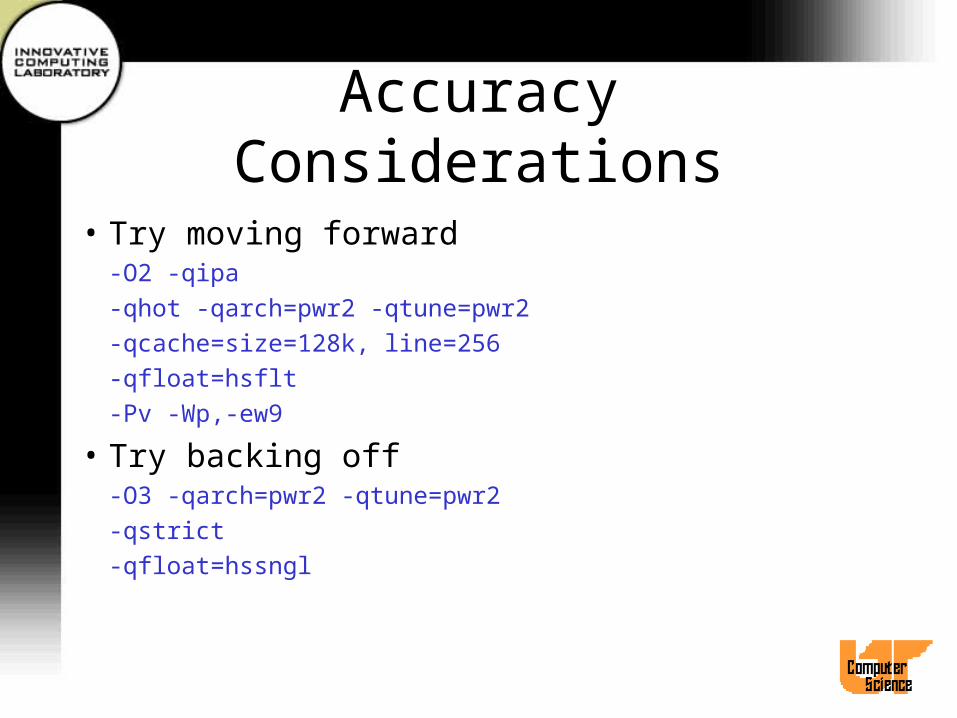
• Try moving forward-O2 -qipa
-qhot -qarch=pwr2 -qtune=pwr2
-qcache=size=128k, line=256
-qfloat=hsflt
-Pv -Wp,-ew9
• Try backing off-O3 -qarch=pwr2 -qtune=pwr2
-qstrict
-qfloat=hssngl

Numerical Libraries
• Link in the Engineering and Scientific Subroutine Library
– Link with -lesslp2
• Link in the Basic Linear Algebra Routines
• Link in the Mathematical Acceleration subsystems (MASS) Libraries
– Can be obtained at http://www.austin.ibm.com/tech/MASS
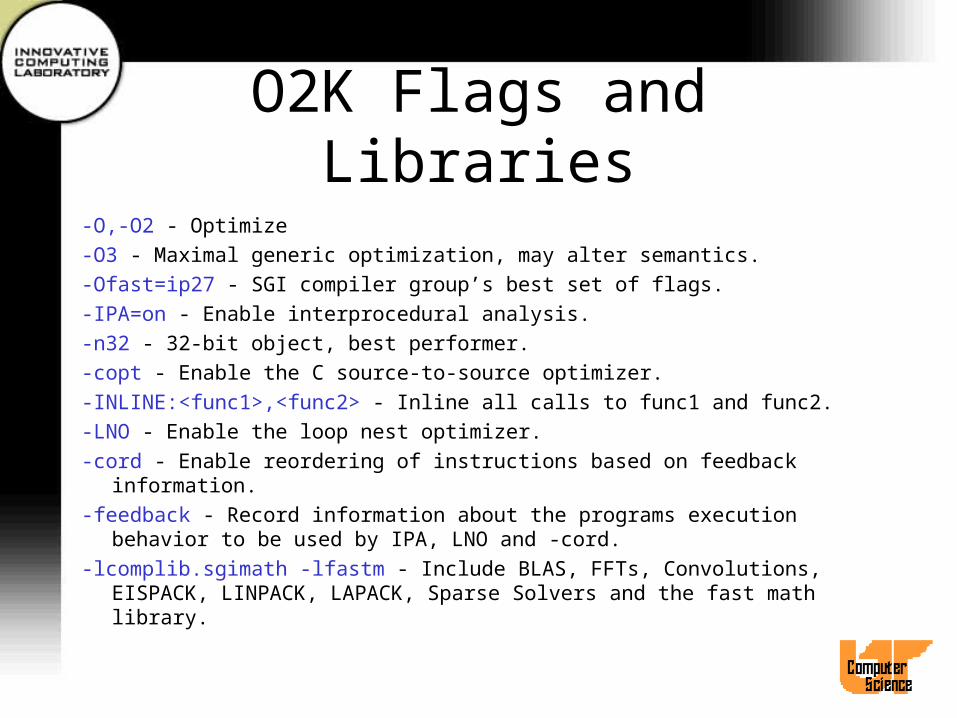
O2K Flags and Libraries
-O,-O2 - Optimize
-O3 - Maximal generic optimization, may alter semantics.
-Ofast=ip27 - SGI compiler group’s best set of flags.
-IPA=on - Enable interprocedural analysis.
-n32 - 32-bit object, best performer.
-copt - Enable the C source-to-source optimizer.
-INLINE:<func1>,<func2> - Inline all calls to func1 and func2.
-LNO - Enable the loop nest optimizer.
-cord - Enable reordering of instructions based on feedback information.
-feedback - Record information about the programs execution behavior to be used by IPA, LNO and -cord.
-lcomplib.sgimath -lfastm - Include BLAS, FFTs, Convolutions, EISPACK, LINPACK, LAPACK, Sparse Solvers and the fast math library.
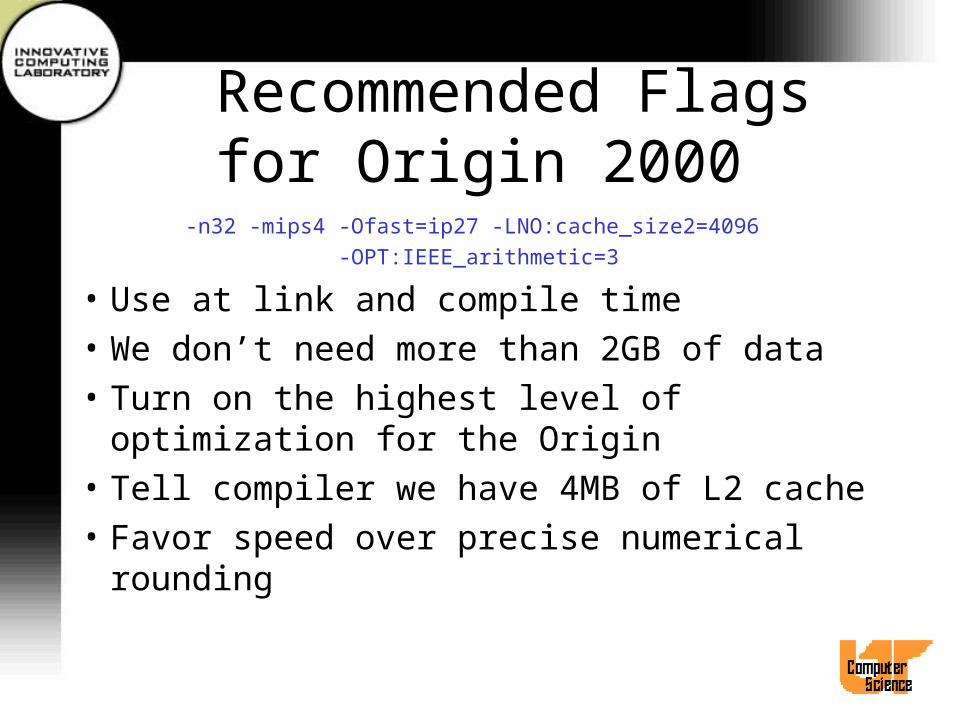
Recommended Flags for Origin 2000
-n32 -mips4 -Ofast=ip27 -LNO:cache_size2=4096
-OPT:IEEE_arithmetic=3
• Use at link and compile time
• We don’t need more than 2GB of data
• Turn on the highest level of optimization for the Origin
• Tell compiler we have 4MB of L2 cache
• Favor speed over precise numerical rounding
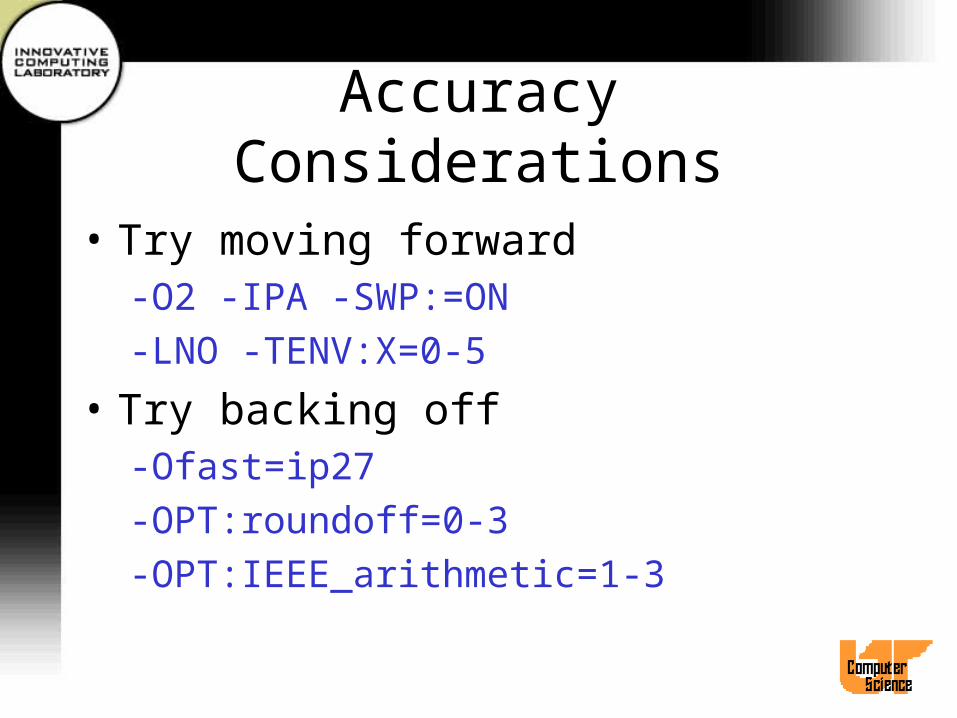
Accuracy Considerations
• Try moving forward-O2 -IPA -SWP:=ON
-LNO -TENV:X=0-5
• Try backing off-Ofast=ip27
-OPT:roundoff=0-3
-OPT:IEEE_arithmetic=1-3
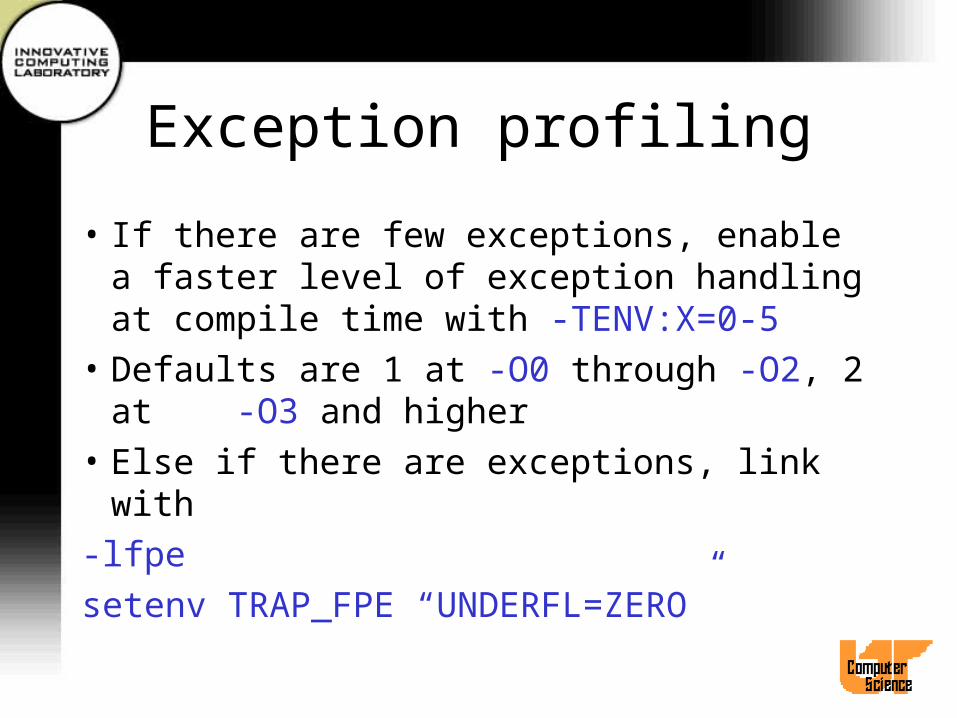
Exception profiling
• If there are few exceptions, enable a faster level of exception handling at compile time with -TENV:X=0-5
• Defaults are 1 at -O0 through -O2, 2 at -O3 and higher
• Else if there are exceptions, link with
-lfpe
setenv TRAP_FPE “UNDERFL=ZERO”
Interprocedural Analysis
• When analysis is confined to a single procedure, the optimizer is forced to make worst case assumptions about the possible effects of subroutines.
• IPA analyzes the entire program at once and feeds that information into the other phases.

Inlining
• Replaces a subroutine call with the function itself.
• Useful in loops that have a large iteration count and functions that don’t do a lot of work.
• Allows other optimizations.
• Most compilers will do inlining but the decision process is conservative.
Manual Inlining
-INLINE:file=<filename>
-INLINE:must=<name>[,name2,name3..]
-INLINE:all
• Exposes internals of the call to the optimizer
• Eliminates overhead of the call
• Expands code

Loop Nest Optimizer
• Optimizes the use of the memory heirarchy
• Works on relatively small sections of code
• Enabled with -LNO• Visualize the transformations with
-FLIST:=on
-CLIST:=on
Optimized Arithmetic Libraries
• Advantages:– Subroutines are quick to code and understand.– Routines provide portability.– Routines perform well.– Comprehensive set of routines.
• Disadvantages– Can lead to vertical code structure– May mask memory performance problems
Numerical Libraries
• libfastm – Link with -r10000 and -lfastm– Link before -lm
• CHALLENGEcomplib and SCSL– Sequential and parallel versions– FFTs, convolutions, BLAS, LINPACK,
EISPACK, LAPACK and sparse solvers
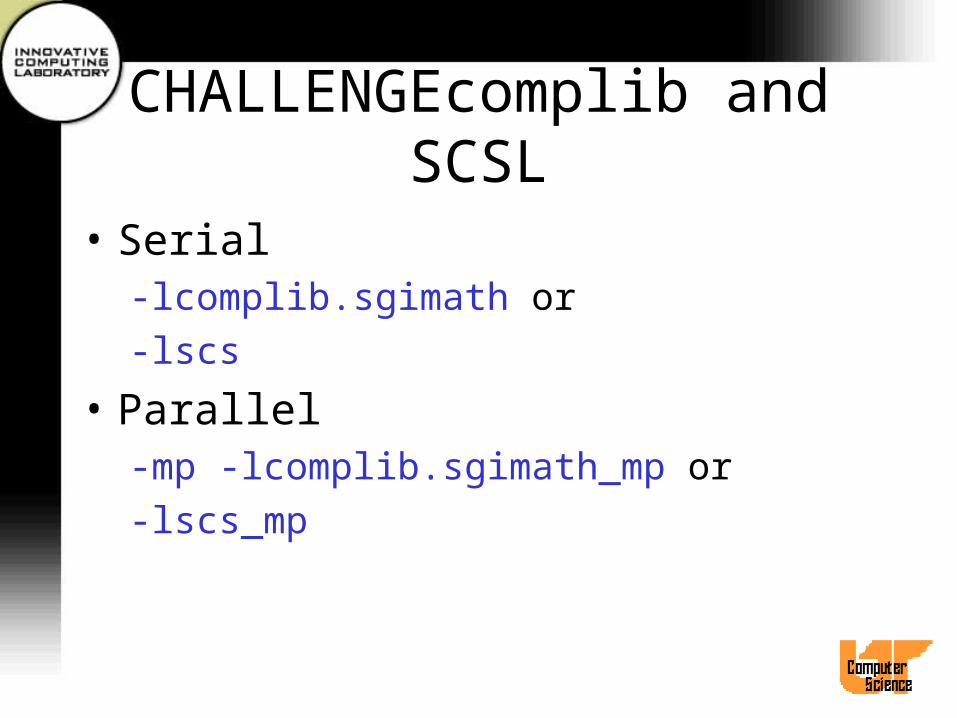
CHALLENGEcomplib and SCSL
• Serial-lcomplib.sgimath or
-lscs
• Parallel-mp -lcomplib.sgimath_mp or
-lscs_mp

T3E Flags and Libraries
-O,-O2 - Optimize
-O3 - Maximum optimization, may alter semantics.
-apad - Pad arrays to avoid cache line conflicts
-unroll - Apply aggressive unrolling
-pipeline - Software pipelining
-split - Apply loop splitting.
-aggress - Apply aggressive code motion
-Wl”-Dallocate(alignsz)=64b” Align common blocks on cache line boundary
-lmfastv - Fastest vectorized intrinsic library
-lsci - Include library with BLAS, LAPACK and ESSL routines
-inlinefrom=<> - Specifies source file or directory of functions to inline
-inline2 - Aggressively inline function calls.
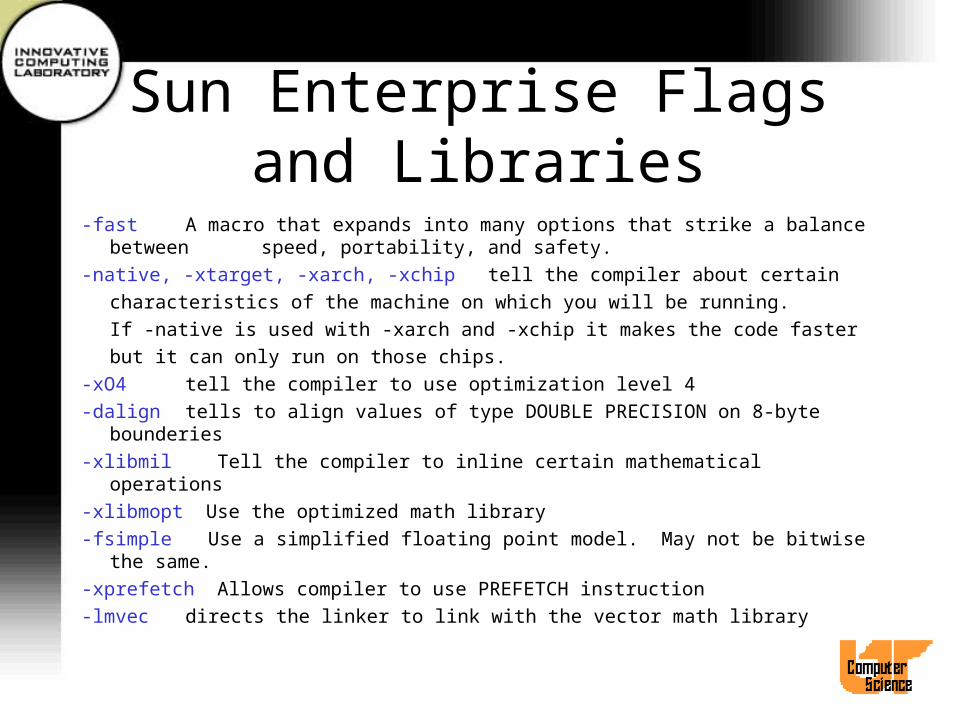
Sun Enterprise Flags and Libraries
-fast A macro that expands into many options that strike a balance between speed, portability, and safety.
-native, -xtarget, -xarch, -xchip tell the compiler about certain
characteristics of the machine on which you will be running.
If -native is used with -xarch and -xchip it makes the code faster
but it can only run on those chips.
-xO4 tell the compiler to use optimization level 4
-dalign tells to align values of type DOUBLE PRECISION on 8-byte bounderies
-xlibmil Tell the compiler to inline certain mathematical operations
-xlibmopt Use the optimized math library
-fsimple Use a simplified floating point model. May not be bitwise the same.
-xprefetch Allows compiler to use PREFETCH instruction
-lmvec directs the linker to link with the vector math library
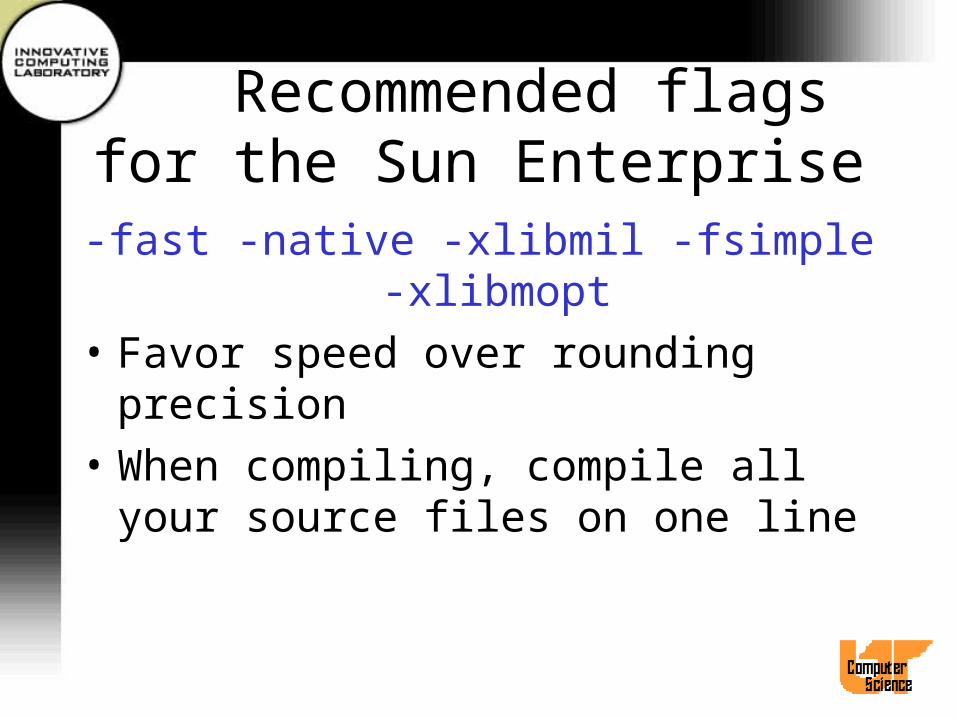
Recommended flags for the Sun Enterprise
-fast -native -xlibmil -fsimple -xlibmopt
• Favor speed over rounding precision
• When compiling, compile all your source files on one line
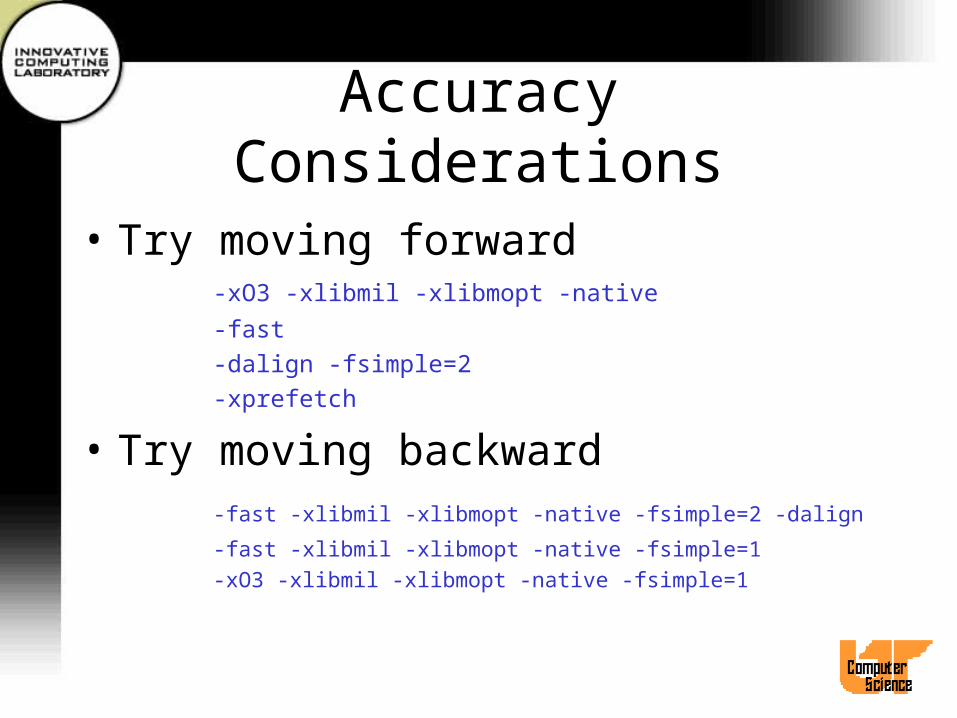
Accuracy Considerations
• Try moving forward-xO3 -xlibmil -xlibmopt -native
-fast
-dalign -fsimple=2
-xprefetch
• Try moving backward-fast -xlibmil -xlibmopt -native -fsimple=2 -dalign
-fast -xlibmil -xlibmopt -native -fsimple=1
-xO3 -xlibmil -xlibmopt -native -fsimple=1
Performance Tools
O2K Performance Tools
• Hardware Counters
• Profilers– perfex– SpeedShop– prof– dprof– cvd

Some Hardware Counter Events
• Cycles, Instructions
• Loads, Stores, Misses
• Exceptions, Mispredictions
• Coherency
• Issued/Graduated
• Conditionals
Hardware Performance Counter Access
• At the application level with perfex• At the function level with SpeedShop and prof.
• List all the events with perfex -h
Speedshop
• Find out exactly where program is spending it’s time– procedures– lines
• Uses 3 methods– Sampling– Counting– Tracing
Speedshop Components
• 4 parts– ssrun performs experiments and collects data– ssusage reports machine resources– prof processes the data and prepares reports– SpeedShop allows caliper points
• See man pages

Speedshop Usage
ssrun [options] <exe>• output is placed in ./command.experiment.pid
• Viewed withprof [options] <command.experiment.pid>
SpeedShop Sampling
• All procedures called by the code, many will be foreign to the programmer.
• Statistics are created by sampling and then looking up the PC and correlating it with the address and symbol table information.
• Phase problems may cause erroneous results and reporting.
Speedshop Counting
• Based upon basic block profiling
• Basic block is a section of code with one entry and one exit
• Executable is instrumented with pixie• pixie adds a counter to every basic block
Ideal Experiment
• ssrun -ideal• Calculates ideal time
– no cache/TLB misses– minimum latencies for all operations
• Exact operation count with -op– floating point operations (MADD is 2)– integer operations
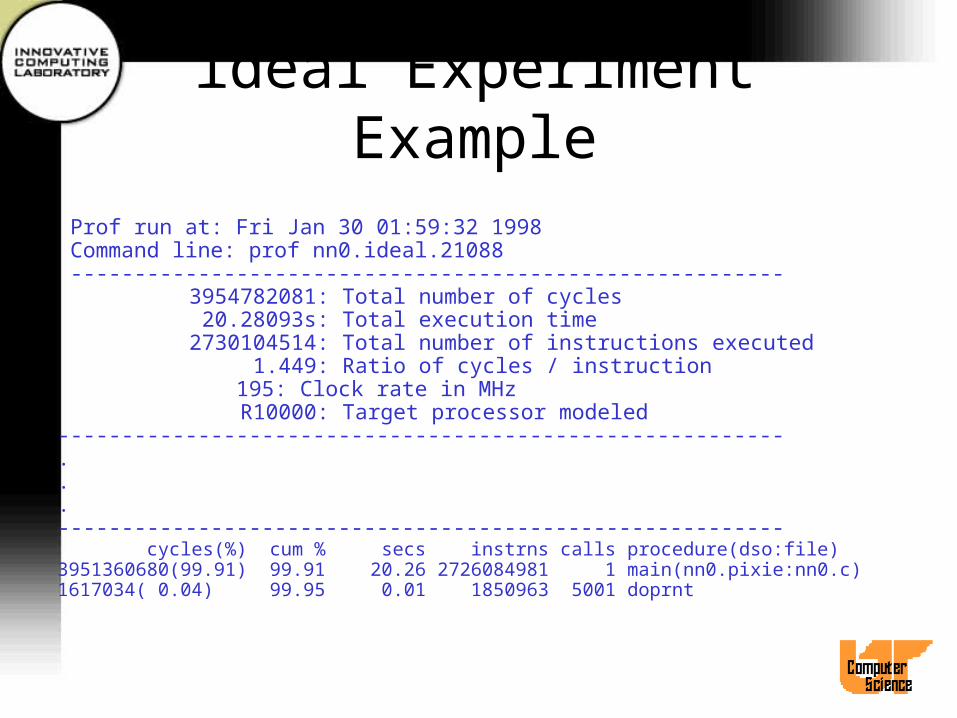
ideal Experiment Example
Prof run at: Fri Jan 30 01:59:32 1998 Command line: prof nn0.ideal.21088 -------------------------------------------------------- 3954782081: Total number of cycles 20.28093s: Total execution time 2730104514: Total number of instructions executed 1.449: Ratio of cycles / instruction 195: Clock rate in MHz
R10000: Target processor modeled---------------------------------------------------------...--------------------------------------------------------- cycles(%) cum % secs instrns calls procedure(dso:file)3951360680(99.91) 99.91 20.26 2726084981 1 main(nn0.pixie:nn0.c)1617034( 0.04) 99.95 0.01 1850963 5001 doprnt
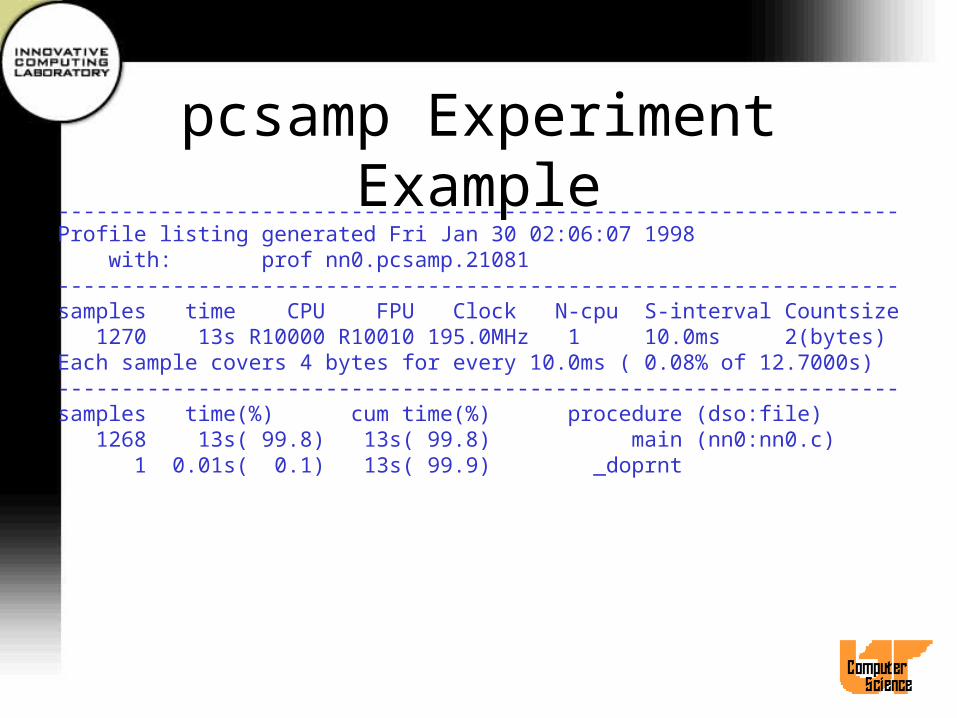
pcsamp Experiment Example------------------------------------------------------------------Profile listing generated Fri Jan 30 02:06:07 1998 with: prof nn0.pcsamp.21081------------------------------------------------------------------samples time CPU FPU Clock N-cpu S-interval Countsize 1270 13s R10000 R10010 195.0MHz 1 10.0ms 2(bytes)Each sample covers 4 bytes for every 10.0ms ( 0.08% of 12.7000s)------------------------------------------------------------------samples time(%) cum time(%) procedure (dso:file) 1268 13s( 99.8) 13s( 99.8) main (nn0:nn0.c) 1 0.01s( 0.1) 13s( 99.9) _doprnt
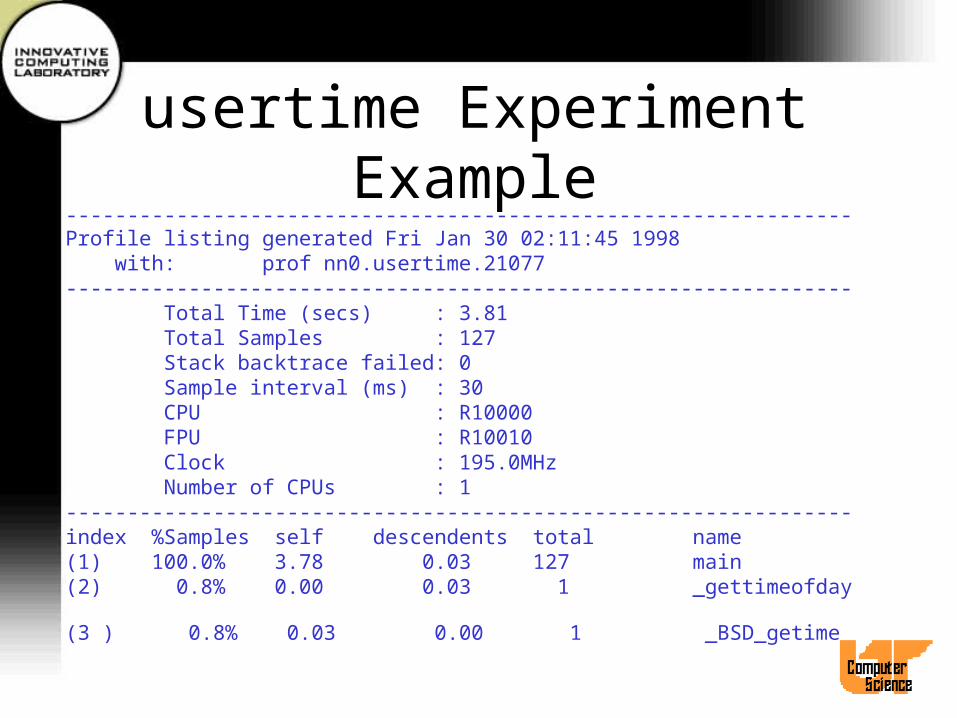
usertime Experiment Example----------------------------------------------------------------Profile listing generated Fri Jan 30 02:11:45 1998 with: prof nn0.usertime.21077---------------------------------------------------------------- Total Time (secs) : 3.81 Total Samples : 127 Stack backtrace failed: 0 Sample interval (ms) : 30 CPU : R10000 FPU : R10010 Clock : 195.0MHz Number of CPUs : 1----------------------------------------------------------------index %Samples self descendents total name(1) 100.0% 3.78 0.03 127 main(2) 0.8% 0.00 0.03 1 _gettimeofday
(3 ) 0.8% 0.03 0.00 1 _BSD_getime
Gprof information
• In addition to the information from prof– Contributions from descendants– Distribution relative to callers
• To get gprof like information use
prof -gprof <output file>
Exception Profiling
• By default the R10000 causes hardware traps on floating point exceptions and then ignores them in software
• This can result in lots of overhead.
• Use ssrun -fpe <exe> to generate a trace of locations generating exceptions.

Address Space Profiling
• Used primarily for checking shared memory programs for memory contention.
• Generates a trace of most frequently referenced pages
• Samples operand address instead of PC
dprof -hwpc <exe>
Parallel Profiling
• After tuning for a single CPU, tune for parallel.
• Use full path of tool• ssrun/perfex used directly with mpirun
• mpirun <opts> /bin/perfex -mp <opts> <exe> <args> |& cat > output
• mpirun <opts> /bin/ssrun <opts> <exe> <args>
Parallel Profiling
• perfex outputs all tasks followed by all tasks summed
• In shared memory executables, watch – load imbalance (cntr 21, flinstr)– excessive synchronization (4, store cond)– false sharing (31, shared cache block)
CASEVision Debugger
• cvd• GUI interface to SpeedShop PC sampling and
ideal experiments
• Interface to viewing automatic parallelization options
• Poor documentation
• Debugging support
• This tool is complex...
Performance Tools for the IBM SP2
• Profilers– tprof– xprofile

tprof for the SP2
• Reports CPU usage for programs and system. i.e.– All other processes while your program was
executing– Each subroutine of the program– Kernel and Idle time– Each line of the program
• We are interested in source statement profiling.

xprofile for the SP2
• A graphical version of gprof
• Shows call-tree and time associated with it
Performance Tools for Cray T3E
• Profilers– Pat– Apprentice
PAT for the T3E
• Uses the UNICOS/mk profil() system call to gather information by periodically sampling and examining the program counter.
• Works on C, C++ and Fortran executables
• No recompiling necessary
• Just link with -lpat

Apprentice for the T3E
• Graphical interface for identifying bottlenecks.
% f90 -eA <file>.f -lapp
% cc -happrentice <file>.c -lapp
% a.out
% apprentice app.rif

Performance Tools for the Sun Enterprise
• Profilers– prof– gprof– looptool– tconv– prism

looptool for SUN
• To use looptool compile the most time-consuming loops with -Zlp and run the code
• Then use loopreport to produce a list of the loops and how much time they took

looptool outputLegend for compiler hints
0 No hint available1 Loop contains procedure2 Compiler generated two versions of this loop3 The variable(s) “%s” cause a data dependency in this loop4 Loop was significantly transformed during optimization5 Loop may not hold enough work to be profitably parallelized6 Loop was marked by user-inserted pragma, DOALL8 Loop contains I/O, or other function calls, that are not MT safe-------------------------------------------------------------------------------------------------Source File: /export/home/langenba/gasp/src/gasp/front.F
Loop ID Line # Par? Hints Entries Nest Wallclock % 12 256 No 8 3 2 3498.92 96.27 13 277 No 8 3 3 3498.93 96.27 14 282 No 1 3 4 3498.93 96.27 15 371 No 8 0 5 0.00 96.27

tcov for Sun
• To get a line-by-line description of where the code was executing
• Compile with -xprofile=tcov:
• Running will create a directory, to read the report use tcov
• tcov -x <executable.profile> source.f
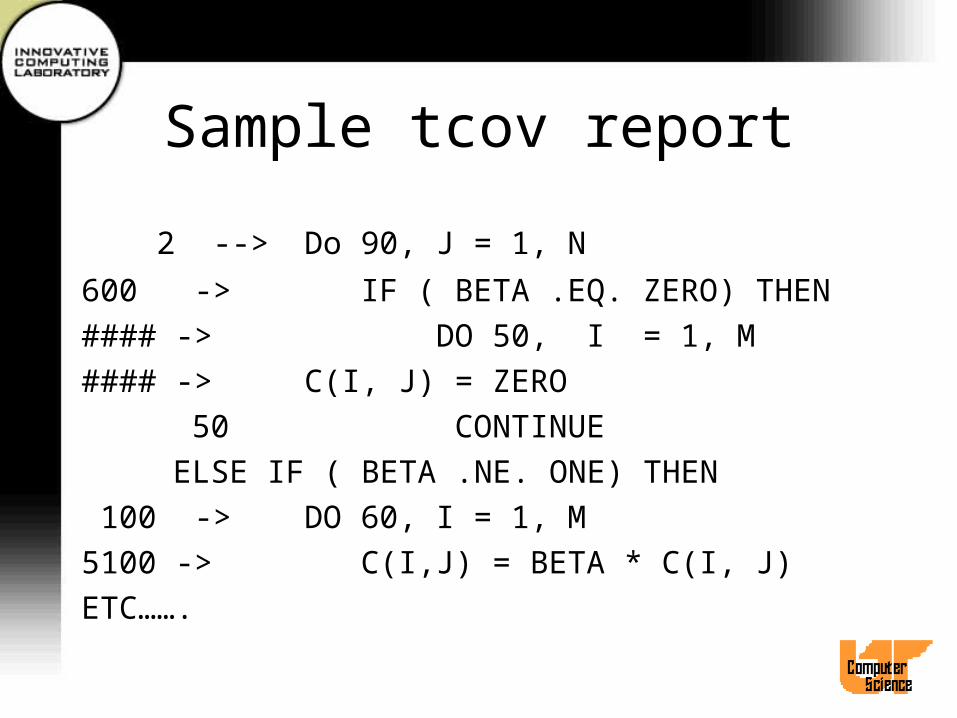
Sample tcov report
2 --> Do 90, J = 1, N
600 -> IF ( BETA .EQ. ZERO) THEN
#### -> DO 50, I = 1, M
#### -> C(I, J) = ZERO
50 CONTINUE
ELSE IF ( BETA .NE. ONE) THEN
100 -> DO 60, I = 1, M
5100 -> C(I,J) = BETA * C(I, J)
ETC…….

Fortran 90 Issues
• Object-Oriented Features
• Operator Overloading
• Dynamic Memory Allocation
• Array Syntax
• WHERE
• CSHIFT/EOSHIFT
• MATMUL/SUM/MAXVAL...
Fortran 90 and OO programming
• Object Oriented programming is a mixed blessing for HPC.– Featuritis: n. The overwhelming urge to use every
feature of a programming language.
– You think tuning/parallelizing legacy F77 is tough?
– When using OO features, use only what you need, not what’s in fashion.
– Example: Telluride, < 2% time in > 50 functions.
Operator Overloading
• Hard to read
• May result in function calls which...
• Prohibits some compiler optimizations

Dynamic Memory Allocation
• This is good right?– Yes. BUT, now we must worry about the
mapping of allocated arrays to cache– Most F77 compilers perform internal and
external padding of array’s in COMMON– This is no longer possible because this may
violate correctness

Array Syntax
• Looks nice, but requires a lot of work by the compiler.– Temporary arrays, extent fetching
– Loop fusion, blocking
– Dependency analysis
• Diagnosis? Larger number of loads Vs. floating point instructions than expected.
• Advice? Group operations with the same extents as close as possible.

Fortran 90 WHERE
• Arguably the most evil primitive in F90– But gosh it’s useful!
• Results in a conditional in the innermost loop. What use is your pipeline?
• 2 options– Instead of a boolean mask, multiply by a floating
point array of 1.0 or 0.0. No branches!
– Code the loop by hand and unroll. Separate loads of the mask value and conditionals.
CSHIFT and F90 intrinsics
• CSHIFT is just as bad as WHERE.– Why? Because of a branch inside a loop.
• However, some intrinsics, especially those that perform reductions are usually much faster than those coded by hand.
F90 Derived Types
• An excellent feature not widely used, mostly because types are a new concept. But they can alleviate a lot of performance problems and greatly increase readability.– Improve spatial locality– Reduce run-time address computations– Facilitate padding for cache lines
MPI Optimizations
• The MPI protocol
• Collective operations
• Portable MPI tips
• Vendor MPI tips

The MPI ProtocolShort messages
• MPI processes have a finite number of small preallocated buffers for short messages.
• Messages that are less than this threshold are sent without any handshake.
• If the receive is posted, the data is received in place. Otherwise, the message is copied into an available buffer. If no buffers are available, the send may block or signal an error.

The MPI ProtocolLong messages
• Long messages– MPI sends a request to the remote process to
receive the data. If the receive is posted, a reply is sent to the sender containing information about the destination. The sender then proceeds. If the receive is not posted, the sender may block, return or signal an error depending on the semantics of the call.
What does all this mean?
• Why use MPI_ISEND on short messages? MPI_Ixxxx primitives must allocate a request handle for you, which is not free.
• If you can guarantee the receive is posted, use MPI_[I]RSEND. This bypasses the handshake.
• Most MPI’s are not threaded internally so MPI_ISEND just defers the transfer to MPI_WAIT

Portable MPI tips
• Use contiguous datatypes or MPI_TYPE_STRUCT. Never use MPI_Pack or MPI_Unpack
• Post receives before sends
• Send BIG messages
• Avoid persistent requests
• Avoid MPI_Probe, MPI_Barrier
Vendor MPI tricks
• Tune short message length to avoid handshake at reasonable message lengths.– IBM SP setenv MP_EAGERLIMIT 16384– SGI O2K dplace -data_pagesize 64k– SUN E10000 setenv MPI_SHORTMSGSIZE 16384– Similar options on MPICH and LAM
• SGI O2K setenv MPI_NAP 1

MPI Tools
• Nupshot/Jumpshot
• Vampir
• Pablo
• Paradyn
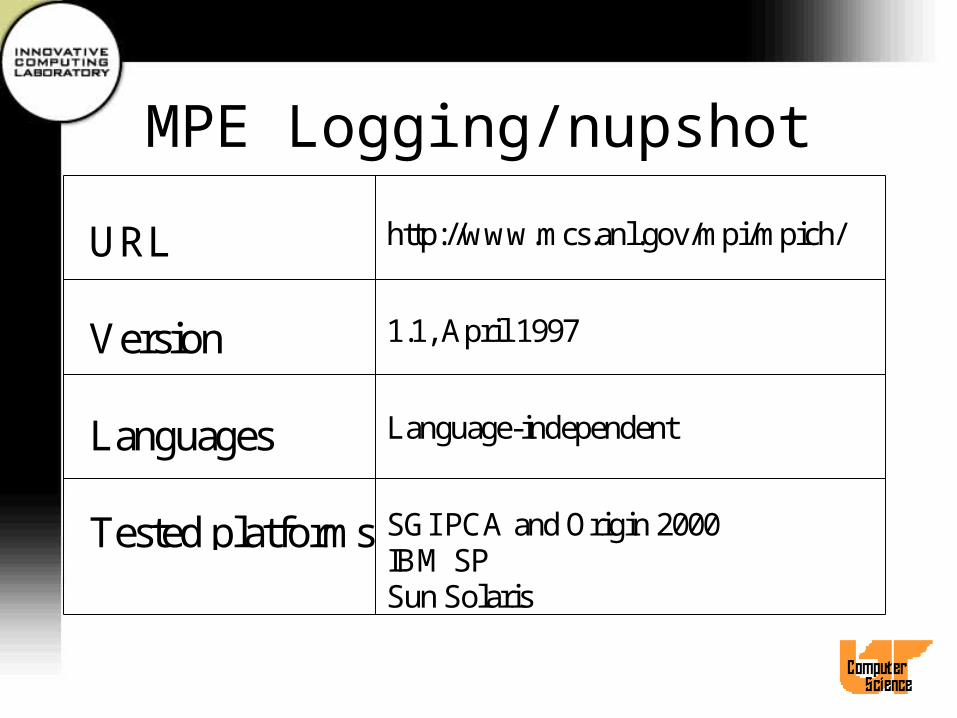
MPE Logging/nupshot
URL http://www.mcs.anl.gov/mpi/mpich/
Version 1.1, April 1997
Languages Language-independent
Tested platforms SGI PCA and Origin 2000IBM SPSun Solaris

MPE Logging/nupshot
• Included with MPICH 1.1 distribution• Distributed separately from rest of MPICH from
PTLIB• MPE logging library produces trace files in ALOG
format• nupshot display trace files in ALOG or PICL
format• Minimal documentation in MPICH User’s Guide
and man pages

MPE Logging Library
• MPI profiling library
• Additional routines for user-defined events and states– MPE_Log_get_event_number– MPE_Describe_event– MPE_Describe_state– MPE_Log_event

MPE Logging Library (cont.)
• MPI application linked with liblmpi.a produces trace file in ALOG format– Calls to MPE_Log_event store event records in
per-process memory buffer– Memory buffers are collected and merged
during MPI_Finalize
• MPI_Pcontrol can be used to suspend and restart logging
nupshot
• Current version requires Tcl 7.3 and Tk 3.6
• Must be built with -32 on SGI IRIX
• Visualization displays– Timeline– Mountain Ranges– State duration histograms
• Zooming and scrolling capabilities
Timelines Display
• Initially present by default• Each bar represents states of a process over time
with colors specified in log file.• Clicking on bar with left mouse button brings up
info box containing state name and duration.• Messages between processes are represented by
arrows.
Other Displays
• Mountain Ranges– Use Display menu to bring up this view– Color-coded histogram of states present over
time of execution
• State duration histograms– Accessed by menu buttons that pop up
according to which states were found in log file
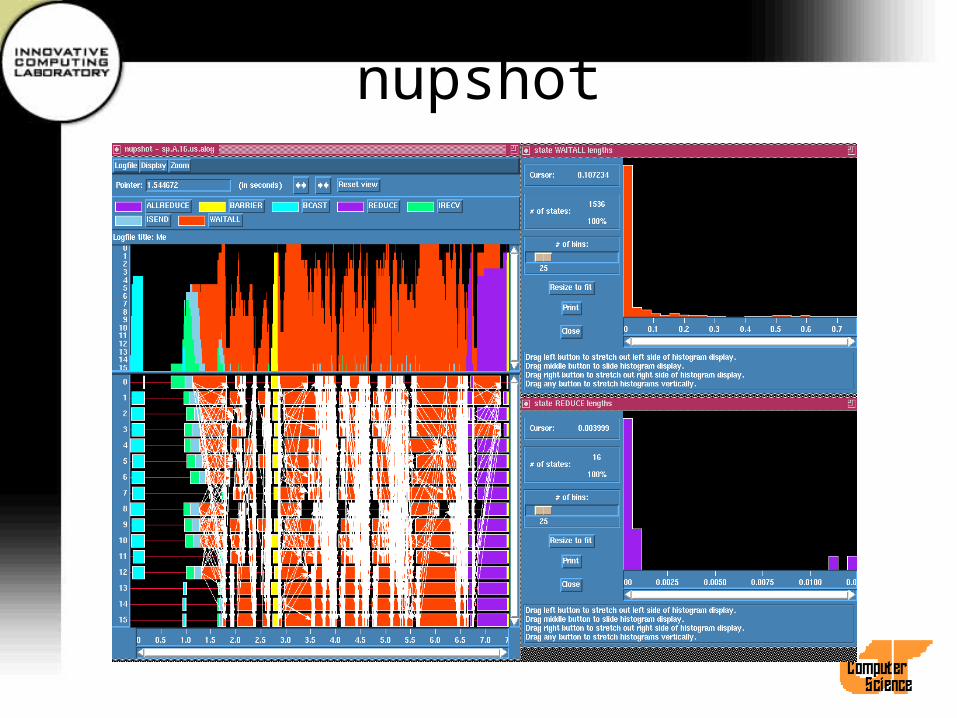
nupshot
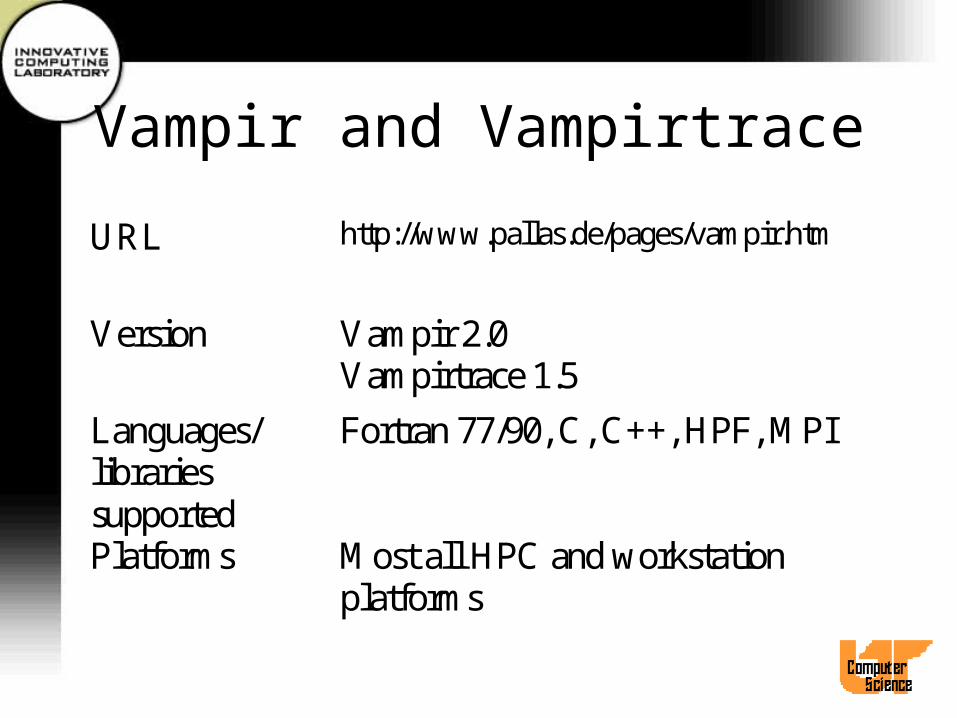
Vampir and Vampirtrace
URL http://www.pallas.de/pages/vampir.htm
Version Vampir 2.0Vampirtrace 1.5
Languages/librariessupported
Fortran 77/90, C, C++, HPF, MPI
Platforms Most all HPC and workstationplatforms

Vampir Features
• Tool for converting tracefile data for MPI programs into a variety of graphical views
• Highly configurable
• Timeline display with zooming and scrolling capabilities
• Profiling and communications statistics

Vampir GUI Features
• Four basic window styles– List windows such as call tree views– Graphics windows such as timeline and
statistics views– Source listing windows such as source code
display (not available on all platforms)– Configuration dialogs

Vampir GUI Features (cont.)
• All Vampir views except list windows have context-sensitive menus that pop up when the right mouse button is clicked inside the view.
• All Vampir menus can be “torn off” so that they remain displayed. When tear off functionality is enabled, selecting the dashed line tears off the menu. The menu remains displayed until the user presses the ESCAPE key within the window or selects close from the window manager menu.
Vampir GUI Features (cont.)
• Zooming is available in most Vampir graphic windows. To magnify a part of the display, press the left mouse button at the start of the region to be magnified. While holding the left button down, drag the mouse to the end of the desired region, then release the mouse button.
• Configuration setting for the various windows can be changed by using the Preferences menu on the main window.

Global Timeline Display
• Pops up by default after a tracefile is loaded or pause loaded.
• Shows all analyzed state changes over the entire time period in one display.
• Horizontal axis is time, vertical axis is processes.• Messages between processes shown as black lines
which may appear as solid black in condensed display.
Global Timeline Display (cont.)
• Zoom to get more detailed view.• Unzoom by using context-sensitive menu or U
key.• Use Window Options/Adapt (hotkey A) to see
entire trace.• Select Ruler function (hotkey R) and drag mouse
with left button pressed to measure exact length of time period.

Zoomed Global Timeline Display
Global Timeline Context Menu
• Close
• Undo Zoom
• Ruler
• Identify Message
• Identify State
• Window Options menu
• Components menu
• Pointer Function menu
• Options menu

Identify Message
• Select this function from the Timeline context-sensitive menu and then select the message line.
• A message box with information about the selected message will appear.
• If source code information is available, two source code windows for the send and receive operations will be opened, with the send and receive lines highlighted.

Identify State
• Select this function from the Timeline context-sensitive menu and then select a process bar.
• A message box with information about the selected state will appear.
• If source code information is available, a source code window will be opened with the corresponding line of code highlighted.
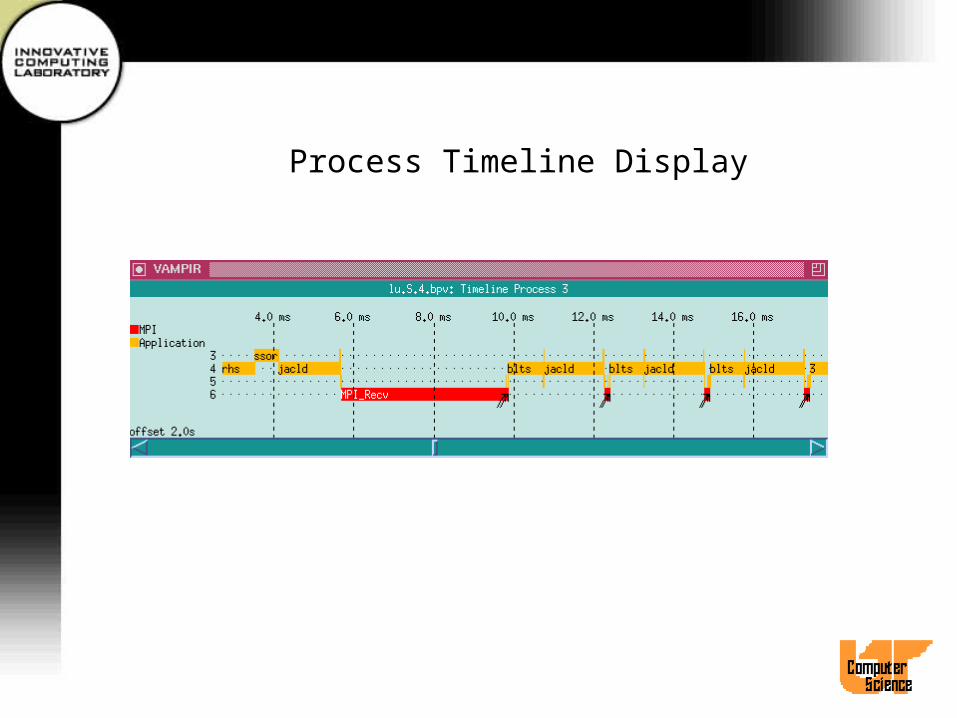
Process Timeline Display
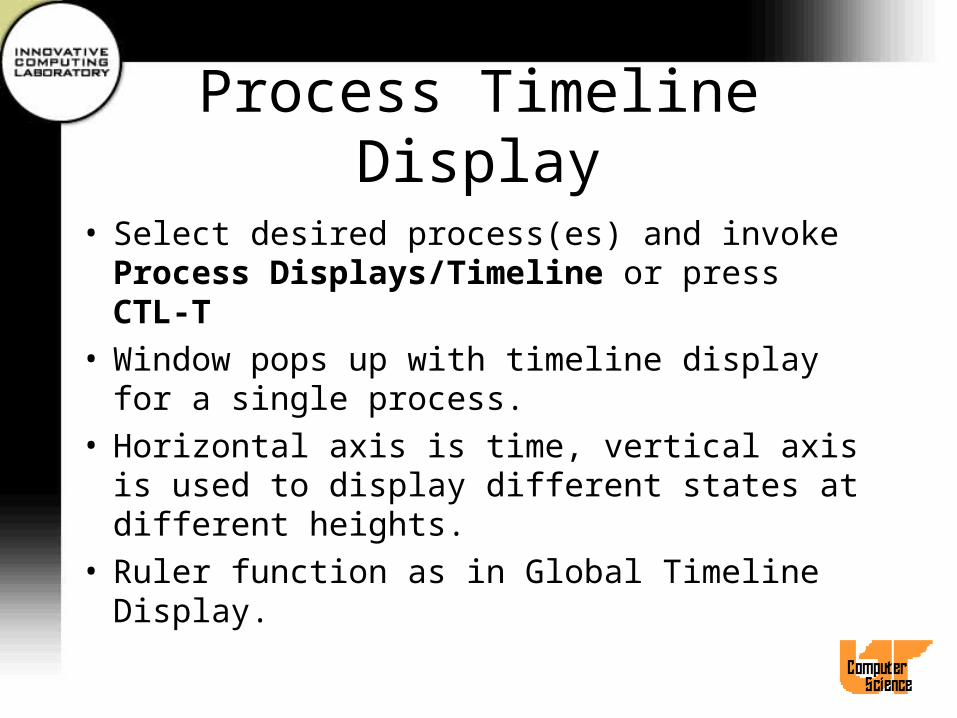
• Select desired process(es) and invoke Process Displays/Timeline or press CTL-T
• Window pops up with timeline display for a single process.
• Horizontal axis is time, vertical axis is used to display different states at different heights.
• Ruler function as in Global Timeline Display.
Process Timeline Display
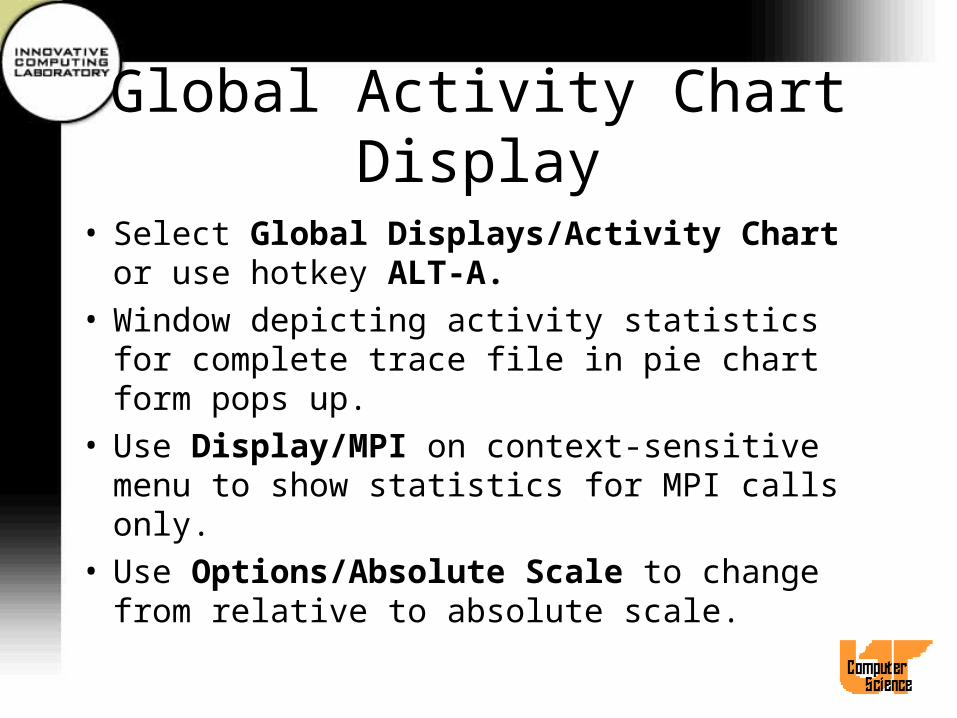
Global Activity Chart Display
• Select Global Displays/Activity Chart or use hotkey ALT-A.
• Window depicting activity statistics for complete trace file in pie chart form pops up.
• Use Display/MPI on context-sensitive menu to show statistics for MPI calls only.
• Use Options/Absolute Scale to change from relative to absolute scale.
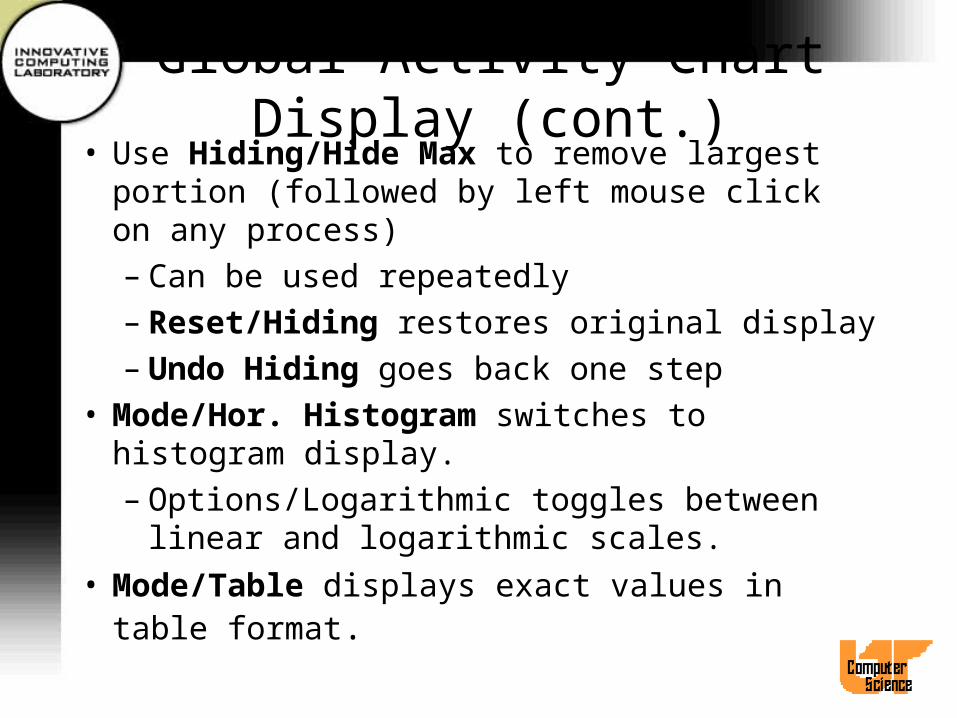
Global Activity Chart Display (cont.)• Use Hiding/Hide Max to remove largest portion
(followed by left mouse click on any process)– Can be used repeatedly– Reset/Hiding restores original display– Undo Hiding goes back one step
• Mode/Hor. Histogram switches to histogram display.– Options/Logarithmic toggles between linear
and logarithmic scales.
• Mode/Table displays exact values in table format.
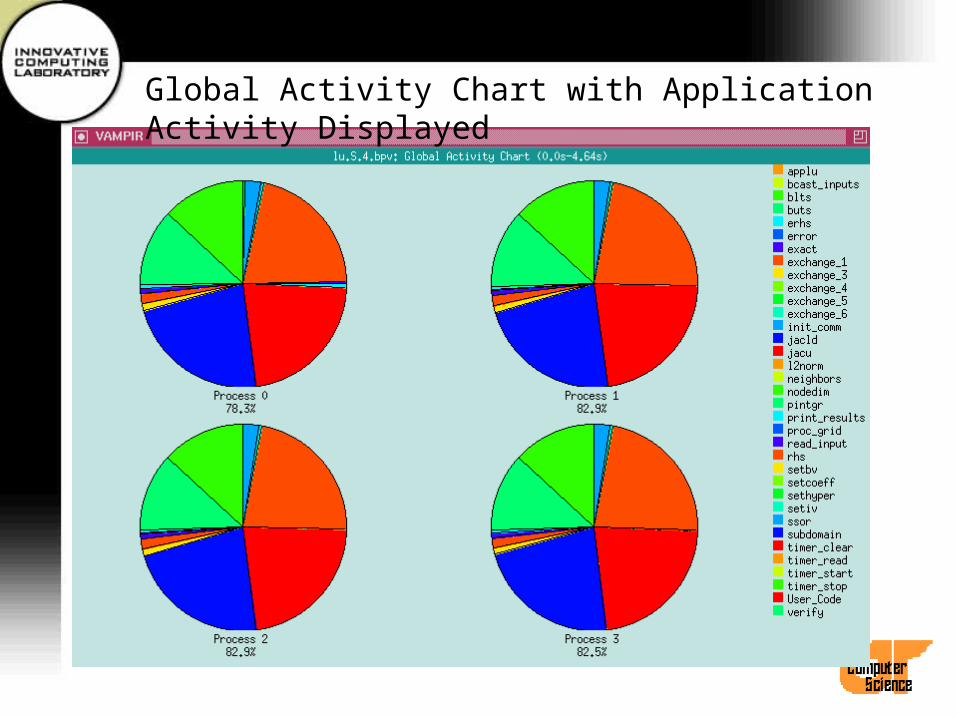
Global Activity Chart with Application Activity Displayed
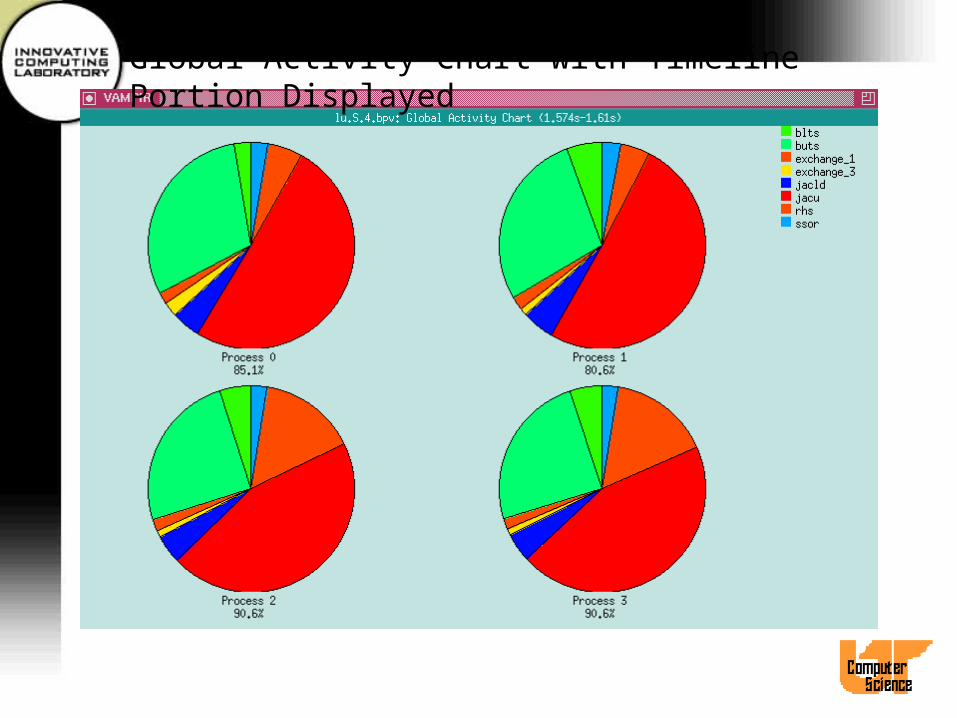
Global Activity Chart with Timeline Portion Displayed
Process Activity Chart Display• Select process(es) and then select Process
Displays/Activity Chart or use hotkey CTL-A.• A separate statistics window for each selected
process pops up.• Activity names are displayed directly at
corresponding pie sectors.• Use Options/Append Values to append exact
time portions or values to each activity.• Other menu items similar to Global Activity Chart
Display.
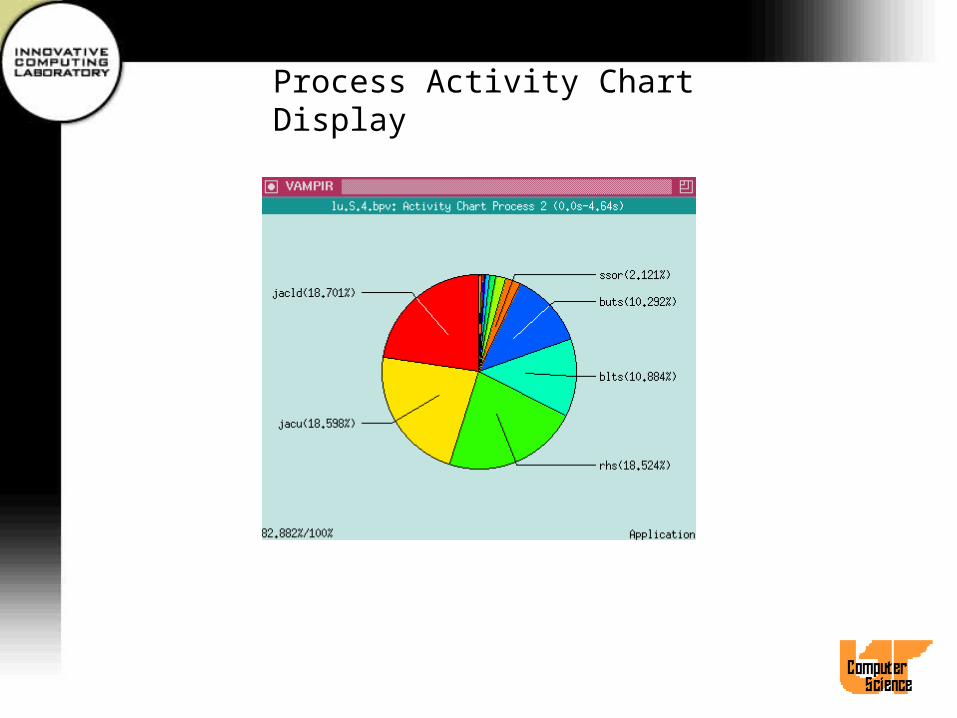
Process Activity Chart Display
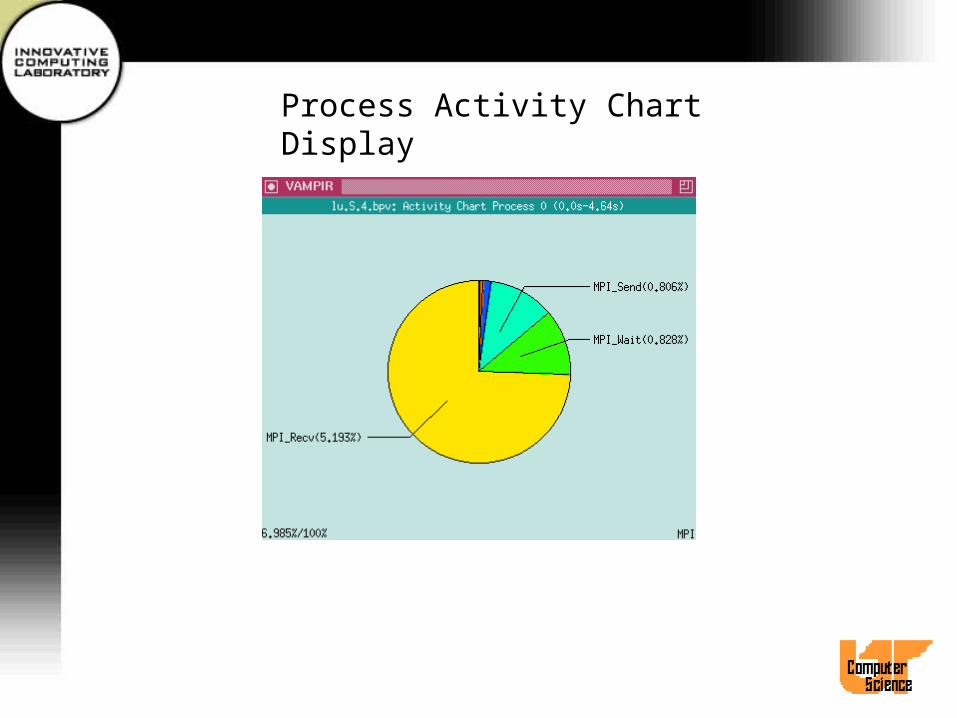
Process Activity Chart Display
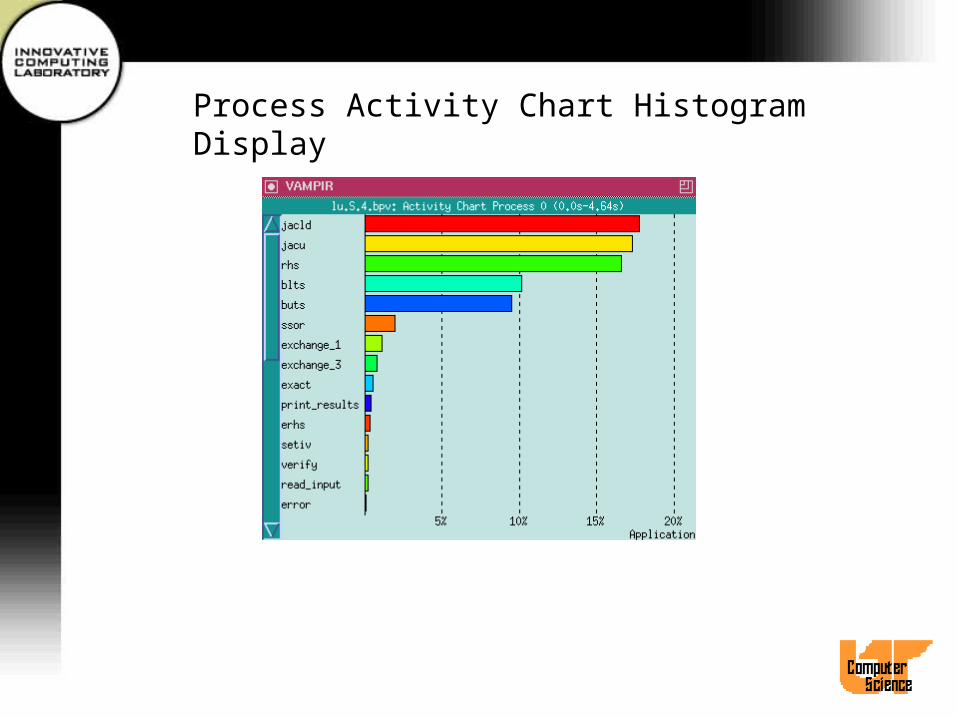
Process Activity Chart Histogram Display
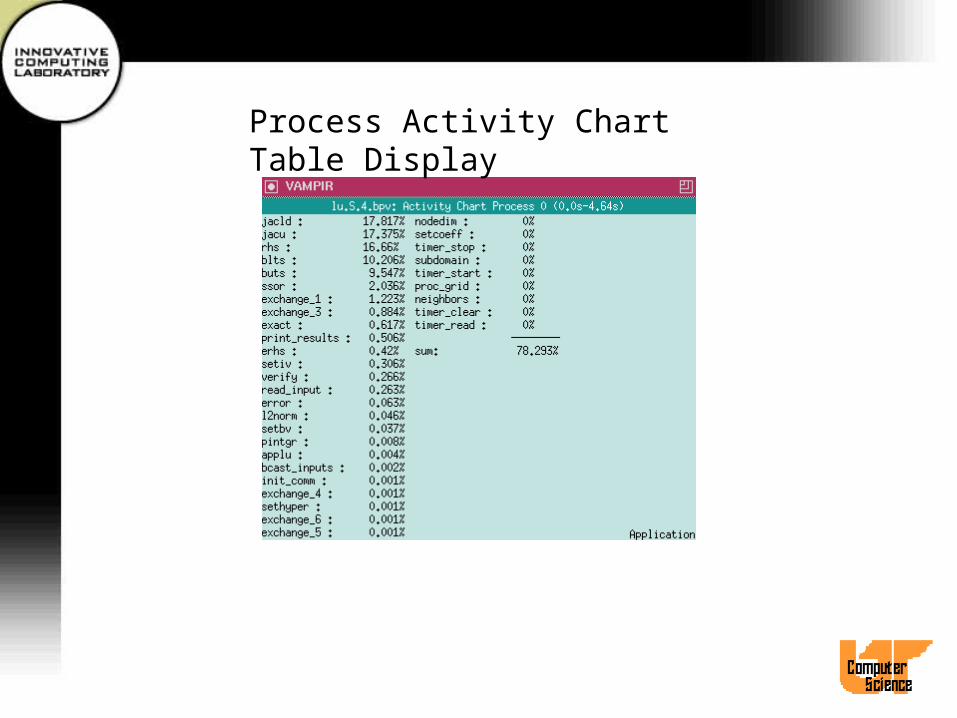
Process Activity Chart Table Display
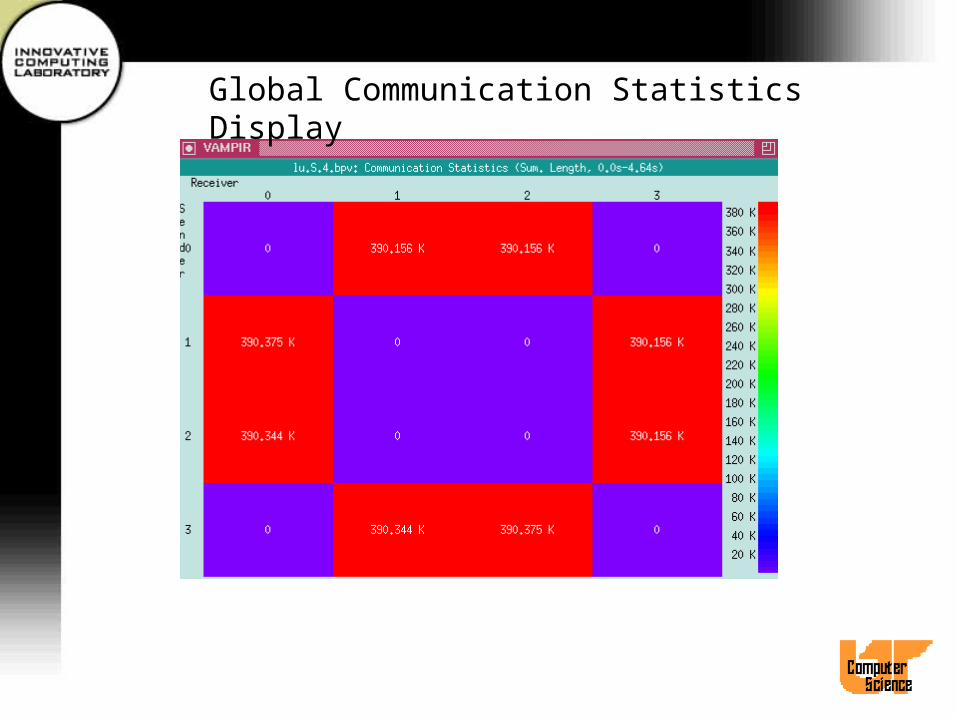
Global Communication Statistics Display
• Displays a matrix describing messages between sender-receiver pairs
• Default view shows absolute numbers of bytes communicated between pairs of processes.
• Use Timeline Portion and Freeze options• Filter Messages dialog• Use Count submenu to change values displayed
(e.g., to total number of messages)• Length Statistics sub-display
Global Communication Statistics Display

Global Communication Statistics Display using Timeline Portion
Global Parallelism Display
• Shows how many processes are involved in which activities over time
• Zoom and Ruler features (as in Timeline Display)
• Use Configuration dialog to deselect and order activities

Global Parallelism Display

OpenMP Optimization
• Well, we’re still figuring out how to get it to work in general.
• It’s not the panacea we thought it would be.
• Sure it’s easier than HPF, but is it as expressive?
• Doesn’t matter, since nobody uses HPF.

OpenMP Optimization cont.
• Parallelization strategies
• Synchronization
• Scheduling
• Variables

Loop Level Approach
• Easy to parallelize code
• Each expense loop paralleled one at a time
• Ensure correctness
• Not easy to ensure good scalability
• Remember that non-parallel code will dominate.
SPMD via OpenMP
• Useful if developing from scratch
• Implement to run on any number of threads– Query number of threads
omp_get_num_threads()
– Find my thread numberomp_get_thread_num()
– Calculate extents– All subdomain data is PRIVATE

OpenMP Synchronization
• Critical section - a section of code that must be executed completely by one thread. Non-reentrant
• C$OMP CRITICAL – Implies synchronization and one thread of execution
at a time.
• Use C$OMP ATOMIC– Multiple threads may execute it, but it must run to
completion.
OpenMP Barriers
• During the debugging phase, be liberal.
• During tuning barriers are not always necessary in every case.
• There is an implied barriers at the end of every PARALLEL DO construct.
• Consecutive loops may be independent.
• Use C$OMP END DO NOWAIT
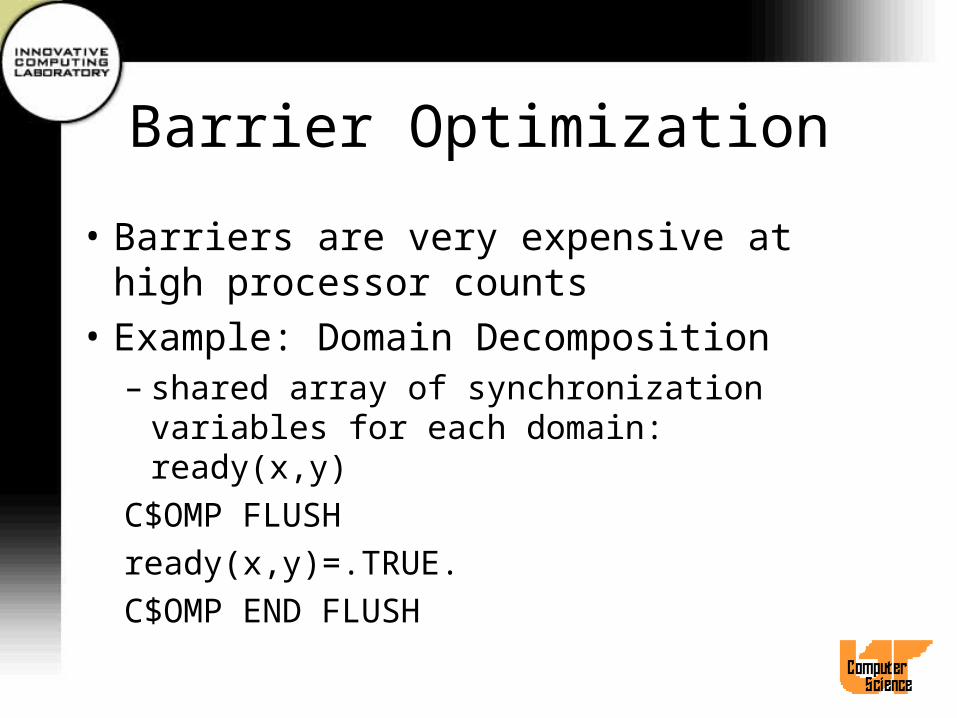
Barrier Optimization
• Barriers are very expensive at high processor counts
• Example: Domain Decomposition– shared array of synchronization variables for
each domain: ready(x,y)
C$OMP FLUSH
ready(x,y)=.TRUE.
C$OMP END FLUSH
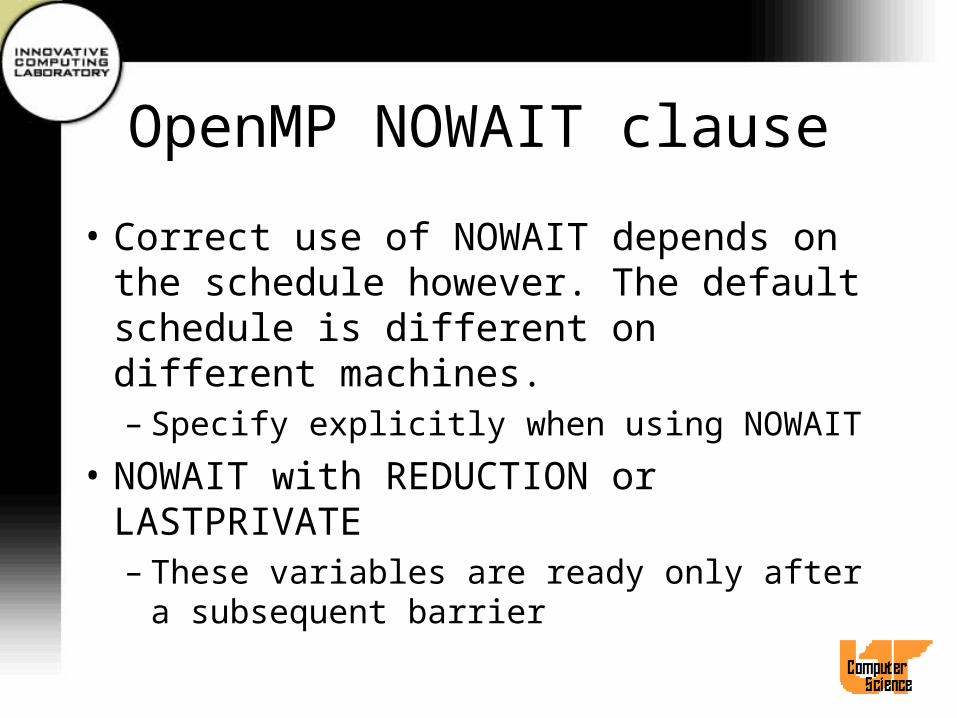
OpenMP NOWAIT clause
• Correct use of NOWAIT depends on the schedule however. The default schedule is different on different machines.– Specify explicitly when using NOWAIT
• NOWAIT with REDUCTION or LASTPRIVATE– These variables are ready only after a
subsequent barrier
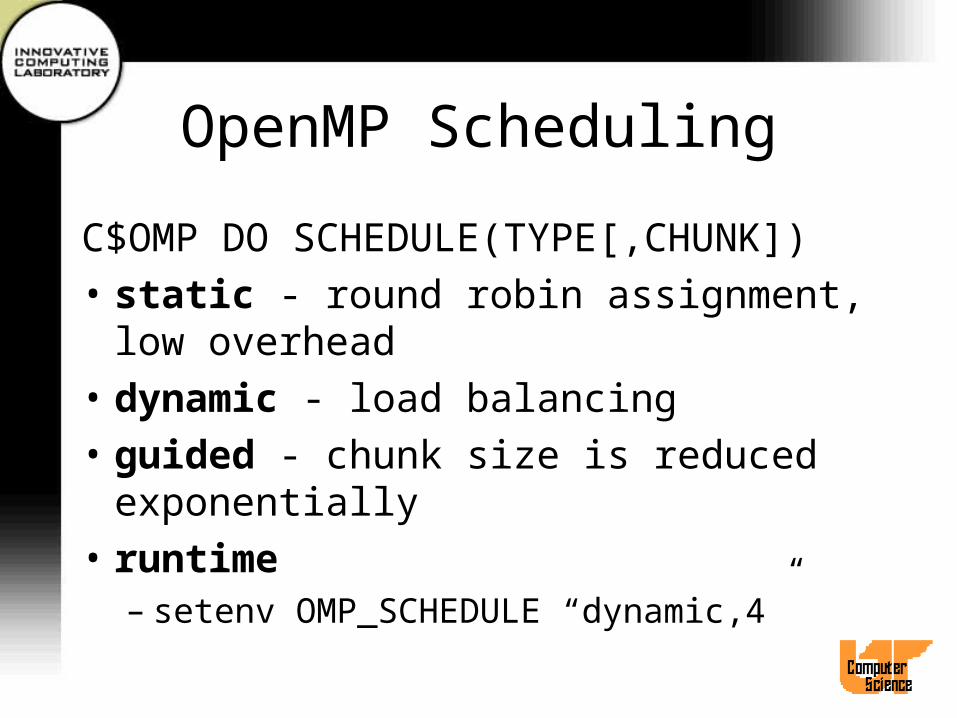
OpenMP Scheduling
C$OMP DO SCHEDULE(TYPE[,CHUNK])• static - round robin assignment, low overhead
• dynamic - load balancing
• guided - chunk size is reduced exponentially
• runtime– setenv OMP_SCHEDULE “dynamic,4”

Dynamic Threads
• Varies the number of threads depending on the load of the machine at the start of each parallel region.– Only works for codes with multiple parallel
regions.
• Optional feature in OpenMP.
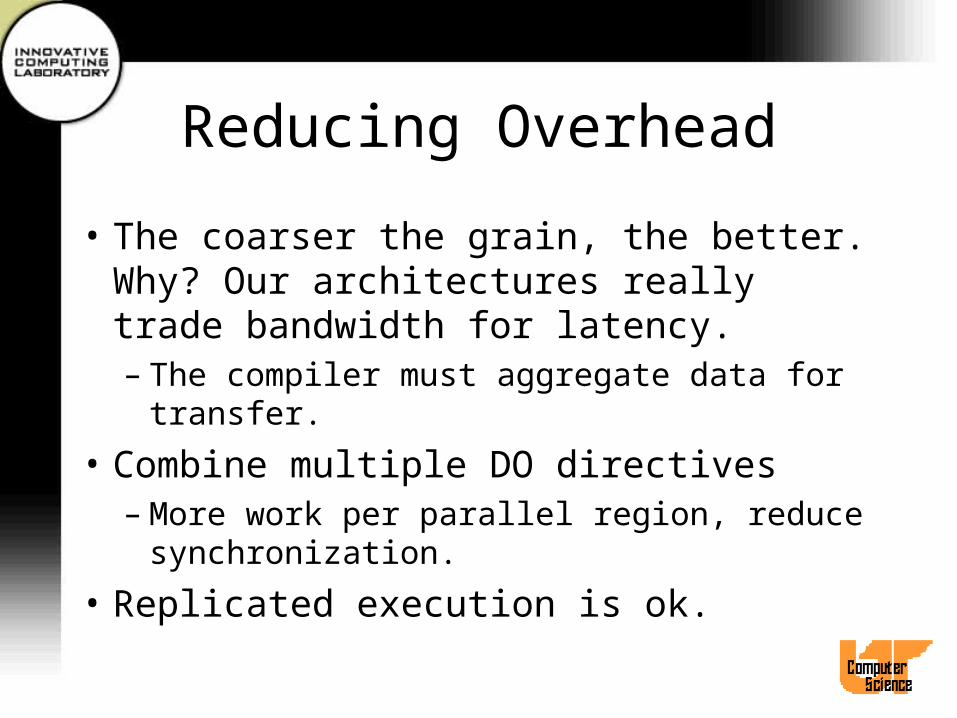
Reducing Overhead
• The coarser the grain, the better. Why? Our architectures really trade bandwidth for latency.– The compiler must aggregate data for transfer.
• Combine multiple DO directives– More work per parallel region, reduce
synchronization.
• Replicated execution is ok.
OpenMP Reduction
C$OMP PARALLEL DO REDUCTION (+,X)
do
x = x <op> expr
enddo
• Only scalar’s are allowed
• Sensitive to roundoff errors

OpenMP and PRIVATE’s
• SHARED - one copy, remote read/write• PRIVATE - uninitialized copy for each
thread• FIRSTPRIVATE - initialized from original• DEFAULT(CLASS) - different on each• THREADPRIVATE - global data private to a
thread. (COMMON, static)
Parallel I/O and OpenMP
• If your I/O is done in a C routine– Normal file descriptor based I/O will fight for
access to the file pointer.– Use open() and mmap() and operate on
segments of the memory mapped file in a PARALLEL DO region.
OpenMP Memory Consistency
• Provides a memory fence
• Necessary for consistent memory across threads.
• If using synchronization variables, give flush the name of the variable.
• C$OMP FLUSH(var)

OpenMP and Global Variables
• Use C$OMP THREADPRIVATE() for data needed by subroutines in the parallel region.– Common blocks
OpenMP Performance Tuning
• Fix false sharing– Multiple threads writing to the same cache line
• Increase chunk size
• Tune schedule
• Reduce barriers
• SPMD Vs. Loop Level
Additional Material
http://www.cs.utk.edu/~mucci/MPPopt.html
• Slides
• Optimization Guides
• Papers
• Pointers
• Compiler Benchmarks