Embed Size (px)
Citation preview

Perfect Competition
Cost Curve Collection
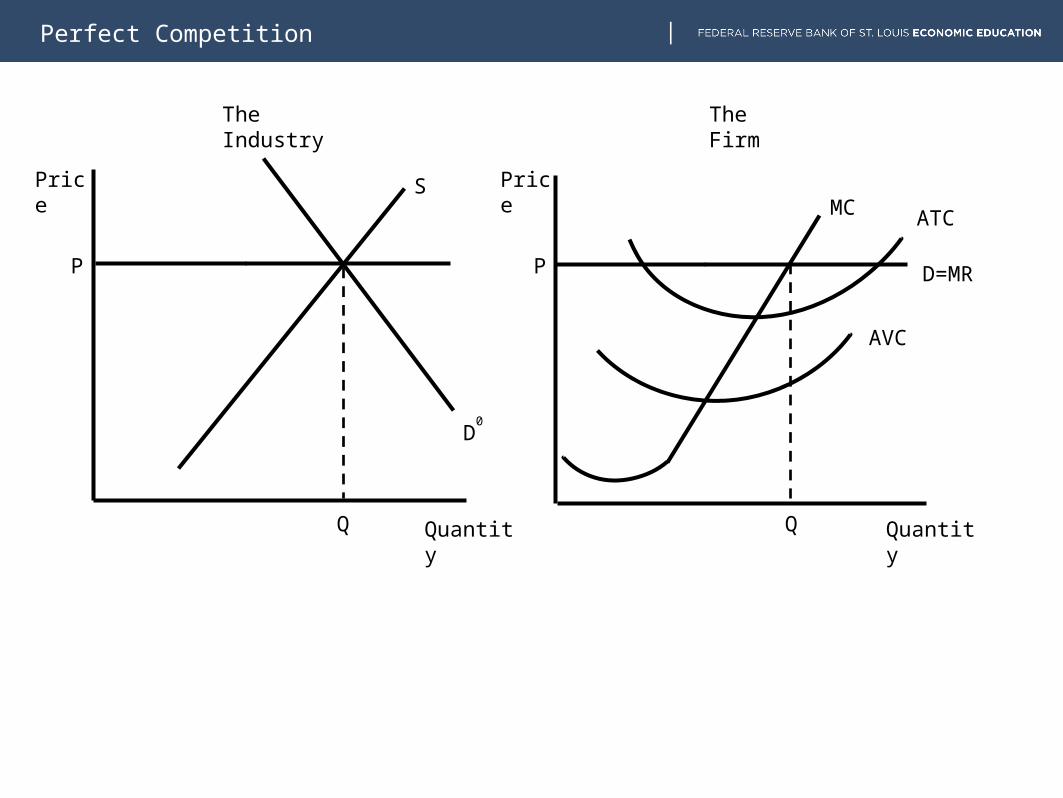
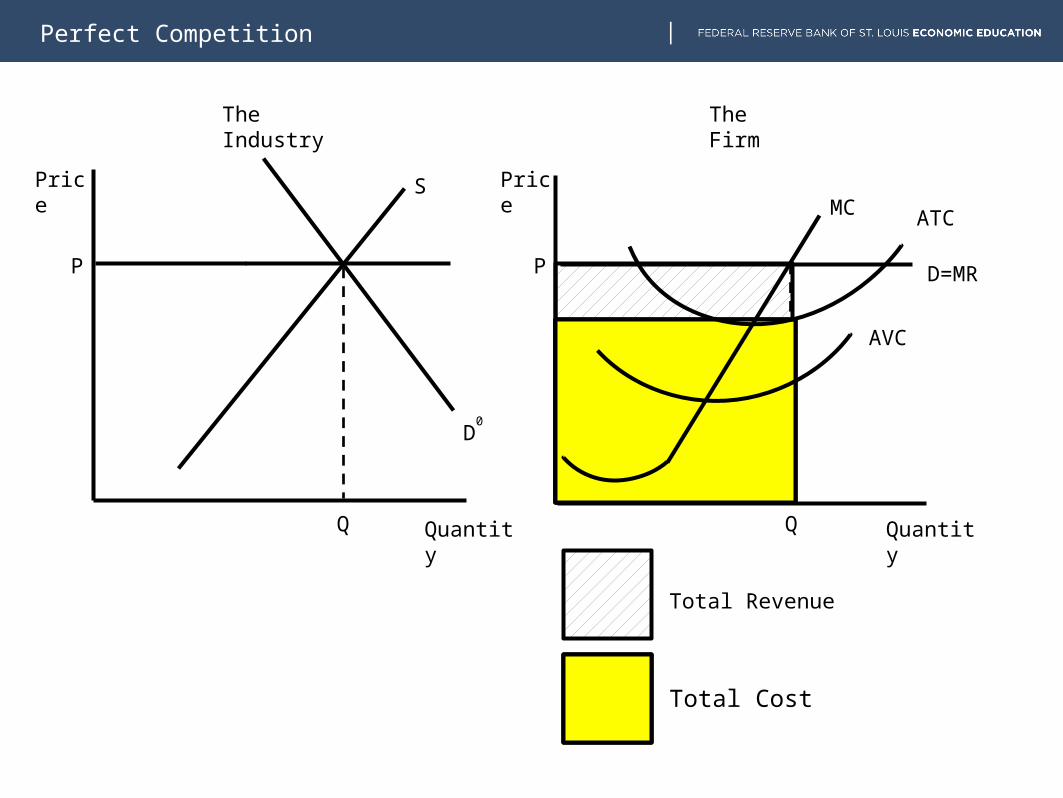
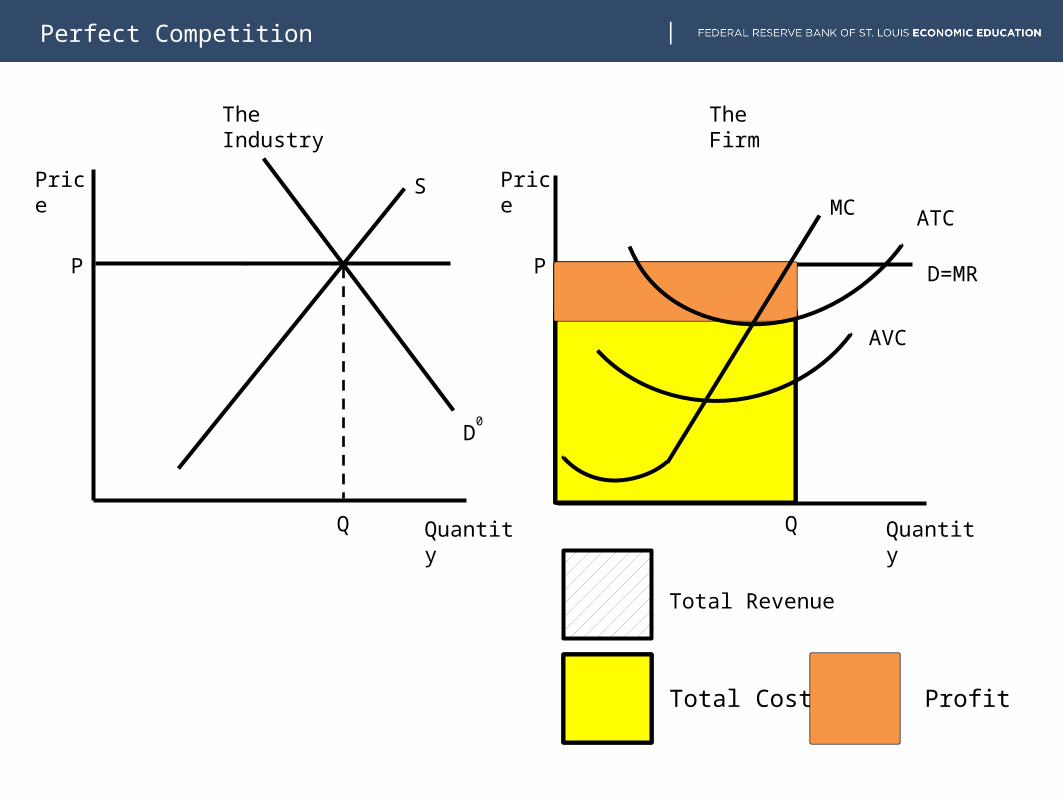
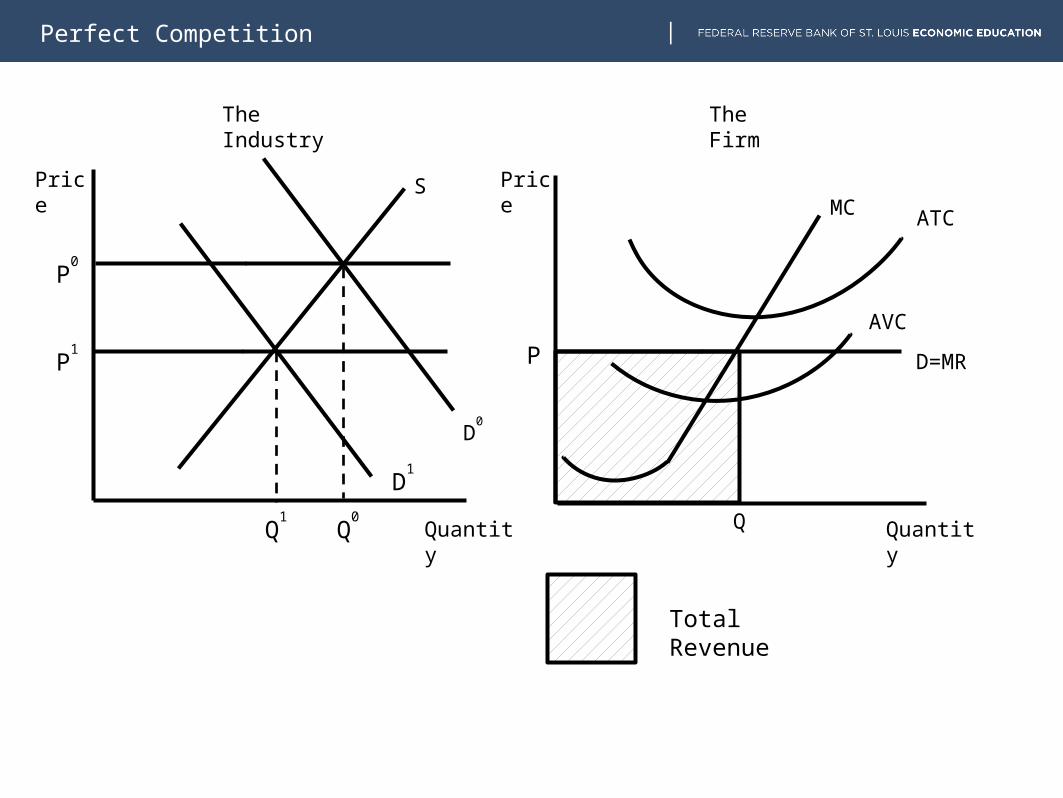
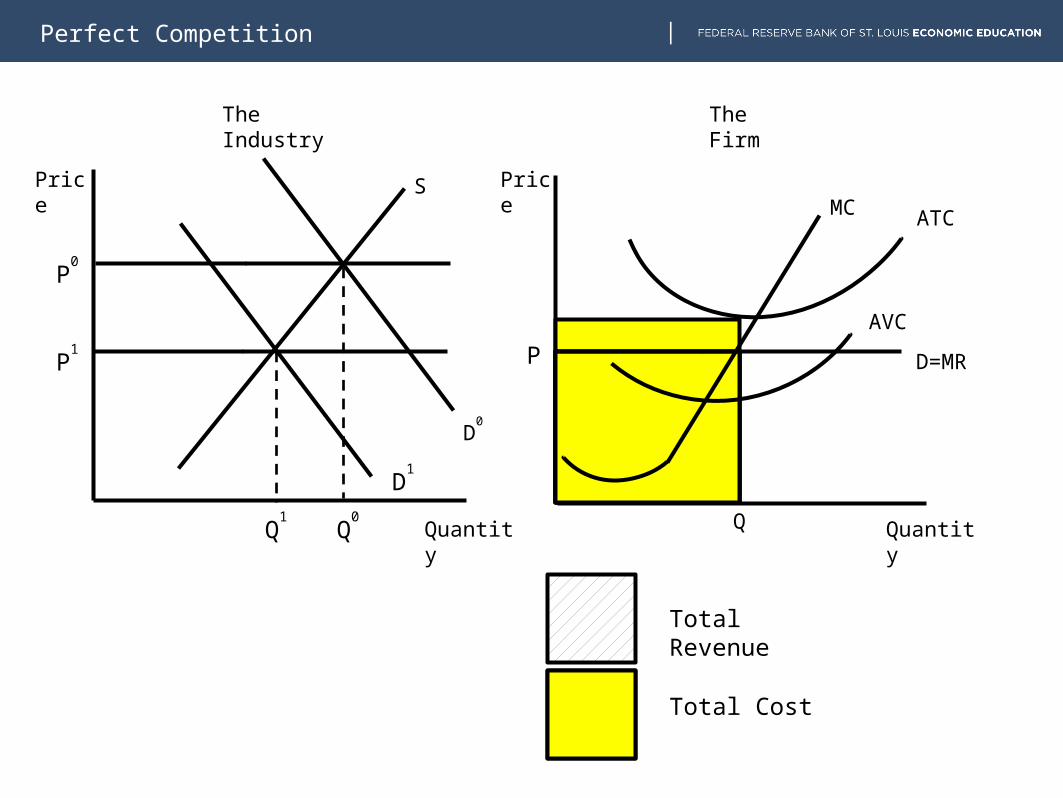
Slides 2-5 depict a perfectly competitive market and a firm in that market. The progression from slide 2 through 4 show the areas of total revenue (TR), total cost (TC), and profit.
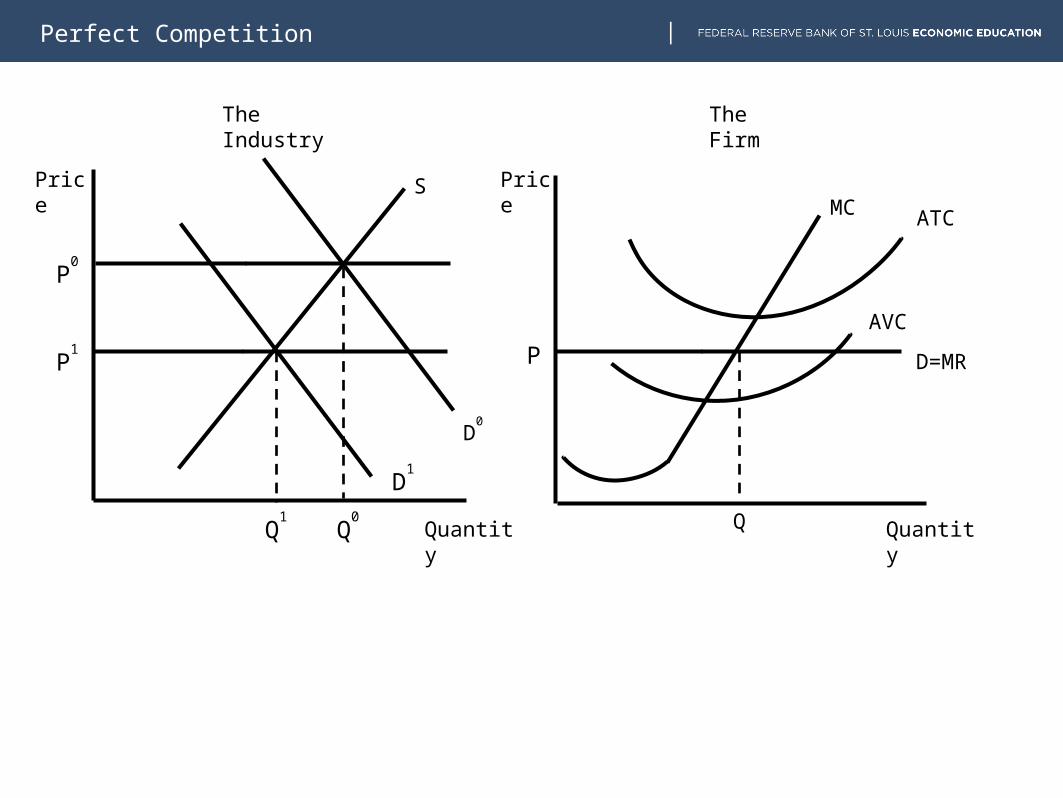
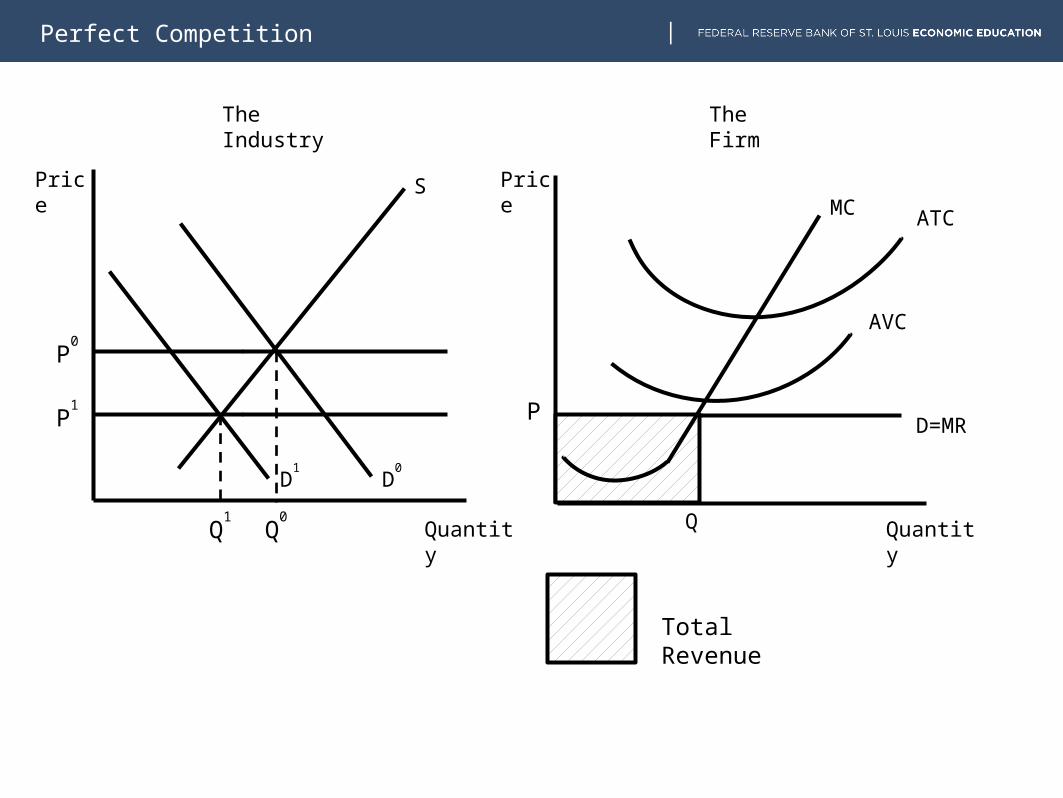
Slides 6-9 illustrate a decrease in demand and how the new market price reduces TR and causes the firm to operate at a loss. The decrease drives the price below the ATC of the firm, which decreases total revenue and produces a loss for the firm. The firm is covering its variable costs and part of its fixed costs.
Slides 10-13 illustrates a further decrease in demand, reducing the price for the firm to a point below the AVC curve. The slides indicate even greater loss. At this point, the firm will shut down to minimize losses, but it will still be obligated to its fixed costs.
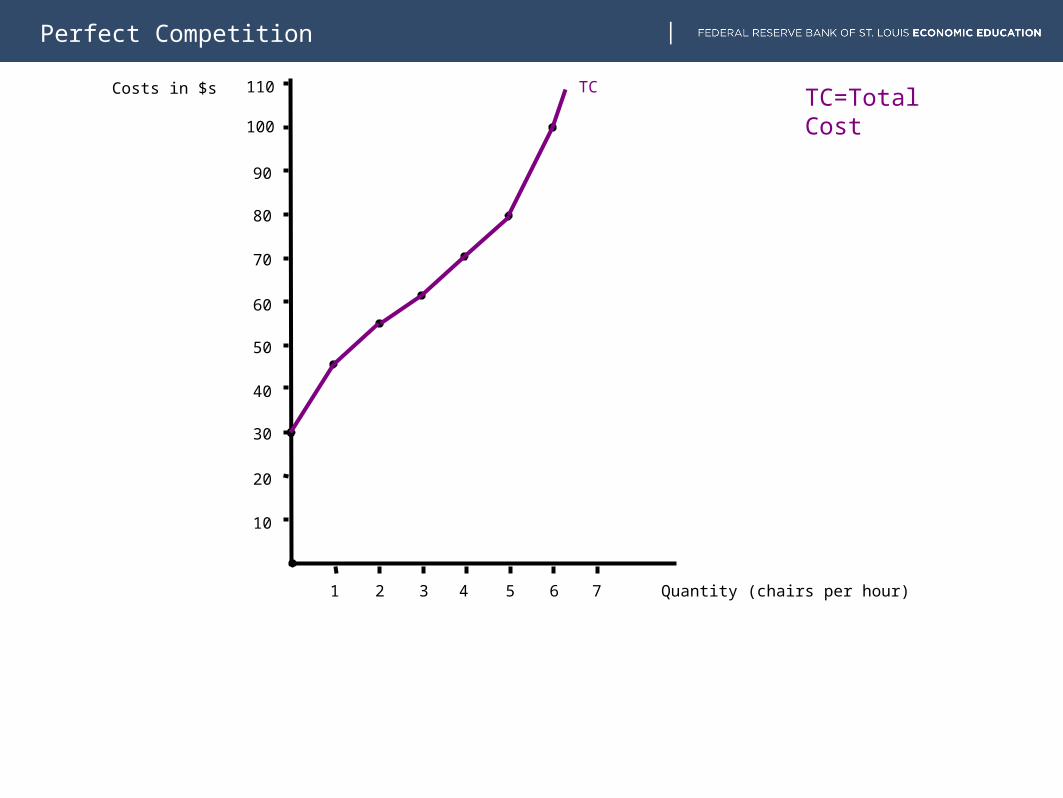
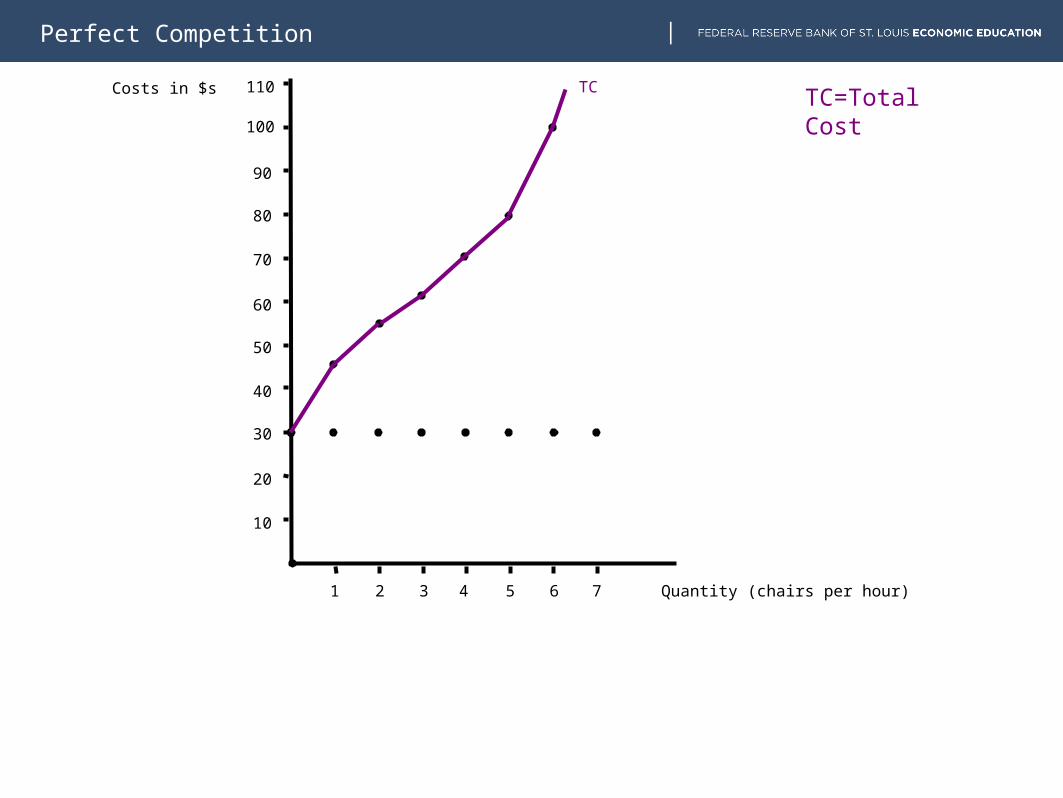
Slides 14-30 could be considered a set. The curves in slides 15-29 are based on the table in slide 14. The table could be printed so that students would have it handy while viewing the graphs. For best results, print the table in "landscape" orientation.
Perfect Competition
D=MR
MC
P
S
D0
P
The Industry
Q
The Firm
Price Price
Quantity QuantityQ
ATC
AVC

Perfect Competition
D=MR
MC
P
S
D0
P
The Industry
Q
The Firm
Price Price
Quantity QuantityQ
ATC
AVC
Total Revenue
Perfect Competition
D=MR
MC
P
S
D0
P
The Industry
Q
The Firm
Price Price
Quantity QuantityQ
ATC
AVC
Total Revenue
Total Cost
Perfect Competition
D=MR
MC
P
S
D0
P
The Industry
Q
The Firm
Price Price
Quantity QuantityQ
ATC
AVC
Total Revenue
Total Cost Profit
Perfect Competition
MCS
D0
The Industry
The Firm
Price Price
Quantity QuantityQ
ATC
AVC
D1
Q1
Q0
P1
P0
P D=MR
Perfect Competition
MCS
D0
The Industry
The Firm
Price Price
Quantity QuantityQ
ATC
AVC
D1
Q1
Q0
P1
P0
P
Total Revenue
D=MR
Perfect Competition
MCS
D0
The Industry
The Firm
Price Price
Quantity QuantityQ
ATC
AVC
D1
Q1
Q0
P1
P0
P
Total Revenue
Total Cost
D=MR

Perfect Competition
MCS
D0
The Industry
The Firm
Price Price
Quantity QuantityQ
ATC
AVC
D1
Q1
Q0
P1
P0
P
Total Revenue
Total Cost Loss
D=MR

Perfect Competition
D=MR
MCS
D0
The Industry
The Firm
Price Price
Quantity QuantityQ
ATC
AVC
D1
Q1
Q0
P1
P0
P
Perfect Competition
MCS
D0
The Industry
The Firm
Price Price
Quantity QuantityQ
ATC
AVC
D1
Q1
Q0
P1
P0
P
Total Revenue
D=MR

Perfect Competition
MCS
D0
The Industry
The Firm
Price Price
Quantity QuantityQ
ATC
AVC
D1
Q1
Q0
P1
P0
P
Total Revenue
Total Cost
D=MR

Perfect Competition
MCS
D0
The Industry
The Firm
Price Price
Quantity QuantityQ
ATC
AVC
D1
Q1
Q0
P1
P0
P
Total Revenue
Total Cost
D=MR
Loss

Perfect Competition
Quantity of chairs per hour
TC FC VC MC AFC AVC ATC
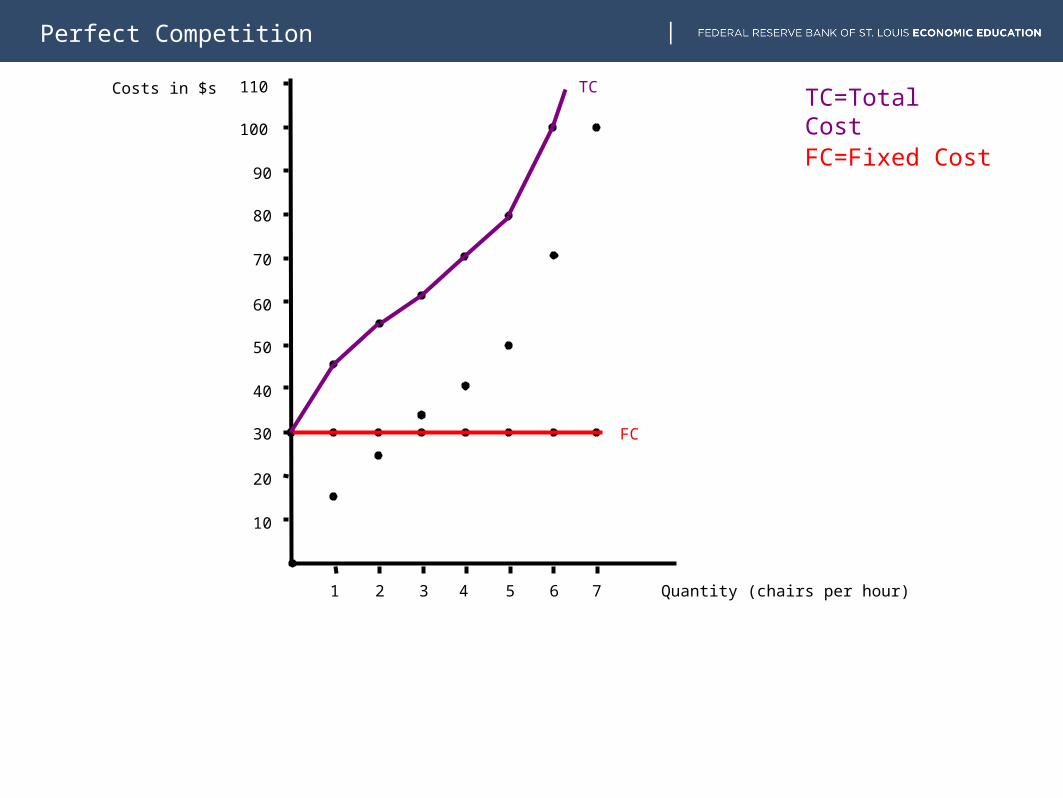
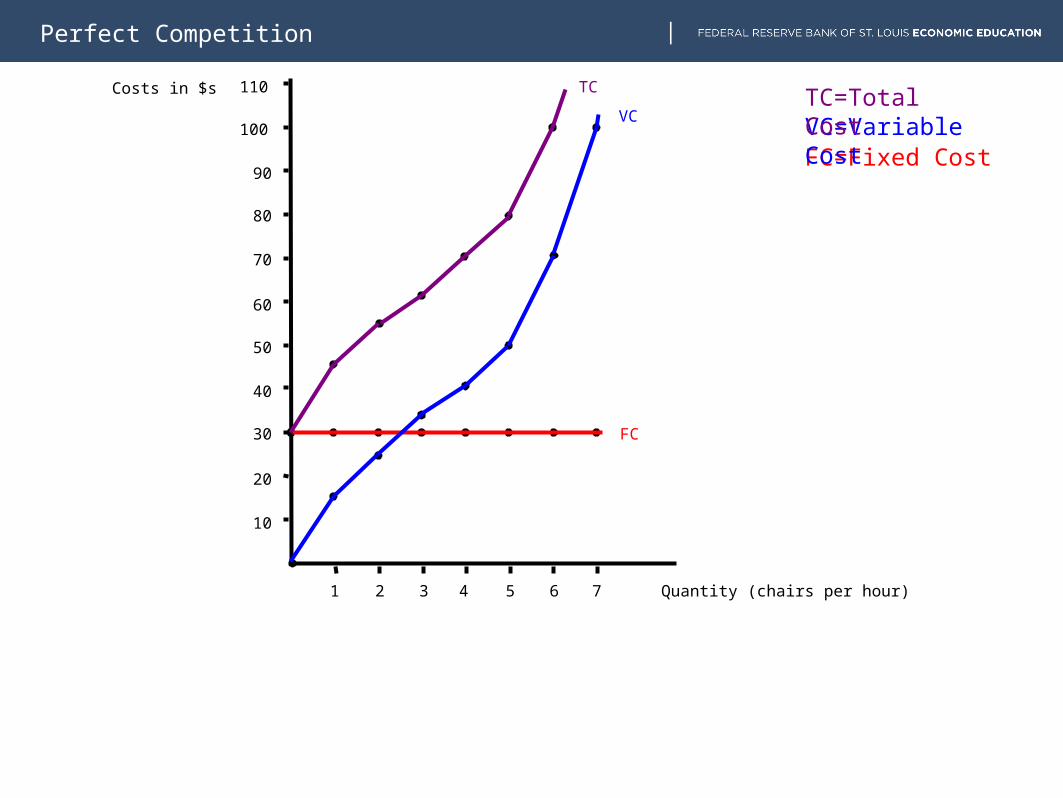
0 30 30 0
1 45 30 15 15.00 30.00 15.00 45.00
2 55 30 25 10.00 15.00 14.50 27.50
3 63 30 33 8.00 10.00 11.00 21.00
4 70 30 40 7.00 7.50 10.00 17.50
5 80 30 50 10.00 6.00 10.00 16.00
6 100 30 70 20.00 5.00 11.67 16.67
7 130 30 100 30.00 4.28 14.28 18.57

Perfect Competition
1 2 3 4 5 6 7
10
20
30
40
50
60
70
80
90
100
110Costs in $s
Quantity (chairs per hour)
Perfect Competition
1 2 3 4 5 6 7
10
20
30
40
50
60
70
80
90
100
110 TC TC=Total CostCosts in $s
Quantity (chairs per hour)
Perfect Competition
1 2 3 4 5 6 7
10
20
30
40
50
60
70
80
90
100
110 TC TC=Total CostCosts in $s
Quantity (chairs per hour)

Perfect Competition
1 2 3 4 5 6 7
10
20
30
40
50
60
70
80
90
100
110
FC
TC
FC=Fixed Cost
TC=Total CostCosts in $s
Quantity (chairs per hour)
Perfect Competition
1 2 3 4 5 6 7
10
20
30
40
50
60
70
80
90
100
110
FC
TC
FC=Fixed Cost
TC=Total CostCosts in $s
Quantity (chairs per hour)
Perfect Competition
1 2 3 4 5 6 7
10
20
30
40
50
60
70
80
90
100
110
FC
VC
TC
FC=Fixed CostVC=Variable CostTC=Total CostCosts in $s
Quantity (chairs per hour)

Perfect Competition
1 2 3 4 5 6 7
10
20
30
40
50
60
70
80
90
100
110
FC
VC
TC
FC=Fixed CostVC=Variable CostTC=Total CostCosts in $s
Quantity (chairs per hour)
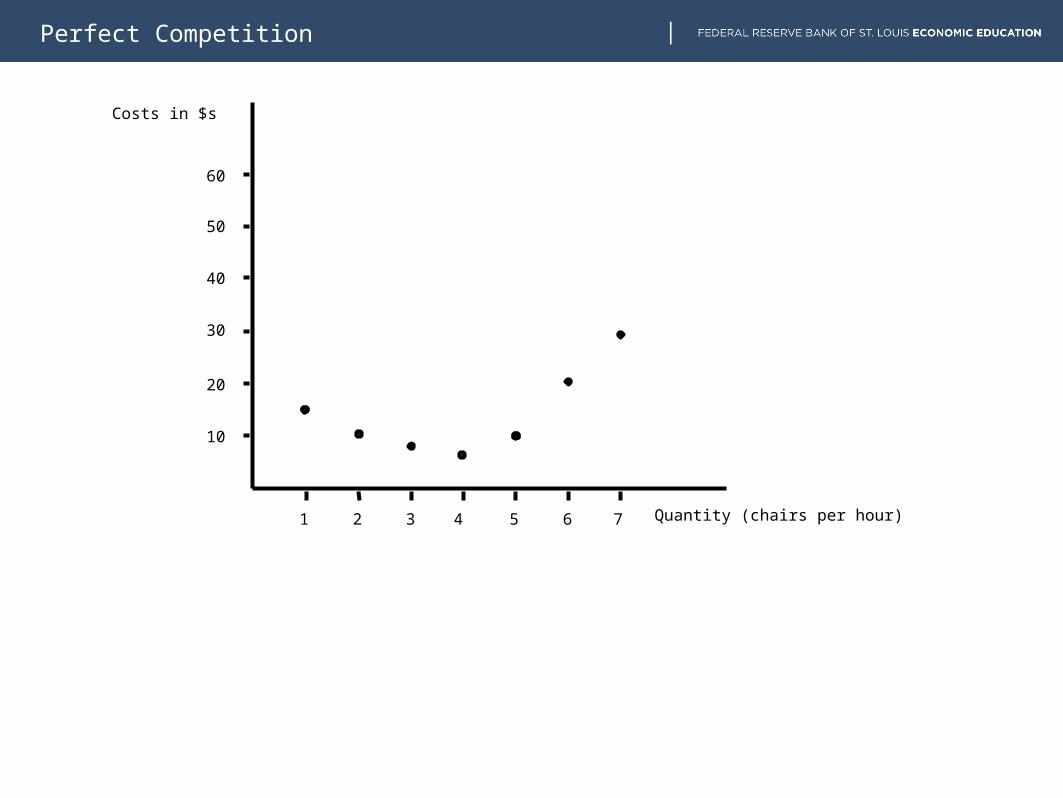
Perfect Competition
1 2 3 4 5 6 7
10
20
30
40
50
60
Costs in $s
Quantity (chairs per hour)

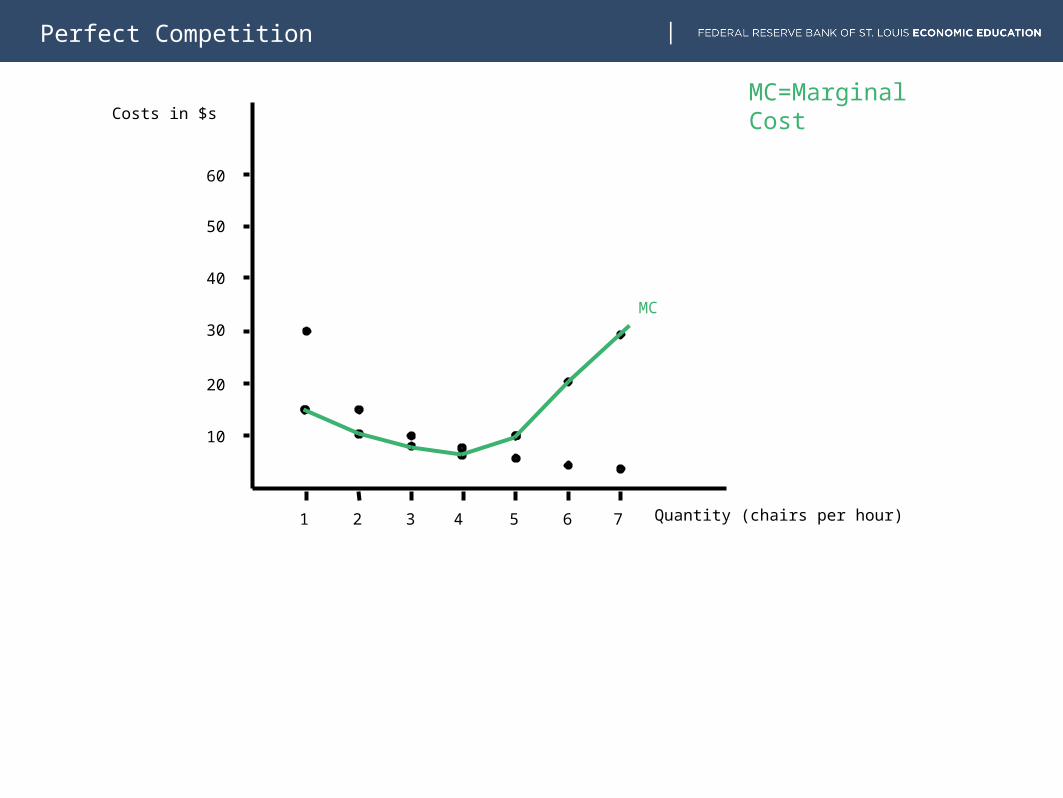
Perfect Competition
1 2 3 4 5 6 7
10
20
30
40
50
60
MC
MC=Marginal CostCosts in $s
Quantity (chairs per hour)
Perfect Competition
1 2 3 4 5 6 7
10
20
30
40
50
60
MC
MC=Marginal CostCosts in $s
Quantity (chairs per hour)

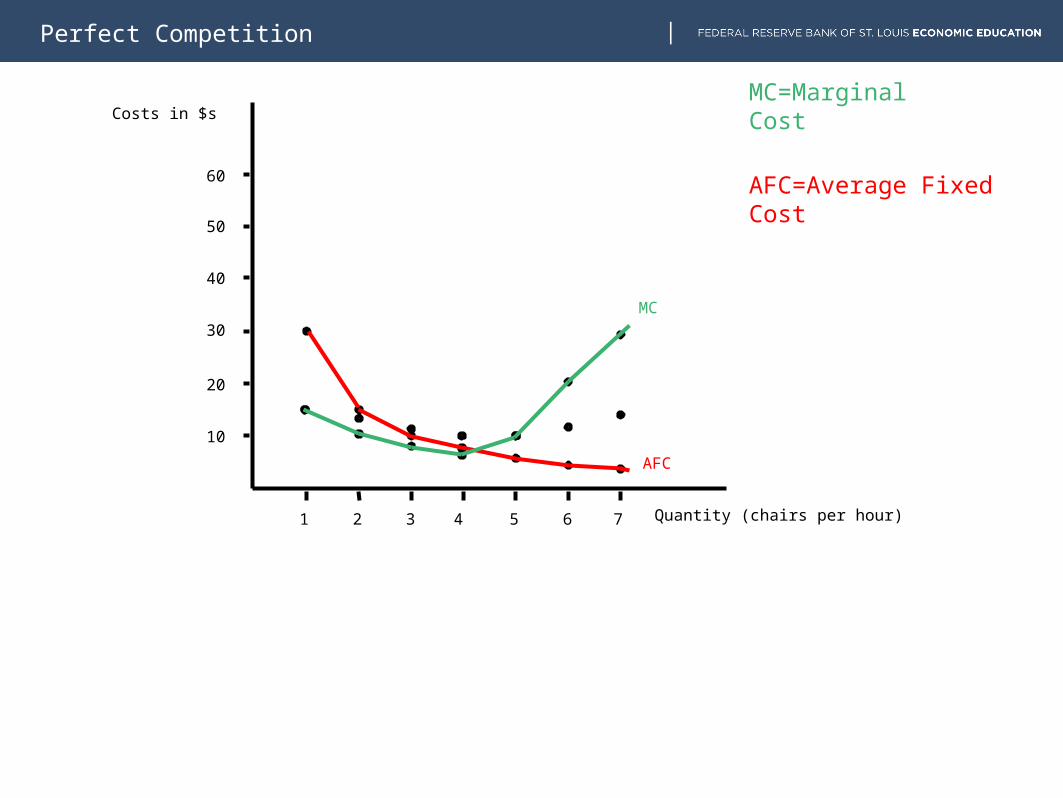
Perfect Competition
1 2 3 4 5 6 7
10
20
30
40
50
60
AFC
MC
AFC=Average Fixed Cost
MC=Marginal CostCosts in $s
Quantity (chairs per hour)
Perfect Competition
1 2 3 4 5 6 7
10
20
30
40
50
60
AFC
MC
AFC=Average Fixed Cost
MC=Marginal CostCosts in $s
Quantity (chairs per hour)
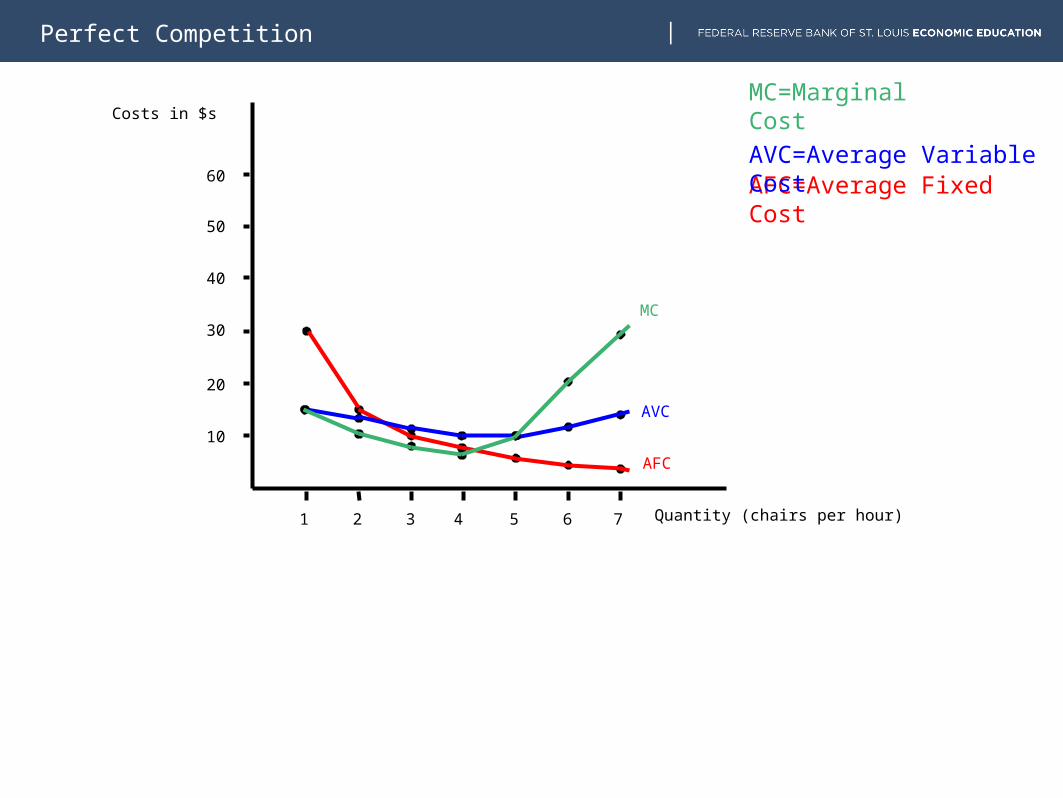
Perfect Competition
1 2 3 4 5 6 7
10
20
30
40
50
60
AFC
AVC
MC
AFC=Average Fixed Cost
AVC=Average Variable Cost
MC=Marginal CostCosts in $s
Quantity (chairs per hour)

Perfect Competition
1 2 3 4 5 6 7
10
20
30
40
50
60
AFC
AVC
MC
AFC=Average Fixed Cost
AVC=Average Variable Cost
MC=Marginal CostCosts in $s
Quantity (chairs per hour)

Perfect Competition
1 2 3 4 5 6 7
10
20
30
40
50
60
AFC
AVC
ATC
MC
AFC=Average Fixed Cost
AVC=Average Variable Cost
ATC=Average Total Cost
MC=Marginal CostCosts in $s
Quantity (chairs per hour)