Embed Size (px)
Citation preview


Technical papers in hydrology 1
In this series:
1 Perennial Ice and Snow Masses. A Guide for Compilation and Assemblage of Data for a World Inventory.
2 Seasonal Snow Cower. A Guide for Measurement, Compilation and Assemblage of Data.
3 Variations of Existing Glaciers. A Guide to International Practices for their Measurement.
4 Antartic Glaciology in the International Hydrological Decade.
5 Combined Heat, Ice and Water Balances at Selected Glacier Basins. A Guide for Compilation and Assemblage of Data for Glacier Mass Balance Measurements.

A contribution to the
International Hydrological
Decade
Perennial ice and snow masses
A guide for
compilation and assemblage of
data for a world inventory
nesco/iash

The selection and presentation of material and the opinions expressed in this publication are the responsibility of the authors concerned and do not necessarily reflect the views of Unesco. N o r do the designations employed or the presentation of the material imply the expression of any opinion whatsoever on the part of Unesco concerning the legal status of any country or territory, or of its authorities, or concerning the frontiers of any country or territory.
Published in 1970 by the United Nations Educational, Scientific and Cultural Organization, Place de Fontenoy, 75 Paris-7C. Printed by Imprimerie-Reliure M a m e .
© Unesco/I A S H 1970 Printed in France S C . 6 8 / X X . 1 / A .

Preface
The International Hydrological Decade ( IHD) 1965-1974 was launched by the General Conference of Unesco at its thirteenth session to promote international co-operation in research and studies and the training of specialists and technicians in scientific hydrology. Its purpose is to enable all countries to m a k e a fuller assessment of their water resources and a more rational use of them as man's demands for water constantly increase in face of developments in population, industry and agriculture. In 1968 national committees for the Decade had been formed in 100 of Unesco 's 122 M e m b e r States to carry out national activities and to contribute to regional and international activities within the programme of the Decade. The implementation of the programme is supervised by a co-ordinàting council, composed of twenty-one M e m b e r States selected by the General Conference of Unesco, which studies proposals for developments of the programme, recommends projects of interest to all or a large number of countries, assists in the development of national and regional projects and co-ordinates international co-operation.
Promotion of collaboration in developing hydro-logical research techniques, diffusing hydrological data and planning hydrological installations is a major feature of the programme of the I H D which encompasses all aspects of hydrological studies and research. Hydrological investigations are encouraged at the national, regional and international level to strengthen and to improve the use of natural resources from a local and a global perspective. The programme provides a means for countries well advanced in hydrological research to exchange scientific views and for developing countries to benefit from this exchange of information in elaborating research projects and in implementing recent developments in the planning of hydrological installations.
A s part of Unesco's contribution to the achievement of the objectives of the I H D the General Conference authorized the Director-General to collect, exchange and disseminate information concerning research on scientific hydrology and to facilitate contacts between research workers in this field. T o this end Unesco has initiated two collections of publications 'Studies and Reports in Hydrology' and 'Technical Papers in Hydrology'.
The collection 'Technical Papers in Hydrology' is intended to provide a means for the exchange of information on hydrological techniques and for the co-ordination of research and data collection.
The acquisition, transmission and processing of data in a manner permitting the intercomparison of results is a prerequisite to efforts to co-ordinate scientific projects within the framework of the I H D . The exchange of information on data collected throughout the world requires standard instruments, techniques, units of measure and terminology in order that data from all areas will be comparable. M u c h work has been done already toward international standardization, but m u c h remains to be done even for simple measurements of basic factors such as precipitation, snow cover, soil moisture, streamflow, sediment transport and ground-water phenomena.
It is hoped that the guides on data collection and compilation in specific areas of hydrology to be published in this collection will provide means whereby hydrologists m a y standardize their records of observations and thus facilitate the study of hydrology on a world-wide basis.

Contents
Foreword 9
1 Ice and snow on the surface (glacier inventory) 11
2 Ice beneath the surface 21
3 Three pilot studies for the I H D world inventory of glaciers 25
Introduction 25 A . A pilot study for an inventory
of the glaciers of the High Arctic 26 B . A pilot study for an inventory of
the glaciers in the Rocky Mountains 36 C . A pilot study for an inventory of the
glaciers in the Eastern Himalayas 47

Foreword
Since about 80 per cent of all fresh water exists in solid form, an accurate assessment of the amount, distribution and variation of all snow and ice masses, both near to and far from areas at present inhabited is of importance for the understanding of man's environment. T o comply with the need for more complete and detailed information on ice and snow, the Co-ordinating Council of the I H D at its first session passed a resolution recommending to M e m b e r States the mapping of permanent snow and ice masses and the compilation and assemblage of data for publication in order to obtain the elements necessary for the establishment of the regional distribution of permanent snow and ice various territories and the degree of accuracy in each area.
The International Commission of S n o w and Ice (ICSI) of the International Association of Scientific Hydrology (IASH) was asked to prepare guidance material for the compilation of a world inventory of perennial ice and snow masses as a contribution to the estimation of the world water balance. This technical paper was prepared by a Working Group of ICSI under the chairmanship of Professor F. Müller.
The guide takes into account the recent manual Guide to Making a Catalogue of Glaciers of the U.S.S.R. published in 1966 in the U . S . S . R .
Unesco gratefully acknowledges the efforts of the working group and the aid of the officers of ICSI in the preparation of this manual.
9

1 Ice and snow on the surface (glacier inventory)
Almost 99 per cent of all ice on the earth is contained in glaciers, and most of it is stored in the two continental ice sheets of Antarctica and Greenland (97 per cent of the total glacier area of the earth). S o m e of the remaining 3 per cent of the glacierized area is, however, of direct importance to mankind, providing water for irrigation, industry, hydro-power, recreation and domestic supplies.
A pilot study for a glacier inventory was carried out by C . S. L . O m m a n n e y , in close co-operation with the ICSI Working Group, on the ice masses of Axel Heiberg Island (Canadian High Arctic). It will appear as a separate publication ( O m m a n n e y , 1969).
Different levels of sophistication in the glacier inventory
Owing to differences in availability and quality of maps , photographs and personnel, and in the nature of the glacierized areas, it will be easier for some countries to produce a glacier inventory than for others. O n the following pages standard requirements are presented for data collection and accuracy; it is hoped that they can be fulfilled by everyone. For certain areas, however, it might prove impossible—for a variety of reasons—to meet these requirements. In such cases it is suggested that statistically valid sampling techniques be used for selected areas, and that models be developed, such as are frequently applied in the earth sciences (Krumbein and Graybill, 1965), to calculate the best possible over-all values for large areas. O n the other hand, all countries capable of providing information additional to the standard requirements should do so.
The Standard Data Sheet
The objective of the Standard Data Sheet (Fig. 1) is to permit useful and rapid processing of the data for hydrological needs as well as for further use by the various environmental sciences. It is suggested that the information on each glacier or ice mass should be entered on a separate data sheet, from which punch cards of standard format are easily prepared.
Source material
The primary sources of information are m a p s , photographs and published accounts.
Maps In general, standard topographical m a p s will have to be the basis from which most data are extracted. The m i n i m u m suitable scale is probably 1 :250,000, but wherever available larger scales should be used. Unfortunately m a n y topographical m a p s pay scant heed to the exact shape and precise extent of glaciers and perennial snowfields; consequently it is frequently necessary to check the glaciological information depicted on the m a p . Anomalies must be corrected with the aid of photographs, etc., and a note to this effect must be m a d e on the Standard Data Sheet together with the other required m a p information,
In addition to the largest scale m a p s available, a regional m a p on a smaller scale—perhaps at 1 : 500,000 or less, depending on the size and nature of the glacierized area—will be required in order to work out the identification and coding system.
Photographs Aerial and terrestrial photographs must be used to substantiate and where necessary to improve, the
11

Perennial ice and snow masses
State, Province or Region:
Mountain area:
Hydrological basin:-1st order:
U n d order:
Illrd order:
IVth order:
Glacier name:
Sources:-Hap, title & No:
Compiled by:
Date:
Scale:
Contour Interval:
Reliability:
Photographs:-
Type:
Serial No:
Date:
Remarks :
Literature:
Data compiled by:
Date & organisation:
Supervisor:
REMARKS (special geomorph-ological features, abnormal characteristics, If International boundary, source Information on mean depth estimate, observations regarding snow line or equilibrium line from other years)
Regional and basin identification
Glacier number
Longitude
Latitude
U.T.M. . L _
Orientation: Accumulation area (8 pt. compass)
Ablation area (8 pt. compass)
Highest glacier elevation (m/a.s.l.)
Lowest glacier elevation: Exposed (m/a.s.l.)
Total (m/a.s.l.)
Elevation of snow line (m/a.s.l.) oay
Date of snow line •—•-
Mean accumulation area elevation,weighted,(m/a.s.l.)
•Accuracy rating (1-5)
Mean ablation area elevation, weighted,(m/a.s.l.)
•Accuracy rating (1-5)
Maximum length:Ablatlon area (km)lncl.debris covered
Exposed (km)
Total (km)
Mean width of main ice body (km)
Surface area: Exposed (knr) .
Total (km2)
•Accuracy rating (1-5)
Area of ablation (km )
•Accuracy rating (1-5)
Accumulation area ratio (per cent)
Mean depth (m)
Volume (km ) of Ice
•Estimated accuracy rating (1-5)
Classification and description (see Table 1)
•Accuracy racings
1 2 3 A 5
Excellent Good Fair Acceptable Unreliable
Area 0 5-
10-15-
>
•57. •107. •157. •25% 25%
Elevations 0-
25-50-
100-
>
•25 m •50 m -100 m •200 m 200 m
Volume 0 - 107. 10 - 257. 25 - 50% 50 - 1007. > 100%
FiG. 1. Glacier inventory data sheet
12

Ice and snow on the surface (glacier inventory)
glaciological information on the m a p . In particular, photographs are needed to assess the snow line, which is rarely shown on ordinary m a p s . Again it is essential to record the full information regarding the photos (date, etc.) on the Standard Data Sheet.
Literature M u c h useful information, e.g. regarding the snow line position or tongue activity can be found in various publications. It should be incorporated in the inventory and reference given under 'Literature'.
Identification system
Each glacier must have an 'address', which gives in the first place the n a m e of a sizable political unit—a state of the United States of America such as Alaska, or a small country such as Nepal— or a geographical unit; for this the first two digits should follow an international code obtainable from the world data centres. The study area must then be divided and subdivided into drainage basins of 1st (A-Z) , U n d (0-9), Illrd (0-9) and, if necessary, IVth (a-z), etc., order. T h e lettering and numbering should start from the mouth of the major stream and proceed clockwise round the basin. A key m a p (or a sequence of them) must be drawn up showing the assigned letters and numbers. Finally, each glacier in the Illrd (or IVth) order basin is given a number, again starting with '1' at the outlet of the drainage basin, proceeding clockwise to '999'. Index m a p s with the glacier numbers are required. In addition the identification of individual glaciers should be given in geographical co-ordinates, às well as—wherever available—in U T M (Universal Transverse Mercator) co-ordinates. The point on the glacier chosen for the co-ordinates should be in the upper part of the ablation area, in the main stream, and high enough not to be lost if the glacier retreats.
Delineation
Catchment Measurement of glacier dimensions should be m a d e within the carefully delineated drainage area of the individual ice stream.
Tributaries W h e r e tributaries join into and cannot be differentiated from the main stream, they should be included with it. However, where former tributaries can be clearly distinguished from the main glacier, they should be measured separately. Their régime is frequently quite different.
Snow and ice boundaries Delineation of visible ice, firn and snow versus rock and debris surfaces as well as delineation of active glacier versus inactive ice (dead ice), as diagrammatically shown in Figure 2, can affect various inventory measurements, particularly for subtropical glaciers. Inactive ice must be included in the inventory for hydrologie purposes. M a n y marginal and terminal moraines of arctic glaciers should be included because the ice content usually amounts to 80 per cent and more. T h e distinction between 'exposed' and 'total' glacier area, as m a d e in the Russian inventory of Franz Josef L a n d (Vinogradov and Psareva, 1965), is supported. R o c k glaciers must be included if evidence of large ice content has been or can be established. Glacierets and snow patches of large enough size, as well as aufeis (nayled)—if perennial—should also be included in the inventory, but must be clearly marked as such (see 'Glacier classification and description', page 16).
International boundaries M a n y glaciers cross international boundaries—this should be noted.
Exposure
There is frequently a marked difference in exposure between the accumulation and ablation areas, which m a y be of great significance for the régime of the glacier. It is therefore necessary to establish the main direction of exposure for both parts.
Area and linear measurements
Ice aprons in accumulation area T h e 'inactive' ice aprons, frequent above the bergschrund, are part of the glacierized area. There is a serious danger, however, that seasonal snow-fields m a y be included that do not belong to the
13

Perennial ice and snow masses
LEGEND
Delineation of glaclerized area
Ditto, questionable
Ice divide
Non>permanent snow cover
Active (lacier versus inactive ice
Transient snow line
Lower boundary of firn from previous years
V . v 1 \'. t's Debris cover
A Peak
mil, -Llill Lateral and terminal moraine
' I Trim line
7 0 O — Contour line
« S E E ? Rock
F I G . 2. Diagrammatic delineation of glacierized area
14

Ice and snow on the surface (glacier inventory)
accumulation area. Analysis of photos from different years might help to prevent this error.
'Exposed' versus 'total' ablation area There is frequently a considerable difference between the 'exposed' and the 'total' ablation area, when the lower reaches are covered by a debris layer of varying thickness. It is suggested that for the purpose of this inventory a distinction be m a d e between the two values because of their importance for hydrology and for the albedo of the glacier. The total area and length measurements include the debris-covered parts of a glacier and the ice-cored moraines, if they are close to the terminus.
Mean width W h e n a glacier has a uniform width, as with a valley glacier, its m e a n width in the ablation area should be measured.
Measuring techniques Up-to-date measuring techniques and equipment (for example electronic dot planimeter, etc.) should be used when available. The instrument error must be established.
Transient snow line, firn line and equilibrium line, and A A R value
The transient snow line, usually simply called the snow line, is defined as the continuously shifting line separating areas with a closed snow cover from areas free of snow.
The firn line on a glacier is defined as the lower boundary of those recent snow deposits which are carried over as firn into the next balance year.
The equilibrium line separates areas of equal accumulation and ablation for a given balance year, as observed at the end of the ablation season. O n some glaciers, particularly in polar regions, the firn line m a y be separated from the equilibrium line by an area of superimposed ice.
The firn line and the equilibrium line will only be available for a relatively small number of glaciers, i.e. for those on which detailed field-work was carried out. For the practical purpose of the glacier inventory it will be necessary to quote the (transient) snow line, as recognized on aerial or terrestrial photographs taken near the end of the ablation season. This is not a reliable dividing line
between the areas of accumulation and ablation. Nevertheless, if the photographs are taken close to the end of the ablation season it is possible to calculate an approximate accumulation area ratio value ( A A R ) :
AAR (%) = & « ! ! » ) x 100 = (l_ ïea) x 100 \total area/ \ total area/
The elevation of the snow line should always be quoted together with the appropriate date. A n y information on elevations of snow lines (or firn line, or equilibrium line) and on A A R values for earlier years should be given.
W h e r e no snow-line assessment is possible an approximate elevation of the m e a n equilibrium line over several years can be established in lieu—at least for glaciers in near balance—by using either one or a combination of the following: 1. Change in the shape of the contour lines from
convex (in the albation area) to concave (in the accumulation area).
2. Beginning of moraines. 3. Höfer's or similar method (von Wissmann, 1959).
The Höfer method, for example, calculates the approximate elevation of the 'mean equilibrium line over several years' from the arithmetic m e a n of the elevation of the glacier terminus and the average elevation of the ridge which surrounds the accumulation basin. This method can only be applied to small simple basin glaciers.
4. 'Summit' method (Ostem, 1966).
Mean elevations of accumulation and ablation areas
Because of their importance as climatic indicators, the m e a n elevations of the areas of accumulation and ablation should be assessed. This is achieved by choosing that contour line which halves the areas of accumulation and ablation respectively.
Volume
The m e a n depth of the glacier from which the volume of ice (not w.e.) is calculated, is extremely difficult to assess. It is, however, of such significance to the world water balance that every' effort should be m a d e by qualified people to obtain 'intelligent estimates'. Based on the experience gained from glaciers on which detailed depth measurements were carried out, estimates of the m e a n ice depth can be m a d e using a combination of
15

Perennial ice and snow masses
surface area and glacier type as shown in the examples given in Chapter 3 of this guide and estimates of depth values must be reassessed for each climatic area (Meier, 1961). T o date there are far too few glaciers with k n o w n depths. Wherever possible, further depth probes on glaciers of the various types should be carried out with modern geophysical techniques such as radio echo and seismic sounding, etc.
Error estimates
All quantitative data are to be accompanied by an estimate of the error involved. A 5-point accuracy rating is proposed at the bottom of Figure 1.
Glacier classification and description
A morphological matrix-type classification and description is proposed (Table 1). Each glacier m a y be coded as a 6-digit number, the 6 digits being the vertical columns of the table; the individual numbers for each digit (horizontal row numbers) must be read on the left-hand side.
In addition to the guidance given on the next pages for the use of Table 1, consultation of the Illustrated Glossary of Ice and Snow (Armstrong, Roberts and Swithinbank, 1966) could prove helpful.
Table 1. Glacier classification and description
0 1
2
3 4 5
6 7 8
9
Digit 1 Primary classification
Uncertain or misc. Continental ice
sheet Ice-field
Icecap Outlet glacier Valley glacier
Mountain glacier Glacieret Ice shelf
R o c k glacier
Digit 2 Form
Uncertain or misc.
Digit 3 Frontal characteristic
N o r m a l or misc. C o m p o u n d basins Piedmont
C o m p o u n d basin
Simple basin Cirque Niche
Crater Ice aprons Groups of small
units Remnant
Expanded foot
Lobed Calving Coalescing, non-
contributing
Digit 4 Longitudinal profile
Uncertain or mise, Even; regular
Hanging
Cascading Ice-fall Interrupted
Digit 5 Digit 6 Major source of Activity of nourishment tongue
. Uncertain or misc. Uncertain S n o w and/or drift Marked retreat
snow Avalanche ice and/ Slight retreat
or avalanche snow
Superimposed ice Stationary Slight advance Marked advance
Possible surge K n o w n surge Oscillating.
Digit 1 Primary classification
Miscellaneous A n y not listed.
Continental ice sheet
Ice-field
Ice cap
Outlet glacier
Inundates areas of continental size.
Ice masses of sheet or blanket type of a thickness not sufficient to obscure the subsurface topography.
D o m e - s h a p e d ice mass with radial flow.
Drains an ice sheet or ice cap, usually of valley glacier form; the catchment area m a y not be clearly delineated (Fig. 3a).
Valley glacier Flows d o w n a valley; the catchment area is well defined.
Mountain glacier Cirque, niche or crater type; includes ice aprons and groups of small units.
16
[ce and snow on the surface (glacier inventory)
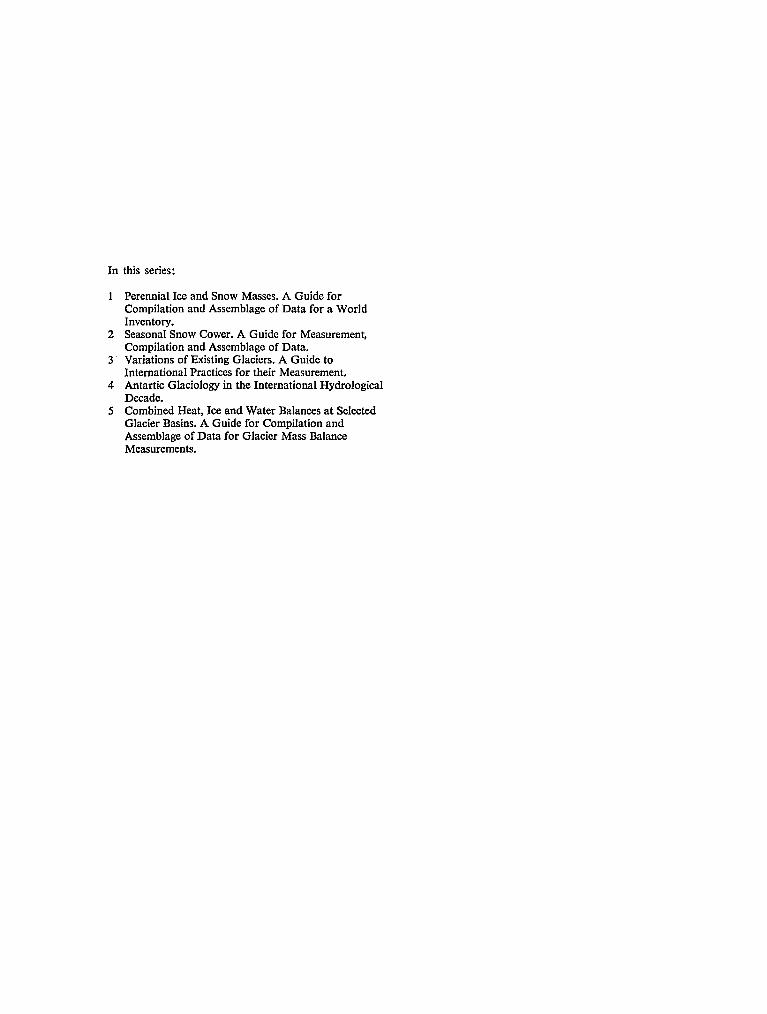
datieret and A glacieret is a small ice mass of indefinite shape in hollows, river beds and on protected slopes snowfield developed from snow drifting, avalanching and/or especially heavy accumulation in certain years;
usually no marked flow pattern is visible and therefore no clear distinction from snow-field is possible. Exists for at least two consecutive summers.
Ice shelf A floating ice sheet of considerable thickness attached to a coast, nourished by glacier(s); snow accumulation on its surface or bottom freezing (Fig. 3b).
Rock glacier A glacier-shaped mass of angular rock in a cirque or valley either with interstitial ice, firn and snow or covering the remnants of a glacier, moving slowly downslope.
J&L&' ''àt*
^C ÍÉ^C' 3a ""¿/fyfy'/
T w o or more individual valley glaciers issuing from tributary valleys and coalescing (Fig. Ad).
T w o or more individual accumulation basins feeding one glacier system (Fig. Ab).
Single accumulation area (Fig. Ac).
Occupies a separate, rounded, steep walled recess which it has formed on a mountain-side (Fig. Ad).
Small glacier formed in initially V-shaped gulley or depression on mountain slope; generally m o r e c o m m o n than the genetically further developed cirque glacier (Fig. Ae).
Occurring in extinct or dormant volcanic craters which rise above the regional snow line.
A n irregular, usually thin, ice mass plastered along a mountain slope or ridge.
A number of similar small ice masses occurring in close proximity and too small to be assessed individually.
1
2
3
4
5
6
7
8
Digit 2 Form
Compound basins
Compound basin
Simple basin
Cirque
Niche
Crater
Ice apron
Group
Remnant A n inactive, usually small ice mass left by a receding glacier.
17

Perennial ice and snow masses
Digit 3 Frontal characteristics
1 Piedmont (glacier) Ice-field formed on a lowland by the lateral expansion of one or the coalescence of several glaciers (Fig. 5a, 5b).
2 Expanded foot Lobe or fan of ice formed where the lower portion of the glacier leaves the confining wall of a valley and extends on to a less restricted and more level surface (Fig. 5c).
3 Lobed Part of an ice sheet or ice cap, disqualified as outlet or valley glacier (Fig. 5d).
4 Calving Terminus of glacier sufficiently extending into sea or occasionally lake water to produce icebergs; includes—for this inventory—dry land calving, which would be recognizable from the'lowest glacier elevation'.
5 Coalescing, non (sec Fig. 5e). contributing
~M Digit 4 Longitudinal profile
1 Even Includes the regular or slightly irregular and stepped longitudinal profile.
2 Hanging (glacier) Perched on a steep mountain-side or issuing from a hanging valley.
3 Cascading Descending in a series of marked steps with some crevasses and séracs.
4 Ice-fall Break above a cliff, with reconstitution to a cohering ice mass below.
Digit 5 Nourishment
Self-explanatory.
Digit 6 Tongue activity
A simple-point qualitative statement regarding advance or retreat of the glacier tongue in recent years, if m a d e for all the glaciers on earth, would provide most useful information. The assessment for an individual glacier (strongly or slightly advancing or retreating, etc.) should be made in terms of the world picture and not just that of the local area; however, it seems very difficult to establish an objective, i.e. quantitative basis for the assessment of the tongue activity. A change of frontal position of up to 20 m per year might be classed as a 'slight' advance or retreat. If the frontal change takes place at a greater rate it would be called 'marked'. Very strong advances or surges might shift the glacier front by more than 500 m per year. It is important to specify whether the information on the tongue activity is documented or estimated.
18
Ice and snow on the surface (glacier inventory)
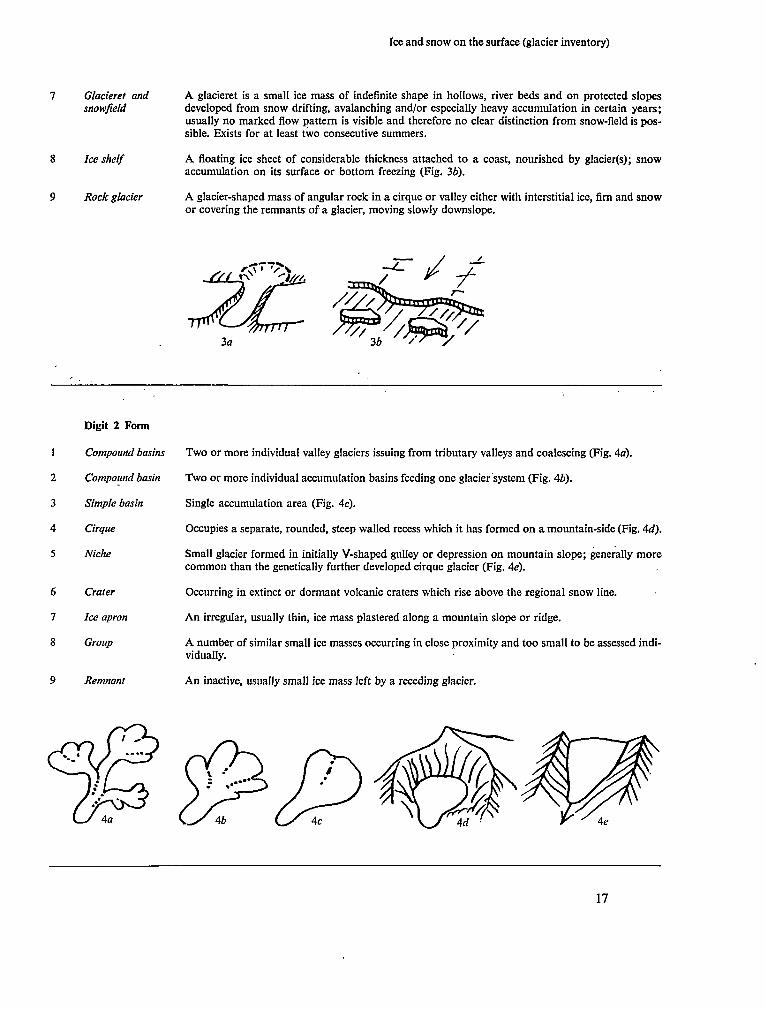
Data presentation and submission
Inventory data should be stored on computer cards or tapes and summarized on print-out sheets for submission to data centres. Each country's data collection should be accompanied by a general physiographic and climatic description of the glacierized region(s), together with index and general reference m a p s , selected photographs, and reference lists of pertinent literature, e.g. on earlier observations and related current work. Each national submission should also include summaries of the information collected on the left side of
the Standard Data Sheet (Fig. 1), that is : the scale, accuracy and data of the m a p s used; the height, focal length, picture scale and data of the aerial and/or terrestrial photographs; the equipment used (planimeter type, etc.) with accuracy information. T h e inventory data sheets for the individual glaciers should remain in the custody of national archives to be available on request, together with the corresponding computer cards or tapes.
The three pilot studies reported in Chapter 3 below m a y , in part, serve as examples of data submissions.
19

2 Ice beneath the surface
Ice occurring beneath the land surface is called underground ice. The total of underground ice is estimated by Shumskiy and Vtyurin (Shumskiy and Vityurin, 1963, p. 108) as 0.2 to 0.5 million k m 3 , or less than 1 per cent of the ice volume of the earth; nevertheless, in some northern regions of Asia and America ice constitutes as m u c h as 50 to 80 per cent of the uppermost 20 to 30 metres of the lithosphère. It is realized that to draw up an inventory of underground ice will be exceedingly difficult and that it will necessarily be of very limited accuracy. However, because of the rapidly increasing importance of this ice to h u m a n activity a serious effort should be m a d e to obtain improved information on the underground ice in polar and subpolar regions and in high mountain areas. Only in recent years has serious attention been given to the occurrence of perennially frozen ground in the high mountains. Brown's permafrost m a p of Canada (Brown, 1967) attempts to delineate the areas of permafrost in the Western Cordillera.
M u c h of the information on underground ice, particularly the more massive forms, will only be available from indirect evidence, i.e. its surface manifestations. Pingos, ice-wedge polygons, paisa, thermokarst m o u n d s and pits lend themselves to aerial photograph recognition and on low-level aerial photographs even smaller permafrost features m a y be distinguished. However, the lack of permafrost surface features does not indicate the absence of ground ice. In the northern portion of the discontinuous permafrost zone there is undoubtedly a considerable volume of ground ice which has no surface expression.
Classification
For the purpose of a ground-ice inventory a descriptive as well as a simple genetic classification
is needed. A detailed description of the physiographic, lithologie and geologic units is required to permit an assessment of the genetic situation, which provides the key to volume estimates.
After a survey of the pertinent literature (Linell and Kaplar, 1963; M a c k a y , 1966; Péwé, 1966; Pihlainen and Johnston, 1963; Shumskiy and Vtyurin, 1963) the following simple descriptive classification is suggested for use by non-specialists:
Non-visible ground ice: pore ice. Visible ground ice: =sj 2.5 c m : segregated ice.
> 2.5 c m : a y e r s S stratifiedorrandom. lenses )
Massive ground ice: Js 10 c m : horizontal (as in pingos and massive ice beds).
vertical (as in ice wedges). buried ice. cave ice.
Procedure
It is suggested that the inventory of ground ice be carried out in four stages: 1. Search of the literature. Previous studies should
be utilized. The search for published and unpublished information is particularly important for all those ground-ice masses that have little or no surface expression.
2. Mapping on a scale of 1: 250,000 or better for the representative areas and on the scale of 1 : 1,000,000 for other permafrost areas : (a) all the information contained in the literature (including boundaries of continuous and discontinuous permafrost); (b) all the ground-ice indicators which can be recognized on aerial photographs—pingos, ice wedges, paisa, ice associated with thermokarst features.
3. Recording of the individual features compiled on the m a p s by numbering them for each drainage basin and—where practical—filling in on a form
21

Perennial ice and snow masses
the quantitative information, including error estimates. A small pilot study for stages 2 and 3 was carried out for an area in the Canadian Arctic by G . Falconer, Department of Energy, Mines and Resources. It is estimated that for Canada the compilation of information on to about 440 maps at the scale of 1 : 250,000 (stage 2) would take about 700 work days; an additional 200 work days would be required for numbering, measuring, recording and summarizing of the mapped information (stage 3).
4 . Estimate of ice volume, based on the quantitative information and the geological and physiographic situation, and carried out by an expert. The relative accuracy (probable error) of the volume data must be indicated.
Brown (1967) has m a d e a first approximation for the volume of ground ice contained beneath the Coastal Plain of northern Alaska. T h e estimates are based on surface and subsurface data obtained in the Barrow area and a number of assumptions concerning: size and shape of ice wedges and pingo ice; occurrence of wedges with depth and below lakes; the area and depth of lakes; and the saturated water content of both near-surface and deeper sediments and rocks. T h e total perennial ice volume in the upper 7.5 metres of permafrost is estimated at 175 k m 3 (total area of 50,000 k m 2 ) . If pore ice is eliminated from this calculation, the volume is reduced to 49 k m 3 . A rough estimate for the total quantity of underground ice in the permafrost of the Coastal Plain sediments and underlying strata is 1,500 k m 3 .
This and similar investigations clearly demonstrate the great contribution to the underground ice volume m a d e by the pore ice. The assessment of pore-ice quantities, however, is dependent on geologic, geomorphic and climatic data.
Delineation of permafrost
The boundaries between continuous and discontinuous permafrost and permafrost-free areas are determined from mapped ground-temperature data, well-log data, the distribution of thermokarst features in cleared fields and changes in plant cover. In the southern fringe of the discontinuous zone the occurrences of permafrost are mostly confined
to peat bogs and m u c h of the ground ice is found in paisa.
Mapping the surface indicators—ice wedge polygons, thermokarst mounds or pits, paisa and pingos—will establish the m i n i m u m extent of massive ground ice.
Some suggestions for an inventory of perennial ice beneath the land surface
Quaternary deposits
Mapping of those Quaternary deposits in permafrost areas which have a potentiality for considerable quantities of pore and segregation ice. 1. Geographic identification: latitude, longitude
and/or U T M co-ordinates for centre of feature; n a m e of geographical region; regional index m a p number; hydrological basin; height above sea level.
2. Area and linear measurements, with probable error.
3. Geologic and lithological description. 4 . Physical setting : main slope angle; orientation
of main slope; surrounding topography. 5. Climatic setting : any climatic data, particularly
radiation and temperature. 6. Depth estimate: of deposit; of permafrost. 7. Ice volume estimate (km 3 ) : technique used and
probable error. 8. Source material: aerial and ground photographs
(flight line number, date, scale of photographs, quality, etc.) ; m a p (official reference, year, scale, reliability, etc.).
Polygon fields (ice wedges) 1. Geographic identification: as above. 2. Area and linear measurements with probable
error. 3. Physical setting: orientation in 8-point compass;
regional slope angle; lithology and physiography.
4 . Ice volume estimate (km3) : technique used (measured or estimated) and probable error.
5. Source material: same as above.
Pingos, thermokarst mounds and pits, and paisa 1. Geographic identification: as above. 2. Measurements of height and diameter (or length
and width).
22

Ice beneath the surface
3. Classification : open system pingo, code 1 ; closed system pingo, code 2 ; other pingos, code 3; thermokarst mound , code 4 ; thermokarst pit with lake, code 5; thermokarst pit, dry, code 6.
4. State of degradation: undisturbed, code 1; cracked, code 2 ; ponded, code 3; remnant, code 4.
5. Physical setting: orientation; slope angle; height above valley bottom; height below surrounding mountains; lithology and physiography; for pingos indicate if surrounded by lake or not.
6. Source material : as above.
References
ARMSTRONG, T., ROBERTS, B., SWITHINBANK, C. 1966. Illustrated glossary of snow and ice. Cambridge, The Scott Polar Research Institute, with support of Unesco, 60 p.
B R O W N , J. 1967. An estimation of the volume of ground ice, coastal plain, Northern Alaska, U.S.A., 19 p. ( C R R E L technical note.)
B R O W N , R . J. E . 1967. Permafrost in Canada, 1 : 7603 200. Division of Building Research, National Research Council of Canada. (Publication no. 9769 and Canadian Geological Survey M a p no. 1246A.)
K R U M B E I N , W . C , G R A Y B I L L , F . A . 1965. Introduction to statistical models in geology. N e w York, McGraw-Hill, 475 p.
L I N E L L , K . A . , K A P L A R , C . W . 1963. Description and classification of frozen soils. Proceedings of the International Permafrost Conference, p. 481-7. Washington, D . C . , National Academy of Sciences, National Research Council. (Publication no. 1287.)
M A C K A Y , R . 1966. Segregated epigenetic ice and slumps in permafrost, Mackenzie Delta Area, N . W . T . Geogr. B. vol. 8, no. 1, p. 59-80.
M E I E R , M . F. 1961. Distribution and variations of glaciers in the United States exclusive of Alaska. General Assembly of Helsinki, IUGG, p. 420-9. (IASH publication no. 54.)
O M M A N N E Y , C . S. L . 1969. A study in glacier inventory on the ice masses of Axel Heiberg Island, Canadian Arctic
Permafrost ice in high mountains Climatic data (annual mean and seasonal fluctuation of temperature, etc.) and geological information (surface geology maps and their tectonic interpretation) m a y permit mapping of approximate permafrost boundaries in high mountains.
A s the surface layers of the upper reaches of high mountains are mainly bed-rock, the underground ice in these areas consists predominantly of some pore ice (in the rock itself) and 'fissure' and cave ice.
Archipelago. Montreal, McGill University, 120 p. (Axe Heiberg Island Research Report, Glaciology no. 2.)
O S T R E M , G . 1966. The height of the glaciation limit in southern British Columbia and Alberta. Geogr. Annal., vol. 48, no. 3, p. 126-38.
P É w É , T . L . 1966. Permafrost and its effect on life in the north. Oregon State University Press, 40 p.
P I H L A I N E N , J. A . , J O H N S T O N , G . H . 1963. Guide to a field description of permafrost for engineering purposes. Associate Committee on Soil and Snow Mechanics, National Research Council, Canada, 23 p. (Technical memorand u m 79.)
S H U M S K I Y , P. A . , V T Y U R I N , B . I. 1963. Underground ice.
Proceedings of the International Permafrost Conference, p. 108-13. Washington, D . C . , National Academy of Sciences, National Research Council. (Publication no. 1287.)
V I N O G R A D O V , O . N . , P S A R E V A , T . V . 1965. Katalog lednikov, SSSR. T o m e 3, part I: Franz-Josef Land, 144 p.
W I S S M A N N , H . von. 1959. Die Heutige Vergletscherung und Schneegrenze in Hochasien. Abhandlungen der Mathematisch-Naturwissenschaftlichen Klasse, Jg. 1959, no. 14, p. 48-55. Mainz, Verlag der Akademie der Wissenschaften und der Literatur.
23

3 Three pilot studies for the I H D world inventory of glaciers
Introduction
T o test the feasibility of the recommended instructions for a glacier inventory, inventories of three areas of markedly different nature have been c o m piled and presented here as first examples of implementations of the guide.
The three test areas are: 1. T h e south-west part of Axel Heiberg Island
(79° N . , 90° W . ) in the Canadian High Arctic. This region has moderate mountain relief (ranging from sea level to an elevation of 1,750 m ) with m a n y different types of cold glaciers: minor ice sheets, outlet glaciers, valley glaciers, piedmont glaciers, etc. S o m e 200 glaciers from this area were included.
2. The region of the Waputik Range in the Canadian Rocky Mountains (52° N . , 116° W . ) . A n u m ber of valley glaciers descend from three small ice-fields at about 2,600 m with numerous cirque glaciers and glacierets on the surrounding ridges; about 100 glaciers were surveyed.
3. T h e M o u n t Everest region in eastern Nepal (28° N . , 87° E . ) where m a n y valley glaciers are avalanche-fed from the precipitous (up to 3,000-m-high) slopes, the ablation areas often being thickly covered with debris. S o m e 160 glaciers were included in this pilot study.
S o m e critical problems are assessed in each area and the experience gained from the actual implementation of the guide is presented. It was found that the identification system, i.e. the numbering and coding of the individual glaciers, needs careful
attention at the outset of the work . A n international agreement on identification and coding is required. Difficulties of delineation in the accumulation as well as in the ablation area are mentioned. These appear to be more pronounced in low-latitude high-mountain areas, such as the Himalayas, than in the Arctic. T h e assessment of an annual or climatic snow line, or even better of the firn and equilibrium lines, and subsequently an A A R value, is discussed. T h e glacier classification suggested in the guide proved to be a useful aid in the problematic ice-volume assessment. T h e difficulties of error estimation for area, elevation and volume data are discussed. M a p s , photos and measuring equipment of differing quality were used in the three test cases. T w o examples of completed standard data sheets and computer print-outs of all the glacier inventory data are appended to each pilot study.
Though some data summaries of general interest are given in table form, no analysis was attempted. In each case it was felt to be premature to draw conclusions from such a limited amount of data. A study of the more interesting elements in the inventory (changes in elevation of snow line, m e a n accumulation and ablation areas, etc.) necessitates (a) statistical validity tests of the data itself and (b) proper consideration of the environmental parameters (climatic, topographic, etc.) in an elaborate multiple-factor analysis.
25

A .
Glacier inventory of Steacie Ice Cap ar Axel Heiberg Island, N . W . T .
Physiography
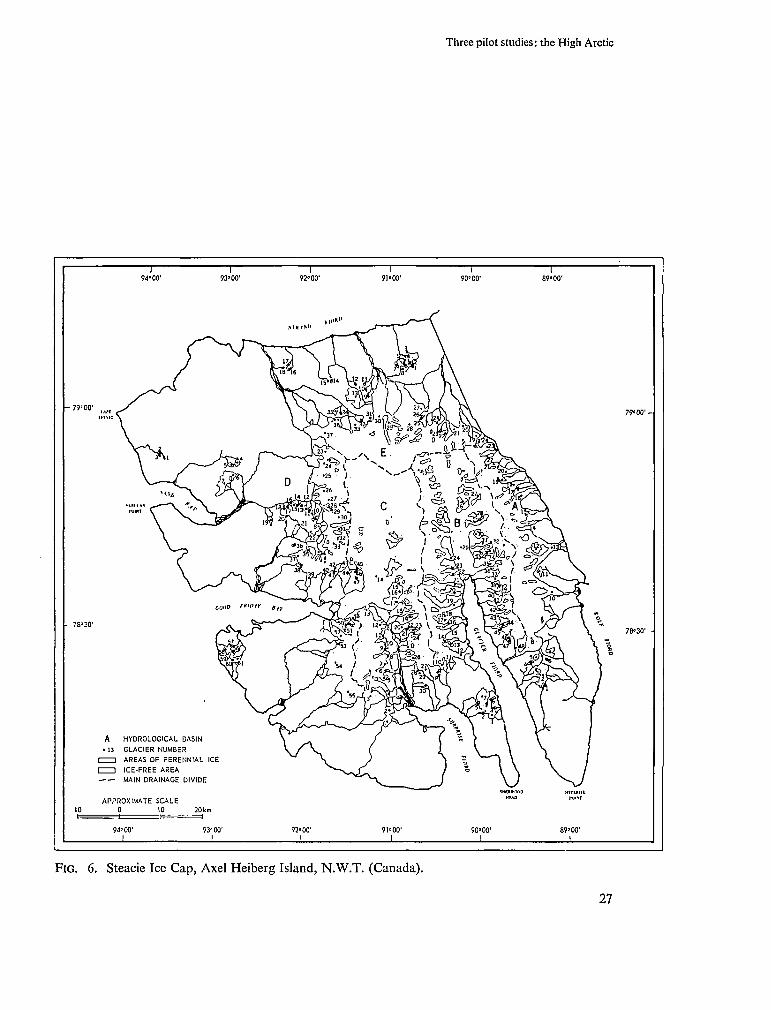
The area selected for this study (Fig. 6) is the triangular-shaped south-western corner of Axel Heiberg Island bordered to the north by Strand Fiord, to the west and south by the sea, and to the east by Wolf Fiord and the mountain trough separating the Steacie Ice Cap from the major ice mass on the island, the McGill Ice Cap. The moderately m o u n tainous relief ranges from sea level to an elevation of 1,750 m . Within this region the ice cover constitutes 37.5 per cent of the total land area of 8,100 k m 2 . In physical appearance the Steacie Ice Cap rather resembles an ice-field. The surface ice movement is strongly controlled by the topography, which divides this ice mass into individual units: minor ice sheets, outlet, valley and piedmont glaciers, etc. Three large mountain troughs run north to south through the region terminating in Surprise, Glacier and Wol f fiords. The ridges on either side form the major drainage divides. The western trough which ends in Surprise Fiord contains the largest glacier (641 k m 2 ) in the region, the second largest glacier (383 k m 2 ) flows in the neighbouring trough to the east. M a n y glaciers flow to the coast, especially in Glacier Fiord, none of which are, at the present time, tidal.
Climate and meteorological data
A recent analysis of the climate of Axel Heiberg Island (Müller and Roskin-Sharlin, 1967) has shown that all the major precipitation comes from the south-west. This is of great significance for the nourishment of glaciers in the area as the low lands
A pilot study for an inventory of the glaciers of the High Arctic
(79° N . , 90° W ) ,
by C . S. L . O m m a n n e y , Glaciology Sub-Division, Inland Waters Branch, Ottawa (Canada)1
to the west, A m u n d and Ellef Rignes islands, seem to have little influence on the air masses coming from the Arctic Basin. The Norwegian Sea is free of ice for a considerable period every summer. T o the east and north-east the ice-free lowlands of Axel Heiberg Island and the land mass of Elles-mere Island have a more continental climate.
At present long-term weather records for this region are only available from the joint Canadian-United States weather stations at Isachsen (Ellef Rignes), Eureka (Ellesmere), and Resolute Bay (Cornwallis). In 1961 an automatic weather station was installed at Sherwood Head but removed after operating intermittently for three years. The data are available from the Canadian Department of Transport, Meteorological Branch, Toronto.
Source material
Recent (1958 and 1959) stereo aerial photograph coverage was available for the whole area. A n R C 5 aerial camera was used with a focal length of 152 m m . The flying height was 9,100 m providing photographs with an approximate scale of 1:60,000. N o n e of the area was obscured by cloud at the time of photography so that the only real problems experienced with the photo-interpretation were due to lack of contrast in the more extensive areas of snow.
Advance prints of a new m a p at a scale of 1 : 125,000 were obtained and used for all the measurements (Table 2).
1. Formerly of McGill University, Montreal (Canada).
26
Three pilot studies: the High Arctic
-79=00'
- 76=30'
10
1 1 94" 00' 93=00'
tjji ^ ^
\^*.< ~J frets'
« r—v "VS jr\ \ ^ * - ^^ 1
cou» futur
A HYDROLOGICAL BASIN
• 13 GLACIER NUMBER
1 1 AREAS OF PERENNIAL ICE
1 1 ICE-FREE AREA
MAIN DRAINAGE DIVIDE
APPROXIMATE SCALE 0 10 201™
94=00' 93=00'
1 1
r
92=00
M m M '
1 1 1 91«00' 90=00' 89=00'
r \ ?•«* *K^I ^J\ \ Ï?»« ^ ^ J T T C ~ - " { n \ "~x wra / IV i / \ \
v « ; L / M A fc\
D fe \& í^là ^di&àfcs^ c ¿ p 3 r l rx
><¡
92=00'
. „...1
í -í A wir > »¿áJ, - v*w^,5C>v \
^ ""* J u ^ ï. 1 \ r ^ 1
*HCT*noo Htrrjiin H U D njiir
91000' 90°00' 89«00' 1 1 1
790 00"-
78»30' •
Õ
FIG. 6. Steacie Ice Cap, Axel Heiberg Island, N . W . T . (Canada).
27
Perennial ice and snow masses
Table 2
Map
59E 59F 59G 59H
Date
1959 1958/9 1959 1959
Scale
1:125 000 1:125 000 1:125 000 1:125 000
Contour interval (ft)
500 500 500 500
Vertical
±200 ± 150 ± 150 ±200
Accuracy (ft)
Horizontal
±200 ±200 ±200 ±200
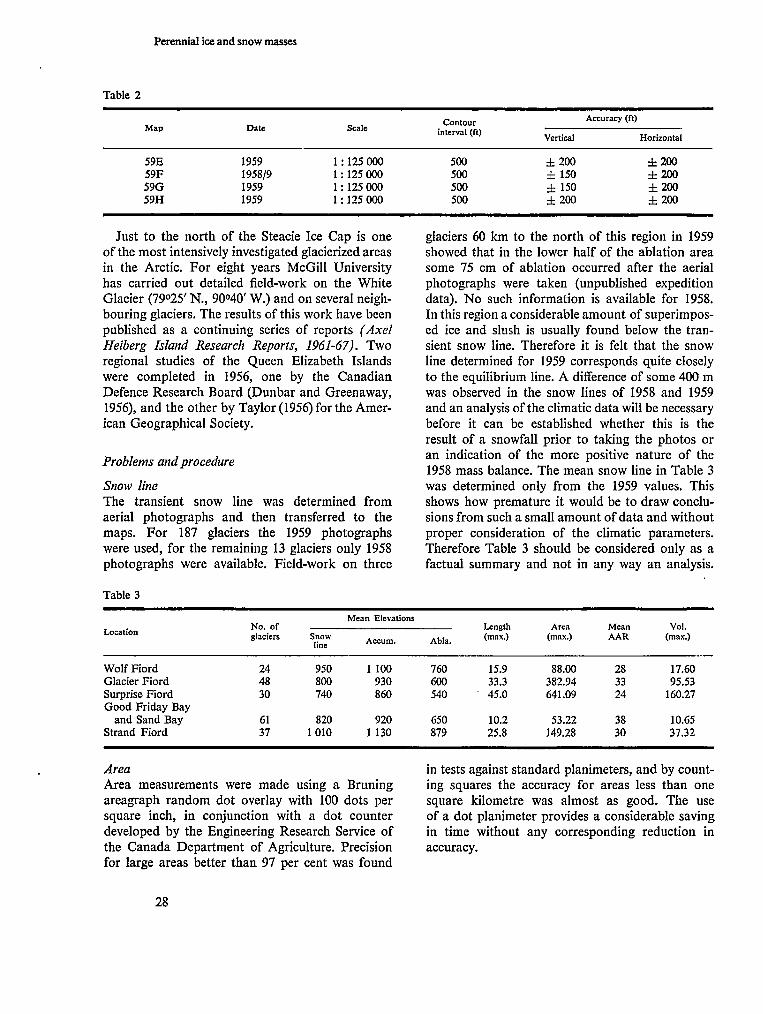
Just to the north of the Steacie Ice C a p is one of the most intensively investigated glacierized areas in the Arctic. For eight years McGill University has carried out detailed field-work on the White Glacier (79°25' N . , 90°40' W . ) and on several neighbouring glaciers. The results of this work have been published as a continuing series of reports (Axel Heiberg Island Research Reports, 1961-67). T w o regional studies of the Queen Elizabeth Islands were completed in 1956, one by the Canadian Defence Research Board (Dunbar and Greenaway, 1956), and the other by Taylor (1956) for the A m e r ican Geographical Society.
Problems and procedure
Snow line The transient snow line was determined from aerial photographs and then transferred to the maps . For 187 glaciers the 1959 photographs were used, for the remaining 13 glaciers only 1958 photographs were available. Field-work on three
glaciers 60 k m to the north of this region in 1959 showed that in the lower half of the ablation area some 75 c m of ablation occurred after the aerial photographs were taken (unpublished expedition data). N o such information is available for 1958. In this region a considerable amount of superimposed ice and slush is usually found below the transient snow line. Therefore it is felt that the snow line determined for 1959 corresponds quite closely to the equilibrium line. A difference of some 400 m was observed in the snow lines of 1958 and 1959 and an analysis of the climatic data will be necessary before it can be established whether this is the result of a snowfall prior to taking the photos or an indication of the more positive nature of the 1958 mass balance. The m e a n snow line in Table 3 was determined only from the 1959 values. This shows h o w premature it would be to draw conclusions from such a small amount of data and without proper consideration of the climatic parameters. Therefore Table 3 should be considered only as a factual summary and not in any way an analysis.
Table 3
Location
Wolf Fiord Glacier Fiord Surprise Fiord G o o d Friday Bay
and Sand Bay Strand Fiord
N o . of glaciers
24 48 30
61 37
Snow line
950 800 740
820 1010
M e a n Elevations
A c c u m .
1 100 930 860
920 1 130
Abla.
760 600 540
650 879
Length (max.)
15.9 33.3 45.0
10.2 25.8
(max.)
88.00 382.94 641.09
53.22 149.28
AAR
28 33 24
38 30
Vol. (max.)
17.60 95.53
160.27
10.65 37.32
Area Area measurements were m a d e using a Bruning areagraph random dot overlay with 100 dots per square inch, in conjunction with a dot counter developed by the Engineering Research Service of the Canada Department of Agriculture. Precision for large areas better than 97 per cent was found
in tests against standard planimeters, and by counting squares the accuracy for areas less than one square kilometre was almost as good. The use of a dot planimeter provides a considerable saving in time without any corresponding reduction in accuracy.
28

Three pilot studies: the High Arctic
Volume Considerable problems were encountered in attempts to estimate depths for the volume estimates. For the previously mentioned region to the north, depth values are available for an outlet and a medium-sized valley glacier from seismic and gravity investigation (Redpath, 1965). In addition all available information on glacier depths from similar regions was used to construct a table of estimated depth values according to glacier type and area (Table 4). These estimates should only be applied to this particular climatic region. They
Table 4
Type
Ice-field
Ice cap
Outlet and valley glaciers
Mountain glacier
Area (km1)
0-5 5-20
20-100 100-300 300-1000
1000 +
0-1 1-5 5-20
20-100 100-300 300 +
0-5 5-20
20-100 100 +
0-1 1-2 2-5 5-20
20 +
Depth (m)
20 30 50
100 150
200-500
15 25 75
150 250
>250
50 125 200
250-500
15 20 35 50
>50
are considered m i n i m u m values and will be adjusted as soon as additional information becomes available.
S o m e 69 valleys, 58 mountains and 32 outlet glaciers were distinguished. The depth estimates in Table 4 were adhered to in all but two cases where small valley glaciers were found with areas just over 5 k m 2 , for which a depth value of 75 m was assigned.
Activity Time has not permitted detailed analysis of the photographs to determine whether the estimated tongue activity for each glacier is correct or not. However, there seems to be a fairly general, though slight retreat of ice in all areas that were studied apart from the G o o d Friday Glacier N o . C 1 4 which m a y be surging at the present time.
Conclusion
Within the area selected for this study it was found possible to apply the guide without any great difficulty. S o m e trouble was experienced with determining ice divides where the contrast on the aerial photographs was poor. Careful study of the photographs was also necessary to determine whether terminal moraines were recessional, and in this region, therefore, probably ice-cored, or push features with a very small ice content.
The accuracy of the data collected in this inventory of the Steacie Ice C a p area is felt to fall well within those recommended limits that are considered acceptable.
Approximately three months' work was involved in the completion of the pilot study but m u c h of this time was spent in producing proposals for the improvement of the guide, which then necessitated revision of already completed data sheets.
References
Axel Heiberg Island Research Reports. Montreal, McGill University, 1961 onwards.
D U N B A R , M . , G R E E N A W A Y , K . R . 1956. Arctic Canada from the air. Ottawa, Canada Defense Research Board, 541 p.
M Ü L L E R , F., R O S K I N - S H A R L I N , N . 1967. A high arctic climate study on Axel Heiberg Island, Canadian Arctic Archipelago —summer 1961. Part I : General meteorology. Montreal, McGill University, 82 p . (Axel Heiberg Island Research Reports, Meteorology, n o . 3.)
R E D P A T H , B . B . 1965. Seismic investigations of glaciers on Axel Heiberg Island, Canadian Arctic Archipelago. M o n t real, McGill University, 26 p . (Axel Heiberg Island Research Reports, Geophysics, no . 1.)
T A Y L O R , A . 1956. Physical geography of the Queen Elizabeth Islands, Canada. Vol. II : Glaciology. Vol. X : Axel Heiberg Island. N e w York, American Geographical Society.
29

SIEAUE ICE CAP AXEL HEIBEF.C ISLAND CANADIAN ARCTIC ARCHIPELAGC C.S.1.OMMANNEY FCGILL UNIVERSITY 1967
F I G . 7. Computer print-out, Axel Heiberg Island, Wolf Fiord, Glacier Fiord and Surprise Fiord.
WCLF F10KO
ICEM
A A A A A A A A A A A A A A A A A A A A A A A A
NU.
1 2 3 4 5 6 7 6 9
IC 11 12 13 14 15 lb 17 IB 19 20 21 22 23 24
LONGITUDE
u u V. u w W U tí W h u U tí tí tí tí H
tí
w Vi
W H W tí
69 69 89 69 69 89 £9 £5 £9 89 69 89 69 89 89 89 89 09 89 69 89 89 89 89
11. C 11.0 16.C 19.0 15.0 6.0 5.0
19.C 11.0 J.C
rj.tf 14.0 3.0
17.0 16.0 21.0 2ÍJ.5 26. C 3 b . S 34 .0 43.0 48.0 4b. C 52.0
LATITUDE
N N N N N N N N H N N N N N N N N N H N N H N H
76 78 78 78 78 78 7£ 76 78 78 78 78 76 78 78 78 7e 78 76 76 76 78 78 78
2 2 . 2 2 4 . C 24 .6 2 5 . B 2 6 . 5 2 8 . 2 2 7 . 2 2 S . 3 22 .3 35 .5 3 E . 3 41 .5 41 .5 4 5 . C 4 6 . 5 45 .0 4 S . 4 5Í.5 51 .1 52 .2 53 .C 5 4 . 2 5 C . 7 5 6 . 2
U . T . M .
16XDC509005 16XOC510040 16X0C492053 16XDC483072 16XDC496P84 16XDC522079 I6XDC532099 16XDC434137 18XCC516191 16XUC547250 16XDC513303 16XUC512365 16XCC554364 I6XDC50542B 16X0C502456 16XUC4905C3 16XCC472515 16XDC474533 IbXDC436544 16X0C447565 16XUC4145B3 16XDC390602 16XDC410630 16XCC3U4643
CRIENT AC
S tí tí
NU NVi NVi NV. SE
E E
NE NE
E E
NE NE SE
E SE
E E
NE NE NE
AB
S U
w NU NU NU NU
S E E
NE NE
E E E
NE SE
E SE
E E E
NE NE
HIGH
640 834 68b bB6 769 762 792
1260 1180 1234 1097 1052 1378 1341 1341 140? 1021 1524 1097 1636 1554 1524 1387 1067
ELEVATIONS L . E X
42 7 290 655 457 625 670 610 396 259 137 610 549 137 290 2 74 244 914 259 762 335 442 564 442 732
L .TL
427 290 655 457 625 670 610 396 259 137 blO 549 137
90 274 244 914 259 762 335 442 564 442 732
SNOW
945 945 823 823 623 823 323 823 869 864
1067 945 975
1006 975 884
1067 975 975
1006 1067 1067 1128 1067
DATE
28 28 28 26 28 28 28 26 28 26 28 28 26 28 28 26 23 23 28 2R 28 26 28 26
7 7 7 7 7 7 7 7 7 7 7 7 7 7 7 7 7 7 7 7 7 7 7 7
59 59 59 59 59 59 59 59 59 59 59 59 59 59 59 59 59 59 59 59 59 59 59 59
MEAN ELEVATION ACCU
945 060 991
1062 991
1123 1128 1112 1052
1123 1036 1189 1234 1250 1295
4 4 4 4 4 4 4 4 4
4 4 4 4 4 4
ABLA
549 3 686 3 667 3 625 3 686 3 701 3 836 3 594 3 610 3 62 5 3 823 3 808 3 655 3 823 3 823 3 762 3 960 3 762 3 884 3 823 3 853 3 869 3 808 3 899 3
CLACIEK FIORD
T
H o U B D U U II B u B II B 0 n u B B B II H b B D B B U B U C II D b Ü
b B b B U B 11 B B B B B B U
NO.
1 2 3 4 S b 7 b
<> 1C U 12 13 14 15 16 17 16 19 2C 21 22 23 24 25 26 27 28 2S 30 31 32 33 34 35 36 37 38 39 40 41 42 43 44 45 46 47 46
Lct.cmoe
W U H tí tí tí W tí tí tí tí tí rl tí tí H h tí tí tí tí tí tí tí H vi V. tí tí tí tí tí tí tí VI
H tí tí tí tí tí n W tí tí tí rt tí
69 .65 et 8? 89 89 89 9? 90 90 90 SO 9C 90 90 90 SC 90 9C 5C 9C 9C VC SC 9C 5C tí 84 85 69 es BS 65 65 69 6S ES 89 es 89 89 es as 69 69 69 89 89
4 8 . C Ï3.C 45 .0 £2 .0 Í5.0 4 / . 0 5J.0 22 .5 2o. 0 22 . C 15.0 9 . 0
14.P 19.0 15.0 16.0 19.0 Ib. 5 16.0 14.0 13.5 12.C 12.0 13.0 6 . 0 5 .0
5b .C Í2.C Î3.C íB.n
14 .C 47 .C Í5.0 :?.o 48 .0 44 .5 4 3 . C 41 .0 40 .0 41.0 ' 0 . 0 4 0 . C 40 .0 26 .C 39 .0 24 .5 -J5.Ö 20 .5
LATITUDE
N 7e N 76 N 78 U 78 II 7e N 78 N 78 N 7H N 78 N 78 N 78 N 76 N" 76 N 70 N 78 N 76 N 711 N 70 N 78 N 78 H VI' N 78 N 76 N 78 H 76 Il ïe N 76 N 76 N 78 N 76 H 76 II 7E N 7C N 78 H 76 N 76 N 7« N 7E H 76 N 76 N '78 N 78 N 76 N 76 N 76 H 78 N 78 N 76
1E .5 19 .0 15.2 ís.e 2 C . C 2 C . 5 21 .5 2 4 . 2 2 4 . 5 2 t .S 26 . C 26 .6 26 . 2 26 .8 3 C . 5 3 1 . 2 21.6 22 .5 22 .5 3Í .2 36 .6 36 .2 3 9 . 2 4 C . 0 4 1 . 5 4 6 . C 4 6 . 7 4 6 . 2 4 5 . 6 4 3 . 5 4 2 . 2 4 2 . 2 41 .2 4 C . 8 3 S . 2 36 .8 37 .5 37 .C 36 .5 35 .5 3 3 . 2 34 . C 2 2 . 4 31 .2 3C .6 2 S . 6 2 9 . C 2 6 . 3
L . T . M .
16XCB36B942 16XCD350949 16XBD380956 16X08353964 16XDB340972 16XD6374980 16XC6350994 15XV.T590044 15XM587050 15XVIT592066 15XKT614080 15XhI636096 15XV.T616124 15XV.T601132 15XV.T612162 15XV.T606176 15XV.T596183 15XV.T597197 15XV.I606216 15XV.T610252 15XV.T61227H 15XH616306 15XU613322 15XVT610345 15XV.T62S360 15XV.T63249C 16XCC365501 16XDL376455 16XUC375448 16XDC354410 16XCC3673Ö6 I6XDC391304 16X0C363366 16XCC372354 16XCC3B7328 16X0C398316 16XÜC403292 16XUC4C8282 18XDC412271 lbXDC406254 16XCC410214 lbXCC409228 16X0C4C7197 16X0C414175 16X0C4121bb 16XUC426L48 16XDC425137 16XDC442122
ORIENT AC
S W E E tí E N
NE S
SE S
SE E E E E
NE N E E 6 E E E S
u E
SE SE
VI u
SU tí tí
su tí tí
NU Stí
tí tí V tí tí tí tí tí s
A6
s W E e M E N
NE S £ S E E E
NE Nt NE
K E E E E E E S K E
SE SE NU
W SU
U W h N H
NU SU
U NU
u S
su u
Stí
v s
HIGH
759 732 732 792 777 777 777 651 549 666 732 930 610 792
1173 1171
68b 640
1410 1410 1410 1367 1387 1367 1685
884 1250 1494 1494 1067 1265 1250 1219 1219 1378
975 1341
914 975
1219 1097 1234 1280 1097 1097
762 975-
1143
ELEVATIONS L.EX
305 2 74 122 442 320
91 213 579 468 290 466
15 •427 427 137 137 594 427
30 7b 91
122 137 152
91 579
1052 914 884 610 244
1189 274 305
76 427 168 564 457 196 427 137 137 381 122 564 610 137
L.TL
305 274 122 442 320
91 213 579 466 290 488
15 427 42.7 137 137 594 427
30 76 91
122 137 152
91 579
1052 914 884 610 244
1189 274 305
7b 427 166 564 457 196 427 137 137 361 122 564 610 137
SNOU
800 300
son 800 300 800 800 655 640 655 640 579 640 579 564 579 690 533 579 533 516 533 516 486 640 792
1052 1067 1097 792 914
1189 914 914 945 914 945 945 945 945
1090 914
1006 975 975 975 975 884
DATE
28 28 28 28 28 28 26 13 13 13 13 13 13 13 13 13 13 13 13 13 13 13 13 13 13 13 13 13 13 13 13 28 13 28 26 28 28 28 28 28 2B 26 28 28 28 26 28 28
7 7 7 7 7 7 7 8 8 8 8 8 8 8 6 8 8 B 8 8 8 6 6 6 6 8 B 6 6 6 8 7 8 7 7 7 7 7 7 7 7 7 7 7 7 7 7 7
59 59 59 59 59 59 59 59 59 59 59 59 59 59 59 59 59 59 59 59 59 59 59 59 59 59 59 59 59 59 59 59 59 59 59 59 59 59 59 59 59 59 59 59 59 59 59 59
MEAN ELEVATION ACCU
670 686 747
655 732 732
610 823 762 777 800 800 792 920 820
1158 1250 1250 823
1062 1200 1067 1036 1128 930
1067
955 1036 1093 1040 1126 1037 1006
995
4 4 4
4 4 4
4 4 4 4 4 4 4 4 4 4 4 4 4 4 4 4 4 4 4 4
4 4 4 4 4 4 4
4
ABLA
660 3 550 3 460 3 640 3 600 3 460 3 610 3 60O 3 Ç15 3 518 3 594 3 411 3 490 3
.500 3 320 3 366 3 640 3 457 3 335 3 290 3 335 3 366 3 366 3 366 3 427 3 701 3
975 3 991 3 732 3 701 3
747 3 701 3 457 3 716 3 732 3 747 3 777 3 732 3 732 3 716 3 716 3 762 3 701 3 686 3 838 3 640 3
SlRPMSE FICHU
30
T
C C c c c c c c c c c c c c c c c c c c c c c c c c c c c c
N O .
1 2 3 4 i b 7 B 9
10 11 12 13 14 15 16 17 18 19 2C 21 22 23 24 25 26 27 28 29 30
LONGITUDE
u •s
U U n tí tí tí rt VI H tí tí tí tí tí tí tí tí tí tí tí tí tí tí H
tí H
tí H
SO se 91 se 91 91 91 51 91 91 91 51 51 51 se 90 9C 90 50 9C se se 90 9C 9C 90 9C 9C se 9C
55 .0 58. 0 10.0 59 .C 3.0 1.0 2.0
.5 3.0
.5 3.0 6.C
16.0 10.0 52 . 0 52.5 54.5 46.0 45 . C ÍO.O 46 . C 45 .0 41 .5 42.0 <4.5 41.0 22.0 27.5 27 . C 32 .0
LATIIUDE
N N N N N N N N N N N N N H N N N N N N N N N N N N N N N N
78 76 76 78 76 76 76 76 76 78 76 78 78 76 76 7e 76 78 78 73 7e 78 7e 78 76 76 78 76 78 78
17.B 15.1 2 1 . C 21 .6 2 3 . 8 24 .5 25.3 26 .5 2 7 . 5 2 6 . 2 2 5 . 5 3 1 . C 22 .5 27 .C 36 .8 3 5 . 5 34 .1 2 2 . 5 22 .2 3 C . B 3 C . 5 3 C . 5 3 C . 5 25 .8 27 .8 26 .3 24 .5 24 .8 2 4 . 5 2 3 . 0
U . T . H .
15XV.S454916 15XV.S460944 15XKS411970 15XV.S453952 15XV.T437026 15XV>I445046 15XV.I439060 15XV.T446062 15XV.T436102 15XH445115 15JvT43413b 15XUT424164 15XV.T384191 15XV.T406274 15XI.T471273 15XKT470255 15XV.T464223 15XV.T4S7196 15XWT501190 1SXV.T482162 15XV.T457197 15XUT502158 15XV.I514159 15XV.T512145 15XV.T505110 15XV.T51708D 15XV.I554051 15XV.T532053 15XUT534049 15XV.T553020
ORIENT AC
SE NU SE
E E E E E E E E E
NE S u
NU U U V H
NU N tí h U tí S tí tí N
AB
SE NU SE SE
E NE NE
S E E E E N S
NU NU SU U U tí
NW N
Su SU
H W S H tí N
HIGH
640 640 967 967 762 945 762 998 823
1072 975 792 9b0
1750 945 594
1410 1097 1067 1204
549 610
1097 1097 1204
640 960 549 549 610
ELEVATIONS L .EX
411 259 259 .76 152 122 305 107 163 122 137 244 366
46 533 533 274 290 610 183 503 549 610 457 152 152 259 503 503 442
L .TL
411 259 259
7b 152 122 305 107 163 122 137 244 366
46 533 533 274 290 610 163 503 549 610 457 152 152 259 503 503 442
SNOU
670 670 701 610 853 670 670 686 666 732 716 732 732 762 792 701 792 604
1080 762 701 701 945 869 701 701 701 701 701, 701
DATE
23 23 28 28 23 28 26 26 28 26 28 28 26
7 7 7 7 7 7 7 7 7 7 7 7 7 B B 8 8 8 8 8 8 8 8 8 8 8 8 8 0 8
59 59 59 59 59 59 59 59 59 59 59 59 59 59 59 59 59 59 59 59 59 59 59 59 59 59 59 59 59 59
MEAN ELEVATION ACCU
777 747
762 700 770 770 653 633 732 853 975 834
960 1052
960
1067 975 884
823
4 4
4 4 4 4 4 4 4 4 4 4
4 4
4
4 4 4
4
ABLA
533 3 442 3 533 3 411 3 564 3 457 3 550 3 472 3 472 3 427 3 488 3 518 3 640 3 488 3 670 3 560 3 442 3 640 3 850 3 442 3 520 3 575 3 623 3 610 3 503 3 518 3 545 3 52 5 3 525 3 515 3

SILICIC ICt CAP AXEL HEIBERG ISLAND CANADIAN ARCTIC ARCHIPELAGC C.S.L.OMMÍNNEY MCGILL UNIVERSITY 1967
WL'LF FIGRD
1UENT
A A A A A A A A A A A A A A A A A A A A A A A A
GLAL.IEK
IDENT
tr 15 E U
u 1! Ü
u l>
a a B B U B B B B B ¡j B U
' U B B B B B B B 0 B li
B B D B li B Ë B U B B L li B B
SLRPRISE
IDENT
C C C
c L C C C
c I
c c 0
c c c c c c c c c c c c c c c c c
ha.
1 2 3 4
5 6 7
u 9
10 11 12 13 I<i 15 16 17 IS 19 20 21 22 23 24
TCTÁL LENGTH AULA
2 . 2 6.1
. 2 1.4 1.7
.9 2 .0 9 .2 4 . 0
10.0 1.5 1.2
11.0 6 .2 6 . 2 7 .0
. 9 8 .6 1.2 6 . 4 4 . 2 3 . 2 6 . 2 1.4
F1URD
N O .
1 2 3 A 5 6 7 6 9
10 11 12 13 14 15 16 17 IS 19 20 21 22 23 24 <5 26 27 20 29 30 21 32 33 24 35 36 37 28 39 40 «1 42 43 44 45 46 47 411
EXP
2 . 2 6.1
. 2 1.4 1.7
. 9 2 . C
14 .5 7.1
13 .9 2 . C 2.4
15 .9 7 .9
e.E 1 C . 4
.9 11.4
l.S 1 C . 2
6.1 4 . 2
e.t 1.4
TCTAL
2 . 2 6.1
. 2 1 .4
. 1 .7 • 9.
2 . 0 14 .5
7.1 13.9
2 . C 2 . 4
15 .9 7 . 9 8 .8
1C.5 . 9
11.6 1.8
10.2 6.1 4 . 2 8 . B 1.4
1CTAL LENGTH A3LA
2 . S 2 . 6 2 .7 3 . 6 2 . C J . 5 3 . C
.tl . 2
4 . C .9
B . 5 . 9 .6
4 . 6 4 . 6
. 4
. 6 7 . B 4 . 5 i.C l.L 3 . 2 5 . C
23 .2 . 9
.2
. 7
. 5 3 . 6
•J . 9
1.6 1 1 . 9
1.4 6 . 2
. 3 1.4 5 .6 5 .9 2 . 5 6 .2 2 . 1 !
5 . C . 6
l.C 7 .1
FICKC
N C .
1 2 3 4
5 6 7 il 9
10 11 12 13 14 15 16 17 IS 19 20 21 22 23 24 25 26 27 28 29 •30
EXP
2 . Ö 2 .6 2 . 7 2 . 6 2 . C 2 . 5 3 . 0
. 8
. 2 4 . 4 1.5
12.1 .9
1.4 9 . C £ .4
. 4 1.0
13.6 11.0 1 C . 6
8 .6 9.1
e.2 3 3 . 2
1 .2 . 4
1.2 1.4
. 6 5 . B
. 2 4 . 0 2 .5
1Ï.Û 1.4 7 .2
. 8 1 .6 6 .9 7 . C 2 .9 7 . 4 3 .4 5 .0
. 6 1.0
1 0 . 6
TOTAL
L'.ff
2 . 6 2 . 7 3 . 6 2 . C 3 . 5 3 . C
. 8
. 2 4 . 4 1 .5
1 3 . 2 . 9
1.4 9 . 0 8 .4
. 4 1.0
13 .7 11 .2 ln.ii
8 . 8 9.1 8 .2
3 3 . 3 1.2
. 4 1 .2 1.4
. 8 5 . U
. 2 5 .1 2 . 5
1 5 . 7 1.4 7 . 4
. 8 1 .6 7 . 0 7 .0 2 . 9 7 .4 3 . 4 5.1
. 6 1.0
1C.6
lr .TAL L E N G T H
AULA
2 .4 2 .U 3 .S 8.1 2.6 4 . C 1.5 0 .5 4.t 7.1! 5 .5 4 .3 •j.e
28 .2 1.4
.6 7.1 3 .6 l.C 6 . 8
.2
. 4 1.0 2 .8 5 .C 4 .1 6 .6
.2
.1 . 9
EXP
? . ' , 2 . 8 5 .9
1C .6 2 . 6 4 . 4 1.9
11.6 7 .2
12.1 1 C . 2
5.E 6 .8
4 5 . C 1.9
.6 10.9
4 . 7 l.C
13.9 . 2 . 4
2.1 4 . 5 9 .2 4.1 9 .2
. 2
.1
.9
TOTAL
3 ,4 2 .8 5 .9
10. U 2 .6 4 . 6 1.9
11.7 7 .2
12.1 1C.2 5 .8 6 .8
4 5 . 0 1.9
. 6 1C.9 4 . 8 1.0
13.9 . 2 . 4
2.1 4 . 5 9 .6 4.1 9 .2
. 2
.1
. 9
V.IÜIK
. 3
2 . 4
1.9
l.S . 9
1.0 1.0
. 8
1.1 . 3 . 6
1.1 . 2
1UDTH
. 4
1.0
. 0
.') . 0
1 .4 . 8 . 9 . 6 . 6
1.0 4 . 6
. 2
.1
. 2
. 5
. 5
. 2 1 .6
• 2 . 9
.1 1.1 1.1
. 5
. 5 • 4
. 6
1.1
lilDTH
2 . 0 1.3
. 6
1.0 .6
1.1 . 9
1.0 . 9
à.i .2
1.1 . 8 .1
1.4
. 2
. 6 1 . 4
. 8 1.2
SURFACE EXP
.91 11.39
.10
.50 1.71
.40 1.51
48 .23 8.63
64 .21 2 . 6 2 4 .03
S S . 0 0 10.59 16.54 24 .19
.40 3 4 . 2 7
1.11 23 .28
9 .17 5 .64
19.05 1.41
TOTAL
.91 11.39
.10
.50 1.71
.40 1.51
48 .28 8 .68
64.21 2 .62 4 .03
38 .00 10.59 16.54 24,59
.40 35 .38
1.11 23 .50
9 .17 5 .64
19.05 1.41
SURFACE
txp 3 . 3 3 1.71 1.51 5 . 0 4 1.41 2 . 9 2 5 .94
.30
.15 7 .87 2.01
J O . 4 4 .50 .70
14 .02 9 . 9 8
.20
.25 34 .27 15.42 15 .42 11 .49 10.69 3 2 . 3 6
382 .13 .60 .11 .50 .60 .70
5.35 .20
4 . 3 8 1.31
49 .39 .23
14.51 .19 .54
(1.16 11.89
1.81 7.S6 2 .42 4 .33
.40
.60 17.74
IOTAL
3.33 1.91 1.51 5 .04 1.41 3 .12 5 . 9 4
.30
. 15 ' 7 .87 2.01
31 .45 .50 .70
14.52 10.68
.20
.25 3 5 . O S 15.92 16.12 11.89 10.69 32.36
382.94 .60 .11 .50 .60 .70
5 .35 .20
4 .41 1.31
50 .80 .28
14.91 .19 .54
3 .46 12.19
1.91 7.86 2 .42 4 .53
.40
.60 17.74
SURFACE EXP
10.48 5 .04
IB.44 18.45 2 .87 3.75 1.41
43 .14 1 0 . 23 34.67 27 .72
9.98 17.34
641.09 1.51
.25 26 .51
5 .74 .20
31 .95 .10 .20 .90
-3 .32 2 9 . 2 4
5 .85 2 5 . 3 0
.10
.10
.91
TOTAL
10.43 5.04
18.59 20.77
2 .92 3.33 1.41
45 .06 10.58 34.67 27.72
9 .9S 17.34
641.09 1.51
.25 26.51
6 .04 .20
32 .25 .10 .20 .90
3 .32 29 .64
6 .45 25 .30
.10
.10 -91
AREA
3 3 3 3 3 3 3 3 3 3 3 3 3 3 3 3 3 3 3 3 3 3 3 3
ABLATION
.91 11.39
. 1 0
. 5 0 1.71
. 4 0 1.51
25 .70 1.72
3 4 . 88 2 .32 2 .82
44 .76 7 .26
12.00 11.99
. 4 0 18.75
1.01 10.28 4 .13 1.51 9 . 5 7 1.41
AREA
3 3 3 3 3 3 3 3 3 3 3 3 3 3 3 3 3 3 3 3 3 3 3 3 3 3 3 3 3 3 3 3 "ï i 3 3
) 3 3 3 3 3 3 3 3 3 3 3
3 3 3 3-3 3 3 3 3 3 3 3 3 3 3 3 3 3 3 3 3 3 3 3 •
ABLATION
3 .33 1.91 1.51 5 . 0 4 1.41 3 . 1 2 5 .94
. 3 0
. 1 5 7 .06 1.31
14.62 . 5 0 . 3 0
4 . 9 4 4 .33
. 2 0
. 1 5 13.61
4 .53 5 .03 3 .12 2 .12 7 .06
135.88 . 4 0
. 1 0
. 3 C
. 3 0 3 .33
3 .73 .91
24 .59 . 2 3
9 .77 . 19 .38
6 .04 8.26 1.71 6 .65 1.41 4 .33
. 4 0
. 6 0 12 .80
AREA
3 3 3 3 3 3 3 3 3 3 3 3 3 3 3 3 3 3 3 3
) 3 3 3 3 3 3 3 3 3
3 3 3 3 3 3 3 3 3 3 3 3 3 3 3 3 3 3 3 3 3 3 3 3 3 3 3 3 3 3 3 3 3 3 3 3 3 3 3 3
•3 3 3 3 3 3 3 i
ABLATION
5.44 5 .04
15.67 15.73 2 .92 2 .72 1.11
23.79 7 .46
15.52 14.01
8 .37 10.B9
214 .10 .81 . 2 5
15.32 4 .33
. 2 0 14.01
. 1 0
. 2 0
. 5 0 l.Sl
15.02 6 .45
-17.64 . 1 0 . 1 0 .91
3 3 3 3 3 3 3 3 3 3 3 3 3 3 3 3 3 3 3 3 3 3 3 3 3 3 3 3 3 3
AAR
0 0 0 0 0 0 0
47 80 46 11 30 49 32 27 51
0 47
9 56 55 73 51
0
AAR
0 .0 0 0 0 0 0 0 0
10 3 5 54
0 57 66 59
0 30 61 72 69 74 SO SB 65 33
ion no 50 57 3 8
100 16 51 52
0 34
0 30 29 32 10 15 42
4 0 0
28
AAR
0
n 16 24
0 29 21 47 29 55 49 16 37 67 46
0 42 28
0 57
0 0
44 45 49
0 30
0 0 0
DEPTH
15 75 15 15 25 15 25
200 30
200 25 25
200 125 125 200
15 200
20 200 125 125 125
50
DEPTH
25 50 50 •75 50 50 75 15 15
12? 20
ZOO 20
ir 125 125
15 15
200 125 125 125 125 200 250
15 15 15 15 15 75 20 50 20
200 15
125 15 15
125 125
20 125
50 50 15 IS
125
DEPTH
30 30
125 200
20 50 20
200 30
200 200 125 125 250
50 15
200 125
15 200
15 20 15 50
200 125 200
15 15 15
VOLUME
.01 4
. 8 5 4
.00 4
.01 4
. 04 4
.01 4
. 04 4 9 .66 4
.26 4 12.84 4
.58 4
.10 4 17.60 4
1.33 4 2 .07 4 4 . 9 2 4
.01 4 7 .08 4
.02 4 4 .72 4 1.15 4
.71 4 2 .38 4
.07 4
VOLUME
.08 4
.01 4
.01 4
.37 4
.01 4
.16 4
.45 4
.00 4
. 0 0 4
.98 4
.04 4 6.31 4
.01 4
.01 4 1.82 4 1.33 4
.00 4
. C O 4 7 .02 4 2 .00 4 2 .01 4 1.49 4 1.34 4 6 . 4 7 4
<}'5.53 4 .01 4 .00 4 .01 4 .01 4 .01 4 .4P 4 .00 4 .22 4 .03 4
10.16 4 .00 4
1.87 4 .00 4 .01 4
1.06 4 1.52 4
.04 4
.98 4
.11 4
.23 4
.01 4
.01 4 2 .22 4
VC1LUHF
.31 4
.15 4 2 . 3 2 4 4 .15 4
.06 4
.19 4 .03 4
9.11 4 .32 4
6 .94 4 5 .54 4 1.25 4 2.17 4
169.27 4 .08 4 .00 4
5 .30 4 .75 4 .00 4
6 .45 4 .00 4 .00 4 .01 4 .17 4
5 .94 4 .81 4
5 . 0 6 4 .00 4 .00 4 .01 4
TYPE
650t32 300132 300132 300132 300132 300132 300132 532114 200112 510114 300112 300112 510114 530112 520112 530112 300132 512112 65C112 536112 505112 522112 532112 520112
TYPE
300132 400132 400132 300132 400132 400132 300132 3C0132 650112 53011P 200112 520112 220102 65C110 520114 530112 650112 65P112 510112 520112 520112 535112 535112 51211P 410114 620112 650112 65P112 620112 650112 52P112 003112
520112 620112 512114 650112 513112 65CI02 650112 510112 510110 655112 525112 535112 53511? 650102 300102
,535112
TYPE
200102 200102 403112 522112 200112 530112 655112 422112 205112 402114 402114 402114 4 P 5 U 4 411114 535310 450112 515114 510112 65C112 522112 650102 000101 650112 535112 520112 532112 533110 700102 700102 300132
F I G . 8. Computer print-out, Axel Heiberg Island, Wolf Fiord, Glacier Fiord and Surprise Fiord. (Note. For volume accuracy rating ' 4 ' read '3 ' . )
31

GOOD FRIDAY BAY AMD SAND BAY
FIG. 9. Computer print-out, Axel Heiberg Island, Good Friday Bay and Sand Bay, and Strand Fiord.
II
D C D C D U D C D D C D 0 0 D D D D C C B D D D U D 0 D D 0 D 0 0 C D D D C C D D 0 c C c c D c D C D D
c c D D D D D D D
N O .
1 2 3 4 5 6 7 8 9
10 11 12 13 14 15 16 17 18 19 20 21 22 23 24 25 26 21 28 29 30 31 32 33 34 3S 36 37 38 39 40 41 42 43 44 45 4b 47 4B 45 50 51 52 53 54 55 5b 57 58 55 bO 61
LONGITUDE
W H H W U W W W H H W M U M W W H U W h W k H U W W M U H H h H h W H U H H W k h H W H W k W W U W W U U W U W W W W U U
93 93 93 92 92 92 92 il 91 91 91 91 92 92 92 92 92 92 92 52 92 51 91 91 51 91 51 51 91 91 91 91 91 91 51 92 92 92 91 91 91 51 91 91 91 91 91 91 91 91 91 51 91 91 51 92 92 92 92 92 92
42 .0 46 .0 •17.0 ' 8 . 5 S3 .5 ¡2.0 S7.5 49.0 fl.5 ¡3.0 S6 .c ! 8 . 5
3 . 0 5 .0 Í.C
10.0 12.0 14.5 24 .5 11.0 4 . 5
55.C 47.5 ' 5 . 0 'fl.C 47 .0 45.0 42 .0 41.5 38 .C 38 .0 39 .0 41 .0 : o . o S7 .0
7 .5 5 .0 2 . 0
; Ó . C
44.5 38 .0 37 .C 32.0 25 .5 21.C 22 .5 22 .5 27.5 26 .0 29 .5 31.0 21 .5 31.5 34.0 24 .0 46.0 48 .0 Ï1.0 51.0 <6.C ' 2 . 0
LATITUDE
N 78 N 78 N 78 N 7e N 78 N 78 N 78 N 78 N 78 N 7B N 78 N 78 N 78 N 78 N 78 N 78 N 76 N 7b N 78 N 7e N 78 N 78 N 78 N 7e N 78 N 78 N 78 N 78 N 7e N 78 N 76 N 78 N 76 N 78 N 76 N 78 N 7B N 78 N 78 N 78 N 76 N 78 N 76 N 78 N 76 N 76 N 78 N 78 N 76 N 7e N 76 N 76 n 7e N 76 N 76 N 76 N 76 N 78 N 76 N 7« N 78
53 .3 S 3 . 5 S 3 . S 53 .0 5 2 . 7 5 1 . 2 5 C . 0 4 4 . 7 4 5 . 6 4 6 . 5 4 7 . 0 4 7 . C 4 7 . 5 4 7 . 5 4 7 . 5 4 7 . 5 4 7 . 0 4 6 . 8 45 .3 4 5 . B 4 4 . 4 4 3 . 7 5 5 . C S 3 . 2 5 1 . 2 4 5 . 5 4 e . 2 4 7 . 3 4 6 . 8 4 5 . 5 44 .2 4 3 . S 4 2 . 8 4 1 . 4 4 1 . 2 4 1 . 6 4 C . 6 3 5 . 2 37 .7 36 .0 36 .3 3 5 . C 36 .e 3 6 . 7 36 .6 3e .2 31 .3 3 1 . 7 3 C . B 3 C . 6 3 C . 3 2 5 . 2 26 .3 2 S . 8 22.1 26 .8 2 7 . 5 2 5 . 8 2 5 . 8 25 .5 26 .8
U . T . M .
15XVTÍ50574 15XVT83657Í 1SXVT832578 15XkT042568 15XWT024561 15XkT030535 15XkT010513 15XWT257416 15XM250436 15XkT242446 15XUT233457 15xkT223457 1SXM206466 15XkT198465 15XUT192466 15XI.T1S2464 15>kT174456 15XH165452 15XkT129424 15XH179432 I 5 X H 2 0 2 4 U 15»k[239397 15XkT2606C7 15XkT26B575 15XkT258539 15XkT263505 15XUI272582 15XWT282464 15XkT285455 15XH2S7438 15XU299408 15XkT295395 15XH288382 15XkT256354 15XkT230352 15XU192361 15XkT202339 15XH214310 15»kT2372B3 15XkT278292 15XkT3022S8 15XkT304310 15XU323306 15XH348306 15XkT364306 15>kT356298
•15XkT359260 15XH345174 15XH349159 1SXU335159 15XH331151 15XhT329129 15xkT328114 15XkT320064 15xkS361996 15XUIC51079 15XkT045 593 15XkT034063 15XkT034063 15XUT052056 15XkT0680b2
ORIENT AC
NE NE NE
N NU NE Nh
E NE NE NE
N N N N N
NE NE
N S
sw 5 U H H M W H U W H k
NW MU NE NH NU
H S S
SE SE
S S S
NE NE NW NU
U U N U u
su
E NE
H NU
S NE
AB
NE NE NE
N NU
E NU
E NE NE NE
N N N N N
NE NE
N S
SW sw NU NH
U U U h U k
NU NH NU NU
N NU
N W S s
SE SE • S
S SE NE. NE NU NH NU NW NU
U SU SU
E E U
NW S
NE
HIGH
549 427 442 935 853 732 972
1106 1067 1028 1028 1028 1006 991 991 945 884 914 747
1057 1057 1106 1485 1372 1372 1372 1250
823 823
1204 1204 1072 1072 125C
960 755 975 945
1006 1250 1250
945 1067 1067
869 655 670 762
1072 853 B53
1072 1072 1072
967 845 701 792 823 549 610
ELEVATIONS L .EX
290 274 229 427 411 305 305 564 549 518 549 442 244 305 427 366 244 229 411 366 2 83 457 564 579 427 305 290 579 594 427 320 320 274 274 290 610 229 427 274 290 427 747 457 549 427 579 579 366 137 533 533 152 427 274 2 74 244 213 488 335 366 183
L .TL
290 274 229 427 411 305 305
. 564 549 518 549 442 183 305 427 366 244 213 411 366 183 457 564 579 427 305 290 579 594 427 320 320 274 274 290 610 229 427 274 290 427 747 457 549 427 579 579 366 137 533 533 152 427 274 274 244 213 48B 335 366 163
SNOW
305 305 305 B23 750 300 777 823 853 869
1030 930 930 945 945 884 B53 792 610 B69 914 B23 823 823 B3B 836 777 777 74 7 777 792 732 701 747 762 762 76 2 914 777 77 7 777 838 823 623 823 823 823 fl?3 823 953 853 B23 823 686 747 411 457 457 457 457 396
DATE
22 22 22 22 22 22 22 25 25 25 25 25 25 25 25 25 25 25 22 25 25 25 28 26 26 28 2& 28 2B 28 2B 26 2B 25 25 25 25 25 25 25 28 26 26 2e 26 26 28 28 28 28 26 2f 28 26 2B 22 22 22 22 22 22
7 7 7 7 7 7 7 7 7 7 7 7 7 7 7 7 7 7 7 7 7 7 7 7 7 7 7 7 7 7 7 7 7 7 7 7 7 7 7 7 7 7 7 7 7 7 7 7 7 7 7 7 7 7 7 7 7 7 7 7 7
58 58 58 58 58 58 58 59 59 59 59 59 59 59 59 59 59 59 58 59 59 59 59 59 59 59 59 59 59 59 59 59 59 59 59 59 59 59 59 59 59 59 59 59 59 59 59 59 59 59 59 59 59 59 59 56 53 5B 56 58 58
MEAN ELEVATION ACCU
442 366 381 884 650 686 853
1006 914 914 930 960 975 975 975 930 869 B69 6S6 914
1006 960 960 975
1173 1082
930 80S 808
1006 975 869 83B 884 899
638 925 6B4 960
1036 880 960 6B4 840
975 835 835 960 960 884 80S 610 594 670 655 518 503
4 4 4 4 4 4 4 4 4 4 4 4 4 4 4 4 4 4 4 4 4 4 4 4 4 4 4 4 4 4 4 4 4 4 4
4 4 4 4 4 4 4 4 4
4 4 4 4 4 4 4 4 4 4 4 4 4
ARLA
295 3 290 3 274 3 610 3 61C 3 472 3 670 3 732 3 716 3 716 3 762 3 732 3 762 3 762 3 792 3 762 3 640 3 625 3 533 3 655 3 576 3 670 3 747 3 762 3 732 3 686 3 610 3 686 3 686 3 670 3 625 3 62 5 3 655 3 549 3 550 3 670 3 594 3 640 3 594 3 564 3 564 3 780 3 701 3 .670 3 655 3 610 3 615 3 579 3 457 3 670 3 670 3 564 3 670 3 564 3 579 3 335 3 391 3
427 3 427 3 290 3
STRAND FICRO
IT
E E E t E E E E E E E E E E E E E E E E E E E E E E E E E E E E E E E E E
N O .
1 2 3 4 5 6 7 B 5
10 U 12 13 14 15 16 17 16 19 20 21 22 23 24 25 26 27 28 29 30 31 32 33 34 35 36 37
LCNGIIUUE
h U W U U W U u H u H U w H W H W H U W U M W W rt w w w w u H U U u u u u
90 9C 5C 50 9C 90 90 90 91 91 SI 91 91 51 91 92 92 92 89 90 90 90 50 50 90 50 50 90 SO 91 51 SI 91 51 51 91 51
' 1 . 0 44.C 45 .0 47 .0 47 .C 47 .C 49 .0 S4.0 16.C 17.C 18.0 2 4 . C 2 4 . C 42 .C 45 .C 10.C 12.0 15.5 S4 .0 4 . 0
10.0 17.0 22.0 22 .0 33.0 34 .0 33.0 47 .0 S9 .0
6 .C 13.5 19.C 22 .0 31 .5 37 .C 41.0 48 .0
LAIIIUDE
N N N N N N N N H N N N N N N N N N N N N N N N H N N N N N N N H N N N N
75 75 75 75 79 75 75 75 79 75 75 79 79 7S 7S 75 75 75 78 78 78 76 7e 76 76 76 79 78 76 78 76 78 78 75 7S 76 76
6 .8 7 .C 5 .2 6 . 2 7 .6 7 . C 6 . 2 6 .9 2 .6 3 . 5 4 . 2 4 .1 2 . 4 4 . 3 4 .3
C 6 . C 6 . 8 6 .3
57 .2 56 .0 S t .O 57 . S 5 7 . 6 5 5 . 0 55 .5 55 .7
. 8 5 5 . S 5 5 . C 5 9 . 0 5 5 . 2 5 6 . 8 S £ . C
. 2
. 5 5 6 . 6 57 .5
U . I . H .
15>kT487834 15XkT4i6B37 15XUT472880 15XkT466860 15XUT466846 lSXkT465S36 15XkT460823 15XkT443S34 15XH367753 15XH7363768 15XkT359783 15XW337778 15XH340745 15XkT275782 15XkI2847B2 15XkT175jl3 15XkM70024 15XU1156818 16XDC3B1663 15XUI628681 15XkI604676 15XkT57966B 15>kT56266B 1SJU562696 15XM522700 15>kT519704 15XUT521723 15XM470706 15>kT432691 15XkT404688 15XkT37B690 15XkI3586B2 1 5 X W 3 4 S 6 6 7 15XH314705 15»kT294710 lS»kT281682 15XkI256654
CRIENT AC
N E N W U U U
NE N N N
NU W N
NU NE NE
W NE
N N
NE NE NE NE NE
E N
NW N N
NE N
NE N
NW NW
AB
N E N U
NU NW
N NE
N N N N H N
NU NE
N U
NE N
NU N N N
NE NE
N NW NW
N N
NE N N
NE N U
HIGH
975 1250
716 1250 1250 1250 1250 1006 1021 1021 1067
960 1128
914 975 960 945 670
1387 1494 1494
975 023
1749 1372 1295 1250 1676 1554 1021 1173 1189 1530
808 975
1067 14B5
ELEVATIONS L . E X
808 762 67C 762 8B4 732 914 914 678 945 844 623 754 640 869 762 564 335 594 457 427 488 486 2 74 899
1021 503 152 701 122 732 899 732 701 762 594 533
L.TL
608 762 670 762 B84 732 914 914 676 945 644 623 754 640 869 762 564 335 594 457 427 466 408 274 899
1021 503 152 701 122 732 B99 732 701 762 594 533
SNOW
1067 1067 1158 1158 1158 .1158 1158 1067 1067 1067 1067 1067 1067 1006 1006 1006 100 6 750
1006 945 945 792 792 853
1219 1219 1006 99 1 945 975 991 991 991 810 980 972 869
DATE
13 13 13 13 13 13 13 13 13 13 13 13 13 28 26 25 25 25 28 13 13 13 13 13 13 13 13 13 28 13 13 13 13 28 28 28 26
8 B 8 6 B B 8 8 a B 8 B S 7 7 7 7 7 7 8 8 6 8 8 8 B 8 B 7 8 B B B 7 7 7 7
59 59 59 59 59 59 59 59 59 59 59 59 59 59 59 59 59 59 59 59 59 59 59 59 59 59 59 59 59 59 59 59 59 59 59 59 59
NFAN ELEVATION ' ACCU
1220
1204 1204 1204 1204
1097
1219 1C67 1112
899 805
1128 1280 1250 1097 1219 1169 1169 1062 1052 1190
980 115B
4
4 4 4 4
4
4 4 4 4 4 4 4 4 4 4 4 4 4 4
4
4 4
ABLA
945 3 960 3 690 3
1"52 3 105 2 3 1036 3 1O06 3
960 3 1006 3 1006 3 975 3 930 3 991 3 945 3 945 3 914 3 762 3 457 3 823 3 762 3 777 3 701 3 640 3 716 3
1040 3 1110 3
B49 3 808 3 B84 3 762 3 623 3 930 3 914 3 762 '3 945 3 914 3 701 3
32

CEDO fRlGÍY BAY AND SANO CAY
IDEMT NO, TOTAL LENGTH HIOTH ABLA EXP TOTAL
SURFACE AREA EXP TOTAL ABLATION
»AR DEPTH VOLlTHF TYPE
7
a 9
10 u 12 13 14 IS lb 17 ia 19 20 21 22 23 24 25 26 27 26 29 30 21 32 33 34 35 36 37 20 39 40 41 42 43 44 45 46 47 40 49 50 51 £2 53 54 55 56 57 53 59 60 61
.4
. 2
. 3 1.1
. 4 ï
2 . 5 1.4 1.5 l.B 1.9 1 .9 i.e l.a 2 .1 1.7 1 .6 2 . 3
. e 2 . 5 5.1 1.9 3.1 1.8 4 .1 4 . 6 3 . 5 1.1
. 6 2 . 4 2 . 5 4 .1 3 .1 6 . 2 2 . 6
. 9 4 . 1 2 .1 4 . 5 2 . 3 2 .1
. 5 2 . 5 2 . 1 2 .6
. 9 . B
1 .0 •4.4 1 .0
. 9 4 . 6 1.9 5 . C Í.4
. 6 l.C
. 6
. 2 1.2
1 . 6 . 5 . 9
1.5 1.4 1.2 3 . 9 2 . 5 2 . 2 2 . 5 1.9 2 .9 3 . 2 2 .1 2 . 4 2 . C I.E 2 . 5 1.6
3 .a 6 .5 2 . 8 9 .2 6.t
1 C . 2 10 .2
9 .C 1.4 l.C
e.c 6.2 7.1 5.5 9 . 5 3 .9
. 9 5 .6 2 . 4 7 .5 5 . C 4 . C
.6 4 . C 3 .6 3 . 0
. 9
.» l.C 5.6 1.0
. 9 7 .8 4 . 4 6 .5 t .C 2 .5 2 .6
.6 i.e 1.5 3 . C
1 . 6 . 5 . 8
1.9 1.4 1.2 3 . 9 2 . 5 2 . 2 2 .5 1.9 2 .9 3 . 5 2 .1 2 . 4 2 . 0 l.B 2 . 6
' 1 . 6 3 . B 6 . 5 2 .9 9 . 2 6 . 8
11 .2 1 C . 2
9'.C 1.4 1.0 8 . C 6 . 2 7.1 9 . 5 9 . 5 3 . 9
. 9 5 .6 2 . 4 7 . 5 5 . P 4 .1
. 6 4 . 0 3 . 6 3 . C
. 9 . 8
1 .0 5 . 6 1.0
. 9 7 . 8 4 . 4 B . 5 8 . 0 2 . 5 2 .6
. 8 1 .8 1.5 3 . 0
. 9
. 4
. 5
. 2
. 5
. 6
. 9
. 5 2 . 1
. 8
. 9 1 . 2
. 5
1 .4 1 .0
. 5
1.5 . 6
. 40
.10
.20 2 . O L 1.31 1.71 9 .97 3 .73 2 . 3 2 1 .41 1 .71 1.61 3 .32
.80 2 . 2 7 2.12
L O I
2.41
1.41 4 .63
19.56 3 .63
25 .60 8 .87
32 .06 32 .76 1 8 . 85
1.10 .40
28 .23 8.46
10.99 2 3 . B 8 22 .93
4 .13 .81
9 . 0 7 1.71
18.35 6.75 3 .53
.30 7 . 4 5 3 .83 2 .32
. 5 0 . 6 0 .40
5 . 5 4 .40 .60
16.33 3 . 0 2
53 .22 39.61
3 .02 2 .16 1 . 1 1 1.36 1 .26 2 . 8 2
. 4 0
. 1 0
. 2 0 2 .01 1.31 1.71
10 .07 3 .73 2 . 3 2 1.41 1.71 1.61 3 . 7 2
. 8 0 2 . 2 7 2 . 1 2 1.01 2 .56 1 . 4 1 4 . 6 3
19.56 3.83
2 5 . 6 0 8 .87
32 .06 32 .76 18.85
1.10 . 4 0
28 .23 8 .56
10 .99 2 3 . 8 8 2 2 . 9 3
•4.13 .81
9 . 0 7 1.71
18.35 6 . 9 5 3 . 8 3
.30 7 . 4 5 3 . 8 3 2 . 3 2
.50
. 6 0
. 4 0 5 . 6 4 3
.60 3
.60 17.03 3 . 0 2
53 .2? 39 .61
3 . 0 2 2 .16 l.ll 1.36 1.26 2 . 8 2 :
. 3 0
. 0 5
. 1 0 1.51
. 5 0
2 .72 1.51 1.51 1.11 1.71 1.21 3 .12
. 7 0 3 2 .12 3 2 .02
.91 1.86
.40 1.51 8.57 1.21 7.26 2 .52
13.51 9 .27 6 .96
. 7 0
. 2 0 9 .48 2 .9? 3 .23 5 .74
11.39 3 .02
.81 4 . 8 4 1.61 8 .57 2 . 9 2 1.81
. 2 0 3 .12 2 .12 2 . 2 2
. 5 0
. 6 0
. 4 0 2 . 5 2
.60
. 6 0 8.66 1.31
31 .55 29 .33
. 2 0
. 3 5
3 3 3 3 3 3 3 3 3 3 3 3 3 3 3 3 3 3 3 3 3 3 3 3 3 3 3 3 3 3 3 3 3 3 3 3 3 3 3 3 S 3 3
35 3 15 3 30 3
25 50 50 25 62
100 73 60 38 21
0 25 16 12
7 5
10 27 72 67 56 68 72 72 58 72 63
66 71 76 50 27
0 47
6 53 58 53 33 58 45
55 0 0
49 57 41 26 93 84
100 74 88 89
15 15 15 20 20 20 30 50 50 50 20 50 50 25 50 50 50 50 20 50
125 5 0 .
200 125 200 200 125
20 15
2C0 125 125 200 200
50 15
125 20
125 125
50 15
125 50 50 15 15 15 75 15 IS
125 50
200 200
50 35 20 20 20 35
.01
.00
.00
.04
.03
.03
.30
. 19
.12
. 07
.03
.08
.19
.02
.11
.11
.05
. 1 3 .03 .23
2.44 4 .19 4
5 .12 4 1.11 4 6.41 4 6 .55 4 2 .36 4
.02 4 .01 4
5.65 4 1.07 4 1.38 4 4 .78 4 4 . 6 0 4
. 2 1 4
.01 4 1 . 1 3 4
. " 3 4 2 .30 4
.87 4
.19 4
.00 4
.93 4
.19 4
.12 4
.01 4
.01 4
.01 4
. 4 2 4
.01 4
.01 4 2.13 4
.15 4 10.65 4
7.93 4 .15 4 .08 4 .02 4 .03 4 .02 4 .10 4
700112 700112 700112 20011? 650112 640112 200112 520112 530112 530112 650112 520112 400212 400212 403112 401112 530U2
530112
700112
533112 522112 530112 504112 403112 435112 525112 535112 650112 65C112 42111?
535112
405112
402112
512112
520112
300132
533113
650112,
532114
530U2
532112 650112 530114 530110 535112 650112 30011? 730212 402312 650UZ 650112 400112 400112 403112 403112 526112 65C11? 730112
650112
730U2
65QU2
F I G . 10. Computer print-out, Axel Heiberg Island, Good Friday Bay and Sand Bay, and Strand Fiord. (Note. For volume accuracy rating '4' read '3'.)
STRAND FIOUC
IDENT N C . TOTAL LENGTH1
AlJLA EXP TOTAL SUifACE ARb'A
EXP TOTAL ABLATION AAR DEPTH VOLUME"-
3 4 5 6 7 8 V
10 11 12 13 14 15 16 17 18 19 20 21 22 23 24 25 26 27 28 29 30 31 22 33 34 35 36 37
l.C . 6
lie . 7
1.6 l.b 2 .2
. 6 .9
1.4 . 8
3 . 0 4 . 6 4 . U i.e 1 .4 5 . 2 l . C
. 6 3.1 t.i 4 . 2
13.£ l.C
.6 2 .2 1.2 1.9 2 . C 6 . C
1 . 0 1 . 2 .1
1.4 1.2 2.1 2 . 2 2 . 2
. 6
. 6
6 .C 2 .2
1.4 . 8
4 . 7 9.1 8 .C i.5 1.5
21 .2 1.2
. 5 4 .2
15.e 5 . 3
2£ .e 1.2 1.5 (.5 1.2 1.5 3.1
16.2
1.0 1 .2
. 3 1.4 1.2. 2 .1 2 . 2 2 . 2
. 6
. 8 6 . C 2 . 2
. 6
. 9 1.4
. 8 4 . 7 5.1 8 .U 6 . 5 1.5
2 1 . 2 1.2
. 9 4 . 2
15.8 9 .3
2 5 . 8 1 . 2 1 . 5 6 . 5 1 . 2 1.9 3 . 1
16 .2
.40 1.91
.15
.90 1.00' 1.21 1.91
.81
.20
.20
.25
.30 13.91
2 .02 .15 .60 .70 .30
7.89 21 .57 16.83 13.21
1.31 43 .04
.70
.30 8.77
53.93 21.88
149.28 .81
1.20 14.92
.40 1.21 7 .56
70 .06
.40 1.91
.15
.90 1.00 1.21 1.91 .81 .20 .20 .25 .30
13.91 2 . 0 2
.15
.60
.70
.30 8 .06
2 1 . 7 7 17.13 13.21
1.46 43 .19
.10
.30 8 .77
53.93 2 1 . 0 8
149.28 .81
1.20 15 .02
.40 1.21 7 .56
70 .06
3 3 3 3 3 3 3 3 3 3 3 3 3 3 3 3 3 3 3 3 3 3 3 1 3 3 3 3 3 3 3 3 3 3 3 3 3
.40
.40
.15
.70
.50
.81 1.81 .81 .20 .20 .25 .30
7 .16 2 .02
.15
.60
.70
.30 4 . B 4
12.80 7 .76
• 3 .43 1.01
10.23 .40 .20
3 .03 17.04
7.36 44 .55
.71
.60 3.63
.40 1.21 6 .35
17.34
3 3 3 3 3 3 3 3 3 1 3 3 3 3 3 3 3 3 3 3 3 3 3 3 3 3 3 3 3 3 3 3 3 3 3 3 3
0 52
0 22 50 33
5 0 0 0 0 0
48 0 0 0 0 0
39 41 55 74 31 76 43 33 56 68 (.6 71 12 50 76
0 P
16 75
15 20 15 15 20 20 2P 15 15-
15 15 15 75 35 15 15 15 15
125 200 125 125 ?0
200 15 15 50
200 200 250
15 20
125 15 20 50
200
• CI .04 .00 .01 .02 .02 .04 .01
•oc .op .00 • OP
1.04 .07 .00 .01 .01 .00
1.01 4 .35 2 .14 1.64 .03
8 .64 .01 .00 .44
10.79 4 .38
37 .32 .01 .02
I.B8 .01 .02 .38
14.01
4 4 4 4 4 4 4 4 4 4 4 4 4 4 4 4 4 4 4 4 4 4 4 4 4 4 4 4 4 4 4 4 4 4 4 4 4
650102 203112 650112 650112 650112 65011Z 620112 700112 650112 650112 650112 650112 300112 650112 650112 650112 620112 900100 532112 426112 420112 430112 650112 510112 625112 655112 640113 432112 525410 423110 650112 650112 510113 650112 650112 620112 424112
33

Perennial ice and snow masses
State, Province or Region: C A ^ A b A
Mountain area: A%et_ H E / 6 E Ä C lit-Art^
Hydrologlcal basin:-1st order: uiouf FloAt>
U n d order:
Illrd order:
IVth order:
Glacier name:
Sources:- fifeVftrJOZ P£irJï~ Map, title & No: C¡uñcji£ií FSPÉ^
Compiled by: bEVAtXtlsvir oF enetotf. r\,*ie<\ ^¿esouiii.eS
Date: i<j65 ^
Scale: , • ,xs,i>ob
Contour interval: Sero -ft.
Reliability: ± ¿leu 4b.
Photographs : -
Type: \JcdT\Cnu 3 o , ooo AS-L.
Serial No: A IbiS*] - l3a
Date: J &/T/SJ Remarks: , „ . _
M o CLjaohS Literature:
Data compiled by: C.S.L. o*iHfl*irteH
Date & organisation: l¿]b7"
Supervisor: f. Y¡Ou.ee., T)CC¡IL.L. '
REMARKS (special geomorph- ' ologlcal features, abnormal characteristics, If international boundary, source information on mean depth estimate, observations regarding snow line or'equilibrium line from other years)
•£re.eAH fi-oiAS. OUT FHar\ E*|9/W&£>> r<r°T /»oro Oñui-^y
To -ToorHuZ c r ) rofi.r¡i*JC) A -£>'7'"-<-
aoTLZT Çt-flc-ter/L- rjAihJ SrJoov
S-TEEpl-J C¡-IFFe:>) latrH ÇLAUEÍZ.
V.ArttfHT^ /./VICE fJ F£OrJ~T
Regional and basin identification
Glacier number
Longitude
Latitude
U.T.M. i — 1 _
• , A,
ul
JL .T- .g,c .¿- . ' j . .s ' ,
, • 5,
, .3,1,4,
, .¿.Lb , , r . ' ¿ . . ? .
doy t mo. jr. ••2.IT ; .*\S.y.
Orientation: Accumulation area (8 pt. compass)
Ablation area (8 pt. compass)
Highest glacier elevation (m/a.s.l.)
Lowest glacier elevation: Exposed (m/a.s.l.)
Total (m/a.s.l.)
Elevation of snow line (m/a.s.l.)
Date of snow line
Mean accumulation area elevation,weighted,(m/a.s.l.) i—i*?i4- i"i
•Accuracy rating (1-5) ^
Mean ablation area elevation, weighted,(m/a.s.l.) ,—i-f , °) , f,
*Accuracy rating (1-5) ^
Maximum length:Ablatlon area (km)lncl.debris covered . ,f...J.
Exposed (km) J_iiL.JL
Total (km) JLiáb.i^
Mean width of main ice body (km) i—isL.iifcj
Surface area: Exposed (km2) . , , lj-,8 . .A. ¥•.
Total (km2) . , ,f.lT...J.Pr
•Accuracy rating (1-5)
Area of ablation (km )
•Accuracy rating (1-5)
•Accumulation area ratio (per cent)
Mean depth (m)
Volume (km ) of ice
•Estimated accuracy rating (1-5) ••3.
Classification and description (see Table 1) S ¿ .2.1 -I .4-
.3 ,
J J 2 _ I * i o ife> • t
•Accuracy ratings
1 2 3 4 5
Excellent Good Fair Acceptable Unreliable
Area 0-57. 5-107. 10-157. 15-25% > 25%
Elevations 0-
25-50-
100-
>
•25 m 50 m •100 ra -200 ra 200 m
Volume 0 - 107. 10 - 257. 25 - 507. 50 - 1007. > 1007.
F I G . 11. Glacier inventory data sheet for Axel Heiberg Island, Wolf Fiord.
34

Three pilot studies: the High Arctic
State, ProvLnce or Region: C A M / V b A
Mountain area: A*£i- M E I « O & J I£¿-/)TJ^
Hydrologlcal basin:- ÇL/KCIS*. F I O Ä N Ist order:
U n d order:
Illrd order:
IVth order:
Glacier name:
Sources:- A í s W W t e fñirJT Map, title & No: GLACI&C FioAb i<ji
Compiled by: hBPMírnehfT OF Ewae;/
Date: „ b 5
Scale: I : 'J-5, 0 0 0
Contour Interval: Soofb.
Reliability: Í ¿ro fc.
Photographs:-
Type: VS-EriCfM.
Serial No: A lb.6i.o-n
Date: lí¡fS¡S<^
Remarks: w o Ci.ö(Jbs
Literature:
Data complied by: C.£.L..C»1>1A»»JZ-J
Date £1 organisation: i^bj1
Supervisor: F. rçû'-t.e/î, ÍJCÇILL. u*>iú£<£tTÍ
REMARKS (special geomorph ologtcal features, abnormal characteristics, if international boundary, source information on mean depth estimate, observations regarding snow line or equilibrium line from other years)
TiOO VifltrJ ZTßSMS • SevéXAL-
~b£AtVAqe C H / W W E L . rb(_(_o""vJ<}
. ATE Aft u.
Regional and basin identification
Glacier number
Longitude
Latitude
U.T.M. 1 i_
JL
JA • •*? .o.M .3...S.
1 JÉ_i Orientation: Accumulation area (8 pt. compass)
Ablation area (8 pt. compass)
Highest glacier elevation (m/a.s.l.)
Lowest glacier elevation: Exposed (m/a.s.l.)
Total (m/a.s.l.)
Elevation of snow line (m/a.s.l.)
Date of snow line
Mean accumulation area elevation,weighted,(m/a.s.l.)
•Accuracy rating (1-5)
Mean ablation area elevation, weighted,(m/a.s.l.)
•Accuracy rating (1-5)
Maximum length:Ablation area (km)incl.debris covered
Exposed (km)
Total (km)
Mean width of main ice body (km)
Surface area: Exposed (km2) . •
Total (km2) , i_
•Accuracy rating (1-5)
Area of ablation (km )
•Accuracy rating (1-5)
Accumulation area ratio (per cent)
Mean depth (m)
Volume (km ) of ice
•Estimated accuracy rating (1-5)
Classification and description (see Table 1)
, g.
. . .q.i.
, . . q . / •
, • ? • I , ft, doy mo. it.
.0,
• I .0...&.
.1.0...8.
1—1 i.t^j
.l.6...U-.%
.!.(>...1 ,a^
3.
,
s a.
.,f,
, , '
,.,J
0,1
.O.3.
. 3 .
. * . * . 0 . / .
^
J ,2-,
3£ A Pumu-r)ofLMÑG
•Accuracy ratings Area
1 Excellent 0-5% 2 Good 5-107. 3 Fair 10-157. 4 Acceptable 15-257. 5 Unreliable > 257.
Elevations 0-25 m 25-50 m 50-100 m 100-200 m > 200 m
Volume 0 - 107. 10 - 257. 25 - 507. 50 - 1007.
> 1007.
FiG. 12. Glacier inventory data sheet for Axel Heiberg Island, Glacier Fiord.
35

B.
Glacier ice once covered a considerable portion of North America but is n o w restricted to two main areas : the Arctic Islands and the Western Cordillera. Partial inventories have been compiled for some regions by Field (1958) and Meier (1961). In preparation for a complete inventory a pilot study has been carried out for the Waputik Mountains (116°30' W . , 51°30' N . ) , part of the Rocky M o u n tains.
O n e of the initial problems was applying a numerical system to identify the drainage basin in which a glacier is located. The guide suggests subdividing river basins into first, second and third order parts progressively upstream. However, in Canada a code system already exists for the drainage areas, established by the Water Survey of Canada. The main ocean basins are defined by a number (e.g. Pacific, 8; Arctic, 7) and smaller units within them by letters (Fig. 13). The division of basins is not uniform but in general the first letter refers to all or part of a major river basin. Further subdivisions, designated by a second letter, are not necessarily separate drainage areas of lower order. For some of the main river systems. the subdivision A covers the head waters and successive areas downstream are lettered consecutively.
For the purpose of the glacier inventory the existing system of drainage area identification is adequate but it was necessary to divide the areas into smaller units (Fig. 14). Where possible the smaller units were lettered clockwise from the downstream end of the subdivision. For m a n y
A pilot study for an inventory of the glaciers in the Rocky Mountains
by A . D . Stanley, Glaciology Sub-Division, Inland Waters Branch, Ottawa (Canada)
basins it was not possible to remain consistent and the first unit m a y not be a single drainage area. Difficulties in basin identification were accentuated in the area of the pilot study as the Waputik M o u n tains form part of the divide between two main river systems: the Columbia flowing westward to the Pacific and the Nelson flowing eastward.
Geographic location
In Canada the Rocky Mountains extend in a north-westerly direction from the 49th parallel for a distance of over 1,300 k m to the Liard River. M u c h of their length forms the political boundary between the provinces of British Columbia and Alberta and the Continental Divide between main drainage basins. Part of the divide is formed by the Waputik Mountains that extend north-westward for a distance of 63 k m from Lake Louise, Alberta. They cover a roughly triangular area of nearly 900 k m 2 with the widest section, 25 k m , at the southern end. The mountains are defined by the rivers B o w and Mistaya on the east and the Blaeberry, Kicking Horse and Howser on the west. Valley floors are at an elevation of 1,500 m and steep slopes lead to ridges of 2,700 m that culminate in a number of peaks, one over 3,300 m .
Most of the higher ridges have small areas of permanent ice and snow but few valleys contain large glaciers. W a p t a Icefield in the centre of the mountains is the largest ice mass and forms the accumulation for the Y o h o and Daly rivers and
Inventory of glaciers in the Waputik Mountains
36

Three pilot studies: the Rocky Mountains
FIG. 13. Drainage basins in Canada.
for the Peyto Glacier. Peyto Glacier is n o w being investigated as an I H D project and detailed information is available which can be correlated with data gathered for the inventory.
Climate
Within the general area there are no extensive bodies of open water and any moisture from the Pacific Ocean to the west must pass over 700 k m of land including more than one range of high mountains. F rom the Pacific Ocean along a w e s M o -east profile to the Rocky Mountains there are a number of meteorological stations but climatic information is limited for the Waputik Mountains. There are no meteorological data for high elevations. The nearest station is in the valley at Lake Louise at an elevation of 1536 m ; observations of the daily precipitation and temperature have been recorded there since 1915. For the period of record the annual precipitation averaged just under 70 c m with nearly two-thirds of it falling during the winter months from October to April. During the winter the average temperature is —5° C and in the summer months, from M a y until September, the temperature is well over 9° C .
Maps and aerial photographs
Glaciers are portrayed on all maps of the Waputik Mountains. These include special maps of national parks and regular editions of the National Topographic series produced by the Surveys and M a p ping Branch, Department of Energy, Mines and Resources. These maps have been published at a variety of scales including: 1:1,000,000; 1 :500,000; and 1 : 250,000, but only the larger areas of ice and snow are portrayed and their outlines have been generalized. The most detailed glaciological information is given on the regular National T o p ographic series, printed at a scale of 1 : 50,000 with contours every 100 feet. These sheets are: Golden, 82, N / 7 E ; Lake Louise, 82, N / 8 W ; Hector Lake, 82, N / 9 W ; Blaeberry River, 82, N / 1 0 E ; Mistaya Lake, 82, N / 1 5 E & W ; Siffleur River, 82, N / 1 6 W .
All these maps give excellent detail but they have been compiled from aerial photographs taken in 1949 and 1951. O n some maps small glaciers have been omitted and on others areas shown as snow and ice were probably patches of snow that had not melted at the time the photographs were taken. For the glacier inventory, areas of snow
37
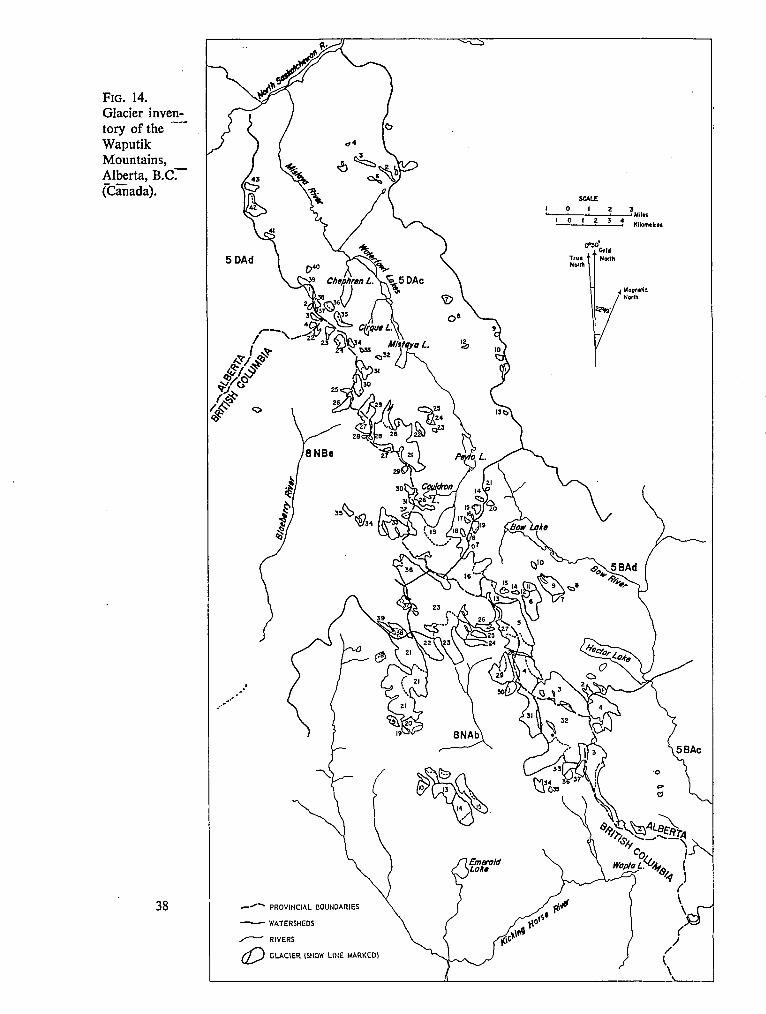
F I G . 14. Glacier inventory of the Waputik Mountains, Alberta, B . C T " (Canada).
38

Three pilot studies: the Rocky Mountains
and ice on all maps were compared with high-level aerial photographs taken in 1966. A good coverage was obtained for glaciers along a transect from the Pacific Ocean to the Rocky Mountains including a number of I H D project glacier basins in southern British Columbia and Alberta. All photographs were taken at a height of 30,000 feet above sea level between 21 to 23 August 1966 using a Wild R C / 5 a camera with a focal length of 153 m m .
The photographs are very suitable for the inventory as glacier margins and termini are readily identifiable, but some of the larger glaciers have ice-cored moraines and their exact boundaries are difficult to determine. For most glaciers there is good contrast between white areas of snow and darker areas of ice and firn.
Method
For the inventory the location of glaciers on each m a p was compared with the distribution of snow and ice on aerial photographs. Where necessary glacier boundaries were adjusted to agree with the photographs, and small glaciers that had been omitted were sketched on the m a p . Geographic co-ordinates and the U T M grid are clearly shown on each m a p and there was no difficulty in determining the glacier location. Elevations were obtained directly from the m a p to the nearest 50 feet and the values converted to the metric system. Each of the initial readings is accurate to within ± 75 feet, but the metric value is a direct conversion and does not imply precision to the nearest metre. Areas were measured with a dot planimeter and a random-grid overlay; for most glaciers the error is just more than 5 per cent. The location of the snow line for each glacier was determined from inspection of aerial photographs, and that of the Peyto Glacier found to be at 2,500 m . Detailed field observations show that the transient snow line was at an average elevation of 2,500 m in late August but it rose to 2,600 m by the end of the ablation season. Thus it m a y be assumed that for m a n y glaciers the highest position of the snow line in 1966 would be 100 m above the elevation given in the computer print-out.
Glacier thickness was not measured directly but estimated by comparison with depths obtained for alpine glaciers elsewhere in the world. F r o m a general survey of published data the depths for
Table 5
Type Area (km1) Averago depth (m)
Valley glaciers 0-2.5 50 2.5-5 70
5-10 100 10-25 150
Mountian glaciers 0-0.5 10 0.5-2.5 25 2.5-5 50
each of two glacier classifications has been estimated (Table 5).
During the last period of glaciation the Waputik Mountains had extensive valley glaciers. These have retreated and n o w all that remains are small valley glaciers and a large number of remnants. For the pilot study these have been listed as m o u n tain glaciers for they are not glacierets and they do not conveniently fit any other description given in the guide.
These small glaciers are less than 1 k m 2 and occupy walls of cirques and basins or mantle the eastern slopes of the ridges. They tend to be irregular or elongate bodies parallel with the hill-side and structurally controlled by the general strike of the layered rocks that form these mountains. There are all gradations from a single basin to a cirque and it was not possible to clearly distinguish between the extremes for some glaciers.
Summary
All information compiled for the glacier inventory is given on the computer print-outs (Figs. 15 and 16), and the main data are summarized in Table 6. Within the Waputik Mountains there are 109 glaciers with a total volume of 12 k m 3 covering an area of 150 k m 2 . The glaciers range in elevation from 2,100 m to well over 3,200 m , with transient snow lines from 2,050 m to 2,650 m . A A R values are commonly 70 to 80 per cent. There appears to be no relation between the transient snow line and the size of the glacier, and m a n y of the smaller glaciers occur on slopes at high elevations well above the transient snow line.
39

Perennial ice and snow masses
Table 6. Summary of glacier inventory of Waputik Mountains
Location
B o w River headwaters 5BAc 5BAd
North Saskatchewan 5 D Ac 5 D Ad
Columbia River 8NAb
Columbia River 8NBc
Total
No.
6 21
30 4
30
18
109
Volume (kms)
.366 1.560
2.690 .008
7.067
.495
12.186
Area (km1)
7.33 26.67
28.19 .95
70.74
11.93
145.81
M a x . size
(km1)
4.3 5.9
12.6 .45
13.7
3.2
Highest
2 800 2 900
3 100 3 250
3 150
2 750
Elevation (m)
Terminus
2100 2100
1920 2 450
2 100
2 200
Transient
From
2 450 2 350
2 050
2 300
2 250
snow line
To
2600
2 650
2 550
2 650
Conclusion
The directives set d o w n in the guide of the C o m m i s sion of S n o w and Ice were followed in the compilation of the glacier inventory for the Waputik Mountains. This region was selected for a pilot study because it is covered by large-scale m a p s and recent aerial photography, which brought out m o r e clearly difficulties inherent in the guide. The three main problems were glacier identification, classification and thickness determination.
T h e identification system was modified to follow the existing index of drainage basins used by the
Water Survey of Canada. The proposed classification does allow for some irregular ice masses; consequently all those that are not definitely valley glaciers have been designated mountain glaciers irrespective of their shape, size, or location. The actual term seriously influences any volume determinations, for the estimated thickness values are considerably greater for valley glaciers. Estimates used in this pilot study are considered reasonable and as the most unreliable figures are for the smaller ice masses the total value of 12 k m 3 appears acceptable.
References
FIELD, W . O . 1958. Geographical study of mountain glaciation in the northern hemisphere, parts 2a and 2b, N e w York, American Geographical Society (Mimeographed report.), p. 274, p. 108.
M E I E R , M . F. 1961. Distribution and variations of glaciers in the United States, exclusive of Alaska. General Assembly of Helsinki, IUGG (IASH publication no. 54.), p . 420-429.
40

Three pilot studies: the Rocky Mountains
«APUTIlt MOUNTAINS ROCKY HOUNIAINS WcSTEKN CANADA A.J.STANLEY INLAW KATERS BRANCH OTTAWA 1967 p j Q JJ
BOW pi RIVE* hEADWATERS
ICEKT
5EAC SEAC SEAC sue sue SBAC SEAC 5BAC 5EAC 5EAB SEAC SEAC SEAC SEAC SEAC SBAO 5SAB 5BAC SEAC SEAC 5t*C SEAC .5BAD 5 d A C
JEAC 3EAC SEAC
NO.
2 3 •4
5 4 7 1 Z 3 4 5
« 7 8 9
10 11 12 13 14 15 It 17 IS 19 2 0
21
LONGITUDE
h
w U-W 'rt K W W h W W w w h K W H W W U U M W M kl U
H
116 116 116 11b 116 1 U lia 116 116 116 116 116 1IÍ 116 119 116 116 116 116 116 116 116 lie 116 116 116 116
;o.o ¡3.0 22. S 18.5 lu.S 19. C ¡2.5 22.5 25.0 27.5 27.S 27. S 25.S 26.C 26.0 ¡7.0 27.5 27.5 20.0 20.0 29.0 30. ; 21. C 21.5 21.0 20.0 20. C
LATITUDE
H il N SI H SI N 51 H SI N 51 N Si N il H SI N 51 N 51 N 51 H 51 N 51 N SI N 51 N 51 N 51 N SI N 51 N 51 N 51 K 51 N SI N 51 N il N 51
21.C 2C.5 32.0 29.5 3C.C 3C.5 34.C 34.0 34.C 34.5 35.5 37.0 3Î.5 3t.0 2E.0 36.5 3E.0 37.5 2f.C 37.5 3t.C 39.C 39.5 4C.0 4C.5 41.5 42.C
U.T .H.
11U.HS46Z57021 UUNH543157061 111.NH543557126 lll;NH547BS7C47 11LNH547B'J7C53 UU1H5477170Ü'. 11LNH543357126 11LNH5423571Z3 1KHH540257126 UUNH537837141 llbNH537457160 1HNH53795718/ 1IUNH539757193 11UNHS40857200 11UNH5394S7202 1KNH538057217 11UNH537757202 11UNH537257194 111NH534657203 11UNH535757198 11UNH53585719B 11LNH5J3957216 11UNH533457233 1UNH5J325724C 1UNH533657246 11LNH535657264 11UNH534557276
CRIENT AC A3
. N N 1 S SE i SE SE ' N N i 6 E > NE E i N NW 1 N NM i N NW . N NE 1 SE SE ' SU SE 1 S S 1 NE NE ! NW N • SE E ! NW NH > NW NW 1 N E 1 NW NW l N N . NE NE i E E : E E . SE SE . NE NE . H H
HIGH
2347 277'. 2713 26CS 2377 222S 280'. 277«. 304» 3048 21)30 2865 2 743 2J77 2743 243S 2896 2743 2926 2591 2438 2774 2H0 4 2896 2743 2591 2499
ELEVATICNÎ L.EX
2134 2347 222? 2499 2195 2103 2225 2347 2134 2286 2330 2445 2575 2316 2<.08 2286 2575 2682 2469 2452 2256 2317 2652 2713 2576 2469 2377
L.TL
2134 2347 2225 2499 2195 2103 2225 2347 2134 228f. 233" 2445 2575 2316 2403 2286 2575 2682 2469 2452 2256 2317 2652 2713 2576 2469 2377
SHUtf
2499 Z'tùÇ
2438 2530 253C 2591
2438 2347
2560 2499 2316 2560
2606
CATE
22 22 22 22 22 22 22 22 22 22 22 22 22 22 22 22 22 22 22 22 22 22 22 22 22 22 22
OS "fl 08 08 08 r-a OB 08 OB OB OB 08 OB OB 08
re "8 CB OB 08 OH
r-a OB 08 08 OB 08
6 f.
66 66 66 66 66 66 64. 6 h
66 66 6b 66 66 66 66 6h 66 66 66 66 66 66 66 66 66 66
MEAI ELEVATION ACCU
2225 2 2652 Z 2530 2 2591 Z 2347 2 2195 2 24B2 2 2652 2 2652 2 2B96 2 2713 7. 2743 2 2Ú9D 7. 2347 2 2682 2 240B 2 279n ? 2713 2 2665 ? 2499 2 2377 2 2652 2 2743 2 2758 2 2652 2 2560 2 2433 2
ABU
2499 2 2347 7
2286 2 .2535 2 2499 2 2530 2
2499 2 2316 2
2530 2 2499 2 2286 Z 2484 Z,
2591 2
Computer card, Waputik Mrs., B o w River headwaters, North Saskatchewan River, Columbia River, Columbia River headwaters.
NORTH SASKATCHEWAN RIVER
ICENT
fCAC SCAC 5CAC 5 CAC M A C 5 CAC .SCAC 5EAC SCAC 5CAC 5CAC 5CAC SEAC 5CAC 5EAC 5 CAC SCAC SCAC SCAC 5LAC SCAC SCAC 5CAC 5CAC SCAC SCAC S CAC SCAC 5CAC 5CAC ¿CAC SCAD SCAD SCAC
NO.
14 15 16 17 IB 15 20 21 22 23 24 25 26 27 28 25 30 31 32 33 34 35 36 37 38 39 40 41 42 43 1 Z 3 4
LONGITUDE
W W M W
w w w w w w w u w w w w w w w u w w w w w w w u w w w H w X
116 20.5 116 20.5 116 21.0 116 21.5 116 21.5 116 23.0 116 25.0 116 25.0 116 24.5 116 23.5 116 24.0 116 24.5 116 :-7.0 116 26.5 116 28.0 116 28.0 116 2a.5 116 2B.5 116 27.5 116 28.5 116 29.0 116 40.0 116 40.5 116 41.C 116 41.C 116 42.0 116 42.0 116 44.5 116 45.5 116 45.5 116 42.C 116 42.0 116 41.5 116 41.5
LAT1TUUE
N II N N N N
H N N
N N N
N N N N N N N
N N N H N N N N N N N N N N N
51 51 51 51 51 51 51 51 51 51 51 SL 51 SI 51 51 51 51 51 51 ;i 51 51 51 51 51 51 51 51 51 51 51 51
51
41.5 41.5 41.0 4C.5 4C-.C 4C.5 41.5 43.5 44.5 44.5 45.C 45.0 45.0 42.5 44. C 45.0 46.0 .46-5 47.0 47.5 46. 0 48.5 44.5 49.0 45.5 5C.S 51. C 52. C 53.5 54.C 5C.C 49.5 49.0 46.5
11UNH53405726B 11UNH533757261 11UNH5334572S4 11LNH532957252 11LNH532657242 11LNH531257249 11UNH528957266 11CNH528857Z98 11UNH529557317 11LNH5345S7317 ULNH5301573Z7 11UNH525657334 11LNH526657330 UUNH526757303 11LNH525657313 11LNH525357333 lUNh524657343 UUNh524£57364 U0NH526Z57373 11UNH524857377 11UNH524057383' 1UNH523357399 11UNH522457411 ULNH5Z15574C7 11UNHS21657411 11USH520457429 ULNHS2C557433 UUNH517857464 11UNH5167574B5 11UNH516557499 11LNH521057422 ULNH52U57410 HUNH521357403 UUNH5Z1257397
CRIENT AC AB
1 K N H K
> H >| : NW N K
H n 1 NE NE i NE NE 1 E E ' SE SE r E E ' fe E - NW N 1 N N \ Uw Nit 1 SE E > NW N 1 E E i SE S > NE NE ' NE NE 1" SE g 1 NW NM . NE NE ' E Ë . SE F. 1 NW h 1 NE NE > Nh NU i N E l NE NE : sw su 1 NW N» > W SW r H li
HIGH
259L 2774 2743 2743 2865 307a 2804. 2713 2957 2560 2652 2304 2896 295 r 2926 2652 2835 2926 22B6 2256 2743 2225 2134 2587 2865 3200 2256 2987 2804 2743 3261 2896 3200
27«
ELEVATIONS L.EX
243 B 2545 2621 2530 2469 2042 2560 2438 2515 2484 2438 2438 2042 2096 2682 2256 2530 2408 2208 2134 2469 1920 1981 2S04 2530 2591 2134 2743 2499 2530 2865 2713 2713 2469
L.TL
2438 2545 2621 2530 2469 2042 2560 2438 2515 2484 2438 2438 2042 2896 2632 2256 2530 2403 2208 2134. 2469 1920 19BI 2804 2530 2591 2134 2743 2499 2530 2865 2713 2713 2469
5M0K
2499 2652
2130
2606
2530
2469
2484 2606 2531
2042 2085
2621
DATE
72 08 22 22 22 22 22 22 22 22 22 22 22 22 22 22 22 22 22 22 22 22 22 22 22 22 22 22 22 22 22 22 22 22 2 2
08 08 08 08 08 08 08 08 08 08 08 08 08 08 08 08 OB 08 OB OB 08 08 08 08 08 08 08 08 08 08 08 08 08
66 66 £6 66 66 66 66 66 66 66 66 66 66 66 66 66 66 66 66 66 66 66 66 66 66 66 66 66 66 66 66 66 66 66
MEAN ELEVATION ACCU
2530 2
2652 2 2682 2591 2652 2621 2652 2576 2743 2530 2560 2652 2560 2926 2865 2530 2682 2713 2256 2164 2652
2 2 2 2
2 2 2 2 2 2 2 2 2 2 2 2 2 2 2
2085 2 2103 2880
Z 2
2804 Z 2790 2195 2804 2713 2606 3139 2789 2957 2621
2 2 Z Z 2 Z 2 2 2
ABLA
2499 2 2652 2
2347 2
2560 2
2499 Z
2225 2
243 B 2 2591 Z 253(1 2
2027 2 2027 2
2621 Z
¿CLUMelA RIVER
IPEKT
SNAB SNAB 8NAB
sum SNAB 8NAE 8NAE BNAB 8NA6 ÍKAB ÏNAE 8NA8 £St£ SNAB SNAB «NAE SNAB SNAB SNAB SNAB 8NAS SNAB SNAE SNAB SNAB, 1NA8 SNAB BNAB BNAB SNAB.
NO.
e 9
10 11 12 13 14 15 16 17 18 19 20 21 22 23 24 25 26 27 2e 29 30 31 22 33 34 35 36'
37
LCNGITUDE
U H W W W W
w w w H M U
w w w H W
w w w w w w •w k w h h H H
116 116, 116 116 116 116 116 116 116 116 116 116 116 116 166 116 116 116 116 116 116 116 116 116 116 lia 116 116 116 116
27.0 .26.C 24.5 24.S 24.0 24.0 21.5' 31.S 23.0 24.C 34.5 25.5 25.0 25.C 23.0 T2. 5
20.5 30.5 20.0 28.5 2B.5 29.0 28.5 27.0 25.5 26.5 26.0 26.C 25.0 24.0
LATITL06
N N N
H N N N N N N N N N N
N N N N H H N N N N
N N N N N K
il 3E.C 51.22.5 51 2C.0 51 25.0 51 25.5 51 3C.0 51 3C.C 51 25.5 51 2C.5 51 3C.5 51 3C.5 51 22.0 51 22.5 El 34.C il 3Î.C 51 25.5 51 25.5 51 26.C 51 36.5 51 36.C 51 25.0 51 34.5 51 24.C 51 32.5 51 21.5 51 2C.C 51 2C.C il 2C.0 51 2 C 5 51 3C.5
U.T.H.
C 11ÜNH526357150 11UNH527357103 UUNH525657053 11LNH529557039 11UN8530157043 11LNH53165704B 11UNH532957031 11UNH533357046 11UNH531457062 11LNH530357065 11UNH529657060 11UNH528Z57095 111NH529057C97 11UNH52895712B 11UNÍI530757149 llbNH531757I74 111ÍNH534257159 11UMH534257165 11UNH534457171 11UNH536357166 11UNH536557150 11UNII53S957141 11UNH536457124 HLNri53UJ57103 HL5e54C157084 11UNH538657054
C 11LNH53B657054 11LNH539457057 11UNH540757063 UUNH541657064
ORIENT AC AB
1 H U í Nw W i W W r s S
H M 1 SE S . SE SE i NE NE ! N N 1 NW NW 1 NW NW
S S ' E E 1 E 6 SE SE SE SE
1 E E SE SE SE SF
> SE Sn l N H
N NW ' £W W sw Svr s su
• N N N N
• N N ; SE SE sw srf
HIGH
2591 2896 2835 28114 3048 3109 2957 2621 2743 2957 2335 30 IB 3018 2937 2972 3125 2896 2850 3170 2B96 259L 2065 2385 3200 2987 2408 2408 2652 2682 2987
ELEVATIONS L.EX
2377 Z47C 2530 2438 2804 2591 2103 2240 2377 2301 2225 2835 2480 2240 2408 2149 2469 240B 2865 236 L 2438 2377 2438 2484 2134. 2210 2210 2530 2438 2560
L.TL.
2377 2470. 2530 2438 2804 2S9L 2103 2241 2377 2301 2225 2835 248C 2240 2408 2149 2469 24C3 2865 2361 2438 2377 2438 2484 2134 2210 2210 2530 2438 2560
SNOW
2438 256C
2774 2469 2347 2530 2362
2591 2469 2469 2469 2515
2530
2560 2652
2591
DATE
22 22 22 22 22 22 22 22 22 22 22 22 22 22 22 72 22 22 22 22 22 22 22 22 22 22 22 22 22 22
08 08 08 08 OB 08 08 08 08 08 OB OR 08 08 08 08 OS 08 OB na 08 08 OB 08 CB 08 08 08 08 OB
66 66 66 66 66 66 66 66 66 66 66 66 66 66 66 66 66 66 66 66 66 66 66 66 66 66 66 66 66 66
MEAN ELEVATION ACCU
249? 2682 2713 2591 2957 2896 2667 240« 2621 2499 2510 2926 2743 2591 2728 2652 2621 27S9 2957 2743 2530 2713 2804 7865 2743 2682 2362 2591 2591 2865
2 2 2 2 2 2 2 7. 2 Z 2 2 2 Z 2 2 2 2 2 2 2 2 2 2 2 2 2 2 Z 2
A8LA
2377 2 2499 2
2743 2 2347 2 2317 2 2499 2 2332 2
2560 Z 2408 Z ?43B Z 2301 Z 2469 2
2515 2
2499 2 2591 2
2177 2 41

Perennial ice and snow masses
COLUMBIA KIvER HEADKATERS
DEVT
BNBE UNBE BNBE BI .EE entE eNBE »Hbt 6I.BE bNBt 8HBE BSbE fcf.EE ijNBt at.tE tít\õl ÜNtíE ar.EE 6r.bE
WJ.
22 23 24 25 2b 27 ¿8 29 -3C 31 32 33 34 35 3t 37 3t! 39
LONCITUbE
v. H i V. 116 V. H i H 110. « 116 - H i h lit H lie h lili >• lit X lit Va 116 M 116 h 116 > 116 n 116 k 116 •< 116
4 1 . 5 4 0 . 5 4 0 . C 2 9 . 5 29 .5 2 8 . C 3 8 . 0 2 5 . 5 2 5 . C 2 5 . C 2 5 . 5 2 6 . 5 ¡a.) 29.0 25.5 25.5 2t.C 27.C
LAIUUUt
N N N H K K N H N N K H M K N N N
N
SI £1 il il 51 51 il 51 SI 51 il 51 51 il 51 51 51 51
4E.C 4E.C •4E.C At. C 4 S . 5 4 5 . C 4 4 . C -42.5 •42.C 4 1 . 5 41.C •4C.5 4 C . 5 4 1 . G •4C.C 2Î .5 3 t .5 2 6 . 5
C 1H.HH521557391 ULMI5223573B9 11UHM523257384 11UNH523B57340 11UI.H52365 7347 11UKH525157327 11UNHS25157314 HLNH5281572d9 11LNH528657273 11UM152B6572B6
G, UUKH52e257255 11LNH527057251 HLKh524957252 11UNH523857258 11LNH528157217 11UNH52B1571B9 11UNH527B5717C 111,^526757172
CRIENT ¿C AB
. SU Sw l SX SB > K t«
1 k X ' NW KW ' NW k , SU Sh 1 SW SW 1 NW NW ) M , w > fiu Kk . Nk N ! K N 1 Nk NH r Nx nw > Nn NK : N NW : NE NE
HIGH
2743 2835 2743 2957 2972 29B7 2896 2697 2835 7.635 2743 304B 2774 ZB39 Z835 J139 2713 2621
ELEVATIONS L.EX
2408 2515 2560 2591 2591 2377 2743 2545 2637 269Ã 2591 2179 243E 2560 2347 2637 2316 243 8
L.TL
24C8 2515 2560 2591 7591 2377 2743 2545 2637 269H 2591 217-» Z43B 7560 2347 2637 2316 243 tt
SNC1U
2605 2621
2499
2560 2682
2667 Z4.6Ï
2530 2698 2469
DATE
22 08 22 nu 22 08 22 OB 22 OS 22 08 22 C8 22 OB 22 OB 22 PB 22 PB 22 "8 22 " 8 22 08 22 PB 22 38 22 08 22 Ç8
66 66 66 66 66 66 66 66 66 6b 66 66 66 66 6b 6b 66 66
HfAN ELEVATION ACCU
2530 2713 286B 7B35 2743 2835 2819 2621 2774 2774 2713 2652 2591 2713 7621 2B19 2652 2530
Z 2 2 2 2 2 2 2 2 2 2 2 2 2 2 2 2 ?
A5LA .
2530 2 2591 2
2436 2
2245 2 2667 2
2469 2 2347 2
2438 2 2667 2 2406 2
42

Three pilot studies: the Rocky Mountains
WAPUTIK HCLNTAUS HOCK* M C U M A I N S tESTEkN CANADA A.D.STANLEY INLAND HATERS BRANCH OTTAWA 1967 - p . . - , 1 £
BOW RIVEfc hCACWATERS
1QIAL LEfiCTh ' klDTH ABLA EXP TUTAL
SURFACE AREA AAR DEPTH V0LUP6 EXP TOTAL ABLATION
TYPF,
5BAC 5BAC SÊAC 5BAC ÎBAC 5BAC 5BAC 5BAC 5UAL" 5BAC 5BAC 5SAC 5BAC 5BAG SBAC 5BAC 5EAC 5BAD SBAC 5ÍAC 5BAC
.58AC 5BAC ÍBAC 5BAD 5BAD 5BAB
2 3 •4 5
& 7 1 2 3 4 5 6 7 8 9
JO 11 12 13 14 15 16 17 IS 19 20 2L
. 2 1.3
1 .5 . 5
1.3 1.1
. 1
. 1
.3 .1 . 2
1.6
.1
. 4 3 .1 3 . 2 -
. 3
. 4
. 4 .
. 6
.a. 2 . 9 . Z . 7 3 . 2 1 .9
. 5 . . 4
1 . 6 . 6
1.0 .3
2 . 6 . 4 . 5
3 . 1 . 2 . 2 . 7 . 5 . 3
. 4 3 . L 3 . 2
. 3
. 4
. 4 . 6
.a 3 . 9 2 . 7 3 . 2 1 .9
.ï
. 4 1 .6
. 6 I.C
. 3 2 . 6
. 4 • i
3 . 1 . 2 . 2 . 7
.!> . 3
1.5
.a
. 2
. 2
. 4
. 4 1 . 2
1 .0 . 8 . 2
. 7
. 2
. 7
. 2
.1
. 5
. 3 4 4 . 3 0 2 .50
. 06
. O S
. 0 5
. 27
.31 5 . 9 0 Z . 9 0 4 . 9 0 1.50
. 2 5
. 1 2 1.50
. 1 4
.45
.06 2 . 0 0
.11
.27 5 . 1 0
. 06
.20
. 3 S
. 1 9
.06
. 3 4 4 . 3 0 2 .90
. 06
. O B . . 05
.27
.Jl 5 . 9 0 2 . 9 0 4 . 9 0 1 .50
. 2 5
. 12 1 .50
. 1 4
.45
.06 2 . 0 0
.11
. 2 7 5 . 1 0
. 0 6
.20
. 3 8
.19 . 0 6
2 2 2 2 2 2 2 2 . 2 •
2 Z 2 2 2 2 . 2 2 2 2 Z Z
z z z 2
z 2
. 3 4 . 5 9
2 2
1 .70 2 . 8 0
l .OO -
. 4 4
.06
. 0 9
. 0 2
. 0 6
. 5 2
. O B
Z 2 2
Z
2 2 2 2
Z
ion 92 79
100
ion 100 100
ion. 71 74 79 7L
100 100
66 100 100 10 0
95 BO 78 90
100 100
79 100 100
10 50 50 10 10 10 10 10 70 7 0 7P 50
in 10 25 10 10 10 2S 10 10
100
in 10 10 10 10
. 003
.215
.145
.001
.001
.001 .003 .003 .413 .203 .343 . C O S . 0 0 2 .001 . 0 C 4 .001 . 0 0 4 .001 . 050 .001 . 0 0 3 . 5 1 0 .001 . 0 0 2 . 0 0 4 . 0 0 2 • P O L
3 3 4 4 4 4 4 4 3 3 4 4 4 4 4 ' 4 4 4 4 4 4 3 4 4 4 4 4
60CO10 600010 520012 600010 600000 64001C. 640402 603312 52C412 503311 503012 530010 60C012 600010 600212 630000 600O10 600310 600210 640002 640002 523411 640000 630010 630002 640000 60001Z
Computer card, Waputik Mts., B o w River headwaters, North Saskatchewan River, Columbia River, Columbia River headwaters. (Note. For volume accuracy rating '4' read '3' and for '3' read '2'.)
NORTH SASKATChEkAN RIVER.
IDENT N O . TCTAL LENGTH. A3LA, EXP TOTAL
WIDTH SURFACE AREA AAR DEPTH VOLUME TYPE EXP TOTAL ABLATIO«
5CAC 5CAC 5CÍC 5DAC 5CAC 50AC 50AC 5DAC 5UAC 50AC 5CAC 5CAC 5CAC 5EAC 50AC 5CAC 5CAC 5CAC 5CAC 5CAC 50AC 5DAC 5CAC 5CAC 5CAC 5CAC 50AC 5 LAC SCAC 5DAC 5DAC 5CAC 5CAC 5DAC
COLUMBIA
I D E M
8NAB BNAB SNAb BNAB BNAB UNAS SNAB ENAB 6NA0 BNAB fcNAB BNAB SNAB SNAB 6NAB BNAB 8NAB BNAB BNAB BNAB BNAB SNAB SNAB BNAB 8NAB SNAB BNAB BNAB SNAB BNAB
14 IS 16 17 IS 19 20 ZL 22 23 24 25 26 27 28 29 30 31 22 23 24 25 26 27 SB 39 40 4L 42 43
1 Z 3 4
.1
3 . 3
.1
Í .0
1.5' . 2 . 8
.1
. 3
RIVER
N C .
a 9
10 11 12 13 14 15 16 17 IB 19 2(1 2L 22 23 24 25 26 27 2B 29 20 31 22 23 34 25 36 37
. 3
. 7
. 2
. 6
. 7 Í .C
. 3 1.3 1 . 0 . 4
. 5 . 5
4 . 3 . 3 . 3
1.7 1.5 1 .4
. 3
. 3
. 3
. 5
. 5 . 3 . 8
1.1 • 3
. 7 1 . 6
. 5
. 4
. 2
. 6
. 5
. 3 . 7 . 2 . 6 . 7
5 . 0 . 3
1 .3 l .C
. 4
. 5
. 9 4 . 3
. 3
. 3 1 . 7 1 .5 1 .4
. 3
. 3
. 8
. 5
. 5
. 3
. 8 1.1:
. 3
. 7 1 . 6
. 5 . 4 . 2 . 8 . 5
10TAL LENGTh ABLA
. 2
. 3
. 3
. 7
.1
. 2
. 4
. 3 1.5
.2
3 .9 . 4
1.1
. 6
. 2
3 . 7
EXP
.8 1 .2
.a 1.5
.3 l.C 2 . 5 l.C
.6 1.5 1.2
.b 1.7 4 .6 2 .2 7.C 2.1 l.C
. 6 2 . 9
. 3 2 . 4 1.1 1.4 7 .C 1.2 1.3
. 4 l.C l.C
TOTAL
. 8 1 .2
. 8 1.5
. 3 1.0 2 . 5 1 .0
. 6 1.5 1.3
. 6 1 .7 4 . 6 3 .2 7 .C 2.1 2 . 0
. 6 2 . 9
. 3 2 . 4 1.1 1.4 7 .0 1.3 1.3
. 4 1.0 l.C
. 2
. 3 1 .0
. 3 . 4 . 3
- .5
. 3
. 5
. 4
. 2
. 3
. 5
. 3
. 3
. 4
M D T K
. 4
1.5
. 6
. 2
. 3 1.0
1.0 . i
1.0
. 5
. 7
. 7
. 7
. 9
• 6
. 3
. 1 2
.31
. 06
. 1 2
. 1 6 1 2 . 6 0
. 6 2 2 . 2 0
. 4 2
. 1 2
. 3 9 . 3 4
4 . 5 0 . 1 4 . 0 9
1 .15 • 6(j
. 5 5
. 06
.08
. 1 7
. 3 6
. 3 4
. 0 8
. 1 7
.39
. 1 2
.23 1.10
.39
.45
. 1 4
. 2 2 . 1 4
. 1 2
.3L
. 06
. 1 2 .16
1 2 . 6 0 . 6 2
2 . 2 0 . 4 2 . 1 2 .39 . 3 4
4 . 5 0 . 1 4 . 09
1 .15 . 66 . 7 0 . 0 6 . 0 8 . 1 7 . 3 6 . 3 4 . 0 8 . 17 . 39 . 1 2 . 2 3
1.10 .39 .45 .14 .22 . 1 4
SURFACE EXP
.33
.30 . 49 . 86 . 3 0
1.80 2 .20 1.90
.45
.75
.36
. 1 4 1.19
12.10 1 70
20 .90 .78 . 4 2 .33
1.90 .05
2 .00 .59
2 .50 13.70
.59
. 3 6
. 16
. 4 2
. 47
TOIAL
. 3 3
. 3 0
.49 • 86 .30
1.80 2 .20 1.90
.45
.75
.36
.14 1.19
12.80 1.70
20 .90 .70 .42 .33
1.90 .05
2 .00 .59
2 .50 13 .70
. 59
. 36
.16
. 4 2
. 47
Z 2
z z 2 2 2 2 Z 2 Z Z Z Z Z Z 2 2 Z 2 •2 2 2 2 2 2 2 2 I 2 2 2 Z 2
. 0 3
. 0 5
3 .40
. 0 6
. 0 5
. 9 3
. 7 2
. 0 8
. 2 7
.11
.19
. 1 4
AREA
2 2 2 Z 2 2 2 2 2 2 2 2 2 2 2 2 2 2 2 2 2 2 2 2 2 2 2 2 2 2
2 Z
Z
Z
2
Z
Z Z 2
Z 2
2
ABLATION
. 06
. 0 8
. 09
.61
. 2 S
. 16
. 2 0
.20 3 .68
.09 4 . 4 0
. 09
. 9 4
. 44 . 0 6
3 .50
2 2
2 2 2 2 2
2 2 2 2 2
2
2 2
Z
75 «4
100 10n 100 73
ion 10O
86 10O
«7 10O
22 100 100
65 88 61
100 100 100
70 44
100 100 100 100 100
77 100 100 10O 100
1Q0
AAR
Bl 74
ion 100 100
95 73 85 66 73
100 100
82 72 94 79 BS
100 100
50 100
78 90
loo 74
lno ICO 100 100 100
10 10 10 10 10
150 25 25 10 10 10 10 70 10 10 50 25 25 10 10 10 10 10 10 10 10 10 10 25 10 10 10 10 10
DEPTH
10 10 10 25 10 25 25 25 10 25 10 10 25
100 25
150 25 10 10 25 10 25 25 10
150 25 10 10 10 10
. 001
. 0 0 3
.001
.001
. 0 0 2 1.890
4 4 4 4 4 4
. 0 1 5 4
. 0 5 5
. 0 0 4
. 001
. 0 0 4
. 003
. 3 1 5
.001
.001
.058
. 0 1 6
. 018
. 0 0 1
.001
. 0 0 2 . 0 0 4 . 003 . 0 0 1 . 0 0 2 . 0 0 4 . 0 0 1 . 0 0 2 . 2 7 5 . 0 0 4 . 0 0 4 .001 . 0 0 2 • OOL
VOLUME;
. 0 0 3
.003
.005
. 0 2 2
.003
.045
.055
. 048
. 0 0 4
. 0 1 9
. 0 0 4
.001
.003 1.280
. 0 0 4
3 .130
4 4 4 4 4 3 4 4 4 4 4 4 4 4 4 4 4 4 4 4 4 4 4 4 4 4 4
4 4 4 4 4 4 4 4 4 4 4 4 4 5 4 4
. 0 2 " -4
. 0 0 4
. 0 0 3
. 048
. O O L
.nil
. 015
. 250 2 .056
.015 . 0 0 4 .002 .004' • 0C5
4 4 4 4 4 4 4 3 4 4 4 4 4
64000Z 640012 600012 60001Z 630212 520411 600010 640011 630001 640002 630002 600200 53001L 630210 630010 53041O 630010 650011 600000 600000 &3000O 640000 630000 630000 630000 600010 630000 630010 640210 600210 600010 600010 600010 600010
TYPE
64C010 630010 630010 60C010 600010 630012 630012 600712 64C310 640010 600010 600010 630010 520012 60C010 520412 630010 600010 600200 633010 600010 633010 64C410 620210 52041Z 600010 630010 6001in 630010 600000
43
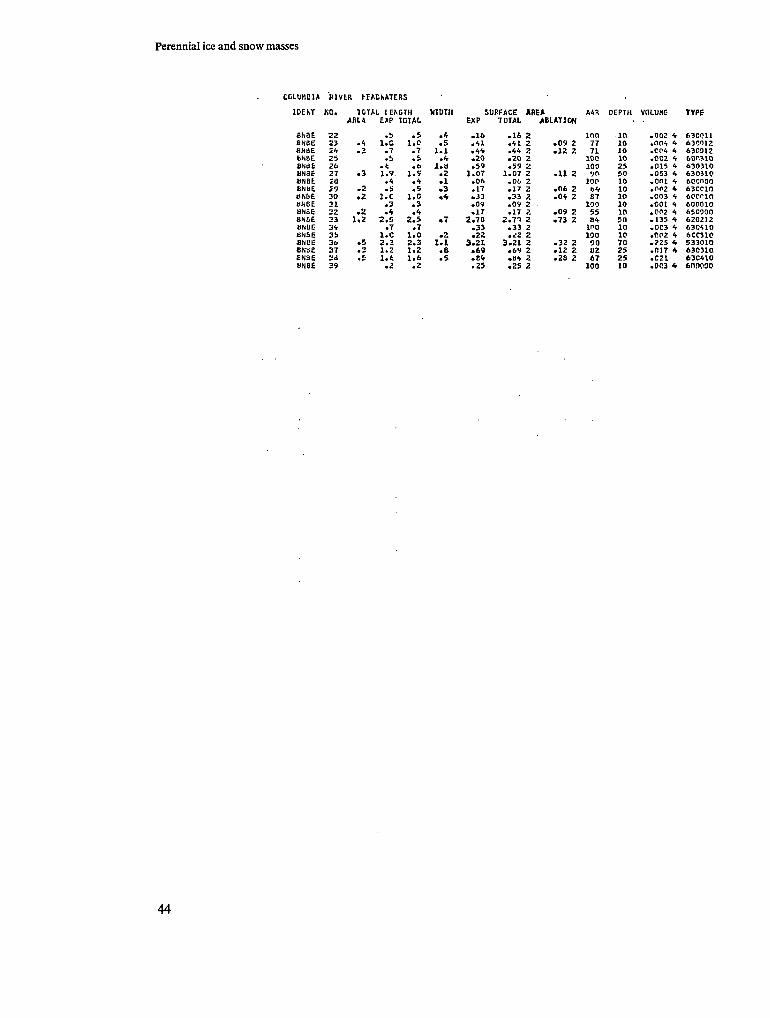
Perennial ice and snow masses
COLUMBIA RIVER KAChATERS
IDENT
8I,BE 8NBE 8NBE BNBE SNtlfc
BNBE UNBE 8NUE »NBE UNBE «NSE 8NBE UNBE UN5E BUCÉ 8NBE ÍNBE-BN6E
KC.
32 23 14 25 26 27
:u it 30 21 22 33 3 * 35 3t> 3T 3d 39
TOTAL IENGTH ABLA
.4
. 3
. 3
. 2 . 2
. 2 1.2
. 5
. 2
.5
E*P
. 5 l.S
. 7 .5
.t 1.9.
. 4
.5 ].C
. 3
. 4 3 . 5
. 7 l.C 2.3 l.Z 1.6
.2
TOUt.
. 5 1.0
. 7
. 5
. 6 1.9
. 4
.9 l.C
. 3
. 4 2 .5
. 7 1.0 2.3 1.2 1.6
. 2
WIDTH
. 4
. 5 1.1
. 4 l.a
. 2
.1
. 3
. 4
« * . 2
1.1
•a . 5
SUBFACE EXP
.16
.41
.44
.20
.59 1.07
.06
.17
.33
.09
.17 2.70
.33
.22 3.21
.69
.84
.25
TOTAL AREA
ABLATION
.16 2
.41
.44
.20
.59 1.07
.06
.17
.33
.09
.17 2.7T
.33
.¿2 3.21
.69 •B4 .25
2 2 2 2 2 2 2 -2 2 2 2 2 2 2 2 2 2
.09
.12
.11
.06
.04
.09
.73
.32
.12
.28
2 2
2
2 2
2 2
2 2 2
AAR
100 77 71
100 10 0 90
100 64 87
190 55 »4
1"0 10 0 90 82 67
100
DEPTH
10 10 10 10 25 50 10 10 10 10 10 50 10 10 70 25 25 10
V0LUH6
.002
.004
.004
.002
.015
.053
.001
.nP2 .003 .001 .002 .135 .003 .002 .225 .017 .021 .003
4 4 4 4 4 4 4 4 4 4 4 4 4 4 4 4
4
TYPE
630011 630012 630012 600310 630310 630310 60cnoo 63CC10 600rio 600010 650000 620212 630410 6CC310 533010 630310 630410 600000
44

Three pilot studies: the Rocky Mountains
State, Province or Region: Au3£Krf\ CAtOAbA
Mountain area:
Hydrologlcal basin:-1st order: fjtîi-SorJ Ali)£<
U n d order: SOUTH ÇASLATCHIUATI ClDEÄ
Illrd order: ¿ o u R-iveg.
IVth order: (goO i_A»u£
Glacier name:
Sources:-Map, title & No: H-EC-TO& L.AIUÍ
Compiled by: ^ e m e r f / o Y r of £fJ£B5/
Date: „ . V]bl
Scale: / ; -€0,000
Contour interval: l<ro ft.
Reliability: ± S o fL ,
Photographs : -
Type: VEKriCJlL. 36/(5ro AUL
Serial Np: A l^faíS- /IS2.
Date: < 3 a / ¿ - / 6 é
Remarks :
Literature:
Data compiled by: K . SEÏXjUICIC
Date & organisation: AOiJutr ' ^ 6 ^
Supervisor: ,4 . STAMi-«;/ , //\Ji.flM>* u/vr£)e£ &.ZMJCM
REMARKS (special geomorph-ologlcal features, abnormal characteristics, if international boundary, source information on' mean depth estimate, observations regarding snow line or equilibrium line from other years)
QuAciee. Li£$ "J ^ SVA.Li~
¡¡teitj Ô/VJ NCHÍTH rfitce or S.T. NICHOLAS f£hiC
Glacier number
Longitude ^ •* '* '•
Latitude ^ " ^
H T M il 1/ 1 Vi M H^^ • «$"•<? •$
Orientation: Accumulation area (8 pt. compass)
Ablation area (8 pt. compass)
Highest glacier elevation (m/a.s.l.)
Lowest glacier elevation: Exposed (m/a.s.l.)
Total (m/a.s.l.)
Elevation of snow line (m/a.s.l.) day
Date of snow line •—•—
Mean accumulation area elevation,weighted,(ra/a.s.l.)
•Accuracy rating (1-5)
Mean ablation area elevation, weighted,(m/a.s.l.)
•Accuracy rating (1-5)
Maximum length:Ablatlon area(km)incl.debris covered
Exposed (km)
Total (km)
Mean width of main ice body (km)
Surface area: Exposed (km2) . . .
Tntnl (km2) , . ,
•Accuracy rating (1-5)
Area of ablation (km ) >—1 . «.
•Accuracy rating (1-5)
Accumulation area ratio (per cent)
Mean depth (m)
•Estimated accuracy rating (1-5)
Classification and description (see Table 1) £_JrL
..•5.«.A,h«
1 • ' " • ^ ,
k , ° , - M - < °¡ .o.3,£,..0Í
.*.l.1 .J?.
. .//•
• ,s, .á.^.,3 ,?.
• •2 ..3 .^5". ¿>.
.A.¿..i.e.
A.S.! L,.
.. .íi¿.£.
• J . 3 , / , ? ,
c¿.
.J.¿.<f.é,
. 3.,
-2,
J. • ü k 3 •
• p . - 5 - ? -
• '..-if,
^ , . ...6. 6.
¿. •f.*.
. , , ^,0,
...0 .rt .3 .
O. O.O. 2,
•Accuracy ratings Area
1 Excellent 0-57. 2 Cood 5-107. 3 Fair 10-15%
Elevations 0-25 m 25-50 m 50-100 m
4 Acceptable 15-257. 100-200 m 5 Unreliable 257. > 200 m
Volume 0 - 107.
10 - 257. 25 - 507. 50 - 1007. > 1007.
F I G . 17. Glacier inventory data shee tfor Waputik Mts., Nelson River, South Saskatchewan River, B o w River, B o w Lake.
45

Perennial ice and s n o w masses
State, Province or Region: CAnoAV,A
Mountain area: g£U"lSH- cot-utf/S«3!
Hydrological basin:-1st order: cai.oH.6ifi fi-lú^R. U n d order: Ô L A E Ais ¿^y Ä n « €
Illrd order: £ / 3 Û N J O X E E JÉ.
IVth order:
Glacier name:
Sources:-Map, title & No: IVSTfiffA uftrHX
Compiled by: >>EPAi2rr/E>or OF
a t e ' iiu.
Scale: / : 5o, BTTTJ
Contour interval: «TO ¿"k-
Reliability: £ •&> ft
Photographs : -
Type: \JEX.T\cJ*L. 3.c¡ C T O ASL.
Serial No: fi, ;fbt"S- /á í
Date: ¿¿¡¿/lb
Remarks :
Literature:
Data compiled by: tC- Ze£,qu>icJL
Daté & organisation: fjb -
Supervisor: A - £rfi*>uz~/ I N U W J > J wrtreiej StfoOcM
REMARKS (special geomorph-ologlcal features, abnormal characteristics, if international boundary, source information on mean depth 'estimate, observations re-
fardlng snow line or equi-ibriura line from other years)
Vht qLfituen. £ A «£<-£.-
r*a, OF n>h^M pit ML,
Regional and basin identification •—•—'—'—
Glacier number
Longitude ^ lf •' '
Latitude ^ ¿~^-
Î tf .fiifi
, .-a-.*-,
L.°. tf-,ö...n.
_.°A.?,.,Q
„ T M ,/ ,/ .D.iJ.li.S.a.3 .1.Î.Ï.Î.S-,»,
Orientation: Accumulation area (8 pt. compass)
Ablation area (8 pt. compass)
Highest glacier elevation (m/a.s.l.)
Lowest glacier elevation: Exposed (m/a.s.l.)
Total (m/a.s.l.)
Elevation of snow line (m/a.s.l.)
day
Date of snow line e2_i¿ Mean accumulation area elevatibn,welghted,(m/a.s.l.)
•Accuracy rating (1-5)
Mean ablation area elevation, weighted,(m/a.s.l.)
•Accuracy rating (1-5)
Maximum length:Ablation area(km)incl.debris covered
Exposed (km)
Total (km)
Mean width of main ice body (km)
Surface area: Exposed ( k m) , , ,
Tntal iltm2} . . .
•Accuracy rating (1-5)
Aren of ablation (km ) i. i ..
•Accuracy rating (1-5)
Accumulation area ratio (per cent)
Mean depth (ra)
Vnliimi» (kmJ) of iCP i, i i ,
•Estimated accuracy rating (1-5)
Classification and description (see Table 1) i c w
•Accuracy ratings Area Elevations Volume
1 Excellent 0-57. 0-25 m 0 - 107. 2 Good 5-107. 25-50 m 10 - 257. 3 Fair 10-157. 50-100 m 25 - 507. 4 Acceptable 15-257. 100-200 m 50 - 1007. 5 Unreliable > 257. > 200 m > 1007.
• . U
. .a .J. 7.4.3.
.¿.S. (,.ô.
.^.f.é.O
.J.C.J. 1. mo. jr.
! .»it, J..
i-J? i %fi P i fl i
i=L
.3,¿r,7,/,
¿ J.
?•
• _ ^ . t 2 j
^L.¿ . ...It. t.
-¿—..Jj^,
*3u
. . .. ¡.-i..
..A
• f, Í,
i 1 • / .Of
...O.O.V.
£ O. n. I.*-.
FIG. 18. Glacier inventory data sheet for Waputik Mts., Columbia River. Blaeberry River, Ebon Creek.
46

c.
The M o u n t Everest region in eastern Nepal (28° N . , 87° E. ) (Figs. 19 and 20) was chosen as a test area for the glacier inventory for several reasons : (a) it contains a multitude of glacier types, some c o m m o n and some unusual; (b) maps of different scale and quality are available; (c) the author's field observations and familiarity with some of the glaciers in the area (Müller, 1959) permitted an evaluation of the inventory data; and (d) there is a practical importance in glacierized mountains near heavily populated areas for hydrological, climatological and other reasons.
Physiography
This test area (Fig. 21) covers the highest mountain group in the eastern Himalayas and, for that matter, in the world. It contains three mountains with an elevation of more than 8,000 m , including M t . Everest (8,848 m ) , and some 75 peaks of more than 6,500 m . The lowest point lies at 3,500 m but the main valley bottoms are at an elevation of 4 to 5,000 m .
There are only two S . - N . gaps in this part of the mountain chain, the Nangpa L a (5,716 m ) and the L h o L a (6,006 m ) ; the former serves occasionally as a trade route between India and China. The neighbouring hills to the north, edging the Tibetan Plateau (mean height about 5,000 m ) , are of markedly different nature, whereas to the south of the area, though elevations are somewhat lower,
A pilot study for an inventory of the glaciers in the Eastern Himalayas
by Fritz Müller, McGill University, Montreal (Canada)
the character is essentially the same, with, however, m a n y more, and deeper, S . - N . gaps, produced by the south-oriented drainage system.
Comprehensive accounts of the geology of eastern Nepal have been given attention by Lombard (1958), Hagen (1959) and others.
There is little climatic data for the area. The only weather station, operating continuously since 1957 and intermittently before that, is located at N a m c h e Bazar at 3,440 m , too low to be representative for the main valleys and the glacierized heights. For these there are only some sporadic weather data collections from expedition stations which operated for short periods. At a station established in 1956 at 5,300 m above sea level near the K h u m b u Glacier the precipitation total for an 8 months' period (including the whole of the monsoon season) was found to amount to only 39 c m of water, testifying to an unexpectedly great aridity in the Everest region. This finding is in good agreement with (a) the small size and low surface velocity of the glaciers and (b) the vast quantities of debris covering most of the ablation areas, forming huge lateral and terminal moraines 'and blanketing the lower slopes and valley floors.
Three former glacier positions are evidenced in the area: 1. A well-developed, sub-recent stage in which the
valley glacier termini were very close to the present positions. The mass loss of the recent decades led mainly to a thinning of the larger glaciers and only the smaller, usually steeper
Inventory of glaciers in the M o u n t Everest region
47

FIG
. 19.
Drainage basins in N
epal.
48

Three pilot studies: the Eastern Himalayas
•.(¿/.••Third order basin A—Four th order basin
| Study area
27°30N —
86°30'E
• f
J 1 \ 87900E
Jo f °
10 Km. 10 Miles
F I G . 20. Drainage basins in the M t . Everest region.
49

Perennial ice and snow masses
T ' :::>•• 1 * - « W T i r 1 < 5 S K Í Í - "
, T V - » ^ ^ ^ w - ^ ^ k w
^ ^ • ^ • • • • • • ^ ^ ^ ^ ^ A -jè^^^^^
\ ~ A) ^ T \ ~ - - . ° * r
v V Í \ ¿ J Í . " <» # V . \^ /J ^ ^ V» ï'î- V44
rftÄÄ'' JL^y '^''^i33c^¿' f^^y\ \ *2T¥\ >L«32 W -
y^%^)J ^^•:::^_4i VH^P Jc\ \ (á&C
) ftp " > / yj.»
v is / * |ii"^lff|o"^^> J ' * **
f**'"w£*"I/íl*
s^y-f-
^ ^ ^ ^ u v •% T »
\ *"** r ^
•^^•'' ^ T J C H O OYU^Y " 1 JT8I5J ^ y I
^JXJ? } - ^ T / ^ « Û ^ ^ H V ' A /> i -a ¿ ^ •*
S :! ï •-' "i ' . ' / / . * '^r Î ' " i'J ' — o
\ 4B«/«I4 / / 49ÍJ3
/ .'— i • L • •
_ / * / «•Xîfc. '¡5- -SÍ.''-1- ï l îV ••"/',' 2 Í '^ \ ï . ^ ^ 1 1 . ^--^ ^ : / 2 4 F \ . ' f U J %. <i . • m • — / _ ^ ^ ^
' / i_^\J-rf" i -• /:;r^ ";,• ¡ ."•/i r ri?. •>••*. » °\ ; T W ï». , - . . . • sér\«io
SI«]
" * \
23*JL
', ! t _ \ » ff"»«"/ j \ < A * \ ' . /V"? 1 °o':/ 'V*ST»«>UNT EVEREST
. ^ T ï*8 W S » \ Im \ W II ! m ^ ^ >£' ml V,33*,v T „• m* iN f
v* 7 eC\ \ D V \ | /-'/ >Ajf8 w'i \5V\3si .¿„.f <f 1 V s TNi5 V ' S r A JX ¡; ' 'i (A/Mv)*» 1 Vi ^ - V « >. ^ \ 3 4 » ^ . A Î Î N / * V K !.' . ' / / T" .' X 38 /.f/ • - /
\->» 591
\ x
Im
Y**
\
^ l w \ C ) r— »49 150 A A /•J-" X
1 Y^^ '•^-;c:\ f ¿ _ i x O v / >—^ *% L'^
r« 1 ^ "n> y ^ A X / / \ S4\5Ï _32 JU.I f . 1 •
2B*N
86 8 40 'C a7o0Û'E SOURCES
• ^ „ ^ 1. Khumbu Himol (Nepal) 1:50,000 Entensive glaciers . . —
Small glaciers •
Mountain peaks over 6500 metres A
1
) 0 1 2 3 4 5 6 7 9 9 10 Mites Research Scheme-Nepal Himalaya, 1965
• • - • • ' • • • • • • Z.The Mount tveresl Region 1; 100,000 Royal Geographical Society. I96I
0 2 4 6 S 10 12 14 16 Kilometres
F I G . 21. T h e glaciers of the M o u n t Everest region.
50

Three pilot studies: the Eastern Himalayas
Table 7. Drainage basins with glaciers (RGS) of the Mount Everest region
Basin
Likhu Khola Beni-Solu Khola Lumding Khola Nangpa (Bhote Kosi)3
Dudh Kosi3
Imja Khola3
Kyangshar Khola Hinku (Inukhu) Khola Hunku (Hongu) Khola Sangkhua Khola Chhoyang Khola Iswa Khola Barun Khola Karma Chu Kharta Chu Lang Chu Ngo Chu Dzakar (Rong) Chu Gyabrag (Kyetrak) Chu
1. N E =• Nepal. 2. A " Ganges. 3. Basins included in study. 4 . T B = Tibet.
Political division
N E 1
N E N E N E NE NE NE N E N E NE NE NE N E TB1
TB TB TB TB TB
on 1 : 100,000 map
Order of drainage basins
1st 2nd 3rd 4th
A 2 4 A A A A A A A A A A A A A A A A A A
4 4 4 4 4 4 4 4 4 4 4 4 4 4 4 4 4 4
4 A 5 A 5 B 5 C 5 D 5 E 5 F 5 G 5 H 6 A 6 B 6 C 6 D 6 A 6 B 6 C 6 D 6 E 6 F
N o . of glaciers
per basin
5 3
12 68 35 61
5 20 40
2 3 5
37 29 20 1
29 61 13
Table 8. Some statistics for the glaciers in the three basins of the pilot study
Subject
Total area of basin (km2)
Number of glaciers, total Number of glaciers > 5 k m in length Number of glaciers < 1 k m in length
Glacierized area (km2) Glacierized area in % basin area Number of glaciers > 1.0 km2
Largest glacier: length (km) area (km2) volume (km3)
Total ice volume (km3)
M e a n elevation of: accu. area (m) snow line (m) abla. area (m)
Nangpo (Bhotc Kosi)
452
68
5
29
106 of
23
20
19.2 30.5
3.0
6.0
5 740 5 540 5 350
Dudh Kosi
279
35
2
13
100
36
9
21.0 65.3 10.5
12.1
5 690 5 530 5 380
Imja Khola
440
61
8
15
154
35
23
18.2 33.8
3.4
9.8
5 860 5 580 5 320
ones have detached themselves noticeably from the '1850' moraines.
2. A prehistoric glacier position (Daun ?) left well-preserved large-size moraines some few kilometres downstream from the present termini.
3. Isolated remnants show an even older, somewhat more extensive, glacier position but even this does not alter the impression that the M t . Everest region has not supported large glaciers during at least the latter part of the Pleistocene.
The present glacier in the test area
Before it was possible to label the 164 glaciers in the three drainage basins to the south-west of M t . Everest it was found necessary first to apply the guide's identification system to the whole of Nepal (Fig. 19), then to subdivide the second-order basins further into third- and fourth-order units as shown in Figure 20 and Table 7. The glaciers of the three basins, numbered clockwise, are presented in Figure 21, the 'index m a p ' . Table 8 gives some statistics on these basins and glaciers.
The majority of the glaciers are very small: only 7 have a surface area of more than 10 k m 2 , while 68 per cent of them measure less than 1 k m 2 . Only one glacier, the N g o z u m p a , occupies any considerable length of a main valley. S o m e 30 glaciers could be called valley glaciers, but most of them lie in small side valleys and only 6 reach the floor of a main valley. A large number of the med ium and smaller sized ice masses occupy either cirques or form ice aprons and hanging glaciers on the steep and expansive mountain flanks.
The full inventory data for the 167 glaciers are included with this paper in the form of computer print-out sheets reduced to page size (Figs. 22 to 27). For each glacier an individual data sheet was compiled, two of which (C20 and E23) are shown in Figures 25 and 26.
Source material
Four different sets of maps and photographs were used for this inventory. They are:
51

Perennial ice and snow masses
1. Schneider (1957) : Mahalangur Himal (1 :25,000), contour interval 20 m . Covering almost all of the K h u m b u - I m j a basin; particulars of this m a p are described by E . Schneider (1959). Schneider very kindly provided original-size copies of his high-quality 1955 terrestrial photogrammetry photographs for the entire area of this m a p .
2. Schneider (1965): K h u m b u Himal (1 : 50,000), contour interval 40 m . Based on 1955 to 1963 terrestrial photogrammetry; excellent quality; covers all three test basins. The measurements for most data sheets were extracted from this m a p .
3. Royal Geographical Society (1961): the M o u n t Everest Region (1 : 100,000), contour interval 100 m . Compiled from various published and unpublished sources; strongly varying quality. The Royal Geographical Society m a d e available unpublished photographs and original large-scale m a p s from m a n y expeditions.
4. Survey of India (1930): Nepal-Tibet (1 in. to 4 miles), contour interval 1,000 ft. Indicates only the major glaciers in approximate form lines.
In addition a large number of unpublished expedition photographs, both single and panoramic, were provided by the Swiss Foundation for Alpine Research, Zürich.
Problems of obtaining the data
Area delineation A comparison of the photographs and the m a p of a glacier frequently illustrated the arbitrary decisions forced on both the cartographer and the inventory maker when delineating the perennial ice mass. The difficulties are numerous in both the accumulation and the ablation areas: separating seasonal snow from perennial ice; connecting hanging glaciers (feeding ice avalanches) to a glacier body lower separated by a large rock wall; distinguishing between debris-covered ice and morainic deposits, etc. The area measurements were carried out with a dot planimeter and a random grid overlay; the measuring error is less than 5 per cent for the glaciers larger than 0.5 k m 2 , but increases considerably for the smaller ones.
Snow-line assessment For only a few glaciers were field observations of the snow line available. It was found impossible to extract reliable snow-line data from the photographs except in a few cases. Therefore, it was decided to follow the suggestions m a d e by von Wiss-m a n (1959, p. 48-55) for establishing an approximate elevation of the climatic firn line. Usually a combination was used of the value gained with the Höfer method and those obtained by studying the changes in configuration of the contour unes and by establishing the highest elevation of m o r ainic material on the surface. It is self-evident that m a n y individual values for the firn-line elevation and subsequently the m e a n elevations for the accumulation and ablation areas are in considerable error.
Mean ice-depth estimates There are no measurements of ice thickness for any of the glaciers in the area. Table 9, listing estimated depth values for different types and sizes of glaciers,
Table 9. Mean glacier-depth estimates
Type
1 C o m p o u n d basins
1 . . „ , . J C o m p o u n d basins Valley glacier <
, Simple basins
Mountain glacier, cirque
Glacieret and snow-fields
1. Individual adjustments needed.
Area (km«)
1-10 10-20 20-50 50-100
1-5 5-10
10-20 20-50 50-100
1-5 5-10
10-20
0-1 1-2 2-5 5-10
10-20
0-0.5 0.5-1
1-2
Depth (m)
50l
70 100 1001
301
60 80
120 1201
40 75
1001
20 30 50 90
120
10 15 25
'.
52

Three pilot studies: the Eastern Himalayas
was inferred from a critical analysis of all glacier-depth measurements ; k n o w n to the author for the Rarakoram Mts . and the Alps. Table 9 was not rigidly adhered to; for about half of the cases individual adjustments were made . ; The assessments of the firn line and the estimates of the m e a n ice-depth values, as well as some of the area delineations, were carried out by the author..
References
H Ä G E N ; T . 1959. In: Hàgen, et al. (eds.). Mount Everest, p. 11-110. Zurich, Orell Füssli Verlag.
L O M B A R D , A . 1958. U n itinéraire géologique dans l'Est du Népal (Massif du Mont Everest). Mémoires de la Société
:'. helvétique des sciences'.naturelles (Zürich), vol. 82, no. 1, 107 p. and plates.
M Ü L L E R , F . 1959. Eight months of glacier and soiLrèsearch in the Mount Everest Region. The mountain world, 1958-59.
• Zürich, Swiss Foundation for Alpine Research, 29-p.
Conclusion ,
The ; difficulties encountered in making a glacier inventory of a selected area near M o u n t Everest are: (a).those inherent in the mapping of glacierized areas ; (b) those generally met in the assessment of the firn line; and (c) those due to the lack or scarcity of glacier-depth data. The suggestions m a d e by the guide were easily followed and led to results for an acceptable accuracy, and thus of practical and scientific meaning. .
S C H N E I D E R , E . 1959. In: T . Hagen, et al. (eds.). Mount : Everest, p. 219-34. Zürich, Orell Füssli, Verlag.
W I S S M A N N , H . von. 1959. Die heutige Vergletscherung und •. Schneegrenze in Hochasien. Abhandlungen der Mathema
tisch-Naturwissenschaftlichen Klasse, Jg. 1959, no. 14, . p. 48-55. Mainz, Verlag der Akademie der Wissenschaften
und der Literatur.
53

MOUNT EVEREST REGICH EASTERN NEFAL HIHALAVAS F.MUELLER .MCGILL UNIVERSITY MONTREAL 196T
KANGFO TSANGPO IBhCTE KOSH
ICENT N O . LONGITUDE LATITUDE
FIG. 22. Computer card, Mount Everest region, Nangpa (Bhote Kosi), Dudh Kosi.
ORIENT ELEVATIONS
AC AB HIGH L.EX L.TL
MEAN ELEVATION
ACCU ABLA
54
NEA45C NEA45C NEA45C NEA45C NEA45C NEA45C NEA4£C NEA45C NEA45C NEA45C NEA45C NEA45C NEA45C NEA45C NEA45C NEA45C NEÍ45C NEA45C NEÍ45C Utf.SC NEA45C NEA45C ^EA4SC NEA45C NEA45C NEA45C f>EA4SC NEA45C N E / 4 5 C NEA45C NEÍ45C NEA45C NEA45C NEA45C NEA45C NEÍ45C NEÍ45C NEA45C NEA45C NEA45C NEA45C NEA45C NEA45C NEA45C NEA45C NEA45C NEA45C NEA45C NEA45C NEA45C NEA45C NEA45C NEA4SC NEA4EC
' NEA4£C NEA4EC NEA4EC N£A4£C NEA45C NEA4EC NEA4£C NEA4EC NEA45C NEA45C NEA45C NEA45C NEA45C NEA4EC NEA45C
0 1 2 3 4 5 c 7
a 9
10 11 12 13 14 15 16 17 IB 19 2C 21 22 23 24 25 26 27 2B 29 3C 31 32 33 34 35 36 37 3e 39 4C 41 42 43 44 45 46 47 4B 49 50 51 52 52 54 55 56. 57 58 59 6C 61 62 62 64 65 66 67 6B
CUCH KCSI
ICENT N O .
E E E E E E E E E E E E E E E E E E E E E E E E E E
E E E E E E E E E E E E E E E E Ë E E E E E b E E E E E E E E E E E E E E E E E E E
86 e6 86 E6 86 86 E6 86 £b 86 E6 86 E6 86 86 E6 E6 86 86 E6 86 86 E6 E6 86 86
86 86 86 86 at 8£ 86 86 Ot 86 86 86 B6 86 86 at E6 66 86 86 86 86 86 E6 £6 E6 E6 E6 86 86 86 86 E6 66 Uli 86 EC B6 86 86 86 86
2 9 . 2 39.7 38 .5 28 .0 26 .0 24 .0 22.9 2 3 . 2 23 .6 34 .9 25 .5 25.1 2 4 . 9 24 .0 23 .2 2 3 . 7 2 3 . 6 24 .0 24 .9 25 .9 2 3 . 5 22 .5 22 .2 22 . C 22.1 2 1 . 1
22 .1 2 2 . 5 33 .3 2 3 . 7 2 3 . 9 2 4 . e 3 5 . 0 2 4 . 2 24 .5 3 6 . 5 2 6 . 4 3 5 . B 25 .6 26 .3 25 .5 26 .2 26.1 26 .8 2 7 . 7 29 .4 2 9 . 3 29 .1 2 8 . 7 2 6 . 3 28 .5 £8 .5 2 8 . 2 28 .B 40 .0 4 0 . 0 40.1 40 .1 3 9 . 9 4 C . 0 40 .0 4 0 . 5 4 0 . 7 4 0 . B 4 0 . 7 4 0 . 2 25.4 4 1 . S
LONGITUDE
K U K N H N N N N N N N N N N N N N N
n N N N N N N
N N N N N N N H H H N N N N N N N N N N N H N N N N N N N N H N N N N N N N N N H N
27 27 27 27 27 27 27 27 27 27 27 27 27 27 27 27 27 27 27 27 27 27 27 27 27 27
28 28 2B 28 2E 27 28 26 28 26 2b 2E 2b 2b 26 2E 26 28 28 28 28 26 2.Z 27 27 27 27 27 27 27 27 27 21 27 27 27 27 27 27 27 27 27
4 7 . 5 4 7 . a 4 7 . S 4 E . Ï 4 E . 3 4 9 . 0 4 5 . B 4 9 . 9 5 1 . 0 5 C . 5 5 C . 5 51.1 5 1 . 7 52 .0 52 .3 52 .3 £ 4 . 0 £4 .5 £5 .0 5£.l 5 5 . 5 51 .3 £6 .5 5 E . 4 S E . 7 55 .0
C C . G C C . 6 C C . 5 C C . 4 C C . 2 55 .5 C E . O C 2 . 5 C4 .1 C 3 . 3 C 2 . S C 2 . 1 Cl. B C l .4 C l .9 C l .9 C 2 . 5 C 2 . 6 C 2 . C C 2 . 2 C l .6 C C . Ç CC.7. 55 .9 £ 5 . 2 5 5 . C 56 .5 £f.l 55 .B 55 .5 54 .« £ 4 . 4 55.1 £ 3 . 7 £3 .3 52 .8 £2 .4 5 1 . S 5 1 . 5 5 3 . 3 5 4 . 0 5 3 . 7
LATITUDE
NEA450
NEA45C
NEA45C
NEA45U
NEA45C
NEA45C
NEA45D
NEÍ45D
NEA45U
NEÍ45C
NEA45D
NEÍ45C
NEA450
NEA45D
NEA45C
NEA45D
NEA45D
NEA45C
NEA45C
NEA4ED
NEA45Q
NEA45C
NEA45L
NEA45C
NEA45D
NEA45C
NEJ45L-
NEA45C
NEA45C
NEA45C
NEA45D
NEA45C
NEA45C
NEA45C
NEA4EC
NEA45C
NEA45D
86 41.7
86 40.B
86 40.5
E6 40.5
86 41.4
86 41.1
86 40.2
EÉ 39.2
Et 29.3
86 29.0
86 39.1
e6 39.5
86 29.2
86 29.4
E6 29.8
86 29.9
86 40.2
86 29.7
E6 42.2
E6 42.4
E6 44.C et 44.6 86 44.7
£6 44.8
66 45.0
66 44.9
eu 44.0 86 43.£
86 43.C
86 45.£
£6 45.7
86 45.0
8Í 45.£
86 46.2
66 46.4
N 27 53.7
N 77 £4.3
M 27 45.B
N 27 55.7
N 27 55.2
N 27 56.1
N 27 56.5
N 27 57.C
N 27 57.6
N 27 55.5
N 27 55.9
N JE CC.L
N 2e CC.3
N 28 CC.9
N 28 Cl.2
N 26 Cl.7
N 2Í C2.2
N 2e C2.6
N 26 C1.0
N 2B 02.5
N 28 CC.5
N 26 CC.6
N 26 CC.3
N 2e CCI
N 27 £5.5
N 27 5E.6
N 27 £E.e
N 27 55.0
N 27 59.3
N 27 £5.8
N 27 55.2
N 2J 5£.C
N 27 £4.4
H 27 £3.5 N 27 52.9
U.T.H.
E NE
N NE NE NE NE
E SE
S E
NE E
NE NE
E SE SE
E SE E E
NE E E-E
S SE St N
NE N S
SE SE SU SW
w w E N
Nb S
SE S
SW
W N S
NW W
NW S W
SU W W
H W W H W W
SE E W
E NE N
NE
E E E
SE S
SE NE
E E E E
SE SE
S SE NE
E NE
E E E
S SE
S N N N S
SE E
SM H h W E
NE liE
S SE
S SU
W W N S
Nw W
NW Sw
M W
Si) ri W
SW H M
SW W U E E W
6093 5400 6167 6120 6500 6718 5673 6215 6940 6180 6060 6650 6010 6940 6640 6040 6293 6263 6000 5700 5880 6601 6200 568" 5620 6320
5990 6716 5565 5720 5777 5530 7352 6777 6590 5700 6276 5640 5410 5480 5560 5650 6296 6040 7352 5580 5420 5927 5977 5977 5660 574U 5855 5855 5906 5800 6186 6166 5700 5680 5845 5853 5560 5590 5673
sauo 6186 5593
5010 4640 4700 4620 5460 4470 4960 4970 5160 5120 5040 4900 5400 4490 4960 5100 5910 5260 5160 5280 5040 5130 5300 5410 5390 5240
5390 5280 5340 5270 5420 5300 5120 5330 5310 5260 5350 5310 5220 5310 5330 5450 5360 5480 5210 5230 5120 5390 5240 5600 5320 5240 5190 5440 5240 5340 5020 5360 5100 5210 5200 5350 5340 5120 5270 5360 5350 5260
5010 4640 4700 4620 5460 430O
4900 492? 5160 5120 5040 490" 5400 4410 4960 5100 5910 5260
5160 5260. 4S50 4850 5300 5410 5390 516"
5370 5020 5340 5270 542C 530C 4500 5330 5310 5260 5350 5310 5220 5310 5330 5450 5380 5480 4840 5230 5120 539" 5240 5600 5320 5240 5190 5440 5240 5340 502* 5360 SlOf 6210 5200 5350 5340 510O 5270 538" 5350
5260
535t> 5040 5400 5250 5460 5450 5450 5550 5750 5600
5550 5500 5500 5500 5500 5560 5640 568r 5620 5610 5560 5400 5500 5560 5520 5630
5600 5600 5560 54"Ç 555n 6450 5800 6000 5650 5500 5700 5500 5400 5450 5460 55 20 5ÍI00 5il00 5750 5500 5500 5ü4C 5440 5H00 550C 5500 5400 5500 540C 535C 5300 550C 5450 5560 5520 55"0 540 C 538C 5380 5640 5640 5-40
5650 5200 5720 5600 6000 5920 5560 5BC0 6300 5890 5840 5920 5670 6200 6000 5700 5940 5760
5690 5680 5760 5800 5640 5630 5570 6000
5660 6160 5570 5560 5660 5490 620" 6?."0 6060 5500 5940 5570 5405 5465 5500 5565 6P80 5680 6320 5540
5730 5600 5860 5590 5600 5800 5670 5640 566? 5700 5780
5760 5670 5640 5460 552" 5530 5690 57C0 5470
3 3 3 3 3 3 2 3 5 2 2 3 3 3 3 3 3 4 3 3 3 3 3 2 2
ï 3 3 1 ? 2 2 4 3 3 3 3 2 3 2 2 3 3 3 4 3
2 3 2 2 2 2 2 3 2 3 3
3 2 2 2 2 2 2 3 1
5200 2 4641 2 51*0 3 4920 3
4960 3 5160 3 5240 2 5470 3 5320 2 5240 3 5190 3 5450 2 41140 ? 5370 2 5360 2 547n 2 5520 3 5490 3 5440 3 5150 3 5200 3 5360 2 5495 2 5455 2 5560 3
5440 3 531" 3 5450 2 5335 2 5490 2 5380 2 5160 3 5600 3 5560 2 5310 2 5'90 ? 5390 2
5230 2 5595 ? 5410 2 5490 2 5520 3 5670 ? 5240 3 5360 2 522" 3 5520 2 5160 2 5710 2 5400 ? 5410 2 5120 2 552.0 2
5240 7 5400 2 5740 2 5430 2 5220 2
535" 2 530" 7. 543" 2 5370 2 5740 2 5340 7 5540 2 5520 2 5400 l
CRIENT AC
SE N E S E
NE N S S E
SE E
NE S
E N
SE S
SE NW
S
sw w s s s s w
NW W
NW NW
S Nu
A3
E N F S E
NE N
SE E E E E
NE S S E N
SE S
NE Nu Sw SW
SW W S
SE S
SW
w w
NH Sw
s NW
HIGH
5593 5620 5760 6073 5980 5660 5900 5560 5670 5977 5780 5740 5500 SB20 5480 5540 5530
6500 6153 6066 5913 5913 5880
5760 7020 5865 6103 6089 6089 5840 6440 5600 6367 6542 5330
ELEVATIONS L .EX
5080 5240 5780 5160 5120 ¿940 5140 5300 51B0 5300 5340 5420 5300 554C 5360 5310 5350
53 20 5010 5330 5240 5590 5460
5360 5260 5180 5390 5480 5270 5080 5020 5180 5120 5100 5090
L.TL
5060 51"0 5280 5140 5060 4940 5140 5300 5180 5300 5340 5420 5300 5540 5360 5310 535"
5320 4690 5330 5240 5590 5480
5360 500C 5160 5390 54B0 5270 5000 5020 5160 4680 4600
5090
DATE MFAN SHOW
5360 5360 5400 5600 5530 5440 53B0 54 3C 55"0 553C 556" 6560 5400 566C 5560 5500 547r
573C 558" 5670 5480 5750 5650
5660 5670 544C 565<-5600 5500 5400 5500 540" 54 50 5500 5350
ElFVATIflN ACCU
5420. 546C 5680 5760 5800 5500 5520 5500
5550 5600 5610 5600 5420 5740
5520 5490
5850 6400 592" 5600 5640 5720
57O0 61O0
5570 5800 5940 5560 5490 5640
5460 6000 6000 5450
7. 3 2 2 3 3 3 7. 3 3 3 2 3 3
3 2
3 3 2 2 2 3
3 3 3 3 3 3 7 3 3 3 3 3
ABLA
5240 2 £310 2 544'. 2 5370 2 524" 2 5160 3 5270 2 539" 1
5360 2 5350 2 5480 7 6520 2 5350 2 5600 3 5540 2
5450 2 5410 2
5600 2 5130 3 5390 2 5360 2 5650 Z 5550 3
5430 2 5360 3 5760 2 5520 2 5720 2 5420 2 5760 7 5240 2 5300 2 5140 2 5120 2 5240 2

IlOUNT EVEREST RÉGION CASTERN NEPAL HIMALAYAS F.PUELLER MCGILL UNIVERSITY MONTREAL 1967
MANCPÜ TSANÜPO ÍOhOIE KCSII
ÎOEHI
NEA4£C NEA45C1
NEA45C NEA4 5C NtA45C NEA45C NEA45C HEA45C NEA45C NEA45C NEA45C HEA41C NEA4SC. NEA4SC Hb A 4 SC N L A 4 5 C N C A 4 Í C N E A 4 5 C N E A 4 5 C N E A 4 5 C N E A 4 S C N E A 4 S C NtAl íC N E A 4 Í C NEA4SC NEA45C NEA45C NEA4SC NEA45C HLA45C NEA45C NEA41C NEA45C NEA45C NEA45C NEA45C NEA4ÏC NEA45C NEA45C N6A45C NEA45C NEA45C NEA45C NEA45C NEA45C NEA45C NEA45C HEA45C NEA45C NEA45C NEA4EC NEA4EC NEA45C NEA4ÎC NEA45C NEA45C NEA45C NEA45C NEA45C NEA4ÍC NEA4SC NEA4 5C NEA45C NEA45C NEA4SC NEA45C NEA45C NEA4EC NEA4EC
NU.
0 1 2 3 4 5 6 7 d 9
10 11 12 13 14 15 16 17 IB 19 20 21 22 23 24 25 26 27 21} 29 30 31 22 23 34 25 36 27 2!) 39 40 4£ 42 43 44 45 46 47 4H 49 50 51 52 53 54 55 56 57
tu 59 £0 £1 £2 63 £4 £5 66 ¿7 £8
Dl'DH KCSI
TOTAL LENGTH
AULA
C.3 0.4 0.5 0.9
4.1 1.1 1.7 1.6 C.5 0.7 1.1 C.2 3.3 C.5 C.9 0.6 1.6 2.2 1.2 3.a £.2 1.0 C.6 C.4 4.C
0.? 7.5 C.9 0.5 C.2 C.3
18.1 C.7 1.5 C.9 0.5 0.4 C.6 0.4 0.4 0.3 C.6 1.9 9.1 l.l 0.4 0.3 0.7 C.2 0.3 C.3 0.2 0.3 C.b U.4 C U 0.1 0.4 C.6 C.6 0.2 0.1 C.t 0.1 0.4 1.5 C.2
EXP
1.3 C.7 C.9 1.3 C.7 4.5 1.3 2.2 2.6 1.2 1.5 1.7 C.4 3.6 2.0 1.4 2.2 2.4 3.1 1.6 3.6 3.1 1.8 1.3 C.7 2.3
1.9 2.e 1.1 C.3 C.5 C.B 6.5 1.3 2.C 1.4 l.C 0.5 C.6 C.5 C.5 0.5 C.9 2.0 S.4 1.2 C.4 C.5 1.7 C.5 0.6-0.6 0.5 C.7 1.0 1.1 1.4 0.8 C.4 1.0 C.9 C.5 C.2 1.0 C.4 C.9 1.8 C.5
TOTAL
1.3 0.7 0.9 1.3 017 5.9 1.4 2.4 2.6 1.2 1.5 1.7 C.4 4.7 2.0 1.4 2.2 2.4 3.1 1.6 4.8 6.6 1.8 1.3 0.7 4.3
1.2 8.1 1.1
ce 0.5 0.8
1 9 . 2 1.3 2.1 1.6 1.0 0.5 C.6 0.5 0.5 0.5 0.9 2.0
1 1 . Q 1.2 C.4
• 0 . 5 1.7 0.5 C.6 0.6 0.5 0.7 1.0 1.1 1.4 C.8 0.4 1.0 0,9 0.5 0.2 l.l C.4 C.9 1.8 0.5
klUTK
0. 0,
0,
0, 0.
0,
0.
0. 0. 0.
• 2 .4
.5
.4
.4
.3
.4
.5
.2
.2
0.6
0.3 0.4-
0.2 0.1 0.2 0, .2
0.3 0.6 0.3 0.3 0.2
0.3 0. .2
0.1
SURFACE EXP
1.57 0 .31 1.23 0 .53 0 . 4 4 5 . 7 4 0 . 3 T 1.10 3 . 7 7 C . 7 4 C .81 2 .30 0 .03 3 . 2 0 1.07 1.16 1.18 1.65 1.05 0.97 1.26 5.25 1.10 0.42 p.l6 1.96
0.45 1.91 0.15 0.18 0.11 0.45
17.24 0.44 0.61 0.50 0.31 0.10 0.13 0.06 0.11 0.13 0.26 0.73 9.83 0.32 0.40 0.10 0.63 0.06 0.13 0.10 0.11 0.23 0.29 0.36 0.52 0.06 0.05 0.24 0.11 0.13 0.06 0.06 0.15 0.45 1.29 0.05
TOTAL
1.57 0.31 1.23 0.53 0.44 6.37 0.37 1.35 4.01 0.74 0.31 2.30 n.08 3.86 1.07 1.16 1.10 1.65 1.05 0.97 1.92 7.23 1.10 0.42 0.1B 2.98
0.45 4.92 0.15 0.18 0.11 0.45
30.49 0.44 0.61 0.53 0.31
o.m 0.13 0.06 0.11 0.13 0.26 0.73
15.35 0.32 0.40 0.10 0.63 0.06 0.13 0.10 0.11 0.23 0.29 0.36 0.52 0.06 0.05 0.24 0.11 0.13 0.06 0.06 o.ts 0 . 4 5 1.29 0 . 0 5
AREA
3 4 3 4 4 3 4 3 3 3 3 3 5 3 3 3 3 3 3 3 3 3 3 3 4 3
4 3 5 4 5 h 2 4 4 4 3 4 4 4 4 4 4 3 3 3 3 4 3 4 3 4 3 3 3 3 3 4 4 4 4 4 4 4 3 3 3 4
ABLATION
0 . 3 7 0 .19 0 . 5 8 0 . 3 4
4 . 5 4 0 . 2 3 0 .61 2 . 1 4 0 . 3 7 0 . 5 5 1 .34 0 . 0 5 2 . 1 2 0 . 3 2 0 . 5 6 0 .66 1.33 0 . 6 8 0 . 8 7 1.39 5 .35 0 .53 0 . 2 3 0 . 1 0 2 . 2 0
0 . 3 4 4 . 6 7 0 . 1 3 0 .06 0 . 0 5 0 .16
19 .28 0 .21 0 . 4 7 0 . 4 2 0 . 1 8 0 . 0 8 0 . 1 2 0 . 0 5 0 .10 0 .06 0 .11 0 .61 9 . a s 0.31 0 . 4 0 0 .06 0 . 3 2 0 . 0 3 0 .11 0 .06 0 . 0 8 0 . 0 8 0 . 0 8 n .11 0 . 3 4 0 . 0 5 0 . 0 5 0 .19 0 . 0 5 0 . 0 6 0 . 0 2 0 . 0 3 0 . 0 6 0 . 1 0 0 . 8 2 0 . 0 2
3 3 4 4
3 4 3 3 3 3 3 4 3 3 3 3 3 4 3 3 3 3 3 4 3
3 3 4 4 5 4 2 3 3 3 3 4 4 4 4 4 4 3 ? 4 4 4 3 4 3 4 4 3 3 3 3 4 3 3 4 4 4 4 3 4 3 4
AAR
76 39 55 36
100 29 38 55 47 50 32 42 38 45 70 52 27 19 35 10 32 26 52 45 44 26
24 5
13 67 55 32 37 52 23 21 42 20
8 17
9 54 58 16 36
3 0
40 49 50 ¿" 40 27 65 72 69 35 17 0
21 55 54 67 50 60 78 36 60
DEPTH
25 15 25 17 13 60 IS 22 40 16 16 25 10 30 20 22 22 25 22 20 35 50 22 20 15 30
18 45 15 15 10 18
100 15 20 20 12 12 ia 12 12 12 15 20 65 15 15 10 20
8 12 12 10 13 13 14 IS 10 10 20 10 12 10 10 12 15 25 10
VOLUME
0 . 0 3 9 0 . 0 0 5 0 . 0 2 2 n . C 0 9 P .006 0 . 3 8 2 0 .006 0.031* 0 .160 C . 0 1 2 O . 0 1 3 0 .058 0 .C01 0 . 1 1 6 0.(121 O . 0 2 6 0 .026 0.041 0 . 0 2 3 0 .019 0 . 0 6 7 C . 3 6 2 O . 0 2 4 0 . 0 0 8 0 . 0 0 3 P . 089
O . o r 8 0 .221 0 . 0 C 2 0 . 0 0 3
n.roi 3 . 0 0 8 3 .049 O . 0 P 7 0 . 0 1 2
P.Oil 0 . 9 0 4 0 .001 n . 0 0 2 0 .001 O.OIM 0 . 0 0 2 P . 004 0 . 0 1 5 0 .993 O . 0 C 5 0 . 0 0 6 O.001 fl.013 0.001 0 . 0 0 2 0 .001
n.ooi 0.003 0.004 0.005 0.009 0.0C1 0.001 0.005 0.001 0.002 0.001 0.001 0.002 O.008 0.032 O.OOL
3 4 3 4 4 3 4 3 3 3 3 3 4 3 3 3 3 3 J 3 3 3 3 3 3 3
3 3 4 4 5 4 3 4 4 3 3 4 4 4 4 4 4 3 2 3 3 4 3 4 3 4 4 3 4 3 3 4 3 3 4 4 4 4 3 3 3 4
TYPE
60C211 640021 600411 640421 603210 600012 60011O 50CO22 60C011 600211 600011 640411 00022O 520312 60P411 6O002I 600021 640021 6OC0U 640021 530322 51012L 600022 64C120 64C021 525122
640021 52012L 600121 600010 600020 6001 IO 510112 600210 645022 640122 600O12 640021 64C121 640021 64V20 64012O 640421 645121 515122 600121 60CI2I 6P0210 640111 6O021O 600011 600011 700000 •640011 6nO0U 600011 602311 6C021O. 640020 640021 70021O 600210 600210 600310 640022 600210. 640121 600210
FIG. 23. Computer card, ' :
Mount Everest region, Nângpa 1 (Bhote Kosi), Dudh Kosi.
JDENT
NEA45D NEA45D NEA450 NEA45C NEA45D N6A45D NEA4SD NEA45D NEA4S0 NEA4E0 NEA45D NEA45U NEA45C NEA45D NEA45U NEA45U NEA450 NEA450 NEA450 NEA45D NEA450 NEA450 NEA45D NEA45D NEA450 NEA450 NEA45D NEA450 NEA4S0 NEA45D NEA45D NEA45D NEA450 NEA45C NEA450 NEA4SD NEA45D
NU.
1 2 3 4 5 6 7 8 91
10 11 12 13 14 15 16 17 18 19 20 21 22 23 24 25 26 27 28 29 30 31 22 33 24 35 36 27
TOTAL LENGTH ABLA
0.5 C.4 0.4 2.2 C.7 1.0 1.2 C.4 O.E 1.7 1.1 0.6 0.3 C.l C.5 1.7 0.2
1.4 1 7 . 4 1.1 C.7 0.4 C.6
0.5 9.9 1.4 0.7 0.3 C.4 1.0 l.C 0.3 3.C 2.1 0.7
EXP
C.8 C.6 0.6 2.7 C.8 1.1 1.6 C.6 1.6 1.9 1.6 1.0 C.4 C.6 C.5 1.5 C.4
2.0 2.5 1.7 1.5 C.7 l.l
C.6 e.5 1.8 1.2 l.C C.6 1.1 1.6 0.3 1.6 1.2 C.7
TOTAL
0.8 0.3 0.6 2.8 1.0 1.1 1.6 0.6 1.6 1.9 1.6 1.0 0.4 0.6 0.5 1.9 0.4
2.C 2 1 . C
1.7 1.5 0.7 l.l
0.6 1 C . 7
1.8 1.2 1.0 0.6 1.3 1.6 0.3 3.5 2.8 0.7
K10TH
0.3 0.3 0.1 0.6 0.2
0.1 0.3
0.3 0.3
0.1 0.1
1.0
O.I
0.5 0.4 0.3
0.4 O.S O.L
SURFACE EXP
0 .25 0 . 2 2 O . U 1 .64 0 .03 0 .41 1.14 0 .06 0 . 4 2 1 .08 0 .63 0 .33 0 . 1 6 0 .09 O . U 0 . 9 4 0 . C 6
1.25 4 6 . 5 0
0 . 7 0 0 .88 0 . 1 4 0 . 2 0
0 . 1 4 9 .81 0.81 0 .65 0 .28 0 . 2 2 0 .45 1.12 0 .12 1.14-1 .12 0 .18
TOTAL
0 .25 0 .25 0 .11 l.ai O . U 0 . 4 7 1.22 0 .06 0 .45 1.08 0 .63 0 .33 0 . 1 6 0 .09 O . U 0 .94 0 ,06
1.25 65 .35
0 .70 O . B B 0 . 1 4 0 .20
0 .14 14 .17 0 .86 0 . 6 5 0 .23 0 . 2 2 0 .50 1.12 0 . 1 2 2 . 3 7 2 . 3 4 O . U
ARCA
3 3 3 2 4 4 2 4 3 4 3 4 3 4 4 3 3
3' 2 3 3 4 4
4 2 3 2 3 3 3 2 3 3 3 3
ABLATION
0 . 1 6 O . U 0 . 0 6 1.05 0 .08 0 . 3 4 1.03 0 .06 0 . 2 7 0 . 7 3 0 . 3 9 0 . 1 7 O . U 0 . 0 2 O . U 0 . 7 2 0 .03
0 . 8 7 2 C . 6 7
0 . 3 4 0 . 4 7 0 .09 0 . 1 2
O . U 9 . 1 0 0 . 4 8 0 . 3 0 0 . 1 2 0 .06 0 . 3 4 0 . 4 5 0 . 0 5 1.64 1.61 0 . 1 2
3 3 3 2 3 4 2 4 2 3 3 3 3 4
t 2 3
3 2 3 3 3 4
4 2 2 2 3 3 2 2 3 2 2 3
AAK
36 56 46 42 27 28 16 0
40 32 38 49 31
sa 0
23 50
30 57 51 47 36 40
21 36 45 53 57 73 32 60 58 31 31 33
DEPTH
15 15 10 30 10 15 30 10 15 25 15 13 10 8
10 20 10
20 160 20 20 12 12
12 SO 20 15 12 12 16 23 10 35 35 12
VOLUHE
0 . 0 0 4 0 .004 O . 0 0 1 0 . 0 5 4 0 .001 0 . 0 C 7 0 . 0 3 7 0 .001 0 . C 0 7 0 . 0 2 7 0 .009 0 . 0 0 4 P . 0 0 2 A . 0 0 1 0.001 0 .019 0 .001
0 . 0 2 5 10.456 0 . 0 1 4 0 .018 0 .002 0 .002
0 .002 1.134 0 . C 1 8 0 .010 0 .003 0 .003 0 .008 0 .026 0 .001 0 .083 0 .082 0 . 0 0 2
3 3 3 3 4 4 3 4 3 4 3 4 3 4 4 3 3
3 2 3 3 4 4
4 2 3 3 3 4 3 3 3 3 3 3
TYPE
600020 64C02O 640020 530021 600421 640021 640121 650021 600421 60012L 600111 60C011 640021 650220 64(1021 640121 POOOOl
64C011 510112 600410 600111 600111 600421
000121 525112 530011 6C0011 600210 600210 600421 640011 600O2O 520122 532122 600020
55
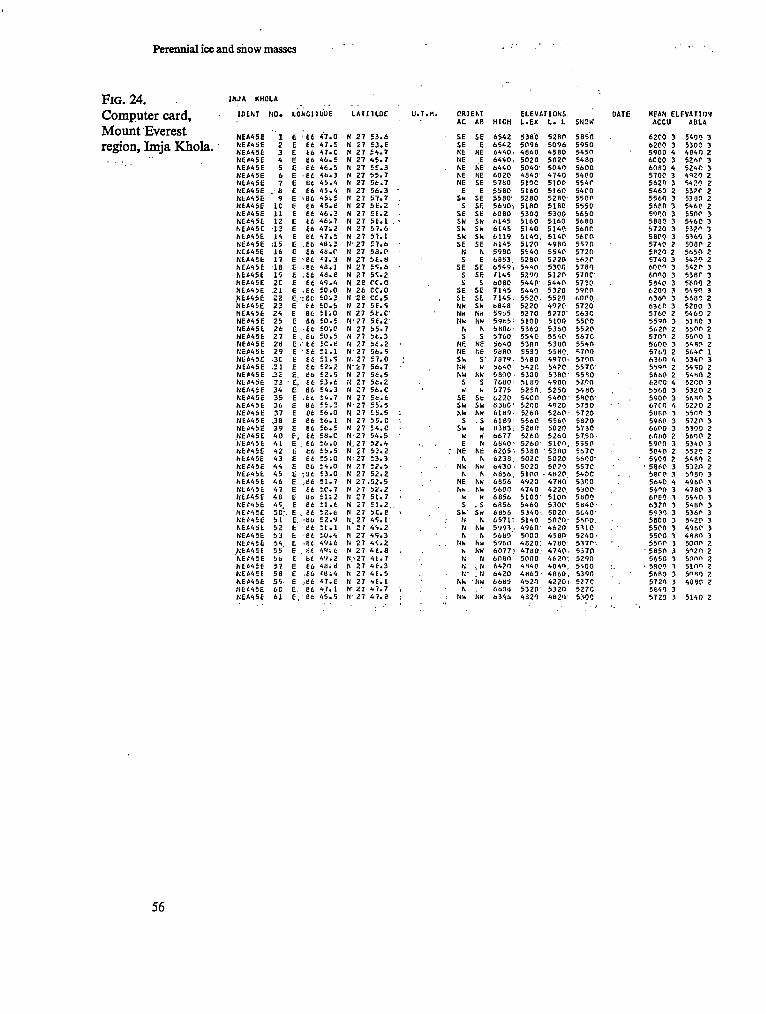
Perennial ice and show masses
F I G . 24. Computer card, Mount Everest region, Imja Khola.
HJA KHOLA
I D E M
NEA45E NEÍ45E
N E * 4 5 E
NEÍ45E
NEÍ45E
NEÍ45E
NEA45E
NEA45E
NfcA45E
NEA45E
NEÍ45E
NEÍ45E
NEÍ45E
NEÍ45E
NEA45E
NEÍ45E
NEA4EE
NEÍ45E
NEÍ45E
NEÍ45E
NEA45E
NE445E
NEA45E NEA45E
NEÍ45E
NEA45E
NEA45E
NEÍ45E
NEÍ45E
NEÍ45E
NEA45E
NEA45E
N E / 4 5 E
NEA4EE
NEA45E
NE445E
NEÍ45E
NEÍ4 5E
NEÍ45E
NEÍ45E
N E M 5 E
NEÍ45E
NEA45E
NEÍ45E
NEÍ45E
NEA45E
NEÍ4SE
NEÍ45E
NEÍ46E
NEÍ4EE
NEÍ4EE
NEÍ4SE
NEA45E
NEÍ4EE
,NtA4£E
N E / 4 E E
NEA4EE
NEÍ4EE
NEÍ45E
/ I t M E E
NEA45E
MO.
1 2 2
4
5
6
7
. 8
9
LC
11 12
13
14
ilS
16
17 la
19
2C
.21
22
23
24
25
26
27
2d
29
• 3 C
.21
J32
32
34
35
36
37
J O
39
40
41
42
43
44
45
46
47
4B
49
50:.
51
52
53
54.
55
56
57
58
59
6C
61
LONGITUDE
Ë
E
E
E
E
E
E
E
E
E
E
E
E
E
E
E
E
E
E
E
e E •
E
E
E
E.
E
E •
E
E
E
E.
E.
E
E
E
E
E
E
f,
E
Ë
E
E
E
E
E
E
E
E .
E.
E
E
E
E
E
E
E
E
E.
E.
•et
E6
E6
86
Et
et
Bt
E6
>86
E6
66
E6
E6
Bt
.É6
E6
•et
.66
• Et
Et
.E6
J E t
it
66
86
Et
. Eü
Et
E6
E6
E6
86
Et
66
.le.
66
66
66
E6
E6
. t ' 66
E6
66
;'J6
/86
E6
80
e6
. Et '86
• et
•et
.et
, «t BÍ
tú • eu
...et
et
•et
4 7 . 0
4 7 . 5
47 .C
4 6 . 5
46 .5
46 .3
4 5 . 4
4 5 . 4
4 5 . £
«5 .6
4 6 . 3
4 6 , 7
4 7 . 2
47 .5
4 8 . :
46. r
»7 .3
48.1
46 .E
49 .4
50 .0
E0i3
S O . 5 £1.0
£0 .5
50 .0
50 .5
Ec.e
51.1
£1 .9
E2¿2
£2 .5
53 .6
54 .3
£ 4 . 7
£5 .3
56 .0
£6.1
56 .5
5 B . C
£6 .0
£5 .5
£5iO
£4 .0
£3 .0
£ 1 . 7
E C . 7
E1-.2
£1 .6
52 .6
£2 .9
£1.1
50 .4 4 9 ; 6
49 it
4 9 . 2
48 ¿d
<6i4
47 .E
4 7 . 1
4 5 . 5
L A T I H O C
N 27
N 27
N 27
N 27
N 27
N 27
N 27
N 27
N 27
H 27
N 27
M 27
N 27
N 27
M - 2 7
N 27
N 27
N 27
N 27
N 26
N . 26
N 28
H 27
H 27
N - 2 7
N 27
N 27
H 27
N - 2 7
N. 27
N i !
N 27
H 27
N 27
N 27
N 27
N 27
H 27
N 27
N 27
N . 2 7
N 27
N 27
N 27
N 27
N 27
N 27
N 27
N 27
N 27
K 27
It 2 7
N 27
N 27
N 27
M.. 27
N 27
N 27
N 27
Ir 27
Il 27
£3 .6
E 3 . E £ 4 . 7
4 5 . 7
5 E . 3
5 5 . 7
5 t .7
56 .3
5 7 . 7
5 Ë . 2
E E . 2
5E .1
51 .6
57.1
£7 .6
£ 8 . 0
5 t .H
£9 .6
59 .2
roc C C . O
C C . 5
5 E . 9
5 6 . C
5 E . 2
5 5 . 7
56 .3
5 t .2
5 6 . 9
5 7 .0
5 6 . 7
56 .5
56 .2
5 6 . C
£6 .6
£ 5 . 5 £5 .5
5 5 . C
£ 4 . 0
5 4 . 5
5 2 . 4
53 .2
£3 .3
52 .5
52 .2
.52 .5
5 2 . 2
5 1 . 7
51 .2
5 C . 6
4 9 . r
4 9 . 2
4 9 . 3
4 ' . . 2 4 1 . 8
4 t .7
4 E . 3
4 E . 5
•>£ . ! 4 7 . 7
4 7 . 8
C R I E M
AC
SE
SE
NE
NE
NE
NE
NE
E Su
S
SE
SH
SU
SX
SE
N
S
SE
S
S
SE
St
NU
Nu NW
N
S
NE
NE
SU
NW
NU S
w
SE
su NW
S
SU W
E
NE
N
NU
N
NE
Ni.
h
S
S W
M
H
N
NW
h
N
N
N-
Nu N
Nu
AB
SE
E NE
E
NE
.NE
SE
E
SE
SE
SE
Sh
SX
SW
SE
N
E
SE
SE
S
SE
SE
Sh
NU
NU
N
S
NE
NE
S '
H
NW
S
h
SE
SU NH
. S
h
H
N
NE
N
Nu
N
Nu NU
W
. S
Su
N
NU
N
Nu
NU
N
-. N . N
•NU
NU
HIGH
6542 6542
6440.
64401
6440
6020
5760
5560
5580-
5690,
6080
6145
6145
6119
6145
5980
6853.
6549,
7145
608C
7145
7145
UB48
59o5
5965 '
5806
5760
5640
5880
7879.
5640
5 8 0 ? .
7680 '
5775
6220
83BC:
616.9-
6169 '
B363:
6677
6 6 4 0 ' 6205 -,
6238.
6 4 3 0 '
6856 , 6856
5600 6856
6856
6656
6571-,
5993 ,
5660
59611
6077 ; 6060
6420
6420
6685 tiOOll
6346
ELEVATIONS
L .EX
5380
5096
4860
5020
5040-
4840-
510C
5160
5260
5160
5300 5160
5140
5140.
5120
5540
52B0
5440
5290
5440' 5440
5520.
5220
5270
5100
5360
5540 5380
5530
5460
6420
5330
5180
5250
5400
5200
5260
5560 '
5260
5260
5260'
5380
502C
5020
5100
4920
4740
5100-
5460
5340-
5140
4960 '
5000
4820:
4780 ;
5000
4640
4H60-
4520
53 20'
4820
L . L
5280
5096
4580
5020
5040
4740
5100
5160 5280
5180
5300 5160
5140
5140
4980
5540
5220
5300 5120
5440
5320
5520
4920
5270-
5100
5360
5540
53BO
55H0.
4970 .
5420
5360
4980
5250
5400
4920
5260
5560
50 20
5260
5100.
•5360
502II
5020
• 4B20
4780
4220
510O
530O
5020
5020-
4620
4560
4780 474p ,
4620 :
4840,
4660 .
42?0i
5320
46 2 T
DATE MEAN
SNOW
5850
5950 5450
5480
5600
5400
5540
5400 5500
5550
5650
5680
5600
5600
5570
5720
5620
5780
570C
5730 590O
6000
5720
563C
5500
5520
567C
5540-
"¡700
5700
557C
55BQ 57,00 '
54 60
5800'
5750
5720
5820 5730
57.50-
5550
567C
5600"
557C 540C
530O
530C
5800
5B40-
5Í.40-5400,
5310
5240 ' 5170-,
5J70
5290
5400 : .
5390
527C 527 C
5300
ELEVATION
ACCU
62C0
6200
5900
6C00
6060
5700 5620
5460
5560
5660
590O
5880
5720
5800
5740
5820
5740
600O
6000
5840
6200 6360
6360
5760
5590
5620
5700
5600
5760 6360
559"
5660
62C0
5660
5900
67C0
5860
5960
6600
6060
5900
5840
• 5900
' 5960
5800
5640
54"0
6060 6320
5930
5800
5500
5500 5500
• 5650
5650
• 5800
5660
5720
5640
5720
3
3
4
3
4
3
3
2
3
3
3
3
3
3
?
2
3
3
3
3 3
3
3
2
3
Z
2
3
2
4
2
2
4
3
3
4
3
3
3
2
3
2
2
3
3
4
3
3
3
3
3
3
3
3
3
3
3
3
3
3
3
ABLA
5400 3
5300 3
4640 2 526r 3
5240 3
49J0 2
5420 2
5320 2 5380 2
5460 2 5500 3
5460 3
£32" 3
5360 3
508O 2
5650 2
5420 2
5420 3 5360 3
5600 2
5490 3
5680 2
5280 3
5460 2
5180 3
5500 2
5Í.O0 1
54 60 2
5640 1
5340 3
5490 2
5460 2
52CO 3
5320 2
5681 3
5220 2 5500 3
5720 3
5300 2
5600 2
6340 3
5520 2
5480 2
532/1 2
5030 3 4960 3
4780 3
5440 3
5480 3
5360 3 5420 3
4960 3 46H0 3
5000 2
5020 2 500O 2
5 1 0 1 •>_
5180 ?.
4850 2
5140 2
56

JHJA KHULA
Three pilot studies: the Eastern Himalayas
I D E M
NEA45E NEA45E NEA4ÍE MEARSE NEA45E NEA4SE NEA45E NEA45E NEA45E NEA45E NEA4ÍE NEA45E NEA45E N E A « ; E NEA45E NEA45E NEA45E KEA«5E NEA45E NEA45E NEA45E NEA45E NEA45L NEA4SE NEA45E «EA45E NEA45E HtA4£E «LA45Ë NEA45E NEA45E NEA4ÍE «EA45E MEARSE «EA45C NEA45E HEA45E NEA45E NEA45E ÍIEA45E NEA45E NEA45E NLA4ÍE HEA45E «EA45E (VEA45E NSA456 NEA45L NEA45E NEA451Í NEA45E NEA45E NEA41E NEA45E ACA4ÍE HEA4ÍE NEA45E NEA4SE M E A < , ; C NEA45E NEA45E
M O .
1 2 3 4 5 6 7 8 9
10 11 12 13 14 15 ]6 17 IS 19 20 21 22 23 lh 25 26 27
ia 29 20 21 22 33 24 25 26 27
3a 29 40 41 42 4J 44 45 46 47 4H 49 50 51 52 S3 54 55 50 57 53 59
to 61
TOTAL LENGTH ADLA
0.Í 1.1 2 .7 1.0 0 .4 1.2 C i C . 5 1.1 1.7 0 .5 0 . 7 0 .5 C . 7 2 . 3 0 . 2 4 . 9 1.9 5 .5 C . 6 2.1
c.a li.l
0 .7 1.6 0 . 2 C . 6 C . 2 0.1 1.2 C . 4 C . 4 4 . 4 0 . 6 C . 5 Y . 2 C . 7 C . 2 f . 2
c.a 4 . C 0 . 4 C . 6 1.6 4 . 8 2 .2 2 .7 1.1 1.7 3 .4 2 . 4 2 . 3 1.7 C . 6 1.1 1.1 C . 7
o.n 2 . 3
C . 9
EXP
1.1 1.7 1.5 1.5
c.e C E C . 8 C . 6 1.2 2 . 2 1.1 l.C
c.a 1.2 2 . 2 C . 6 4 . 6 1.1 3 .5 l.C 1.7 1.8
IC.7 1.1 2 .2 0 . 6 C . E C . 3 C 4 2 . 4 C . 5 C . 7 2 .5 C . 6 C . 7 3 . 5 1.1 1.1 5.2 1.4 2 .1
c.e l.C 2 . 5 1.8 1.4 1.5 1.5 1.1 2 .3 1.9 1.3
c.a i.l 1.6 C . 5 1.3 1.7 2 .5 C S 1.6
TOTAL
1.1 1.7 3 . 3 1.5 C . 8 1.5 C . 8 C . 6 1.2 2 . 2 1.1 1.0
ce 1.2 3 . 5 0 . 6 6 . 7 2 . 2 6 . C l.C 3 . C 1.8
18.2 1.1 2 . 2 0 . 6 C . 8 0 .3 C . 4 7 .8 0 . 5 0 . 7 6.1 0 . 6 C . 7
a.s 1.1 1.1
11 .2 1.4 4 . 4 C . 8 1.0 2 . 5 5 . 6 3 .3 2 . 9 1.9 2 . 3 4 . 6 2 .6 2 . 6 2 . 2 1.3 l.a 1.6 1.3 1 .7 3 .1 0 . 9 1.6
ri'lOTH SURFACE AREA
0 . 4
0.1 0.3
0 .1 0 . 4 0 . 4
0 . 4
1.1
0 .9 0 .3 0 .5
0 . 7
0 . 3
0 .3
0 . 4
0 .4
1 .0
0 .6
0 .3 0 .2
0 . 6 0 .8 0 . 3
0 .3 0 .5
0 . 4 0 . 2 0 . 2 0 . 3 0 . 2 0 .3 0 . 4
EXP
0 .27 0 .58 C.81 0 .55 0 .16 0.28 0 .19 0.11 0 .44 1.37 0 .37 0.42 0.62 0.53 0 .66 0 .14 5.0Ó 0.39 3.85 0.48 0 .67 0 .62
25.41 0 .63 1.11 0.31 0.22 0 .17 0.19 2.53 0.11 0 .17 2.61 0 .22 0 .36 6 .93 1.17 0 .43
11.61 1.29 2 .44 0 .16 0.48 3.17 5.39 1.12 0 .44 1.12 0.41 3.25 5.18 0 .66 0.39 0.28 0 .75 0.39 0 .53 0 .52 2.26 0.52 0.78
TOTAL
0 . 2 7 0 . 5 8 1.54 0 . 5 5 0 .16 0 .48 0 .19 0 .11 0 . 4 4 1.37 0 . 3 7 0 . 4 2 0 .62 0 . 5 8 1.69 0 . 1 4 8 .20 0 .92 8 .98 0 .48 1.39 0 .62
33 .79 0 .63 1.11 0.31 0 .22 0 . 1 7 0 . 1 9 5 .95 0.11 0 . 1 7 5 .09 0 . 2 7 0 . 3 6
11.61 1.17 0 .43
19 .87 1.29 4 . 6 2 0 .16 0 . 4 8 3 .17 7.11 2 . 3 4 0 .92 1.12 0 . 7 2 5 .78 5 .18 1.66 0 . 8 4 0 .33 0 . 7 8 0 .73 0 . 5 3 0 . 5 2 2 .53 0 . 5 2
o.ai
3 2 2 3 4 3 3 3 2 3 3 3 3 3 3 4 2 4 2 2 3 3 2 3 2 3 3 3 3 2 3 3 2 3 3 2 ' 2 2 2 2 3 3 3 2 2 3 3 3 3 3 3 3 3 3 3 3 2 3 3 4 3
ABLATION
0 .08 4 0 .19 2 1.31 2 0 . 3 4 3 0 .04 4 0 .37 3 0.11 2 0 .06 3 0 .39 2 0.89 2 0 .17 3 0 .25 3 0 .33 3 0 . 3 C 3 0 .99 2 0.03 4 5 .45 2 0 .73 3 5.45 2 0 .19 2 1.11 2 0 .33 2
12.25 2 0.31 2 0 .64 3 0.19 2 0.16 2 0 .12 2 0 .94 3 4 .37 2 0.09 2 0.11 2 3 .12 2 0.19 3 0.19 3 7 .36 2 0 .55 2 0 .14 2
1C.99 2 0 .37 2 3 .04 2 0 .08 3 0 .28 2 2 .66 2 3.15 2 1.56 2 0 .78 2 0 .75 2 0 .52 2 3.73 2 2 .76 2 1.30 3 0 .59 2 0 .27 2 0 .48 2 0 .55 2 0 .16 3 0 .25 2 1.42 2
0.41 3
AAR 0EPTH VOLUME TYPE
70 67 15 38 75 30 42 46 11 35 54 40 47 48 42 79 34 21 39 60 20 47 64 51 42 39 27 29 80 25 18 35 39 30 47 37 53 67 45 71 34 50 42 16 56 33 15 33 23 35 47 22 30 18 39 25 It) 52 44
100 49
15 20 40 18 15 20 18 18 20 40 16 16 18 IB 40 15 50 IB 70 18 35 15
100 18 25 16 15 15 15 55 12 12 60 15 15 90 20 17 70 27 30 15 17 45 70 40 20 28 '18 60 60 30 18 IB 20 20 18 18 28 15 15
0.004 0.012 0.062 0.010 0.002 0.010 0.003 0.002 0.009 0.055 0.006 0.007 0.011 0.010 0.068 0.002 0.410 0.017 0.629 0.009 0.049 0.009 3.379 0.011 0.028 0.005 0.003 0.003 n.003 0.327 P.COI 0.002 0.305 0.004 0.005 1.045 0.023 0.007 1.391 0.035 0.139 0.002 0.008 0.143 0.498 0.094 O.018 0.031 0.013 0.347 0.211 0.050 0.015 1.006 0.C16 0.015 O.OIP O.0C9 0.071 0.008 0.012
3 3 2 3 4 3 3 3 2 2 4 4 4 4 2 4 3 3 3 3 3 3 3 3 3 3 3 3 3 2 3 3 2 3 3 3 3 3 N
3 3 3 3 2 3 3 3 3 3 3 3 3 3 3 3 3 3 3 3 4 3
600421 640421 532322 600421 600020 600022 600022 600010 640021 530111 600021 600221 600221 600011 532312 640022 515112 645322 535112 600211 530121 603211 510312 600011 522312 600011 640121 600020 600010 520122 600021 600112 520122 600021 600211 530122 603011 600311 515112 600011 525122 530021 600211 600011 530112 530021 530322 600321 532322 520112 600011 605021 530322 600021 600221 530021 530011 530021 520021 60021O 600011
57

Perennial ice and snow masses-
State, Province or Region: NEPAL.
Mountain area: ^ ejaJ^'^
Hydrological basin:-1st order: QAhJqeS (_*)
U n d order: Í Ü N J t*-0£l SI
Illrd order: ~&OhH K-<^< ©
IVth order: fiJA*JqPO (J&HOTE. .UJCIJ C.
Glacier name: cUHut-C.
Sources : -Map, title &.No: fOAon&O, rr/tffit.
Compiled by: £>Z&i*j SCMUÍ i^cß
Date: tfbS
Scale: / ,' go, o oo
Contour interval: 4-0 <]&TtlES
Reliability: ÜcTT£ß- TH&M otJt?
Photographs:-TEUCeST/2lrt¿. PfrBTO-
T yP e : qe.ftnnc.Tfl.-f ATJÏ, HAIO>> cj\r¡eeA
Serial No:, tferieft«.«^« ScHei-te Date:
1155 /Hoi* ¿vos, ocntusK. i<jii Remarks
Literature
Data compiled by: J.tf. U O L F £
Date & organisation: «Joi-y ifbl
Supervisor: f=". rjÒu-ZA rjcÇit-i-
REMARKS (special geomorph- / ological features, abnormal characteristics, if international boundary, source information on mean depth estimate, observations regarding snow line or equilibrium line from other years)
ftCLvnúi-nTiorò t¡,PiS.ii<¡ lOiTtt THE
• m e yc" ' / iscTc/iOerrt-r/o/O uëEV
iifFicui-T. Ttfe: Pe.es.SrJrr Ctin-/uL.e.
Feon SOUTH / oH©ee ¿í/ecA-re^ -mPrtJio&>-
¡]er£e £ot«_ f^ccc e^Kr unto: u*r££&-
#Ni> TEtlnifijfU. V)oZftlrJ£i. L-IC lOe-Mi. f££ÏE>JT C,t,fiCI£lZ. A*>$ AfOOi- C-HHOÍ.IZ \Jlt-Lfl HE
Regional and basin identification
Glacier number
Longitude
Latitude
U.T.M. ï — i —
.£, ¿L
.iJ.e.A.t-.S.c*
. A.o.
.£r.<=.°<Z,3..&.
,¿,?'.VA«*Í
Orientation: Accumulation area (8 pt. compass)
Ablation area (8 pt. compass)
Highest glacier elevation (m/a.s.l.)
Lowest glacier elevation: Exposed (m/a.s.l.)
Total (m/a.s.l.)
Elevation of snow line (m/a.s.l.)
Date of snow line
Mean accumulation area elevation.weighted,(m/a.s.l.) r*if i¿ .O.
.fJ.É.
ó .g.S- . O.
• UA .S.o.
•Accuracy rating (1-5)
Mean ablation area elevation, weighted,(m/a.s.l.)
•Accuracy rating (1-5)
Maximum length:Ablation area (km)incl.debris covered
Exposed (km)
Total (km)
Mean width of main ice body (km)
Surface area: Exposed (km2) ^ _
Total, (km2) , ,_
•Accuracy rating (1-5)
Area of ablation (km ) , i_
•Accuracy rating (1-5)
Accumulation area ratio (per cent)
Mean depth (m)
Volume (km3) of ice • i_
•Estimated accuracy rating (1-5)
Classification and description, (see Table 1)
i L^Lf.LjLI
f-
-•-? 3".
¿J.õ.3.a._.í.
•Accuracy ratings Area
1 Excellent 2 Good
Fair
0-57. 5-10%
.„„ 10-15% „,„ .„ Acceptable 15-257. 100-200 m Unreliable > 257. > 200 m
Elevations 0-25 m 25-50 m 50-100 ra
Volume 0 - 107. 10 - 257. 25 - 507. 50 - 1007. > 1007.
FIG. 25. Glacier inventory data sheet for Mount Everest region, Ganges (A), Sun Kosi (4), D u d h Kosi (5), Nangpa (Bhote Kosi), Chhule glacier.
58

Three pilot studies: the Eastern Himalayas
State, Province or Region: wefVH. , (A/ .£\)
Mountain area: _. __
Hydrological basin:-1st order: ç / ^ ç e S L&)
Und order: £Or4 ftoSI 5}
Illrd order: 2)o2)H K£S/ ©
IVth order: IHJR iWftLfl ££)
Glacier name: KHV^SU
Sources:-Map, title & No: HAríAl-A^cjOe^
Compiled by: ¿z^, *J ScHtJE^fL
Date: ,<j5^-
Scale: I ; û.£,000
Contour Interval: J O r / e T ^ E Í
Reliability: ¿ETTEft THftrl
Photographs:-OK)£ C O P J T O O / Ç .
Type: T E R ß e ' S ' r ß i ^ i -
Serial N o :
Date: rlrVJ l1)^
Remarks: Ence(j_<£rJ7' Q^OPÍUTH ; u/ve^e /estofes ¿¿SCSETA/L
7
Literature
Data compiled by: J.¡J. lOoi-FE
Date & organisation: JUfOe ^ k ^ "
Supervisor: F\ rjiiixeC, d^Cluu OrttoetZC
REMARKS (special geomorph-ologlcal features, abnormal characteristics, if International boundary, source information on mean depth estimate, observations regarding snow line or equilibrium line from other years)
vA&jiiJq Tmo£. íJ££s íSFiEóei í cavai. ñA. i)<£T o p i-rt 'ooJ rttóAj L O W E S T 7lfteJ) rjosr H£AO/. LARqc P£*urc*iTe.s.. T H o e c is /(- ifOT- r)ET/ee Eí-e.OKJTYo'v/ i/FFueehJtí
FIE.O)-UxOt /t*J> lO/tí PMLTICO LflKLJ 2>IFFÍCOÍ_T ro flssexs, £ S P E & * L ¿ . V 'mTHC \€oo T]Erre.e.- nc,u ioix>nev \CJS-FAU-.
Regional and basin identification
Glacier number
Longitude
Latitude
U.T.M. ï — i —
,£.
¿L
.hl.E . A ./f.ff.E.
. .2.3.
,K , h . ° . Ä . 0 . . 5 ,
,3 , T 1 .fît PLIJ} 1
JUL . s,¿J.
.g. g. y. g.
i û 4^f ., ( mo. t yr.
j i i/'fJi g i
dajr
Orientation: Accumulation area (8 pt. compass)
Ablation area (8 pt. compass)
Highest glacier elevation (m/a.s.l.)
Lowest glacier elevation: Exposed (m/a.s.l.)
Total (m/a.s.f.)
Elevation of snow line (m/a.s.l.)
Date of snow line
Mean accumulation area elevati'on,weighted,(m/a.s.l.) i 6 id . O|0 i
*Accuracy rating (1-5) ¿<
Mean ablation area elevation, weighted,(m/a.s.l.) S .-?. .ff . O .
•Accuracy rating (1-5) i±L
Maximum length:Ablatlon area (km)lncl.debris covered 7 ,/ ... / .
Exposed (km) . 1.0 ...f~.
Total (km) • />$<-<£i
Mean width of main ice body (km) 7,
Surface area: Exposed (km 2) . , .J..6 ... li, I.
Total (km 2) • , - ? . j . ,-fcg
•Accuracy rating (1-5) fcj1J
•Area of ablation (km ) • • • l -SL, ..J-'.S.
•Accuracy racing (1-5) .2.
Accumulation area ratio (per cent) . ¿ . UT
Mean depth (m) . . I . O .O,
Volume (km3) of ice • . ..3 ...3. & ?.
•Estimated accuracy rating (1-5) .J.
Classification and description (see Table 1) J • / • O . T3 •/ • a.
•Accuracy ratings Area
1 Excellent 0-5% 2 Good 5-10% 3 Fair 10-157.
Elevations 0-25 m
25-50 m 50-100 m
4 Acceptable 15-25% 100-200 m 5 Unreliable > 257. > 200 m
Volume 0 - 10% 10 - 25% 25 - 507. 50 - 1007.
>100%
F I G . 26. Glacier inventory data sheet for M o u n t Everest region, Ganges (A), Sun Kosi (4), D u d h Kosi (5), N a n g p a (Bhote Kosi), K h u m b u glacier.
59

[A. 2486] S 4 ; 24/-2.(£ 1.20) (stg.); 16 F