Embed Size (px)
Citation preview

Perceptual Mapping of Different Toothpaste Brands
Available in Bangladesh: A study in Dhaka City
Md. Atiqur Rahman
Assistant Professor
Department of Management
Islamic University
Kushtia, Bangladesh
A. S. M. Sarfaraz Nawaz
Associate Professor
Department of Management
Islamic University
Kushtia, Bangladesh

1
Perceptual Mapping of Different Toothpaste Brands Available in
Bangladesh: A study in Dhaka City
Abstract
This paper investigates how the consumers in Bangladesh perceive different toothpaste
brands against major quality attributes. Consumers’ perception of six brands (Pepsodent,
Meswak, Colgate, Sensodyne, Mediplus and Crest) was analyzed on seven attributes (Anti-
Cavity, Medicinal, Herbal, Cleaning, Taste, Mouth freshening and Price). A total of 60
respondents were randomly selected at different sales outlets at Dhaka city. Respondents
were asked to rate their most preferred brand, which he/she buys, against seven attributes on
a seven point Likert Scale. The collected data were analyzed by Discriminant Model using
SPSS and the perceptual map was developed by MS-Excel. It was found that Meswak is
highly perceived as being Herbal, whereas Colgate was perceived to have both mouth
freshening and cleaning properties followed by some herbal properties. Pepsodent was
supposed to have significant cleaning and anti-cavity properties. Mediplus and Sensodyne
have strong medical properties. Crest was perceived to have no anti-cavity, medical or
herbal properties. It was also evident that Sensodyne and Mediplus are close competitors,
and Colgate competes with both Meswak and Pepsodent.
Key Words
Brand, Toothpaste, Medical and Herbal Property, Anti-Cavity, Perceptual Map
2
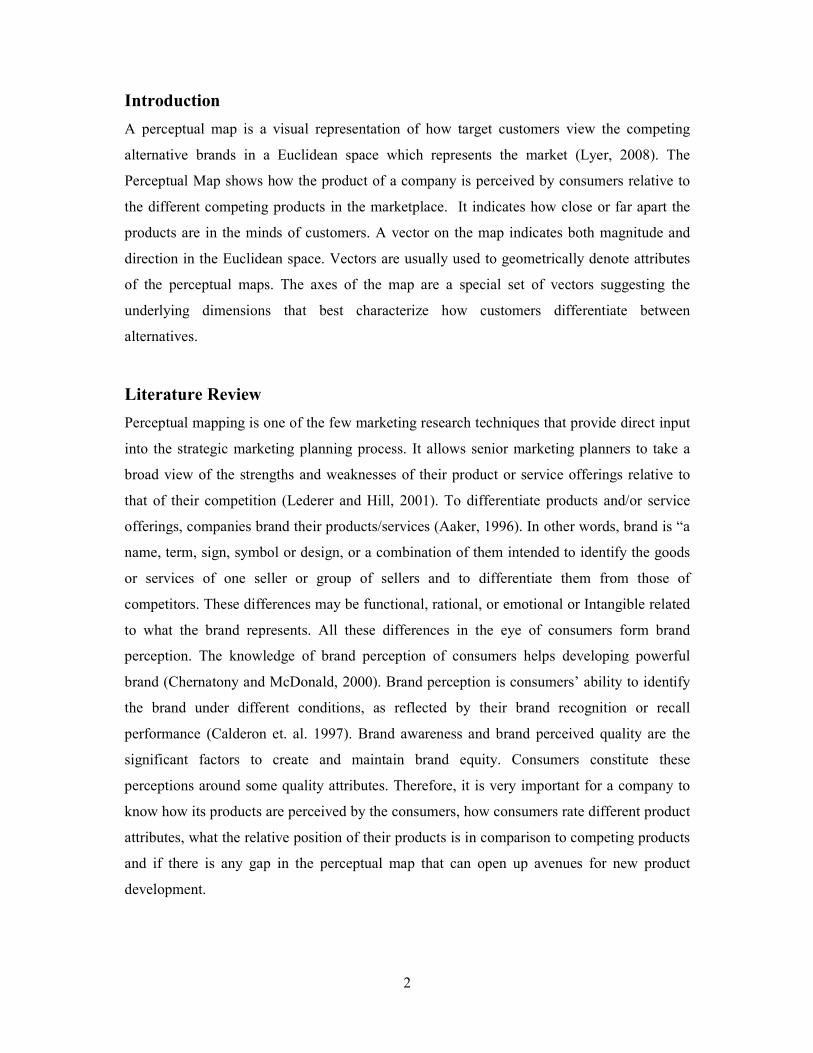
Introduction
A perceptual map is a visual representation of how target customers view the competing
alternative brands in a Euclidean space which represents the market (Lyer, 2008). The
Perceptual Map shows how the product of a company is perceived by consumers relative to
the different competing products in the marketplace. It indicates how close or far apart the
products are in the minds of customers. A vector on the map indicates both magnitude and
direction in the Euclidean space. Vectors are usually used to geometrically denote attributes
of the perceptual maps. The axes of the map are a special set of vectors suggesting the
underlying dimensions that best characterize how customers differentiate between
alternatives.
Literature Review
Perceptual mapping is one of the few marketing research techniques that provide direct input
into the strategic marketing planning process. It allows senior marketing planners to take a
broad view of the strengths and weaknesses of their product or service offerings relative to
that of their competition (Lederer and Hill, 2001). To differentiate products and/or service
offerings, companies brand their products/services (Aaker, 1996). In other words, brand is “a
name, term, sign, symbol or design, or a combination of them intended to identify the goods
or services of one seller or group of sellers and to differentiate them from those of
competitors. These differences may be functional, rational, or emotional or Intangible related
to what the brand represents. All these differences in the eye of consumers form brand
perception. The knowledge of brand perception of consumers helps developing powerful
brand (Chernatony and McDonald, 2000). Brand perception is consumers’ ability to identify
the brand under different conditions, as reflected by their brand recognition or recall
performance (Calderon et. al. 1997). Brand awareness and brand perceived quality are the
significant factors to create and maintain brand equity. Consumers constitute these
perceptions around some quality attributes. Therefore, it is very important for a company to
know how its products are perceived by the consumers, how consumers rate different product
attributes, what the relative position of their products is in comparison to competing products
and if there is any gap in the perceptual map that can open up avenues for new product
development.

3
Although perceptual mapping techniques have been used extensively over a large number of
applied research studies, and for a very wide variety of product and service categories, no
significant research has been found in the context of toothpaste market in Bangladesh.
Therefore, the researchers have had an opportunity to investigate the consumers’ perception
of different toothpaste brand in Bangladesh.
Objectives of the Study
The main objective of the study is to explore how the selected brands of toothpaste are
perceived by the respondents against the set seven quality attributes. To attain the main
objective the researchers have set the following specific objectives:
1. To develop a perceptual map of toothpaste brands.
2. To identify how consumers evaluate different attributes of toothpaste; i.e. the
correlation of different attributes.
3. To find out close competitors of each of the brands.
4. To find out if there is any gap in the perceptual map, that can offer new product
development opportunities.
5. To recommend policy implications of the findings to manufacturers.
Methodology of the Study
In this study, six different brands and seven quality attributes were selected for analysis based
on the findings of focus groups. Two focus groups consisting of nine members in each group
were interviewed to know about their most preferred brands and also to know how important
is the different attributes of toothpaste to them. Finally, based on the focus group discussion,
the following six brands and seven quality attributes were selected for analysis.
A total of 60 respondents (10 brand users for each brand) were randomly selected at different
sales outlets like grocery stores, superstores, departmental stores and small shops located at
Dhaka city.

4
Brands No. of brand users
(Respondents) Attributes Survey Areas
Pepsodent 10 Anti-Cavity
Medicinal
Herbal
Cleaning
Taste
Mouth freshening
Price
Grocery stores,
superstores, departmental
stores and small shops
located at Dhaka city
Meswak 10
Colgate 10
Sensodyne 10
Mediplus 10
Crest 10
Total= 60
This study is based on primary data, which was collected between May 20, 2011 to June 10,
2011; using a structured questionnaire. In the questionnaire, the respondents were asked to
rate his most preferred brand (which he buys) for each of the seven attributes on a seven point
Liker Scale, which was as follows:
1 2 3 4 5 6 7
No Cavity Protection ____ ____ ____ ____ ____ ____ ____ High Cavity Protection
No Medicinal Property ____ ____ ____ ____ ____ ____ ____ Strong Medicinal Property
No Herbal Property ____ ____ ____ ____ ____ ____ ____ Strong Herbal Property
Ineffective Cleaning ____ ____ ____ ____ ____ ____ ____ Effective Cleaning
Unpleasant Taste ____ ____ ____ ____ ____ ____ ____ Pleasant Taste
Weak Mouth Freshening ____ ____ ____ ____ ____ ____ ____ Strong Mouth freshening
Low Price ____ ____ ____ ____ ____ ____ ____ High on Price
The collected data were analyzed by “Discriminant Model” using SPSS (Version 15.0). The
Perceptual Map was developed by Microsoft Excel using the SPSS outputs.
Discussion and Analysis
Here in this study, the researchers have taken six brands of toothpaste and seven attributes.
However, from table-1, we see that six out of those seven attributes namely taste mouth
freshening, cleaning, anti-cavity, medicinal and herbal significantly discriminate the
toothpaste brands (Sig. .000), whereas only price was not a significant discriminating
attribute to the respondents (Sig. .060).

5
Table-1
Tests of Equality of Group Means
.826 2.278 5 54 .060
.651 5.788 5 54 .000
.606 7.011 5 54 .000
.612 6.845 5 54 .000
.434 14.110 5 54 .000
.497 10.942 5 54 .000
.301 25.033 5 54 .000
PRICE
TASTE
MOUTHFRS
CLEANING
ANTICAV
MEDICINA
HERBAL
Wilks'
Lambda F df1 df2 Sig.
Table-2
Summary of Canonical Discriminant Functions
Eigenvalues
3.099a 44.9 44.9 .870
3.040a 44.0 88.9 .867
.444a 6.4 95.4 .555
.225a 3.3 98.6 .429
.095a 1.4 100.0 .294
Function
1
2
3
4
5
Eigenvalue % of Variance Cumulative %
Canonical
Correlation
First 5 canonical discriminant functions were used in the
analysis.
a.
From Table-2, we see that the maximum number of discriminating function can be five.
However, first two functions (Eigenvalue>=1) describe 88.9% of the total variability in the
six brands. Therefore, the perceptual map was developed using only function 1 and 2.

6
Table-3
Standardized Canonical Discriminant Function Coefficients
-.161 .149 -.125 -.181 .777
-.267 .036 .009 .839 .403
-.318 .321 -.189 .058 -.289
-.062 .137 .942 -.362 .155
.734 -.052 .181 .536 -.141
.343 -.540 -.124 -.090 .436
.456 .866 -.321 -.175 -.102
PRICE
TASTE
MOUTHFRS
CLEANING
ANTICAV
MEDICINA
HERBAL
1 2 3 4 5
Function
Table-4
Functions at Group Centroids
1.037 .774 .884 .654 .166
.310 1.392 .389 -.802 .114
.605 -2.259 -.650 -2.09E-02 .472
.596 2.137 -1.011 .235 -.178
-3.678 -.305 8.723E-02 .113 -5.42E-02
1.159 -2.105 .197 -.101 -.485
BRAND
Pepsodent
Colgate
MediPlus
Meswak
Close Up
Sensodyne
1 2 3 4 5
Function
Unstandardized canonical discriminant functions evaluated at group means
Standardized Canonical-discriminant-function- coefficients of attributes (Table-3) were used
to plot the attributes and Unstandardized Canonical-discriminant-functions, evaluated at
group means (Table-4) were taken to plot the brands on the map. The resulting perceptual
Map is shown in Figure-1.

7
Figure-1: Perceptual Map of Toothpaste Brands
The arrows in the map indicate the directions in which attributes are increasing. Length of the
lines from the origin to the arrow is the indicator of the variance of that attribute explained by
the map. The longer this line, the greater is the importance of that attribute in explaining
variance.

8
Analysis of Attribute Vectors:
In this map it is shown that anti-cavity is correlated with medicinal and herbal attributes, and
highly negatively correlated with taste. In other words, respondents perceive that a paste with
anti-cavity property cannot be tasty.
Analysis of Brand Positions:
In this map we see that Meswak is highly perceived as being Herbal. Colgate is perceived to
have both mouth freshening and cleaning properties followed by some herbal attributes.
Pepsodent is supposed to have significant cleaning and anti-cavity properties. However,
Mediplus and Sensodyne stand out and close to “medical” vector. It is also strongly evident
in the map that Crest does not have any anti-cavity, medical or herbal attributes, and have
only mouth freshening and cleaning properties.
In the above perceptual map, Sensodyne and Mediplus are positioned very closely, which
means that they are close competitors in the market place. On the other side, Meswak and
Colgate are competing with each other. However, Pepsodent occupies to some extent a
distinct position in the map, with some proximity with Colgate.
Conclusion and Recommendation
This Perceptual Map provides a clear picture of how the different brands of toothpaste are
positioned in the mind of the consumers in Bangladesh. This has a great implication in brand
positioning strategies of the manufacturers. Again, companies can now identify their major
competing brands, which would help in deploying competitive strategies. This map will also
help in new product development by identifying gaps in the market. For example, among the
selected brands there is no brand positioned very closely to “taste” and “mouth freshening”
attributes. Therefore a new brand can be introduced in the market and positioned based on
those two attributes.

9
References
Aaker, D.A (1996), Building Strong Brands (New York: The Free Press)
Calderon, H; Cervera, A and Molla, A (1997) “BrandAssessment: A Key Element of
Marketing Strategy” Journal of Product and Brand Management Vol.6 No.5
Chernatony, L and McDonald, M (2000) Creating Powerful Brands (London:
Butterworth-Heinemann)
Lederer, C and Hill, S (2001)“See Your Brands’ Through Your Customers Eyes” Harvard
Business Review, June
Lyer, G (2008), Perceptual Mapping Techniques “South Asian Journal of Marketing” Vol. 4
No. 3. Pp 63-68.