Embed Size (px)
Citation preview

Perceptual Evaluation of Tone Mapping Operators with
Real-World Scenes
Akiko Yoshida, Volker Blanz, Karol Myszkowski and Hans-Peter Seidel
Max-Planck-Institut fur InformatikSaarbrucken, Germany
ABSTRACTA number of successful tone mapping operators for contrast compression have been proposed due to the need to visualizehigh dynamic range (HDR) images on low dynamic range devices. They were inspired by fields as diverse as imageprocessing, photographic practice, and modeling of the human visual systems (HVS). The variety of approaches calls for asystematic perceptual evaluation of their performance.
We conduct a psychophysical experiment based on a direct comparison between the appearance of real-world scenesand HDR images of these scenes displayed on a low dynamic range monitor. In our experiment, HDR images are tonemapped by seven existing tone mapping operators. The primary interest of this psychophysical experiment is to assessthe differences in how tone mapped images are perceived by human observers and to find out which attributes of imageappearance account for these differences when tone mapped images are compared directly with their corresponding real-world scenes rather than with each other. The human subjects rate image naturalness, overall contrast, overall brightness,and detail reproduction in dark and bright image regions with respect to the corresponding real-world scene.
The results indicate substantial differences in perception of images produced by individual tone mapping operators.We observe a clear distinction between global and local operators in favor of the latter, and we classify the tone mappingoperators according to naturalness and appearance attributes.
Keywords: high dynamic range (HDR) images, human visual systems (HVS), tone mapping, psychophysics, ANOVA,correlation, MANOVA, Mahalanobis distances.
1. INTRODUCTIONThe need of high dynamic range (HDR) images, containing broader dynamic range than most of today’s display devices,has highly increased. They are useful not only for static images but also for multimedia applications. Therefore, how toproduce visually compelling HDR images has been one of the important discussions in computer graphics, and a numberof techniques have been introduced. To represent HDR images on low dynamic range devices, a number of successful tonemapping operators have been presented. They are useful not only for HDR photography but also for lighting simulation inrealistic rendering and global illumination techniques which provide real-world luminance ranges.
Because a variety of tone mapping operators have been proposed, only a systematic perceptual evaluation can revealthe strengths and weaknesses of the wide range of approaches presented in recent years. We conducted a psychophysicalexperiment of a direct comparison between the appearance of real-world scenes and tone mapped images of these scenes.The primary interest of this experiment is to investigate the differences in perception of tone mapped images when they aredirectly compared with their corresponding real-world views and indirectly compared with each other. To our knowledge,this work is the first direct comparison of tone mapped images with corresponding real-world scenes.
In Section 2, the seven tone mapping operators selected for our experiment are briefly described. Section 3 gives anoutline of our perceptual evaluation and Section 4 discusses the obtained results.
Further authors’ information:E-mails: {yoshida, blanz, karol, hpseidel}@mpi-sb.mpg.de
2. TONE MAPPING OPERATORSThe concept of tone reproduction was first introduced by Tumblin and Rushmeier in 1993.34 The goal of tone reproductionis to compress the dynamic range of an image to the range that can be displayed on physical devices in case that theluminance range of the images is much broader than that of physical devices. A number of tone mapping techniques havebeen presented, and most of them can be categorized into two groups: global and local operators. Global operators applythe same transformation to every pixel of an image while local ones adapt their scales to different areas of an image. Theexisting tone mapping operators are summarized in a recent review by Devlin.8
For our perceptual evaluation, seven commonly used tone mapping operators were selected. The global operators arethe linear mapping and the methods of Pattanaik,27 Ward,38 and Drago.9 The local operators are the fast bilateral filteringpresented by Durand and Dorsey,10 Ashikhmin,2 and Reinhard31 methods. In the following sections, we briefly discusseach of those operators.
2.1. Global OperatorsThe simplest tone reproduction is a linear mapping which scales the radiances to the range between 0 and 255. If thelogarithm of the radiances is taken and linearly scaled to [0, 255], it is called a logarithmic linear mapping.
The histogram adjustment tone mapping operator developed by Ward Larson et al.38 builds on earlier work.12, 36 Thealgorithm features strong contrast compression for pixels belonging to sparsely populated regions in the image histogram,which helps to overcome the problem of dynamic range shortage. This method leads to a monotonic tone reconstructioncurve which is applied globally to all pixels in the image. The slope of the curve is constrained by considering the humancontrast sensitivity to guarantee that the displayed image does not exhibit more contrast than what is perceived in the realscene.
Pattanaik et al. extended the perceptual models framework by Tumblin and Rushmeier34 and presented a new time-dependent tone mapping operator which is based on psychophysical experiments and a photoreceptor model for luminancevalues.27 This algorithm deals with the changes of threshold visibility, color appearance, visual acuity, and sensitivity overtime. This algorithm briefly can be decomposed into two models: the visual adaptation model and the visual appearancemodel. The signals that simulate the adaptation measured in the retina are used for adaptation in each pixel of an image.To reproduce visual appearance, it is assumed that a viewer determines reference white and reference black colors. Then,the visual appearance model recalculates the visual appearance values with those reference points. By assembling thosevisual adaptation and appearance models, the scene appearance is reproduced with changes to visual adaptation dependingon time. This method is also useful to predict the visibility and appearance of scene features because it deals with referencewhite and black points.
Drago et al. introduced a method which is called adaptive logarithmic mapping.9 This method addresses the needfor a fast algorithm suitable for interactive applications which automatically produces realistically looking images fora wide variation of scenes exhibiting high dynamic range of luminance. This global tone mapping function is basedon logarithmic compression of luminance. To preserve details while providing high contrast compression, a family oflogarithmic functions ranging from log2 to log10 with increasing compressive power are used. The log10 is applied forthe brightest image pixel and for remaining pixels the logarithm base is smoothly interpolated between values 2–10 as afunction of their luminance. Perlin bias power function29 is used for interpolation between the logarithm bases to providebetter steepness control of the resulting tone mapping curve.
2.2. Local OperatorsReinhard et al. presented a photographic tone reproduction inspired by photographic film development and the printingprocess.31 The luminance of an image is initially mapped by using a global tone mapping function to compress the rangeof luminance into the displayable range. To enhance the quality of an image, a local adaptation is based on photographic“dodging and burning” technique which allows a different exposure for each part of the applied image. The most recentversion of this method operates automatically, freeing the user from setting parameters.30 To automate processes, lowcontrast regions are found by a center-surround function at different scales. Then, a tone mapping function is locallyapplied. The automatic dodging and burning method enhances contrast and details in an image while preserving theoverall luminance characteristics.
Ashikhmin presented a new tone mapping method which works on a multipass approach.2 The method takes intoaccount two basic characteristics of the human visual systems (HVS): signaling absolute brightness and local contrast.This method first calculates local adaptation luminance by calculating an average luminance of neighboring pixels fittingin a bound-limited contrast range (similar to Reinhard et al.31). Then, it applies the capacity function which is based on thelinearly approximated threshold vs. intensity function and calculates the final pixel values. The final calculation restoresthe details which may be lost in the steps of compression. A tone mapped pixel value is obtained by multiplying a detailimage given by the ratio of pixel luminance to the corresponding local world adaptation.
A fast bilateral filtering method was presented by Durand and Dorsey.10 This method considers two different spatialfrequency layers: a base layer and a detail layer. The base layer preserves high contrast edges and removes high-spatialfrequency details of lower contrast. The detail layer is created as the difference of the original image and the base layer inlogarithmic scale. After contrast compression in the base layer, both layers are summed up to create a tone mapped image.
3. PERCEPTUAL EVALUATIONImage comparison techniques can be roughly classified into two major categories: subjective and objective methods.Subjective methods obtain data from human observers and the data are usually analyzed by statistical techniques.24, 25, 39
Objective methods are based on theoretical models which can be either purely image processing techniques19, 20, 35, 40 ormodels incorporating some characteristics of the human visual systems (HVS).1, 5, 6, 13, 16, 18, 26 A number of surveys onimage quality measurements have been presented.3, 4, 11, 15, 22, 41
3.1. Experimental Design and ParticipantsWe selected a human-perception based method for our experiment with seven tone mapping operators (see Section 2)because our goal is a comparison of tone mapped images and their corresponding real world views and there exists noobjective method to accommodate such as a cross-media comparison.
The experiment was performed with the participation of 14 human observers. All of the 14 participants were graduatestudents and researchers of the Computer Graphics group in the Max-Planck-Institut fur Informatik. Two of them arefemale and the rest are male. The range of their age is 24 – 34. All of them were naıve for the goal of the experiment andtone mapping operators. Additionally, every participant reported normal or corrected eyesight to normal vision.
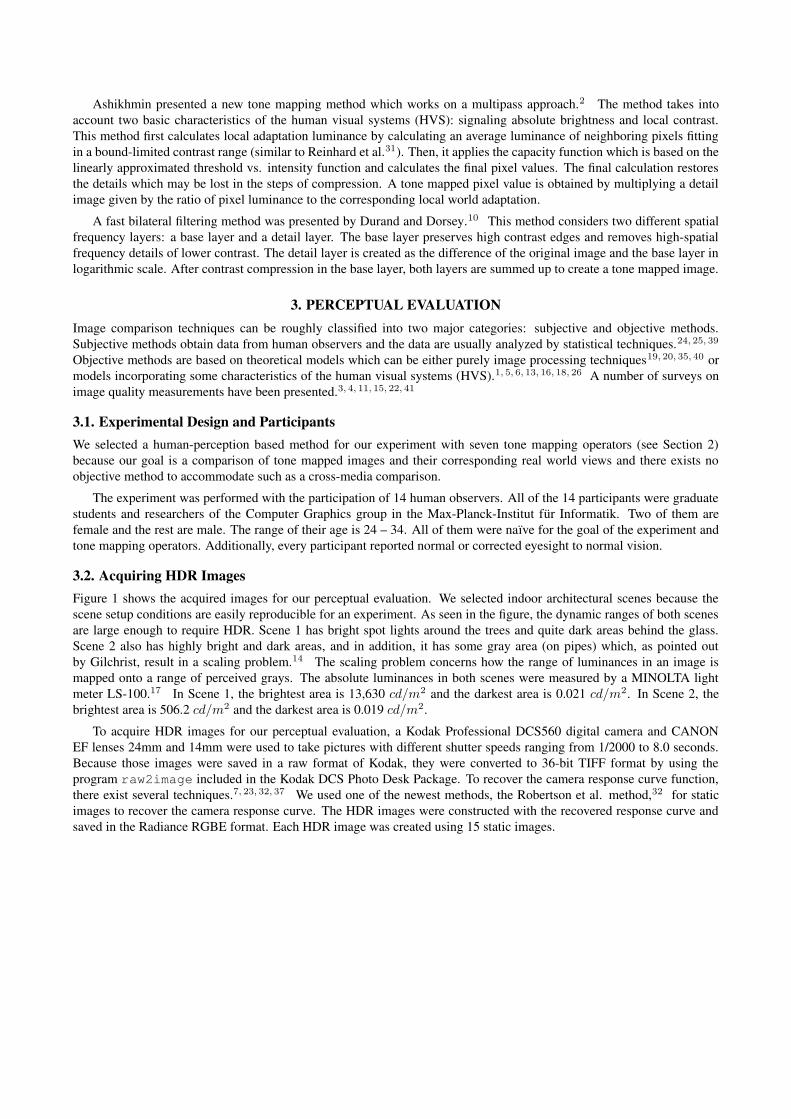
3.2. Acquiring HDR ImagesFigure 1 shows the acquired images for our perceptual evaluation. We selected indoor architectural scenes because thescene setup conditions are easily reproducible for an experiment. As seen in the figure, the dynamic ranges of both scenesare large enough to require HDR. Scene 1 has bright spot lights around the trees and quite dark areas behind the glass.Scene 2 also has highly bright and dark areas, and in addition, it has some gray area (on pipes) which, as pointed outby Gilchrist, result in a scaling problem.14 The scaling problem concerns how the range of luminances in an image ismapped onto a range of perceived grays. The absolute luminances in both scenes were measured by a MINOLTA lightmeter LS-100.17 In Scene 1, the brightest area is 13,630 cd/m2 and the darkest area is 0.021 cd/m2. In Scene 2, thebrightest area is 506.2 cd/m2 and the darkest area is 0.019 cd/m2.
To acquire HDR images for our perceptual evaluation, a Kodak Professional DCS560 digital camera and CANONEF lenses 24mm and 14mm were used to take pictures with different shutter speeds ranging from 1/2000 to 8.0 seconds.Because those images were saved in a raw format of Kodak, they were converted to 36-bit TIFF format by using theprogram raw2image included in the Kodak DCS Photo Desk Package. To recover the camera response curve function,there exist several techniques.7, 23, 32, 37 We used one of the newest methods, the Robertson et al. method,32 for staticimages to recover the camera response curve. The HDR images were constructed with the recovered response curve andsaved in the Radiance RGBE format. Each HDR image was created using 15 static images.
(a) Scene 1. Maximum pixel luminance: 4,848.9506, mini-mum luminance: 0.0076, dynamic range: 638,019:1.
(b) Scene 2. Maximum pixel luminance: 159.697,minimum luminance: 0.006, dynamic range:26,616:1.
Figure 1. View of scenes selected for our tone mapping evaluation.
3.3. Experimental ProcedurePrior to the main experiment, we conducted a pilot study with experienced subjects to fine tune the parameter settings foreach tone mapping operator. From a selection from multiple tone mapped images for every tone reproduction, we askedsubjects to choose the best image. Additional post-processing, such as gamma correction, was performed according to thesuggestions in each respective paper of the tone mapping operators. All of the images used in our experiment are shownin Appendix A. All of the HDR images and our implementations of the tone reproductions used in the experiment areavailable at our website∗.
In the main experiment, the participants were asked to stay in the same position as each of the HDR images had beentaken (Figure 1) and view seven images one after another for each of the two scenes. An sRGB-calibrated monitor (DELLUltraSharp 1800FP) displaying images of resolution 1280×1024 at 60.0 Hz was used. The subjects were asked to compareeach of the 14 images with their corresponding real-world view and give ratings for image appearance and realism. Imageappearance attributes judged in our experiment are overall brightness, contrast, detail reproductions in dark regions, anddetail reproductions in bright regions. The subjects rated how well each of those attributes was reproduced in tone mappedimages with respect to the real world view. Additionally, the subjects were asked to rate image naturalness in terms ofreproducing the overall appearance of the real world views. All of the ratings were done by moving scroll bars. Thesubjects were allowed to move back and forth among images for one scene (see Figure 2 for an example screenshot). Thewhole procedure for one participant took approximately 20 to 30 minutes.
4. RESULTS AND DISCUSSIONOur experiment is a seven (tone mapping operators) × two (scenes) within-subjects design (see Tabachnick33 for details ofthe design types). This experiment has two independent variables (IVs: the tone mapping operators and the scenes) and fivedependent variables (DVs: overall brightness, overall contrast, detail reproductions in dark regions, detail reproductions inbright regions, and naturalness)†. Our primary interest is whether the images produced by different tone mapping operatorsare perceived differently when they are compared to their corresponding real-world views. For analyzing a set of data, theStatistics Toolbox of MATLAB was used.21 As preliminary data processing, all obtained scores were normalized overeach of the attributes and each of the subjects in order to scale the standard deviations 1.0 as xi →
xi−µx
σx
where xi is ascore and µx and σx are respectively the mean and the standard deviation over an attribute of a subject.
∗http://www.mpi-sb.mpg.de/resources/tmo/†IVs are the variables which do not depend on participants while DVs depend on participants’ ratings.
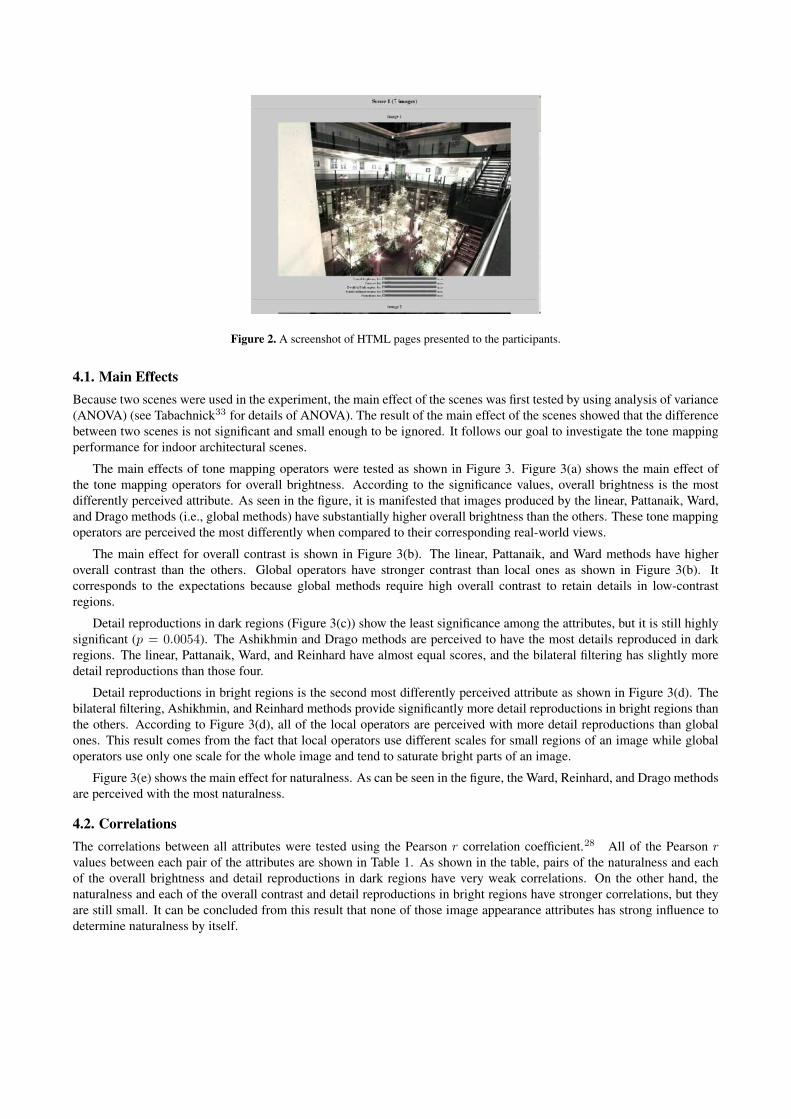
Figure 2. A screenshot of HTML pages presented to the participants.
4.1. Main EffectsBecause two scenes were used in the experiment, the main effect of the scenes was first tested by using analysis of variance(ANOVA) (see Tabachnick33 for details of ANOVA). The result of the main effect of the scenes showed that the differencebetween two scenes is not significant and small enough to be ignored. It follows our goal to investigate the tone mappingperformance for indoor architectural scenes.
The main effects of tone mapping operators were tested as shown in Figure 3. Figure 3(a) shows the main effect ofthe tone mapping operators for overall brightness. According to the significance values, overall brightness is the mostdifferently perceived attribute. As seen in the figure, it is manifested that images produced by the linear, Pattanaik, Ward,and Drago methods (i.e., global methods) have substantially higher overall brightness than the others. These tone mappingoperators are perceived the most differently when compared to their corresponding real-world views.
The main effect for overall contrast is shown in Figure 3(b). The linear, Pattanaik, and Ward methods have higheroverall contrast than the others. Global operators have stronger contrast than local ones as shown in Figure 3(b). Itcorresponds to the expectations because global methods require high overall contrast to retain details in low-contrastregions.
Detail reproductions in dark regions (Figure 3(c)) show the least significance among the attributes, but it is still highlysignificant (p = 0.0054). The Ashikhmin and Drago methods are perceived to have the most details reproduced in darkregions. The linear, Pattanaik, Ward, and Reinhard have almost equal scores, and the bilateral filtering has slightly moredetail reproductions than those four.
Detail reproductions in bright regions is the second most differently perceived attribute as shown in Figure 3(d). Thebilateral filtering, Ashikhmin, and Reinhard methods provide significantly more detail reproductions in bright regions thanthe others. According to Figure 3(d), all of the local operators are perceived with more detail reproductions than globalones. This result comes from the fact that local operators use different scales for small regions of an image while globaloperators use only one scale for the whole image and tend to saturate bright parts of an image.
Figure 3(e) shows the main effect for naturalness. As can be seen in the figure, the Ward, Reinhard, and Drago methodsare perceived with the most naturalness.
4.2. CorrelationsThe correlations between all attributes were tested using the Pearson r correlation coefficient.28 All of the Pearson rvalues between each pair of the attributes are shown in Table 1. As shown in the table, pairs of the naturalness and eachof the overall brightness and detail reproductions in dark regions have very weak correlations. On the other hand, thenaturalness and each of the overall contrast and detail reproductions in bright regions have stronger correlations, but theyare still small. It can be concluded from this result that none of those image appearance attributes has strong influence todetermine naturalness by itself.
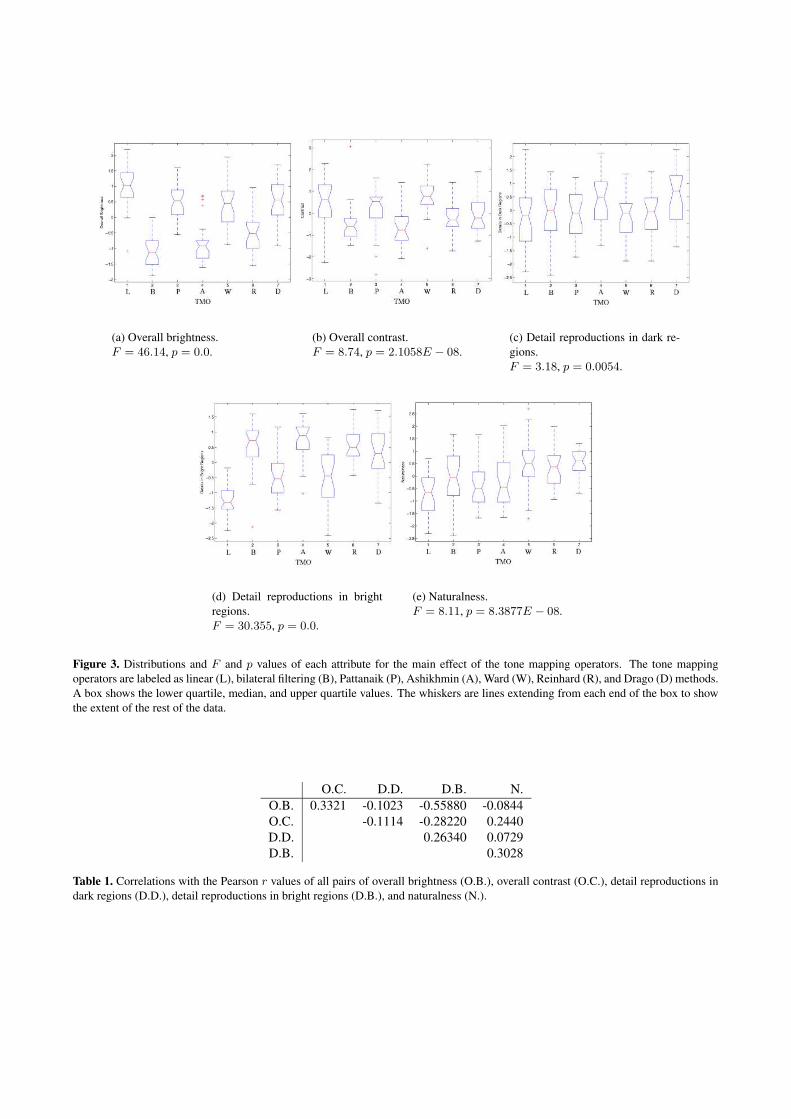
(a) Overall brightness.F = 46.14, p = 0.0.
(b) Overall contrast.F = 8.74, p = 2.1058E − 08.
(c) Detail reproductions in dark re-gions.F = 3.18, p = 0.0054.
(d) Detail reproductions in brightregions.F = 30.355, p = 0.0.
(e) Naturalness.F = 8.11, p = 8.3877E − 08.
Figure 3. Distributions and F and p values of each attribute for the main effect of the tone mapping operators. The tone mappingoperators are labeled as linear (L), bilateral filtering (B), Pattanaik (P), Ashikhmin (A), Ward (W), Reinhard (R), and Drago (D) methods.A box shows the lower quartile, median, and upper quartile values. The whiskers are lines extending from each end of the box to showthe extent of the rest of the data.
O.C. D.D. D.B. N.O.B. 0.3321 -0.1023 -0.55880 -0.0844O.C. -0.1114 -0.28220 0.2440D.D. 0.26340 0.0729D.B. 0.3028
Table 1. Correlations with the Pearson r values of all pairs of overall brightness (O.B.), overall contrast (O.C.), detail reproductions indark regions (D.D.), detail reproductions in bright regions (D.B.), and naturalness (N.).
The pair of the overall brightness and detail reproductions in bright regions has the biggest negative correlation withthe Pearson coefficient r = −0.55880. It is expected because as overall brightness decreases, bright parts are less saturatedand better visible.
4.3. Dimension EstimateIn addition, the data were analyzed by using multivariate analysis of variance (MANOVA). MANOVA is an extension ofANOVA to analyze multiple IVs and/or multiple DVs (see Tabachnick33 for details). MANOVA in the Statistics Toolboxof MATLAB provides an estimate of the dimension d of the space containing the group means and the significance valuesfor each of the dimensions. If d = 0, it indicates that the means are at the same point. A value of d = 1 indicates that themeans are different but along a line, value d = 2 shows that the means are on a plane but not along a line and similarly forhigher values of d. The null hypotheses are tested by calculating the significant values (p-values) in each of the dimensionssuch as the means are in N -dimensional space, where N is the number of dimensions. From our set of data, MANOVAreturns d = 3 which indicates that the means are in a space with at least three dimensions. The p values for each of thedimensions in our perceptual experiment are
p(d = 0) = 0.0000
p(d = 1) = 0.0000
p(d = 2) = 0.0017
p(d = 3) = 0.9397
p(d = 4) = 0.8833.
For value d = 3, the possibility is the largest and above the significance level; therefore, the means are located in an atleast three-dimensional space.
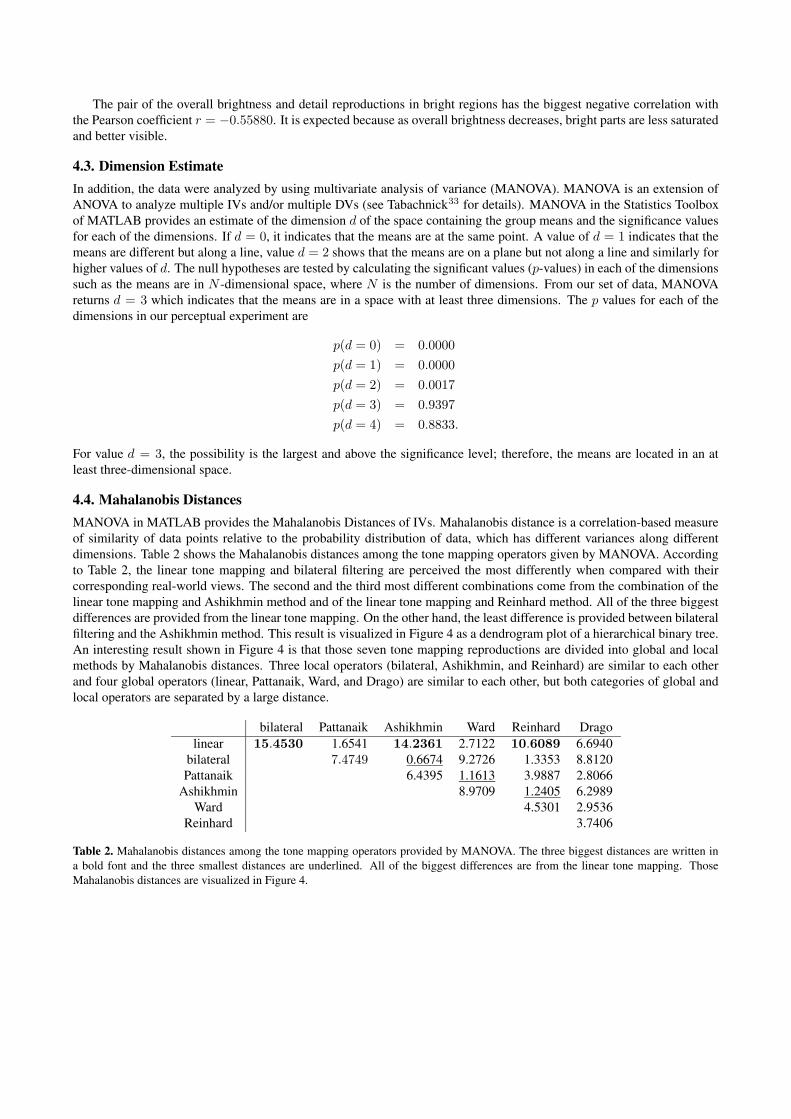
4.4. Mahalanobis DistancesMANOVA in MATLAB provides the Mahalanobis Distances of IVs. Mahalanobis distance is a correlation-based measureof similarity of data points relative to the probability distribution of data, which has different variances along differentdimensions. Table 2 shows the Mahalanobis distances among the tone mapping operators given by MANOVA. Accordingto Table 2, the linear tone mapping and bilateral filtering are perceived the most differently when compared with theircorresponding real-world views. The second and the third most different combinations come from the combination of thelinear tone mapping and Ashikhmin method and of the linear tone mapping and Reinhard method. All of the three biggestdifferences are provided from the linear tone mapping. On the other hand, the least difference is provided between bilateralfiltering and the Ashikhmin method. This result is visualized in Figure 4 as a dendrogram plot of a hierarchical binary tree.An interesting result shown in Figure 4 is that those seven tone mapping reproductions are divided into global and localmethods by Mahalanobis distances. Three local operators (bilateral, Ashikhmin, and Reinhard) are similar to each otherand four global operators (linear, Pattanaik, Ward, and Drago) are similar to each other, but both categories of global andlocal operators are separated by a large distance.
bilateral Pattanaik Ashikhmin Ward Reinhard Dragolinear 15.4530 1.6541 14.2361 2.7122 10.6089 6.6940
bilateral 7.4749 0.6674 9.2726 1.3353 8.8120Pattanaik 6.4395 1.1613 3.9887 2.8066
Ashikhmin 8.9709 1.2405 6.2989Ward 4.5301 2.9536
Reinhard 3.7406
Table 2. Mahalanobis distances among the tone mapping operators provided by MANOVA. The three biggest distances are written ina bold font and the three smallest distances are underlined. All of the biggest differences are from the linear tone mapping. ThoseMahalanobis distances are visualized in Figure 4.
Figure 4. Tree-structured Mahalanobis distances to determine similarity among the tone mapping operators given by MANOVA. As inFigure 3, the tone mapping operators are labeled as linear (L), bilateral filtering (B), Pattanaik (P), Ashikhmin (A), Ward (W), Reinhard(R), and Drago (D) methods.Note that those tone mapping operators are divided into global and local methods by Mahalanobis distances.
5. CONCLUSIONSWe conducted a psychophysical experiment over seven tone mapping operators and two scenes with 14 human observers.The result of the analysis shows that the seven tone mapping operators were perceived very differently in terms of allof the attributes when compared to their corresponding real-world views. Overall brightness shows the most significantdifferences among the tone reproductions, and global operators (the linear, Pattanaik, Ward, and Drago methods) have morebrightness than local ones (the bilateral filtering, Ashikhmin, and Reinhard methods). For overall contrast, global operatorshave more contrast than local ones, but the difference is not as large as for overall brightness. The linear, Pattanaik, andWard methods show more overall contrast reproduction than the others. Detail reproductions in dark regions shows the leastsignificance value among the attributes, but it is still highly significant. The Ashikhmin and Drago methods are perceivedas the most detailed one in dark regions. Detail reproduction in bright regions is the second most differently perceivedattribute. In contrast to overall brightness, local operators are perceived with significantly more detail reproductions inbright regions than global ones. About naturalness, the Ward, Reinhard, and Drago methods are perceived as the mostnatural ones.
Correlations between naturalness and each of the image appearance attributes were tested. The result shows that noneof the image appearance attributes has a strong influence on the perception of naturalness by itself. This may suggest thatnaturalness is dependent on a combination of the other attributes. All the other possible pairs between attributes werealso tested. The biggest negative correlation happens between overall brightness and detail reproductions in bright regionswhich may be due to saturation or contrast compression in bright regions.
The multivariate analysis of variance (MANOVA) shows that the means of the set of data are embedded in an at leastthree-dimensional space. In terms of the similarity of the tone mapping operators computed by Mahalanobis distances, thebiggest differences are between the linear tone mapping and each of the fast bilateral filtering, the Ashikhmin method, andthe photographic tone reproduction by Reinhard et al. (i.e., local methods). The least differences are between fast bilateralfiltering and the Ashikhmin method, between the methods of Pattanaik and Ward, and between the Ashikhmin method andthe photographic reproduction. The Mahalanobis distances are visualized in a dendrogram plot and it shows that those tonemapping operators are divided into global and local categories in terms of similarity.
Our results demonstrate that qualitative differences in tone mapping operators have a systematic effect on the perceptionof scenes by human observers. They provide a solid basis for selecting the appropriate algorithm for a given applicationand for assessment of new approaches to tone mapping techniques.
APPENDIX A. TONE MAPPED IMAGESFigures 5 and 6 show the tone mapped images which were used in our perceptual experiment.
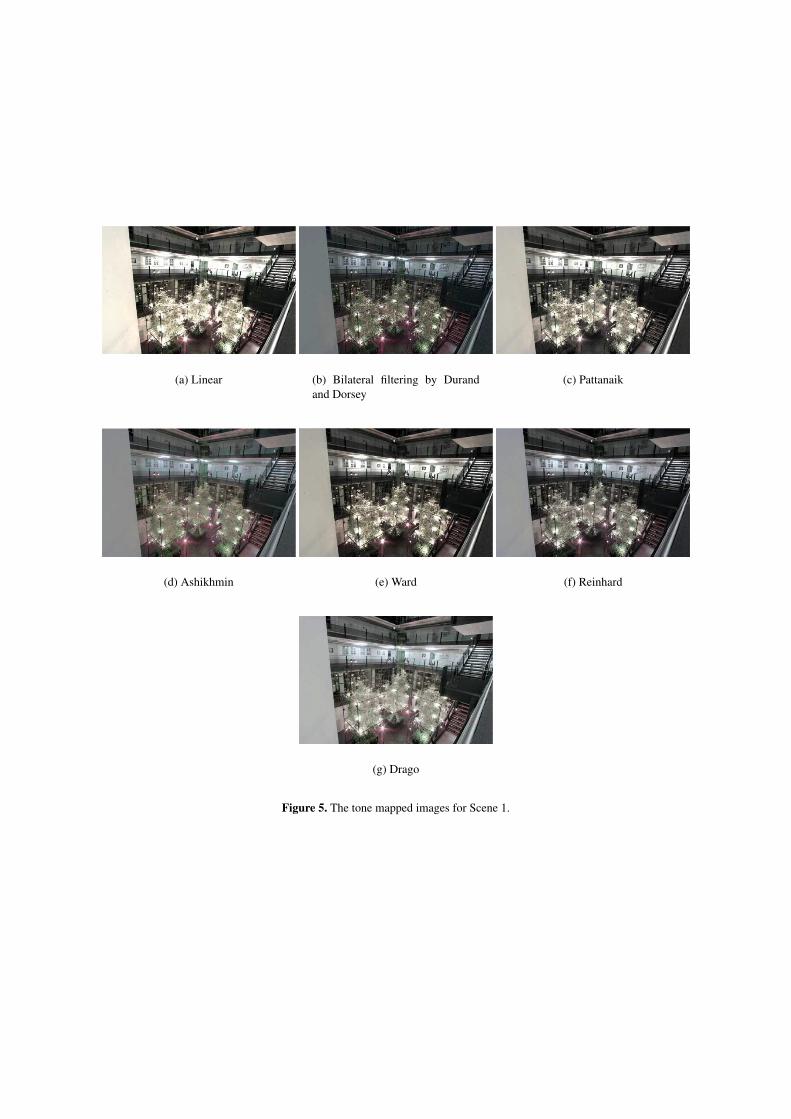
(a) Linear (b) Bilateral filtering by Durandand Dorsey
(c) Pattanaik
(d) Ashikhmin (e) Ward (f) Reinhard
(g) Drago
Figure 5. The tone mapped images for Scene 1.
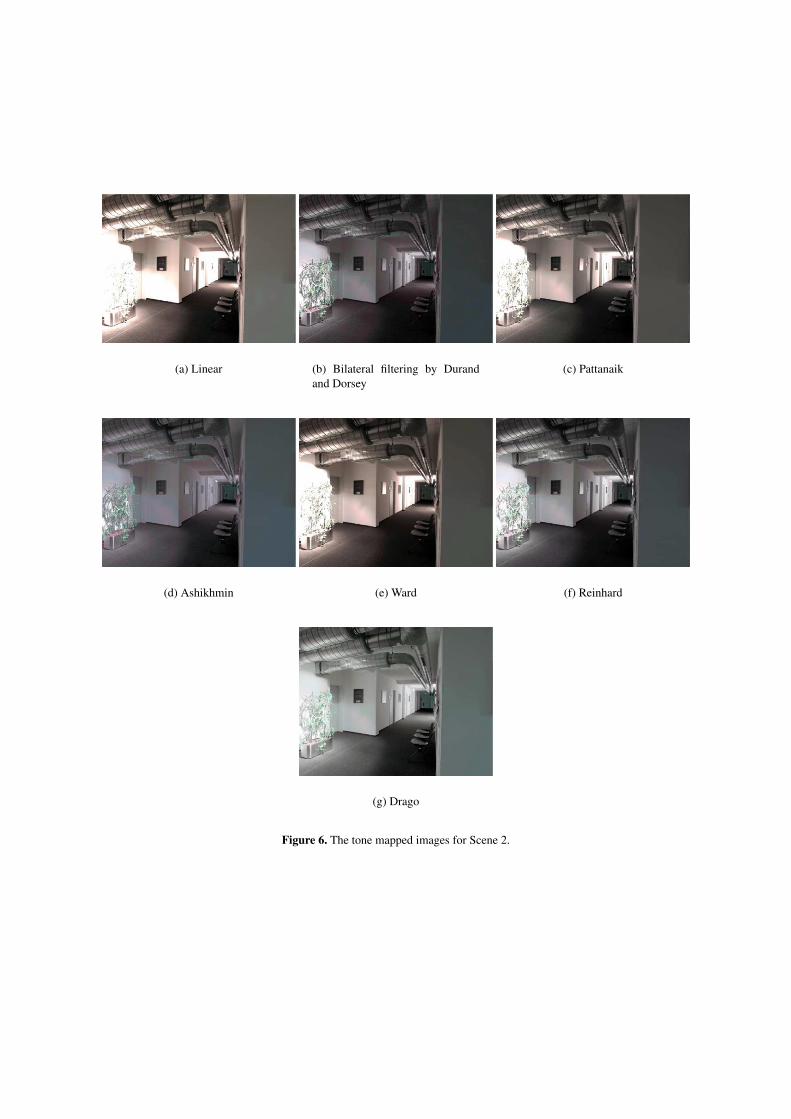
(a) Linear (b) Bilateral filtering by Durandand Dorsey
(c) Pattanaik
(d) Ashikhmin (e) Ward (f) Reinhard
(g) Drago
Figure 6. The tone mapped images for Scene 2.
ACKNOWLEDGMENTSWe wish to express our warmest gratitude to the 14 people who participated our psychophysical experiment. Additionally,we would like to thank Grzegorz Krawczyk and Rafał Mantiuk for providing some tone mapping operators. We are alsograteful to Frederic Drago for providing his software package and tone mapped images by his tone reproduction.
This work was supported in part by the European Community within the scope of the RealReflect project IST-2001-34744 “Realtime visualization of complex reflectance behavior in virtual prototyping”.
REFERENCES1. Stephane Albin, Gilles Rougeron, Bernard Peroche, and Alain Tremeau. Quality image metrics for synthetic images
based on perceptual color differences. IEEE Transactions on Image Processing, 11(9):961–971, September 2002.2. Michael Ashikhmin. A tone mapping algorithm for high contrast images. In P. Debevec and S. Gibson, editors, 13th
Eurographics Workshop on Rendering, pages 145–155, Pisa, Italy, 2002. The Eurographics Association.3. Ismail Avcıbas and Bulent Sankur. Statistical analysis of image quality measures. In Proceedings European Signal
Processing Conference 2000, pages 2181–2184, September 2000.4. Ismail Avcıbas, Bulent Sankur, and Khalid Sayood. Statistical evaluation of image quality measures. Journal of
Electronic Imaging, 11(2):206–223, April 2002.5. Alexander Bornik, Peter Cech, Andrej Ferko, and Roland Perko. Beyond image quality comparison. In M. Chover,
H. Hagen, and D. Tost, editors, Eurographics 2003 Short Presentations, pages 263–272. The Eurographics Associa-tion 2003, 2003.
6. Scott Daly. Digital Images and Human Vision, chapter 14: The Visible Differences Predictor: An Algorithm for theAssessment of Image Fidelity, pages 179–206. MIT Press, 1993. ISBN: 0-262-23171-9.
7. Paul E. Debevec and Jitendra Malik. Recovering high dynamic range radiance maps from photographs. In TurnerWhitted, editor, SIGGRAPH 97 Conference Proceedings, Annual Conference Series, pages 369–378. ACM SIG-GRAPH, Addison Wesley, August 1997. ISBN 0-89791-896-7.
8. Kate Devlin, Alan Chalmers, Alexander Wilkie, and Werner Purgathofer. Tone reproduction and physically basedspectral rendering. In Dieter Fellner and Roberto Scopignio, editors, State of the Art Reports, Eurographics, pages101–123. The Eurographics Association, September 2002.
9. Frederic Drago, Karol Myszkowski, Thomas Annen, and Norishige Chiba. Adaptive logarithmic mapping for dis-playing high contrast scenes. In P. Brunet and D. Fellner, editors, Proceedings of Eurographics, pages 419–426,2003.
10. Fredo Durand and Julie Dorsey. Fast bilateral filtering for the display of high-dynamic-range images. In Proceedingsof ACM SIGGRAPH 2002, Computer Graphics Proceedings, Annual Conference Series, 2002.
11. Ahmet M. Eskicioglu and Paul S. Fisher. Image quality measures and their performance. IEEE Transactions onCommunications, 43(12):2959–2965, December 1995.
12. James A. Ferwerda, Sumanta Pattanaik, Peter Shirley, and Donald P. Greenberg. A model of visual adaptation forrealistic image synthesis. In Holly Rushmeier, editor, SIGGRAPH 96 Conference Proceedings, Annual ConferenceSeries, pages 249–258. ACM SIGGRAPH, Addison Wesley, August 1996.
13. Thomas Frese, Charles A. Bouman, and Jan. P. Allebach. A methodology for designing image similarity metricsbased on human visual system models. In Proceedings of SPIE on Human Vision and Electronic Imaging II, volume3016, pages 472–483, 1997.
14. Alan Gilchrist, Christos Kossyfidis, Frederick Bonato, Tiziano Agostini, Joseph Cataliotti, Xiaojun Li, BrankaSpehar, Vidal Annan, and Elias Economou. An anchoring theory of lightness perception. Psychological Review,106(4):795–834, 1999.
15. Warren B. Jackson, Maya R. Said, David A. Jared, James O. Larimer, Jennifer L. Gille, and Jeffrey Lubin. Evaluationof human vision models for predicting human-observer performance. In Harold L. Kundel, editor, Medical Imaging1997: Image Perception, Proceedings of SPIE, volume 3036, pages 64–73, April 1997.
16. Ruud Janssen. Computational Image Quality. SPIE Press, Bellingham, WA 97227-0010, USA, 2001. ISBN 0-8194-4132-5.
17. KONICA MINOLTA, Inc. http://konicaminolta.com/.
18. Yung-Kai Lai and C.-C. Jay Kuo. Image quality measurement using the haar wavelet. In Proceedings of SPIE, volume3169, 1997.
19. David E.B. Lees and Philip D. Henshaw. Printed circuit board inspection – a novel approach. In Proceedings of theInternational Society for Optical Engineering, volume 730, pages 164–173, 1987.
20. Gian Paolo Lorenzetto and Peter Kovesi. A phase based image comparison technique. In Proceedings of DICTA ’99,1999.
21. MathWorks, Inc. MATLAB. http://www.mathworks.com/.22. Ann McNamara. Visual perception in realistic image synthesis. Computer Graphics Forum, 20(4):211–224, 2001.23. Tomoo Mitsunaga and Shree K. Nayar. Radiometric self calibration. In Proceedings of IEEE Conference on Computer
Vision and Pattern Recognition, June 1999.24. Guy R. Newsham, Helge Seetzen, and Jennifer A. Veitch. Lighting quality evaluations using images on a high
dynamic range display. In Proceedings of the ARCC/EAAE Conference on Architectural Research, pages 1–9, May2002.
25. M. Nijenhuis, R. Hamberg, C. Teunissen, S. Bech, H. Looren de Jong, P. Houben, and S. K. Pramanik. Sharpness,sharpness related attributes, and their physical correlates. In Proceedings of SPIE, volume 3025, pages 173–184,1997.
26. Wilfried Osberger, Anthony J. Maeder, and Donald McLean. A computational model of the human visual system forimage quality assessment. In Proceedings DICTA-97, pages 337–342, Auckland, New Zealand, December 1997.
27. Sumanta N. Pattanaik, Jack E. Tumblin, Hector Yee, and Donald P. Greenberg. Time-dependent visual adaptation forrealistic image display. In Proceedings of ACM SIGGRAPH 2000, Annual Conference Series, pages 47–54. ACMPress / ACM SIGGRAPH / Addison Wesley Longman, July 2000. ISBN 1-58113-208-5.
28. Karl Pearson. Regression, heredity, and panmixia. Philosophical Transactions of the Royal Society of London,A(187):253–318, 1896.
29. K. Perlin and E.M. Hoffert. Hypertexture. In Proceedings of ACM SIGGRAPH 89, volume 23, pages 253–262, 1989.30. Erik Reinhard. Parameter estimation for photographic tone reproduction. Journal of Graphics Tools, 7(1):45–51,
January 2003.31. Erik Reinhard, Michael Stark, Peter Shirley, and Jim Ferwerda. Photographic tone reproduction for digital images.
In SIGGRAPH 2002 Conference Proceedings. ACM SIGGRAPH, Addison Wesley, August 2002.32. Mark A. Robertson, Sean Borman, and Robert L. Stevenson. Dynamic range improvement through multiple expo-
sures. IEEE International Conference on Image Processing, October 1999.33. Barbara G. Tabachnick. Using multivariate statistics. Harper Collins Publishers, Inc., 2nd edition, 1989. ISBN
0-06-046571-9.34. Jack Tumblin and Holly E. Rushmeier. Tone reproduction for realistic images. IEEE Computer Graphics and
Applications, 13(6):42–48, November 1993.35. Zhou Wang and Alan C. Bovik. A universal image quality index. IEEE Signal Processing Letters, 9(3):81–84, March
2002.36. Greg Ward. A contrast-based scalefactor for luminance display. Graphics Gems IV, pages 415–421, 1994.37. Greg Ward. Fast, robust image registration for compositing high dynamic range photographcs from hand-held expo-
sures. Journal of Graphics Tools, 8(2):17–30, 2003.38. Gregory Ward Larson, Holly Rushmeier, and Christine Piatko. A Visibility Matching Tone Reproduction Operator
for High Dynamic Range Scenes. IEEE Transactions on Visualization and Computer Graphics, 3(4):291–306, 1997.39. Benjamin Watson, Alinda Friedman, and Aaron McGaffey. Measuring and predicting visual fidelity. In Proceedings
of ACM SIGGRAPH 2001, Computer Graphics Proceedings, Annual Conference Series, pages 213–220. ACM Press/ ACM SIGGRAPH / Addison Wesley Longman, 2001.
40. Dale L. Wilson, Adrian J. Baddeley, and Robyn A. Owens. A new metric for grey-scale comparison. InternationalJournal of Computer Vision, 24(1):5–17, 1997.
41. Hualinn Zhou, Min Chen, and Mike F. Webster. Comparative evaluation of visualization and experimental resultsusing image comparison metrics. IEEE Visualization, 2002.


![Impact of Tone-mapping Algorithms on Subjective and ... · Five different tone-mapping operators, including a simple Gamma-based operator gamma, drago03 by Drago et al. [4], reinhard02](https://img.pdfslide.us/doc/110x75/5fcf34fc2ec83f3d5a39e455/impact-of-tone-mapping-algorithms-on-subjective-and-five-different-tone-mapping.jpg)


![Real-Time High Fidelity Inverse Tone Mapping for …vcg.isti.cnr.it/Publications/2013/BCS13/main.pdfbased on image processing techniques they use. For exam-ple, global operators [MAF∗09]](https://img.pdfslide.us/doc/110x75/5f19adf44801060dc5207f96/real-time-high-fidelity-inverse-tone-mapping-for-vcgisticnritpublications2013bcs13mainpdf.jpg)