Embed Size (px)
Citation preview
In Proceedings of EuroHaptics 2003, Dublin, UK, July 2003 http://www.mle.ie/palpable/eurohaptics2003/
Perceptual Design of Haptic Icons
Karon MacLean and Mario Enriquez
Department of Computer Science University of British Columbia
2366 Main Mall Vancouver, B.C. V6T 1Z4, Canada
{maclean, enriquez}@cs.ubc.ca
Abstract: The bulk of applications for haptic feedback employ direct rendering approaches wherein a user touches a virtual model of some “real” thing, often displayed graphically as well. We propose a new class of applications based on abstract messages, ranging from “haptic icons” – brief signals conveying an ob-ject’s or event’s state, function or content – to an expressive haptic language for interpersonal communication. Building this language requires us to understand how synthetic haptic signals are perceived, and what they can mean to us. Experiments presented here address the perception question by using an effi-cient version of Multidimensional Scaling (MDS) to extract perceptual axes for complex haptic icons: once this space is mapped, icons can be designed to maximize both differentiability and individual salience. Results show that a set of icons constructed by varying the frequency, magnitude and shape of 2-sec, time-invariant wave shapes map to two perceptual axes, which differ depending on the signals’ frequency range; and suggest that expressive capability is maxi-mized in one frequency subspace. Keywords: Haptic interfaces, icon design, multidimensional scaling analysis.
1 Introduction Sensory overload is a common problem with contemporary computer user interfaces, particularly for those that connect users to computation embedded in portable devices and non-desktop environments. These are increasingly pervasive, often have complex functionality, and are frequently used in contexts which pose multiple demands on a single sensory modality: e.g., accessing a cell phone while driving or sitting in a thea-tre, or using a remote control that requires visual inspection while watching TV. A theme of our group’s research is to create ways in which an underutilized haptic sense can absorb more of the demand that modern interfaces place on vision and audition.
With few exceptions, haptic force feedback research has been devoted to direct rendering of virtual environments. Most force feedback devices enable 3D manipula-tion of graphically displayed models, and tend to be expensive and non-portable. They are used in desktop applications such as training simulators for laparoscopic surgery, sculpting of 3D models and design of mechanical assemblies. The user feels and ma-nipulates the same thing he sees; the graphical image is rendered haptically.
Haptic feedback is well suited for a radically different kind of contribution, poten-tially of much larger scope, by rendering abstract models or concepts as a new modal-
2
ity for communication. At the lowest level, devices and objects notify users of an event, their identity or their current state or contents. Simplistic versions, such as pager vibrators, have existed for years. However, we argue that this binary or ampli-tude-graded signal contains far less intelligible information than may be possible with systematic, perceptually guided design; and that in the future, it may support expres-sive and nuanced communication that qualifies as a new haptic language.
1.1 Haptic Icons We define “haptic icons” for our purpose as brief computer-generated signals, dis-played to a user through force or tactile feedback to convey information such as event notification, identity, content or state. While these icons might also be constructed from real texture or mechanisms, this would not permit dynamic computer control and is ultimately of narrow applicability. Synthetic icons may be experienced passively or explored actively; they may be composed from one or many parameters; their signal can be steady or vary over time (e.g., a sinusoid with an amplitude envelope that in-creases or decreases). The haptic icon editor of Enriquez et al. illustrates the possible variety [4]. However, this kind of manual, intuitive design makes it difficult to predict whether a set of icons will be either easily distinguishable or salient in combination.
1.2 Approach: Perceptual Design The first step towards abstracted haptic communication is to understand how synthe-sized haptic signals are perceived: which parameters are most salient, how they inter-act perceptually, and what kind of signals are easily distinguished. We wished to rep-resent this knowledge in a multi-dimensional design space, within which an icon de-signer can systematically compose a set of icons with specified characteristics and maximum information carrying capacity. For example, to create a set of 5 easily dis-tinguished icons, he could pick 5 maximally spaced locations in a volume defined by the parameters that his display can control, and rotate them to find the most appealing set. This early stage is a necessary prerequisite to the specification of higher-level characteristics that will eventually support assignment of semantic meaning.
The goal of the research presented here is to establish a viable method for mapping haptic perception of complex stimuli in terms of key input dimensions for synthesized, passively presented haptic icons. We have chosen to analyze synthetically composed icons rather than natural ones (e.g. real textures) because we are looking specifically for a mapping between controlled display parameters to human perception.
Our approach is based on Multidimensional Scaling Analysis (MDS), which has al-ready proved useful for perceptual mapping. Once validated for a small number of design parameters, this technique is easily extensible.
2 Previous Work
2.1 Human Perception of Forces and Textures There is substantial literature on human tactile and force perception; most relevant here are studies that focus on perception of synthetic stimuli. E.g., Tan, Srinivasan, et al summarize a series of experiments determining various perceptual capabilities, including pressure, stiffness, position resolution and force magnitude [15]; while
3
Klatzky & Lederman have studied texture perception extensively, most recently touch-ing through a stylus [8]. These results apply to “pure”, single-parametered stimuli, and do not place them in an information-bearing context.
Nesbitt asked participants to explore objects with various rendered properties (hardness, roughness and inertia) and rank them in sets [11]; however, it appears that only one parameter was varied at a time, and levels adjusted independently.
Tan, Durlach, et al studied information transmission of complex synthesized signals composed by varying frequency, amplitude, motion direction and finger location [14]. Participants identified the middle stimulus in a sequence of three stimuli randomly selected from a given stimulus set. Rinker et al. examined human ability to discrimi-nate finger movements according to amplitude and frequency with the goal of receiv-ing synthesized speech information [13]. While revealing important clues about the amount of information we’ll eventually be able to encode in haptic signals, these stud-ies do not address methodical design of sets of signals to maximize the information capacity of the group as a whole.
2.2 Iconography for Other Senses Graphical and auditory icons have long been integral to computer interfaces, as a means of indicating functionality, location and other low-dimensional information. Easily identified by the user, they can be used to relate specific functions to abstract controls. Auditory and synthetic haptic icon design share key attributes: for example, both must be generally be temporally sequential.
Gaver et al. [5] defined “auditory icons” as representations of objects or notions that embody a literal, intuitive meaning: the sound of a paper being crushed indicates deleting a computer file. However, there is no systematic basis for determining rela-tive icon salience or differentiability, which can lead to problems. For example, the sound of an unimportant event might dominate the signal for an urgent event. Con-versely, Brewster et al. focused on quantifying people’s ability to perceptually differ-entiate “Earcons”: sounds and rhythms with no intrinsic meaning, whose meaning has to be learned [1]. They found that structuring bursts of sound aided in differentiation, as did varying musical timbre rather than using simple tones.
Our own approach shares more philosophically with Brewster’s, but we also have a long-term aim of adding the intuitive benefits of Gaver’s approach when we better understand the perception of complex haptic stimuli.
2.3 Multidimensional Scaling of Perceptual Quantities MDS is a tool for analyzing complex scenarios, and provides a means of representing complex perceptual data by uncovering its hidden structure [2]. The algorithm takes as input a dissimilarity matrix containing perceived distances between N items (here, haptic icons) and places them in a Euclidean space of specified dimension, such that inter-item distances approximate the specified dissimilarities. Stress is a measure of the fitness of the space’s dimension based on perceived distances between stimuli: as with data modeling in general, a higher-order model might provide a tighter fit (lower stress value), but at the cost of the model’s abstraction and/or clarity.
Once an appropriate dimensionality has been found, some ingenuity may be re-quired to interpret the meaning of the axes, particularly in the absence of accepted
4
statistical measures. The dimensions recovered by perceptual MDS are taken to be the most salient aspects, and the stimulus coordinates recovered in the scaling are inter-preted as the location of the objects along these salient aspects.
Some studies that have used MDS in sensory perception illustrate possible ap-proaches, payoffs and pitfalls. They exhibit a variety of means for obtaining dissimi-larity data and interpreting solution axes.
The initial and most well-known use of MDS to model perception is Grey’s analy-sis of timbre space, which resulted in a 3-D model of a percept which had long defied characterization [6]. Grey required participants to rate pairs of tones relative to one another. He employed synthetic rather than natural tones in order to control factors such as perceptual equalization, tone complexity and physical properties.
Ward devised a collection strategy whereby participants sort stimuli into clusters, rather than rating stimulus pairs [17]. This drastically increased the efficiency of evaluating large sample sets, and improved repeatability and accuracy.
Hollins et al. tested passive perception of real tactile surface texture [7]. Partici-pants sorted 17 stimuli (e.g. wood, sandpaper, velvet) into categories on the basis of perceived similarity, from which a 3-D MDS solution space was derived. Two axes were roughly associated with hard/soft and slippery-sticky; the third was difficult to interpret. While valuable for understanding tactile perception, Hollins’ naturalistic stimuli does not clarify the synthesis of tactile sensations, since it is not clear how to relate simulation parameters to the sensory percepts identified.
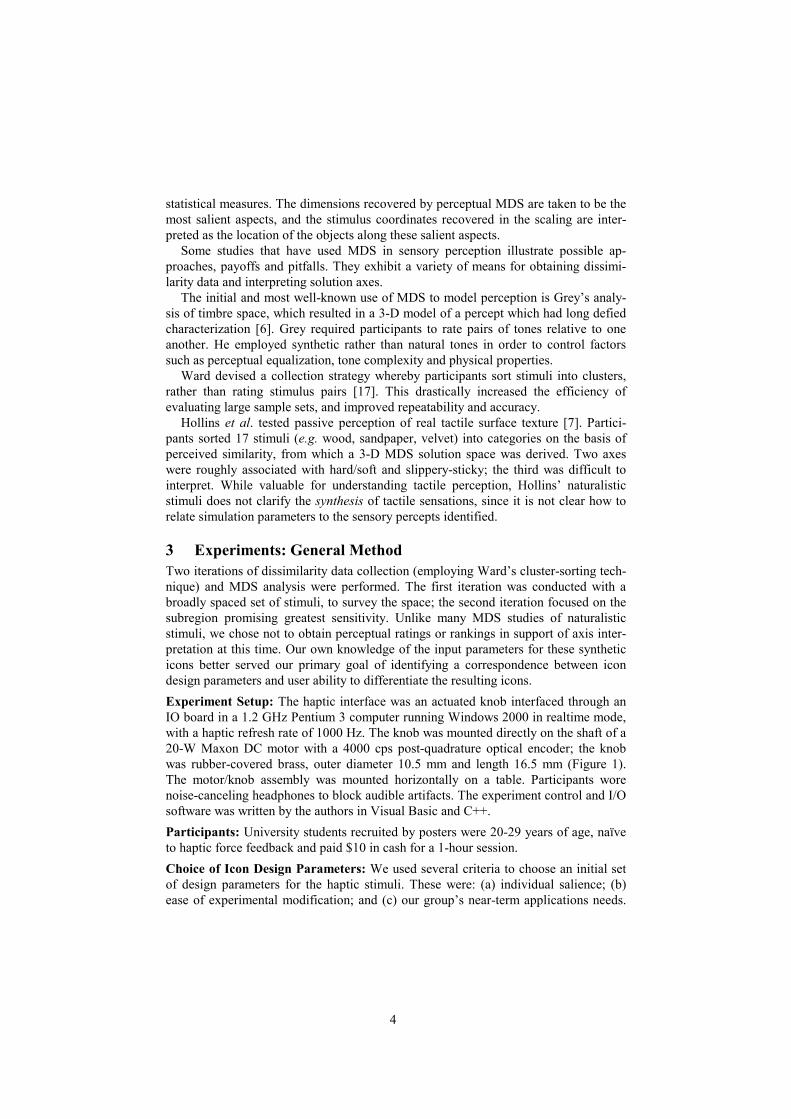
3 Experiments: General Method Two iterations of dissimilarity data collection (employing Ward’s cluster-sorting tech-nique) and MDS analysis were performed. The first iteration was conducted with a broadly spaced set of stimuli, to survey the space; the second iteration focused on the subregion promising greatest sensitivity. Unlike many MDS studies of naturalistic stimuli, we chose not to obtain perceptual ratings or rankings in support of axis inter-pretation at this time. Our own knowledge of the input parameters for these synthetic icons better served our primary goal of identifying a correspondence between icon design parameters and user ability to differentiate the resulting icons. Experiment Setup: The haptic interface was an actuated knob interfaced through an IO board in a 1.2 GHz Pentium 3 computer running Windows 2000 in realtime mode, with a haptic refresh rate of 1000 Hz. The knob was mounted directly on the shaft of a 20-W Maxon DC motor with a 4000 cps post-quadrature optical encoder; the knob was rubber-covered brass, outer diameter 10.5 mm and length 16.5 mm (Figure 1). The motor/knob assembly was mounted horizontally on a table. Participants wore noise-canceling headphones to block audible artifacts. The experiment control and I/O software was written by the authors in Visual Basic and C++. Participants: University students recruited by posters were 20-29 years of age, naïve to haptic force feedback and paid $10 in cash for a 1-hour session. Choice of Icon Design Parameters: We used several criteria to choose an initial set of design parameters for the haptic stimuli. These were: (a) individual salience; (b) ease of experimental modification; and (c) our group’s near-term applications needs.
5
We are interested in “haptic glance” usage: situations where the user is transiently in contact with the device or a specific controller state (opening a door, pressing a but-ton, or rapidly rotating a knob through many settings). With non-stationary signals, a user might miss the first part, or have to wait while a longer signal plays out. There-fore we made the critical and conservative restriction to time-invariant or simple peri-odic parameters, thus eliminating many salient variations including duration, time-varying envelopes and serial combination. Approach validation provided an additional argument: since temporal cues are qualitatively different and therefore likely to domi-nate spatial cues, we felt we were choosing a more subtle case in trying to maximize perceptual variation in these less salient but stationary factors. Aiming for a final stimulus set size of 30-50, we chose three primitives combined at 3-4 levels each; the exact number and value of levels for each parameter to be deter-mined based on pre-determined perceptual thresholds. Our choices were signal wave shape (initially sine, square, triangle and sawtooth), frequency and force amplitude. Determination of Perceptual Thresholds for Stimuli: To create a balanced stimulus set with parameters set at consistent “loudness”, we determined perceptual thresholds for the design parameters. These thresholds are likely to be a function of the haptic hardware, but we have developed an efficient technique for finding the minimum detectable (a) amplitude and (b) change in frequency for “pure” haptic stimuli [3]. Both tests are based on an adaptive identification technique [16].
A Detection Threshold test, based on 6 participants and 10 frequencies from 0.1-200 Hz, was used to determine the smallest easily detectable torque magnitude as delivered by our setup. For the least sensitive wave shape at the least sensitive fre-quency (sine at 0.1 Hz), participants required a force magnitude of 6.2 mNm to detect the signal 80% of the time. A Frequency Differentiation test confirmed that signals could be spaced as closely as 10% in frequency and still be distinguished. Initial Icon Composition: The triangle and sine wave shapes proved perceptually similar, so we eliminated the triangle. The DT test’s minimally detectable torque am-
Figure 1: Haptic display and experiment setup. A brass knob mounted directly on the motor shaft was covered with 1-mm rubber to prevent slipping while adding little compliance. The adjustable vise mount and cushioned armrest made the setup customizable and comfortable. Participants were asked to hold the knob lightly between thumb and index finger.
6
plitude level was doubled for the “low” magnitude setting; a “high” level was chosen before it reached annoying levels. Finally, frequency was varied exponentially in size, beginning with 0.5 Hz and maintaining uniform intervals of 10% or greater through 100 Hz (the maximum our device could deliver without significant attenuation).
4 Experiment 1
4.1 Method
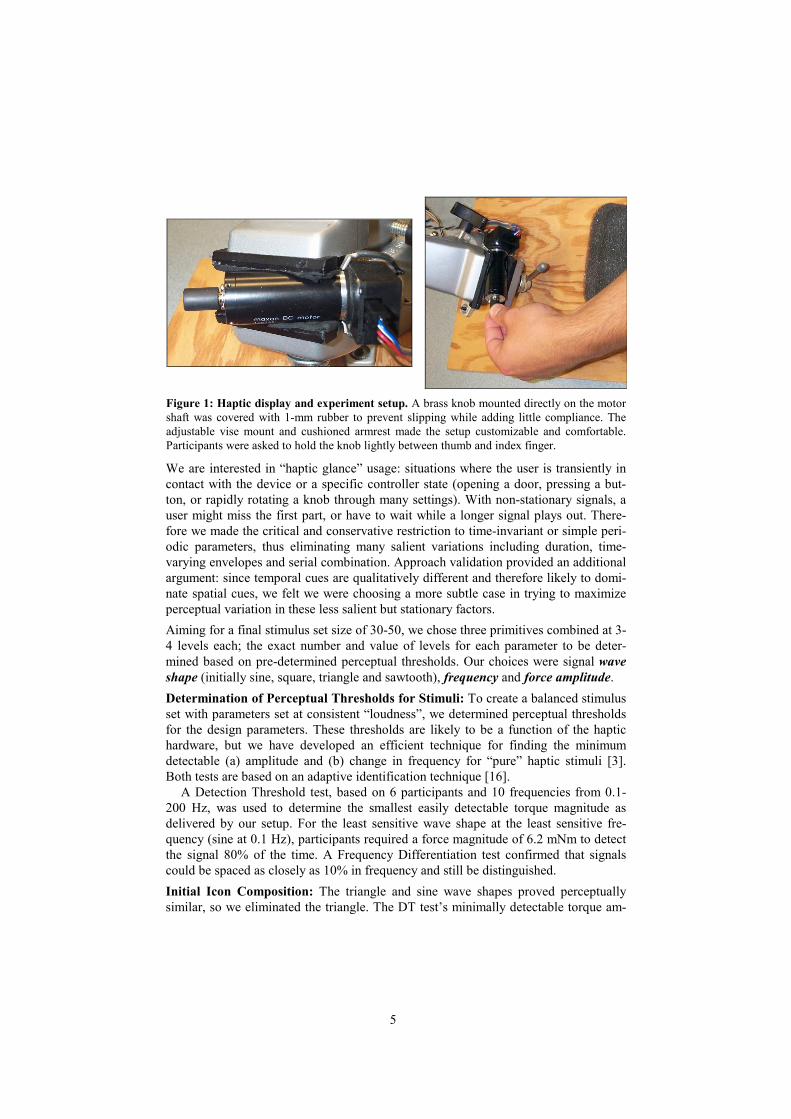
Participants: Experiment 1 used 8 participants (4 females and 4 males, all right-hand writers), each completing one session. Pilot studies indicated this size would deliver stable data, as indeed it did for both experiments. Stimulus Set: The initial experiment used 36 stimuli, combining 3 wave shapes (sine, square and sawtooth), 4 frequencies (0.5, 5, 20 and 100 Hz) and 3 amplitudes (12.3, 19.6 and 29.4 mNm), each with duration of 2 seconds. All force magnitudes are scaled as torque values in peak-to-peak mNm. Sorting procedure: An experiment session had 5 blocks. For each block, participants sorted stimuli – represented by graphical markers displayed haptically when clicked with a mouse (Figure 2) – into a number of groups; they were instructed to use “any criteria you want”. For the first block, participants chose the number of groups. For the remaining 4 blocks, the number of groups was pre-determined so as to form a completed test-set of approximately 3, 6, 9, 12, and 15 groups. Thus, if a participant freely selected 5 groups for the first block, in the following 4 blocks he was forced to employ (in random order) 3, 9, 12 and 15 groups. A session required ¾ -1 hour.
Calculation of dis-similarity matrix: For each block in the session, if two particu-lar stimuli coincided in the same group, a similarity value equal to the number of groups for that block was assigned to the stimulus pair. These values were added for all blocks in the ses-sion. For example, if stimuli 1 and 3 were grouped together for the blocks with 3, 9 and 15 groups but not for the blocks with 6 and 12 groups, the similarity measure for this pair was calcu-
Figure 2: Screenshot of the program used to obtain dissimilarity data from participants, after several placements. Each numbered tile on the bottom represents a single haptic icon. Participants could “feel” stimuli as many times as desired while sorting the tiles into groups (larger boxes on the top of the screen).
7
lated as 3+9+15=27. The maximum possible similarity measure was thus 3+6+9+12+15=45.
For each participant, similarity values for each stimulus pair (0-45) were linearly converted to dissimilarity (1000-0), with 1000 being most unlike; and used to populate that participant’s dissimilarity matrix. An aggregate dissimilarity matrix was then constructed with the average values for all participants. Thus for Experiment 1, each cell of the final matrix contained the average of 8 values. The result was processed using Alscal PC [10] to obtain the MDS solution.
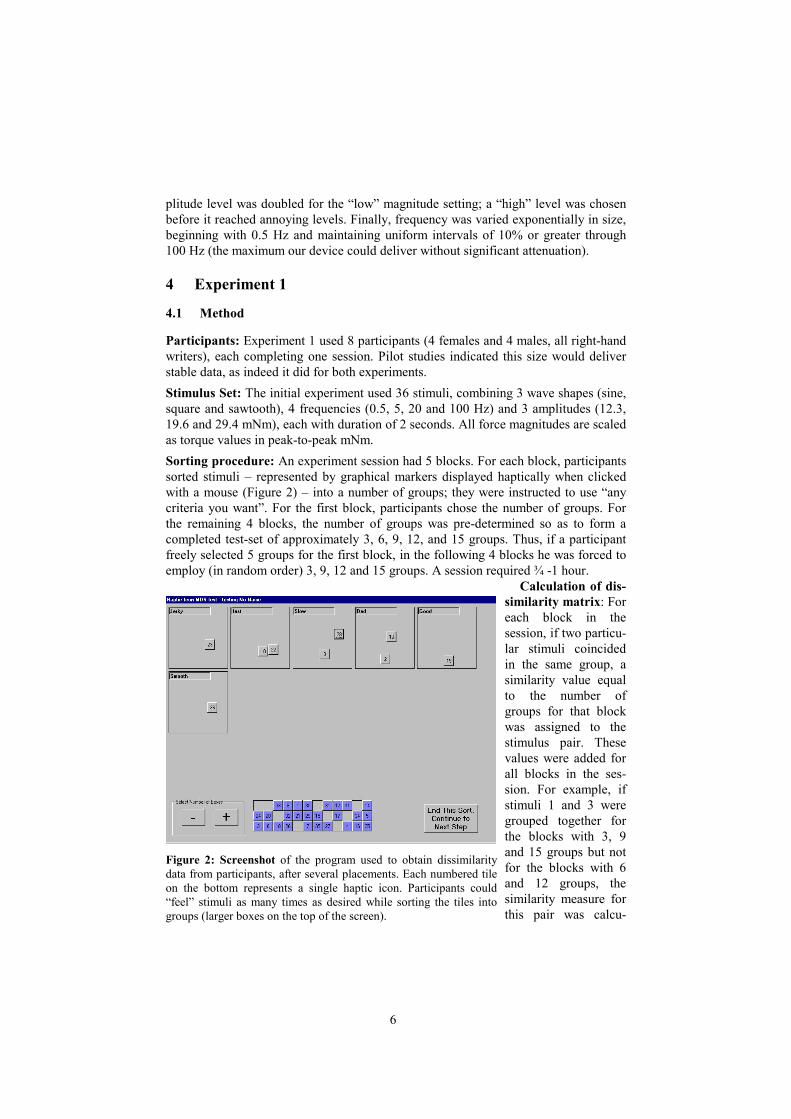
4.2 Results Figure 3 (Right) shows stress (revealing fit to data for a selection of dimensions) for Experiment 1. It is conventional to use the marked “elbow” (seen here at 2 dimen-sions) on the basis of parsimony and diminishing returns for the more complex model; although the fit does improve slightly for 4 dimensions. 3- and 4-D solutions (not shown) did not offer further clarification regarding disposition of input parameters to perceived axes. Figure 3 (Bottom) shows the 2-D MDS solution for the 1st icon set, and demonstrates a strong grouping based on frequency, particularly at 0.5 and 100 Hz; in fact, frequency subsumes most of both dimensions, as evinced by its central occupation of 4 quadrants. Wave shape is probably of second importance in the groupings, followed closely by amplitude. Stimuli sharing a 5 Hz frequency have the greatest spread of other stimulus parameters, followed by 20 Hz.
5 Experiment 2 Experiment 1 results suggested that frequency dominates our other parameters, except
Figure 3: (Left) MDS solution for the Experiment 1 icon set at 2 dimensions (average ofsolutions for all participants). Marker size, shade and shape encode stimulus amplitude, fre-quency and wave shape. (Right) Stress values for Exp. 1 MDS solutions at 1-5 dimensions.
8
in the region of 5 and to a lesser extent, 20 Hz. On the hypothesis that a stimuli set composed solely from this region would increase overall expressive capability, we performed an iteration focusing on frequencies between 5-20 Hz.
5.1 Method
Participants: Experiment 2 employed 9 right-handed participants (5F / 4M), each of whom conducted one session. 3 participants had also completed Experiment 1. Stimulus Set: To keep the stimulus set size reasonable, we used 30 stimuli: 3 wave shapes (sine, square and sawtooth), 5 frequencies (3, 7, 10, 16 and 25 Hz) and 2 am-plitudes (12.3 and 24.5 mNm), each with duration of 2 seconds.
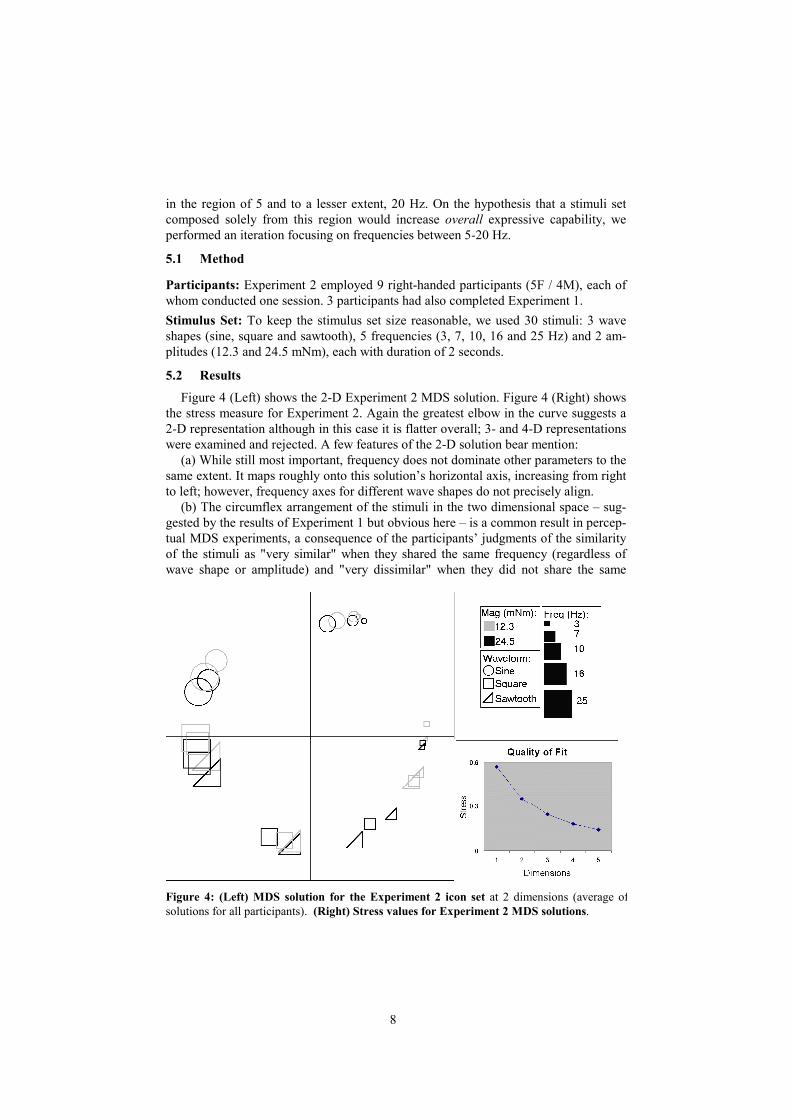
5.2 Results Figure 4 (Left) shows the 2-D Experiment 2 MDS solution. Figure 4 (Right) shows
the stress measure for Experiment 2. Again the greatest elbow in the curve suggests a 2-D representation although in this case it is flatter overall; 3- and 4-D representations were examined and rejected. A few features of the 2-D solution bear mention:
(a) While still most important, frequency does not dominate other parameters to the same extent. It maps roughly onto this solution’s horizontal axis, increasing from right to left; however, frequency axes for different wave shapes do not precisely align.
(b) The circumflex arrangement of the stimuli in the two dimensional space – sug-gested by the results of Experiment 1 but obvious here – is a common result in percep-tual MDS experiments, a consequence of the participants’ judgments of the similarity of the stimuli as "very similar" when they shared the same frequency (regardless of wave shape or amplitude) and "very dissimilar" when they did not share the same
Figure 4: (Left) MDS solution for the Experiment 2 icon set at 2 dimensions (average ofsolutions for all participants). (Right) Stress values for Experiment 2 MDS solutions.
9
frequency. The resulting distri-bution of judgments along the similar-dissimilar scale results in the stimuli being arranged as far as possible from each other in the two dimensional plane, thus the circumflex.
(c) There is a clear separa-tion between the sine and the square / sawtooth shapes. Effect of 3-Cluster: Every participant was required to perform one stimulus-sort into 3 groups (as well as 6, 9, 12, and 15 groups). The 3-group was the most lightly weighted. Nevertheless, to ensure it was not responsible for the 3 domi-nant groups seen especially in Figure 3 (if the stimuli grouped naturally into 4 groups, then forcing them into 3 might result in 3 tight groups plus 1 “unde-cided’ group) we re-analyzed the data without the 3-group. The MDS solutions for both
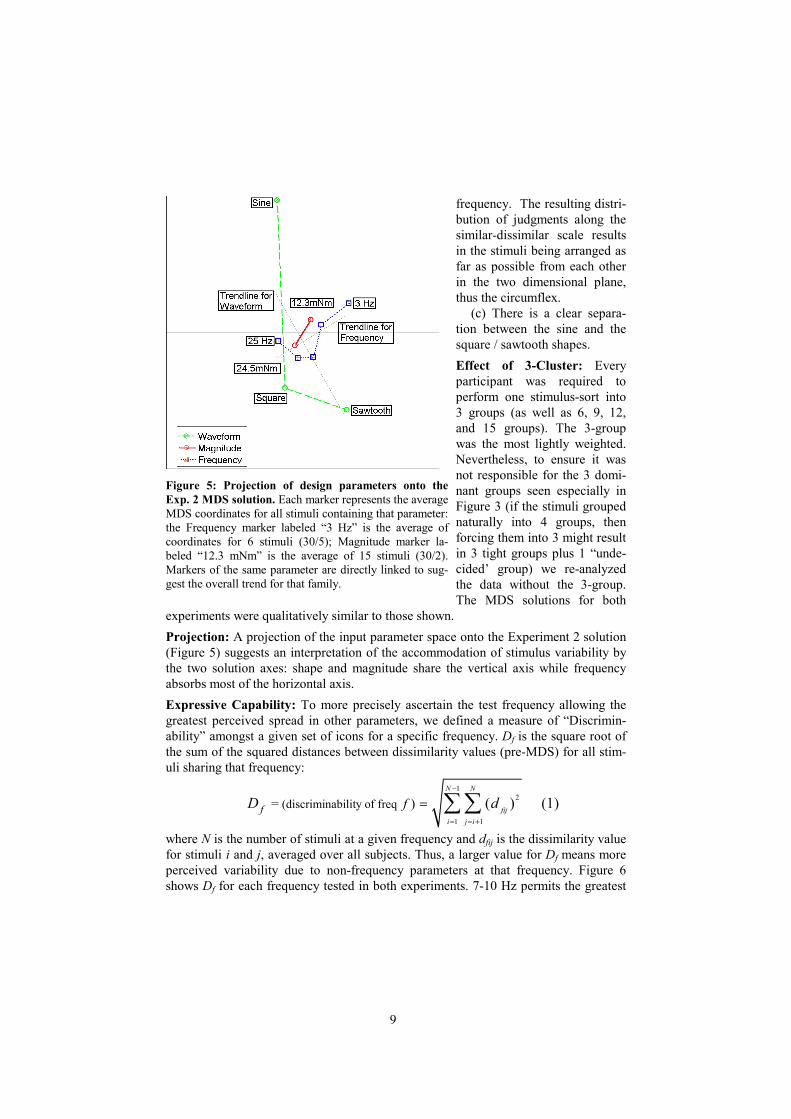
experiments were qualitatively similar to those shown. Projection: A projection of the input parameter space onto the Experiment 2 solution (Figure 5) suggests an interpretation of the accommodation of stimulus variability by the two solution axes: shape and magnitude share the vertical axis while frequency absorbs most of the horizontal axis. Expressive Capability: To more precisely ascertain the test frequency allowing the greatest perceived spread in other parameters, we defined a measure of “Discrimin-ability” amongst a given set of icons for a specific frequency. Df is the square root of the sum of the squared distances between dissimilarity values (pre-MDS) for all stim-uli sharing that frequency:
12
1 1
(discriminability of freq = ) ( ) (1) N N
fiji j i
f fD d−
= = +
= ∑∑
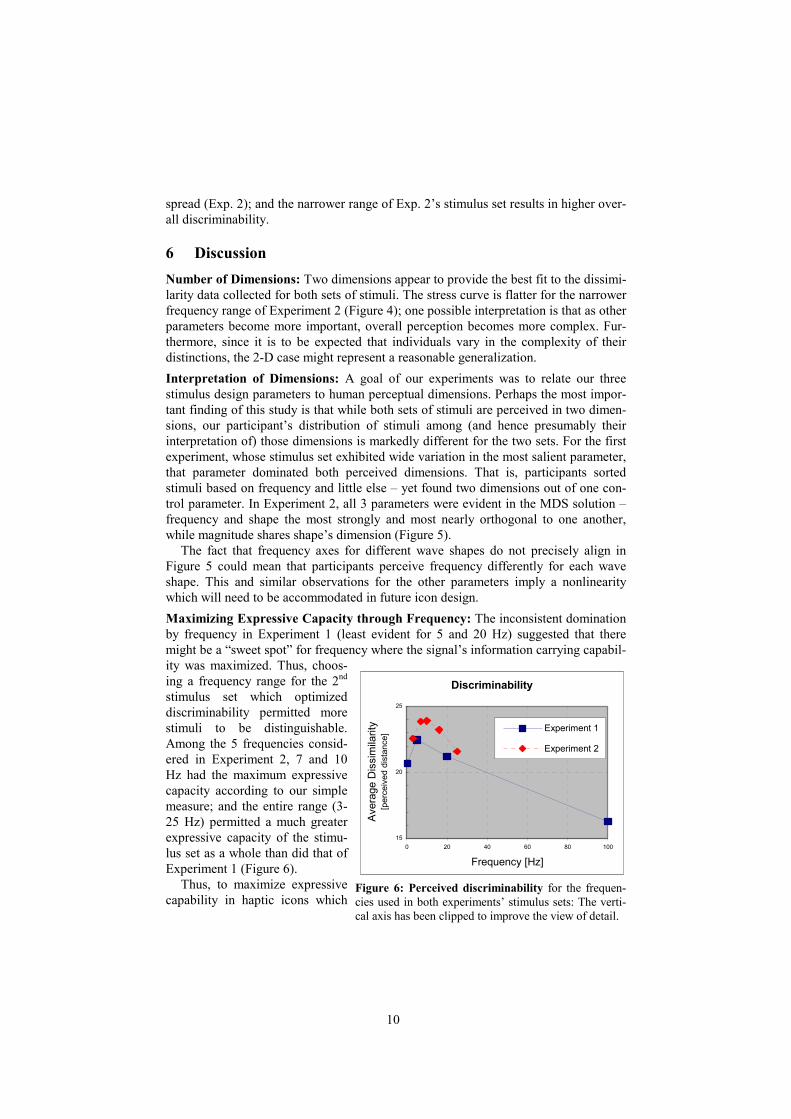
where N is the number of stimuli at a given frequency and dfij is the dissimilarity value for stimuli i and j, averaged over all subjects. Thus, a larger value for Df means more perceived variability due to non-frequency parameters at that frequency. Figure 6 shows Df for each frequency tested in both experiments. 7-10 Hz permits the greatest
Figure 5: Projection of design parameters onto the Exp. 2 MDS solution. Each marker represents the average MDS coordinates for all stimuli containing that parameter: the Frequency marker labeled “3 Hz” is the average of coordinates for 6 stimuli (30/5); Magnitude marker la-beled “12.3 mNm” is the average of 15 stimuli (30/2). Markers of the same parameter are directly linked to sug-gest the overall trend for that family.
10
spread (Exp. 2); and the narrower range of Exp. 2’s stimulus set results in higher over-all discriminability.
6 Discussion Number of Dimensions: Two dimensions appear to provide the best fit to the dissimi-larity data collected for both sets of stimuli. The stress curve is flatter for the narrower frequency range of Experiment 2 (Figure 4); one possible interpretation is that as other parameters become more important, overall perception becomes more complex. Fur-thermore, since it is to be expected that individuals vary in the complexity of their distinctions, the 2-D case might represent a reasonable generalization. Interpretation of Dimensions: A goal of our experiments was to relate our three stimulus design parameters to human perceptual dimensions. Perhaps the most impor-tant finding of this study is that while both sets of stimuli are perceived in two dimen-sions, our participant’s distribution of stimuli among (and hence presumably their interpretation of) those dimensions is markedly different for the two sets. For the first experiment, whose stimulus set exhibited wide variation in the most salient parameter, that parameter dominated both perceived dimensions. That is, participants sorted stimuli based on frequency and little else – yet found two dimensions out of one con-trol parameter. In Experiment 2, all 3 parameters were evident in the MDS solution – frequency and shape the most strongly and most nearly orthogonal to one another, while magnitude shares shape’s dimension (Figure 5).
The fact that frequency axes for different wave shapes do not precisely align in Figure 5 could mean that participants perceive frequency differently for each wave shape. This and similar observations for the other parameters imply a nonlinearity which will need to be accommodated in future icon design. Maximizing Expressive Capacity through Frequency: The inconsistent domination by frequency in Experiment 1 (least evident for 5 and 20 Hz) suggested that there might be a “sweet spot” for frequency where the signal’s information carrying capabil-ity was maximized. Thus, choos-ing a frequency range for the 2nd stimulus set which optimized discriminability permitted more stimuli to be distinguishable. Among the 5 frequencies consid-ered in Experiment 2, 7 and 10 Hz had the maximum expressive capacity according to our simple measure; and the entire range (3-25 Hz) permitted a much greater expressive capacity of the stimu-lus set as a whole than did that of Experiment 1 (Figure 6).
Thus, to maximize expressive capability in haptic icons which
Discriminability
15
20
25
0 20 40 60 80 100
Frequency [Hz]
Aver
age
Dis
sim
ilarit
y[p
erce
ived
dis
tanc
e]
Experiment 1
Experiment 2
Figure 6: Perceived discriminability for the frequen-cies used in both experiments’ stimulus sets: The verti-cal axis has been clipped to improve the view of detail.
11
employ frequency as a parameter, frequency range should be carefully considered; and at least for the set of design parameters and stimulus duration used here, a range be-tween 5-20 Hz appears optimal in this regard. Frequencies outside this range may also be used, but the contribution from other design parameters will be less salient throughout the set. Evidence of Range Effect in Groupings: When a set of stimuli contains variations on a specific characteristic over a range, the results of a perceptual test for those stim-uli might exhibit a clustering at the extremes of the range. The “Range Effect” is a consequence of the ability to identify one or both of the extremes more easily than points within it [12]. The extremes serve as anchors from which to base perceptual judgments, near which responses are grouped. The range effect may be one explana-tion for the tight clustering observed in the MDS solution for Experiment 1 (Figure 3). If so, its lessened impact for the Experiment 2 stimulus set, which did not contain such extremes of frequency, could imply that to maximize expressive capability for a set as a whole, extremes should be avoided. Effect of Shape - Smooth vs. Jerky: As observed in Figure 5, there is a clear separa-tion between the sine and the square / sawtooth wave shapes. This is likely due to the discontinuity of the square and sawtooth waves relative to the smooth derivatives of the sine wave (further supported by evidence that edges are processed early in the haptic pipeline [9]). However, Figure 4 suggests that separations between smooth and discontinuous shapes diminish with frequency; experience with the stimuli confirms that these shape differences were indeed less perceptible at higher frequencies. Passive Exploration: In these experiments, icons were temporally based and experi-enced passively: participants could not explore them in time and space as they would, for example, spatially displayed surface textures. We chose this approach because of the nature of the space we are designing for. It constitutes an important limitation of the icon design space we addressed here, but not necessarily of the technique itself.
7 Conclusions and Future Work The stimulus design, data collection and analysis techniques presented comprise an innovative approach to the design of haptic icons, which in turn portend a new com-munication medium for interactive devices. Our results support the method’s promise.
Specific contributions of the present study include observations that for synthetic haptic icons, (a) frequency plays a dominant perceptual role among a set of time-invariant parameters; (b) users’ assignment of perceptual dimensionality is affected by the composition of the entire stimulus set, and specifically by the range of the domi-nant parameter employed; (c) to maximize expressive capability of other design pa-rameters, frequency should be varied around a relatively narrow range – probably 5-20 Hz; and (d) beyond frequency, wave shape and finally force magnitude are most im-portant perceptually among this set of parameters.
The present study was confined to time-invariant parameters and passively felt stimuli. We used time-invariant signals because we are designing for “haptic glance” interactions; however, time-variant and actively explored signals will provide salient additional dimensions for longer signals. The results of this study underscore the chal-
12
lenges in combining very salient with more subtle parameters without losing expres-sive capability, but also demonstrate a powerful tool for optimizing this kind of de-sign. We are presently extending our efforts in this direction. Likewise, we anticipate that the mode of usage will influence icon perception: does the user actively explore, what is his context, and what other demands are on his attention? For example, we are integrating the presented work into studies of conscious and nonconscious stimulus perception in the driving environment.
The MDS technique tells us about differentiability, but not about meaning. Ongoing work addresses this by developing new methods, some MDS-based, for designing icons based on user ability to associate icons with targets and relate them to hierar-chies. Thus this work is an integral first stepping stone to achieving our long-term goal of building a usable, designable haptic language. Acknowledgements: This work was supported in part by Immersion Inc., and espe-cially by Chris Hasser. We also thank Jason Harrison, Vince di Lollo and Lawrence Ward of UBC.
References [1] Brewster, S. A., Wright, P. C., and Edwards, A. D. N., “Experimentally derived guidelines
for the creation of earcons,” in Proc. of HCI'95, Huddersfield, UK, 1995. [2] Cox, T. F., Multidimensional Scaling: Chapman & Hall, 1988. [3] Enriquez, M., A study of haptic icons, M.Sc. Thesis, Univ. of British Columbia, 2002. [4] Enriquez, M. and MacLean, K., “The Hapticon Editor: A Tool in Support of Haptic
Communication Research,” in Proc. of The 11th Ann. Symp. on Haptic Interfaces for Vir-tual Environments and Teleoperator Systems, IEEE-VR2003, Los Angeles, CA, 2003.
[5] Gaver, W. W., “The SonicFinder: An Interface that Uses Auditory Icons,” Human-Computer Interaction, vol. 4:1, 1989.
[6] Grey, J. M., “Multidimensional perceptual scaling of musical timbres,” J. Acoust. Soc. Am., vol. 61:5, pp. 1270-1277, 1977.
[7] Hollins, M., Faldowski, R., Rao, S., and Young, F., “Perceptual dimensions of tactile surface texture: a multidimensional scaling analysis,” Perception and Psychophysics, vol. 54, pp. 697-705, 1993.
[8] Klatzky, R. L. and Lederman, S. J., “Tactile roughness perception with a rigid link inter-posed between skin and surface,” Perception & Psychophysics, vol. 61:4, 1999.
[9] Lederman, S. J. and Klatzky, R. L., “Relative Availability of Surface and Object Properties During Early Haptic Processing,” Journal of Experimental Psychology: Human Percep-tion and Performance, vol. 23:6, pp. 1680-1707, 1997.
[10] Lewyckyj, F. W. Y. R., Alscal User's Guide: Chapel Hill, 1996. [11] Nesbitt, K., “Experimenting with Haptic Attributes for Display of Abstract Data,” in Proc.
of Eurohaptics 2002, Edinburgh, Scotland, 2002. [12] Poulton, E. C., Bias in quantifying judgments: Hove Publications, 1989. [13] Rinker, M. A., Craig, J. C., and Bernstein, L. E., “Amplitude and period discrimination of
haptic stimuli,” Journal of the Acoustical Society of America, vol. 104, pp. 453-463, 1998. [14] Tan, H. Z., Durlach, N. I., Rabinowitz, W. M., and Reed, C. M., “Information Transmis-
sion with a Multi-finger Tactual Display,” in Proc. of Int'l Sensory Aid Conf., 1996. [15] Tan, H. Z., Srinivasan, M. A., Eberman, B., and Cheng, B., “Human Factors for the De-
sign of Force-Reflecting Haptic Interfaces,” in Proc. Haptic Interfaces for Virtual Envi-ronment and Teleoperator Systems, ASME/IMECE, DSC:55-1, 1994.

13
[16] Taylor, M. M. and Creelman, C. D., “PEST: Efficient estimates on probability functions,” Journal of the Acoustical Society of America, vol. 41, pp. 782-787, 1967.
[17] Ward, L., “Multidimensional Scaling of the Molar Physical Environment,” Multivariate Behavioral Research, vol. 12, pp. 23-42, 1977.


![schmidtm@cs.ubc.ca Abstract arXiv:1612.04337v1 [cs.CV] 13](https://img.pdfslide.us/doc/110x75/61acb1a11e31da5abf39094d/schmidtmcsubcca-abstract-arxiv161204337v1-cscv-13-.jpg)