Embed Size (px)
Citation preview
Lindenwood University Lindenwood University
Digital Commons@Lindenwood University Digital Commons@Lindenwood University
Dissertations Theses & Dissertations
Fall 10-2017
Perceptions of School Leaders Regarding the Benefits of Perceptions of School Leaders Regarding the Benefits of
Leadership Dashboards Leadership Dashboards
Chance A. Wistrom Lindenwood University
Follow this and additional works at: https://digitalcommons.lindenwood.edu/dissertations
Part of the Educational Assessment, Evaluation, and Research Commons
Recommended Citation Recommended Citation Wistrom, Chance A., "Perceptions of School Leaders Regarding the Benefits of Leadership Dashboards" (2017). Dissertations. 216. https://digitalcommons.lindenwood.edu/dissertations/216
This Dissertation is brought to you for free and open access by the Theses & Dissertations at Digital Commons@Lindenwood University. It has been accepted for inclusion in Dissertations by an authorized administrator of Digital Commons@Lindenwood University. For more information, please contact [email protected].
Perceptions of School Leaders Regarding the
Benefits of Leadership Dashboards
by
Chance A. Wistrom
October 2017
A Dissertation submitted to the Education Faculty of Lindenwood University in
partial fulfillment of the requirements for the degree of
Doctor of Education
School of Education

ii
Acknowledgements
I would like to thank my dissertation chair, advisor, and confidante, Dr. Brad
Hanson. Dr. Hanson was always available to provide dissertation support, words of
encouragement, and gentle prodding. I would also like to thank Dr. Sherry DeVore for
her patience and support during this process. In addition, my appreciation goes to Dr.
Ted Davis for encouraging me to pursue this degree and the position of superintendent.
Last, but certainly not least, I would like to thank the many mentors and colleagues who
have made this degree and career possible.
I especially want to thank my amazing wife, Sweet Sara, whose contagious
laughter, love, and complaints regarding extension payments motivated me to complete
this journey. Not a day goes by when I am not thankful for the gift of being her partner
in life’s adventures. I want to thank my two daughters, Andie and Josie, for their trust
that Daddy would rather be playing with them than working on his dissertation. Finally, I
want to thank my mother and father, Kathy and Ron, for being the consummate parents I
am striving to become daily.
iii
Abstract
Implementation of continuous improvement structures in education continues to expand
as demands for accountability increase in response to ongoing educational reform
(Frickx, 2015). Park, Hironaka, Carver, and Nordstrum (2013) found the systemic nature
of educational organizations often inhibits these organizations from successfully
implementing continuous improvement structures characteristic of high-reliability
organizations. Specifically, system leaders in educational entities are ill-equipped to lead
system improvement due to poor preparation and lack of focus on specific
implementation drivers (Kirkpatrick & Kirkpatrick, 2014). This has resulted in a need
for educational system leaders to develop a leadership dashboard similar to dashboards
created by Jack Stack (2013) and utilized by his Great Game of Business. Due to the
myriad of roles school administrators play in the daily operations and systemic
improvement of schools, it is vital administrators be equipped with a systematic tool to
focus leadership behaviors on needs specific to a continuous improvement plan (SIP) or
departmental improvement plan (DIP). This study involved examination of the
perceptions of Missouri educational system leaders regarding the impact of dashboards
on their efficacy to promote systemic improvement of the systems under their direction.
Interview responses were collected and analyzed using coding methods to identify
common words, phrases, and themes. The findings of this study revealed leadership
dashboards are beneficial in building leadership capacity to promote system
improvement. Educational leaders should be prepared to investigate the use of leadership
dashboards to build leadership efficacy necessary in leading highly systemic educational
organizations.
iv
Table of Contents
Acknowlegements .............................................................................................................. ii
Abstract .............................................................................................................................iii
List of Tables ................................................................................................................... vii
Chapter One: Introduction of the Study ............................................................................. 1
Background of the Study ....................................................................................... 2
Conceptual Framework .......................................................................................... 5
Statement of the Problem ....................................................................................... 7
Purpose of the Study .............................................................................................. 9
Research Questions .............................................................................................. 10
Definitions of Key Terms .................................................................................... 10
Significance of the Study ..................................................................................... 11
Limitations ........................................................................................................... 13
Summary .............................................................................................................. 14
Chapter Two: Review of the Literature ........................................................................... 15
Conceptual Framework ........................................................................................ 16
Impact of Legislation on Educational Reform ..................................................... 17
Background for Continuous Improvement .......................................................... 22
Total Quality Management .................................................................................. 25
Baldrige Model for Continous Improvement ....................................................... 26
Systems Thinking Component to Continuous Improvement Processes .............. 27
Inherent Data Driven Decision Making in Continuous Improvement ................. 30
Challenges of Implementing Continuous Improvement Processes in Schools .... 33
v
Success of Continuous Improvement Processes in Schools ................................ 36
Self-Efficacy and Data Driven Decision Making ................................................ 37
Impact of Accountability on Educational Leaders............................................... 38
Tenets of a High-Reliability Organization ........................................................... 39
Leadership Dashboards as Improvement Strategies ............................................ 40
Use of Data Dashboards in Education ................................................................. 41
The Need for Leadership Dashboards.................................................................. 44
Theoretical Basis Supporting Leadership Dashboards ........................................ 46
Summary .............................................................................................................. 52
Chapter Three: Methodology ........................................................................................... 54
Problem and Purpose ........................................................................................... 55
Research Questions .............................................................................................. 56
Research Design................................................................................................... 56
Ethical Considerations ......................................................................................... 57
Population and Sample ........................................................................................ 58
Instrumentation .................................................................................................... 61
Research Question One ........................................................................................ 61
Research Question Two ....................................................................................... 62
Research Question Three ..................................................................................... 63
Data Collection .................................................................................................... 65
Data Analysis ....................................................................................................... 65
Summary .............................................................................................................. 66
Chapter Four: Analysis of Data ....................................................................................... 68
vi
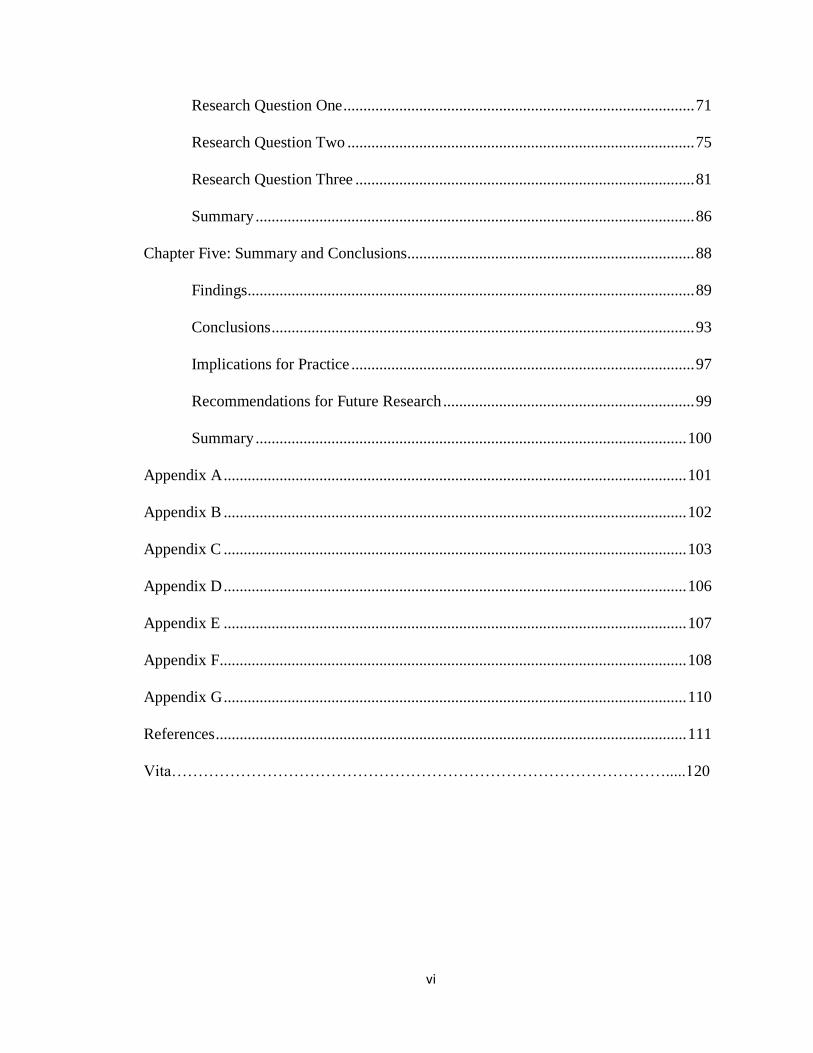
Research Question One ........................................................................................ 71
Research Question Two ....................................................................................... 75
Research Question Three ..................................................................................... 81
Summary .............................................................................................................. 86
Chapter Five: Summary and Conclusions........................................................................ 88
Findings................................................................................................................ 89
Conclusions .......................................................................................................... 93
Implications for Practice ...................................................................................... 97
Recommendations for Future Research ............................................................... 99
Summary ............................................................................................................ 100
Appendix A .................................................................................................................... 101
Appendix B .................................................................................................................... 102
Appendix C .................................................................................................................... 103
Appendix D .................................................................................................................... 106
Appendix E .................................................................................................................... 107
Appendix F..................................................................................................................... 108
Appendix G .................................................................................................................... 110
References ...................................................................................................................... 111
Vita………………………………………………………………………………….....120
vii
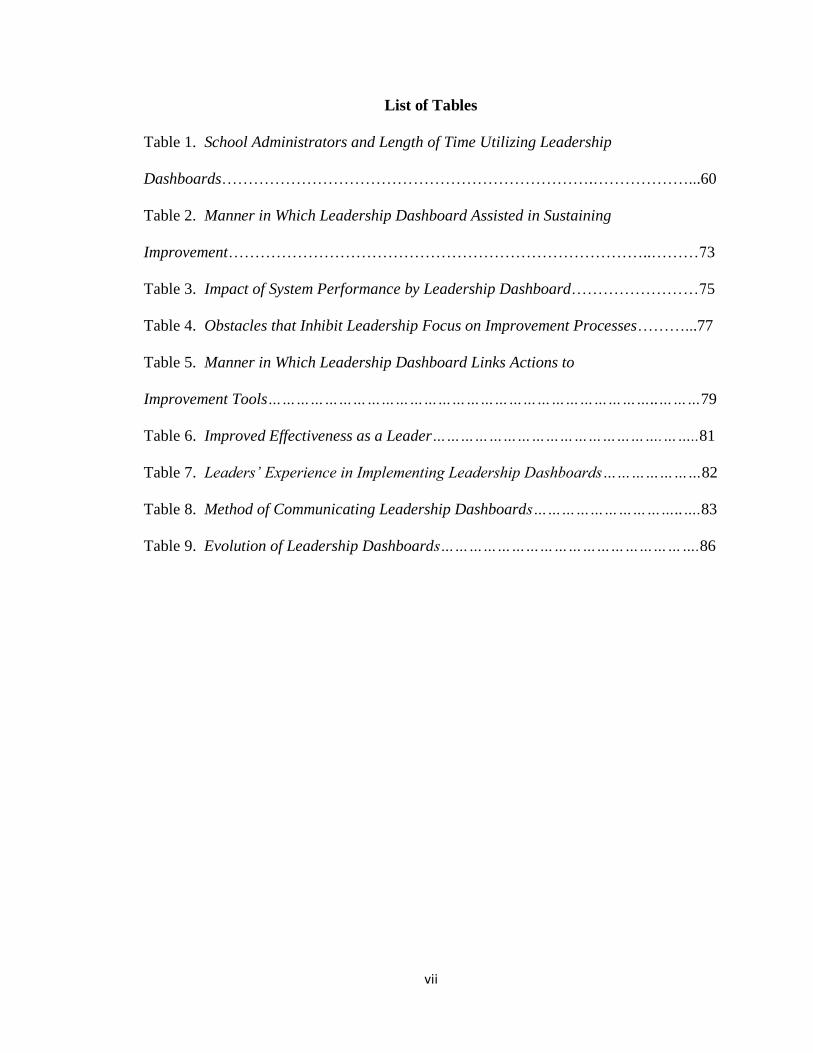
List of Tables
Table 1. School Administrators and Length of Time Utilizing Leadership
Dashboards…………………………………………………………….………………...60
Table 2. Manner in Which Leadership Dashboard Assisted in Sustaining
Improvement……………………………………………………………………..………73
Table 3. Impact of System Performance by Leadership Dashboard……………………75
Table 4. Obstacles that Inhibit Leadership Focus on Improvement Processes………...77
Table 5. Manner in Which Leadership Dashboard Links Actions to
Improvement Tools………………………………………………………………………..………79
Table 6. Improved Effectiveness as a Leader………………………………………….……..81
Table 7. Leaders’ Experience in Implementing Leadership Dashboards…………………82
Table 8. Method of Communicating Leadership Dashboards…………………………..….83
Table 9. Evolution of Leadership Dashboards……………………………………………….86
Chapter One: Introduction
The need for additional leadership tools was evident in Mrachko’s (2015)
assertion that “to enact large-scale instructional reform, school-level leaders need
opportunities and support to acquire the new skills necessary for its implementation” (p.
17). Mrachko (2015) further illustrated the need to equip school leaders with school
improvement tools:
Guiding the effective enactment and maintenance of school improvement
initiatives will depend on the generation of new knowledge surrounding the
development of appropriate capacities in system-level leaders to support,
implement, and manage sustainable change in the midst of teaching and learning.
For that development to occur, it would be of value to know how to characterize
successful system-level leadership, improve system-level leaders’ performance,
and recreate effective practices. It would be worthwhile for an initiative seeking
to foster this type of leadership at scale to create provisional designs for practice
at the system level and engage in their continuous improvement. (p. 19)
W. Edwards Deming’s Total Quality Management concepts were adopted and soon
evolved into a prevalent school improvement model titled the Continuous Improvement
Model (CIM) (Brown, Smith, & Steele, 2013). Researchers Best and Dunlap (2014)
asserted successful implementation of continuous improvement strategies by
organizations in healthcare, manufacturing, and technology has resulted in them being
“categorized as ‘high-reliability organizations,’ which strive to operate error-free under
high-risk conditions” (p. 1).
2
However, Park, Hironaka, Carver, and Nordstrum (2013) cited educational
organizations have traditionally been slow to adopt formal continuous improvement
methodologies and are rarely characterized as “high-reliability organizations.” The need
for a personal continuous improvement tool such as an administrative dashboard that can
be monitored daily is evident. Park et al. (2013) found, “The only way for quality
improvement work to be truly continuous is if it is woven into the fabric of the daily
work that individuals are constantly doing” (p. 5). Annual strategic plans and
organizational goals with lag measures do not qualify as continuous improvement (Park
et al., 2013).
Background of the Study
December 10, 2015, was a significant date in the history of public education, as it
was the day on which the Elementary and Secondary Education Act (ESEA) was
reauthorized in the form of the Every Student Succeeds Act (ESSA) (Shulman &
Hulnick, 2016). Before the reauthorization of the ESSA, the ESEA had not been
reauthorized since 2007 when Congress approved the No Child Left Behind (NCLB) Act
(Shulman & Hulnick, 2016). Before the passage of the ESSA, NCLB had been
characterized as the most “extensive legislative changes since the inception of the
department of education” (Schumpelt, 2011, p. 4).
The passage of the ESSA was significant in its unprecedented transfer of control
for accountability from the U.S. Department of Education to state educational agencies
(American Association of School Administrators [AASA], 2016). The 2016 American
Association of School Administrators (AASA) resource library on the ESSA illustrated
this by publishing, “States are now in charge of setting school performance standards and
3
putting in place accountability provisions. The entire federal infrastructure for
identifying low-performing districts and schools has been eliminated” (p. 1). While the
relinquishment of long-time federal control of public education to state control was well-
received, the 2017-2018 deadlines for state accountability plans quickly proved daunting
(Burnett, 2016). The 2007 recession left state educational agencies understaffed and ill-
prepared to transition from their previous role of NCLB compliance officers for federal
accountability to initiators of innovation in meeting ESSA accountability plans (Burnett,
2016).
The ESSA maintained the same emphasis on accountability as the NCLB Act and
thus necessitated ongoing continuous improvement processes encouraged by NCLB
(AASA, 2016). The current continuous improvement processes are an outgrowth of
Deming’s Total Quality Management (TQM) in Japan (O’Day & Smith, 2016).
According to O’Day and Smith (2016), “Continuous (quality) improvement has been a
focus for research and organizational change efforts in both public service and private
industry for decades” (p. 315). O’Day and Smith (2016) outlined the premise of
continuous improvement processes in the following manner:
While specific methodologies differ, continuous improvement processes generally
start with identification and analysis of a problem or practice in the given system,
followed by repeated cycles of inquiry in which a plan for addressing that
problem is developed, tested, revised based on data, and then implemented more
broadly (or retested anew), followed by new data and more refinement. (p. 315)
Unfortunately, past policies emphasized outcome data for accountability rather than
improvement (Hargreaves & Braun, 2013). Hargreaves and Braun (2013) explained, “In
4
the main, over more than a decade, these top-down initiatives in the U.S. have not had
positive effects on educational excellence or equity” (p. 3).
Dr. Daggett (2014), founder and chairman of the International Center for
Leadership in Education, identified benefits of aforementioned federal legislation
mandating additional accountability. Daggett (2014) posited ongoing legislation spurred
educational leaders to embrace the processes associated with continuous improvement
and to seek organizational change. Dr. Daggett’s (2014) research documented the
proliferation of data-based TQM models such as the Baldrige Model, which is embedded
in state education agencies and school districts throughout the nation.
The difficulty in capitalizing on continuous improvement’s narrow focus for
improvement is the public school system’s inability to reduce the number of goals due to
numerous competing demands schools much manage (Best & Dunlap, 2014). Unlike
many industries, the complex nature of educational institutions has often resulted in
ambiguous measures of organizational effectiveness (Lillis, 2012). Arnold and Marchese
(2011) identified fundamental differences in continuous improvement focus, the
organizational autonomy of materials, identification of product, improvement cycle
times, and disparities in performance measures as just a few of the inherent differences
that must be overcome to integrate continuous improvement systems into education.
System leaders occupy a crucial role in the implementation and sustainability of
continuous improvement processes (Best & Dunlap, 2014). Best and Dunlap (2014) cited
the research of Park et al. (2013), “Successful leaders use a formal improvement
methodology, create a vision for improvement, enable others to pursue that vision, and
monitor progress toward goals” (p. 3). Frabutt and Holter (2012) echoed this belief in
5
their assertion, “A truly effective leader is one who systematically uses data to answer
questions and takes an inquiry-based stance toward educational improvement” (pp. 254-
255).
Educational leaders are poorly equipped and often do not possess the necessary
skills to lead continuous improvement initiatives (Frabutt & Holter, 2012). Frabutt and
Holter (2012) recognized “scant focus and inconsistent delivery of courses related to
data-based decision making in higher education preparation of school leaders” (p. 255).
Researchers Best and Dunlap (2014) asserted future leaders of educational systems could
be better supported through “policy that provides for the training of school and district
leaders in continuous improvement that may help those leaders successfully incorporate
continuous improvement into their work” (p. 3).
Conceptual Framework
Jack Stack’s (2013) business leadership system titled the “Great Game of
Business” (GGOB) served as the guide for this study. Stack’s (2013) implementation of
the GGOB was predicated upon the following two essential questions: “If leaders are so
important, then how come we aren’t teaching people to lead all the time? Why don’t we
have an everyday system that works on giving people the tools they need to become
leaders?” (p. 11). Stack (2013) posited, “By using the Great Game of Business we can
delegate information to make people responsible for making decisions” (p. 11). Stack’s
(2013) systems thinking approach to leadership led him to surmise “the idea of working a
system instead of a hierarchy is that when you have a variance or a deviation, you attack
the reason for the discrepancy, not the person” (pp. 11-12). This theoretical change has
allowed implementers of the GGOB to “quit trying to cover holes with Band-Aids and
6
instead lay the foundation for a whole new operating system for the company” (Stack,
2013, p. 18).
In the early 1980s, Springfield Remanufacturing Corporation experienced limited
success, and leadership realized employees did not understand how their company’s parts
functioned as a whole, nor did employees have a voice to promote improvement (Stack,
2013). In response to this realization, Springfield Remanufacturing Corporation’s
leadership implemented the GGOB as a new operating system (Stack, 2013). The GGOB
served as a system improvement structure to provide common verbiage, common
company goals, systemic departmental goals, monitoring of progress, and a vehicle to
respond to results (Stack, 2013). The foundation for the success experienced in the
GGOB are the standards, or targets, departments and employees establish for their
spheres of influence (Stack, 2013). Standards serve as the primary system improvement
tool of system leaders (Stack, 2013).
In the GGOB, standards or targets are established, communicated to other
employees, monitored, and acted upon as trends emerge (Stack, 2013). Additionally,
standards are fluid and may be changed to address opportunities for improvement within
the system (Stack, 2013). The systematic implementation of standards has increased
employee efficacy, raised awareness of the systemic nature of the organization, and
improved organizational performance (Stack, 2013).
The problems identified in 1982 that led to the implementation of the GGOB
continue to persist in the field of education (Arnold & Marchese, 2011; Bryk, Gomez,
Grunow, & LeMahieu, 2015; Eck, Bellamy, Schaffer, Stringfield, & Reynolds, 2011).
School districts that have experienced success with systems improvement have utilized
7
tools aligned to the GGOB’s standards called educational dashboards (Rothman, 2015).
However, these educational dashboards are typically predicated upon the school or
departmental measures and are not related to targets associated with individual behaviors
such as the GGOB’s standards (Rothman, 2015). Contrary to traditional educational
dashboards predicated upon school or district outcomes, leadership dashboards are
similar to the GGOB’s structures, as they are predicated upon clearly stated system leader
inputs that drive organizational improvement (Kirkpatrick & Kirkpatrick, 2014). This
study was designed to identify the perceptions of school system leaders regarding the
effectiveness of leadership dashboards in supporting continuous improvement.
Statement of the Problem
The rapid adoption of private industry’s continuous improvement models has not
empowered public schools to meet the federal government’s mandates for school
improvement as outlined in NCLB and the ESSA (Arnold & Marchese, 2011). Many
have suggested the reason for this apparent lack of success may be attributed to the vast
difference between private industry and public school systems (Arnold & Marchese,
2011). The many differences between these entities include tangible versus intangible
products, quality control of raw materials, the distance between product and judgment,
and determinate versus indeterminate cycles (Arnold & Marchese, 2011). Arnold and
Marchese (2011) also found in addition to these differences, dissimilarities also exist in
the result of the associated continuous improvement cycle and length of the cycle. The
inherent goal of continuous improvement in most private industries is a reduction of
redundancies that produce human error, while the typical end goal of continuous
8
improvement in public education is the intensification of efforts toward the product of
student learning (Arnold & Marchese, 2011).
Further compounding the inherent differences between private industry and public
education are the roles the associated employees maintain in the ultimate product and
associated continuous improvement process (Park et al., 2013). Unlike private industry,
employees of the public school system fill a number of roles that indirectly impact
student learning (Park et al., 2013). In public education, there is no quality control
department, and although most job descriptions may not reference student learning, it is
still the ultimate bottom line for all departments (Park et al., 2013). This bottom line
necessitates a holistic understanding of each employee’s role in the product of student
learning and the continuous improvement process (Park et al. 2013).
The ambiguity of the “bottom line,” changes in raw resources, and diversity of
roles educators assume have resulted in a disconnect between organizational data-driven
decision-making processes and individual behaviors which drive organizational
improvement (Bryk et al., 2015). This disconnect necessitates a crosswalk between
organizational improvement structures and the monitoring of personal actions
(Kirkpatrick & Kirkpatrick, 2014). The crosswalk must be aligned within the
organizational improvement structures to promote the efficacy of the Plan Do Study Act
improvement cycle inherent in all continuous improvement models (Goodwin, 2011).
Additionally, Goodwin (2011) stated the crosswalk must contain fidelity and
performance measures to ensure personal behaviors are congruent and authentic with the
organization’s efforts.
9
Leadership dashboards similar to those implemented in Jack Stack’s (2013)
“Great Game of Business” model have been modified to provide the aforementioned
crosswalk (see Appendix A). These crosswalks allow individual employees, regardless
of position, to determine quantifiable behaviors to address opportunities for progress to
improve the bottom line of student learning (Kirkpatrick & Kirkpatrick, 2014). These
personal leadership behaviors are often overlooked as the system leader focuses only on
system goals and processes (Kirkpatrick & Kirkpatrick, 2014).
Purpose of the Study
The purpose of this study was to examine school administrators’ perceptions of
the impact of leadership dashboards on their efficacy to promote the systemic
improvement of the buildings under their direction. Due to the myriad roles school
administrators play in the daily operations and systemic improvement of schools, it is
vital administrators be equipped with a systematic tool to focus leadership behaviors on
specific needs of a school’s continuous improvement plan (SIP) or departmental
improvement plan (DIP).
The results of this study support the ability of educational leaders to meet the
increasing demand by policymakers to utilize data to establish accountability and
improve student achievement (Morrison-Danner, 2014). This study also supports and
provides a potential counterpoint to research that has indicated data literacy of
educational leaders is lagging and the capacity to properly utilize data must be improved
(Mandinach & Gummer, 2013). Specifically, the investigation of leadership dashboards
addresses the inadequacies identified by Morrison-Danner (2014) and Wayman, Spring,
Lemke, and Lehr (2012), who stated, “Research indicated there is a need to provide in
10
more detail how principals use data in ‘regular’ settings. The field lacks a concrete
research-based inventory of key principal behaviors that foster data use” (p. 35).
Research questions. The following research questions guided the research to
examine the type of systemic improvement tool that could provide focus to administrative
behaviors and increase administrator efficacy in continuous improvement:
1. How does the leadership dashboard enhance system improvement?
2. How does the leadership dashboard enhance the personal efficacy of system
leaders?
3. How does the fidelity of implementation of leadership dashboards impact
system improvement?
Definitions of Key Terms
For this study, the following terms are defined:
Continuous improvement. According to O’Day and Smith (2016), continuous
improvement is the identification of a barrier in a system improved by repeated cycles of
analysis in which a process to overcome the barrier is developed, assessed, revised, and
implemented more broadly in an attempt to improve the condition.
Critical mass. Critical mass is defined as a process to reduce resistance through
accrual of additional support and success (Coleman, Brooks, & Ewart, 2013).
Data-driven decision making (DDDM). As defined by Mandinach (2012), data-
driven decision making is the systematic accrual, analysis, and response to data to inform
practice and improve performance.
Data literacy. The North Carolina Department of Public Instruction (2013)
defined data literacy as the capacity to find, evaluate, and utilize data to inform decisions.
11
High-reliability organization (HRO). Researchers Weick and Sutcliffe (2015)
found high-reliability organizations are organizations consistent in realizing goals,
avoiding tragic errors, and responding to crisis events.
Quality improvement. Park et al. (2013) referenced University Research
Company, LLC (2017) in defining quality improvement as the structured use of
qualitative and quantitative evidence to improve the desired outcome of a system for an
end user.
Self-efficacy. Self-efficacy is the ability of an individual to organize actions and
processes to achieve a goal and belief in one’s ability, not the actual ability, to perform a
task or meet a goal (McCray, 2014).
System. As defined by Monat and Gannon (2015), a system is a group of highly
interconnected components, often possessing unique characteristics, which form a unified
entity whose success is contingent on the arrangement and connectivity of the
components.
Systems thinking. Systems thinking is defined as an approach that values the
interconnections among the components of a complex entity and synthesizes a unified
view of the entity (Monat & Gannon, 2015).
Significance of the Study
School administrators charged with ensuring continuous improvement will be the
primary benefactors of this study. The significance of this study lies in the collection of
perceptual data to contribute to the creation of a systemic improvement tool that links
measurable administrative behaviors to broad organizational continuous improvement
tools. This personal leadership tool is an essential and missing component of continuous
12
improvement plans typically implemented in public education. The personal leadership
tool will increase the efficacy of participants and provide the necessary crosswalk to
enable educators to implement and sustain continuous improvement models successfully.
A leadership dashboard is a quality tool currently missing from continuous
improvement models and may provide the leadership supportive implementation strategy
necessary for bridging the gap between system measures of school improvement
processes and personal leadership behaviors (Bernhardt, 2016). Leadership dashboards
require system leaders to identify specific areas of focus for their actions and to assign
measures to monitor the fidelity of their actions and the subsequent performance of their
actions (Stack, 2013). The system leader’s efficacy to impact system improvement will
be enhanced through the use of the leadership dashboard. An essential byproduct of this
quality tool is the use of data to nurture the transition from managerial leadership to
transformational leadership necessary for schools to excel in data-driven decision making
processes for school improvement (Bernhardt, 2016).
The use of leadership dashboards will allow school leaders to focus their
behaviors in a quantifiable manner on problematic areas in order to improve the
organizational goal of student achievement. The addition of dashboards to the
continuous improvement cycle personalizes the process and may likely increase the
collective efficacy of administrators (Donohoo, 2017). The public posting of
administrative dashboards also facilitates a culture of data-driven decision making and
accountability (Brown et al., 2013).
13
Limitations
The primary limitation of a qualitative study is that the findings cannot be
generalized to a population-at-large (Bloomberg & Volpe, 2016). Further compounding
this component of qualitative research is the sampling size of this investigation. The
sampling size included the selection of eight participants out of 20 school administrators
in one school district who implemented the dashboard tool at the start of the 2013-2014
school year. Participants who volunteered for the study and were subsequently selected
may not be indicative of the population.
Responses through perceptual data are also limited by the truthfulness of
respondents, data-literacy of the researcher, and knowledge of the subject matter by the
independent proctor (Bloomberg & Volpe, 2016). While the qualitative design adopted
for this study was chosen to ensure anonymity of all participants, the researcher could not
guarantee the willingness of participants to communicate their experiences fully.
Participants may have been unwilling to be critical of the subject of research due to the
fear of retaliation. The researcher attempted to assuage this limitation by employing an
independent proctor to conduct interviews and by eliminating all identifying information.
However, the use of an independent proctor may have resulted in an additional
limitation, as the proctor did not have significant knowledge capacity regarding the
subject of research. The limited knowledge capacity led to a limited ability to prompt
subjects to expand responses to interview questions. The limited ability to prompt
subjects to expand responses was evident in some participant responses to interview
questions that appeared to be overly concise.
14
Summary
This study was predicated upon Jack Stack’s (2013) system of leadership
development titled “The Great Game of Business.” Stack’s (2013) implementation of the
GGOB was founded upon the following two essential questions: “If leaders are so
important, then how come we aren’t teaching people to lead all of the time? Why don’t
we have an everyday system that works on giving people the tools they need to become
leaders?” (p. 11). The tools Stack (2013) referenced appear to be missing from the many
continuous improvement models public educators have implemented in the federally
mandated quest for improvement.
Chapter Two includes a review of literature about the impact of legislation on
educational reform and the adoption of continuous improvement models in public
education. This review includes a description of the prevalent continuous improvement
models in public education and the data-driven decision making component inherent in
each model. Chapter Two also includes a portrayal of the challenges and successes of
public education entities while adopting the continuous improvement models of private
industry. Chapter Two then includes information on the use of tools such as dashboards
to enhance the capacity of leaders to implement and sustain continuous improvement in
the field of education.
In Chapter Three, the methodology utilized in this study is presented. A
presentation of the analysis of data is included in Chapter Four. The findings,
conclusions, implications for practice, and recommendations for future research are
discussed in Chapter Five.
15
Chapter Two: Review of Literature
Dr. Bill Daggett (2014), founder and chairman of the International Center for
Leadership in Education, illustrated the dilemma of modern education: “American
schools are data rich but analysis poor” (p. 7). Frickx (2015) further elaborated:
Education institutions have a variety of continuous improvement frameworks
from which to choose to improve quality and effectiveness in their processes and
ultimately, their outcomes. There is, however, little research to identify how a
framework might relate to organizational performance. (p. 3)
Dr. Daggett (2014) confirmed, “We have volumes of data but, unlike our counter parts in
medicine, we have not learned how to monitor, track and introduce effective intervention
based upon the data we have” (p. 7).
The U.S. Department of Education (2011) stated one of its six goals embedded in
the 2011-2014 strategic plan was to “enhance the education system’s ability to
continuously improve through better and more widespread use of data, research and
evaluation, transparency, innovation, and technology” (p. 47). According to Frickx
(2015), “Continuous improvement has become a high priority in higher education, raised
to the national level with its inclusion in the Department of Education’s 2011-14
Strategic Plan” (p. 17). The inclusion of continuous improvement in the 2011-2014
strategic plan “demonstrates the belief that a continuous improvement culture benefits
education institutions, and that its development is vital to U.S. education” (Frickx, 2015,
p. 17).
Researchers Bryk et al. (2015) acknowledged the need for a leadership tool to
simplify the many processes of a complex system when they identified the “key to
16
improvement is seeing the actual organization of work amidst this complexity” (p. 46).
Chapter Two is organized to provide the reader with an overview of educational reform
and the focus on accountability that has encouraged educational institutions to adopt
continuous improvement processes. Chapter Two includes a description of the
challenges educational organizations have experienced in adopting prevalent continuous
improvement processes with inherent data-driven decision-making processes predicated
upon system thinking. The chapter culminates in a description of high-reliability
organizations and how a tool such as a leadership dashboard is essential for complex
educational institutions to become institutions of high reliability.
Conceptual Framework
The highly systemic nature of educational organizations creates inherent
challenges for leaders attempting to implement continuous improvement processes
(Lillis, 2012). In addition to the systemic nature of educational organizations, Bryk et al.
(2015) identified unique user needs and subsequent processes as challenges that must be
addressed for system improvement. Frickx (2015) found these characteristics of
educational organizations make it difficult to build consensus, develop common
organizational goals, and cultivate subsequent improvement processes. Rothman (2015)
asserted there is a need for a tool that establishes clear targets and monitors progress in
incremental units.
Jack Stack’s (2013) Great Game of Business (GGOB) has allowed system leaders
in private industry to “quit trying to cover holes with Band-Aids and instead lay the
foundation for a whole new operating system for the company” (p. 18). This system has
empowered organizations to establish an improvement process that provides a common
17
vocabulary, succinct organizational goals, common subsystem goals, progress
monitoring, and a tool to respond to results (Stack, 2013). The implementation of the
GGOB has improved employee efficacy, awareness of systemic interactions between
departments, and attentiveness to the impact of personal actions on system performance
(Stack, 2013). The improvements above associated with the GGOB appear to address
deficiencies in the self-efficacy of public school leaders and the connectedness of their
actions in driving system improvement (Goodwin, 2011).
Impact of Legislation on Educational Reform
The launch of Sputnik on October 4, 1957, initiated the first modern school
reform, which precipitated the National Defense Act in Education of 1958 (Conti,
Ellsasser, & Griffin, 2000). This act officially placed public education under the
umbrella of the federal government and ushered in the modern era of educational reform
(Conti et al., 2000). Concerned about the nation’s ability to compete in an emerging
global economy, Secretary of Education T. H. Bell ushered in the second reform of
public education in 1983 by creating the National Commission on Excellence in
Education (Conti et al., 2000). The purpose of the National Commission on Excellence
in Education was to rate the quality of the nation’s public education system (Conti et al.,
2000). T. H. Bell’s concerns regarding America’s ability to compete in an emerging
global economy were confirmed in the commission’s report titled A Nation at Risk (Conti
et al., 2000). Unlike the results of the country’s first report on public education, A Nation
at Risk proposed deficiencies were evident in nearly every aspect of public education
including curriculum, instruction, school leadership, and funding (Conti et al., 2000).
18
Unlike its predecessors, the No Child Left Behind Act of 2001 (NCLB) was
centered on student performance-based outcomes on standardized assessments to show
continuing improvement (Mrachko, 2015). The rapid expansion of accountability and the
associated ties to state and federal funding dictated both accreditation and revenue
assigned to public school districts (Mrachko, 2015). The NCLB Act’s unprecedented
mandate to disaggregate grade 3-12 assessments created an unofficial mandate for
structures to support data-driven decision making and research-based programs for
improvement (Mrachko, 2015).
Regardless of intent, legislation necessitated educational institutions develop a
culture of evidence predicated upon a continuous improvement process (Eaton, 2012).
The assessments mandated by NCLB did create a national movement toward the adoption
of systematic improvement models by local school districts after illustrating weaknesses
in student performance data (O’Day & Smith, 2016). The use of data and associated
continuous improvement processes was deemed a necessary component of NCLB to
improve the quality of education and provided stakeholders with information to evaluate
educational institutions (U.S. Department of Education, 2011).
Dr. Bill Daggett (2014), founder and chairman of the International Center for
Leadership in Education, summarized the impact and challenge of the aforementioned
legislative policies:
From the aftermath of the 1983 A Nation at Risk to the No Child Left Behind Act
of 2001 to the CCSS, TEKS, and SOL, new initiatives in education have always
been accompanied by strong reactions and emotionally packed debate. However
the need for continuous improvement and shifts in instructional practices is clear.
19
If we cut through the distractions, most people agree on the urgency and the intent
of these current initiatives: to prepare students to be successful in the rapidly
evolving economy. (p. 2)
The unprecedented collaboration among congressional leaders resulted in the passage of
the ESSA and officially marked the end of NCLB (Missouri Association of School
Administrators, 2015). Public education organizations such as the Missouri Association
of School Administrators (2015) applauded the abolition of NCLB by stating, “No Child
Left Behind’s approach to education relied heavily on standardized tests and lacked the
flexibility that states, school districts, and educators said they need in order to support
student success” (p. 1). This transition supported the research of Park et al. (2013), who
affirmed the need for “policy that allows education leaders to manage change via staff
training and promote stakeholder investment via shared decision making can help ensure
the successful integration of continuous improvement into schools and districts” (Best &
Dunlap, 2014, p. 4).
According to the White House Office of the Press Secretary (2015), the
fundamental purpose of the ESSA and reasoning for deviation from NCLB is to
accomplish the following:
The bill will target resources, attention, and effort to make gains for our students
attending schools most in need of help. Consistent with the policies in place
under the Administration’s ESEA flexibility agreements, the bill moves away
from NCLB’s one-size-fits-all accountability and ensures that states undertake
reforms in their lowest performing schools, in high schools with high dropout
rates, and in schools where subgroups are falling behind. It includes provisions
20
that would require districts to use evidence-based models to support whole-school
interventions in the lowest-performing five percent of schools and schools where
more than a third of high school students do not graduate on time and includes
dedicated funding to support interventions in these schools. In schools where
subgroups of students persistently underperform, school districts must mount
targeted interventions and supports to narrow gaps and improve student
achievement. If such schools are not showing improvement, the state will ensure
more rigorous strategies are put in place. Moreover, the Department of Education
has the authority it needs to ensure that states carry out their responsibilities. (p. 1)
The ESSA unraveled much of the federal oversight of education established in the 1958
National Defense Act in Education and was credited with “the end of an era in which the
federal government aggressively policed public school performance and returning control
to states and local districts” (Huetteman & Rich, 2015, p. A25).
Although the ESSA transferred much of the oversight of educational
accountability away from the federal government, individual states were mandated to
submit accountability plans to the U.S. Department of Education for approval prior to the
2017-2018 school year (“The Every Student Succeeds Act: Explained,” 2015).
Accountability plans included goals to address academic proficiency on tests, English-
language proficiency, and graduation rates (“The Every Student Succeeds Act:
Explained,” 2015). At a minimum, proficiency tests must include assessments in the
areas of mathematics and English language arts in grades 3-8 and once in high school
(“The Every Student Succeeds Act: Explained,” 2015). Additionally, a science
21
assessment must be administered one time in the elementary, middle, and high school
grade levels (“The Every Student Succeeds Act: Explained,” 2015).
The ESSA’s inherent flexibility and the July 2017 deadline for state
accountability plans necessitated the quick transition of state education departments from
the role of compliance officers for the federal government to innovators (Burnett, 2016).
The transition of roles was made more difficult by understaffed state education
departments previously downsized in response to the recession (Burnett, 2016). Burnett
(2016) illustrated the impact of understaffed state education departments in an interview
with Brenda Cassellius, Minnesota Educational Commissioner, who stated, “I have one
math specialist and one reading specialist and one person working standards” (p. 23).
Compounding the challenges associated with understaffed state departments of education
is the continual turnover of department leaders as evidenced by the national average
tenure of 3.2 years (Burnett, 2016).
While the ESSA transferred additional local control to state local educational
agencies (LEAs), it replicated the problems associated with previous federal legislation
by creating legislation with no associated regulations (Eck et al., 2011). Eck et al. (2011)
illustrated the dilemma this created for LEAs in the following description:
With federal educational legislation, states more often look to the non-regulatory
guidance to determine how to meet legal requirements. States then developed
new testing schemes and established new regulatory requirements of their own,
which they passed on to LEAs. Meanwhile, colleges of education across the
country were changing requirements in various courses and developing new
programs to assist schools and districts in meeting the requirements. More
22
aggressively, a broad range of for-profit corporations (such as text and software
publishers and consulting firms) and not-for-profit entities (such as the regional
laboratories and various foundations) began developing products, workshops, and
other materials to assist schools and LEAs in addressing the changes required in
NCLB. LEAs received this range of information and federal funds and made
diverse new requirements on schools, which in turn made new demands on
teachers. (pp. 10-11)
Eck et al. (2011) found LEAs are too often left to develop methods of meeting broad
legislative requirements absent of specific regulations.
Background for Continuous Improvement
Frickx (2015) defined continuous improvement as “the process by which an
organization improves its processes and performance on a systemic basis” (p. 16). The
difference between competing continuous improvement frameworks lies in the value each
framework places on organizational components such as leadership, feedback loops,
workforce development, and systems thinking (Frickx, 2015). Regardless of the value
assigned to these components, each continuous improvement framework is predicated on
the use of data and the systemic integration of continuous improvement processes into the
processes of the organizational structure (Baldrige Performance Excellence Program
[BPEP], 2011, 2013). When organizations meet these requirements for continuous
improvement, they transition from “making discrete changes to developing an institution-
wide culture of continuous improvement” (Frickx, 2015, p. 16).
23
Four primary differences exist among typical approaches to continuous
improvement and accountability by education systems (O’Day & Smith, 2016). Mark
Elgart (2016) outlined the four fundamental differences in the following manner:
#1. Focuses on root causes, not just outcomes. Rather than focus exclusively on
collecting and analyzing data on student outcomes without information about
what happens in the system to produce those outcomes, continuous improvement
provides detailed information about particular practices to identify important
connections between actions and results.
#2. Sees failure as a means to improve, not a reason to assign blame or sanctions.
Rather than seeing failure as an opportunity for blame and negative consequences,
continuous improvement uses failure as a means to identify needed assistance and
learning.
#3. Enables informed decision making based on rich context and evidence.
Rather than mandate solutions about what should be done when something fails
without considering what caused the problem or the strength of the evidence,
continuous improvement approaches enable educators to make decisions based on
context, so participants understand which solutions are likely to work for whom
and under what conditions.
#4. Places the source of accountability and decisions about action for
improvement within the system. Rather than placing the source of accountability
far from the district and school and removing local actors from setting goals and
identifying solutions to problems, the main source of accountability in a
continuous improvement approach resides within the system – with key players
24
within the organization focused on the practices and feedback loops they have put
in place. (p. 28)
As the national discussion regarding accountability increases, it is important to
differentiate between continuous improvement and accountability (O’Day & Smith,
2016).
Before investigating the premise of continuous improvement, one must delineate
the difference between continuous improvement and quality improvement. Quality
improvement focuses on a specific population of customers encountering a problem the
organization is attempting to solve (Park et al., 2013). To maximize success, standard
practices must exist so variation in system performance may be attributed to improved
processes and not to random acts of improvement (Park et al., 2013). This necessitates
the system be seen in its entirety and that the product, as well as standard processes, exist
so the “results are the natural products of the current state of affairs” (Park et al., 2013, p.
4). The systems perspective “implies that, in order to achieve improved results, one must
of necessity alter the system and the ways of working in it” (Park et al., 2013, p. 4). To
monitor achievement and meet quality improvement requirements, the system must
possess the capacity to measure and track key processes and outcomes on a day-to-day
basis (Park et al. 2013).
Lastly, quality improvement must include “the application of an evidence-based
methodology, with its inherent standards, protocols and guidelines” (Park et al., 2013, p.
5). Formal methodologies include Lean, Six Sigma, and the Model for Improvement
(Park et al., 2013). The type of methodology is typically dependent on factors such as
purpose, work focus, scale of implementation, and desired effect size (Park et al., 2013).
25
Total Quality Management
Many researchers have identified Edward Deming’s Total Quality Management
(TQM) as an early continuous improvement framework still prevalent today (Frickx,
2015). Total Quality Management incorporates the Plan-Do-Check-Act process
improvement model and is considered the foundation upon which other continuous
improvement models have been built (BPEP, 2011, 2013). Lunenburg and Ornstein
(2012) stated, “The concepts formulated by TQM founder W. Edwards Deming, have
proved so powerful that educators want to apply TQM to schools” (p. 194).
Deming’s principles not only apply to corporations, but they also translate to any
organization, including schools (Lunenburg & Ornstein, 2012). Lunenburg and Ornstein
(2012) posited:
[Deming’s work] is based on the assumption that people want to do their best and
that it is management’s job to enable them to do so by constantly improving the
system in which they work... it is an opportunity to conceptualize a systematic
change for a school district. (p. 5)
Deming’s philosophy of TQM “provides a framework that can integrate many positive
developments in education, such as team-teaching, site-based management, cooperative
learning, and outcomes based education” (Lunenburg & Ornstein, 2012, p. 194).
Lunenburg and Ornstein (2012) wrote school leaders have found Deming’s principles can
provide the formula for improving America’s schools. As educational leaders search for
methods to increase academic achievement, Deming’s principles have been identified as
the chosen method (Lunenburg & Ornstein, 2012).
26
Baldrige Model for Continuous Improvement
The emergence of the Baldrige Model for Continuous Improvement as one of the
TQM models of choice is substantiated by the number of school districts and states that
have embraced this model as their official school improvement program (Schumpelt,
2011). According to Frickx (2015), “The Baldrige Performance Excellence Program
(BPEP) was founded as the Malcolm Baldrige National Quality Award (MBNQA) in
1987 as a public-private partnership” (p. 21). The purpose of the BPEP and the
subsequent MBNQA was to increase “awareness of performance excellence as an
increasingly important element in U.S. competitiveness and the sharing of successful
performance strategies and information on the benefits of using these strategies” (BPEP,
2013, p. 55). Researcher Gretchen Frickx (2015) defined the BPEP as based “on the
principals of TQM and uses a framework of seven criteria against which institutions
assess their performance” (p. 18). Although similar to TQM, the BPEP relies on third-
party evaluation to qualify for the MBNQA, while TQM is entirely an internal process
(Frickx, 2015).
Institutions may choose to adopt and utilize the BPEP to improve performance or
may apply for the MBNQA that necessitates a third-party review process (Frickx, 2015).
Frickx (2015) found institutions choosing to pursue the MBNQA must implement the
following applications process and evaluation procedures:
The institution must prepare a self-study addressing all seven criteria. The self-
study is submitted, reviewed and scored by a team of examiners trained in the
criteria. Institutions may be selected for a site visit, during which the team
evaluates and scores the institution against the Baldrige Criteria utilizing a pre-set
27
rubric. A key element of the BPEP is the scoring guideline published with its
criteria... This scoring guideline requires the institution to show not only that it
has a process to satisfy the criteria (an approach), but also that the approach is
systematically shared across the organization (deployment), that it has been
evaluated and improved (learning) and that the approach works with and informs
other processes in the institution. (p. 22)
The third-party review process is “unique among continuous improvement frameworks,
and allows the evaluation to take into account how well an organization has integrated the
identified processes into its activities” (Frickx, 2015, p. 22). Since 1999, five public
school districts, one charter school, and three higher education institutions have earned
the MBNQA (National Institute of Standards and Technology [NIST], 2015).
The Baldrige criteria are “leadership, strategic planning, customer focus,
measurement, analysis and knowledge management, workforce and operations and
results” (NIST, 2015, p. 18). The Baldrige criteria were initially established for use in
the manufacturing, service, and small business sectors; however, the criteria were
expanded in 1999 to support the education and health care sectors (Frickx, 2015). Since
1999, the Baldrige criteria have been implemented in systems supporting primary,
secondary, and higher education throughout the United States (BPEP, 2011).
Systems Thinking Component to Continuous Improvement Processes
While researching the struggle of public school in America, Eck et al. (2011)
stated, “This is both a people problem and a system problem; some suggest it is mostly a
system problem” (p. 37). Bryan Goodwin (2011) summed up the importance of systems
thinking as related to continuous improvement when he stated one must think
28
systemically while acting systematically. Goodwin (2011) reiterated the importance of
this behavior when he noted, “Improvement efforts are most successful when
organizations remain focused on simple changes, building on them as they progress
toward a coordinated, systems wide response” (p. 14).
Educational institutions experiencing improved performance via continuous
improvement processes actively engage in breaking down silos inherent in their
organizations (Park et al., 2013). Park et al. (2013) posited these institutions utilize
systems thinking in the following method to enhance performance:
These institutions apply a systems-thinking approach to their work; as a result, of
breaking down the silos and bringing together individuals from across the system
is a natural part of how they do business. This allows them to understand the root
causes of the problems they face, develop a collective vision for the entire
organization, and to execute on strategies that recognize the interdependency of
the organization’s key processes. Most importantly, it builds a clear sense of
shared accountability among all that workers and larger constituency. (p. 23)
Researchers Ellen Mandinach and Edith Gummer (2013) summarized the research of
Park et al. (2013) when they stated systems thinking encourages organizations to
“examine the structure or the interrelationships among components that influence
behavior over time” (p. 33).
Bryk et al. (2015) concluded oversimplification of the term “system” by educators
often causes them to overlook the significance of system components for improved
outcomes. Bryk et al. (2015) stated the improvement of outcomes by an organization “is
the product of interactions among the people who engage with it, the tools and materials
29
they have at their disposal and the processes through which these people and resources
come together to do work” (p. 58). In simple systems, this oversimplification does not
hinder improvement, as the interactions are few in number and the outcomes can be
easily traced (Bryk et al., 2015).
In contrast, educational systems resemble complex systems where “the
interactions are many in number and densely interconnected” (Bryk et al., 2015, p. 58).
These systems “can manifest behaviors that one intentionally designed, and often it is
hard to predict fully the outcomes that may ensue from attempts to change them” (Bryk et
al., 2015, p. 58). This seemingly minor difference necessitates educational organizations
transition from a focus of efforts for improvement to a focus of efforts on learning to
improve (Bryk et al., 2015). The refocus of efforts on learning to improve demands
educational organizations transition “toward a design-development orientation, in which
we try out change ideas quickly, analyze what happens, modify the ideas based on what
we think we have learned, retry, and continue this learning cycle towards system
improvement” (Bryk et al., 2015, p. 58).
This transition necessitates the system be viewed in its entirety so desired
outcomes may be achieved reliably on the appropriate scale (Bryk et al., 2015). Bryk et
al. (2015) summarized this premise by asserting the addition of quality components to the
system does not assure a quality result. Atu Gawande (2012) provided an analogy to the
research findings of Bryk et al. (2015) in the following statement from his TED Talk
address:
What if you build a car from the very best car parts? Well, it would lead
30
you to put Porsche brakes, a Ferrari engine, a Volvo body, a BMW chassis. And
you put it all together and what do you get? A very expensive pile of junk that
does not go anywhere. (10:59)
Bryk et al. (2015) further corroborated Gawande’s (2012) comments by stating
organizations must attend to how the system components join “productively together for
the people charged with carrying out this work and for those that they seek to serve. In
short, we must make the system better” (p. 59).
The systems thinking component of continuous improvement assures a focus on
the system for improvement before a focus on personnel (Bryk et al., 2015).
Organizational improvement specialist Tom Nolan (2012) asserted poorly performing
personnel typically only account for approximately 6% of an organization’s performance
problems. This finding led organizational researchers to identify disorganized work
processes as the predominant cause of organizational failure (Bryk et al., 2015). The
systems thinking component of continuous improvement empowers organizations to
avoid “attribution error,” which is the tendency for organizations to assign blame to the
employees most closely associated with the unsatisfactory results (Bryk et al., 2015).
This avoidance results in a realization that “improving productivity in complex systems is
not principally about incentivizing more individual effort, preaching about better
intentions, or even enhancing individual competence” (Bryk et al., 2015, p. 61).
Inherent Data-Driven Decision-Making Component in Continuous Improvement
Data-driven decision-making (DDDM) processes are an essential element of
continuous improvement, as these processes “expose inequities, create transparency, and
help drive organizational improvement” (Hess & Mehta, 2013, p. 72). Regarding
31
education, Mandinach (2012) affirmed, “It is no longer acceptable to simply use
anecdotes, gut feelings, or opinions as the basis for decisions” (p. 71). The importance of
DDDM processes in school improvement was illustrated by Ben Jensen (2013):
Data-driven analysis is vital to a successful school turnaround. Before
improvements can be made it is necessary to know what the problems are and
where they lie. Continuous assessment helps to ensure that small failures do not
snowball into major failures. (p. 12)
In the U.S. Department of Education Strategic Plan for Fiscal Years 2011-2014,
Secretary of Education Arne Duncan demonstrated the importance of data-driven
decision making when he stated, “I am a deep believer in the power of data to drive our
decisions. Data gives us the roadmap to reform. It tells us where we are, where we need
to go, and who is most at risk” (U.S. Department of Education, 2011, p. 1). The
importance of the leader in utilizing DDDM was evidenced when Frabutt and Holter
(2012) proclaimed, “A truly effective leader is one who systematically uses data to
answer questions and takes an inquiry-based stance educational improvement” (pp. 254-
255).
Mandinach (2012) described the importance of the systemic use of DDDM
processes:
It is a generic process that can be applied in classrooms to improve instruction as
well as in administrative and policy settings. It can be applied by teachers,
principals, superintendents, other administrators, data entry clerks, chief state
school officers, and federal education officials. DDDM crosses all levels of the
educational system and uses a variety of data from which decisions can be made.
32
These include instructional, administrative, financial, personnel, transportation,
welfare, health, demographic, perceptual, behavioral, process and other kinds of
data. (p. 71)
Mandinach (2012) alleged DDDM processes should be implemented in all subsystems of
an organization. This system-wide implementation of DDDM processes facilitates
continuous improvement of highly systemic organizations (Mandinach, 2012).
The DDDM processes provide the inputs which empower organizations to create
better procedures for conducting common work processes and creating mechanisms to
respond to change in a rapid manner (Rosenberg, 2015). A key component of utilizing
data in this manner is the organizational commitment to view failures as opportunities for
improvement, as opposed to opportunities to cast blame (Bryk et al., 2015). Bryk et al.
(2015) surmised, “Data are not blunt instruments for imposing sanctions and offering
rewards; they are resources used to deepen understanding of current operations and to
generate insights about where to focus efforts to improve” (p. 61).
Mandinach’s (2012) research found that DDDM processes increase the capacity
of individuals to improve the system within their sphere of influence. Mandinach (2012)
asserted the system processes that enable the successful use of data by educators at local
levels must include the following:
Infrastructure aligned to educational goals, (c) making sure that the right data
exist, (d) determining what the right data elements are to address educational
questions and planning for their collection before a stakeholder requests an impact
or return-on-investment study, (e) having an explicit vision for data use that
33
address (f) an explicit need, and (g) providing the needed support and resources to
make data-driven practices possible. (p. 82)
Further, Mandinach (2012) asserted, “The objective in DDDM is to move educators,
schools, districts, and states from being data rich but information poor to using data and
transforming them into actionable knowledge” (p. 82).
Challenges of Implementing Continuous Improvement Processes in Schools
Best and Dunlap (2014) cited Park et al.’s (2013) definition of continuous
improvement in education as “a school, district, or other organization’s ongoing
commitment to quality improvement efforts that are evidence-based, integrated into the
daily work of individuals, contextualized within a system, and iterative” (p. 1).
Unfortunately, the inherent structures of educational institutions are not organized in
ways to promote continuous learning (Park et al., 2013). Park et al. (2013) suggested the
barriers associated with the implementation of continuous improvement frameworks
include the following:
Work is often done in silos, policy demands push for quick results, data isn’t
provided frequently or quickly enough for it to meaningfully inform and change
practice, and poor outcomes are viewed as individual failures rather than a by-
product of a misaligned system. (p. 7)
Although continuous improvement processes are less prevalent in educational institutions
than other industries, the impetus on improved student performance amidst fiscal
constraints is motivating the educational industry to consider continuous improvement
frameworks (Park et al., 2013).
34
Also debilitating to the implementation of continuous improvement in education
organizations is the need to build organizational capacity for implementation (Park et al.,
2013). To build organizational capacity to ensure sustained continuous improvement
processes, the entity must “invest time and energy in training staff to embed this process
into day-to-day work and to create an organizational structure that supports the approach”
(Park et al., 2013, p. 24). Evidence of the success educational institutions experience
upon this investment is apparent in the practices of the School District of Menomonee
Falls and Montgomery Country School District, which represent two of five public
schools to win the prestigious MBQNA award (NIST, 2015; Park et al., 2013). The
investment of time and resources in the building of this capacity is not indicative of the
historical culture of educational organizations (Park et al., 2013). Eck et al. (2011)
corroborated the importance of allocating sufficient time to the implementation of
continuous improvement practices by citing a “lack of multi-year commitment to
intensive, shared professional development” as one of the five predictors of reform
failure (p. 21).
The diversity of user needs and processes in education often proves a challenge in
implementing continuous improvement in education (Bryk et al., 2015). Consequently,
attention must be given to identify unique user needs and associated processes for the
educational system to realize success with continuous improvement (Bryk et al., 2015).
Educational institutions have cited “long timeline[s] for implementation, the high cost in
time and resources of committing to the process, and the inability to trace results to the
use of the framework” as concerns associated with implementing TQM and Baldrige
continuous improvement frameworks (Frickx, 2015, p. 23).
35
While elements and measures of organizational effectiveness are readily agreed
upon in industry, consensus is difficult in the field of education (Frickx, 2015). The
inherent difficulty in reaching consensus in the field of education originates from
departmentalized missions, varied data measures, and differing purposes for the data
(Lillis, 2012). Eck et al. (2011) emphasized even when goals are developed through
broad participation, “school leaders have the challenge of fostering internal coherence.
This is challenging because of the sheer number and variety of educational goals” (p. 26).
Compounding these challenges is the expansion of roles the public education system are
now expected to fill beyond those directly linked to student learning (Eck et al., 2011).
In addition to student learning, “communities count on public schools to ensure students’
safety and well-being; support social, civic, and ethical development; and to help students
pursue individual talents and interests” (Eck et al., 2011, p. 25).
Additional contributing factors to the failure of schools to implement continuous
improvement models on a large scale are extensive training requirements, unfamiliar
vocabulary, and lack of incremental or gradual change (Ibach, 2014). Contributing to
these inhibitors is the unwillingness of public school entities to embrace the possibility of
sub-system failure in the interest of improvement (Eck et al., 2011). Eck et al. (2011)
further illustrated this debilitating component of public education by stating, “The need to
create and maintain safe reporting cultures” is a major factor in establishing high-
performing educational systems (p. 40). The comfort level of persons to “identify errors
in the system, even if they are the ones to commit them,” is a key indicator of a safe
reporting culture (Eck et al., 2011, p. 42).
36
Ultimately, Arnold and Marchese (2011) surmised the difficulty in education of
duplicating the success of continuous improvement processes lies in the “disconnects
between the continuous improvement model as operationalized in business and industry
and the attempt to apply it in an unexamined fashion to educational environments” (p.
16). Bryk et al. (2015) corroborated this finding by stating the need for educational
organizations to get “smarter about how to successfully replicate results under diverse
conditions is the key analytic challenge for quality improvement” (p. 45). Unfortunately,
Bryk et al. (2015) discovered, “No governmental or professional infrastructure currently
exists for engaging educators in developing and testing such practice-based knowledge
and synthesizing what is being learned along the way” (p. 46).
Success of Continuous Improvement Processes in Schools
Numerous researchers have provided evidence educational organizations have
achieved impressive results after implementing continuous improvement processes (Best
& Dunlap, 2014; Flumerfelt & Green, 2013; Park et al., 2013; Wilka & Cohen, 2013).
Best and Dunlap (2014) identified “decreased failure rates, increased homework
completion rates, increased Advanced Placement exam participation, increased
kindergarten readiness, increased college enrollments, and more efficient use of funds” as
performance goals achieved through continuous improvement processes (p. 1). This
evidence should merit further consideration of continuous improvement processes by
both education policymakers and practitioners (Best & Dunlap, 2014).
In any organization dedicated to continuous improvement, “change occurs both
quickly and incrementally, as organizations learn from experience while testing and
refining strategies to produce better results” (Best & Dunlap, 2014, p. 1). According to
37
Best and Dunlap (2014), “At the classroom level, continuous improvement may refer to
using timely, accurate data to inform and improve teacher practice regularly” (p. 1). In
addition, “At a school or district level, continuous improvement may refer to ongoing
efforts to improve operational practices and processes related to efficiency, effectiveness,
and student outcomes” (Best & Dunlap, 2014, p. 1).
Self-Efficacy and Data-Driven Decision Making
Self-efficacy is defined as belief in one’s ability, not the actual ability, to perform
a task or meet a goal (McCray, 2014). According to McCray (2014), an abundance of
studies exist about self-efficacy, and researchers have determined self-efficacy impacts
motivation, persistence, and performance (Federici & Skaalvik, 2012). McCray’s (2014)
research indicated in underperforming school districts there existed ambiguity “as to
whether principals in this district believe that they have the ability to employ data driven
decision making (DDDM) practices to improve student achievement” (p. 5).
The need to address self-efficacy of system leaders is evident in the following
quote by a principal interviewed by Ginsberg and Multon (2011):
It is impossible to make cuts in a district and not have it impact teachers and
students. We cut a secretary and many tasks are now falling to teachers. This
takes up their precious time to prepare for students. We cut a technology
integration person, and now teachers are having to spend more time researching
web sites and online projects. We cut a mail delivery person, and now secretaries
and paras are having to do curbside pickup and drop-off of mail so the mail can
travel on buses. It has further added to our already reduced office staff. (p. 45)
38
Ginsberg and Multon (2011) illustrated the need for a tool such as the leadership
dashboard to support self-efficacy of principals through a response from a building
principal who stated, “We are expected to do more and more with less and less, and the
challenges are not getting any less while societal pressures on staff and student increase”
(p. 45). Ginsberg and Multon (2011) identified a consistent trend of growing stress and
concern among building principals associated with having to meet increasing demands
with decreasing resources.
Impact of Accountability on Educational Leaders
McCray (2014) found sanctions associated with growing accountability have an
adverse impact on the schools most in need of improvement. McCray (2014) cited the
following evidence that inexperienced principals are ill-equipped to lead
underperforming schools:
Empirical knowledge is limited in terms of how to help inexperienced principals
in low performing schools overcome the barriers of progressive NCLB sanctions
and a lack of district support to improve student achievement. As a result, these
schools do not show the growth called for by the law. (p. 2)
McCray (2014) proposed the negative impact is a result of the most underperforming
schools being led by the most inexperienced principals.
A primary consequence of the accountability movement is that it demands
building and district-level administrators seek out new strategies for using data
effectively (McCray, 2014). Unfortunately, many educational leaders do not have the
personal capacity to lead effective data processes to increase organizational capacity and
improve educational performance (McCray, 2014). To build organizational capacity,
39
system leaders must be able to “read, understand, disaggregate, and teach other school
level staff how to use assessment data to improve student achievement” (McCray, 2014,
p. 3). McCray (2014) indicated increased accountability has undeniably led to a focus on
DDDM, but it is still “unknown as to whether principals fully understand and have the
capability to follow through on DDDM practices” (p. 5).
Tenets of a High-Reliability Organization
High-reliability organizations (HROs) are characterized by a preoccupation with
failure where mistakes have catastrophic consequences and often end in human tragedy
or widespread destruction (Eck et al., 2011). Eck et al. (2011) asserted an HRO
incorporates multi-tiered structures within organizational processes to prevent errors and
respond immediately. In addition to preventing errors, the HRO’s multi-tiered structures
exist to enable the organization to respond rapidly when errors occur in order to prevent
tragedies and subsequent system failure (Eck et al., 2011). According to Eck et al.
(2011), “Constant monitoring for the early signs of failure and responding quickly is
another way HROs demonstrate the characteristic of mindfulness” (p. 3).
Researchers Eck et al. (2011) captured the relevance of HRO principles as they
apply to public education with the following questions:
What if school systems considered student failure as catastrophic as an airplane
failing to land safely or a patient failing to recover from surgery? Moreover, what
if educators viewed student failure not as the fault of the child, but as a failure of
the system? For many, this will require changing core beliefs and assumptions
about education. (p. 38)
40
Eck et al. (2011) cited the definition of an HRO as it applies to education as “high levels
of student performance, achieved as a result of high-quality instruction, delivered through
superior execution of effective research-based practices, with low variability in the
quality of instruction within and between schools” (p. 3). Eck et al. (2011) proposed the
principles of HROs that currently exist in other industries will enable public education to
transition from “compliance driven organizations to world-class organizations” (p. 1).
This transition will essentially be accomplished by “benchmarking against top
performing education systems from around the globe” (Eck et al., 2011, p. 1).
This benchmarking of top-performing education systems provides the foundation
for developing HROs in public education by providing public schools with a clear
understanding of what has proven effective in high-performing education systems (Eck et
al., 2011). Two necessary components of effective processes include the use of high-
effect instructional strategies and the reliability of delivery of high-effect size
instructional strategies (Eck et al., 2011). Researchers Eck et al. (2011) created the
following pragmatic equation to illustrate the necessary components of effective
processes: “Effectiveness of schooling = Effectiveness of the ‘Technology’ x Reliability
of Delivery” (p. 6).
Leadership Dashboards as Improvement Strategies
Small-scale improvement strategies and tools are essential components of success
and provide the foundation for large-scale improvement efforts and subsequent results
(Goodwin, 2011). Bryan Goodwin (2011) illustrated the importance of small-scale
improvement strategies:
41
In fractal experiences, schools implement small-scale improvement processes that
generate quick wins – which, in turn, encourage those implementing the changes
to take on larger challenges. Because fractals are small, simple, and completed in
a short time, it’s easier for stakeholders to “connect the dots” between actions
taken and outcomes produced. Moreover, the quick wins help to create a can-do
attitude or a sense of academic optimism, which is a key predictor of school
success. Quick wins encourage school staff members to undertake ever more
complex and substantive improvement efforts which have the dramatic effect of
transforming the school’s culture. (p. 131)
Goodwin (2011) summarized schools with embedded management systems to identify
and generate quick wins are most likely to realize sustained improvement.
Use of data dashboards in education. Data dashboards have become
increasingly prevalent in education, as NCLB created an unprecedented focus on
accountability (Rothman, 2015). Before the dissolution of NCLB, 43 states had received
waivers, many of which included data dashboards as evidence for improvement
(Rothman, 2015). The data dashboards have been implemented as a way to “track
performance and hold schools, principals, and teachers accountable” (Rothman, 2015, p.
28). Prior to the passage of the ESSA, 43 states received waivers predicated upon the use
of data dashboards to provide accountability (Erpenbach, 2014).
In addition to accountability, data dashboards convey transparency by providing
tangible evidence of school performance in the areas of focus to internal patrons, external
patrons, and public officials (Rothman, 2015). The areas of focus are typically predicated
upon areas of low performance such as school operations, grades, and attendance
42
(Rothman, 2015). Although the areas of focus are often easy to ascertain, an effective
dashboard must be comprised of appropriate indicators and performance targets
(Rothman, 2015). Rothman (2015) confirmed for the data dashboard to be a tool of
continuous improvement, the indicators and performance targets must ultimately be used
to perpetuate the culture of continuous improvement.
Rothman (2015) stated appropriate indicators must “reflect the most significant
measures of a school’s performance. To that end, they rely on what are considered the
most crucial outcome measures for that school, as well as research on the factors that
contribute to high performance” (p. 30). Dr. Maggie Glennon, consultant for the Georgia
Leadership Institute for School Improvement, reiterated the importance of narrow focus
when she stated, “You have to prioritize. You can’t do everything” (as cited in Rothman,
2015, p. 30). Limitation of the number of indicators embedded in the data dashboard
provides additional assurance “schools continue to monitor the indicators and address the
most crucial problems in school performance” (Rothman, 2015, p. 31).
Although the focus of individual dashboards must be succinct, each school
district’s dashboard is unique in regard to its choice of indicators (Rothman, 2015). The
Monroe County dashboard, titled a “balanced scorecard,” includes 70 individual
measures associated with four indicators of student learning outcomes, organizational
effectiveness, public engagement, and professional learning (Rothman, 2015). Alberta,
Canada’s district dashboard, titled the “school report,” includes six indicators of “safe
and caring schools; student learning opportunities; student learning achievement;
preparation for lifelong learning, the world of work and citizenship; parental
involvement; and continual improvement” (Rothman, 2015, p. 30).
43
California school districts qualify for the state funding formula by providing
evidence they are monitoring indicators relevant to resources such as instructional
materials, adequate facilities, and access to coursework associated with higher education
prerequisites (Rothman, 2015). These districts utilize data dashboards to monitor the lead
indicators and to comply with state funding guidelines (Rothman, 2015). Regardless of
indicator selection, effective dashboards are fluid and allow organizations to modify
indicators as desired results are achieved and additional performance concerns are
identified (Rothman, 2015).
Appropriate performance targets for dashboard indicators must be established for
the dashboard to serve as a tool for continuous improvement to drive performance over
time (Rothman, 2015). Performance targets for dashboard indicators must be realistic,
collaboratively identified, and easily measured (Rothman, 2015). The Monroe County
School District established realistic performance targets based on current performance
and expected growth toward an ultimate performance goal, as opposed to assigning 100%
to any category (Rothman, 2015). Additionally, the performance target was established
through collaborative negotiations between sub-system leaders and district administrators
(Rothman, 2015). However, district administrators in Monroe County School District
may require performance targets to be raised if the initial proposal is deemed too low
(Rothman, 2015). Performance targets and associated progress are easily discerned
through a color-coordinated scorecard that utilizes red, yellow, and green to demonstrate
current status (Rothman, 2015).
When implemented as a tool for system improvement, the data dashboard has
been credited with transforming the manner in which school districts address
44
accountability (Rothman, 2015). School districts utilizing data dashboards as a tool for
improvement transcend the use of data for threats of intervention and utilize data to
identify areas in need of improvement (Rothman, 2015). Assistant superintendent of the
San Jose Public School District, Dr. Willis, credited data dashboards with the shift from
accountability as punitive to accountability for improvement regarded much more
favorably by building principals (Rothman, 2015). Dr. Willis identified the emerging
culture of continuous improvement as the “polar opposite of the culture of mistrust that
characterized the previous system” (Rothman, 2015, p. 32). In addition to providing
further accountability, a data dashboard “enables educators to focus on particular
problems and, equally important, to monitor and address all the issues that affect
performance” (Rothman, 2015, p. 28).
The need for leadership dashboards. The era of accountability has caused
educational leaders to “re-conceptualize their roles from managers of educational
organizations to active collaborators in the management and improvement of instructional
practice” (Mrachko, 2015, p. 14). Contrary to traditional educational dashboards
predicated upon school or district outcomes, leadership dashboards are predicated upon
clearly stated leadership inputs which drive school improvement initiatives (Kirkpatrick
& Kirkpatrick, 2014). The lack of focus on specific implementation drivers has been
identified as the source of fragmented implementation of system change in education
(Kirkpatrick & Kirkpatrick, 2014). Bryk et al. (2015) illustrated the need to simplify the
many processes of a complex system by stating, “The key to improvement is seeing the
actual organization of work amidst this complexity” (p. 46).
45
Westover (2014) corroborated this finding in the following summary of
McChesney, Covey, and Huling’s (2012) research:
Research points to the fact that if an organization focuses on more than three
goals at one time, few if any will be attained. Three questions have proven
instrumental for school districts in defining goals and strategies that build
capacity to achieve desired results: 1. What is the compelling vision that defines
what our school district strives to achieve? 2. How does data convey root causes
of the constraints within our district-wide systems? 3. Which priorities are
believed to have the greatest impact on student achievement? (p. 25)
Mrachko (2015) illustrated the dilemma of growing accountability by stating, “Policy
makers have created a new paradigm for school leadership without providing all of the
guidance or tools to effectively enact the imposed changes” (p. 17). The need for a tool
such as the leadership dashboard was further illustrated in Brown et al.’s (2013)
investigation of continuous school improvement, when researchers identified modeling,
confronting, and monitoring as three of Rick DuFour’s five activities leaders should
focus upon to be effective change agents.
Brown et al. (2013) defined modeling as the leaders’ “own commitment to
continual development. Principals should act upon and assist in carrying out the
prescribed plan for improvement” (p. 36). For leaders “to convey the importance of
improvement, they must be willing to confront behavior which is detrimental to the
improvement. Once a school has made a commitment to a particular improvement
program, the boundaries of acceptable behavior have been set” (Brown et al., 2013, p.
46
36). Brown et al. (2013) further illustrated the importance of the dashboard’s primary
role of monitoring:
One of the most powerful means by which a leader can convey the importance of
something is by paying attention to it. The principal who devotes time and effort
to the continual improvement sends a message that improvement is important.
Defining measurement is one way a principal can monitor change. (p. 37)
Brown et al. (2013) found the overt monitoring of a defined measure empowers the
principal to have a greater impact on the chosen focus for continual improvement.
Theoretical basis supporting leadership dashboards. To fully illustrate the
need for leadership dashboards, one must investigate how “tools and processes scaffold
effective ways of thinking and acting on complex systems” (Bryk et al., 2015, p. 65).
Understanding the impact of this scaffolding on complex systems “is essential context for
identifying promising changes and testing specific courses of action aimed at sustained,
meaningful improvement” (Bryk et al., 2015, p. 2016). Bryk et al. (2015) provided an
introduction to this foundation for networked improvement communities (NICs) and the
proposed leadership dashboard in the following commentary:
Three tools that can help a network represent its current understanding of a
problem and identify key levers for change. When these tools and processes are
used, knowledge held by different individuals can be unearthed, explicated, and
the warrants for each examined. Along the way collective commitments form to
guide the work ahead. (p. 66)
For this to occur, a NIC must develop a working theory of practice improvement (Bryk et
al., 2015).
47
The foundation for establishing an educational NIC is the protocol termed “causal
system analysis,” which is utilized to investigate the sources of unsatisfactory outcomes
in the education system (Bryk et al., 2015). The question, “Why do we get the outcomes
that we currently do?” is used to drive the causal system analysis process (Bryk et al.,
2015, p. 66). This questioning process necessitates “participants [to] develop a common
understanding of the specific problem or problems they are trying to solve” (Bryk et al.,
2015, p. 66). The natural evolution is for participants to first see the system through the
lens of their perspective and then through conversations gain a system-wide view of the
systemic processes (Bryk et al., 2015). This process provides the first litmus test to
determine if the team can become a focused NIC (Bryk et al., 2015).
The first step in the causal analysis process is to determine the specific problem
the team must address to improve outcomes (Bryk et al., 2015). The natural tendency of
teams first engaging in this step is to describe the problem in very broad terms
resembling a goal rather than a specific improvement target (Bryk et al., 2015). Broad
goals at this step in the process are too general to serve as improvement problems, as they
are the “aggregation of countless processes over extended periods of time and multiple
contexts” (Bryk et al., 2015, p. 66). Bryk et al. (2015) proposed sufficient time and
attention be allocated to description of a problem, as system improvement undeniably
requires a specific improvement target.
The fishbone diagram is the primary collaborative tool teams utilize to visibly
represent the product of discussions associated with the aforementioned question, “Why
do we get the results observed?” (Bryk et al., 2015, p. 66 ). According to Bryk et al.
(2015), “Each major bone represents a key factor thought to contribute to the
48
unsatisfactory outcomes. The smaller bones capture the details that emerge from
conversations about these factors” (p. 68). Typically a fishbone diagram consists of five
or six key factors represented as major bones, and multiple contributing factors are
represented as smaller bones (Bryk et al., 2015). Researchers Bryk et al. (2015) stated
practitioners who have been past victims of attribution error might attempt to skip this
causal system analysis procedure and focus immediately on potential solutions. This
tendency reinforces the need to develop a proper culture of continuous improvement to
view data as essential tools to identify opportunities for improvement (Bryk et al., 2015).
Bryk et al. (2015), reiterated although this analysis procedure “can be trying, it is a
critical prelude to tactical action” (p. 70).
Following the brainstorming session associated with construction of a fishbone
diagram, the next step in the causal system analysis procedure is to create a system
improvement map (Bryk et al., 2015). A system improvement map is an analytic tool
that “represents what we learn through these discussions about how the institution is
organized to carry out work in a particular area” (Bryk et al., 2015, p. 70). The system
improvement map is not intended to provide an exhaustive depiction of the system, but is
intended to identify essential interactive subsystems that will likely encompass future
improvement work (Bryk et al., 2015).
In the following text, Bryk et al. (2015) provided an overview of the interactive
subsystems associated with the complex educational system:
For educational institutions such as school districts and colleges, the subsystems
most germane for student success consist of an instructional core (i.e., courses,
programs of study, and various materials and technologies to support this); a
49
human resources subsystem that provides staff to teach and support this core; an
information infrastructure that collects and organizes data to guide and manage
institutional activity, a vast array of academic, social-behavioral, and
psychological support services for students and their families; and institutional
governance, including budgeting, financial aid, internal policy making, and
external relations. Mapping these subsystems provides one conceptual organizer
for the system improvement map. (p. 70)
As the system causal analysis proceeds, the organization enters into the second phase
focused on identifying a working theory of practice improvement (Bryk et al., 2015).
With the material gleaned from the fishbone diagram and the system improvement map,
the team must now determine how and where changes might be introduced for maximum
impact (Bryk et al., 2015). Due to the complexity of the system, it is impossible to
address each item on the map at one time, so the intent is to identify a limited set of
powerful drivers to initiate improvement (Bryk et al., 2015).
Bryk et al. (2015) summarized the system improvement activity process:
Building a working theory of practice improvement is neither straightforward nor
obvious. It requires blending observations from the causal systems analysis with
relevant research and wise judgments from expert educators. The most
compelling improvement hypotheses often exist at the intersection of these “three
voices” – how does the system appear to work; what does relevant theory and
empirical research suggest about promising changes; and what seems plausible to
educators who might try out these changes in these changes in their classrooms,
schools, and colleges? (p. 73)
50
Drivers not initially identified for targeted improvement may be moved to the forefront as
the improvement process proceeds (Bryk et al., 2015).
The third step in the causal system analysis is to utilize a driver diagram, which
organizes the improvement efforts the networked improvement community will
implement (Bryk et al., 2015). The driver diagram “gives participants a common
language as they build toward a solution to a shared problem” (Bryk et al., 2015, p. 73).
According to Bryk et al. (2015), “The diagram focuses on a small set of hypotheses about
key levers for improvement, specific changes that might be attempted for each, and the
interconnections that may exist among them” (p. 73). Each component or step of the
diagram is logical, but the sum of the parts can become quite complex depending on the
spectrum of the proposed changes (Bryk et al., 2015). Primary drivers are selected for
concentrated improvement efforts (Bryk et al., 2015). Bryk et al. (2015) continued, “In
essence, the primary drivers are a network’s best initial bets about what to target in the
context of causal system analysis” (p. 74). A goal termed the measurable improvement
aim is established for the primary drivers selected (Bryk et al., 2015).
Even with the intentional elaboration associated with the selection of primary
drivers, it is necessary to further dissect the focus for improvement efforts by identifying
secondary drivers (Bryk et al., 2015). Secondary drivers are the key levers the team feels
will yield the most production from improvement efforts (Bryk et al., 2015). According
to Bryk et al. (2015), “Finally, building off each secondary driver, and moving into finer
detail are the actual change ideas to be developed, tested, and refined” (p. 76).
Bryk et al. (2015) summarized the initiation of the theory of practice
improvement:

51
The theory of practice improvement considers new work processes that may be
added, existing processes that may be changed, new tools that may need to be
designed and tested, and new norms required to sustain productive change. Since
variability in performance often starts here, this is a place to consider
opportunities for introducing standard work. (p. 76)
Fullan and Quinn’s (2016) research of recent whole educational system improvement
efforts identified “right drivers” for school improvement initiatives. The right drivers
identified by Fullan and Quinn (2016) for whole system improvement are “capacity
building, collaboration, pedagogy, and systemness” (p. 3). The holistic nature of the right
drivers and the systemic nature of schools require school leaders to adopt a very
intentional approach to monitoring these drivers (Fullan & Quinn, 2016). The intentional
approach is evidenced in the following statement from Laura Schwalm, Superintendent of
Garden Grove Unified School District, and cited by researchers Fullan and Quinn (2016):
You need to be preoccupied with focus, a state or condition permitting clear
perception or understanding; to direct your attention or effort to something
specific; a main purpose or interest to focus is often overwhelmed by the number
and magnitude of the problems faced by the system leader. You need “one main
thing” or central improvement strategy that consists of the leaders’ non-negotiable
view of what, over time, will have the greatest impact on improving the system’s
performance for children. (pp. 8-9)
Although the system improvement process identified by Fullan and Quinn (2016) is
complicated, it does provide the framework to identify and manage focused improvement
drivers.
52
Summary
Public education entities are faced with significant challenges in their pursuit of
becoming high-reliability organizations. This pursuit has resulted in public education
adopting many continuous improvement processes proven successful in private industry.
This chapter included a review of legislation that has increased accountability of public
education, continuous improvement processes adopted by public education, and inherent
differences between public education and private industry.
Federal legislation such as the NCLB Act and the ESSA have resulted in greater
accountability for public education (Mrachko, 2015). Enhanced accountability has
resulted in the increased use of data and a culture of evidence predicated upon continuous
improvement processes (Eaton, 2012). Proliferated use of data in the form of data-driven
decision making by public educators has resulted in mass adoption of continuous
improvement methodologies proven successful in private industry (Bryk et al., 2015).
This chapter also included an exploration of the highly systemic nature of public
education organizations and the low self-efficacy of public school leaders for leading
continuous improvement processes (McCray, 2014). Each of these characteristics has
inhibited the successful implementation of continuous improvement processes (Bryk et
al., 2015). Bryk et al. (2015) also surmised a tool such as the leadership dashboard might
provide the foundation for a network improvement community essential in sustaining
continuous improvement in a highly systemic organization.
Chapter Three includes detail on methodology and research design of this study.
The population, sample, and instrumentation are presented. Then, the process of
collecting and analyzing data are discussed. Chapter Four contains information collected

53
from the interviews of school system leaders regarding their perceptions of leadership
dashboards. The findings, conclusions, implications for practice, and recommendations
for future research are presented in Chapter Five.
54
Chapter Three: Methodology
Researchers have documented numerous cases of school districts achieving
success through system-wide continuous improvement strategies (Flumerfelt & Green,
2013; Park et al., 2013; Wilka & Cohen, 2013). However, Arnold and Marchese (2011)
stated the inability of educational organizations to replicate the success of private
industry can be attributed to five disconnects between the two entities. The five
disconnects include reduction versus intensification of effort, tangible versus intangible
products, determinate versus indeterminate cycles, closeness versus distance between
production and judgment, and focus on inputs and processes versus outcomes (Arnold &
Marchese, 2011).
In Arnold and Marchese’s (2011) description of disconnects, what is often lacking
in the application of continuous improvement to the highly systemic field of education is
the ability of the system leader to immediately apply effort and intuition and to rapidly
monitor the subsequent impact on the processes in question. Park et al. (2013) validated
this finding by citing system leaders who succeeded in deploying effective continuous
improvement strategies “set the agenda, provided the conditions in which it could be
pursued, and monitored progress in adopting the continuous improvement perspective”
(p. 23). Jay Westover (2014) credited researchers Kirkpatrick and Kirkpatrick (2014)
with identifying a lack of clearly defined implementation drivers as the primary cause of
fragmented implementation in schools. Kirkpatrick and Kirkpatrick (2014) categorized
the implementation drivers into four levels of formative feedback that require the leader
to possess a skillset or tools to monitor and quickly respond to feedback. The Every
Student Succeeds Act (ESSA) confirmed the need for this tool by charging state
55
departments and school districts with “more hands-on work in a variety of policy areas
where the federal government called the shots in recent years” (Burnett, 2016, p. 1).
Problem and Purpose
In the interest of school accountability, policymakers throughout the nation have
expanded legislation impacting the country’s schools without providing the necessary
guidance or system tools to implement change (Mrachko, 2015). Researchers in the area
of educational system improvement have identified the following drivers as essential
components for whole-system improvement: “capacity building, collaboration, pedagogy
and systemness” (Fullan & Quinn, 2016, p. 3). The holistic nature of the “right drivers”
and the systemic nature of schools necessitate school leaders adopt a very intentional
approach to monitoring these drivers (Fullan & Quinn, 2016).
The purpose of this study was to examine the perceptions of school administrators
and directors regarding the effectiveness of leadership dashboards in focusing their
actions in a manner congruent with their organizational improvement plans. Mrachko
(2015) found the mounting emphasis on accountability by legislators has increased the
expectations and job description of educational leaders without providing “guidance or
tools to effectively enact the proposed changes” (p. 17). Brown et al. (2013) validated
the need for additional leadership tools to guide leadership efforts by identifying
modeling, confronting, and monitoring as three of Rick Dufour’s five activities leaders
should deploy to be effective change agents. Leadership dashboards have been
implemented to increase leadership capacity to meet accountability measures and to
enable effective change agents.
56
Research questions. The following research questions guided the research to
examine the type of systemic improvement tool that could provide focus to administrative
behaviors and increase administrator efficacy in continuous improvement:
1. How does the leadership dashboard enhance system improvement?
2. How does the leadership dashboard enhance the personal efficacy of system
leaders?
3. How does the fidelity of implementation of leadership dashboards impact
system improvement?
Research Design
The qualitative research approach was deemed appropriate to investigate the
perceptions of school administrators and directors of a Missouri public school district
regarding the effectiveness of leadership dashboards in guiding continuous improvement
(Creswell, 2014). Participants who were selected and who agreed to participate in the
study were asked to provide their opinions regarding the effectiveness of leadership
dashboards. Interviews were conducted by an independent proctor to assure anonymity
of participants and their responses.
Before beginning any research, Institutional Review Board approval was obtained
(see Appendix B). Permission was granted from central office administration in the
participating school district in Missouri (see Appendix C). Additionally, permission was
granted from the Board of Education of the participating school district in Missouri (see
Appendix D).
Perceptions of leadership dashboards are not easily quantified through the
accumulation of data or statistics. A qualitative research methodology was selected, as it
57
“does not forecast what is to happen in the future; rather, it is an analysis that provides a
depth of understanding for those who are interested in the events of a particular setting
and time” (Zeeck, 2012, p. 32). Qualitative research also “focuses on a specific situation
or people [with an] emphasis on descriptions rather than numbers” (Maxwell, 2013, p.
30). Additionally, Robert Baker (2016) cited Fraenkel, Wallen, and Hyun (2014) when
he stated, “Qualitative methods are best when researchers are hoping to study the quality
of activity as opposed to how often the activity occurs” (p. 47).
Ethical Considerations
Following approval by the Lindenwood Institutional Review Board, a process was
implemented to assure anonymity of the participants in the study. Participants received a
letter of participation (see Appendix E) and an Informed Consent for Participation in
Research Activities form (see Appendix F) from the researcher. The letter of
participation requested potential research participants respond directly to an independent
proctor employed by the researcher.
The independent proctor selected for this research was an executive
administrative assistant employed by a local municipality. The independent proctor’s job
duties for the local municipality included participation and documentation of confidential
meetings. The independent proctor had also received training in the Family Educational
Rights and Privacy Act (FERPA) requirements as part of his employment. The
independent proctor conducted a random number identifier to select participants for the
research. All interviews were conducted by the independent proctor; responses were
transcribed and then forwarded to the researcher. Any personal information regarding the
research participants and their responses to the interview questions remained confidential
58
throughout the study. All data and documents relating to the research participants were
housed in a secure location under the supervision of the independent proctor.
Population and Sample
The research for this study was site-specific. The site for the research participants
was a public school district in Missouri that began the deployment of continuous
improvement strategies in the fall of 2012. The district enrollment was 4,717 students
with a free and reduced price meal rate of 44.5%. The student ethnic composition was
90.8% White, 3.4% Hispanic, 3.0% Multi-Racial, 1.6% Black, 0.8% Asian, 0.3% Native
American, and 0.1% Pacific Islander. The special education rate was 12.42%. The
district employed 390 certified staff members and 267 classified staff members. Prior to
the fall of 2012, the district did not utilize continuous improvement strategies such as
systems thinking, data-driven decision making, customer feedback protocol, plan-do-
study-act plans, or system improvement plans.
Purposeful criterion-based sampling was utilized, because the expectation of
phenomenological studies is “that all participants share the same experiences or specific
characteristics” (Dawson, 2015, p. 34). This type of sampling involves recognizing and
choosing the participants who are most knowledgeable of the item of interest or
experienced in the area of interest (Creswell, 2014). Criterion-based sampling assured
each of the research participants possessed the same experiences associated with the
research site and leadership dashboard tool.
The research sample included 23 school administrators from a school district that
implemented leadership dashboards starting in the 2012-2013 school year. The potential
research participants included the following positions: one Assistant Superintendent of
59
Academic Services, one Executive Director of Operations, one high school principal, one
middle school principal, one Director of Early Childhood, one Director of Special
Education, one Director of Curriculum Instruction and Assessment, one Director of
Informational Technology, five elementary principals, five elementary assistant
principals, two middle school assistant principals, and three high school assistant
principals. Due to mobility, the participants have utilized leader dashboards for differing
periods of time. Table 1 summarizes the participants and the amount of time each has
utilized the leadership dashboard.
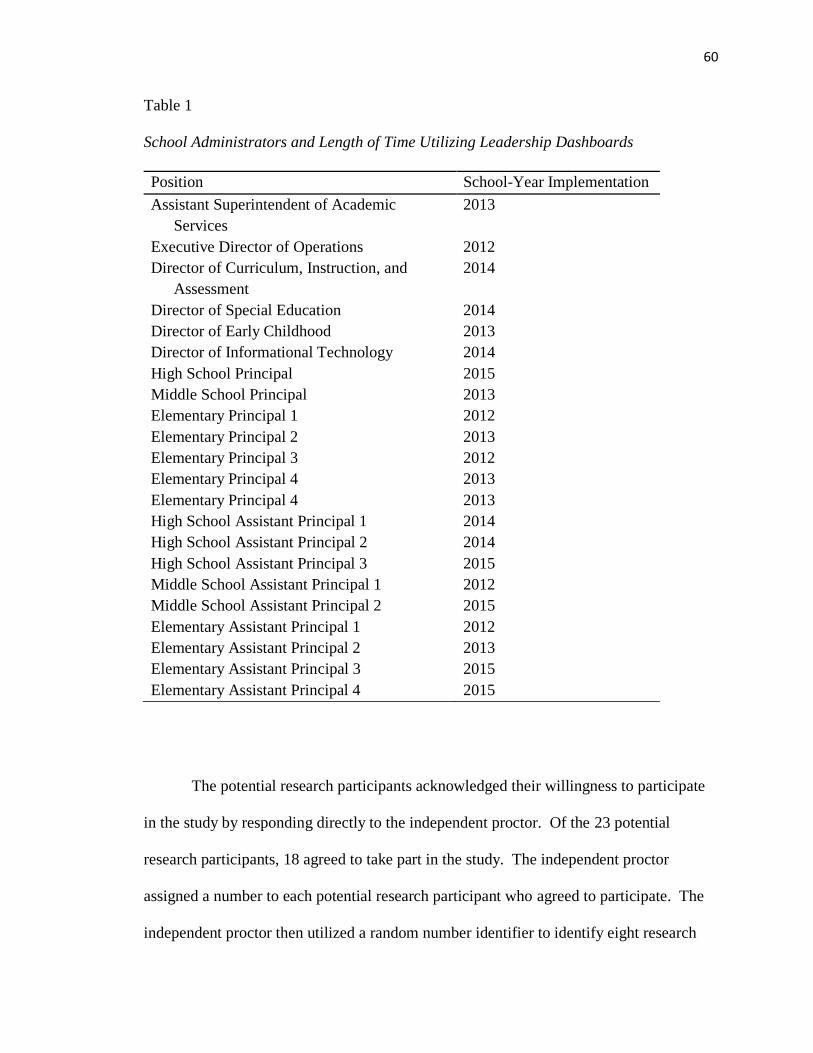
60
Table 1
School Administrators and Length of Time Utilizing Leadership Dashboards
The potential research participants acknowledged their willingness to participate
in the study by responding directly to the independent proctor. Of the 23 potential
research participants, 18 agreed to take part in the study. The independent proctor
assigned a number to each potential research participant who agreed to participate. The
independent proctor then utilized a random number identifier to identify eight research
Position School-Year Implementation
Assistant Superintendent of Academic
Services
2013
Executive Director of Operations 2012
Director of Curriculum, Instruction, and
Assessment
2014
Director of Special Education 2014
Director of Early Childhood 2013
Director of Informational Technology 2014
High School Principal 2015
Middle School Principal 2013
Elementary Principal 1 2012
Elementary Principal 2 2013
Elementary Principal 3 2012
Elementary Principal 4 2013
Elementary Principal 4 2013
High School Assistant Principal 1 2014
High School Assistant Principal 2 2014
High School Assistant Principal 3 2015
Middle School Assistant Principal 1 2012
Middle School Assistant Principal 2 2015
Elementary Assistant Principal 1 2012
Elementary Assistant Principal 2 2013
Elementary Assistant Principal 3 2015
Elementary Assistant Principal 4 2015
61
participants. The independent proctor then contacted the research participants and
established times to conduct the research interviews by phone.
Instrumentation
Interview questions were created to elicit the perceptions of school administrators
and departmental directors (see Appendix G). Interview questions were field tested by
two area superintendents and by the dissertation committee chairpersons. Field testing
was utilized to ensure the reliability of the research by improving the appropriateness of
the interview questions (Fraenkel et al., 2014). Appropriateness of interview questions
was enhanced by making modifications following the field tests. Modifications were
made to ensure the interview questions adequately addressed each of the primary research
questions.
Research question one. Does the leadership dashboard enhance system
improvement?
Research participants were asked if their leadership dashboards impacted the
performance of the systems under their leadership. This question was asked to determine
if leaders perceived their leadership dashboards contributed to system improvement and
assisted them in overcoming the inability of educational systems to replicate the success
of continuous improvement strategies in private industries. Park et al. (2013) found the
organizational structures of educational systems are not structured in a manner to
promote continuous improvement and actually hinder growth. Bryk et al. (2015)
followed up these findings by stating for a system to improve it must create a working
theory of practice improvement that identifies and addresses key drivers for system
62
improvement. The intent of a leadership dashboard is to determine and monitor the key
drivers for system improvement (Rothman, 2015).
Participants in the study were asked if the leadership dashboard assisted them in
sustaining system improvement plans. This question was asked to determine if research
participants perceived the dashboard assisted them in sustaining improvements in the
highly systemic educational system where legislation results in frequent changes to
accountability measures. Sustained improvement in educational organizations is made
more difficult by highly systemic structure and departments with varied goals and work
processes (Park et al., 2013). Eck et al. (2011) surmised continued federal legislation
aimed at public education has perpetuated the barrier to sustained improvement by
creating additional legislative requirements with no clear accountability measures.
Research question two. Does the leadership dashboard enhance the personal
efficacy of system leaders?
Participants in the research study were asked what barriers make it difficult to
focus leadership actions on improvement processes such as departmental or school
improvement plans. This question was posed to investigate the types of inherent
distractions that prevent system leaders from focusing on actions that directly impact
system improvement. Eck et al. (2011) indicated the significant expansion of
expectations and roles in public education has hindered the ability of school leaders to
focus on specific school improvement drivers. The expanded role of public education
and the inability to focus on specific drivers have resulted in more difficulty achieving
consensus in the field of education (Frickx, 2015).
63
Research participants were asked if the leadership dashboard assisted them in
linking daily leadership actions to system improvement tools such as building or
departmental improvement plans. This question was asked to investigate if the leadership
dashboard served as a crosswalk between specific leadership actions and system
improvement processes. The difficulty for leaders in a systemic system is the inability to
establish a unified vision or to establish specific priorities that have the greatest impact on
student achievement (McChesney et al., 2012). Bryk et al. (2015) further corroborated
this finding by stating it is imperative individuals in a system establish a system-wide
view of processes by creating clear individual perspectives of their impact on system
improvement.
System leaders engaged in the research were asked if leadership dashboards
enhanced their effectiveness as leaders. The question was asked to determine the impact
of leadership dashboards on each leader’s self-efficacy to promote system improvement.
Ginsberg and Multon (2011) recognized self-efficacy of school leaders is of primary
concern in leading school improvement amidst the growing scope of responsibility in
public schools. McCray (2014) defined self-efficacy as one’s belief in one’s ability to
perform a task or meet a goal. McCray (2014) confirmed the research of Ginsberg and
Multon (2011) by stating leaders in underperforming districts possess a lack of
confidence in their ability to lead system improvement.
Research question three. Does the fidelity of implementation of leadership
dashboards impact system improvement?
Research participants were asked during what period they utilized the leadership
dashboard. This question was chosen to investigate the importance of sustained
64
leadership focus. The research of Brown et al. (2013) confirmed the importance of
sustained leadership focus by illustrating the importance of monitoring key improvement
targets over time. Bryk et al. (2015) supported this research in their identification of the
three steps of causal analysis to drive improvement and confirmed the system
improvement map must be implemented over a period of time.
Participants engaged in the study were asked if the staff under their leadership
were aware of their dashboard measures. This interview question was chosen to examine
the impact of overt leadership actions on system improvement. Brown et al. (2013)
found the most impactful way a leader can communicate the importance of an
improvement measure is by publicly monitoring it. Brown et al. (2013) also asserted
leaders must follow-up on the monitoring phase by consistently responding to the
measures and by modeling system improvement behaviors.
Leaders engaged in the research study were asked to share the current focus of
their leadership dashboards. This question was asked to determine the variety of
leadership dashboard targets among the system’s leaders. Robert Rothman (2015) found
leadership dashboards must be specific to a system’s needs and ability to monitor
improvement. The leadership dashboard must contain specific system measures if it is to
serve as a crosswalk between personal behaviors and system improvement processes
(Goodwin, 2011).
Research participants were asked to explain how their leadership dashboards have
evolved. This question was posed to determine if leaders modified the focus or
implementation of leadership dashboards over time. Bryk et al.’s (2015) investigation of
system improvement revealed teams typically begin the improvement process by
65
establishing broad system goals too general to monitor or to address successfully. Teams
and leaders experienced in system improvement establish specific improvement targets
easier for all members of the team to conceptualize and monitor (Bryk et al., 2015).
Data Collection
Before the interviews, a meeting was held between the researcher and
independent proctor. The purpose of the meeting was to educate the independent proctor
on the nature of the research, familiarize the independent proctor with interview
questions, review the research process, review the process to assure anonymity of the
research participants, and allow the researcher to ask questions. The independent proctor
utilized this opportunity to determine appropriate prompting to be used during the
interview process.
The independent proctor contacted each of the research participants via phone to
conduct research interviews. Responses from research participants were recorded by the
independent proctor. Bloomberg and Volpe (2016) stated, “As a further indication of
validity, where possible, researchers should document feedback on their interpretation of
data from study participants” (p. 159). The independent proctor provided further
indication of validity by repeating the responses from the research participants following
each question. Upon completion of the interviews, the independent proctor transcribed
the responses and provided an electronic transcript to the researcher. This process
ensured anonymity of all research participants.
Data Analysis
The interviews were recorded and transcribed by the independent proctor. The
completed transcripts were then sent electronically to the researcher. Responses were
66
analyzed using coding methods to “identify significant patterns and construct a
framework for communicating the essence of what the data revealed” (Bloomberg &
Volpe, 2016, p. 159). Open-ended interview questions accompanied by evolving themes
resulted in a more comprehensive qualitative study (Creswell, 2014).
Data analysis necessitates keen attentiveness to the data and objectivity in
identifying recurring themes or trends (Guest, MacQueen, & Namey, 2012). Responses
were analyzed using coding methods to identify trends, themes, and key descriptors.
Coding is a method of arranging data into categories to permit the qualitative researcher
to make sense of the data (Creswell, 2014).
The responses of participants to each interview question were reviewed several
times. Following the reviews of responses, key descriptors were identified and coded
using colored pencils for key descriptors, as suggested by Creswell (2014). The color-
coded key descriptors were then grouped into common themes and categories. The
common themes and categories were placed in a table to facilitate interpretation of the
data.
Summary
This qualitative study involved system leaders in a Missouri public school district.
Qualitative data were collected through interviews conducted by an independent proctor.
The interviews were constructed to elicit responses regarding the participants’
perceptions of leadership dashboards. Responses to the interview questions were
transcribed by the independent proctor and forwarded to the researcher. The responses
were then recorded and coded to reveal common themes.
67
In Chapter Three, the methodology used in this qualitative study was delineated,
and a summary of the problem and purpose of the study was provided. Descriptions of
the population, sample, and instrumentation used to gather data were provided. Lastly,
data collection and description of data analysis methods were provided. Participant
responses to surveys and a subsequent analysis of responses are included in Chapter Four.
Chapter Five includes findings, conclusions, implications, and recommendations for
future research.
68
Chapter Four: Analysis of Data
The purpose of this study was to examine the perceptions of school administrators
and directors regarding the effectiveness of leadership dashboards in focusing their
behaviors in a manner congruent to their organizational improvement plans. Arnold and
Marchese (2011) illustrated the difficulty in replicating private industry’s success of
continuous improvement methodologies in public education in the following posit:
The standard response to doubt is to be urged to do more: collect more data, act
more frequently, document more thoroughly − this has to work. But the problem
may not be insufficient effort. It may lie instead in disconnects between the
continuous improvement model as operationalized in business and industry and
the attempt to apply it in an unexamined fashion to educational environments. (p.
16)
As their name suggests, the essential goal of continuous improvement methodologies is
to sustain improvement of an organization so it may be deemed highly reliable in terms
of producing desired results (Eck et al., 2011). Eck et al. (2011) defined a high-reliability
organization as it applies to educational systems: “high levels of student performance,
achieved as a result of high-quality instruction, delivered through superior execution of
effective research-based practices, with low variability in the quality of instruction within
and between schools” (p. 3). The culture of all high-reliability organizations is a
preoccupation with failure and subsequent prevention of failure (Eck et al., 2011).
Federally mandated accountability systems have created a need for public
education systems to pursue the tenants of high-reliability organizations (Eck et al.,
2011). Paramount to the successful creation of a culture of continuous improvement and
69
high reliability is the dedication of central office leadership to support increased
organizational capacity (Wayman, Cho, Jimerson, & Snodgrass Rangel, 2010). To
successfully implement continuous improvement structures, central office leaders must
provide systematic processes to ensure systemic improvement and a clear focus on
specific organizational goals (Wayman et al., 2010). Unfortunately, the field of
education does not lend itself to specific, measurable organizational goals, nor does it
systematically equip system leaders with the necessary tools to lead continuous
improvement initiatives (Mrachko, 2015). Bryk et al. (2015) found these items are all
representative of a complex system characterized by an abundance of interactions
between loosely related and densely interconnected systems.
Bryk et al. (2015) proposed the hurdle in leading complex systems toward high
reliability is the difficulty to “predict fully the outcomes from attempts to change them”
(p. 58). Compounding this difficulty is the additional challenge of “seeing the actual
organization of work amidst this complexity” (Bryk et al., 2015, p. 46). Central to the
success of complex system leaders in meeting the aforementioned challenges is the
identification of high-leverage processes (Bryk et al., 2015). High-leverage processes
possess the following properties: “(1) they consume substantial resources, especially
teacher or student time; (2) their execution and outcomes vary considerably; and (3) there
are reasons to believe that changes in these processes might yield significant
improvements” (Bryk et al., 2015, p. 47). Bryk et al. (2015) suggested high-leverage
processes abound in education, and “improvement research here can make a big
difference” (p. 47).
70
Bryk et al. (2015) asserted high-leverage processes should be detailed out as
standard work to ensure the systematic nature of associated processes. The concept of
standard work was further explored in the following research by Bryk et al. (2015):
The concept of standard work is central to quality improvement, but it is also a
multifaceted and carefully nuanced idea. It can be easily confused, for example,
with efforts to de-skill professional practice. Its goal is exactly the opposite. The
development of standard work aims to better support the activities that
professionals engage in so that they are more likely to achieve positive outcomes
reliably over and over. (p. 47)
The systemic nature of high-leverage processes and the challenge of developing
associated standard work in the complex educational system may be the primary
inhibitors to continuous improvement in education (Bryk et al., 2015).
For the purposes of this study, the potential of leadership dashboards in
monitoring standard work and impacting high-leverage processes was examined. The
investigation of leadership dashboards addresses the aforementioned need for additional
research in the area of high-leverage processes (Bryk et al., 2015). The impact of
leadership dashboards was studied to determine if they aid school leaders in providing a
systematic focus on leadership actions to facilitate school improvement.
The researcher wanted to gain a more thorough understanding of the system
leader perceptions of leadership dashboards through a qualitative approach based on the
following research questions:
1. Does the leadership dashboard enhance system improvement?
71
2. Does the leadership dashboard enhance the personal efficacy of system
leaders?
3. Does the fidelity of implementation of leadership dashboards impact system
improvement?
Qualitative data were collected through phone interviews conducted by an
independent proctor. Research participants included central office administrators,
building principals, building assistant principals, and departmental directors. All
participants were asked open-ended questions regarding their perceptions of the
effectiveness of leadership dashboards in organizational improvement.
Interviews were the primary data collection tool for this study. All interviews
were conducted by an independent proctor. The independent proctor audio-recorded all
interviews and provided a transcription of interviews to the researcher. All participants in
the study were active administrators in a Missouri school district that has deployed
leadership dashboards.
Research Question One
Does the leadership dashboard enhance system improvement?
Interview question three. Has the leadership dashboard assisted you in
sustaining improvement plans? If so, how?
Seven of the eight leaders acknowledged the leadership dashboard assisted them
in sustaining improvement plans. The dissenting leader did not answer “no” to this
question but did state, “The biggest thing that has driven our school improvement is our
Building School Improvement Plan and not our dashboards.” All of the assenting leaders
acknowledged the leadership dashboard assisted them in sustaining improvement plans

72
by overtly linking leadership behaviors to actions that impact the desired improvement.
Leader 4 demonstrated the personal nature of the leadership dashboard and the
dashboard’s impact on his or her sphere of focus in the following manner:
My dashboard last year had to do with communication, and before I had that as a
dashboard I did not pay a lot of attention to communication, and when I did, it
was in a very haphazard way. Having that dashboard that measured the amount
of communications that I did and through what channels really focused me on
what I was trying to accomplish.
Leader 1 summarized the experience in a like manner by stating the leadership dashboard
“reminds us every day and every week and every month of the goals that we set for
ourselves and the behaviors that we wanted to monitor.”
In the following statement, Leader 7 credited the leadership dashboard with
providing structure to identify and monitor seemingly small behaviors to aid him or her in
moving the system forward:
I came on mid-year; I didn’t have the training for the evaluation process, so I
didn’t have that type of dashboard like many of the administrators had. Mine was
more on relationship building since I came into a new school half-way through
the year. Mine was more about relationship building with the staff, leaving
positive notes in all the classrooms monthly, also riding the buses to help build
relationships with the bus drivers to try to reduce discipline and show that we are
supporting them when they do provide us discipline referrals.
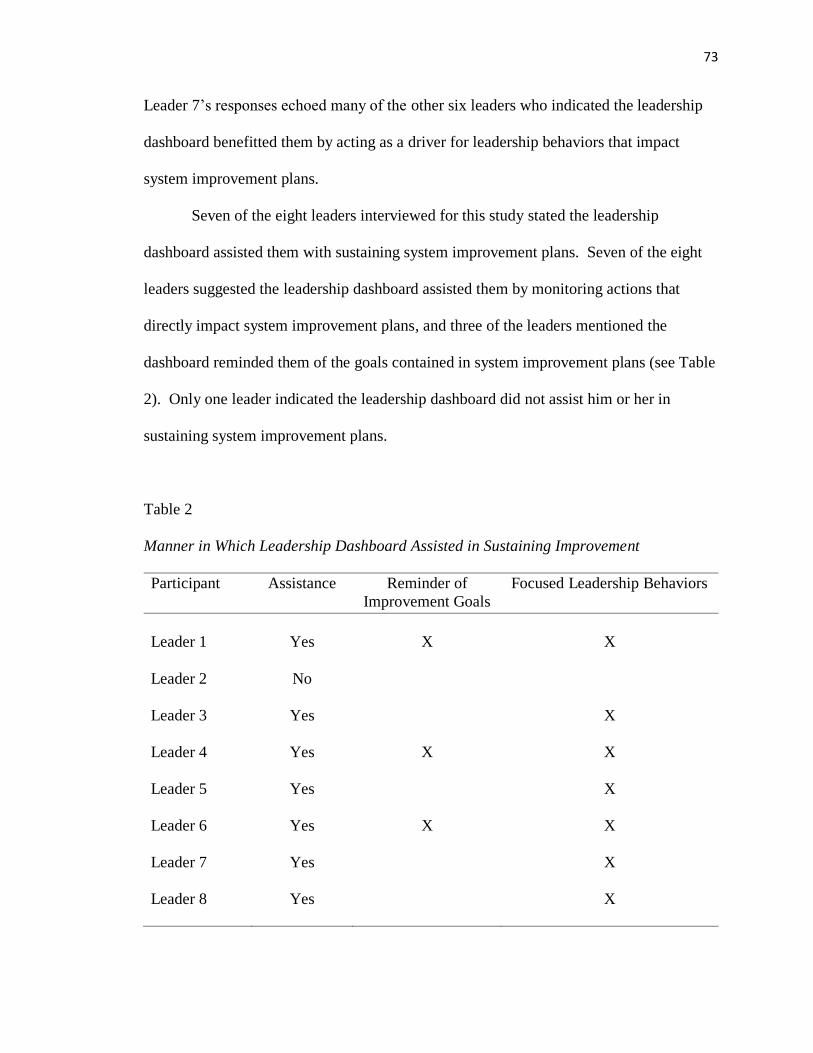
73
Leader 7’s responses echoed many of the other six leaders who indicated the leadership
dashboard benefitted them by acting as a driver for leadership behaviors that impact
system improvement plans.
Seven of the eight leaders interviewed for this study stated the leadership
dashboard assisted them with sustaining system improvement plans. Seven of the eight
leaders suggested the leadership dashboard assisted them by monitoring actions that
directly impact system improvement plans, and three of the leaders mentioned the
dashboard reminded them of the goals contained in system improvement plans (see Table
2). Only one leader indicated the leadership dashboard did not assist him or her in
sustaining system improvement plans.
Table 2
Manner in Which Leadership Dashboard Assisted in Sustaining Improvement
Participant
Assistance Reminder of
Improvement Goals
Focused Leadership Behaviors
Leader 1
Yes
X
X
Leader 2
Leader 3
Leader 4
Leader 5
Leader 6
Leader 7
Leader 8
No
Yes
Yes
Yes
Yes
Yes
Yes
X
X
X
X
X
X
X
X
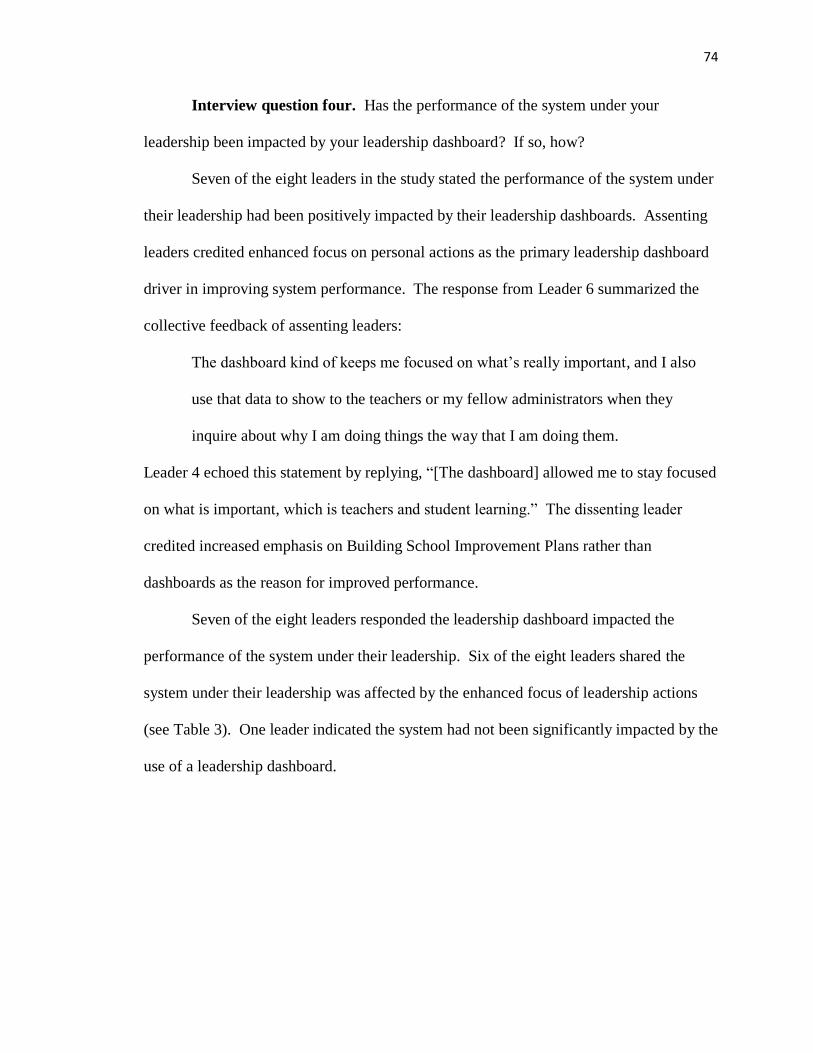
74
Interview question four. Has the performance of the system under your
leadership been impacted by your leadership dashboard? If so, how?
Seven of the eight leaders in the study stated the performance of the system under
their leadership had been positively impacted by their leadership dashboards. Assenting
leaders credited enhanced focus on personal actions as the primary leadership dashboard
driver in improving system performance. The response from Leader 6 summarized the
collective feedback of assenting leaders:
The dashboard kind of keeps me focused on what’s really important, and I also
use that data to show to the teachers or my fellow administrators when they
inquire about why I am doing things the way that I am doing them.
Leader 4 echoed this statement by replying, “[The dashboard] allowed me to stay focused
on what is important, which is teachers and student learning.” The dissenting leader
credited increased emphasis on Building School Improvement Plans rather than
dashboards as the reason for improved performance.
Seven of the eight leaders responded the leadership dashboard impacted the
performance of the system under their leadership. Six of the eight leaders shared the
system under their leadership was affected by the enhanced focus of leadership actions
(see Table 3). One leader indicated the system had not been significantly impacted by the
use of a leadership dashboard.
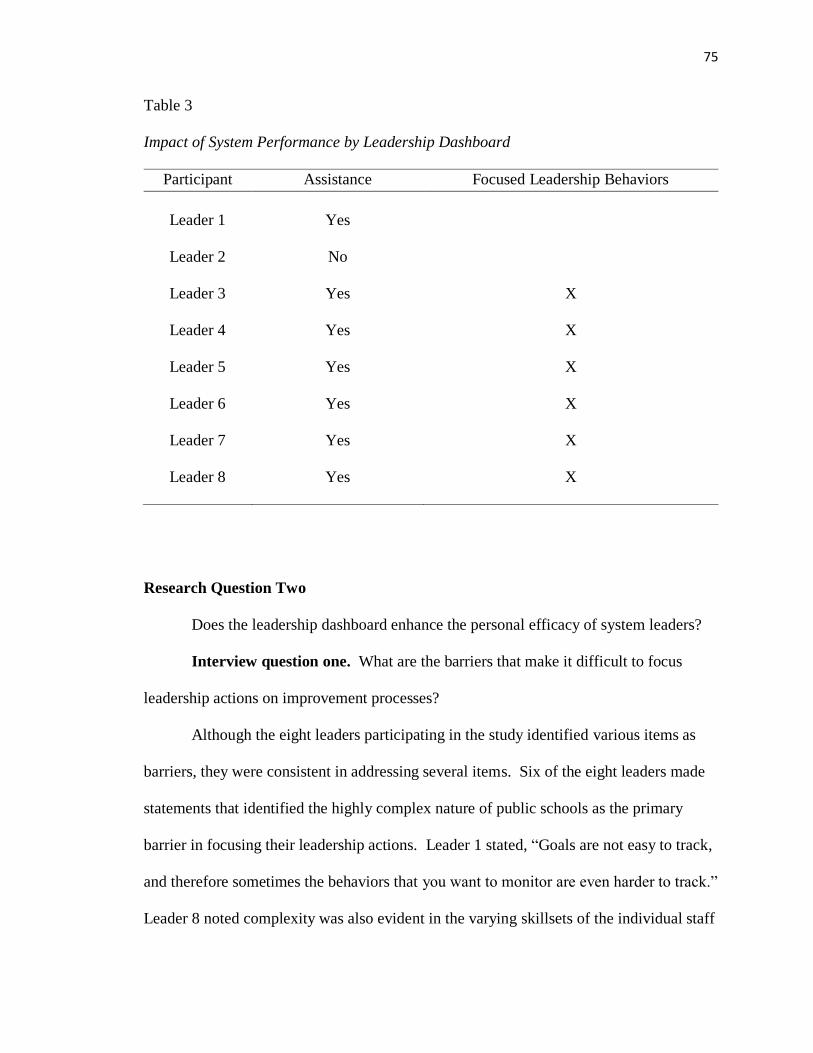
75
Table 3
Impact of System Performance by Leadership Dashboard
Participant Assistance Focused Leadership Behaviors
Leader 1
Yes
Leader 2
Leader 3
Leader 4
Leader 5
Leader 6
Leader 7
Leader 8
No
Yes
Yes
Yes
Yes
Yes
Yes
X
X
X
X
X
X
Research Question Two
Does the leadership dashboard enhance the personal efficacy of system leaders?
Interview question one. What are the barriers that make it difficult to focus
leadership actions on improvement processes?
Although the eight leaders participating in the study identified various items as
barriers, they were consistent in addressing several items. Six of the eight leaders made
statements that identified the highly complex nature of public schools as the primary
barrier in focusing their leadership actions. Leader 1 stated, “Goals are not easy to track,
and therefore sometimes the behaviors that you want to monitor are even harder to track.”
Leader 8 noted complexity was also evident in the varying skillsets of the individual staff
76
members and overall team. In addition to varying skillsets of intradepartmental staff
members, Leader 6 referenced the difficulty in meeting the various needs of departments
as a barrier in focusing leadership behaviors. Leader 6 explicitly referenced ongoing
difficulty in identifying and consistently meeting the varied needs of instructional,
administrative, and custodial staff.
Five of the eight leaders referenced time and interruptions as barriers that make it
difficult to focus leadership actions on improvement processes. Leader 8 summarized the
issue of time by stating, “You might start the day knowing what you want to spend your
time on, and the next thing you know it is 5:00 p.m. and you didn’t get it done, but you
have been busy all day.” Two of the leaders in the study also shared securing “buy-in”
from staff was a barrier (see Table 4).
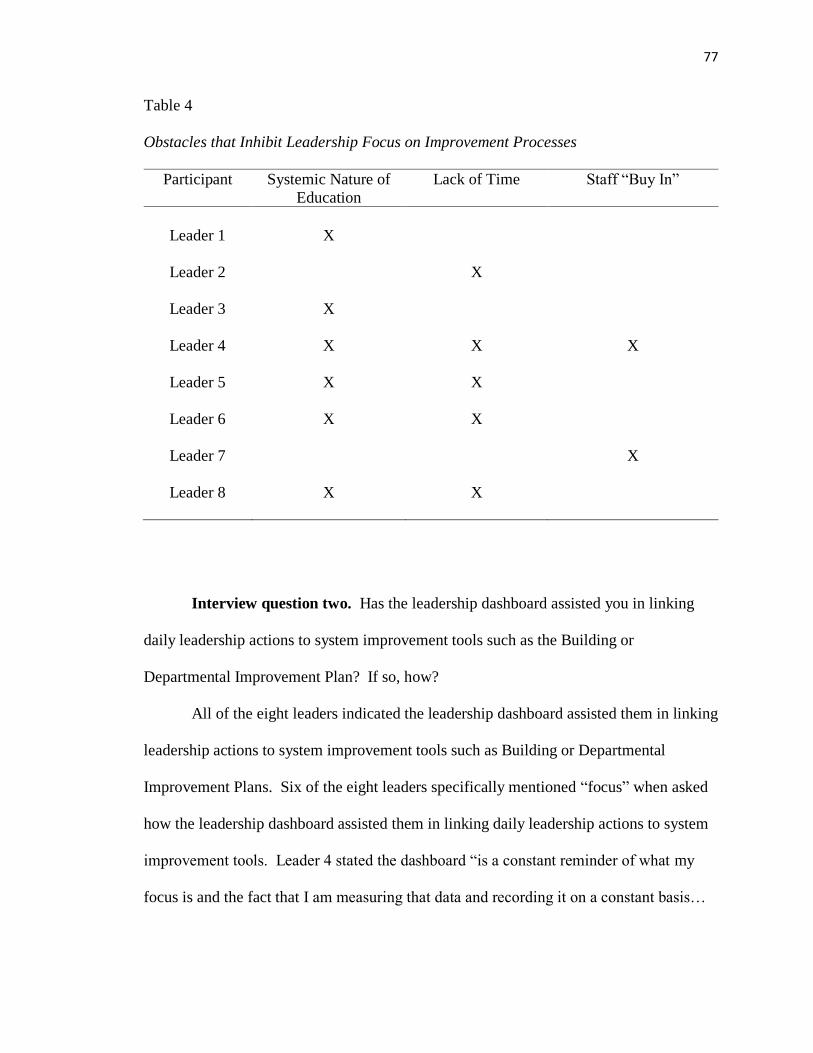
77
Table 4
Obstacles that Inhibit Leadership Focus on Improvement Processes
Participant Systemic Nature of
Education
Lack of Time Staff “Buy In”
Leader 1
X
Leader 2
Leader 3
Leader 4
Leader 5
Leader 6
Leader 7
Leader 8
X
X
X
X
X
X
X
X
X
X
X
X
Interview question two. Has the leadership dashboard assisted you in linking
daily leadership actions to system improvement tools such as the Building or
Departmental Improvement Plan? If so, how?
All of the eight leaders indicated the leadership dashboard assisted them in linking
leadership actions to system improvement tools such as Building or Departmental
Improvement Plans. Six of the eight leaders specifically mentioned “focus” when asked
how the leadership dashboard assisted them in linking daily leadership actions to system
improvement tools. Leader 4 stated the dashboard “is a constant reminder of what my
focus is and the fact that I am measuring that data and recording it on a constant basis…
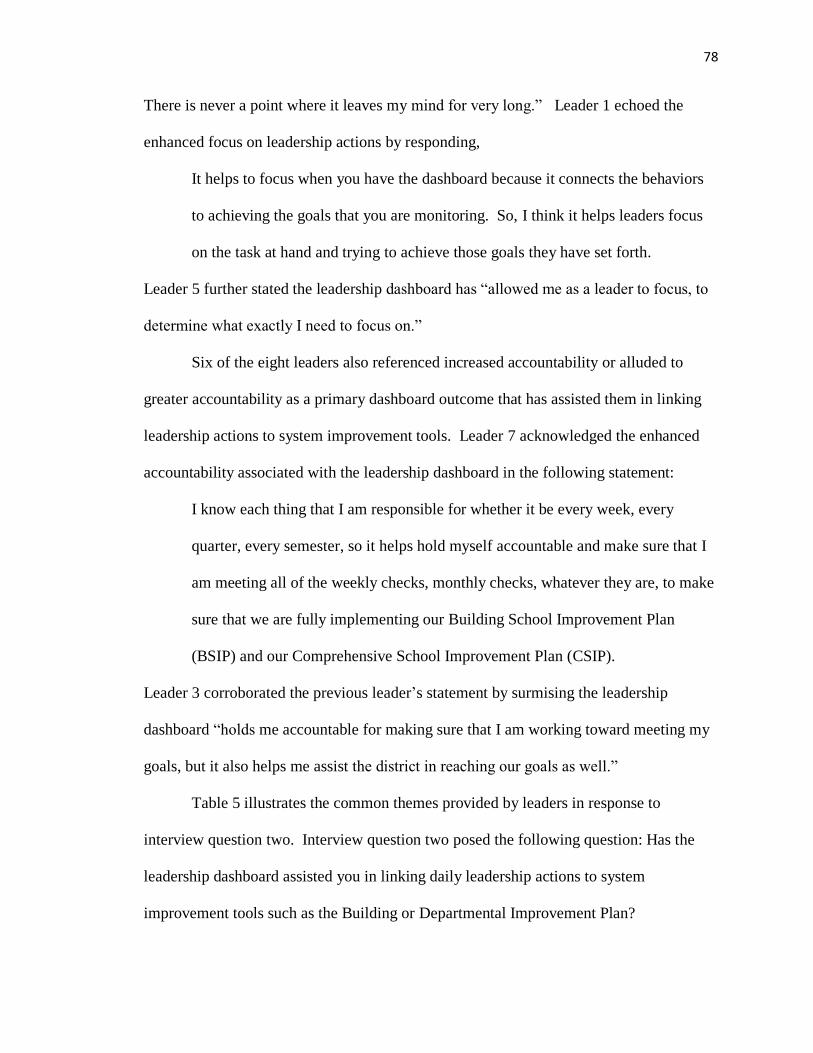
78
There is never a point where it leaves my mind for very long.” Leader 1 echoed the
enhanced focus on leadership actions by responding,
It helps to focus when you have the dashboard because it connects the behaviors
to achieving the goals that you are monitoring. So, I think it helps leaders focus
on the task at hand and trying to achieve those goals they have set forth.
Leader 5 further stated the leadership dashboard has “allowed me as a leader to focus, to
determine what exactly I need to focus on.”
Six of the eight leaders also referenced increased accountability or alluded to
greater accountability as a primary dashboard outcome that has assisted them in linking
leadership actions to system improvement tools. Leader 7 acknowledged the enhanced
accountability associated with the leadership dashboard in the following statement:
I know each thing that I am responsible for whether it be every week, every
quarter, every semester, so it helps hold myself accountable and make sure that I
am meeting all of the weekly checks, monthly checks, whatever they are, to make
sure that we are fully implementing our Building School Improvement Plan
(BSIP) and our Comprehensive School Improvement Plan (CSIP).
Leader 3 corroborated the previous leader’s statement by surmising the leadership
dashboard “holds me accountable for making sure that I am working toward meeting my
goals, but it also helps me assist the district in reaching our goals as well.”
Table 5 illustrates the common themes provided by leaders in response to
interview question two. Interview question two posed the following question: Has the
leadership dashboard assisted you in linking daily leadership actions to system
improvement tools such as the Building or Departmental Improvement Plan?
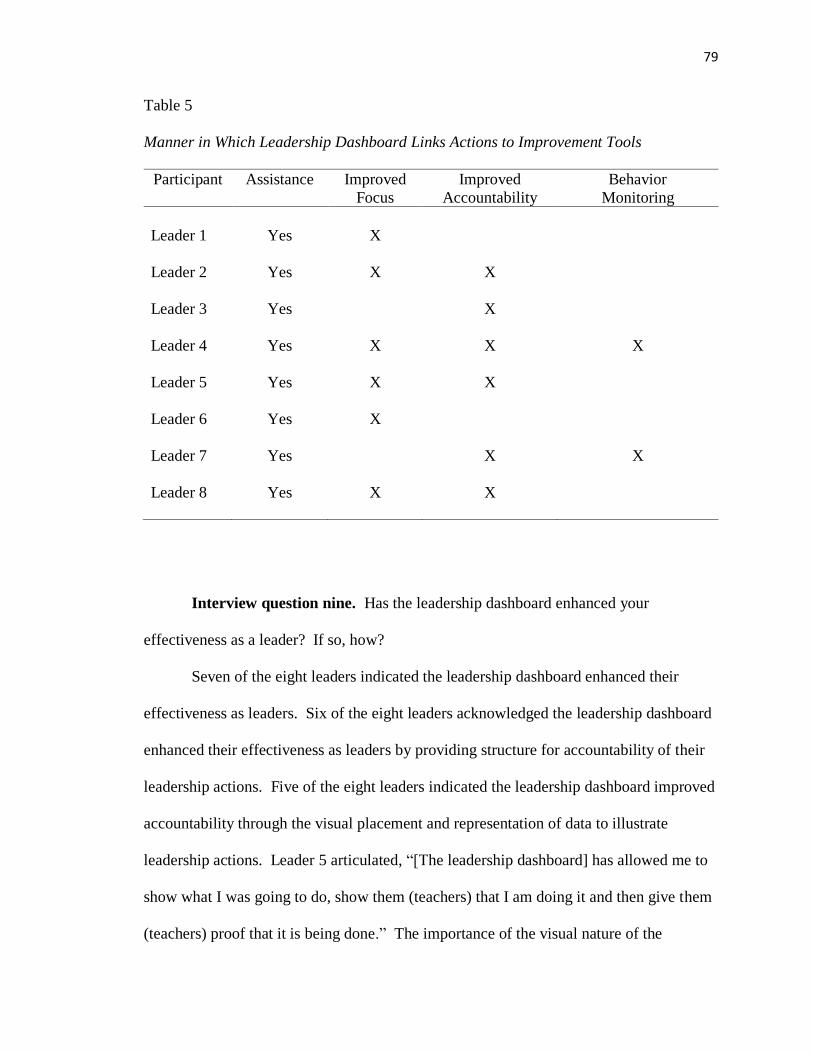
79
Table 5
Manner in Which Leadership Dashboard Links Actions to Improvement Tools
Participant Assistance Improved
Focus
Improved
Accountability
Behavior
Monitoring
Leader 1
Yes
X
Leader 2
Leader 3
Leader 4
Leader 5
Leader 6
Leader 7
Leader 8
Yes
Yes
Yes
Yes
Yes
Yes
Yes
X
X
X
X
X
X
X
X
X
X
X
X
X
Interview question nine. Has the leadership dashboard enhanced your
effectiveness as a leader? If so, how?
Seven of the eight leaders indicated the leadership dashboard enhanced their
effectiveness as leaders. Six of the eight leaders acknowledged the leadership dashboard
enhanced their effectiveness as leaders by providing structure for accountability of their
leadership actions. Five of the eight leaders indicated the leadership dashboard improved
accountability through the visual placement and representation of data to illustrate
leadership actions. Leader 5 articulated, “[The leadership dashboard] has allowed me to
show what I was going to do, show them (teachers) that I am doing it and then give them
(teachers) proof that it is being done.” The importance of the visual nature of the
80
leadership dashboard in providing accountability was identified in the response of Leader
7, who indicated the dashboard provided “something that I am actually collecting data on
so I know at the end of the week to enter if I did it or not.”
Five of the eight leaders recognized the leadership dashboard enhanced their
effectiveness as leaders by improving the focus of their leadership actions. Leader 1
summarized this effect by stating the leadership dashboard “keeps me focused, it keeps
me on track, it reminds me every day of the behaviors that I have set forth for myself so
that I can help achieve goals and meet expectations.” Leader 8 corroborated this
statement by indicating the leadership dashboard “keeps in front of me the work that I’ve
prioritized as important.” One leader stated the leadership dashboard had not enhanced
his or her effectiveness as a leader (see Table 6).
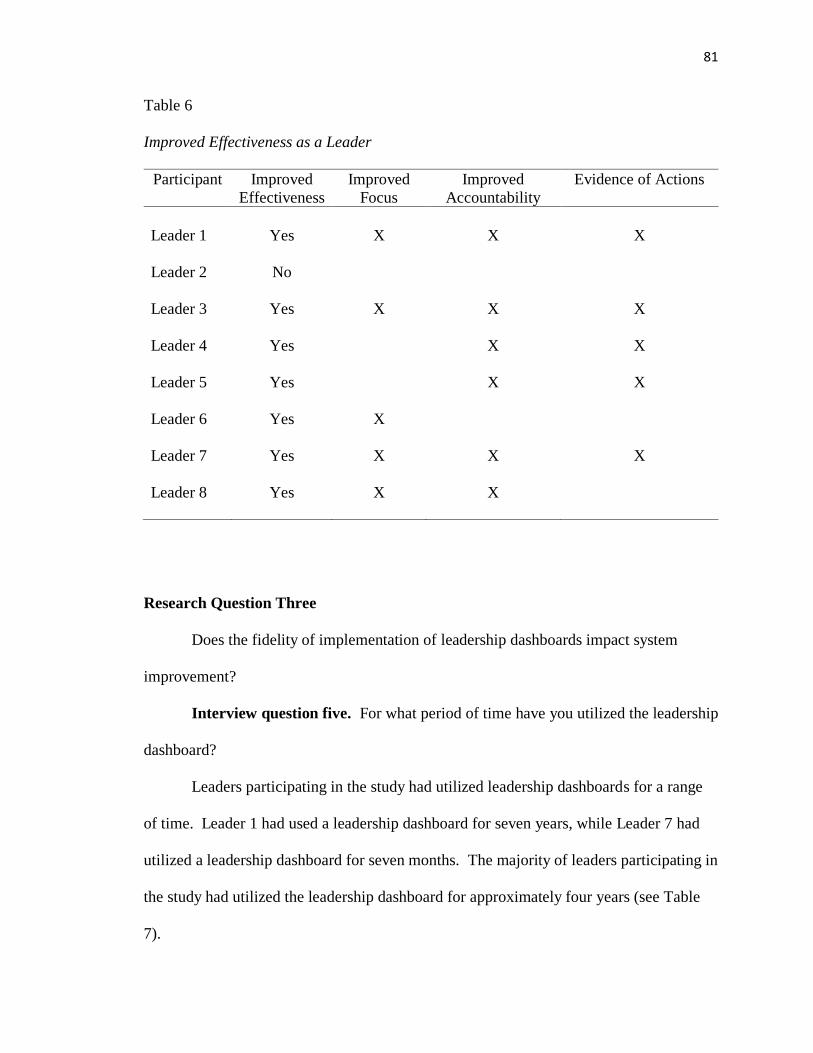
81
Table 6
Improved Effectiveness as a Leader
Participant Improved
Effectiveness
Improved
Focus
Improved
Accountability
Evidence of Actions
Leader 1
Yes
X
X
X
Leader 2
Leader 3
Leader 4
Leader 5
Leader 6
Leader 7
Leader 8
No
Yes
Yes
Yes
Yes
Yes
Yes
X
X
X
X
X
X
X
X
X
X
X
X
X
Research Question Three
Does the fidelity of implementation of leadership dashboards impact system
improvement?
Interview question five. For what period of time have you utilized the leadership
dashboard?
Leaders participating in the study had utilized leadership dashboards for a range
of time. Leader 1 had used a leadership dashboard for seven years, while Leader 7 had
utilized a leadership dashboard for seven months. The majority of leaders participating in
the study had utilized the leadership dashboard for approximately four years (see Table
7).
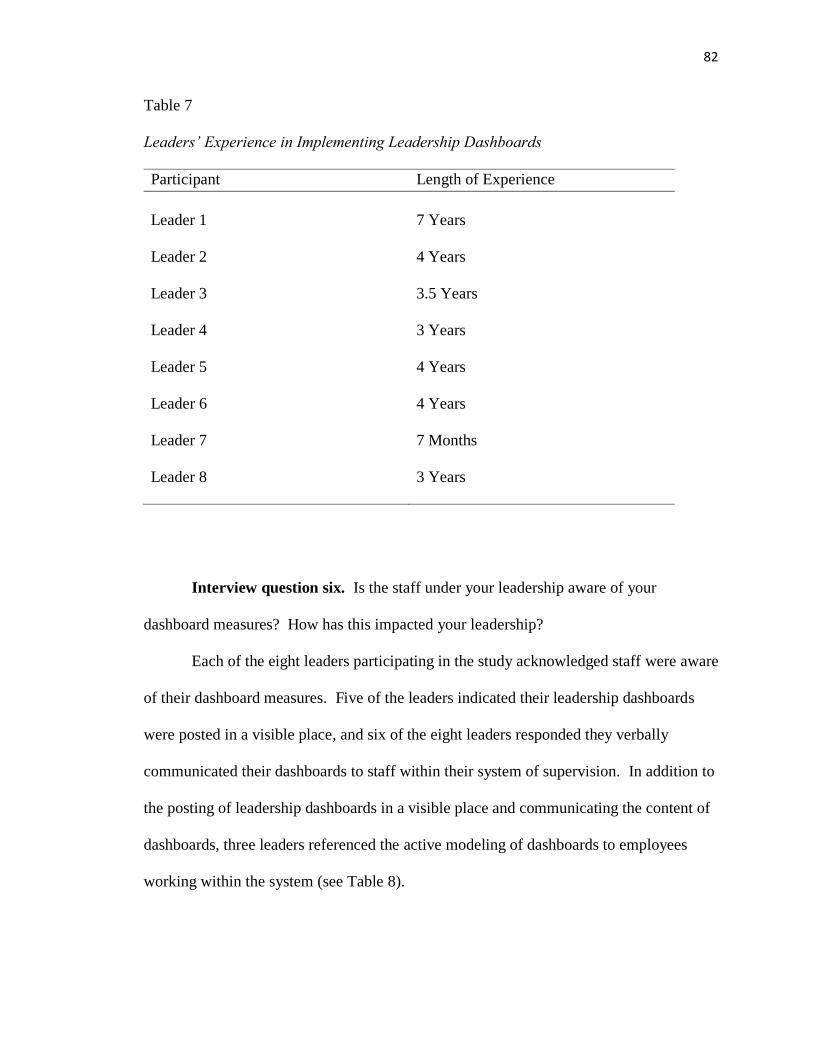
82
Table 7
Leaders’ Experience in Implementing Leadership Dashboards
Participant Length of Experience
Leader 1
7 Years
Leader 2
Leader 3
Leader 4
Leader 5
Leader 6
Leader 7
Leader 8
4 Years
3.5 Years
3 Years
4 Years
4 Years
7 Months
3 Years
Interview question six. Is the staff under your leadership aware of your
dashboard measures? How has this impacted your leadership?
Each of the eight leaders participating in the study acknowledged staff were aware
of their dashboard measures. Five of the leaders indicated their leadership dashboards
were posted in a visible place, and six of the eight leaders responded they verbally
communicated their dashboards to staff within their system of supervision. In addition to
the posting of leadership dashboards in a visible place and communicating the content of
dashboards, three leaders referenced the active modeling of dashboards to employees
working within the system (see Table 8).
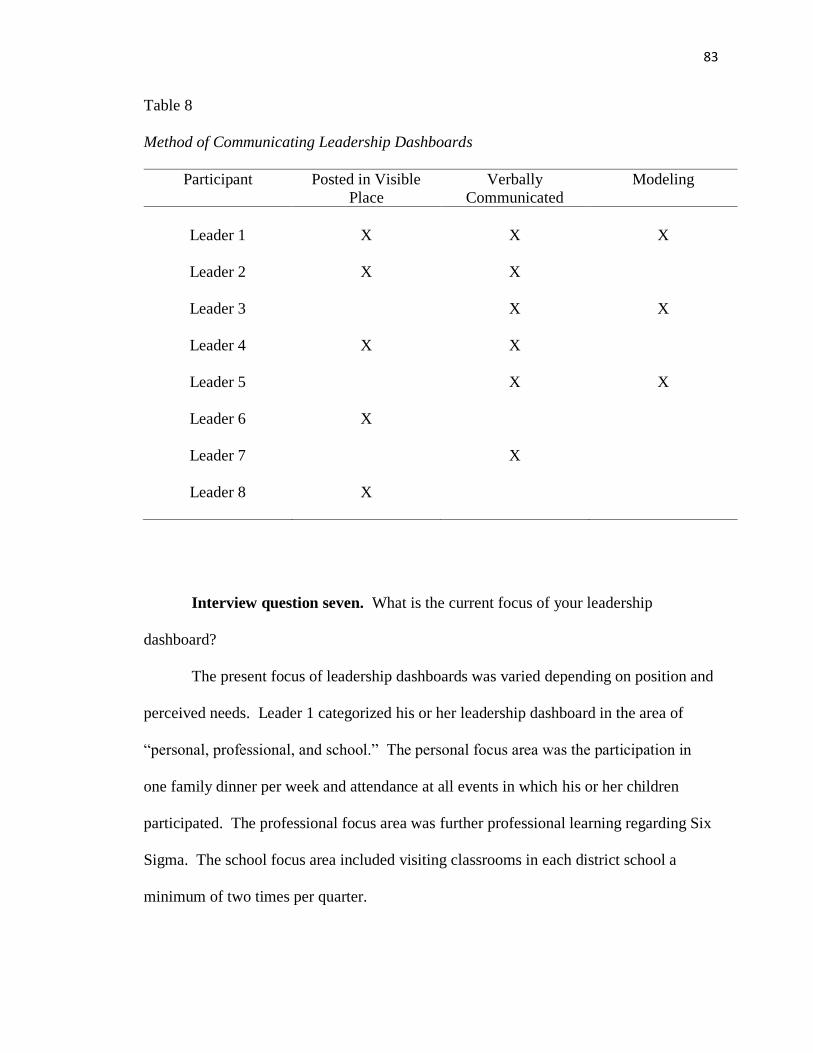
83
Table 8
Method of Communicating Leadership Dashboards
Participant Posted in Visible
Place
Verbally
Communicated
Modeling
Leader 1
X
X
X
Leader 2
Leader 3
Leader 4
Leader 5
Leader 6
Leader 7
Leader 8
X
X
X
X
X
X
X
X
X
X
X
Interview question seven. What is the current focus of your leadership
dashboard?
The present focus of leadership dashboards was varied depending on position and
perceived needs. Leader 1 categorized his or her leadership dashboard in the area of
“personal, professional, and school.” The personal focus area was the participation in
one family dinner per week and attendance at all events in which his or her children
participated. The professional focus area was further professional learning regarding Six
Sigma. The school focus area included visiting classrooms in each district school a
minimum of two times per quarter.
84
Several leaders indicated their leadership dashboards included communication as
the primary focus or contributing focus. The leadership dashboard of Leader 2 was
predicated upon the execution of an agreed-upon communication plan. The
communication plan included external and internal communication to staff and parents.
Additionally, the dashboard of Leader 2 included the tracking of completed teacher
evaluations with a new assistant principal. Leader 3 indicated the primary focus of his or
her dashboard was to “communicate with all of our patrons in a very systematic and
intentional way utilizing appropriate methods of communication to meet their needs.”
Leader 5 also stated the primary focus of his or her dashboard was communication to
fellow leaders in order to stay informed of the progress of projects.
The dashboard of Leader 6 also included communication to internal and external
patrons using social media. In addition to communication, the dashboard of Leader 6
monitored the completion of scheduled teacher evaluations and “early release agendas.”
Leader 6 added the purpose of monitoring “early release agendas” was to ensure the time
was being utilized “effectively for remediation and data collection.”
Leader 4 was very specific in outlining the content of his or her leadership
dashboard that included monitoring the updating of online grade books, Canvas accounts,
and teacher calendars. Leader 4 monitored and communicated these components by
reporting the percentage of teachers who updated their grade books, Canvas accounts,
and teacher calendars within 10 days. Leader 4 stated he or she communicated via email
to any teachers who had not updated these items within 10 days.
Leader 7 indicated his or her dashboard was predicated upon fostering
relationships with parents and learning more about Leader in Me. Leader 7 monitored
85
the building of relationships with parents by tracking the number of positive phone calls
made to parents. Leader 7 monitored new learning about Leader in Me by reading and
communicating informational material regarding the program. Leader 8 indicated his or
her dashboard was predicated upon the monitoring of “participation and system process
so that I have a hand in those processes so that I can monitor and make sure they are
running effectively.” Leader 8 gave no additional commentary to the referenced
processes.
Interview question eight. How has your leadership dashboard evolved?
Six of the eight leaders participating in the study used the terms “strategic” or
“intentional” in describing how their leadership dashboards have evolved. Two
participants used the term “more specific” to describe the evolution of their dashboards.
In addition to these descriptors, leaders also indicated their dashboards evolved to be
more effective, to include shorter monitoring cycles, and to possess the appropriate
metrics.
Leaders utilized different explanations to describe how their dashboards had
become more strategic or intentional. Leader 1 indicated his or her leadership dashboard
had become more strategic by reducing the monitoring cycle from 90 days to weekly.
Leader 5 indicated his or her leadership dashboard had become more intentional by
providing a structure that supported long-range planning and allowed the leader to “think
further out as far as my leadership planning.” Leader 4 indicated his or her dashboard
had improved the intentionality of his or her actions by providing a structure causing the
leader to be more “intentional on holding the line” in the area of focus (see Table 9). One
leader did not give a specific example of how his or her leadership dashboard evolved.
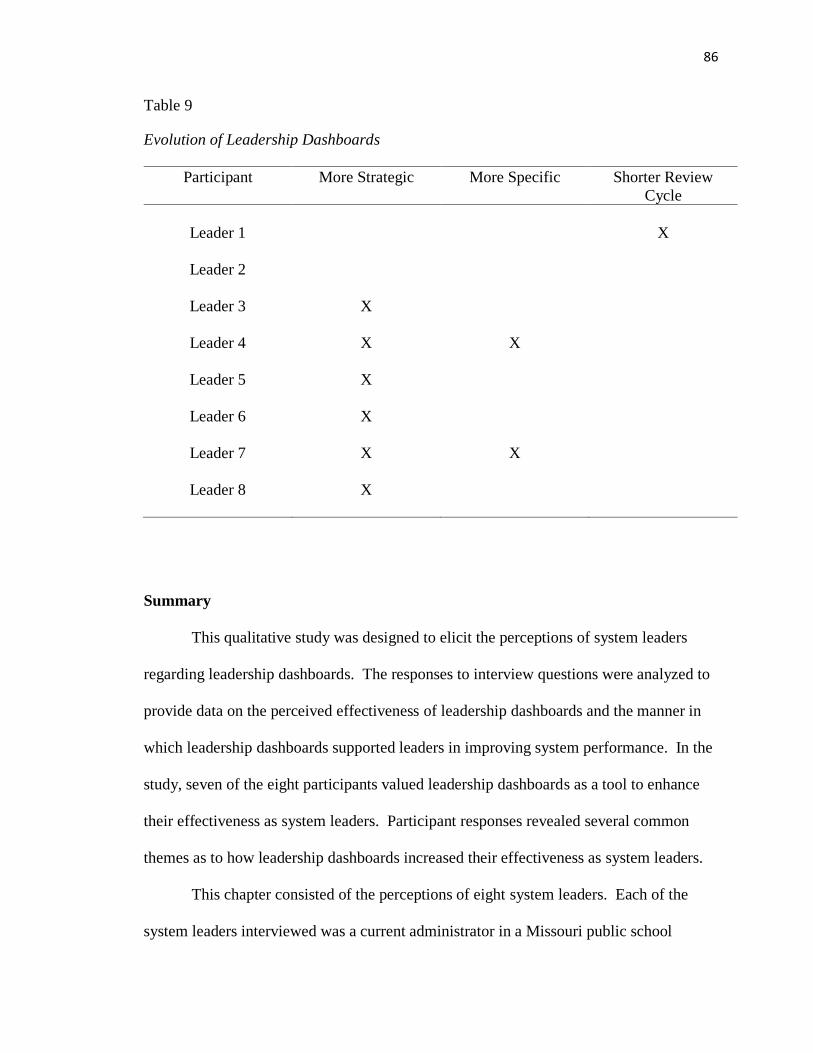
86
Table 9
Evolution of Leadership Dashboards
Participant More Strategic More Specific
Shorter Review
Cycle
Leader 1
X
Leader 2
Leader 3
Leader 4
Leader 5
Leader 6
Leader 7
Leader 8
X
X
X
X
X
X
X
X
Summary
This qualitative study was designed to elicit the perceptions of system leaders
regarding leadership dashboards. The responses to interview questions were analyzed to
provide data on the perceived effectiveness of leadership dashboards and the manner in
which leadership dashboards supported leaders in improving system performance. In the
study, seven of the eight participants valued leadership dashboards as a tool to enhance
their effectiveness as system leaders. Participant responses revealed several common
themes as to how leadership dashboards increased their effectiveness as system leaders.
This chapter consisted of the perceptions of eight system leaders. Each of the
system leaders interviewed was a current administrator in a Missouri public school
87
district. The responses of those interviewed were transcribed and analyzed to determine
common themes and differences.
Chapter Five includes the findings of this study. The three research questions are
revisited, and conclusions are deliberated. Implications of the conclusions are addressed,
and recommendations for further research regarding leadership dashboards are suggested.
88
Chapter Five: Summary and Conclusions
The implementation of continuous improvement structures is crucial to the
success of U.S. education systems (Frickx, 2015). A primary component of all
continuous improvement structures is the ability to systemically apply data-driven
decision-making (DDDM) processes (McCray, 2014). McCray (2014) suggested
education system leaders do not possess the self-efficacy to effectively lead DDDM
processes in the highly systemic structures of public education.
Dr. Bill Daggett (2014), founder and chairman of the International Center for
Leadership in Education, confirmed public education entities have been unable to realize
the same success associated with continuous improvement as other high-reliability
organizations (HROs) found in industries such as medicine. Dr. Bill Daggett (2014)
summarized public education has not been able to replicate the successes of other HROs
in monitoring, tracking, and responding to data. Goodwin (2011) suggested there exists a
need for a tool to connect small-scale improvement strategies to large-scale improvement
efforts.
The purpose of this qualitative study was to examine the perceptions of public
education system leaders regarding the benefits of leadership dashboards. Each of the
system leaders in the study had utilized a leadership dashboard for a period of seven
months to seven years. The answers to the research questions that guided the study are
found in Chapter Five. Supporting data are provided to substantiate these findings.
Conclusions, implications for practice, and recommendations for future research
regarding leadership dashboards are also provided.
89
Findings
This qualitative study involved investigation of the perceptions of public
education system leaders regarding leadership dashboards. The study was predicated
upon three guiding research questions. Participants were interviewed by an independent
proctor, and those interviews were transcribed to provide data. These data were then
studied to gain a better understanding of how system leaders perceive the effectiveness of
leadership dashboards. These findings were summarized and then applied to the
corresponding research questions. Supporting data from Chapter Two are provided in
this chapter to offer further comparisons with the results of this study.
Research question one. Does the leadership dashboard enhance system
improvement?
State and national leaders have continued to promulgate legislation necessitating
the implementation of systematic improvement processes (Eaton, 2012). The passage of
the ESSA complicated the issue of system improvement by transferring the
accountability of improvement goals and measures to individual states (AASA, 2016).
Burnett (2016) suggested the transfer of accountability to states will further complicate
improvement efforts, as state educational agencies are ill-prepared to be initiators of
innovation in meeting ESSA accountability plans. These changes may further inhibit the
public school system’s ability to reduce the number of goals due to the many competing
demands the modern school system must manage (Best & Dunlap, 2014).
Each of the eight participants was asked questions about perceptions of the impact
of leadership dashboards on system performance. Finally, each of the participants was
asked if leadership dashboards assisted in sustaining system performance. The
90
participants were then asked if the systems under their leadership had been impacted by
their leadership dashboards.
Seven of the eight participants indicated the use of leadership dashboards
enhanced system improvement. Although the seven participants differed in the perceived
manner in which leadership dashboards assisted them, they did affirm leadership
dashboards had a positive impact on system improvement. Six of the seven assenting
participants credited a heightened focus on specific leadership behaviors as the most
prominent reason for enhanced system improvement. This feedback echoed the research
of Park et al. (2013), who stated successful leaders must have a formal methodology for
communicating vision and monitoring progress.
When asked about the manner in which leadership dashboards assist in sustaining
system improvement, six of the seven participants referenced an increased focus on
specific leadership behaviors. Leader 1 expressed the benefit of heightened leadership
focus and claimed the leadership dashboard “reminds us every day and every week and
every month of the goals that we set for ourselves and the behaviors we want to monitor.”
This response indicated leadership dashboards support system leaders by clarifying
leadership actions within the complex system of public education. Arnold and Marchese
(2011) suggested the ambiguity of improvement structures, goals, and measures in the
highly systemic structure of public education often inhibit the success of improvement
efforts.
91
Research question two. Does the leadership dashboard enhance the personal
efficacy of system leaders?
Best and Dunlap (2014) found an abundance of evidence to support system
leaders as having the pivotal role in the implementation and sustainability of
improvement processes. Unfortunately, Frabutt and Holter (2012) suggested educational
leaders are ill-equipped and frequently do not possess the necessary skills to lead system
improvement initiatives. Frabutt and Holter (2012) proposed educational leaders lack
preparatory courses in higher education that provide data-based decision-making content
essential to all continuous improvement structures. This has contributed to diminished
leader efficacy in the area of system improvement (Frabutt & Holter, 2012).
Each of the eight research participants was asked questions about perceptions of
personal efficacy. The participants were asked questions to determine the existing
barriers that inhibit their focus on specific leadership actions and if leadership dashboards
assist them in linking leadership actions to improvement plans. Finally, the participants
were asked if leadership dashboards enhanced their effectiveness as leaders.
All eight of the participants in the study identified barriers that made it difficult to
focus leadership actions on improvement processes. Six of the eight participants
identified the ambiguity of goals and diversity of goals as barriers. Leader 1 specifically
indicated, “Goals are not easy to track and therefore, sometimes, the behaviors that you
want to monitor are even harder to track.” These responses corroborated the research of
Park et al. (2013), who found public education is highly systemic and employees fill a
multitude of roles that indirectly impact student learning. Bryk et al. (2015) further stated
this results in an ambiguity in the roles educators must assume in managing
92
organizational data-driven decision-making processes and in individual behaviors which
drive organizational improvement processes.
All research participants claimed leadership dashboards assisted them in linking
daily leadership actions to system improvement tools. Increased focus and accountability
emerged as the two primary drivers for improved congruence between leadership actions
and system improvement tools. Improved focus and accountability were identified by six
of the eight research participants. Four of the eight research participants referenced both
improved focus and accountability in their responses. These responses suggested
leadership dashboards supported the research participants in decreasing the ambiguity of
improvement measures and roles identified by Park et al. (2013) and Bryk et al. (2015).
Seven of the eight research participants responded leadership dashboards
improved their effectiveness as leaders. The importance of leadership effectiveness and
the subsequent impact on perceived self-efficacy are critical to the success of continuous
improvement efforts. The significance of leadership effectiveness was illustrated in the
research of Branch, Hanushek, and Rivkin (2013), who found effective principals
increased achievement of an average student by two to seven months in an average
school year. Of the seven participants who indicated the leadership dashboard enhanced
their effectiveness as leaders, six answered the leadership dashboard provided additional
structure for personal accountability. These responses validated the research of Goodwin
(2011), who found successful school improvement strategies must involve a management
structure to track “quick wins” and address fractal needs.
Research question three. Does the fidelity of implementation of leadership
dashboards impact system improvement?
93
Each of the research participants was asked questions to determine the fidelity of
implementation of leadership dashboards. All participants were asked for the period
during which they had utilized leadership dashboards, the current focus of their
dashboards, and how their leadership dashboards had evolved. Finally, participants were
asked how they communicated the focus, measures, and progress of leadership
dashboards to staff.
All participants answered their dashboards were either placed in a visible area or
verbally communicated to employees on a consistent basis. Kirkpatrick and Kirkpatrick
(2014) found clearly stated and communicated leadership inputs are essential drivers for
improvement initiatives. Westover (2014) further indicated leadership inputs should be
limited to three or fewer to have the greatest potential for sustained improvement.
Three of the eight research participants indicated their leadership dashboards were
posted in a visible place, and progress was verbally communicated to staff on a consistent
basis. Three of the eight participants also answered they consistently modeled their
leadership dashboards by discussing the implementation and monitoring with staff in an
effort to implement leadership dashboards within their system. Brown et al. (2013)
identified modeling and confronting as two of the most powerful means by which a
leader can convey the importance of a focus area. The Wallace Foundation (2013)
identified cultivation of leadership in others as one of the five key tasks a school leader
should initiate to establish high standards and learning expectations.
Conclusions
Conclusions were predicated on the responses of the research participants to the
interview questions and research questions that directed the study. This section contains
94
some of the common perceptions among system leaders regarding leadership dashboards.
The following themes arose following an analysis of interviews with research
participants.
Leadership dashboards enhance system improvement. Following an analysis
of the transcribed responses, it was found system leaders perceive leadership dashboards
enhance system improvement. Seven of the eight leaders participating in the study
responded leadership dashboards enhance system improvement. The same seven
participants indicated leadership dashboards also assist in sustaining system
improvement.
Bryan Goodwin (2011), the author of Simply Better, stated a crosswalk which
contains fidelity and performance measures must be established to ensure personal
behaviors are focused and congruent to organization improvement processes. The seven
assenting participants stated the leadership dashboards enhanced system performance by
providing a structure to clearly state and monitor leadership behaviors. This structure
provided improved focus on individual leadership behaviors identified by the leaders as
crucial to improving system performance. This structure also met the criteria established
by Bryk et al. (2015), who stated a complex system must be monitored by simplifying
processes so the organization of work may be monitored amidst the system’s complexity.
Leadership dashboards enhance personal efficacy of system leaders.
Examination of responses from research participants indicated the participants perceived
leadership dashboards enhance their efficacy as leaders. McCray (2014) defined self-
efficacy as the belief in one’s ability to perform a task or meet a goal.
95
These findings support the research of Ginsberg and Multon (2011), who
identified growing stress and concern among building principals associated with having
to meet increasing demands with decreasing resources. Ginsberg and Multon (2011)
illustrated the clear need for a tool such as the leadership dashboard to support self-
efficacy concerning the growing demands placed on school leaders. Six of the eight
research participants stated the leadership dashboard improved self-efficacy by
establishing clear accountability measures. Five of the six participants who identified
accountability also said public posting of the dashboard enhanced the accountability
associated with the leadership dashboard.
Additionally, McCray (2014) found leaders in underperforming schools possessed
ambiguity as to their ability to utilize data-driven decision making to enhance academic
achievement. Five of the eight leaders participating in the research stated leadership
dashboards improved their self-efficacy by providing additional focus on their leadership
behaviors. Leader 8 articulated this by indicating the leadership dashboard “keeps the
work in front of me that I prioritized.” This statement affirmed the research of
Kirkpatrick and Kirkpatrick (2014), who found the lack of focus on explicit
implementation drivers has been identified as the source of fragmented implementation
of system change in education. Five of the seven participants further supported this by
stating the leadership dashboard improved self-efficacy by providing proof of action by
the leader.
Public awareness of leadership dashboards enhance their effectiveness.
Public posting of the leadership dashboard and its measures appeared to increase its
effectiveness in supporting the leader. All of the eight participants in the research stated
96
staff members were aware of their dashboards. Six of the eight system leaders stated
staff members were also aware of the specific goals or focus areas identified in the
dashboards.
Each of the leaders who stated staff members were aware of specific goals or
focus areas also responded positively to the following questions that addressed system
performance or self-efficacy: 1. Has the leadership dashboard assisted you in linking
daily leadership actions to system improvement tools such as the Building or
Departmental Improvement Plans? 2. Has the leadership dashboard assisted you in
sustaining system improvement plans? 3. Has the performance of the system under your
leadership been impacted by your leadership dashboard?
It appears leaders who communicate the goals of their leadership dashboards to
staff members have a positive perception of the leadership dashboard and its impact on
system improvement. This would support the research of Brown et al. (2013), who
bluntly stated, “One of the most powerful means by which a leader can convey the
importance of something is by paying attention to it” (p. 37). Additionally, Brown et al.
(2013) identified modeling, monitoring, and confronting as three of Rick DuFour’s five
activities system leaders should focus upon for sustainable improvement. The public
posting and communication of dashboard content, goals, and progress appear to enhance
the perception of dashboard impact on efficacy of leadership.
Enhanced efficacy could be attributed to the transparency associated with the
public posting of leadership dashboard content, goals, and progress. Rothman (2015)
stated publicly posted data dashboards improve the perception of organizational
transparency. Rothman (2015) asserted perception of organizational transparency was
97
increased by providing visible evidence to internal patrons and external patrons of school
focus and associated performance.
Leadership dashboards evolve. The most effective leadership dashboards are
personalized and remain fluid based on the perceived needs of the leader. All of the
leaders participating in this study indicated their leadership dashboards had evolved.
Seven of the eight participants in this research study indicated their leadership dashboards
had become more strategic or purposeful with time. Leader 2 did not attribute increased
efficacy with the implementation of leadership dashboards but did state his or her
leadership dashboard had become more effective with time.
The feedback from the research participants corroborated the research of Rothman
(2015), who stated effective dashboards are fluid and allow organizations to modify
indicators as desired results are achieved and additional performance concerns are
identified. Kirkpatrick and Kirkpatrick (2014) posited dashboards must be focused on
explicit leadership inputs that change to meet the needs of a complex organization. Bryk
et al. (2015) proposed this flexibility allows leaders to have a holistic view of the system
and to be strategic in leadership actions.
Implications for Practice
The eight participants interviewed for this study offered varied opinions regarding
their perceptions of leadership dashboards. All of the participants in the research study
indicated their leadership dashboards had evolved to become more strategic, specific, or
effective. Seven of the eight research participants interviewed for this study perceived
implementation of leadership dashboards enhanced their professional efficacy and
performance of their system.
98
Based on the data collected in this study, school superintendents and higher
learning organizations should be prepared to expand professional learning opportunities
through tools such as leadership dashboards. The tools should provide system leaders
with the structure to focus, measure, and communicate leadership actions. This study did
result in identification of a tool of this nature to be utilized as a standard operating
procedure for public school districts or a standard component of higher education
preparatory curriculum for educators. Based upon the responses of the research
participants, a tool such as the leadership dashboard may provide a crosswalk between
focused daily actions of the system leader and the system improvement plan.
Ideally, the system improvement plan is developed by all stakeholders and
includes system goals, action steps, and measures to monitor progress (Bernhardt, 2016).
Most educational systems recognize the importance of leaders in driving system
improvement but fail to account for the many barriers to focused leadership in a highly
complex system (Kirkpatrick & Kirkpatrick, 2014). This oversight fails to ensure daily
actions of the system leader align with what is most important to accomplish the system
improvement plan goals.
Although significant differences exist between private industry and educational
organizations, many educational organizations are experiencing success with continuous
improvement strategies. Educational organizations have implemented structured
improvement strategies predicated upon measurable improvement cycles (Fullan &
Quinn, 2016). Many educational entities have evolved to include shorter-term
improvement cycles and improvement cycles at various levels of subsystems (Rothman,
2015). This evolution is the result of educational organizations responding to increased
99
accountability associated with the growing number of legislative mandates (Mrachko,
2015).
To continue the path of improvement, educational organizations must recognize
the systemic nature of education and mentor educators in system improvement structures
that will result in a culture of high reliability. This will necessitate a shift from
transactional leadership to transformational leadership, where all employees recognize
they are leaders of their system (Bryk et al., 2015). To realize success, leaders must
possess the capacity to implement system improvement structures as well as a tool such
as the leadership dashboard to identify and monitor system leader input.
Recommendations for Future Research
This qualitative study was designed to solicit the perceptions of educational
leaders within one school district regarding leadership dashboards. Assessment of the
perceptions of system leaders in other school districts is necessary to determine if these
data are applicable throughout other school districts or are unique to leaders within the
district of this scope of study. Additional study to investigate the presence and
perception of leadership tools such as the leadership dashboard may prove beneficial to
the field of education.
An additional qualitative study on the presence and perceptions of a culture of
high reliability within the field of education could provide further insight into the
difficulty in implementing private industry’s continuous improvement strategies. A
qualitative study focused on school districts with this culture identified within their
strategic plans could provide further clarification regarding the benefits of system
thinking. This study could involve investigation of the structures of these school districts
100
as they build the capacity of employees to implement system improvement structures
within their highly systemic organizations.
Summary
The purpose of this study was to examine school administrators’ perceptions of
the impact of leadership dashboards on efficacy to promote the systemic improvement of
the systems under their direction. Eight system leaders were randomly selected and
interviewed by an independent proctor. The interviews were recorded, transcribed, and
analyzed.
The analysis of data from this study revealed leadership dashboards are perceived
to convey positive benefits to system leaders who have implemented leadership
dashboards. Leadership dashboards were determined to support leaders in their effort to
promote systemic improvement of the systems under their direction. Data indicated
leadership dashboards provided leaders with structure to identify, communicate, and
monitor specific leadership actions with the greatest impact on system improvement.
Findings from this study confirm earlier research that leadership actions in a systemic
organization must be succinct and known to other individuals within the system.
Continuous improvement structures to promote system improvement are integral
to legislative accountability and more importantly to the growing needs of students.
Although costly and time-consuming, programs to increase employee capacity to lead
system improvement are worthwhile. School districts and school boards should invest in
growing this capacity and equipping system leaders with a tool to assure daily actions of
leaders are congruent with system improvement plans.
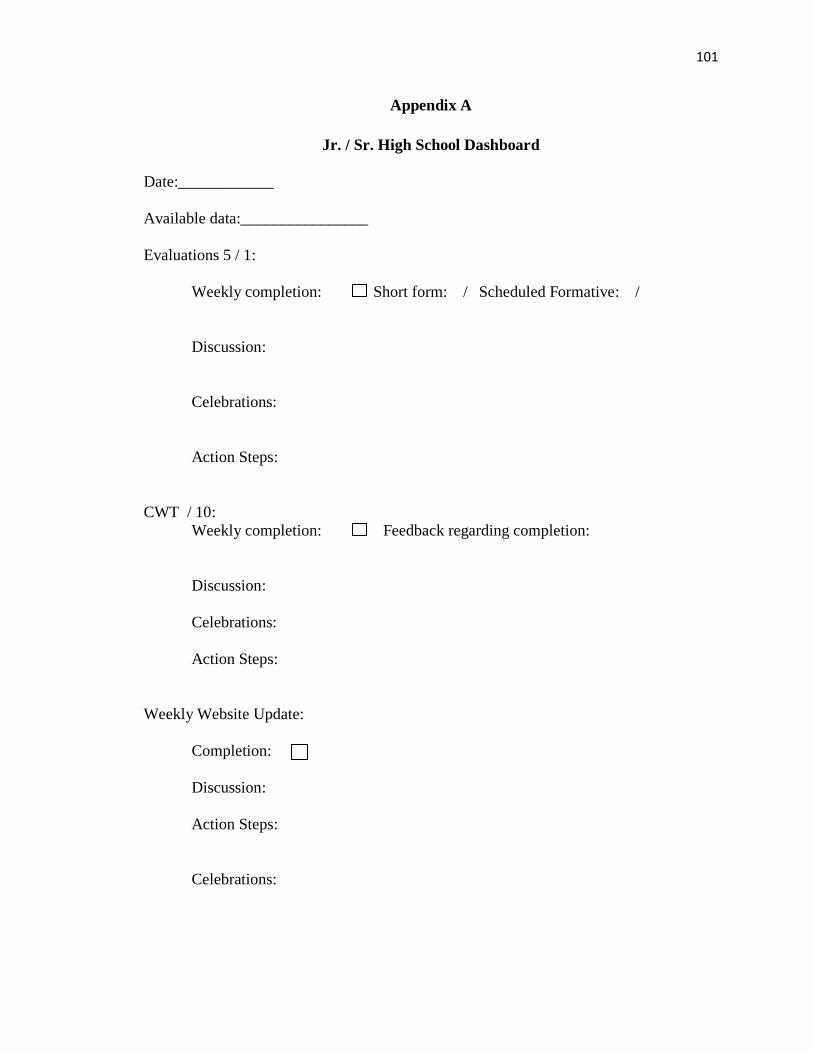
101
Appendix A
Jr. / Sr. High School Dashboard
Date:____________
Available data:________________
Evaluations 5 / 1:
Weekly completion: Short form: / Scheduled Formative: /
Discussion:
Celebrations:
Action Steps:
CWT / 10:
Weekly completion: Feedback regarding completion:
Discussion:
Celebrations:
Action Steps:
Weekly Website Update:
Completion:
Discussion:
Action Steps:
Celebrations:
102
Appendix B
Institutional Review Board Approval
103
Appendix C
Request for Approval to Conduct Research
104
105
106
Appendix D
School Board Approval Letter
107
Appendix E
Letter of Participation
September, 2016
Dear System Leader,
My name is Chance Wistrom, and I am requesting your participation in my doctoral
dissertation research project at Lindenwood University. If selected, participants will be
asked to participate in a 20-minute interview conducted by an independent proctor. I
believe the information gathered through this study will positively contribute to the body
of knowledge by identifying best practices for school leaders to assist in the successful
implementation of continuous improvement practices.
The purpose of the study is to examine school leader perceptions of the impact of
personal leadership dashboards on their efficacy to promote systemic improvement of the
systems under their leadership.
Your participation in this research study is voluntary, and you may withdraw at any time.
Anonymity will be assured through the service of Connie Moller as independent proctor.
The independent proctor will utilize a random number identifier to select participants,
conduct interviews, translate all audio recordings, and remove any personal identifying
statements before submission to Chance Wistrom.
Please express your willingness to participate by replying to the independent proctor at
the following email address: [email protected]. If you have questions, you can
reach me at 417-366-1883 or at [email protected]. Dr. Brad Hanson,
the dissertation advisor for this research project, may be contacted electronically at
[email protected] or by phone at 417-235-7422.
Please open the enclosed attachment to view the Informed Consent form.
Thank you for your time,
Chance Wistrom
Doctoral Candidate
Lindenwood University
108
Appendix F
Informed Consent
INFORMED CONSENT FOR PARTICIPATION IN RESEARCH ACTIVITIES
“Leadership Dashboards: A Tool to Connect Individual Leadership Behaviors to
Organizational Improvement Processes”
Principal Investigator Chance Wistrom Telephone: 417-366-1883 E-mail: Chance.wistrom@republicschools .org
Participant____________________________Contact info________________________
1. You are invited to participate in a research study conducted by Chance Wistrom
under the guidance of Dr. Brad Hanson. The purpose of this research is to examine
school leader perceptions of personal leadership dashboards and their impact on
leader efficacy.
2. a) Your participation will involve the following:
You will be contacted by an independent proctor to conduct an interview
regarding your perceptions of leadership dashboards. The interview will consist
of approximately nine questions and will last approximately 20 minutes.
b) The amount of time involved in your participation will be approximately 30
minutes.
Approximately eight subjects will be randomly selected to be involved in this
research.
3. There are no anticipated risks associated with this research.
4. There are no direct benefits for you participating in this study. However, your
participation will contribute to the educational leadership community gaining insight
into a leadership tool that allows leaders to maximize the impact of continuous
improvement processes on highly systemic organizations such as school districts.
Personal benefits from your participation will include knowledge about how other
participants utilize leadership dashboards to impact the systems in their charge.
5. Your participation is voluntary, and you may choose not to participate in this research
study or to withdraw your consent at any time. You may choose not to answer any
109
questions you do not want to answer. You will NOT be penalized in any way should
you choose not to participate or to withdraw.
6. We will do everything we can to protect your privacy. As part of this effort, your
identity will not be revealed in any publication or presentation that may result from
this study, and the information collected will remain in the possession of the
investigator in a safe location.
7. If you have any questions or concerns regarding this study, or if any problems arise,
you may call the Investigator, Chance Wistrom, at 417-366-1883, or the Supervising
Faculty, Dr. Brad Hanson, at 417-235-7422 You may also ask questions of or state
concerns regarding your participation to the Lindenwood Institutional Review Board
(IRB) through contacting Dr. Marilyn Abbott, Provost, at [email protected]
or 636-949-4912.
I have read this consent form and have been given the opportunity to ask
questions. I will also be given a copy of this consent form for my records. I
consent to my participation in the research described above.
___________________________________
Participant's Signature Date
______________________________
Participant’s Printed Name
___________________________________
Signature of Principal Investigator Date
___________________________
Investigator Printed Name
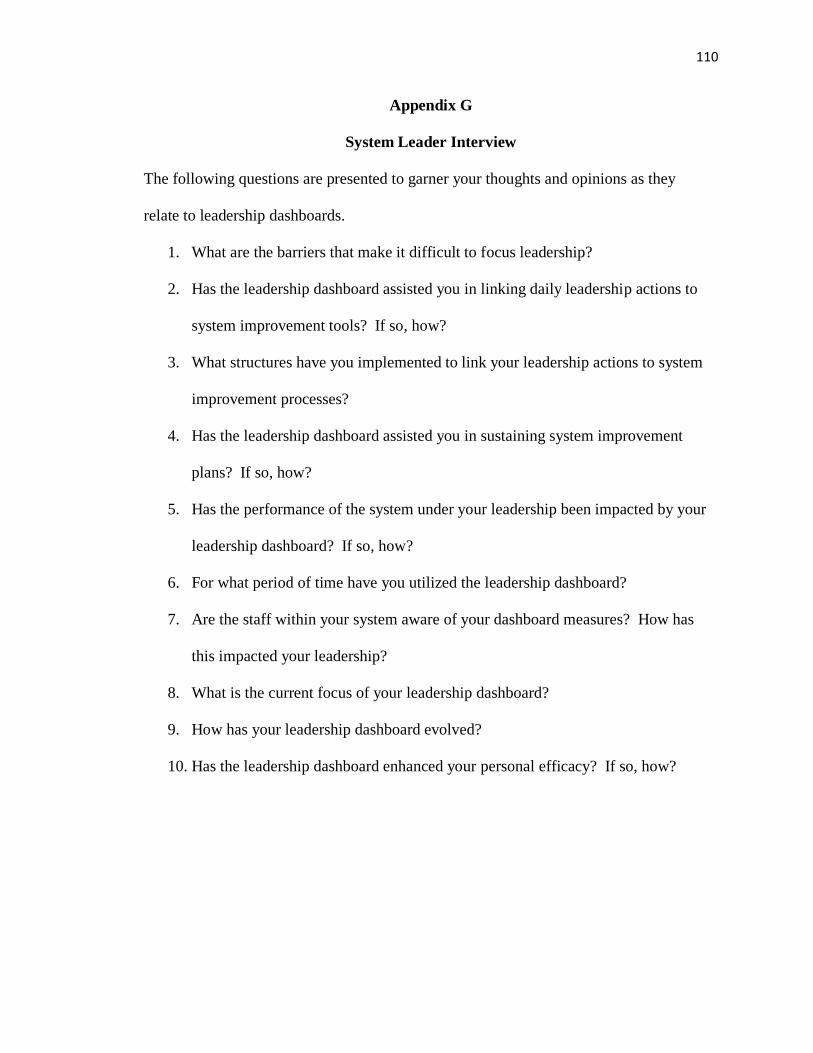
110
Appendix G
System Leader Interview
The following questions are presented to garner your thoughts and opinions as they
relate to leadership dashboards.
1. What are the barriers that make it difficult to focus leadership?
2. Has the leadership dashboard assisted you in linking daily leadership actions to
system improvement tools? If so, how?
3. What structures have you implemented to link your leadership actions to system
improvement processes?
4. Has the leadership dashboard assisted you in sustaining system improvement
plans? If so, how?
5. Has the performance of the system under your leadership been impacted by your
leadership dashboard? If so, how?
6. For what period of time have you utilized the leadership dashboard?
7. Are the staff within your system aware of your dashboard measures? How has
this impacted your leadership?
8. What is the current focus of your leadership dashboard?
9. How has your leadership dashboard evolved?
10. Has the leadership dashboard enhanced your personal efficacy? If so, how?
111
References
American Association of School Administrators. (2016). The big picture view of ESSA.
Retrieved from http://www.aasa.org/content.aspx?id=39890
American Psychological Association. (2010). Publication manual of the American
Psychological Association (6th ed.). Washington, DC: American Psychological
Association.
Arnold, D., & Marchese, T. (2011). Perspectives: The continuous improvement trap.
Change: The Magazine of Higher Learning, 43(2), 16-20.
Baker, R. L. (2016). Perceptions of school administrators regarding the benefits of
teacher induction programs (Doctoral dissertation). Retrieved from ProQuest
Digital Dissertations. (UMI No. 10241944)
Baldrige Performance Excellence Program (BPEP). (2011). 2011-2012 criteria for
performance excellence. Gaithersburg, MD: National Institute of Standards and
Technology.
Baldrige Performance Excellence Program (BPEP). (2013). 2013-2014 education
criteria for performance excellence. Gaithersburg, MD: U.S. Department of
Commerce, National Institute of Standards and Technology. Retrieved from
https://www.nist.gov/baldrige/2013-2014-education-criteria-performance-
excellence
Bernhardt, V. L. (2016). Data, data everywhere (2nd ed.). New York, NY: Routledge.
Best, J., & Dunlap, A. (2014). Continuous improvement in schools and districts: Policy
considerations [White paper]. Denver, CO: McREL International. Retrieved from
http://files.eric.ed.gov/fulltext/ED557599.pdf
112
Bloomberg, L. D., & Volpe, M. (2016). Completing your qualitative dissertation: A
road map from beginning to end (3rd ed.). Thousand Oaks, CA: SAGE.
Branch, G., Hanushek, E., & Rivkin, S. (2013). School leaders matter: Measuring the
impact of effective principals. Education Next, 13(1), 62-69.
Brown, J. V., Smith, V. B., & Steele, C. J. (2013). The continuous improvement model:
A K-12 literacy focus (Doctoral dissertation). Retrieved from ProQuest Digital
Dissertations. (UMI No. 3602327)
Bryk, A., Gomez, L., Grunow, A., & LeMahieu, P. (2015). Learning to improve: How
America’s schools can get better at getting better. Cambridge, MA: Harvard
Education Press.
Burnett, D. (2016). ESSA poses capacity challenges for state education agencies.
Education Week, 35(18), 22-23.
Coleman, M. A., Brooks, T. E., & Ewart, D. (2013). Building critical mass by creating
continuous improvement momentum. The Journal for Quality and Participation,
36(2), 17-22.
Conti, S. D., Ellsasser, C. W., & Griffin, G. A. (2000). School restructuring: A literature
review (RD97124001). New York, NY: Columbia University, Teachers College.
Creswell, J. W. (2014). Research design: Qualitiative, quantitative, and mixed methods
approaches (4th ed.). Thousand Oaks, CA: Sage Publications.
Daggett, B. (2014, June). Addressing current and future challenges in education: Lessons
learned from the nation’s most rapidly improving and transformative schools.
Paper presented at the 22nd Annual Model Schools Conference, International
Center for Leadership in Education, Orlando, FL.
113
Dawson, M. J. (2015). A phenomenological study of national distinguished
elementary and middle school principals from the Class of 2010 (Doctoral
dissertation, University of Arkansas).
Donohoo, J. (2017). Collective efficacy: How educators’ beliefs impact student
learning (1st ed.). Thousand Oaks, CA: SAGE Publications.
Eaton, J. (2012). An overview of U.S. accreditation. Washington, DC: Council for
Higher Education Accreditation. Retrieved from
http://www.chea.org/pdf/Overview%20of%20US%20Accreditation%202012.pdf
Eck, J. H., Bellamy, G. T., Schaffer, E., Stringfield, S., & Reynolds, D. (2011). High
reliability organizations in education: Noteworthy perspectives. Denver, CO:
McREL. Retrieved from http://http://files.eric.ed.gov/fulltext/ED544261.pdf
Elgart, M. A. (2016). Creating state accountability systems that help schools improve.
Kappan, 98(1), 26-30.
Erpenbach, W. J. (2014). A study of states’ requests for waivers from requirements of the
No Child Left Behind Act of 2001: New developments in 2013-14. Washington,
DC: Council of Chief State School Officers. Retrieved from
www.ccsso.org/Docuents/2014/ASR_SCASS_ESEA%20Flex%20Addendum.pdf
The Every Student Succeeds Act: Explained. (2015). Education Week, 35(14), 17.
Federici, R. A., & Skaalvik, E. M. (2012). Principal self-efficacy: Relations with burnout,
job satisfaction and motivation to quit. Social Psychology of Education: An
International Journal, 15(3), 295-320.
Flumerfelt, S., & Green, G. (2013). Using Lean in the flipped classroom for at risk
114
students. Education Technology & Society, 16(1), 356-366. Retrieved from
http://www.ifets.info/journals/16_1/31.pdf
Frabutt, J. M., & Holter, A. C. (2012). Mission driven and data informed leadership.
Catholic Education: A Journal of Inquiry & Practice, 15(2), 253-269.
Fraenkel, J., Wallen, N., & Hyun, H. (2014). How to design and evaluate research in
education (9th ed.). New York, NY: McGraw Hill Education.
Frickx, G. (2015). The academic quality improvement program journey: The impact of
continuous improvement practices on effectiveness measures (Doctoral
dissertation). Retrieved from ProQuest Digital Dissertations. (UMI No.
10035900)
Fullan, F., & Quinn, J. (2016). Coherence: The right drivers in action for schools,
districts, and systems. Thousand Oaks, CA: Corwin.
Gawande, A. (2012, March). How do we heal medicine? [TED talk]. Retrieved from
https://www.ted.com/talks/atul_gawande_how_we_heal_medicine
Ginsberg, R., & Multon, K. (2011). Leading through a fiscal nightmare: The impact on
principals and superintendents. Kappan, 92(8), 42-47.
Goodwin, B. (2011). Simply better. Denver, CO: Mid-Continent Research for
Education and Learning.
Guest, G., MacQueen, K., & Namey, E. E. (2012). Applied thematic analysis. Thousand
Oaks, CA: Sage Publications.
Hargreaves, A., & Braun, H. (2013). Data-driven improvement and accountability.
Boulder, CO: National Education Policy Center. Retrieved from
http://nepc.colorado.edu/publication/data-driven-improvement-accountability/
115
Hess, F., & Mehta, J. (2013). Special topic / data: No deus ex machina. Educational
Leadership, 70(5), 71-75.
Huetteman, E., & Rich, M. (2015, December 3). House restores local education control
in revising No Child Left Behind. The New York Times, p. A25.
Ibach, K. L. (2014). Twenty-one leadership responsibilities and quality management in
the context of educational Baldrige systems (Doctoral dissertation). Retrieved
from ProQuest Digital Dissertations. (UMI No. 3674471)
Jensen, B. (2013). Education and innovation theme: The five critical steps for turnaround
schools. Carlton, Victoria: Grattan Institute. Retrieved from
https://grattan.edu.au/wp-content/uploads/2014/05/904_jensen_alliance_21.pdf
Kirkpatrick, J., & Kirkpatrick, W. (2014). The Kirkpatrick four levels: A fresh look after
55 years 1959-2014 [White paper]. Newnan, GA: Kirkpatrick Partners. Retrieved
from http://www.kirkpatrickpartners.com/Portals/0/Resources/
White%20Papers/Kirkpatrick%20White%20Paper%20-%20May%202014.pdf
Lillis, D. (2012). Systematically evaluating the effectiveness of quality assurance
programmes in leading to improvements in institutional performance. Quality in
Higher Education, 18(1), 50-73. doi:10.1080/13538322.2012.663549
Lunenburg, F. C., & Ornstein, A. C. (2012). Educational administration: Concepts and
practices (6th ed.). Belmont, CA: Wadsworth Cengage Learning.
Mandinach, E. B. (2012). A perfect time for data use: Using data-driven decision making
to inform practice. Educational Psychologist, 47(2), 71-85.
doi:10.1080/00461520.2012.66667064
Mandinach, E. B., & Gummer, E. (2013). A systemic view of implementing data literacy
116
in educator preparation. Educational Researcher, 42(1), 30-37.
doi:10.3102/0013189X12459803
Maxwell, J. A. (2013). Qualitative research design: An interactive approach (3rd ed.).
Thousand Oaks, CA: Sage.
McChesney, C., Covey, S., & Huling, J. (2012). The four disciplines of execution. New
York, NY: Free Press.
McCray, M. (2014). Data driven decision-making and principals’ perceptions (Doctoral
dissertation). Retrieved from ProQuest Digital Dissertations. (UMI No. 3665490)
Missouri Association of School Administrators. (2015, December 9). MASA applauds
passage of Every Student Succeeds Act. MASA Online. Retrieved from
http://www.masaonline.org/vnews/display.v/ART/5669d1611c8b1
Monat, J. P., & Gannon T. F. (2015). What is systems thinking? A review of selected
literature plus recommendations. American Journal of Systems Science, 4(1), 11-
26. doi:10.5923/j.afss.20150401.02
Morrison-Danner, D. A. (2014). Principal leadership strategies: Reforming literacy
instruction through data-driven decision-making (Doctoral dissertation).
Retrieved from ProQuest Digital Dissertations. (UMI No. 3629584)
Mrachko, J. C. (2015). Developing system-level capacity to support local instructional
reform: The case of one large-scale school improvement initiative (Doctoral
dissertation). Retrieved from
https://deepblue.lib.umich.edu/bitstream/handle/2027.42/116661/jmrachko_1.pdf?
sequence=1&isAllowed=y
National Institute of Standards and Technology (NIST). (2015). Baldrige Award
117
recipient information. Retrieved from
http://patapsco.nist.gov/Award_Recipients/index.cfm
Nolan, T. (2012, September). Revisiting teacher evaluation. Proceedings of the
Assessing-Teaching Improving-Learning Forum, USA. Retrieved from
https://vimeo.com/54812046
North Carolina Department of Public Instruction. (2013). Data literacy. Raleigh, NC:
Author. Retrieved from
http://www.ncpublicschools.org/docs/homebase/resources/data/data-guide.pdf
O’Day, J. A., & Smith, M. S. (2016). Quality and equality in American education:
Systemic problems, systemic solutions. In H. Braun & I. Kirsch (Eds.), The
dynamics of opportunity in America (pp. 297-358). New York, NY: Springer.
Park, S., Hironaka, S., Carver, P., & Nordstrum, L. (2013). Continuous improvement in
education [White paper]. Stanford, CA: Carnegie Foundation for the
Advancement of Teaching. Retrieved from
http://archive.carnegiefoundation.org/pdfs/elibrary/carnegie-
foundation_continuous-improvement_2013.05.pdf
Rosenberg, S. (2015). Organizing for quality in education: Individual and systemic
approaches to teacher quality (Doctoral dissertation, University of Michigan).
Retrieved from
https://deepblue.lib.umich.edu/bitstream/handle/2027.42/96158/srberg_1.pdf?seq
uence=1&isAllowed=y
Rothman, R. (2015). What data dashboards can do. Educational Leadership, 73(3), 28.
Schumpelt, G. (2011). Baldrige system reform in New Mexico: A grounded theory
118
study of elementary school principals’ implementation of the Strengthening
Quality in Schools (SQS) initiative (Doctoral dissertation). Retrieved from
ProQuest Digital Dissertations. (UMI No. 3465579)
Shulman, P., & Hulnick, J. (2016). Every Student Succeeds Act (ESSA): Overview and
implications for New Jersey. Trenton, NJ: New Jersey Department of Education.
Retrieved from www.nj.gov/education/archive/ESSA/Overview.pdf
Stack, J. (2013). The great game of business, expanded and updated: The only sensible
way to run a company (2nd ed.). New York, NY: Random House Inc.
University Research Company, LLC. (2017). Quality improvement. Retrieved from
http://www.urc-chs.com/quality_improvement
U.S. Department of Education. (2011). U.S. Department of Education strategic plan for
fiscal years 2011-2014. Washington, DC: Author. Retrieved from
https://www2.ed.gov/about/reports/strat/plan2011-14/plan-2011.pdf
The Wallace Foundation. (2013). The school principal as leader: Guiding schools to
better teaching and learning. New York, NY: The Wallace Foundation.
Retrieved from http://www.wallace foundation.org/knowledge-center/school-
leadership/effective principal-leadership/Documents/The-School-Principal-as-
Leader-as-Leader-Guiding-Schools-to-Better-Teaching-and-Learning-2nd-Ed.pdf
Wayman, J. C., Cho, V., Jimerson, J. B., & Snodgrass Rangel, V. W. (2010, May). The
data-informed district: A systemic approach to educational data use. Paper
presented at the 2010 Annual Meeting of the American Educational Research
Association, Denver, CO.
Wayman, J. C., Spring, S., Lemke, M., & Lehr, M. A. (2012). Using data to inform
119
practice: Effective principal leadership strategies. Paper presented at the 2012
Annual Meeting of the American Education Research Association, Vancouver,
British Columbia, Canada. Retrieved from http://www.waymandatause.com/wp-
content/uploads/2013/11/Wayman-Spring-Lemke-Lehr-Principal-Data-Use-
Strategies.pdf
Weick, K., & Sutcliffe, K. (2015). Managing the unexpected: Sustained performance in
a complex world (3rd ed.). Hoboken, NJ: Wiley & Sons.
Westover, J. (2014). Leading systems change to build district capacity. Leadership,
44(1), 24-27. Retrieved from https://www.joomag.com/magazine/leadership-
magazine-sept-oct-2014-v-44-no-1/0669679001408642017?page=24
The White House Office of the Press Secretary. (2015, December 2). Fact sheet:
Congress acts to fix No Child Left Behind [Press release]. Retrieved from
https://www.whitehouse.gov/the-press-office/2015/12/03/fact-sheet-congress-
acts-fix-no-child-left-behind
Wilka, M., & Cohen, J. (2013). It’s not just about the model: Blended learning,
innovation, and year 2 at Summit Public Schools. San Francisco, CA: FSG.
Retrieved from http://nextgenlearning.org/sites/default/files/supportingdocs
/Blended_Learning_Innovation.pdf
Zeeck, K. A. (2012). A phenomenological study of the lived experiences of elementary
principals involved in dual-career relationships with children (Doctoral
dissertation). Retrieved from
http://ir.stthomas.edu/cgi/viewcontent.cgi?article=1019&context=caps_ed_lead_d
ocdiss
120
Vita
Chance Wistrom graduated from Webb City High School in 1989. After high
school, Chance attended Central Missouri University in Warrensburg, Missouri. At
Central Missouri University, Chance was a four-year letterman in football and graduated
with his Bachelor’s Degree in Industrial Hygiene. Chance returned to Central Missouri
University and completed his Bachelor’s Degree in Science Education. In August 1995,
Chance earned his first teaching job with Carthage School District in Carthage, Missouri,
as a high school science teacher, football coach, and track coach. In 1998, Chance
completed his Master’s Degree in Educational Administration from Missouri State
University. He served as a teacher and coach in the Carthage, Joplin, and Seneca School
Districts.
In 2001, Chance was selected to be the athletic director, assistant principal, and
head football coach of Seneca High School in Seneca, Missouri. Chance served as
principal at Nevada High School in Nevada, Missouri, and at Parkview High School in
Springfield, Missouri. In 2010, Chance left building-level school administration to serve
as Superintendent of the Miller School District in Miller, Missouri, for a period of two
years. In 2012, Chance accepted the position of Superintendent of the Republic School
District, where he continues to serve the Republic community.