Embed Size (px)
Citation preview

Perceptions and experienceof antisocial behaviour:findings from the 2003/2004British Crime Survey
Home Office Online Report 49/04
The views expressed in this report are those of the authors, not necessarily those of the Home Office (nor do theyreflect Government policy).
Martin Wood

Perceptions and experience of antisocial behaviour: findings from the 2003/2004 British Crime Survey
Martin Wood

2
Acknowledgements The author would like to thank colleagues at the Home Office for their help in the preparation of this report: Jonathan Allen, Hannah Roy, Katharine Thorpe, Anna Upson and Alison Walker.
Thanks too for the constructive comments of the (anonymous) peer reviewers and colleagues in the Home Office.
Many thanks to Keith Bolling, Catherine Grant, Alex Thornton and the rest of the team at BMRB Social Research responsible for the running of and interviewing for the British Crime Survey.
Finally, thanks to the participants in the interviews.
3
Contents
1 Executive summary .......................................................................................................................6
2 Introduction.....................................................................................................................................8
Defining and measuring antisocial behaviour ..............................................................8
Understanding the BCS perceptions of antisocial behaviour ....................................8
The structure of this report ..............................................................................................9
3 Extent of problems ..................................................................................................................... 10
BCS measures of problems ......................................................................................... 10
The extent of problems ................................................................................................. 11
Trends.............................................................................................................................. 11
The ‘biggest problem’ .................................................................................................... 12
Chapter summary .......................................................................................................... 13
4 Patterns and risk factors............................................................................................................ 14
Associations with area and personal characteristics ............................................... 14
Underlying predictors of perceived high antisocial behaviour ................................ 16
Chapter summary .......................................................................................................... 18
5 Perceptions and experience ..................................................................................................... 20
Stated source of perceptions ....................................................................................... 20
Experience of antisocial behaviour in previous year ................................................ 21
Reporting incidents ........................................................................................................ 23
Chapter summary .......................................................................................................... 23
6 The nature of antisocial behaviour incidents.......................................................................... 25
Types of problematic behaviour .................................................................................. 25
Variation in types of behaviour by type of area......................................................... 26
Frequency of incidents .................................................................................................. 27
4
Location of incidents ...................................................................................................... 28
Timing of incidents......................................................................................................... 28
Problems in town centres and on public transport ................................................... 29
Chapter summary .......................................................................................................... 29
7 ‘Offenders’ and their relationship to ‘victims’.......................................................................... 30
Profile of offenders......................................................................................................... 30
Personal relationship ..................................................................................................... 31
Social group relationship .............................................................................................. 32
Chapter summary .......................................................................................................... 33
8 Impact of antisocial behaviour.................................................................................................. 34
Personal impact.............................................................................................................. 34
Variation by area and social group – young people hanging around .................... 35
The effect of frequency and emotional impact on quality of life ............................. 36
Underlying factors for impact on quality of life and perceptions ............................. 37
Wider impact................................................................................................................... 37
Chapter summary .......................................................................................................... 38
References................................................................................................................................................... 40
Appendix A: Tables .................................................................................................................................... 41
Conventions .................................................................................................................... 41
Appendix B: Multivariate analysis ............................................................................................................ 42
Appendix C: The British Crime Survey.................................................................................................... 45

5
List of figures Figure 3.1 BCS problem behaviour strands within the ASB typology ............................................... 10
Figure 3.2 Proportion perceiving very or fairly big problems in their local area............................... 11
Figure 3.3 Proportion perceiving very or fairly big problems, 1992 to 2003/04 BCS (all behaviours measured by the BCS since 1992) ...................................................................................... 12
Classifying the local area: the 2001 Census and the ACORN geodemographic tool...................... 14
High perceived ASB: a combined measure............................................................................................ 15
Figure 4.1 Areas and groups at high risk of perceiving high ASB ..................................................... 16
Figure 4.2 Predictors of high perceived ASB found in multivariate analysis .................................... 17
Figure 5.1 Stated sources of perceptions of problems with types of ASB........................................ 20
BCS questions on the experience of types of ASB ............................................................................... 21
Figure 5.2 Proportion with high frequency of experience of young people hanging around by type of area (of those perceiving problems)................................................................................ 22
Figure 6.1 Frequency of experience of types of ASB among those perceiving problems ............. 28
Figure 7.1 Relationship between offender and victim in incidents of drunk or rowdy behaviour by type of area.............................................................................................................................. 32
Figure 8.1 Percentage of those perceiving problems who experience high impact on quality of life – by frequency of experience................................................................................................ 36
Figure B.1 Logistic regression model for high perceived ASB............................................................ 43
6
1 Executive summary • Tackling antisocial behaviour (ASB) continues to be a major focus for government policy, and
is now a part of the Home Office’s Public Service Agreement. British Crime Survey (BCS) measures have shown it to be an area of concern for a relatively large proportion of the population of England and Wales.
• A new set of questions was included in the 2003/04 British Crime Survey that aimed to explore what people based their perceptions of problems on, the nature of experiences that informed perceptions, and the impacts for individuals and communities.
Extent of problems
• Over three-quarters (76%) perceived one or more of 16 types of behaviour to be a problem. Over a third (36%) said one or more was a ‘very big’ problem.
• Speeding traffic was the most commonly mentioned problem behaviour (43% of the population), but a range of other behaviours including illegal parking, rubbish, uncontrolled fireworks, vandalism or graffiti, teenagers hanging around and drug use or dealing were each regarded as problems by over a quarter of the population.
• For those measures of problems where trends are available, there have been significant recent falls in the level of problems perceived. This follows gradual increases over the last decade.
• In the majority of cases, problems were not complained about or reported to anyone (80% of those experiencing drunk or rowdy behaviour did not report any incidents to anyone in a 12-month period). This has clear implications for agencies wishing to understand the extent of problems and how to tackle them.
Underlying drivers of high perceived antisocial behaviour
• There was considerable variation between geographical areas and between social groups in the levels and type of ASB perceived. Multivariate analysis found the type of area where people lived to be the strongest underlying predictor of perceptions of high levels of ASB. Those living in hard-pressed areas had odds of perceiving high levels that were four times higher than those in wealthy achiever areas.
• Area characteristics were the strongest predictors of perceptions of high levels of ASB, but victims of crime and young people were also more likely to be in this category.
• These findings suggest that efforts to tackle ASB should be targeted at particular types of area in the first instance. The evidence also suggests that interventions that aim to build ‘collective efficacy’ (the will and ability of a community to tackle problems itself) would reduce the extent to which ASB is perceived.

7
The nature of experiences of antisocial behaviour
• For a high proportion, people’s perceptions that there were problems with ASB in their local area were based on their personal experience of them.
• There was considerable variation in the type of incident experienced within broad categories such as ‘young people hanging around’. Many incidents by themselves may not be considered serious. A proportion of individual incidents were serious, however, and some were deliberately directed at individuals (these incidents, such as intimidation and drug dealing, were more likely to occur in urban areas).
• Incidents of ASB were found to be much more frequently experienced than crime, with over half of those perceiving problems with young people experiencing this ‘more or less every day’ or ‘all the time’. The impact even of low-level incidents may be high where the frequency of experience is high.
• Offenders were generally young people of both sexes (and young people were more likely to perceive and experience problems). There was a feeling among respondents that the same offenders were responsible for a range of ASB, suggesting that targeting of particular offenders may have an impact on several problem areas.
• Incidents mostly involved strangers, although offenders were largely thought to be from the local area. In hard-pressed areas, where perceived problems were at their highest, there was more likely to be a personal relationship between the parties. At the same time, there was some evidence that cultural gaps, particularly in relation to different age groups, may increase the perception that behaviour is antisocial. Interventions will need to take account of the negative effects of close proximity to offenders while also seeking to improve relationships within communities.
Impacts
• Although emotional responses to ASB were not as frequently acute as in the case of criminal victimisation, serious emotional impact was evident. The wider experience of ASB compared with crime and the higher frequency of experience mean that emotional impact is to be taken seriously.
• Impact on behaviour, including the use of public space, was widespread even for people who had not personally experienced problems. The effect on long term quality of life was important, with six per cent of the national population reporting a high impact on their quality of life as a result of young people hanging around, and a further 11 per cent reporting a medium impact. The total proportion that experiences a high impact as a result of any type of ASB will clearly be higher.
• There was variation in the pattern of this high impact on quality of life. At particular risk were those living in areas that they felt had low collective efficacy, and those in hard-pressed and inner city areas. A high frequency of experience was the strongest predictor of high impact on quality of life.
• Looking at the wider effects of ASB, its ‘signal’ quality meant it was particularly strongly related to fear of violence and fear of property crime, and also to the basic extent to which people enjoyed living in a particular area.

8
2 Introduction Tackling antisocial behaviour (ASB) has been the focus of considerable attention for government policy and front-line practitioners over recent years. The British Crime Survey (BCS) shows that it is widely regarded as a problem by the general public, and the level of attention that it has received is set to continue with ASB now a central part of the Home Office’s Public Service Agreement (PSA)1 to 2007/08.
Defining and measuring antisocial behaviour
A difficulty for both measuring ASB and setting out the approach to tackling it has been in settling on a definition. Essentially, the issues surround the central nature of ASB: that acts such as creating noise become antisocial in specific social contexts and will depend (at least to a degree) on the norms of a local area and the values of individuals. A useful summary of the issues is provided in Whitehead et al., (2003), and also in Harradine et al., (2004).
Most definitions focus on listing specific types of behaviour that have a ‘day to day’ quality and that are widely regarded as ‘unreasonable’ or ‘inappropriate’. These tend to be contrasted with criminal acts, although low-level crime is included within definitions, particularly where public space is affected.
Moving beyond contested definitions of ASB, there are decisions to be made around how best to measure it (again, Whitehead et al., (2003) is useful here). Its subjective and context-specific nature mean that counting ‘incidents’ is problematic (unlike for crime where clear legal definitions are available). In addition, the way in which particular types of behaviour affect people, for instance the sight of graffiti or vandalism, means a single incident may have some effect on many people. A count of a single incident may be inappropriate for understanding the impact of ASB in this case.
For these reasons, since 1992 the British Crime Survey has asked respondents about ‘problems’ with particular types of behaviour in their local area. The behaviours included could not be claimed to be a full list of the types that might be considered antisocial, nor are they presented as things that will always be regarded as problems for individuals when they occur. However, the relatively high proportion of people who report problems to the BCS (up to a third of the population for some behaviours) suggests they do tap into something that is of widespread concern.
Understanding the BCS perceptions of antisocial behaviour For the 2003/04 BCS, a new module was added to the questionnaire that addressed some of the questions that had been raised by the measures of perceptions of problems. Principally, the issue was the extent to which perceptions were based on actual experiences rather than attitudes developed from sources such as media or other secondary sources. It was also an opportunity to describe in detail the nature and impacts of problems where they occur.
1 For more information on the Public Service Agreements see the HM Treasury site: http://www.hm-treasury.gov.uk/

9
The structure of this report Chapter 3 looks in detail at these measures of perceptions. It considers the high prevalence of perceptions of problems with ASB and changes in these over time. It also considers what people feel to be the most acute problems in their local areas.
Chapter 4 looks at the variation in levels and types of perceived problems between communities and between social groups. It shows how deprived and urban areas are particularly likely to perceive problems, in line with what we might intuitively expect, and draws out other underlying factors that drive these perceptions. Collective efficacy in communities is mentioned as a possible inhibitor of ASB.
The high proportion of people who experience problems, and the high frequency of this experience among those who perceive problems, is the subject of Chapter 5. The aim in this and subsequent chapters is to provide a better understanding of the perception measures that form the government’s PSA target on ASB, and as such the analysis focuses on that group that does perceive problems.
The nature of incidents that are regarded as problems is explored in Chapter 6. The specific events that occur within broad categories such as ‘teenagers hanging around’ are varied in nature and seriousness both within and between areas. There is further detail in this chapter of just what an incident of ASB entails in terms of the frequency of occurrence, location and timing.
In Chapter 7 the focus is the nature of the relationship between those perceiving an act to be antisocial and those committing the act. In a high proportion of cases, those involved are strangers. However, in those areas where perceived ASB is highest there is also a higher chance that people are known to one another.
Finally, Chapter 8 looks at the personal and community impacts related to perceptions of ASB, and how the nature of actual incidents relates to this. While serious impact as a result of ASB is not as widespread as it is among victims of crime, it is still apparent, and some degree of direct and indirect impact is seen across a large group of people.

10
3 Extent of problems
BCS measures of problems
The British Crime Survey in 2003/04 asked respondents whether there were problems in their local area with 16 types of behaviour that could be considered antisocial. This list reflected behaviours that were the focus for research, policy and practitioners, and also picked up those found in BCS questionnaire piloting and open-ended responses. While it could not hope to be a complete list of the behaviours that people perceive to be antisocial, it covered most of the central issues of concern.
The ASB typology developed in Harradine et al., (2004), is useful as an initial categorisation of the qualities of these behaviours (Figure 3.1). The behaviours listed are necessarily broad, and the specific nature of them will mean they move between the different categories2. For instance, in some cases of young people hanging around in the street, they may not realise that their presence is a problem for other local people, but in other instances there may be deliberate intimidation of individuals.
The extent to which problems are inadvertent, the result of neglectful or self-interested behaviour, or the result of deliberate and directed action is another dimension to these problems and an important element when considering how problems might be tackled. Later chapters will draw out the detail of the nature of some of these behaviours, how they are experienced and the impacts they have.
Figure 3.1 BCS problem behaviour strands within the ASB typology
Misuse of public space Disregard for community/ personal wellbeing
Acts directed at people Environmental damage
Cars parked inconveniently or illegally
Speeding traffic Teenagers hanging around (intimidation)
Rubbish or litter
Teenagers hanging around (general problem)
Fireworks (not part of an organised display)
People being insulted, pestered or intimidated
Vandalism and graffiti
Drug use or dealing (general problem)
Teenagers hanging around (noisy/ rowdy behaviour)
Racial attacks Teenagers (litter, graffiti)
People sleeping rough Uncontrolled dogs or dog mess
Disputes between neighbours
Abandoned cars
Drunk or rowdy behaviour
Noisy neighbours
Airguns
Source: based on the RDS typology of ASB in Harradine et al., (2004)
2 Some behaviours are in different categories to the original typology due to the specific types of incident mentioned by BCS respondents.

11
The extent of problems A large proportion of the population of England and Wales perceived problems in their area with some form of ASB. Over three-quarters (76%) perceived one or more of the 16 types of behaviour to be a problem. Over a third (36%) said one or more was a ‘very big’ problem.
The most widely perceived individual problem was with speeding traffic (Figure 3.2 and Table A3.1). Forty-three per cent of the population regarded this as a ‘very’ or ‘fairly big’ problem in their local area (12% regarded it as a ‘very big’ problem). Between a quarter and a third of the population regarded parked cars, rubbish, fireworks, vandalism, teenagers hanging around, drug use or dealing and uncontrolled dogs or dog mess to be problems (between 6% and 10% regarded these as ‘very big’ problems).
Figure 3.2 Proportion perceiving very or fairly big problems in their local area
2
3
4
5
6
9
11
14
18
16
19
20
19
20
22
31
1
1
2
2
3
2
4
5
6
9
9
8
10
9
9
12
0 5 10 15 20 25 30 35 40 45 50
People sleeping rough
People with airguns
Disputes between neighbours
Racial attacks
Noisy neighbours
People being insulted, pestered or intimidated
Abandoned cars
People being drunk or rowdy
Uncontrolled dogs and dog mess
Drug use or dealing
Teenagers hanging around
Vandalism and graffiti
Fireworks (not part of an organised display)
Rubbish or litter
Cars parked inconveniently or illegally
Speeding traffic
Percentage perceiving problems
Fairly big problem Very big problem
Behaviour of each of the types described in the typology (Figure 3.1) was described as a problem by significant proportions of respondents indicating that there is not a clear dominant feature to the nature of ASB.
Trends
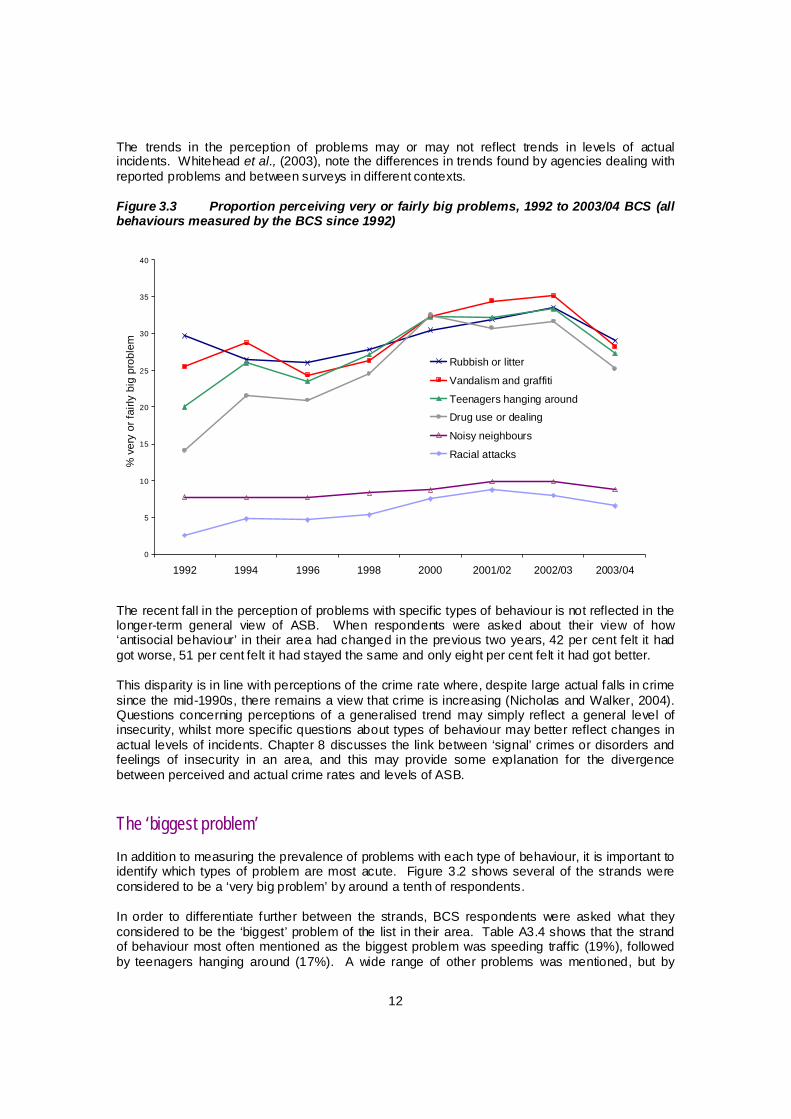
The trend in perceptions of ASB can be traced back to 1992 for the six behaviours asked about since that time. Until the most recent period, the picture has been one of a general increase in the perception of problems across the types of behaviour. Since the peak in 2002/03 there have been sharp and statistically significant falls in all of the strands (Figure 3.3 and Table A3.2).
12
The trends in the perception of problems may or may not reflect trends in levels of actual incidents. Whitehead et al., (2003), note the differences in trends found by agencies dealing with reported problems and between surveys in different contexts.
Figure 3.3 Proportion perceiving very or fairly big problems, 1992 to 2003/04 BCS (all behaviours measured by the BCS since 1992)
0
5
10
15
20
25
30
35
40
1992 1994 1996 1998 2000 2001/02 2002/03 2003/04
% v
ery
or fa
irly
big
prob
lem
Rubbish or litter
Vandalism and graffiti
Teenagers hanging aroundDrug use or dealing
Noisy neighbours
Racial attacks
The recent fall in the perception of problems with specific types of behaviour is not reflected in the longer-term general view of ASB. When respondents were asked about their view of how ‘antisocial behaviour’ in their area had changed in the previous two years, 42 per cent felt it had got worse, 51 per cent felt it had stayed the same and only eight per cent felt it had got better.
This disparity is in line with perceptions of the crime rate where, despite large actual falls in crime since the mid-1990s, there remains a view that crime is increasing (Nicholas and Walker, 2004). Questions concerning perceptions of a generalised trend may simply reflect a general level of insecurity, whilst more specific questions about types of behaviour may better reflect changes in actual levels of incidents. Chapter 8 discusses the link between ‘signal’ crimes or disorders and feelings of insecurity in an area, and this may provide some explanation for the divergence between perceived and actual crime rates and levels of ASB.
The ‘biggest problem’ In addition to measuring the prevalence of problems with each type of behaviour, it is important to identify which types of problem are most acute. Figure 3.2 shows several of the strands were considered to be a ‘very big problem’ by around a tenth of respondents.
In order to differentiate further between the strands, BCS respondents were asked what they considered to be the ‘biggest’ problem of the list in their area. Table A3.4 shows that the strand of behaviour most often mentioned as the biggest problem was speeding traffic (19%), followed by teenagers hanging around (17%). A wide range of other problems was mentioned, but by
13
relatively fewer respondents (drug use or dealing was the third most mentioned problem at 9%). However, while drug use or dealing (to take an example) was mentioned by relatively fewer respondents, it could be the case that for those it does affect, the impact on individuals and communities is relatively more serious. Variation between types of area is taken up in the next chapter, and subsequent chapters draw out the nature and impact of these different types of behaviour.
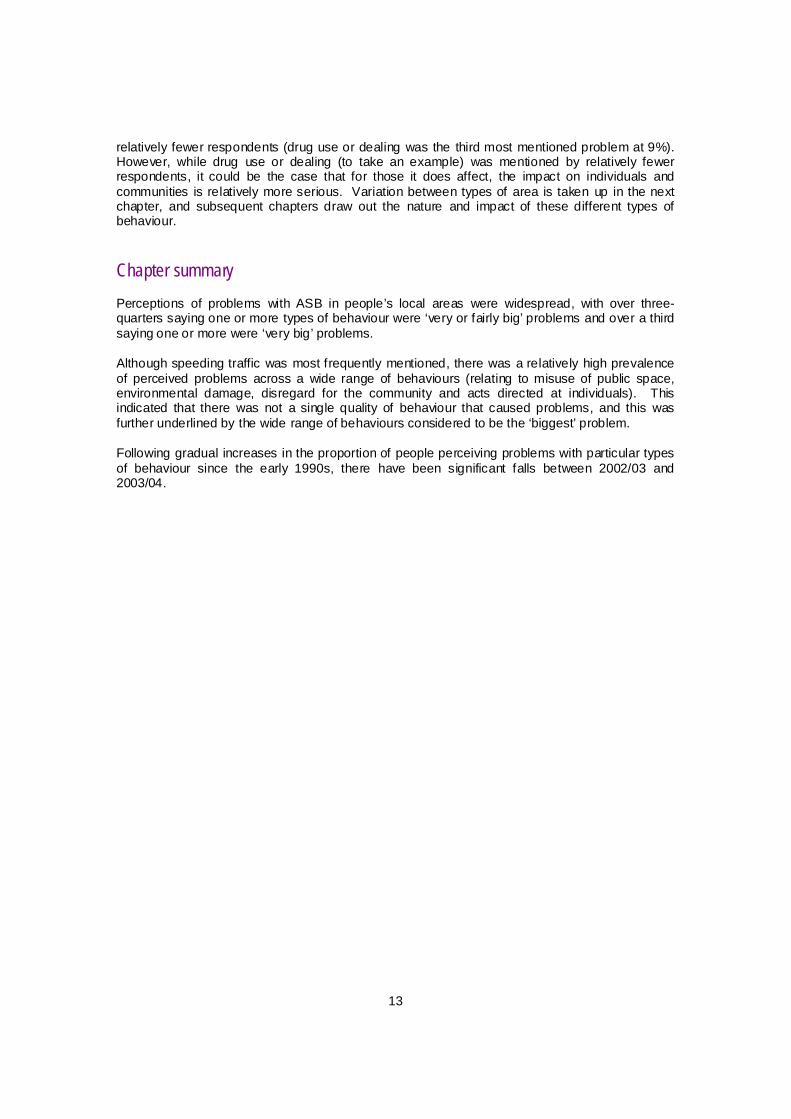
Chapter summary Perceptions of problems with ASB in people’s local areas were widespread, with over three-quarters saying one or more types of behaviour were ‘very or fairly big’ problems and over a third saying one or more were ‘very big’ problems.
Although speeding traffic was most frequently mentioned, there was a relatively high prevalence of perceived problems across a wide range of behaviours (relating to misuse of public space, environmental damage, disregard for the community and acts directed at individuals). This indicated that there was not a single quality of behaviour that caused problems, and this was further underlined by the wide range of behaviours considered to be the ‘biggest’ problem.
Following gradual increases in the proportion of people perceiving problems with particular types of behaviour since the early 1990s, there have been significant falls between 2002/03 and 2003/04.

14
4 Patterns and risk factors The overall levels of ASB discussed in the previous chapter mask considerable variation. The interaction between people’s lifestyles, personal characteristics and the geographical area in which they live have a considerable influence on what they experience and the perceptions they form in relation to ASB.
Associations with area and personal characteristics The variation in the pattern of problems perceived is clear when the different types of area in which people live are considered. A significantly lower proportion of people living in areas characterised by ‘wealthy achievers’ mentioned problems with ASB compared with the national picture (except in relation to speeding traffic). Those in ‘hard-pressed’ areas were much more likely to mention problems (for instance, 41% mentioned problems with drug use or dealing in these areas compared with 13% in wealthy achiever areas) (Table A4.1). Reflecting this pattern, five per cent of those in wealthy achiever areas perceived three or more problems to be a ‘very big’ problem compared with 23 per cent of those in hard-pressed areas (Table A4.2).
This pattern is clear when looking at the behaviour considered the ‘biggest problem’ (Table A4.3). Speeding traffic was the most mentioned biggest problem for those in wealthy achiever areas (29%), but was third on the list for those in hard-pressed areas (11%), after teenagers hanging around (22%) and drug use or dealing (16%).
Classifying the local area: the 2001 Census and the ACORN geodemographic tool
Clearly, a good picture of the neighbourhood context is crucial for an understanding of the nature of ASB and how local residents react to it. Understanding of variation between types of area also provides useful guidance for deploying resources to tackle problems in practice.
Data from the 2001 Census are now available at postcode sector level. The numbers of people in each of these sectors in different age, ethnic and other groups have been converted and attached to the BCS to allow analysis by the type of area in which respondents live. This allows better understanding of the effect, on measures such as perception of ASB, of the interaction of respondents’ personal characteristics with those of people living around them.
Geodemographic tools combine information on households and individuals with their geographical location in order to classify local areas by socioeconomic characteristics. Analysis of the type of area used in this report makes use of ACORN© (A Classification of Residential Neighbourhoods) produced by CACI Ltd using information from the 2001 Census and other data sources. This identifies 56 types of area and these are grouped together into five categories.
• Wealthy achievers (wealthy executives, affluent older people and well-off families).
• Urban prosperity (prosperous professionals, young urban professionals and students living in town and city areas).
• Comfortably off (young couples, secure families, older couples living in the suburbs and pensioners).
• Moderate means (Asian communities, post-industrial families and skilled manual workers).
• Hard-pressed (low-income families, residents in council areas, people living in high-rise, inner city estates).

15
Personal characteristics are also associated with differences in the types of behaviour considered to be the biggest problem (Table A4.4). Perhaps surprisingly, younger age groups were more likely to mention teenagers hanging around as the biggest problem in their local area. This was the case for 22 per cent of those aged from 16 to 24, compared with 13 per cent of those aged from 65 to 74 and eight per cent of those aged 75 and over. A greater proportion of middle and older age groups were concerned with speeding traffic and older groups were more likely to mention rubbish. A third (34%) of those aged over 75 said there were no problems with any of the listed behaviours compared with 12 per cent of those aged from 16 to 24. This perhaps reflects a lower level of exposure to a cross-section of the community for older groups and the lifestyles of younger people that mean they more often encounter situations where there are higher risks of problems. It may also reflect differences in the attitude towards, and treatment of, different age groups by offenders.
High perceived ASB: a combined measure
In order to simplify analysis, a combined measure of seven strands of antisocial behaviour was constructed. Statistical tests (factor analysis and scale reliability tests) showed that these strands behaved in a sufficiently similar way between respondents for a valid and reliable single measure to be produced (indeed, a valid measure could have been constructed that combined all of the types of behaviour considered in the survey).
The resulting measure of high perceived ASB is that used in the Home Office’s Public Service Agreement on ASB. The seven strands were selected on the basis of what was relevant to Home Office policy and what was available for the period required (‘speeding traffic’, for instance, was only introduced into the BCS in 2003/04). The strands used are: teenagers hanging around; drug use or dealing; rubbish and litter; vandalism and graffiti; drunk or rowdy behaviour; abandoned cars; noisy neighbours.
Several factors were associated with high levels of perceived ASB.
Perceived high ASB and area characteristics
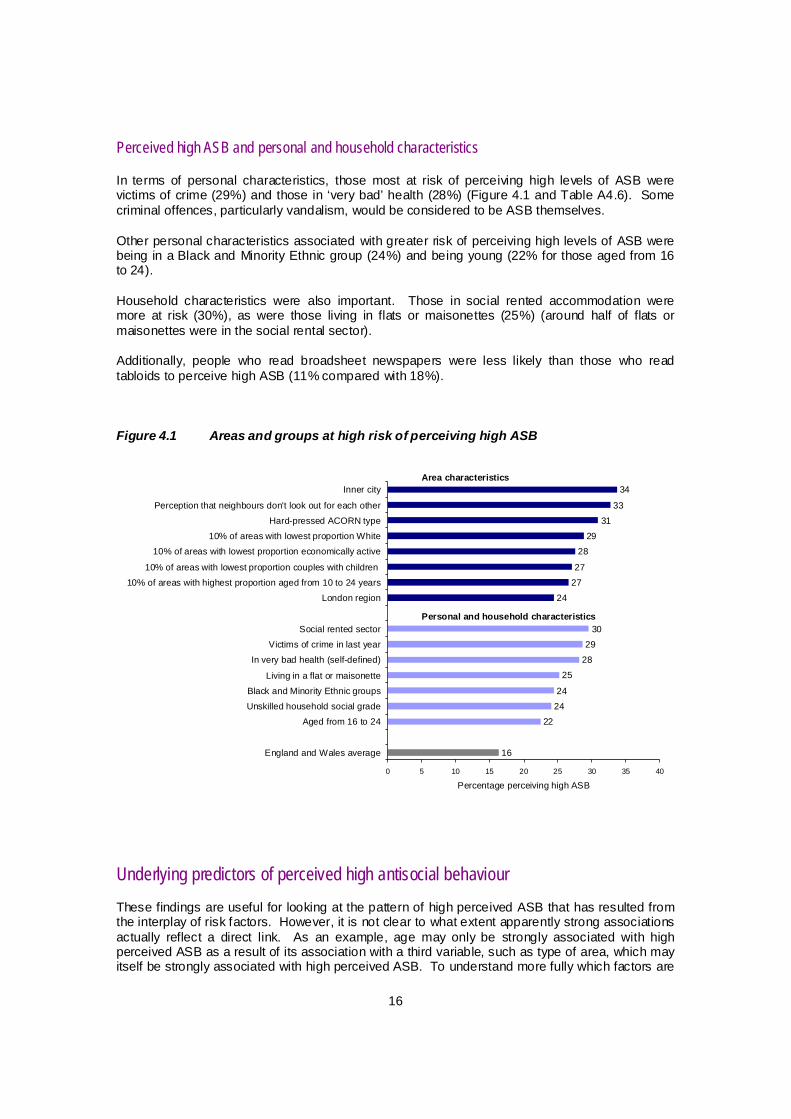
Compared with an average for England and Wales of 16 per cent, those in inner city areas (34%) and hard-pressed ACORN areas (31%) were considerably more at risk of perceiving high levels of ASB. Rural areas (5%) and wealthy achiever areas (5%) were particularly low risk (Figure 4.1 and Table A4.5).
The demographic profile of the area (as defined by Census data) was also important. Higher risk areas included those where there was a relatively high proportion of young people, high ethnic diversity, a low proportion of economically active people and a low proportion of households consisting of couples and children.
Of the regions, those in London were at a relatively higher risk of perceiving high ASB (24%), while those in the east of England (12%) and Wales (12%) were at relatively low risk.
In addition, a third (33%) of those who felt that neighbours did not look out for each other in the area also perceived high levels of ASB compared with eight per cent of those who felt they definitely did.
16
Perceived high ASB and personal and household characteristics
In terms of personal characteristics, those most at risk of perceiving high levels of ASB were victims of crime (29%) and those in ‘very bad’ health (28%) (Figure 4.1 and Table A4.6). Some criminal offences, particularly vandalism, would be considered to be ASB themselves.
Other personal characteristics associated with greater risk of perceiving high levels of ASB were being in a Black and Minority Ethnic group (24%) and being young (22% for those aged from 16 to 24).
Household characteristics were also important. Those in social rented accommodation were more at risk (30%), as were those living in flats or maisonettes (25%) (around half of flats or maisonettes were in the social rental sector).
Additionally, people who read broadsheet newspapers were less likely than those who read tabloids to perceive high ASB (11% compared with 18%).
Figure 4.1 Areas and groups at high risk of perceiving high ASB
16
222424
252829
30
242727
2829
3133
34
0 5 10 15 20 25 30 35 40
England and Wales average
Aged from 16 to 24Unskilled household social gradeBlack and Minority Ethnic groups
Living in a flat or maisonette
In very bad health (self-defined)Victims of crime in last year
Social rented sector
London region10% of areas with highest proportion aged from 10 to 24 years
10% of areas with lowest proportion couples with children
10% of areas with lowest proportion economically active10% of areas with lowest proportion White
Hard-pressed ACORN typePerception that neighbours don't look out for each other
Inner city
Percentage perceiving high ASB
Personal and household characteristics
Area characteristics
Underlying predictors of perceived high antisocial behaviour These findings are useful for looking at the pattern of high perceived ASB that has resulted from the interplay of risk factors. However, it is not clear to what extent apparently strong associations actually reflect a direct link. As an example, age may only be strongly associated with high perceived ASB as a result of its association with a third variable, such as type of area, which may itself be strongly associated with high perceived ASB. To understand more fully which factors are

17
really important (and therefore to be able to direct interventions where they would be most effective), risk factors that are predictive of high perceived ASB independently of other factors need to be identified. Multivariate analysis was carried out with this aim, a summary of which is displayed in Figure 4.2 (see Appendix B for further details). Note that the model summarised here does not include a variable for collective efficacy, discussed later in this chapter.
Figure 4.2 Predictors of high perceived ASB found in multivariate analysis
Strong independent predictors of perceived high ASB Category most susceptible to perceiving high ASB
1. Type of area (ACORN) Hard-pressed
2. Whether respondent a victim of any crime in the last 12 months Victims
3. Proportion of local population in 10 to 24 age group High relative proportion
4. Age group (respondent) Young people
5. Region London and South East
6. Proportion of local population who are economically active Low relative proportion
Notes:
Variables that were statistically significantly related to, but weak predictors of, high perceived ASB: general health, tenure, newspaper readership, gender, proportion of households in area that are couples with children, household income, marital status, proportion of local population who are White, vehicle ownership, social grade.
Variables included in the analysis but not found to be independently statistically significantly related to high perceived ASB: ethnicity of respondent, educational attainment, employment status, frequency of pub visits, number of adults and children in household, type of accommodation.
Area characteristics
The strongest predictor of high perceived ASB included in the analysis, independent of other variables, was the type of area in which people lived. Those in hard-pressed areas had odds of being in the high perceived ASB group that were four times higher than those in wealthy achiever areas.
Three other area-based variables were found to be strong predictors. Firstly, the proportion of the local population made up of young people was important (the higher the proportion, the more likely people in the area were to perceive high levels of ASB). One would expect this to be relevant for understanding problems with teenagers hanging around, but it was actually found to be important for all the individual measures making up the combined measure. Secondly, the region where people lived was important (Londoners and those in the South East were significantly more likely than people in Wales to be in the high perceived ASB group). Thirdly,

18
areas where there was a relatively low proportion of people who were economically active were more likely to be in the high perceived ASB group.
Personal characteristics
The second strongest predictor was that of criminal victimisation. Those who had been the victim of crime in the previous year had odds of being in the high perceived ASB group that were over twice as high as those who had not. It has been seen that some definitions of ASB include criminal acts such as vandalism, but considering the types of behaviour included in the combined measure used here, the effect of crime victimisation is more likely to reflect its ‘signal’ quality (see Chapter 8).
Age also remained a significant independent variable, with those in younger groups considerably more likely to perceive high ASB.
A means of reducing ASB: collective efficacy
The analysis described above avoided the inclusion of attitudinal variables such as fear of crime that, while strongly correlated with antisocial behaviour, would not be expected to cause it (rather one would expect the reverse to be true). The inclusion of variables such as this could lead to results being misleading or difficult to interpret.
This difficulty with interpretation affects a variable of considerable interest for developing policies for tackling ASB, that of ‘collective efficacy’. This was a term coined by Sampson and Raudenbush (1999) following their extensive study of disorder in urban neighbourhoods in Chicago, and refers to the ability and will of a community to deal with local problems. The difficulty when relying on data solely from the BCS is that of establishing the likely causal direction between this kind of measure and perceived ASB (should one theorise that the presence of ASB leads to less collective efficacy or that a lack of collective efficacy leads to ASB or both?).
However, Sampson and Raudenbush’s study concluded that, while it was concentrated deprivation that was most strongly associated with disorder, the informal social control of collective efficacy was a major inhibitor of both crime and disorder.
In the light of this finding, a further piece of analysis was carried out that included a measure relating to whether, in the respondent’s view, neighbours looked out for each other in the local area (a proxy for collective efficacy). The analysis found this variable to be the third strongest in the model (following type of area and criminal victimisation). Those who felt neighbours did not look out for each other were more likely to also be in the perceived high ASB category (the odds were nearly four times higher than for those who definitely thought neighbours looked out for each other).
Chapter summary Multivariate analysis found the type of area where people lived to be the strongest underlying predictor of perceptions of high levels of ASB. Those living in hard-pressed areas had odds of perceiving high levels that were four times higher than those in wealthy achiever areas.
Area characteristics were the strongest predictors of perceptions of high levels of ASB, but victims of crime and young people were also more likely to be in this category.

19
These findings suggest that efforts to tackle ASB should be targeted at particular types of area in the first instance. However, the wide range of behaviours identified as problems and the variation between areas underlines the need for efforts to be guided by a clear understanding of what the specific problems are in the local context.
The evidence also suggests that interventions that aim to build collective efficacy in an area will reduce the extent to which ASB is perceived.

20
5 Perceptions and experience The difficulties associated with counting incidents of ASB (particularly in terms of establishing clear definitions) led to the adoption by the BCS of measures of perceived problems in the local area. The question remains, however, of the extent to which perceptions of problems reflect actual incidents in the community and personal experience (as opposed to being driven, for instance, by media or government treatment, differences in values or interests between groups, or stereotypes). Perceptions can justifiably be considered important in themselves in terms of the impact they have on individuals and communities (see Chapter 8). However, an understanding of the extent to which it is actual ASB that drives these perceptions is needed to establish the nature of problems and how resources should best be deployed to tackle them.
In order to address these issues, five types of ASB that it was felt represented a broad spectrum of behaviours were asked about in interviews: young people hanging around, vandalism and graffiti, drug use or dealing, drunk or rowdy behaviour and noisy neighbours.
Stated source of perceptions
Respondents who said that there were problems in their area with the selected types of behaviour were asked on what they based this impression (Figure 5.1 and Table A5.1).
Figure 5.1 Stated sources of perceptions of problems with types of ASB
96
29
42 1 2 3
0
91
39
20
53 3
13
0
54
41
33
96 4
33
00
10
20
30
40
50
60
70
80
90
100
My ownexperience
Experienceof others
Local media Nationalmedia
Authorities TV dramas Justgenerally
known
Other
Perc
enta
ge
Noisy neighbours Young people hanging around Drug use or dealing
It was clear that for all the types of ASB considered, personal experience was the most common source of perceptions of problems. The level was high for four of the five strands, ranging between 88 per cent and 96 per cent for vandalism, young people hanging around, drunk or rowdy behaviour and noisy neighbours. For the fifth, drug use or dealing, the level was considerably lower at 54 per cent.

21
For the other sources of perceptions, the lowest level of their stated influence was in relation to noisy neighbours and the highest in relation to drug use or dealing. Other people’s experiences (41%) and stories in the local media (33%) were particularly likely to be sources in forming perceptions of problems with drug use or dealing. The high proportion of people who said it was ‘just generally known about’ in the area for this particular strand further suggests that perceptions of problems were based on word of mouth that may or may not reflect actual incidents.
When looking at the breakdown of sources by type of area (the factor most predictive of high perceived ASB), a difference in the proportions using local media is apparent. Taking the vandalism strand as an example, a lower proportion of those in prosperous urban and hard-pressed areas (20% and 22%) referred to local media than in wealthy achiever areas (33%) (Table A5.2). This pattern was repeated for all the strands. The proportion who said their impressions were based on experience was similar between types of area, but the higher levels of local media influence in less urban areas may suggest that experience is relatively less important here.
Experience of antisocial behaviour in previous year
BCS questions on the experience of types of ASB
The BCS asked respondents about a selection of five types of behaviour if they had mentioned them as very or fairly big problems. These were young people hanging around, vandalism and graffiti, drug use or dealing, drunk or rowdy behaviour and noisy neighbours.
Respondents were asked about their personal experience of these types of behaviour in the previous 12 months, with experience being defined in broad and inclusive terms to be:
• seeing groups of young people;
• seeing evidence of vandalism or graffiti to respondent’s or other property;
• seeing evidence of drug use or dealing;
• seeing or hearing drunk or rowdy behaviour;
• experiencing noisy neighbours.
Respondents who perceived problems were asked, for each of a selection of behaviours, whether they personally had experienced them in the previous year. As suggested by the stated sources of perceptions, for four of the five types of behaviour considered, a large proportion of those perceiving problems had had personal experience in the previous 12 months. This proportion ranged from 85 per cent for vandalism and graffiti to 94 per cent for young people hanging around. For drug use or dealing the proportion was considerably lower at 55 per cent (Table A5.3).
Findings here need to be understood in relation to the proportion of people who mentioned there were problems with a particular type of behaviour. For instance, among those perceiving problems, there was a greater level of experience of noisy neighbours compared with some strands, but a lower proportion of all respondents initially said there were problems with noisy neighbours. In addition, there are likely to be people who have experienced the types of

22
behaviour discussed here but who did not regard this to be a more general problem in the local area.
One important reason for developing further understanding of the BCS perception measures was in order to address the question of whether different norms and corresponding tolerances between areas meant that the same incident would be considered a problem in one area but not in another. It has already been seen how differences emerged between types of area when looking at what people regarded to be the ‘biggest problem’, suggesting incidents with different characteristics may be occurring, but one can also try to look at responses to the same types of behaviour.
Respondents were asked about the frequency with which they experienced problems. Taking the example of young people hanging around, among those perceiving problems, the proportion who had a high frequency of experiencing incidents in wealthy achiever areas was considerably lower (at 40%) than those in hard-pressed areas (at 63%) (Figure 5.2 and Table A5.4). This pattern was repeated for the other types of behaviour.
Figure 5.2 Proportion with high frequency of experience of young people hanging around by type of area (of those perceiving problems)
40
47 48
6063
0
10
20
30
40
50
60
70
Wealthy achievers Urban prosperity Comfortably off Moderate means Hard-pressed
Per
cent
age
high
freq
uenc
y of
exp
erie
nce
This suggests a lower tolerance among those in wealthy achiever and other more affluent areas compared with hard-pressed areas. Although a greater proportion of those in hard-pressed areas said there were ‘very’ (as opposed to ‘fairly’) big problems, even when looking within the ‘very big problem’ group, differences between the less affluent and more affluent groups were still apparent.
Across all areas a greater proportion of those who said there were ‘very’ rather than ‘fairly’ big problems had experienced a high frequency of incidents (66% compared with 48%).

23
Reporting incidents The focus on actual experience of ASB in this chapter brings us back to the issue of counting numbers of incidents. The Home Office carried out a ‘one-day count’ that tried to get a snapshot of the number of ASB incidents that were reported to a wide range of agencies during a 24-hour period in September 2003. The numbers obtained, although not claimed to be complete, consistent or without duplication across agencies, suggested 13.5 million incidents were being reported each year (see the discussion of the one-day count in Harradine et al., 2004).
BCS respondents who said they had experienced problems in the previous year were asked whether they had complained about it to anyone (including to the offenders themselves). It was clear that the majority of incidents go unreported to any agency or individual (Table A5.5). In the case of drunk or rowdy behaviour, 80 per cent of those who had experienced this in the last 12 months had not reported any incidents of this type during that time. Noisy neighbours were most likely to be complained about of the five types of behaviour considered, with 54 per cent making some kind of complaint. This is in line with Hunter et al., (2004) who found a reluctance to report incidents for reasons including a fear of reprisals and perceptions that agencies would not be effective in dealing with them.
For four of the five types of behaviour considered, the police were the most commonly mentioned point of complaint (11% in cases of young people hanging around, 9% in cases of drunk or rowdy behaviour). It was relatively rare for people to complain to the individuals actually causing the problem.
There was a different picture in the case of noisy neighbours where over a quarter of those experiencing problems (27%) had complained to the neighbours at some point in the year (the difference here perhaps reflects the different nature of personal relationships – a subject taken up in Chapter 7). ‘Informal resolution’ is discussed further in Hunter et al., (2004). In addition, 16 per cent made a complaint to the local council.
Looking at the reporting of young people hanging around as an example, people were more likely to report behaviour where there was a high impact on their quality of life (a measure discussed further in Chapter 8). Forty per cent of those who experienced a high impact on their quality of life complained to someone compared with 16 per cent of those who experienced low impact.
People were also asked about who they felt was responsible for stopping or reducing ASB (they could mention more than one group or agency). Parents were most frequently mentioned as being responsible in cases of young people hanging around (76%) and vandalism or graffiti (65%), perhaps reflecting the age of offenders here, but the police were also felt to have a role (51% and 59% respectively).
The police were most frequently mentioned in the case of drug use or dealing (74%), drunk or rowdy behaviour (58%) and even noisy neighbours (37%). Local people themselves were not widely thought to have a role in reducing ASB except in the case of noisy neighbours (29%), perhaps as a result of the parties being less likely to be strangers.
Chapter summary The perception of problems in the local area was very often based on recent personal experience of these problems.
Around nine out of ten who perceived problems had experienced young people hanging around, vandalism or graffiti, drunk or rowdy behaviour and noisy neighbours. Where there was less personal experience (around half of those perceiving drug use or dealing to be a problem had

24
personal experience in the last year) the local media and general discussion in the local area were sources of perceptions.
There was evidence that norms of behaviour varied between areas, with those in more affluent areas perceiving problems based on a lower frequency of experience compared with more deprived areas.
The vast majority of incidents of ASB were not reported to any agency, nor were they resolved through an informal approach to those causing problems. The likelihood to report or complain varied by the type of incident and the impact that it had, with noisy neighbour incidents more likely to be reported than those involving drunk or rowdy behaviour. In general, people felt that the parents of those involved or the police were responsible for reducing problems, with local people themselves not widely thought to be responsible except in cases where there was a personal relationship between the parties.

25
6 The nature of antisocial behaviour incidents The previous chapter extended understanding of the measures of perceived problems by establishing the extent to which they reflected personal experience. There are further questions regarding whether different situations and subjective views mean that people are talking about different types of incident within the broad categories of behaviour that the BCS considers. This chapter draws out the specific nature of the experiences that people have and the variation to be found between types of behaviour and between areas and social groups.
Types of problematic behaviour
Within the broad categories of types of ASB, those who had experienced incidents in the previous 12 months were asked what had actually happened on the last occasion. The result is a profile of the type of incidents that occur. Another approach would have been to ask people about the most serious occasion of ASB that they had experienced (this may be more important when considering how perceptions are formed), but the chosen approach gives us the picture of what ASB incidents typically involved.
The specific nature of the most recent incident within each type of ASB is described in Table A6.1. The range of types of incident that people find problematic is quite considerable, as is what might be judged to be the seriousness of them. The analysis below concentrates on young people hanging around to illustrate some general findings.
The importance of appropriate places
Underlying all of the specific incidents within ‘young people hanging around the streets’ is the idea of the misuse of public space. ‘Blocking the pavement’ and ‘blocking the entrance to shops’ are two specific incidents that directly relate to the misuse of space (29% and 16% of incidents respectively involved these elements). However, the most widely mentioned items, ‘bad language’ and ‘being loud, rowdy or noisy’ (both occurring in 48% of incidents), also need to be understood in relation to the context of public space. In another context (for instance a football ground), fewer people may consider these things to be problematic. The issue of appropriate places is key for behaviour to be defined as ASB, as Cresswell (1992) illustrates in her study of reactions to graffiti in New York and the move by the art establishment to mainstream the phenomenon by bringing it into designated art spaces.
The legitimacy of problem claims
The case for describing as a problem a gathering of young people in a particular place may still need to be made in incidents where the individual perceiving it as such describes young people as ‘just being a general nuisance’ (43%) and particularly when they are ‘not doing anything in particular’ (6%). In over a third of incidents (36%), those perceiving problems acknowledged that the young people were not deliberately being antisocial (Table A6.2).
However, there are certain types of behaviour that would seem to be more serious and more likely to gain a consensual view of them being problematic. One area is the environmental damage being caused in littering (24%), damaging property (5%) and writing graffiti (5%). Perhaps most seriously, there are those types of behaviour that are directly aimed at individuals, such as abuse (17%), intimidation (11%), physical assault (1%) and robbery (1%).

26
ASB directed at individuals
For this latter group of types of behaviour plus the use of bad language, respondents were asked whether the behaviour was directed at them personally. This was the case in ten per cent of all incidents (Table A6.3).
In the majority of incidents connected with young people hanging around, therefore, ASB does not involve the person affected being directly ‘victimised’. This does not mean that incidents do not have substantial impacts, however, as will be discussed in Chapter 8. This is particularly pertinent to incidents relating to drug use or dealing, where only six per cent of incidents were directed at the respondent. Incidents such as drug dealing (31% of incidents), although there is no direct victim, may have an important impact on the level of fear and on social cohesion. In the 15 per cent of incidents where used needles were spotted, the problem may have been as much to do with the associations made with wider drug-related problems as with the actual threat posed by the needles themselves.
This is also true of incidents of vandalism and graffiti where the respondent’s own property was the target of the vandalism in only six per cent of cases. Over half (52%) of incidents highlighted were against public facilities such as bus shelters, 16 per cent were against local parks and 15 per cent against local shops. The personal impact of these incidents is not limited to the personal financial cost (10% of cases) or time taken to deal with it (7% of cases).
Incidents connected to drunk or rowdy behaviour were the most likely to be directed at the individual perceiving the problem (23%). In 42 per cent of cases it was not thought that those responsible for the problems were deliberately behaving in an antisocial manner, but mentions of abuse (40% of incidents), intimidation (25%) and assault (9%) were relatively high (Table A6.1).
For noisy neighbours, very few incidents were directly aimed at the respondent, but with 69 per cent of cases involving being kept awake the direct impact is clear.
Variation in types of behaviour by type of area
There were some important differences between types of area in the incidents occurring.
Young people hanging around
In the case of young people hanging around, the profile of the specific type of incident experienced was similar between types of area (the most common types of behaviour were being noisy or rowdy, using bad language, blocking the pavement and littering).
However, those in wealthy achiever areas were more likely than those in less affluent areas to say that young people were ‘not doing anything in particular’ (9% compared with 3% in hard-pressed areas) or were ‘just being a general nuisance’ (46% compared with 43% in hard-pressed areas).
Levels of more serious types of behaviour were lower in wealthy achiever areas, with vandalism occurring in three per cent and graffiti in two per cent of cases compared with six per cent and seven per cent in hard-pressed areas. Less than half a per cent involved assault or robbery compared with two per cent each in areas of urban prosperity.
Vandalism and graffiti
Variation in the target vandalised reflected the type of accommodation to be found in different areas. Damage to communal housing areas and to housing in general was much more common

27
in areas of urban prosperity and hard-pressed areas where high-density living is more common. Local parks and shops were more likely to be targets for those in more affluent and less urban areas.
Associated with this were differences in the impact that this had on residents, with more in the affluent and less urban areas mentioning the costs for local authorities and businesses.
Drug use or dealing
Between types of area there was a similar order in the most common types of behaviour within drug use or dealing, but there were some notable differences in levels.
Incidents in areas of urban prosperity were more likely to have involved people taking hard drugs (27% of incidents compared with 15% in comfortably off areas). This is in line with other findings from the BCS that those in affluent urban areas report the highest rate of Class A drug use (Aust and Condon, 2003). This is evidence for the general point that the types of incident that people say they encounter does reflect the prevalence of that behaviour in the area.
Those living in areas of urban prosperity were also the most likely group to have encountered problems with drug-related begging (17% compared with 4% of those in wealthy achiever areas), and the proportion of incidents involving violence between drug gangs was higher than in other affluent areas (7% compared with 1% of those in wealthy achiever areas). Drug dealing was most common for those experiencing incidents in areas of moderate means (38% compared with 23% of incidents in wealthy achiever areas).
Drunk or rowdy behaviour
Types of experience were relatively similar between different areas. The most distinctive pattern was for those in areas of urban prosperity, where there were higher levels of alcoholics drinking on the street (15%), violent assaults (12%) and drunk people begging (7%). There were lower levels than in other areas of young people drinking in the streets (16% compared with 32% of cases for those living in areas of moderate means).
Noisy neighbours
Loud music (54%) and parties (28%) were the most common noisy neighbour experiences for those in areas of urban prosperity. Arguments or fights and talking or shouting were much more likely to be heard in hard-pressed areas (33% and 27%) and areas of moderate means (29% and 35%) than in more affluent and less urban areas (the figures in wealthy achiever areas were 12% and 24%). This may reflect differences in the type and density of accommodation between these areas.
Frequency of incidents In contrast to criminal offences, where there is a low level of repeat victimisation (Dodd et al., 2004), among those who say there are problems in their area experience of ASB is frequent (Figure 6.1 and Table A6.4). Whitehead et al., (2003) point out that repeated incidents are part of the definition of ASB for some commentators.
Of the types considered, the most frequently experienced problem was that of young people hanging around, with over half (53%) experiencing this ‘more or less every day’ or ‘all the time’ and a further 27 per cent experiencing it ‘around once a week’. The pattern was different for drug use or dealing where, even leaving aside the 45 per cent who had no personal experience, most of the remainder experienced it once a month or less. Even here, however, ten per cent of those

28
perceiving problems experienced them more or less every day or all the time (this is 10% of the 25% of the population who perceived problems with drug use or dealing).
Figure 6.1 Frequency of experience of types of ASB among those perceiving problems
6
0
7 6
27
41
1313
1
1614
29
22
5
45
4
20
911
8
2
0
5
10
15
20
25
30
35
40
45
50
No experiencein last 12months
Once in thelast 12 months
A few times inthe last 12
months
Around once amonth
Around once aweek
More or lessevery day
All the time
Perc
enta
ge o
f tho
se p
erce
ivin
g pr
oble
ms
in a
re
Young people hanging around Noisy neighbours Drug use or dealing
Location of incidents
The most common place for young people to be hanging around was local shops (62% - respondents could mention multiple locations) (Table A6.5). Drug use or dealing was most common in the streets in the local area (39%), in the respondent’s own street (in 37% of cases on foot and in 20% of cases in cars) and in parks (32%). Pubs and clubs were common locations, both outside (29%) and inside (21%). Drunk or rowdy behaviour not surprisingly was most common in the areas around drinking establishments (50%), but was also common in the street (48% in respondent’s own street and 46% in other streets) and other public places including shops (36%) and parks (27%).
Timing of incidents
In the evening and at night were the common times for ASB to occur (Table A6.6). Young people were a problem in the evening generally (82%), but in 20 per cent of cases they were a problem at night (and a further 12% of respondents said it occurred all the time). Drunk or rowdy behaviour and noise from neighbours was more likely to be a problem at the weekend.

29
Problems in town centres and on public transport This report is generally concerned with problems in the local area and the impacts that these have on individuals and communities. However, ASB may be encountered in places outside the local area, and similar issues regarding the use of public space and personal impact apply. The BCS looked at two specific places to check experience of problems: town centres and public transport.
The most frequently experienced problem in town centres was young people hanging around, mentioned by 58 per cent of regular visitors (Table A6.7). Other problems involving the use of public space were people being drunk or rowdy (41%) and begging at cash points (34%). The environmental concern of rubbish and litter was mentioned by 49 per cent, with vandalism mentioned by 33 per cent and buildings being in poor condition by 26 per cent.
On public transport, regular travellers mentioned rubbish or litter most frequently (44%), with another environmental issue, vandalism, also being widely experienced (34%). Noisy or disruptive passengers were mentioned by 41 per cent of passengers, and 30 per cent mentioned people being drunk or rowdy.
Chapter summary There was considerable variation in the type of incident experienced within broad categories such as ‘young people hanging around’. Many incidents by themselves may not be considered serious, and it may be difficult to justify labelling people as ‘offenders’ in these cases. A proportion of individual incidents were serious, however, and were deliberately directed at individuals (these incidents, such as intimidation and drug dealing, are more likely to occur in urban areas). Interventions would need to take account of the variation in types of incidents occurring in different locations and the role and perspective of ‘offenders’.
Assessments of seriousness should include frequency and impact components. The impact even of low-level incidents may be high, particularly where the frequency of experience is high (see Chapter 8). Incidents of ASB were found to be much more frequently experienced than crime, with over half of those perceiving problems with young people experiencing this ‘more or less every day’ or ‘all the time’.

30
7 ‘Offenders’ and their relationship to ‘victims’ The terms ‘offenders’ and ‘victims’ should be viewed with caution bearing in mind the contested nature of ASB. Understanding who offenders and victims are may provide guidance on where to focus interventions, but the nature of those interventions will need to take account of the nature of the relationships between the parties.
It should be noted that the characteristics of offenders are based on victims’ perceptions and it will not have been possible to accurately assess characteristics (for instance precise age) in all cases.
Profile of offenders
The size of the group involved in problems tended to be largest in the case of young people hanging around, where in a quarter of cases the number was ten or more (Table A7.1). Vandalism was more likely to involve smaller groups (12% of cases involved one offender).
Incidents of ASB were more likely to involve males, but females were also widely involved and groups were generally mixed (Table A7.2). In cases of young people hanging around, 78 per cent involved people of both sexes, with a further 21 per cent being all male and only one per cent all female. Groups involved in drunk or rowdy behaviour also tended to be mixed (62%). The most contrasting type of behaviour to this was that of vandalism, where over half (57%) of incidents involved all male groups3.
Offenders across the types of ASB considered tended to be young, even aside from young people hanging around (where 13- to 15-year-olds were involved in 76% of incidents) (Table A7.3). In cases of vandalism where the offender was seen, the most common age group was from 13 to 15 years (51% of incidents). The age profile was a little older in the case of drug use or dealing and drunk or rowdy behaviour, with 18- to 20-year-olds being the most common group for both these behaviours (43% and 44% respectively). There was a much more even spread of age groups who were offenders in the case of noisy neighbours, with 20 per cent being over 40 years old.
White people were most likely to be perceived as being the offenders in all types of ASB considered; 83 per cent of people seen behaving in a drunk or rowdy way were white, as were 70 per cent of offenders in incidents of drug use. Groups of offenders from different ethnic backgrounds were more frequently perceived to be involved in ASB than were people from any one minority ethnic group. In almost a quarter (23%) of incidents of young people hanging around and a fifth (21%) of perceived incidents of drug use the group was made up of people from different ethnic backgrounds – including those from the white group. While 1 per cent of incidents of young people hanging around involved a group of Asian people only, and in 6 per cent of cases of drug use the offenders were all from the black group (Table A7.4).
Except in the case of noisy neighbours, most people perceived that those who were involved in one type of ASB were also involved in others. Only six per cent of respondents did not feel that those young people hanging around were also involved in other forms of ASB. Whilst there is a
3 It should be noted that respondents who had talked about incidents of vandalism in the criminal victimisation section earlier in the questionnaire were not asked about the offenders in this section. However, this only represents a small proportion of cases. A more important consideration for vandalism is that for most incidents the offender was not seen.

31
broad range of types of behaviour and variation between areas, it seems possible that focusing attention on particular offenders will affect a wide range of problems.
Personal relationship The majority of incidents involving young people hanging around, vandalism and drunk or rowdy behaviour involved strangers (Table A7.5). At least some of the young people who were hanging around were strangers in 96 per cent of incidents, in 26 per cent of incidents some of the people were known casually, or by sight, and in only five per cent of incidents involved people known well (groups consisted of both strangers and people known to the respondent in some cases, so percentages add to more than 100%). The pattern was similar in incidents of drunk or rowdy behaviour (93% involved some strangers), while in cases of vandalism slightly more incidents involved some people who were known well (9%) or casually or by sight (35%).
Despite the majority of incidents involving some strangers, the perception was generally that offenders were from the local area, with this being the case for over 90 per cent of incidents across the four behaviours considered (Table A7.6). The type of behaviour with the highest proportion of people who were not perceived to be from the local area was drug use or dealing (34%).
There were some interesting variations between types of area in the relationship between offenders and victims. Taking the example of drunk or rowdy behaviour, those in areas of urban prosperity were the least likely to know offenders well (2%) or casually or by sight (8%) (Figure 7.1 and Table A7.7). This compared with those in hard-pressed areas who knew offenders well in ten per cent of cases and casually or by sight in 25 per cent of cases. Wealthy achievers were also less likely to have personal relationships with offenders (figures here were 5% and 16%).
These results are significant as they mean that, bearing in mind the higher prevalence of problems in hard-pressed areas compared with more affluent areas, knowing your neighbours well is not sufficient to reduce ASB (or the personal impact of it, as we shall see in the next chapter). This is in line with Hunter et al., (2004) who found that ‘proximity’ had negative effects for some as a result of increased contact with particular offenders, an unwillingness to report problems due to fear of reprisal and perceptions that they would not be supported by agencies.

32
Figure 7.1 Relationship between offender and victim in incidents of drunk or rowdy behaviour by type of area
52
46
10
16
8
16 15
25
97 9897
92
87
0
10
20
30
40
50
60
70
80
90
100
Wealthy achievers Urban prosperity Comfortably off Moderate means Hard-pressed
Prop
ortio
n of
inci
dent
s ex
perie
nced
Some or all known well Some or all known casually or by sight Some or all stangers
Social group relationship In addition to the personal relationship between offender and victim, one can look at differences between social groups for explanations of problems being perceived with ASB.
Older people were more likely to experience problems with the behaviour of the youngest age groups (Table A7.8). Those victims who were aged between 55 and 64 years were significantly more likely than those aged between 16 and 19 years to experience problems with young people aged 10 years or younger (11% compared with 3%). The same relationship was evident where offenders were aged between 11 and 12 years and between 13 and 15 years. Those aged between 16 and 19 years were more likely to experience problems with people in that same age group. One explanation for this pattern might be in the greater cultural gap between the older and youngest age groups compared with between the younger and youngest age groups.
There is less to back up this theory when one looks at the ethnicity of victims and offenders, however (Table A7.9). Those in Black and Minority Ethnic (BME) groups were more likely to experience problems with others in BME groups (although small base sizes here mean that ethnic diversity within the BME group cannot be considered). Similarly, White people were more likely to experience problems with other White people. This is likely to reflect the ethnicity of the local area (it has already been seen that most incidents were perceived to involve people from the local area).

33
Chapter summary For the types of ASB considered, those seen to be behaving antisocially were generally young people of both sexes (but especially males). Those involved in drunk or rowdy behaviour and drug use or dealing tended to be slightly older than young people hanging around and those involved in vandalism (peaking around 18 to 20 years old compared with between 13 and 15 years). Those who were noisy neighbours were from a wider range of ages.
There was a feeling among respondents that the same offenders were responsible for a range of ASB, suggesting that targeting of particular offenders may have an impact on several areas of problems.
Incidents mostly involved strangers, although offenders were largely thought to be from the local area. In hard-pressed areas, where perceived problems were at their highest, there was more likely to be a personal relationship between the parties. At the same time, there was some evidence that cultural gaps, particularly in relation to different age groups, may increase the perception that behaviour is antisocial. Interventions will need to take account of the negative effects of close proximity to offenders while also seeking to improve relationships within communities.

34
8 Impact of antisocial behaviour The question of whether ASB is something that one should be concerned about may be most strongly answered with reference to the impact that it has on individuals and on communities. Impact at the personal level includes the immediate harm caused (emotional, physical or in terms of property), the ongoing impact on quality of life, and the changes in behaviour that it engenders. There is a further question of the extent to which relationships across a community are affected by ASB and result in other negative consequences.
Personal impact
Respondents were asked initially whether any of the full list of 16 behaviours had a ‘bad effect’ on their quality of life (Table A8.1). For 61 per cent of the population, none of the types of ASB had a bad effect. The most frequently mentioned strands that did have an effect were speeding traffic and teenagers hanging around on the streets, both of which were mentioned by 11 per cent.
For the five types of behaviour considered in more detail, questions were asked about the emotional reactions that people might have had, the impact on their quality of life in the longer term, and about actual changes to their behavioural routines.
Emotional reaction
The majority of those perceiving problems in the area with each type of ASB considered had some kind of emotional reaction (Table A8.2). The highest proportion of people (27%) saying they did not react emotionally to ASB was in relation to drug use or dealing (where there was also the highest level of people with no personal experience).
The most common response in cases of young people hanging around, vandalism, drunk or rowdy behaviour and noisy neighbours was annoyance (70% of those perceiving problems with noisy neighbours had been annoyed by it). Closely related to this, frustration and anger were also common reactions.
While these reactions may have a significant impact on people, particularly if problems are frequent, some people had what might be agreed to be more serious emotional reactions: shock, fear, stress, depression, anxiety or panic attacks and crying. Over a quarter (27%) of those perceiving problems with noisy neighbours had one or more of these more serious emotional reactions. The equivalent figure was 23 per cent for drug use or dealing, 19 per cent for young people hanging around and for drunk or rowdy behaviour and 12 per cent for vandalism or graffiti.
These levels of emotional reaction, as one might expect, were below those found for crimes such as violence (as a result of which 38% were shocked and 12% experienced depression for instance) (RDS, 2004). However, the proportions experiencing serious reactions were not negligible, and although the impact was not so frequently acute, there was a wide impact when one considers the higher prevalence and frequency of ASB.
Impact on quality of life
Perhaps representing a more long-term measure of impact, respondents were asked about the impact of ASB on their quality of life (this was self-defined and used a ten-point scale).

35
Within the group of people who perceived problems with the specific type of behaviour, noisy neighbours resulted in the biggest impact on quality of life, with 40 per cent experiencing a high impact. For the other types of ASB, the proportion experiencing high impact on their quality of life ranged between 16 and 22 per cent (Table A8.3).
One can look at these high impact figures based on the whole population if one assumes that those people who did not say there was a problem in their local area with the type of ASB did not personally experience a high impact on their quality of life. In total, six per cent of the national population reported a high impact on their quality of life as a result of young people hanging around, with a further 11% reporting a medium impact (Table A8.3). The total proportion who experience a high impact as a result of any ASB will clearly be higher. While these are small percentages, comparison with rates of criminal victimisation may give some perspective (only 2% experienced a burglary in the previous year) (Dodd et al., 2004).
Behavioural changes
Changes in people’s behavioural routines were reported to have resulted directly from drunk or rowdy behaviour for 47 per cent of those perceiving problems in the local area (Table A8.4). In the case of noisy neighbours the figure was 45 per cent, for young people hanging around 41 per cent, for drug use or dealing 39 per cent and for vandalism and graffiti 33 per cent.
The types of behavioural changes were wide ranging, but a common reaction was avoiding certain places in the local area (22% of those perceiving problems with drug use or dealing). The limiting of use of local public spaces was a theme common to many of the changes mentioned (avoiding going out after dark or alone, using cars to get around the area and ultimately thinking about or actually moving away from an area). In addition, when asked about their usage of town centres, eight per cent used them less than they otherwise would as a direct result of ASB, and 27 per cent avoided them at particular times of the day.
There were also mentions of changes in the way respondents approached other members of the community, with 11 per cent of those who perceived problems of drug use or dealing being less trusting of them as a result of this.
Variation by area and social group – young people hanging around There was variation between areas and social groups in the proportion of people for whom ASB had a high impact on their quality of life. This variation is displayed in relation to young people hanging around in Tables A8.5 and A8.6.
It was generally the case that areas or groups where a relatively large proportion of people perceived problems in the local area were also more likely to experience a high impact on quality of life. For instance, 41 per cent of those in hard-pressed areas perceived problems in the local area compared with 27 per cent nationally, and 29 per cent of those perceiving problems in hard-pressed areas experienced a high impact on quality of life compared with 22 per cent nationally. Problems in hard-pressed areas are therefore both more prevalent and more acute than elsewhere. This is reflected in the percentage of the total population (rather than just those perceiving problems) that experienced a high impact on quality of life (12% of those in hard-pressed areas compared with 6% nationally).
Area variables were particularly discriminating for high impact on quality of life as the example above suggests. Of the total population, those who did not think that neighbours looked out for one another in their local area (the measure representing collective efficacy) had the highest prevalence at 14 per cent, compared with three per cent of those who felt neighbours definitely

36
looked out for one another. The prevalence for those in inner city areas and hard-pressed area types was 12 per cent, compared with two per cent in rural areas and wealthy achiever areas.
Looking at household and personal variables, ten per cent of those in the social rented sector experienced high impact compared with five per cent of those in the private rented sector and of owners. High impact was more prevalent among those who were victims of crime (9%) and also for those in Black and Minority Ethnic groups (9%).
The effect of frequency and emotional impact on quality of life There was a strong association, as one might expect, between frequency of experience and the impact on quality of life across the types of ASB considered (Figure 8.1 and Table A8.7). The differences were most stark for those perceiving problems with noisy neighbours, where 63 per cent of those in the high frequency category experienced high impact on their quality of life, compared with 30 per cent for the low frequency group.
Across all types of ASB, there was a group of people who felt there was a high impact on their quality of life despite not having experienced problems in the previous 12 months. A third (33%) of the group who did not personally experience drug use or dealing nevertheless reported some kind of impact on their behaviour as a result of the perceived problem in their area.
Figure 8.1 Percentage of those perceiving problems who experience high impact on quality of life – by frequency of experience
6
1416
28
1514
23
40
10
30
39
63
0
10
20
30
40
50
60
70
Not experienced Low Medium High relative frequency ofexperience
Per
cent
age
high
impa
ct Young people hanging around Drug use or dealing Noisy neighbours
Associations between the severity of emotional reactions to problems and the impact on quality of life were also strong (Table A8.7). Nearly half (49%) of those who had a serious emotional reaction to young people hanging around had experienced a high impact on their quality of life compared with 15 per cent for those who had not had a serious emotional reaction.

37
Underlying factors for impact on quality of life and perceptions
Quality of life impact: young people hanging around
In order to draw out those factors that were the strongest predictors of high impacts on quality of life independently of other variables, multivariate analysis was carried out. Looking at the findings for the effects of young people hanging around in the local area, the strongest predictors of high impact on quality of life were the other impact measures – having had a serious emotional reaction and there having been a change in behaviour.
When these variables were excluded from the model (on the basis that they could actually be measuring something quite similar), the strongest predictors were having a high frequency of experience and there being a relatively high proportion of 10- to 24-year-olds in the local area. This is in line with Hunter et al., (2004) who found that the cumulative effects of repetitive low-level problems were significant.
Comparing ‘very big’ to ‘fairly big’ problems: young people hanging around
One of the initial questions for the research was what was driving perceptions of problems in the local area (one of the range of measures to be used to track progress against the Home Office’s set of Public Service Agreements). Some of the important variables that affect perceptions (such as frequency of experience) were only asked of those people who said there were very or fairly big problems in their area with a particular type of behaviour. For this reason, one cannot look at what underlies the difference between people who do not perceive problems and those who do. However, one can look at what the difference is between those people who say there are ‘fairly big’ problems in their area and those who say there are ‘very big’ problems.
Concentrating again on young people hanging around, multivariate analysis showed that high impact on quality of life was the strongest predictor of perceiving very big rather than fairly big problems in the local area.
When this and the other impact measures were left out of the model, high frequency of experience was the strongest predictor of very big problems with young people, followed by living in less affluent areas and criminal victimisation. Those renting social housing were more likely than homeowners to perceive very big problems with young people.
Wider impact
Fear of crime and ASB as a ‘signal’
Beyond the direct impact that respondents reported, experiences of problems with ASB were also strongly related to fear of crime and wider perceptions of the local community.
There is discussion in the research literature of the effect that ‘signal’ crimes and disorders have on feelings of safety, and this may go some way to explaining the divergence between perceptions of trends in crime and their actual movement. Innes and Fielding (2002), argue that signal crimes are ‘disproportionately influential’ on perceptions of risks. These include serious individual incidents of the sort that attract significant media interest, but also lower level ASB, particularly where there is high frequency or where types of incident occur in combination.

38
This is supported by the significantly higher proportion that reported high levels of worry about violent crime and about burglary among those perceiving high levels of ASB. A quarter (25%) of this group had a high level of worry about violent crime and 28 per cent were very worried about burglary, compared with nine per cent for both for those not perceiving high ASB (Table A8.9).
Considering specific types of behaviour, vandalism and graffiti are examples of high frequency visual cues that would certainly fall within the ‘signal crime’ category. Table A8.10 displays a strong relationship between perceptions of problems with this measure and wider worry about crime.
Multivariate modelling indicated that perceived level of ASB was the second strongest predictor of worry about violent crime after gender, and the strongest single predictor of worry about burglary. Although these are both attitudinal measures that may also partly form perceptions of ASB, it has been seen that for the vast majority of respondents, perceptions of problems with ASB are based on experience of problems, and often quite frequent experience.
Another broad attitudinal impact is that of the extent to which people enjoy living in a particular area. Among those perceiving high ASB only 40 per cent definitely enjoyed living in their area, compared with 74 per cent of those who did not perceive high levels (Table A.11).
Crime, ASB and collective efficacy
Wilson and Kelling (1982) advanced the theory that unchecked low-level crime and disorder led directly to more serious crime through a cycle of decline that eroded informal social control. The intuitively plausible link that is suggested here has led to it being an influential theory, particularly for policy makers in New York and other US cities. However, empirical work by Sampson and Raudenbush (1999) found no evidence of a causal link, and instead they concluded that actually both crime and ASB were associated with deprivation and with a lack of ‘collective efficacy’.
It has been noted (Chapter 4) that there is evidence from the BCS to support the work of Sampson and Raudenbush in their identification of collective efficacy as an inhibitor of ASB (the relationship of crime rate, collective efficacy and perceptions of ASB to type of area are summarised in Table A8.13). The findings from the multivariate analysis, in identifying this and type of area as the most predictive factors of problems with ASB, provide a good basis from which policy planning could proceed.
Chapter summary Although emotional responses to ASB were not as frequently acute as in the case of criminal victimisation, serious emotional impact was evident. The wider experience of ASB compared with crime and the higher frequency of experience mean that emotional impact is to be taken seriously.
Impact on behaviour, including the use of public space, was widespread even for people who have not personally experienced problems. The effect on long term quality of life was important, with six per cent of the national population reporting a high impact on their quality of life as a result of young people hanging around, and a further 11 per cent reporting a medium impact. The total proportion who experience a high impact as a result of any ASB will clearly be higher.
There was variation in the pattern of this high impact on quality of life. At particular risk were those living in areas that they felt had low collective efficacy, and those in hard-pressed and inner city areas. A high frequency of experience was the strongest predictor of high impact on quality of life.

39
Looking at the wider effects of ASB, its ‘signal’ quality meant it was particularly strongly related to fear of violence and property crime and also to the basic extent to which people enjoyed living in a particular area. Although available evidence suggests that ASB is not a direct cause of more serious crime, approaches to tackling ASB that focus on increasing collective efficacy in the worst affected areas may improve both crime and ASB.

40
References Aust, R. and Condon, J. (2003) Geographical variation in drug use: key findings from the 2001/02 British Crime Survey. Statistical Bulletin 15/03, Home Office.
Cresswell, T. (1992) The crucial 'where' of graffiti: a geographical analysis of reactions to graffiti in New York, Environment and Planning, 10:329-344.
Dodd, T., Nicholas, S., Povey, D., Walker, A. (2004), Crime in England and Wales 2003/2004. Statistical Bulletin 10/04, Home Office.
Harradine, S., Kodz, J., Lemetti, F., Jones, B. (2004) Defining and measuring antisocial behaviour. Development and Practice Report 26, Home Office.
Hunter, C., Nixon, J., Parr, S. (2004) What works for victims and witnesses of antisocial behaviour. Sheffield Hallam University/ ASB Unit, Home Office.
Innes, M., and Fielding, N. (2002) From community to communicative policing: ‘signal crimes’ and the problem of reassurance. Sociological Research Online, 7:2. www.socresonline.org.uk/7/2/innes.html
Nicholas, S., Walker, A. (2004) Crime in England and Wales 2002/2003: supplementary volume 2. Statistical Bulletin 02/04, Home Office.
Research Development and Statistics (RDS) (2004) Crime in England and Wales 2002/03 supplementary tables: nature of burglary, vehicle and violent crime. Home Office. http://www.homeoffice.gov.uk/rds/crimeew0203.html,
Sampson, R., and Raudenbush, S. (1999) Systematic social observation of public spaces: a new look at disorder in urban neighbourhoods. American Journal of Sociology, 105:3:603-651.
Simmons, J., and Dodd, T. (2003) Crime in England and Wales 2002/2003. Statistical Bulletin 07/03, Home Office.
Whitehead, C., Stockdale, J., Razzu, G. (2003) The economic and social costs of antisocial behaviour: a review. London School of Economics.
Wilson, J., and Kelling, G. (1982) Broken windows: the police and neighbourhood safety. Atlantic Monthly, 127:29-33.
41
Appendix A: Tables [See accompanying tables file]
Conventions Differences discussed in the text are statistically significant at the 95 per cent level unless otherwise stated.
In some instances, figures are provided in the text only in order to reduce the size of the table set.
‘<1%’ in tables indicates the percentage was less than 0.5 per cent but above zero.
‘ – ‘ in tables indicates zero.

42
Appendix B: Multivariate analysis Multivariate analysis allows underlying factors that drive the dependent variable of interest to be identified. The forward stepwise logistic regression described in this report selects those variables, in order of their strength of prediction, that are statistically associated with the dependent variable independently of the other variables included in the model. This does not imply a causal relationship, and care is needed in selecting variables for inclusion.
The odds ratios that are produced allow one to understand which categories within independent variables are more likely to be associated with the dependent variable category of interest (for instance ‘high perceived ASB’) compared with other categories in that independent variable. Where odds ratios are higher than one, respondents in that category have relatively higher odds of perceiving high ASB than those in the reference category.
It should be noted that this analysis produces a model that uses variables that explain most variation across the sample. Where particular subgroups are small (for instance those in Black and Minority Ethnic groups) the variable may not be included in the model despite variation being significant simply because the size of the group is small.
The full set of variables found to be significant in the model of high perceived ASB together with their odds ratios are included in the table below.

43
Figure B.1 Logistic regression model for high perceived ASB
2003/04 BCSOdds ratio Significance 3
ACORN area type Wealthy achievers (Reference category) 1.00Urban prosperity 2.40 *Comfortably off 1.88 *Moderate means 2.98 *Hard-pressed 4.07 *
Victimisation in last year Not a victim of crime (Reference category) 1.00Victim of crime 2.56 *
Proportion of local population aged from 10 to 24 years10% of areas with lowest proportion 1.0010% of areas with highest proportion 2.53 *
Age group 16-19 (Reference category) 1.0020-24 0.79 *25-34 0.72 *35-44 0.71 *45-54 0.76 *55-64 0.64 *65-74 0.44 *75-84 0.19 *85+ 0.10 *
Region North East 1.20North West 1.31 *Yorkshire & Humberside 1.19East Midlands 1.74 *West Midlands 1.29 *East of England 1.46 *London 1.95 *South East 1.97 *South West 1.54 *Wales (Reference category) 1.00
Proportion of local population who are economically active10% of areas with lowest proportion 1.0010% of areas with highest proportion 0.70 *
General health Very good (Reference category) 1.00Good 1.22 *Fair 1.44 *Bad 1.38 *Very bad 2.22 *
Tenure Owners (Reference category) 1.00Private rented sector 0.84 *Social rented sector 1.25 *
Newspaper readership National broadsheets (Reference category) 1.00National tabloids 1.28 *Other daily newpaper 1.19 *None 1.04
Sex Female (Reference category) 1.00Male 0.86 *
Proportion of local households that are couples with children10% of areas with lowest proportion 1.0010% of areas with highest proportion 0.62 *
Continued over page
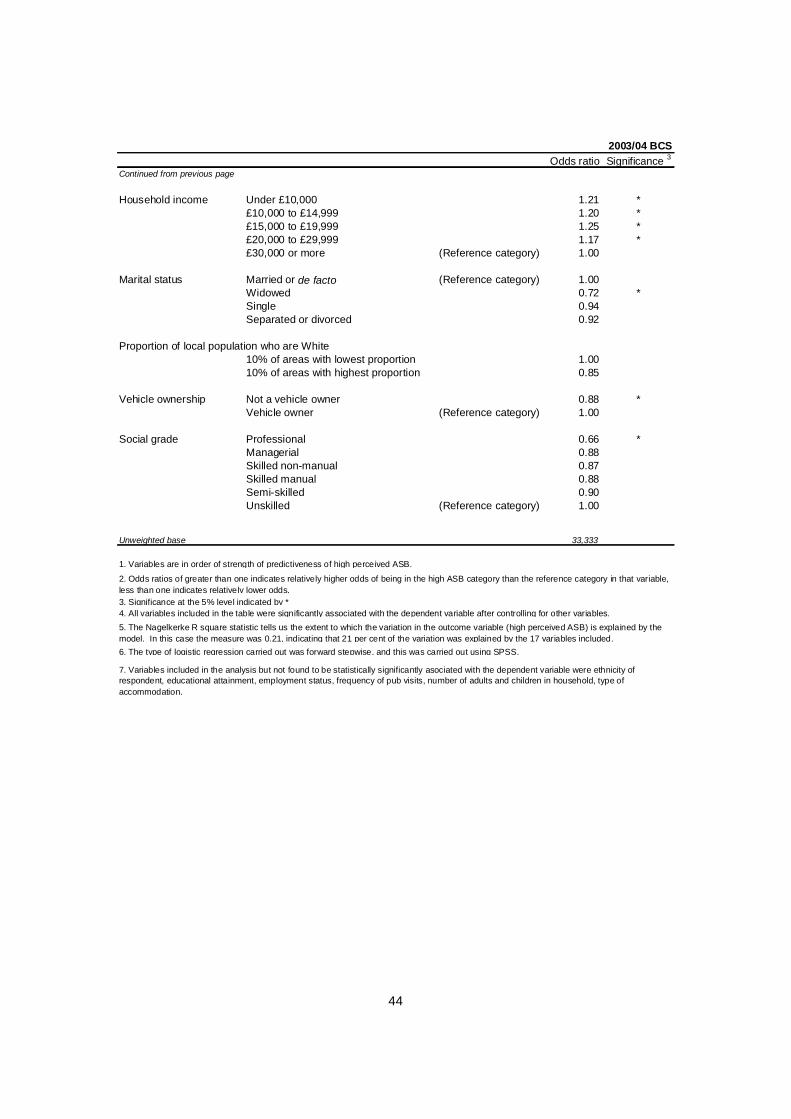
44
2003/04 BCSOdds ratio Significance 3
Continued from previous page
Household income Under £10,000 1.21 *£10,000 to £14,999 1.20 *£15,000 to £19,999 1.25 *£20,000 to £29,999 1.17 *£30,000 or more (Reference category) 1.00
Marital status Married or de facto (Reference category) 1.00Widowed 0.72 *Single 0.94Separated or divorced 0.92
Proportion of local population who are White10% of areas with lowest proportion 1.0010% of areas with highest proportion 0.85
Vehicle ownership Not a vehicle owner 0.88 *Vehicle owner (Reference category) 1.00
Social grade Professional 0.66 *Managerial 0.88Skilled non-manual 0.87Skilled manual 0.88Semi-skilled 0.90Unskilled (Reference category) 1.00
Unweighted base 33,333
5. The Nagelkerke R square statistic tells us the extent to which the variation in the outcome variable (high perceived ASB) is explained by the model. In this case the measure was 0.21, indicating that 21 per cent of the variation was explained by the 17 variables included.6. The type of logistic regression carried out was forward stepwise, and this was carried out using SPSS.
7. Variables included in the analysis but not found to be statistically significantly asociated with the dependent variable were ethnicity of respondent, educational attainment, employment status, frequency of pub visits, number of adults and children in household, type of accommodation.
1. Variables are in order of strength of predictiveness of high perceived ASB.2. Odds ratios of greater than one indicates relatively higher odds of being in the high ASB category than the reference category in that variable, less than one indicates relatively lower odds. 3. Significance at the 5% level indicated by *4. All variables included in the table were significantly associated with the dependent variable after controlling for other variables.

45
Appendix C: The British Crime Survey This report is based on findings from British Crime Survey (BCS) interviews in 2003/04.
The British Crime Survey is primarily concerned with experiences of criminal victimisation and is used to estimate actual levels of crime. This supplements the picture provided by police recorded crime statistics that only include those crimes reported to the police. In addition to criminal victimisation, the BCS asks about other subjects relevant to the Home Office, including antisocial behaviour, on which a new set of questions was added in 2003/04.
The BCS is a survey of people aged 16 and over living in private households in England and Wales. Following appropriate weighting the survey provides a representative sample of individuals and households in this population.
First carried out in 1982, interviewing for the BCS is now carried out on a continuous basis. The achieved main sample size in 2003/04 was 37,931 plus a boost of 3,463 Black and Minority Ethnic respondents. The response rate for main sample interviews in 2003/04 was 74%.
The British Crime Survey is carried out for the Home Office by BMRB social research. For more detail on the design of the survey see the 2002-3 British Crime Survey technical report volume 1, available at the link below.
http://www.homeoffice.gov.uk/rds/crimeew0304.html

Produced by the Research Development and Statistics Directorate, HomeOffice
This document is available only in Adobe Portable Document Format (PDF)through the RDS website
http://www.homeoffice.gov.uk/rds
Email: [email protected]
ISBN 1 84473 470 6 Crown copyright 2004