Embed Size (px)
Citation preview

INTERREG IVB – OptiMIR – September 2012
Perception survey of the dairy farmers and their consultants – page 1/37
Perception survey of the dairy farmers and their consultants
TABLE OF CONTENTS
1. INTRODUCTION .............................................................................................................................. 3
2. SUSTAINABILITY OF THE MILK PRODUCTION ............................................................................. 6
2.1. Coping strategies in reducing the costs ..................................................................................... 6
2.1.1. Global analysis ................................................................................................................... 6
2.1.1.1. Postponement of investment ....................................................................................... 7
2.1.1.2. Performance recordings ............................................................................................... 7
2.1.1.3. Advice services ............................................................................................................ 7
2.1.1.4. Feeding ....................................................................................................................... 8
2.1.1.5. Veterinary service ........................................................................................................ 8
2.1.1.6. Artificial insemination (AI) ............................................................................................ 8
2.1.2. Detailed information ............................................................................................................ 9
2.2. Profitability criteria ................................................................................................................... 14
2.2.1. Global analysis ................................................................................................................. 14
2.2.2. Detailed analysis ............................................................................................................... 16
3. UTILIZATION OF FARM MANAGEMENT COMPUTERIZED TOOLS ............................................. 24
3.1. Perception of computerized tools ............................................................................................. 24
3.1.1. Working time ..................................................................................................................... 24
3.1.2. Awareness ........................................................................................................................ 26
3.1.3. Profitability ........................................................................................................................ 28
3.2. Utilisation of computerized tools .............................................................................................. 30
3.2.1. Global analysis ................................................................................................................. 30
3.2.2. Detailed analysis ............................................................................................................... 31
4. CONCLUSION ................................................................................................................................ 36
INTERREG IVB – OptiMIR – September 2012
Perception survey of the dairy farmers and their consultants – page 2/37
Graph 1: Typology of the surveyed dairy farms ........................................................................................ 4 Graph 2: purposes of the milk production ................................................................................................. 5 Graph 3: Purposes of the milk production ................................................................................................ 5 Graph 4: Occupation of the surveyed farm consultants ............................................................................ 5 Graph 5: Coping strategies in reducing the costs – Farmers’ opinion ....................................................... 6 Graph 6: Coping strategies in reducing the costs – Consultants' opinion ................................................. 7 Graph 7: Strategies in reducing the costs - Answers of farmers from all countries ................................... 9 Graph 8: Strategies in reducing the costs - Answers of consultants from all countries ............................. 9 Graph 9: Strategies in reducing the costs - Answers of farmers from Belgium ....................................... 10 Graph 10: Strategies in reducing the costs - Answers of consultants from Belgium ............................... 10 Graph 11: Strategies in reducing the costs - Answers of farmers from Germany ................................... 11 Graph 12: Strategies in reducing the costs - Answers of consultants from Germany .............................. 11 Graph 13: Strategies in reducing the costs - Answers of farmers from France ....................................... 12 Graph 14: Strategies in reducing the costs - Answers of consultants from France ................................. 12 Graph 15: Strategies in reducing the costs - Answers of farmers from Ireland ....................................... 13 Graph 16: Strategies in reducing the costs - Answers of consultants from Ireland ................................. 13 Graph 17: Strategies in reducing the costs - Answers of farmers from United Kingdom ......................... 14 Graph 18: Major profitability criteria according to farmers ...................................................................... 15 Graph 19: Major profitability criteria according to farm consultants ........................................................ 15 Graph 20: Profitability criteria in link with milk - Farmers' view ............................................................... 17 Graph 21: Profitability criteria in link with milk - Consultants' view .......................................................... 17 Graph 22: Profitability criteria in link with lactation - Farmers' view ......................................................... 18 Graph 23: Profitability criteria in link with lactation - Consultants' view ................................................... 18 Graph 24: Profitability criteria in link with genetic - Farmers' view .......................................................... 19 Graph 25: Profitability criteria in link with genetic - Consultants' view ..................................................... 19 Graph 26: Profitability criteria in link with feeding - Farmers' view .......................................................... 20 Graph 27: Profitability criteria in link with feeding - Consultants' view ..................................................... 20 Graph 28: Profitability criteria in link with fertility - Farmers' view............................................................ 21 Graph 29: Profitability criteria in link with fertility - Consultants' view ...................................................... 21 Graph 30: Profitability criteria in link with health - Farmers' view ............................................................ 22 Graph 31: Profitability criteria in link with health - Consultants' view ....................................................... 22 Graph 32: Profitability criteria in link with scoring - Farmers' view .......................................................... 23 Graph 33: Profitability criteria in link with scoring - Consultants' view ..................................................... 23 Graph 34: Computerized tools and working time when beginner – Farmers’ view .................................. 24 Graph 35: Computerized tools and working time when beginner – Consultants’ view ............................ 25 Graph 36: Computerized tools and working time when familiarized – Farmers’ view .............................. 25 Graph 37: Computerized tools and working time when familiarized – Consultants’ view ........................ 26 Graph 38: Computerized tools and awareness of problems - Farmers' view .......................................... 26 Graph 39: Computerized tools and awareness of problems - Consultants' view ..................................... 27 Graph 40: Computerized tools and awareness of opportunities - Farmers' view .................................... 27 Graph 41: Computerized tools and awareness of opportunities - Consultants' view ............................... 28 Graph 42: Computerized tools and profitability - Farmers' view .............................................................. 29 Graph 43: Computerized tools and profitability - Consultants' view ........................................................ 29 Graph 44: Utilisation of computerized tools by farmers .......................................................................... 30 Graph 45: Utilisation of computerized tools by consultants .................................................................... 30 Graph 46: Utilisation of on local software by farmers ............................................................................. 32 Graph 47: On local software by farmers - For recording and follow-up ................................................... 32 Graph 48: On local software by farmers - For decision making .............................................................. 32 Graph 49: Utilisation of on local software by consultants ........................................................................ 33 Graph 50: On local software by consultants - For recording and follow-up ............................................. 33 Graph 51: On local software by farmers - For decision making .............................................................. 33 Graph 52: Utilisation of Web application by farmers ............................................................................... 34 Graph 53: Web application by farmers - For recording and follow-up ..................................................... 34 Graph 54: Web application by farmers - For decision making ................................................................ 34 Graph 55: Utilisation of Web application by consultants ......................................................................... 35 Graph 56: Web application by consultants - For recording and follow-up ............................................... 35 Graph 57: Web application by consultants - For decision making .......................................................... 35
INTERREG IVB – OptiMIR – September 2012
Perception survey of the dairy farmers and their consultants – page 3/37
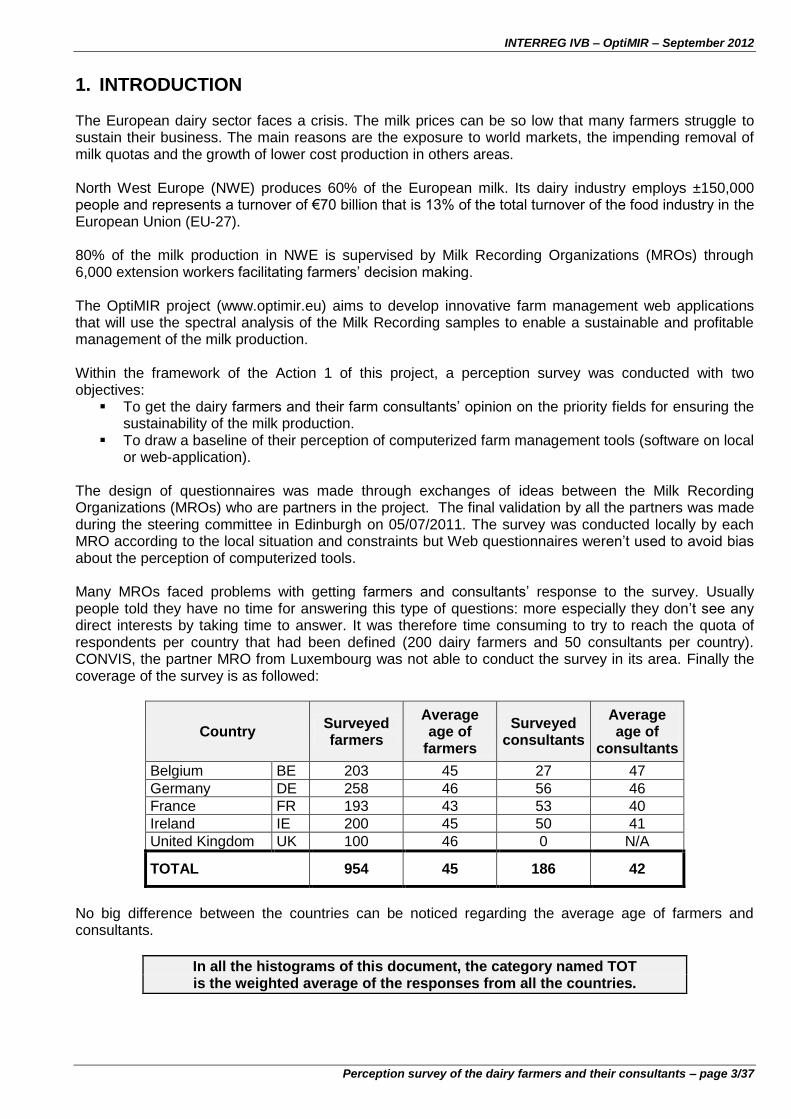
1. INTRODUCTION The European dairy sector faces a crisis. The milk prices can be so low that many farmers struggle to sustain their business. The main reasons are the exposure to world markets, the impending removal of milk quotas and the growth of lower cost production in others areas. North West Europe (NWE) produces 60% of the European milk. Its dairy industry employs ±150,000 people and represents a turnover of €70 billion that is 13% of the total turnover of the food industry in the European Union (EU-27). 80% of the milk production in NWE is supervised by Milk Recording Organizations (MROs) through 6,000 extension workers facilitating farmers’ decision making. The OptiMIR project (www.optimir.eu) aims to develop innovative farm management web applications that will use the spectral analysis of the Milk Recording samples to enable a sustainable and profitable management of the milk production. Within the framework of the Action 1 of this project, a perception survey was conducted with two objectives:
To get the dairy farmers and their farm consultants’ opinion on the priority fields for ensuring the sustainability of the milk production.
To draw a baseline of their perception of computerized farm management tools (software on local or web-application).
The design of questionnaires was made through exchanges of ideas between the Milk Recording Organizations (MROs) who are partners in the project. The final validation by all the partners was made during the steering committee in Edinburgh on 05/07/2011. The survey was conducted locally by each MRO according to the local situation and constraints but Web questionnaires weren’t used to avoid bias about the perception of computerized tools. Many MROs faced problems with getting farmers and consultants’ response to the survey. Usually people told they have no time for answering this type of questions: more especially they don’t see any direct interests by taking time to answer. It was therefore time consuming to try to reach the quota of respondents per country that had been defined (200 dairy farmers and 50 consultants per country). CONVIS, the partner MRO from Luxembourg was not able to conduct the survey in its area. Finally the coverage of the survey is as followed:
Country Surveyed farmers
Average age of
farmers
Surveyed consultants
Average age of
consultants
Belgium BE 203 45 27 47
Germany DE 258 46 56 46
France FR 193 43 53 40
Ireland IE 200 45 50 41
United Kingdom UK 100 46 0 N/A
TOTAL 954 45 186 42
No big difference between the countries can be noticed regarding the average age of farmers and consultants.
In all the histograms of this document, the category named TOT is the weighted average of the responses from all the countries.

INTERREG IVB – OptiMIR – September 2012
Perception survey of the dairy farmers and their consultants – page 4/37
Farm typology is defined with: The number of cows per farm The area (ha) allotted for cows’ fodder The milk quota (kg) which is very closed of the quantity of milk really produced The ratio between those 3 elements
Graph 1: Typology of the surveyed dairy farms
Cows / 10000kg Milk
Fodder Ha / Cow
Fodder Ha / 10000kg Milk
BE 1.46 0.68 1.00
DE 1.35 0.91 1.23
FR 1.41 1.11 1.57
IE 3.41 0.30 1.03
UK 2.03 0.42 0.85
TOT 1.86 0.60 1.11
The Graph 1 shows that the farms typology is comparable in Belgium, Germany and France but with less fodder area per cows in Belgium and more fodder area per kg of milk in France. In Ireland the quantity of milk produced per farm is comparable to those 3 countries, but more than twice the number of cows is needed to fill the quota because they feed less concentrates (grazing system) and have therefore a lower production per cow. Moreover the fodder area per cow is lower in Ireland: pastures are not included, and anyway the feed production of each ha of well managed grassland will be high in comparison to forage area in other countries. In UK the farm typology is different compared to all the others. Farms are bigger: more milk produced more cows and more fodder area per farm. Regarding cows’ performances UK farmers need more cows per kg of milk than Belgium-Germany-France but less than Ireland. Regarding fodder area it’s less per cow than in Belgium-Germany-France because UK has quite a number of herds that are housed for 12 months of the year and often these farms have to buy in feed (in certain areas of the country demand for milk is high, but space for growing feed is limited). The Graphs 2 and 3 show the purposes of the milk production. No surprise here: the main part of the production is for dairy industry (>97%). The only slight difference is for UK where the part of raw milk directly sold is higher (±3%) than in other countries (<1%), and for Germany where the part of milk used for other purposes (mainly to feed calves or for home consumption) is higher (±2,5%) than in other countries (≤1%).
0
20
40
60
80
100
120
140
160
180
0
50
100
150
200
250
300
350
BE DE FR IE UK TOT
Ave
rage
litr
es
x10
,00
0 O
R h
ect
are
s
Ave
rage
n°
of
cow
s Farms typology
Cows/farm Milk quota/farm Fodder area/farm

INTERREG IVB – OptiMIR – September 2012
Perception survey of the dairy farmers and their consultants – page 5/37
Graph 2: purposes of the milk production
Graph 3: Purposes of the milk production
Graph 4: Occupation of the surveyed farm consultants
97.5%
0.8% 0.6%
1.1%
Purposes of milk production - Farmers from all countries
Delivery to dairy industry
Raw milk direct sale
On-farm processing
Other
93%
94%
95%
96%
97%
98%
99%
100%
BE DE FR IE UK TOT
Purposes of milk production - Differences among countries
Other
On-farm processing
Raw milk direct sale
Dairy industry
52.7%
16.1%
7.5%
3.8% 2.2% 1.6%
Surveyed farm consultants
Technician / Extension worker / Advisor
Veterinarian / Inseminator
Animal Scientist
Nutritionist
Accountant / Economic advisor
Other
1
2
Feeding of calves
Home consumption
Other
INTERREG IVB – OptiMIR – September 2012
Perception survey of the dairy farmers and their consultants – page 6/37
The Graph 4 shows the distribution within the different occupations of the farm consultants. Half of them are extension worker. More than 70% of them are people directly targeted by the future OptiMIR farm management tools (extension workers, veterinarians and nutritionists).
2. SUSTAINABILITY OF THE MILK PRODUCTION The survey was designed to determine opinions of the dairy farmers and their farm consultants on topics relevant to the sustainability and profitability of milk production, and those that should be given greatest priority by the project especially regarding the milk crisis.
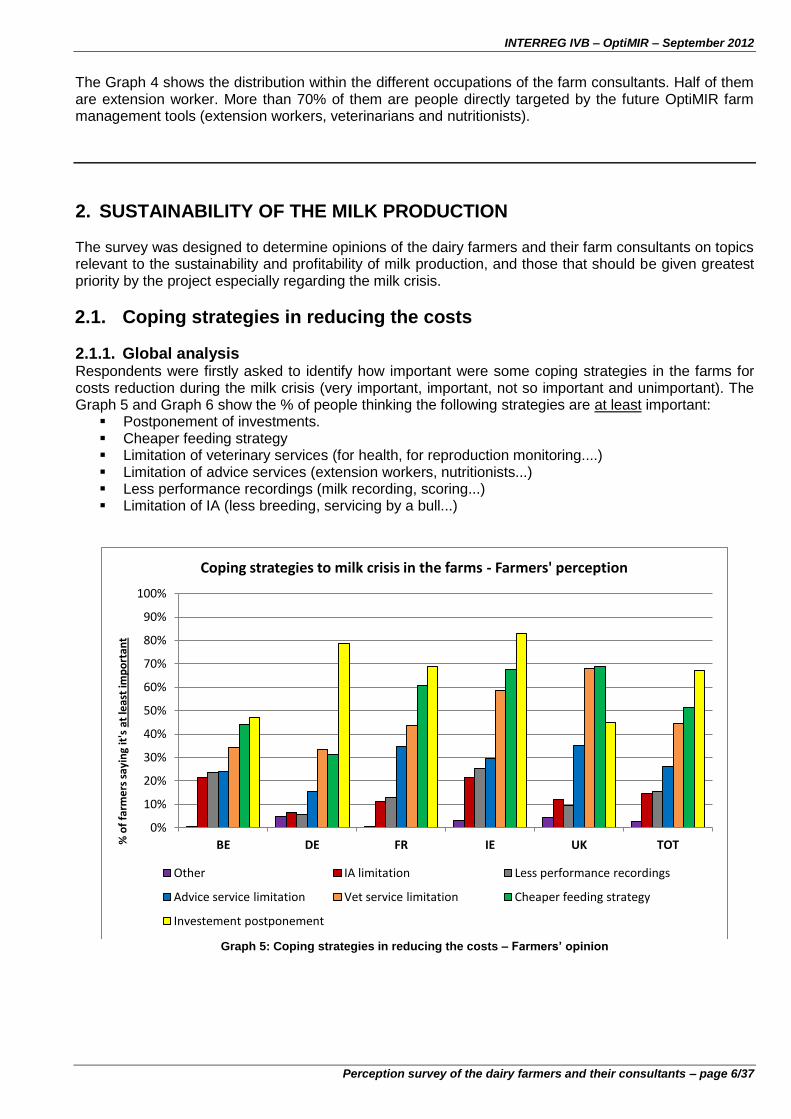
2.1. Coping strategies in reducing the costs
2.1.1. Global analysis Respondents were firstly asked to identify how important were some coping strategies in the farms for costs reduction during the milk crisis (very important, important, not so important and unimportant). The Graph 5 and Graph 6 show the % of people thinking the following strategies are at least important:
Postponement of investments. Cheaper feeding strategy Limitation of veterinary services (for health, for reproduction monitoring....) Limitation of advice services (extension workers, nutritionists...) Less performance recordings (milk recording, scoring...) Limitation of IA (less breeding, servicing by a bull...)
Graph 5: Coping strategies in reducing the costs – Farmers’ opinion
0%
10%
20%
30%
40%
50%
60%
70%
80%
90%
100%
BE DE FR IE UK TOT % o
f fa
rme
rs s
ayin
g it
's a
t le
ast
imp
ort
ant
Coping strategies to milk crisis in the farms - Farmers' perception
Other IA limitation Less performance recordings
Advice service limitation Vet service limitation Cheaper feeding strategy
Investement postponement

INTERREG IVB – OptiMIR – September 2012
Perception survey of the dairy farmers and their consultants – page 7/37
Graph 6: Coping strategies in reducing the costs – Consultants' opinion
During milk crisis the interest of having tools to manage the profitability is higher than ever. However when receipts are low farmers use to trim their sail. We must check which coping strategies could be obstacles or opportunities for the OptiMIR tools implementation and then turn the obstacles into challenges. 2.1.1.1. Postponement of investment Farmers and consultants agree with each other to indicate that the postponement of investment is obviously the most important strategy implemented in the farm when facing low selling prices of milk. We could say than that tools or services developed to help farmers to manage their profitability have therefore to be free or low cost to be adopted. UK is the only country where the postponement of investment is not the first coping strategy noticed by the farmers. 2.1.1.2. Performance recordings Fortunately very few farmers (±15%) told that the limitation of the performance recordings is an important coping strategy (±5% saying it’s very important). That keeps the door widely open for innovative management tools based on the Milk Recording service. However the limitation of recording is considered as more important in Belgium and Ireland where this issue is therefore more a challenge than in other countries for OptiMIR tools implementation. Consultants’ perception is a little bit different: ±30% saying it’s at least important which is double compared to farmers, but ±5% saying it’s very important, the same as farmers. They could simply display here bias as some of them are occupied in the performance recording services. 2.1.1.3. Advice services Around 25% of the farmers told that the limitation of advice services is at least an important coping strategy for them (less than 10% saying it’s very important). This amount can be considered as big because not all respondents use this type of service as opposed to Milk Recording for example. Web-applications used directly by the farmers and providing information for decision making cannot replace the advice given by e.g. an extension worker. Actually both are complementary and in fact that’s the reason why consultants are targeted by the tools too. However in the case a farmer decides to
0%
10%
20%
30%
40%
50%
60%
70%
80%
90%
100%
BE DE FR IE UK TOT
% o
f co
nsu
ltan
ts s
ayin
g it
's a
t le
ast
imp
ort
ant
Coping strategies to milk crisis in the farms - Consultants' perception
Other Less performance recordings IA limitation
Advice service limitation Vet service limitation Cheaper feeding strategy
Investement postponement

INTERREG IVB – OptiMIR – September 2012
Perception survey of the dairy farmers and their consultants – page 8/37
limit advice services it’s then more important than ever that he can access easily, quickly to free or low costs information to enable him to manage its business. The limitation of advice services is less a challenge in Germany than in other countries. It seems the remark about consultants’ perception is exactly the same than at 1.2.: ±45% saying it’s at least important which is almost double compared to farmers, but less than 10% saying it’s very important meaning the same than farmers. 2.1.1.4. Feeding Both farmers and consultants pointed the decrease of feeding costs as the second highest topics in reducing the costs (>50%). That means an opportunity: OptiMIR has a big room for manoeuvre on animal nutrition to help farmers to rationalize the feed ration in an appropriate way e.g. through indicators of cows’ energy balance or cows’ proteins utilization to enable the rationalization of concentrates’ purchases and optimization of grass and forages. 2.1.1.5. Veterinary service Both farmers and consultants pointed the limitation of veterinary service as the third highest topics in reducing the costs (±45%). In one hand that means opportunities but in the other hand that means challenges. This coping strategy is for example an opportunity for OptiMIR in the case of a pregnancy diagnosis that can help to reduce the number of sonograms or rectal explorations made by the veterinarians. In the opposite the limitation of vet service becomes a challenge e.g. in the case of a disease diagnosis requesting a prescription from the vet. 2.1.1.6. Artificial insemination (AI) Finally, only ±15% farmers told that the limitation of AI is at least an important coping strategy in reducing costs (±5% saying it’s very important). That’s clearly an opportunity for a tool such as an indicator of the ability to conceive to save money on AI straws. Consultants’ figure shows one more time the same bias: ±35% saying it’s at least important which is double compared to farmers, but less than 5% saying it’s very important meaning almost the same than farmers.

INTERREG IVB – OptiMIR – September 2012
Perception survey of the dairy farmers and their consultants – page 9/37
2.1.2. Detailed information
Graph 7: Strategies in reducing the costs - Answers of farmers from all countries
Graph 8: Strategies in reducing the costs - Answers of consultants from all countries
0%
10%
20%
30%
40%
50%
60%
70%
80%
90%
100%
Farmers from all countries - Milk crisis - How important are the strategies in reducing the costs?
Unimportant
Not so important
Important
Very important
0%
10%
20%
30%
40%
50%
60%
70%
80%
90%
100%
Consult. from all countries - Milk crisis - How important are the strategies in reducing the costs?
Unimportant
Not so important
Important
Very important
INTERREG IVB – OptiMIR – September 2012
Perception survey of the dairy farmers and their consultants – page 10/37
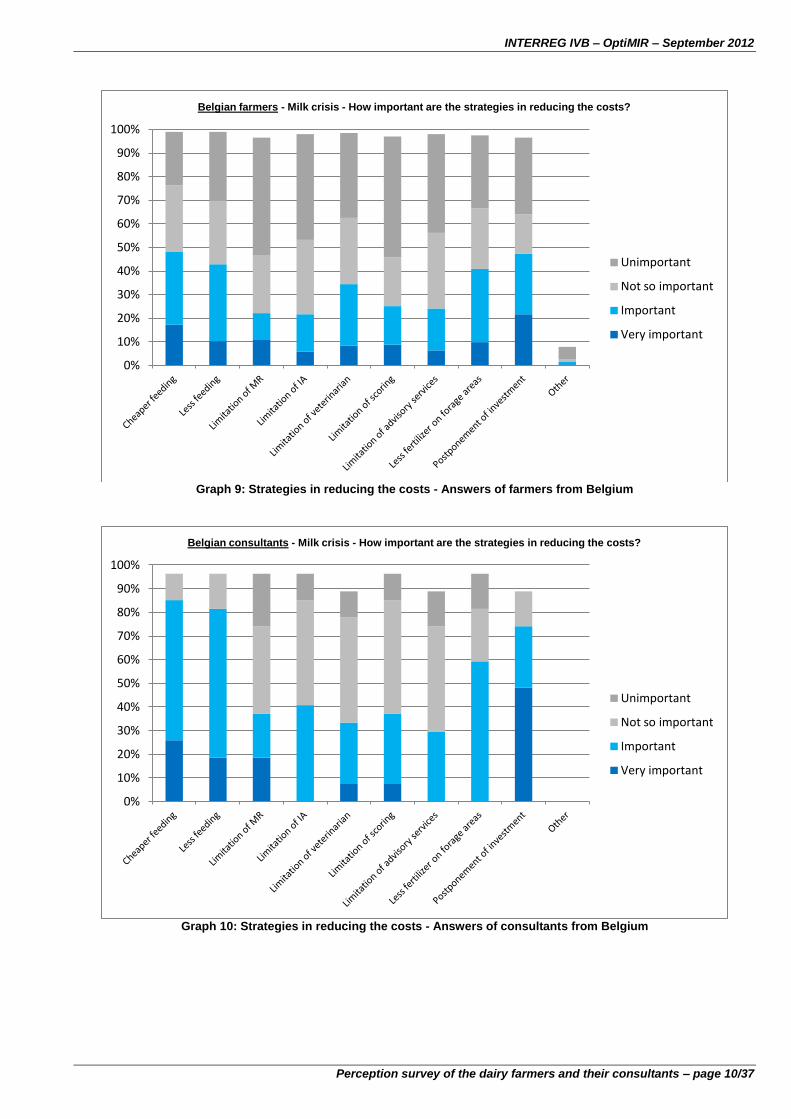
Graph 9: Strategies in reducing the costs - Answers of farmers from Belgium
Graph 10: Strategies in reducing the costs - Answers of consultants from Belgium
0%
10%
20%
30%
40%
50%
60%
70%
80%
90%
100%
Belgian farmers - Milk crisis - How important are the strategies in reducing the costs?
Unimportant
Not so important
Important
Very important
0%
10%
20%
30%
40%
50%
60%
70%
80%
90%
100%
Belgian consultants - Milk crisis - How important are the strategies in reducing the costs?
Unimportant
Not so important
Important
Very important

INTERREG IVB – OptiMIR – September 2012
Perception survey of the dairy farmers and their consultants – page 11/37
Graph 11: Strategies in reducing the costs - Answers of farmers from Germany
Graph 12: Strategies in reducing the costs - Answers of consultants from Germany
0%
10%
20%
30%
40%
50%
60%
70%
80%
90%
100%
German farmers - Milk crisis - How important are the strategies in reducing the costs?
Unimportant
Not so important
Important
Very important
0%
10%
20%
30%
40%
50%
60%
70%
80%
90%
100%
German consultants - Milk crisis - How important are the strategies in reducing the costs?
Unimportant
Not so important
Important
Very important

INTERREG IVB – OptiMIR – September 2012
Perception survey of the dairy farmers and their consultants – page 12/37
Graph 13: Strategies in reducing the costs - Answers of farmers from France
Graph 14: Strategies in reducing the costs - Answers of consultants from France
0%
10%
20%
30%
40%
50%
60%
70%
80%
90%
100%
French farmers - Milk crisis - How important are the strategies in reducing the costs?
Unimportant
Not so important
Important
Very important
0%
10%
20%
30%
40%
50%
60%
70%
80%
90%
100%
French consultants - Milk crisis - How important are the strategies in reducing the costs?
Unimportant
Not so important
Important
Very important
INTERREG IVB – OptiMIR – September 2012
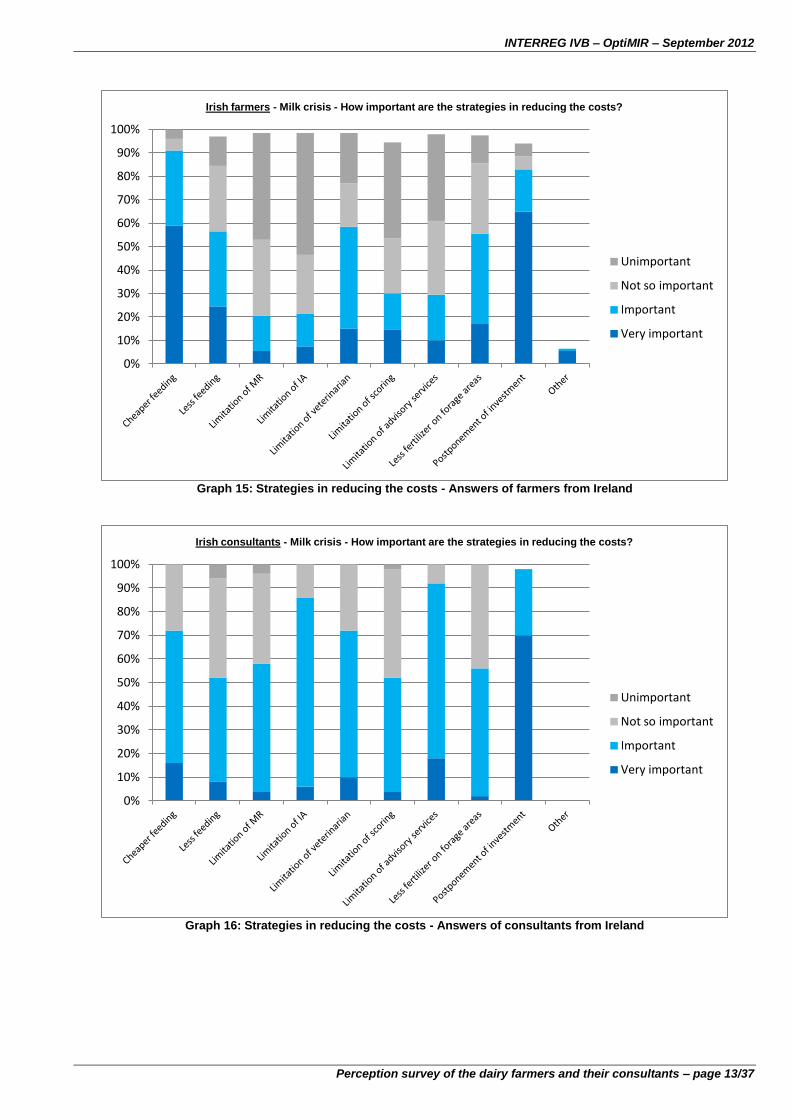
Perception survey of the dairy farmers and their consultants – page 13/37
Graph 15: Strategies in reducing the costs - Answers of farmers from Ireland
Graph 16: Strategies in reducing the costs - Answers of consultants from Ireland
0%
10%
20%
30%
40%
50%
60%
70%
80%
90%
100%
Irish farmers - Milk crisis - How important are the strategies in reducing the costs?
Unimportant
Not so important
Important
Very important
0%
10%
20%
30%
40%
50%
60%
70%
80%
90%
100%
Irish consultants - Milk crisis - How important are the strategies in reducing the costs?
Unimportant
Not so important
Important
Very important
INTERREG IVB – OptiMIR – September 2012
Perception survey of the dairy farmers and their consultants – page 14/37
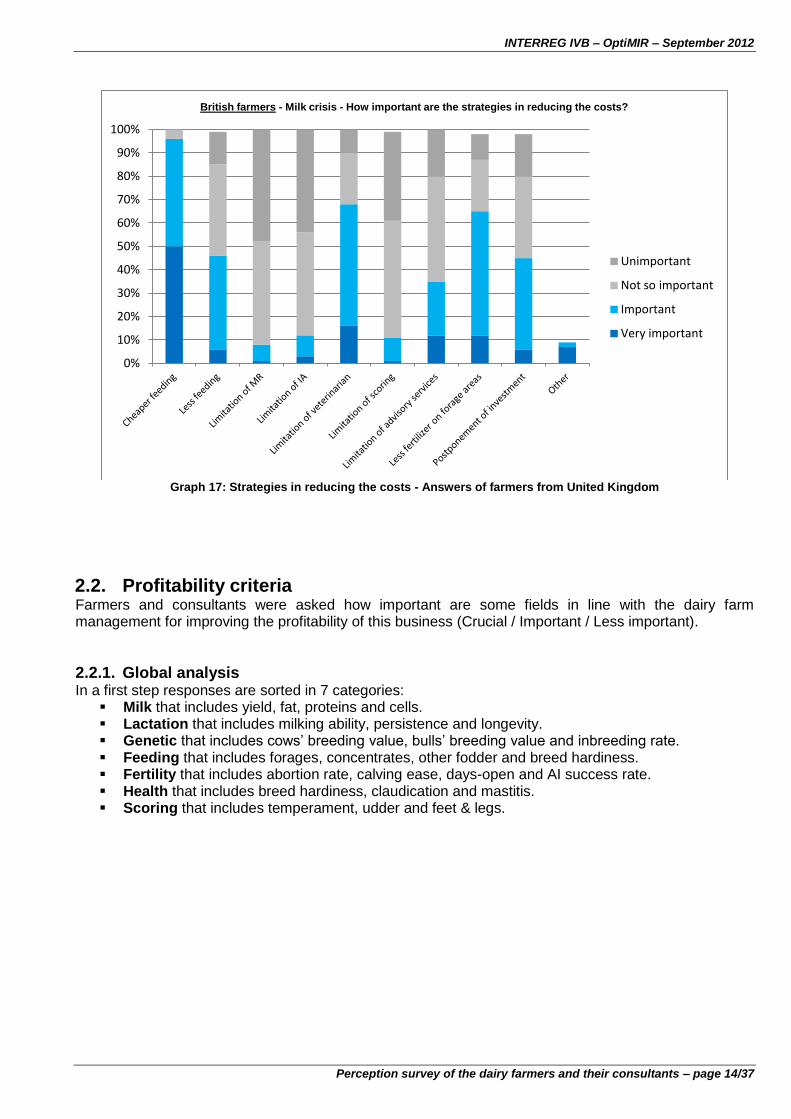
Graph 17: Strategies in reducing the costs - Answers of farmers from United Kingdom
2.2. Profitability criteria Farmers and consultants were asked how important are some fields in line with the dairy farm management for improving the profitability of this business (Crucial / Important / Less important).
2.2.1. Global analysis In a first step responses are sorted in 7 categories:
Milk that includes yield, fat, proteins and cells. Lactation that includes milking ability, persistence and longevity. Genetic that includes cows’ breeding value, bulls’ breeding value and inbreeding rate. Feeding that includes forages, concentrates, other fodder and breed hardiness. Fertility that includes abortion rate, calving ease, days-open and AI success rate. Health that includes breed hardiness, claudication and mastitis. Scoring that includes temperament, udder and feet & legs.
0%
10%
20%
30%
40%
50%
60%
70%
80%
90%
100%
British farmers - Milk crisis - How important are the strategies in reducing the costs?
Unimportant
Not so important
Important
Very important
INTERREG IVB – OptiMIR – September 2012
Perception survey of the dairy farmers and their consultants – page 15/37
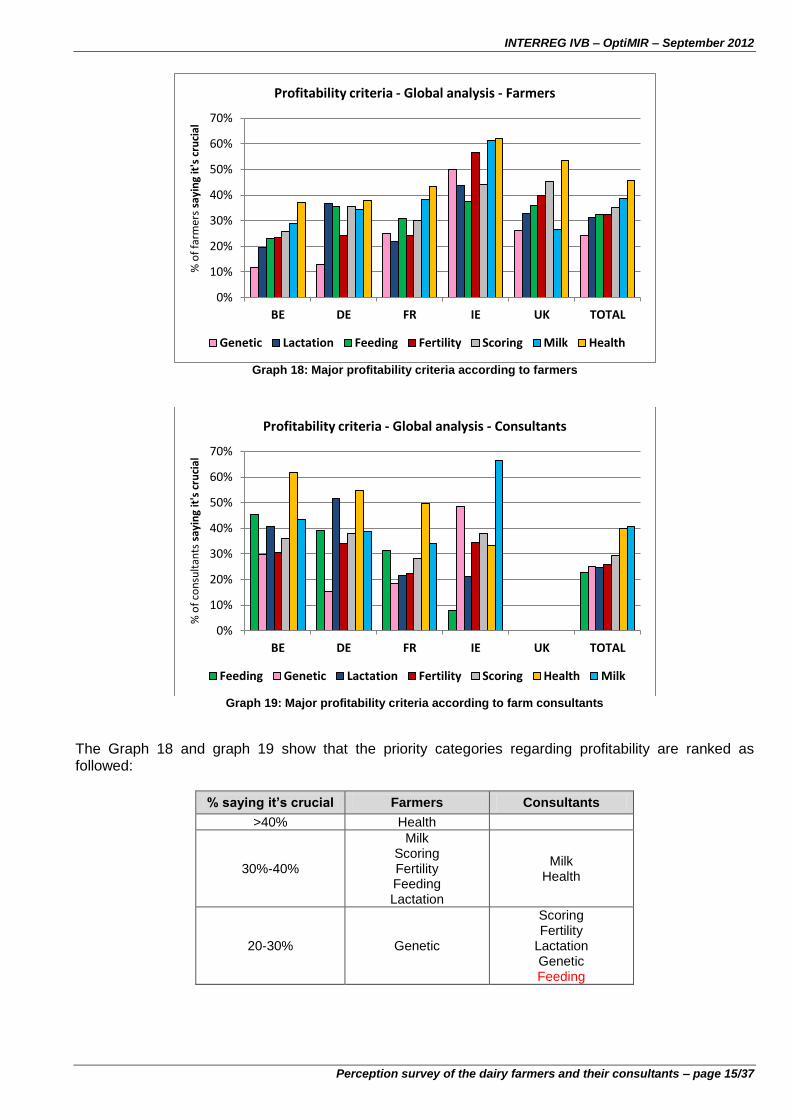
Graph 18: Major profitability criteria according to farmers
Graph 19: Major profitability criteria according to farm consultants
The Graph 18 and graph 19 show that the priority categories regarding profitability are ranked as followed:
% saying it’s crucial Farmers Consultants
>40% Health
30%-40%
Milk Scoring Fertility Feeding Lactation
Milk Health
20-30% Genetic
Scoring Fertility
Lactation Genetic Feeding
0%
10%
20%
30%
40%
50%
60%
70%
BE DE FR IE UK TOTAL
% o
f fa
rmer
s sa
yin
g it
's c
ruci
al
Profitability criteria - Global analysis - Farmers
Genetic Lactation Feeding Fertility Scoring Milk Health
0%
10%
20%
30%
40%
50%
60%
70%
BE DE FR IE UK TOTAL
% o
f co
nsu
ltan
ts s
ayin
g it
's c
ruci
al
Profitability criteria - Global analysis - Consultants
Feeding Genetic Lactation Fertility Scoring Health Milk

INTERREG IVB – OptiMIR – September 2012
Perception survey of the dairy farmers and their consultants – page 16/37
Farmers and consultants almost agree with each other on the ranking but surprisingly the consultants ranked animal feeding as the latest with less than one consultant out of four telling it’s crucial! Maybe the reason comes from their occupation: only 3.8% of nutritionists. Animal health appears as the first priority for the project. The second priority arising is the milk yield and quality. In fact lactation, genetic and scoring cannot be within the scope of the project which promotes the use of milk records for management purposes. The third priority for OptiMIR would be therefore composed of fertility and feeding topics. For fertility the research topics identified are: pregnancy, ability to conceive, cyclicity and embryo loss. For feeding there are energy balance and protein utilization.
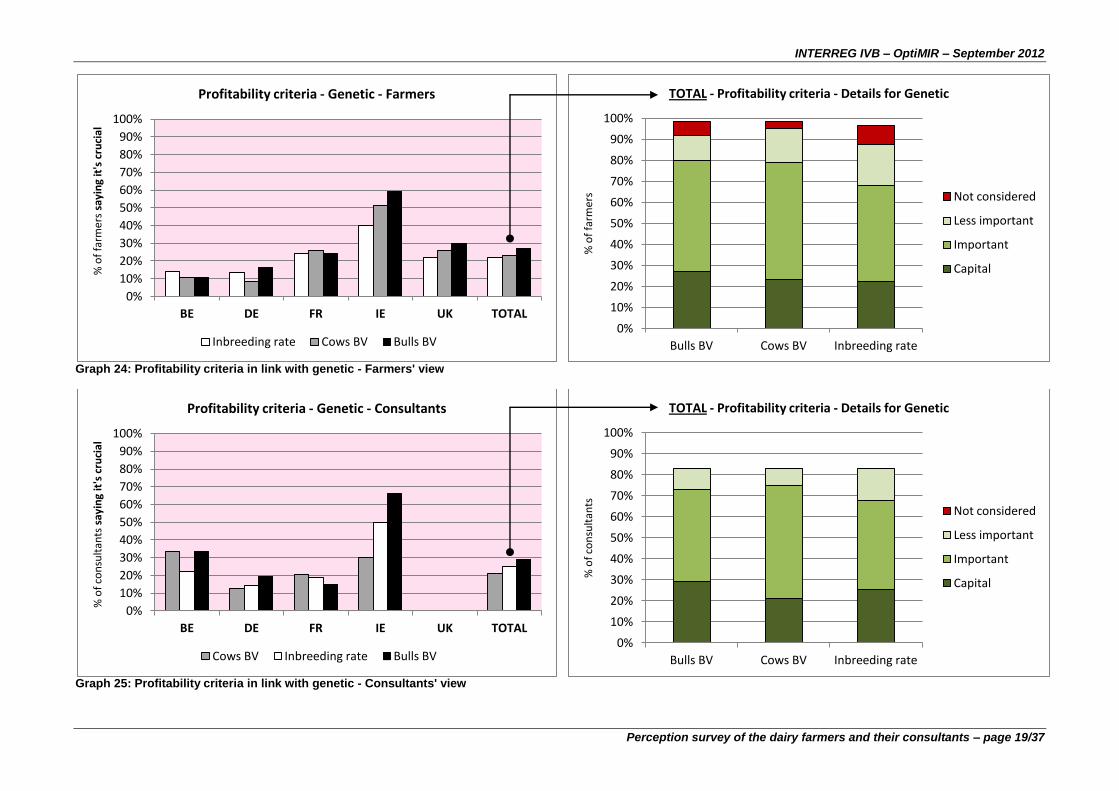
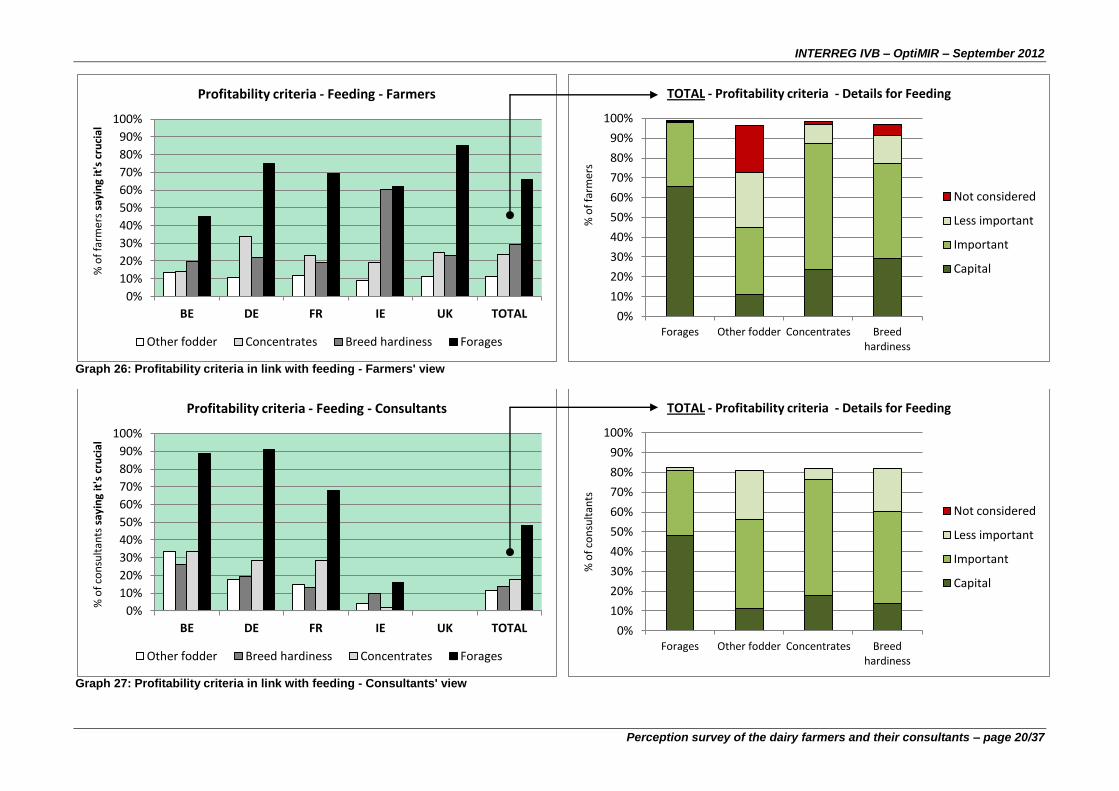
2.2.2. Detailed analysis In a second step we look inside each category to try to find priority topics (see Graphs 20 to 33). OptiMIR has several potential R&D topics related to health: mastitis, Sub-Acute Ruminal Acidosis (SARA), overall immune status and ketosis. Graph 19 and graph 20 show that mastitis is the first priority topic. The second one would be SARA which can cause claudication. For fertility the potential R&D topics identified are: cyclicity, ability to conceive, pregnancy, and embryo loss. Graph 17 and graph 18 show that AI success is the first priority topics. Cyclicity, ability to conceive and pregnancy are linked to the AI success respectively to get the period for insemination, to assess the chance of success and to check the success. Embryo loss (abortion) comes after. For feeding the potential R&D topics are Energy Balance (EB) and Protein Utilization (PU). According to Graphs 15 and 16 having EB and PU indicators should be used firstly to optimize the forages’ part in the feed ration: there is a total agreement on this! Then these indicators could secondly be used to rationalize the quantity of concentrates. About the milk category the milk yield is not within the scope of OptiMIR that aims to reach the profitability by focusing on reduced costs and increased income per litre. In the opposite the milk quality could be tackled by OptiMIR in two ways.
Indirectly through feeding, to answer current market expectations regarding milk value. Graphs 9 and 10 show that protein is obviously ahead fat for profitability but feeding will have more impact on fat. Cells issue is covered with current techniques.
Directly, to answer future market expectations in link with the price of milk by measuring specific quality traits and giving direction for management e.g. for methane emissions or regulated food label claims.

INTERREG IVB – OptiMIR – September 2012
Perception survey of the dairy farmers and their consultants – page 17/37
Graph 20: Profitability criteria in link with milk - Farmers' view
Graph 21: Profitability criteria in link with milk - Consultants' view
0%
10%
20%
30%
40%
50%
60%
70%
80%
90%
100%
BE DE FR IE UK TOTAL
% o
f fa
rmer
s sa
yin
g it
's c
ruci
al
Profitability criteria - Milk - Farmers
Fat Milk yield Cells Prot 0%
10%
20%
30%
40%
50%
60%
70%
80%
90%
100%
Milk yield Fat Protein Cells
% o
f fa
rmer
s
TOTAL - Profitability criteria - Details for Milk
Not considered
Less important
Important
Capital
0%
10%
20%
30%
40%
50%
60%
70%
80%
90%
100%
BE DE FR IE UK TOTAL
% o
f co
nsu
ltan
ts s
ayin
g it
's c
ruci
al
Profitability criteria - Milk - Consultants
Fat Prot Milk yield Cells 0%
10%
20%
30%
40%
50%
60%
70%
80%
90%
100%
Milk yield Fat Prot Cells
% o
f co
nsu
ltan
ts
TOTAL - Profitability criteria - Details for Milk
Not considered
Less important
Important
Capital
INTERREG IVB – OptiMIR – September 2012
Perception survey of the dairy farmers and their consultants – page 18/37
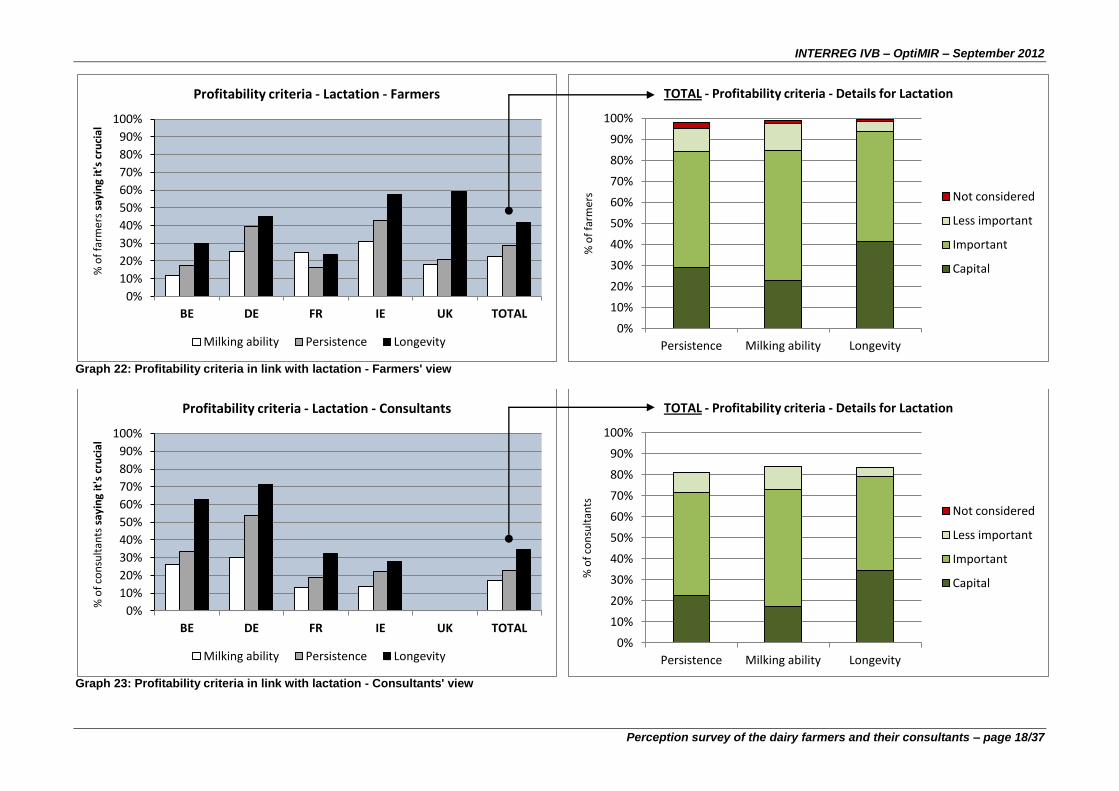
Graph 22: Profitability criteria in link with lactation - Farmers' view
Graph 23: Profitability criteria in link with lactation - Consultants' view
0%
10%
20%
30%
40%
50%
60%
70%
80%
90%
100%
BE DE FR IE UK TOTAL
% o
f fa
rmer
s sa
yin
g it
's c
ruci
al
Profitability criteria - Lactation - Farmers
Milking ability Persistence Longevity 0%
10%
20%
30%
40%
50%
60%
70%
80%
90%
100%
Persistence Milking ability Longevity
% o
f fa
rmer
s
TOTAL - Profitability criteria - Details for Lactation
Not considered
Less important
Important
Capital
0%
10%
20%
30%
40%
50%
60%
70%
80%
90%
100%
BE DE FR IE UK TOTAL
% o
f co
nsu
ltan
ts s
ayin
g it
's c
ruci
al
Profitability criteria - Lactation - Consultants
Milking ability Persistence Longevity 0%
10%
20%
30%
40%
50%
60%
70%
80%
90%
100%
Persistence Milking ability Longevity
% o
f co
nsu
ltan
ts
TOTAL - Profitability criteria - Details for Lactation
Not considered
Less important
Important
Capital
INTERREG IVB – OptiMIR – September 2012
Perception survey of the dairy farmers and their consultants – page 19/37
Graph 24: Profitability criteria in link with genetic - Farmers' view
Graph 25: Profitability criteria in link with genetic - Consultants' view
0%
10%
20%
30%
40%
50%
60%
70%
80%
90%
100%
BE DE FR IE UK TOTAL
% o
f fa
rmer
s sa
yin
g it
's c
ruci
al
Profitability criteria - Genetic - Farmers
Inbreeding rate Cows BV Bulls BV 0%
10%
20%
30%
40%
50%
60%
70%
80%
90%
100%
Bulls BV Cows BV Inbreeding rate
% o
f fa
rmer
s
TOTAL - Profitability criteria - Details for Genetic
Not considered
Less important
Important
Capital
0%
10%
20%
30%
40%
50%
60%
70%
80%
90%
100%
BE DE FR IE UK TOTAL
% o
f co
nsu
ltan
ts s
ayin
g it
's c
ruci
al
Profitability criteria - Genetic - Consultants
Cows BV Inbreeding rate Bulls BV 0%
10%
20%
30%
40%
50%
60%
70%
80%
90%
100%
Bulls BV Cows BV Inbreeding rate
% o
f co
nsu
ltan
ts
TOTAL - Profitability criteria - Details for Genetic
Not considered
Less important
Important
Capital
INTERREG IVB – OptiMIR – September 2012
Perception survey of the dairy farmers and their consultants – page 20/37
Graph 26: Profitability criteria in link with feeding - Farmers' view
Graph 27: Profitability criteria in link with feeding - Consultants' view
0%
10%
20%
30%
40%
50%
60%
70%
80%
90%
100%
BE DE FR IE UK TOTAL
% o
f fa
rmer
s sa
yin
g it
's c
ruci
al
Profitability criteria - Feeding - Farmers
Other fodder Concentrates Breed hardiness Forages
0%
10%
20%
30%
40%
50%
60%
70%
80%
90%
100%
Forages Other fodder Concentrates Breed hardiness
% o
f fa
rmer
s
TOTAL - Profitability criteria - Details for Feeding
Not considered
Less important
Important
Capital
0%
10%
20%
30%
40%
50%
60%
70%
80%
90%
100%
BE DE FR IE UK TOTAL
% o
f co
nsu
ltan
ts s
ayin
g it
's c
ruci
al
Profitability criteria - Feeding - Consultants
Other fodder Breed hardiness Concentrates Forages
0%
10%
20%
30%
40%
50%
60%
70%
80%
90%
100%
Forages Other fodder Concentrates Breed hardiness
% o
f co
nsu
ltan
ts
TOTAL - Profitability criteria - Details for Feeding
Not considered
Less important
Important
Capital

INTERREG IVB – OptiMIR – September 2012
Perception survey of the dairy farmers and their consultants – page 21/37
Graph 28: Profitability criteria in link with fertility - Farmers' view
Graph 29: Profitability criteria in link with fertility - Consultants' view
0%
10%
20%
30%
40%
50%
60%
70%
80%
90%
100%
BE DE FR IE UK TOTAL
% o
f fa
rmer
s sa
yin
g it
's c
ruci
al
Profitability criteria - Fertility - Farmers
Calving ease Abortion Days-open IA success 0%
10%
20%
30%
40%
50%
60%
70%
80%
90%
100%
Days-open IA success Calving ease Abortion
% o
f fa
rmer
s
TOTAL - Profitability criteria - Details for Fertility
Not considered
Less important
Important
Capital
0%
10%
20%
30%
40%
50%
60%
70%
80%
90%
100%
BE DE FR IE UK TOTAL
% o
f co
nsu
ltan
ts s
ayin
g it
's c
ruci
al
Profitability criteria - Fertility - Consultants
Abortion Calving ease Days-open IA success 0%
10%
20%
30%
40%
50%
60%
70%
80%
90%
100%
Days-open IA success Calving ease Abortion
% o
f co
nsu
ltan
ts
TOTAL - Profitability criteria - Details for Fertility
Not considered
Less important
Important
Capital

INTERREG IVB – OptiMIR – September 2012
Perception survey of the dairy farmers and their consultants – page 22/37
Graph 30: Profitability criteria in link with health - Farmers' view
Graph 31: Profitability criteria in link with health - Consultants' view
0%
10%
20%
30%
40%
50%
60%
70%
80%
90%
100%
BE DE FR IE UK TOTAL
% o
f fa
rmer
s sa
yin
g it
's c
apit
al
Profitability criteria - Health
Breed hardiness Claudication Mastitis 0%
10%
20%
30%
40%
50%
60%
70%
80%
90%
100%
Breed hardiness Mastitis Claudication
% o
f fa
rmer
s
TOTAL - Profitability criteria - Details for Health
Not considered
Less important
Important
Capital
0%
10%
20%
30%
40%
50%
60%
70%
80%
90%
100%
BE DE FR IE UK TOTAL
% o
f co
nsu
ltan
ts s
ayin
g it
's c
apit
al
Profitability criteria - Health
Breed hardiness Claudication Mastitis 0%
10%
20%
30%
40%
50%
60%
70%
80%
90%
100%
Breed hardiness Mastitis Claudication
% o
f co
nsu
ltan
ts
TOTAL - Profitability criteria - Details for Health
Not considered
Less important
Important
Capital

INTERREG IVB – OptiMIR – September 2012
Perception survey of the dairy farmers and their consultants – page 23/37
Graph 32: Profitability criteria in link with scoring - Farmers' view
Graph 33: Profitability criteria in link with scoring - Consultants' view
0%
10%
20%
30%
40%
50%
60%
70%
80%
90%
100%
BE DE FR IE UK TOTAL
% o
f fa
rmer
s sa
yin
g it
's c
apit
al
Profitability criteria - Animal scoring
Temperament Udder Feet & legs 0%
10%
20%
30%
40%
50%
60%
70%
80%
90%
100%
Udder Feet & legs Temperament
% o
f fa
rmer
s
TOTAL - Profitability criteria - Details for Animal scoring
Not considered
Less important
Important
Capital
0%
10%
20%
30%
40%
50%
60%
70%
80%
90%
100%
BE DE FR IE UK TOTAL
% o
f co
nsu
ltan
ts s
ayin
g it
's c
apit
al
Profitability criteria - Animal scoring
Temperament Udder Feet & legs 0%
10%
20%
30%
40%
50%
60%
70%
80%
90%
100%
Udder Feet & legs Temperament
% o
f co
nsu
ltan
ts
TOTAL - Profitability criteria - Details for Animal scoring
Not considered
Less important
Important
Capital
INTERREG IVB – OptiMIR – September 2012
Perception survey of the dairy farmers and their consultants – page 24/37
3. UTILIZATION OF FARM MANAGEMENT COMPUTERIZED TOOLS The survey was designed to have a baseline survey of the perception and utilization of computerized farm management tools by the dairy farmers (software on local or web applications).
3.1. Perception of computerized tools The dairy farmers and consultants where asked to give their opinion about the use of farm management tools. Actually they were invited to tell if the use of any type of agricultural software will increase or decrease:
The overall working time while beginner with the computerized tool (Graphs 34 and 35)
The overall working time while advanced user with the computerized tool (Graphs 36 and 37)
The awareness of the problems in the farm (Graphs 38 and 39)
The awareness of the opportunities in the farm (Graphs 40 and 41)
The profitability of the milk production business (Graphs 42 and 43) The goal is obviously to weight how the future potential users of the OptiMIR tools consider this type of tool within their management. Do they think it can be somewhat useful or somewhat useless? Would adoption rate of new computerized tool be somewhat high or somewhat low in the different area?
3.1.1. Working time
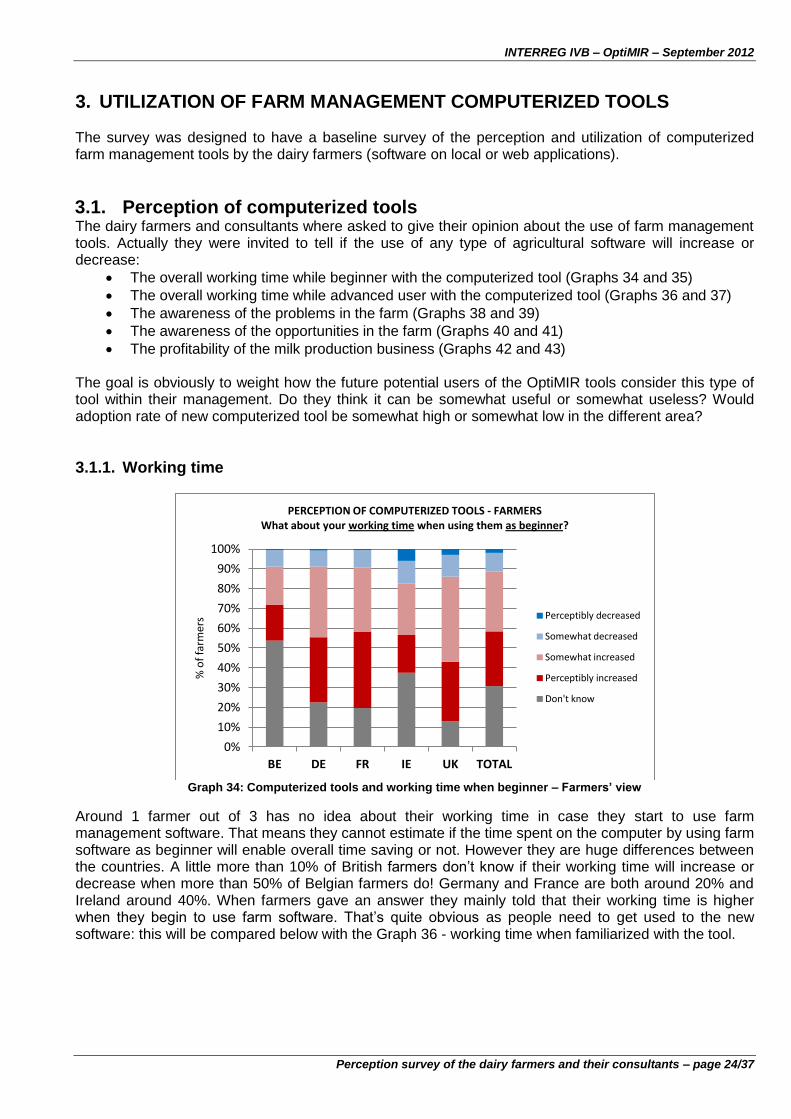
Graph 34: Computerized tools and working time when beginner – Farmers’ view
Around 1 farmer out of 3 has no idea about their working time in case they start to use farm management software. That means they cannot estimate if the time spent on the computer by using farm software as beginner will enable overall time saving or not. However they are huge differences between the countries. A little more than 10% of British farmers don’t know if their working time will increase or decrease when more than 50% of Belgian farmers do! Germany and France are both around 20% and Ireland around 40%. When farmers gave an answer they mainly told that their working time is higher when they begin to use farm software. That’s quite obvious as people need to get used to the new software: this will be compared below with the Graph 36 - working time when familiarized with the tool.
0%
10%
20%
30%
40%
50%
60%
70%
80%
90%
100%
BE DE FR IE UK TOTAL
% o
f fa
rmer
s
PERCEPTION OF COMPUTERIZED TOOLS - FARMERS What about your working time when using them as beginner?
Perceptibly decreased
Somewhat decreased
Somewhat increased
Perceptibly increased
Don't know

INTERREG IVB – OptiMIR – September 2012
Perception survey of the dairy farmers and their consultants – page 25/37
Graph 35: Computerized tools and working time when beginner – Consultants’ view
Consultants’ answers are very different as half of them told they don’t know. There are no big differences between countries. If we compare with the Graph 37 - working time when familiarized with the tool – the explanation seems clear: consultants considered themselves as advanced users and that’s certainly why they just told they don’t know about beginners. Consultants who provided an opinion mainly declared that the working time is increased when starting to use farm software but not so much. They surely consider here the time to get used with the tool.
Graph 36: Computerized tools and working time when familiarized – Farmers’ view
Around 1 farmer out of 3 has still no idea about their overall working time when using farm software for a moment. They cannot estimate if the time spent on the computer will enable overall time saving or not whatever if they are beginner or advanced user. The differences between countries remain the same. By looking at farmers giving an answer we can say roughly that half of them told that they will save working time while the other half told the opposite but Irish farmers seem to be less optimistic than others. The feeling of farmers is an opportunity for OptiMIR tools: as soon as they got used with a computerized tool half of French, German and British farmers think the overall working time will decrease, meaning they feel that this type of tool helps to save time. Irish farmers mainly think the opposite and Belgian farmers especially don’t know.
0%
10%
20%
30%
40%
50%
60%
70%
80%
90%
100%
BE DE FR IE UK TOTAL
% o
f co
nsu
ltan
ts
PERCEPTION OF COMPUTERIZED TOOLS - CONSULTANTS What about your working time when using them as beginner?
Perceptibly decreased
Somewhat decreased
Somewhat increased
Perceptibly increased
Don't know
0%
10%
20%
30%
40%
50%
60%
70%
80%
90%
100%
BE DE FR IE UK TOTAL
% o
f fa
rmer
s
PERCEPTION OF COMPUTERIZED TOOLS - FARMERS What about your working time when using them as familiarized user?
Perceptibly decreased
Somewhat decreased
Somewhat increased
Perceptibly increased
Don't know

INTERREG IVB – OptiMIR – September 2012
Perception survey of the dairy farmers and their consultants – page 26/37
Graph 37: Computerized tools and working time when familiarized – Consultants’ view
The conclusion for the consultants from all the countries is the same. Roughly half of them told that they will save working time while the other half told the opposite. However there are big differences between the countries. In France and especially in Germany they are very optimistic regarding the saving of time with computerized tools, in Belgium they are more mixed and in Ireland more than 90% of them think the working time is increased with computerized tools. We must therefore look below in Graph 43 what Irish people think about their profitability when using computerized tool to check if their perception is an obstacle for OptiMIR tools implementation. We will also look if they use more or less this type of tools than in other areas.
3.1.2. Awareness
Graph 38: Computerized tools and awareness of problems - Farmers' view
Farmers mainly told that they will increase their awareness of some problems in their herd by using computerized tools. This is an opportunity for OptiMIR. We can notice that one more time more than 50% of Belgian farmers told they simply don’t know.
0%
10%
20%
30%
40%
50%
60%
70%
80%
90%
100%
BE DE FR IE UK TOTAL
% o
f fa
rmer
s
PERCEPTION OF COMPUTERIZED TOOLS - CONSULTANTS What about your working time when using them as familiarized user?
Perceptibly decreased
Somewhat decreased
Somewhat increased
Perceptibly increased
Don't know
0%
10%
20%
30%
40%
50%
60%
70%
80%
90%
100%
BE DE FR IE UK TOTAL
% o
f fa
rmer
s
PERCEPTION OF COMPUTERIZED TOOLS - FARMERS What about your awareness of problems when using them ?
Perceptibly decreased
Somewhat decreased
Somewhat increased
Perceptibly increased
Don't know

INTERREG IVB – OptiMIR – September 2012
Perception survey of the dairy farmers and their consultants – page 27/37
Graph 39: Computerized tools and awareness of problems - Consultants' view
Consultants roughly agree with farmers but more consultants know what to answer compared to farmers.
Graph 40: Computerized tools and awareness of opportunities - Farmers' view
Farmers mainly told that they will increase their awareness of opportunities in their herd by using computerized tools. This is an opportunity for OptiMIR. However, the number of farmers who don’t know is lower for awareness of problems, especially in France, meaning they could think computerized tools are especially useful to correct a bad situation. Belgium is as usual very high regarding farmers who don’t know.
0%
10%
20%
30%
40%
50%
60%
70%
80%
90%
100%
BE DE FR IE UK TOTAL
% o
f co
nsu
ltan
ts
PERCEPTION OF COMPUTERIZED TOOLS - CONSULTANTS What about your awareness of problems when using them ?
Perceptibly decreased
Somewhat decreased
Somewhat increased
Perceptibly increased
Don't know
0%
10%
20%
30%
40%
50%
60%
70%
80%
90%
100%
BE DE FR IE UK TOTAL
% o
f fa
rmer
s
PERCEPTION OF COMPUTERIZED TOOLS - FARMERS What about your awareness of opportunities when using them ?
Perceptibly decreased
Somewhat decreased
Somewhat increased
Perceptibly increased
Don't know

INTERREG IVB – OptiMIR – September 2012
Perception survey of the dairy farmers and their consultants – page 28/37
Graph 41: Computerized tools and awareness of opportunities - Consultants' view
The conclusion is the same with the consultants, including for France concerning awareness of problems. More consultants know what to answer compared to farmers.
3.1.3. Profitability Around 40% of farmers told they don’t know if computerized tools can help them to increase the profitability and therefore to sustain their business: from 60% for Belgian farmers to 30% for Irish farmers. Good news for OptiMIR as the main part of farmers giving an answer told the profitability will increase. No need to convince them. The main part of Irish farmers thinks their working time will increase with farm software, but it’s balanced with the increase of profitability. Figures for consultants show the same conclusion with less people who don’t know.
0%
10%
20%
30%
40%
50%
60%
70%
80%
90%
100%
BE DE FR IE UK TOTAL
% o
f co
nsu
ltan
ts
PERCEPTION OF COMPUTERIZED TOOLS - CONSULTANTS What about your awareness of opportunities when using them ?
Perceptibly decreased
Somewhat decreased
Somewhat increased
Perceptibly increased
Don't know

INTERREG IVB – OptiMIR – September 2012
Perception survey of the dairy farmers and their consultants – page 29/37
Graph 42: Computerized tools and profitability - Farmers' view
Graph 43: Computerized tools and profitability - Consultants' view
0%
10%
20%
30%
40%
50%
60%
70%
80%
90%
100%
BE DE FR IE UK TOTAL
% o
f fa
rmer
s PERCEPTION OF COMPUTERIZED TOOLS - FARMERS
What about your profitability when using them ?
Perceptibly decreased
Somewhat decreased
Somewhat increased
Perceptibly increased
Don't know
41.7%
18.2%
37.3%
2.1% 0.8%
PERCEPTION OF COMPUTERIZED TOOLS Farmers from all countries - Profitability
Don't know
Perceptibly increased
Somewhat increased
Somewhat decreased
Perceptibly decreased
0%
10%
20%
30%
40%
50%
60%
70%
80%
90%
100%
BE DE FR IE UK TOTAL
% o
f co
nsu
ltan
ts
PERCEPTION OF COMPUTERIZED TOOLS - CONSULTANTS What about your profitability when using them ?
Perceptibly decreased
Somewhat decreased
Somewhat increased
Perceptibly increased
Don't know
20.4%
28.0%
48.9%
1.6% 1.1%
PERCEPTION OF COMPUTERIZED TOOLS Consultants from all countries - Profitability
Don't know
Perceptibly increased
Somewhat increased
Somewhat decreased
Perceptibly decreased

INTERREG IVB – OptiMIR – September 2012
Perception survey of the dairy farmers and their consultants – page 30/37
3.2. Utilisation of computerized tools The dairy farmers and consultants were asked the following questions:
Do they have a computer and an Internet connection?
If yes, do they use farm management tools on local or through the web?
If yes, for recording and following-up of cows and herd data, for decision making, or for economic purposes?
Recording and following-up of cows and herd data is more related to the past and present, and includes:
Animal data like age, lactation number, pedigree, etc.
Milk data like yield, fat, protein, peak, etc.
Reproduction data like AI, pregnancy diagnosis, heats, abortion, etc.
Health data like diseases and treatments applied.
Other data Decision making is more related to present and future, and includes a couple of indicators to guide the management of fertility (e.g. heats calendar), breeding (e.g. mating advice), health (e.g. cells score), feeding (e.g. fat to protein ratio) and others.
3.2.1. Global analysis
Graph 44: Utilisation of computerized tools by farmers
Graph 45: Utilisation of computerized tools by consultants
0%
10%
20%
30%
40%
50%
60%
70%
80%
90%
100%
BE DE FR IE UK TOTAL
% o
f fa
rmer
s sa
yin
g ye
s
UTILISATION OF COMPUTERIZED TOOLS - FARMERS
Use farm software(s) on local
Use farm web-application(s)
Have computer
Have Internet access
0%
10%
20%
30%
40%
50%
60%
70%
80%
90%
100%
BE DE FR IE UK TOTAL
% o
f co
nsu
ltan
ts s
ayin
g ye
s
UTILISATION OF COMPUTERIZED TOOLS - CONSULTANTS
Use farm software(s) on local
Use farm web-application(s)
Have computer
Have Internet access

INTERREG IVB – OptiMIR – September 2012
Perception survey of the dairy farmers and their consultants – page 31/37
Around 90% of the farmers from all the countries have a computer and 60% of them use farm software on local. That means 2 farmers out of 3 who have computer use farm software on local. 100% of the consultants have a computer and around 90% of them use farm software on local (a little bit more for Ireland and France, a little bit less for Belgium and Germany). That means the future potential users of the OptiMIR tools are mainly familiarized with computerized tools: this is an opportunity for the project. Almost all the people who have a computer have also an Internet access. However the use of farm web application is less than the use of farm software on local, except in Ireland where both farmers and consultants seem to be familiarized with the use of web tools. The implementation of OptiMIR tools and familiarization by users should be easy in UK and Ireland where respectively 60% and 70% of the farmers already use web-application (100% for Irish consultants). In the opposite it could be a challenge in Belgium and Germany especially with farmers, and in France especially with consultants (±25% of them using web application). It’s amazing that the % of French farmers using web tools is higher than for consultants. On the whole North West Europe area, ±40% of farmers and ±65% of consultants are already familiarized with computerized tools through Internet: the opportunity for the project is therefore confirmed.
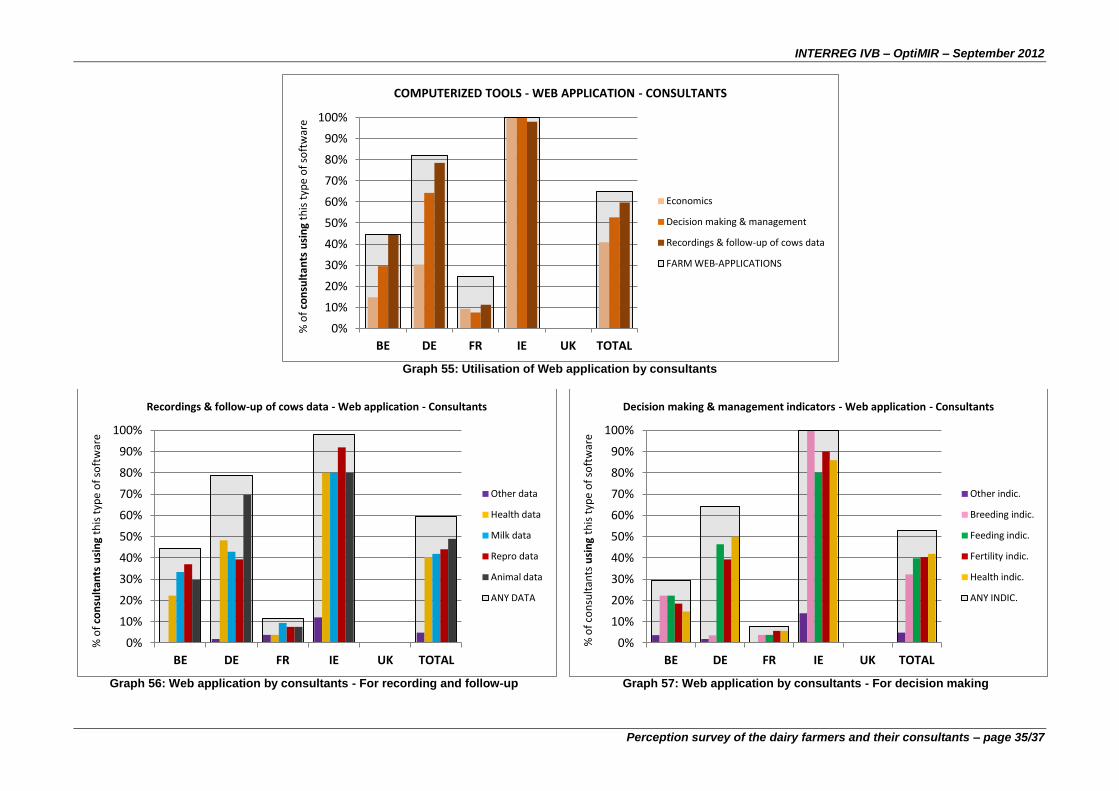
3.2.2. Detailed analysis A very high rate of farmers and consultants using farm software on local or through Internet does it to record and follow-up cows and herd data. That’s expectable as all farmers are members of a Milk Recording Organization (see Graphs 46 and 49). So farmers monitor mainly the animal data, milk production and reproduction information (see Graphs 47 and 53). That’s an opportunity for the Fertility Research Group of OptiMIR who have to couple this type of data with spectra to develop fertility tools based on MIR. In the opposite only 1 farmer out of 3 tells he records health data. That’s a challenge for OptiMIR because health data have to be coupled with spectrum within the frame of the Health Research Group. The feeding of the transnational database with health data is more complicated than with reproduction data, meaning less opportunity for health tools development than for fertility tools. Consultants roughly told the same but obviously with more interest for health. When decision making tools are used by farmers they are mainly for fertility. Breeding, feeding and health issues come after. Consultants are less interested by breeding (see Graphs 48, 51, 54 and 57). German farmers appreciate especially feeding advices: that’s coherent with the fact that Hohenheim University leads the Nutrition Research Group. On all the points it seems Ireland is on the lead with computerized tools. That’s coherent with the fact that ICBF leads the IT Working group. The core business of OptiMIR is web-applications for decision making. The current rate of utilization of such tools by the farmers is less than 30% in the whole project (see Graph 54). However the differences are important between the countries. In Belgium and Germany the rate is poor (<15%). The door is there widely open for OptiMIR tools (no competition) and the challenge will be more to convince the farmers to use web application. In Ireland the rate is very high (>50%) and in UK it’s high (>35%). In those 2 countries farmers would be convinced more easily by web application but OptiMIR have to bring added value compared to what they already use. France is just between. The current rate of utilization of decision making web applications by the consultants is slightly different. Irish rate is still the highest with an amazing 100% but Germany is now second with more than 60%. Belgium rate is doubled which is quite logical. France rate is surprisingly very low (<10%) while 25% of the farmers declare to use this type of tools: maybe French farmers manage the web application by themselves without consultants’ support.

INTERREG IVB – OptiMIR – September 2012
Perception survey of the dairy farmers and their consultants – page 32/37
Graph 46: Utilisation of on local software by farmers
Graph 47: On local software by farmers - For recording and follow-up
Graph 48: On local software by farmers - For decision making
0%
10%
20%
30%
40%
50%
60%
70%
80%
BE DE FR IE UK TOTAL
% o
f fa
rmer
s u
sin
g th
is t
ype
of
soft
war
e
COMPUTERIZED TOOLS - ON LOCAL - FARMERS
Economics
Decision making & management
Recordings & follow-up of cows data
FARM SOFTWARES ON LOCAL
0%
10%
20%
30%
40%
50%
60%
70%
80%
BE DE FR IE UK TOTAL
% o
f fa
rmer
s u
sin
g th
is t
ype
of
soft
war
e
Recordings & follow-up of cows data - On local - Farmers
Other data
Health data
Repro data
Milk data
Animal data
ANY DATA
0%
10%
20%
30%
40%
50%
60%
70%
BE DE FR IE UK TOTAL
% o
f fa
rmer
s u
sin
g th
is t
ype
of
soft
war
e
Decision making & management indicators - On local - Farmers
Other indic.
Health indic.
Feeding indic.
Breeding indic.
Fertility indic.
ANY INDIC.

INTERREG IVB – OptiMIR – September 2012
Perception survey of the dairy farmers and their consultants – page 33/37
Graph 49: Utilisation of on local software by consultants
Graph 50: On local software by consultants - For recording and follow-up
Graph 51: On local software by farmers - For decision making
0%
10%
20%
30%
40%
50%
60%
70%
80%
90%
100%
BE DE FR IE UK TOTAL
% o
f co
nsu
ltan
ts u
sin
g th
is t
ype
of
soft
war
e
COMPUTERIZED TOOLS - ON LOCAL - CONSULTANTS
Economics
Decision making & management
Recordings & follow-up of cows data
FARM SOFTWARES ON LOCAL
0%
10%
20%
30%
40%
50%
60%
70%
80%
90%
100%
BE DE FR IE UK TOTAL
% o
f co
nsu
ltan
ts u
sin
g th
is t
ype
of
soft
war
e
Recordings & follow-up of cows data - On local - Consultants
Other data
Health data
Animal data
Repro data
Milk data
ANY DATA
0%
10%
20%
30%
40%
50%
60%
70%
80%
90%
100%
BE DE FR IE UK TOTAL
% o
f co
nsu
ltan
ts u
sin
g th
is t
ype
of
soft
war
e
Decision making & management indicators - On local - Consultants
Other indic.
Breeding indic.
Health indic.
Fertility indic.
Feeding indic.
ANY INDIC.

INTERREG IVB – OptiMIR – September 2012
Perception survey of the dairy farmers and their consultants – page 34/37
Graph 52: Utilisation of Web application by farmers
Graph 53: Web application by farmers - For recording and follow-up
Graph 54: Web application by farmers - For decision making
0%
10%
20%
30%
40%
50%
60%
70%
80%
90%
100%
BE DE FR IE UK TOTAL
% o
f fa
rmer
s u
sin
g th
is t
ype
of
soft
war
e
COMPUTERIZED TOOLS - WEB APPLICATION - FARMERS
Economics
Decision making & management
Recordings & follow-up of cows data
FARM WEB-APPLICATIONS
0%
10%
20%
30%
40%
50%
60%
70%
80%
90%
100%
BE DE FR IE UK TOTAL
% o
f fa
rmer
s u
sin
g th
is t
ype
of
soft
war
e
Recordings & follow-up of cows data - Web application - Farmers
Other data
Health data
Repro data
Animal data
Milk data
ANY DATA
0%
10%
20%
30%
40%
50%
60%
70%
80%
90%
100%
BE DE FR IE UK TOTAL
% o
f fa
rmer
s u
sin
g th
is t
ype
of
soft
war
e
Decision making & management indicators - Web application - Farmers
Other indic.
Feeding indic.
Health indic.
Breeding indic.
Fertility indic.
ANY INDIC.
INTERREG IVB – OptiMIR – September 2012
Perception survey of the dairy farmers and their consultants – page 35/37
Graph 55: Utilisation of Web application by consultants
Graph 56: Web application by consultants - For recording and follow-up
Graph 57: Web application by consultants - For decision making
0%
10%
20%
30%
40%
50%
60%
70%
80%
90%
100%
BE DE FR IE UK TOTAL
% o
f co
nsu
ltan
ts u
sin
g th
is t
ype
of
soft
war
e
COMPUTERIZED TOOLS - WEB APPLICATION - CONSULTANTS
Economics
Decision making & management
Recordings & follow-up of cows data
FARM WEB-APPLICATIONS
0%
10%
20%
30%
40%
50%
60%
70%
80%
90%
100%
BE DE FR IE UK TOTAL
% o
f co
nsu
ltan
ts u
sin
g th
is t
ype
of
soft
war
e
Recordings & follow-up of cows data - Web application - Consultants
Other data
Health data
Milk data
Repro data
Animal data
ANY DATA
0%
10%
20%
30%
40%
50%
60%
70%
80%
90%
100%
BE DE FR IE UK TOTAL
% o
f co
nsu
ltan
ts u
sin
g th
is t
ype
of
soft
war
e
Decision making & management indicators - Web application - Consultants
Other indic.
Breeding indic.
Feeding indic.
Fertility indic.
Health indic.
ANY INDIC.

INTERREG IVB – OptiMIR – September 2012
Perception survey of the dairy farmers and their consultants – page 36/37
4. CONCLUSION All along this conclusion obstacles and opportunities for the OptiMIR tools are summarized. Highlighted opportunities should be used relevantly in project implementation, especially if some opportunities noticed in one country can help in others. Obstacles have to be turn into challenges. About the farm typology we can tell that France, Germany and Belgium are quite similar. Ireland is different, with more cows to fill the quota and grasslands. UK has bigger farm with less cow food self-sufficiency. The postponement of investment is the most important strategy implemented in the farm when facing low selling prices of milk, except in UK. OptiMIR tools have therefore to be free or low cost to be adopted. Very few farmers told that the limitation of the performance recordings is an important coping strategy. That keeps the door widely open for innovative management tools based on the Milk Recording service. However the limitation of recording is a little bit more important in Belgium and Ireland. One farmers out of four told that the limitation of advice services is at least an important coping strategy. If farmers decides to limit advice services from extension workers it’s then more important than ever that they can access easily, quickly to free or low costs information to enable a relevant management through e.g. OptiMIR tools. In Germany the limitation of advice services is lower. Both farmers and consultants pointed the decrease of feeding costs as the second highest topics in reducing the costs. OptiMIR has a big room for manoeuvre on animal nutrition to help farmers to rationalize the feed ration e.g. through indicators of cows’ energy balance or cows’ proteins utilization to enable the rationalization of concentrates’ purchases and optimization of grass and forages. Both farmers and consultants pointed the limitation of veterinary service as the third highest topics in reducing the costs. It could be an opportunity for OptiMIR in the case e.g. of a pregnancy diagnosis (decrease of sonograms or rectal explorations). It could be a challenge e.g. in the case of a disease diagnosis requesting a prescription from the vet. Finally, the limitation of AI is not an important coping strategy. That’s clearly an opportunity for a tool such as an indicator of the ability to conceive to save money on AI straws. Outcomes regarding profitability criteria given by dairy farmers and consultants are as followed:
Priority Category Sub-priority Topics identified for OptiMIR
1 Health 1 Mastitis indicator
2 Sub-Acute Ruminal Acidosis indicator
2 Milk 1 Feeding management to improve fat (and maybe protein) rate
Methane indicator
3 Feeding 1 Energy Balance and Protein Utilization to optimize forages
2 Energy Balance and Protein Utilization to rationalize concentrates
4 Fertility 1
Pregnancy diagnosis
Ability to conceive indicator
Cyclicity indicator
2 Embryo loss indicator
INTERREG IVB – OptiMIR – September 2012
Perception survey of the dairy farmers and their consultants – page 37/37
As soon as people got used with a computerized tool half of French, German and British think the overall working time will decrease, meaning they feel that this type of tool helps to save time. Irish farmers mainly think exactly the opposite and Belgian farmers especially don’t know. It’s here interesting to notice that Ireland shows the highest rate of computerized tools utilization while Belgium shows the lowest one. That means perhaps French, German and British perception is wrong, or the way they use the tools is different than in Ireland. We should be careful to this. Farmers and consultants mainly told that they will increase their awareness of opportunities in their herd by using computerized tools. The number of farmers who don’t know is lower for awareness of problems, especially in France, meaning they could think computerized tools are especially useful to correct a bad situation. Belgium is high regarding farmers who don’t know. 40% of farmers told they don’t know if computerized tools can help them to increase the profitability: from 60% for Belgium to 30% for Ireland. Fortunately the main part of farmers giving an answer told the profitability will increase. No need to convince them. The potential increase of working time, if some, could be balanced by the increase of profitability. Future potential users of the OptiMIR tools are mainly familiarized with computerized tools. Almost all the people who have a computer have also an Internet access. However the use of farm web application is lower than farm software on local, except in Ireland where both farmers and consultants seem to be familiarized with the use of web tools. Belgium rate for web tools utilization by farmers and consultants is low; France rate is low for consultants but not for farmers; Germany rate is low for famers but not for consultants. The implementation of OptiMIR tools and the familiarization by users should be the easiest in UK and Ireland. The core business of OptiMIR is web-applications for decision making. The current rate of utilization of such tools by the farmers is less than 15% in Belgium and Germany. There the challenge is to convince the farmers to use web application. In Ireland and UK the rate is respectively more than 50% and 35%. In those 2 countries farmers would be convinced more easily by web application but OptiMIR have to bring added value compared to what they already use. France is just between.