Embed Size (px)
Citation preview
1
16 May 2011
Perception of relative depth interval: systematic biases in perceived
depth
Harris1, *, J.M., Chopin1,2, A., Zeiner1, K.M., Hibbard1, P.B.
Quarterly Journal of Experimental Psychology: IN PRESS
Please do not cite or quote without our permission.
1: Vision Lab, School of Psychology, University of St. Andrews, Scotland, UK.
2: Laboratoire Psychologie de la Perception, Université Paris Descartes & CNRS, France
* Corresponding author. Vision Lab, School of Psychology, University of St. Andrews, South
St., St. Andrews, KY16 9JP, Scotland, UK. Tel: +44-1334-462061. Fax: +44-1334-463042.
email: [email protected]
Short title: Biases in depth interval perception
2
Abstract
Given an estimate of the binocular disparity between a pair of points, and an estimate of the
viewing distance, or knowledge of eye position, it should be possible to obtain an estimate of
their depth separation. Here we show that, when points are arranged in different vertical
geometric configurations across two intervals, many observers find this task difficult. Those
who can do the task, tend to perceive the depth interval in one configuration as very different
from depth in the other configuration. We explore two plausible explanations for this effect.
The first is the tilt of the empirical vertical horopter: points perceived along an apparently
vertical line correspond to a physical line of points tilted backwards in space. Second, the eyes
can rotate in response to a particular stimulus. Without compensation for this rotation, biases in
depth perception would result. We measured cyclovergence indirectly, using a standard
psychophysical task, while observers viewed our depth configuration. Biases predicted from
error due either to cyclovergence, or the tilted vertical horopter, were not consistent with the
depth configuration results. Our data suggest that, even for the simplest scenes, we do not
have ready access to metric depth from binocular disparity.
Keywords: binocular disparity, depth, depth interval, metric depth, cyclovergence, vertical
horopter.
3
Introduction
The tiny angular differences between the right and left eyes’ views of a scene are used by the
brain to extract relative depth (see Howard, 2002). These arise because the two eyes view the
world from slightly different vantage points. The image locations of a point in the world on each
eye’s retina depend on its position in space, and these locations may be the same or different
in the two eyes. For the images to fall at corresponding locations in the two eyes, a point must
lie on the locus of points in space known as the horopter, defined by the orientations of the
eyes. More typically, points will project to non-corresponding locations in the two eyes. The
differences in location, or binocular disparities, are a powerful cue to depth. Whilst we are
exquisitely sensitive to even tiny differences in binocular disparity between points, the visual
system cannot simply ‘read-out’ the disparity at every point in the world so as to deliver a
depth-map of the scene. More information than simply an estimate of this disparity is needed
before information about metric depth (depth in an external-world unit, such as cm) can be
extracted.
Human sensitivity to binocular disparity has been much studied (e.g. Howard, 2002), but most
tasks involving disparity detection have not been designed to address how we use disparity to
estimate depth. Typically, one would show observers a pair of intervals, each containing a pair
of dots at different disparities (figure 1a), and ask in which the depth separation is larger. It is
well known that observers can perform this task with reasonable precision for very simple
stimuli. However, observers become less precise at judging differences between depth
separations as the depth separation becomes larger (e.g. Ogle, 1958, Blakemore, 1970). For
example, using a depth pedestal of around 20 min arc, discrimination thresholds are around 1
min arc disparity, an order of magnitude larger than for a zero depth pedestal (Blakemore,
1970; Badcock & Schor, 1985). When asked to make even simple ordinal depth judgments for
4
points on more complex, rendered objects, precision is worse than for isolated pairs of points
(Norman & Todd, 1998).
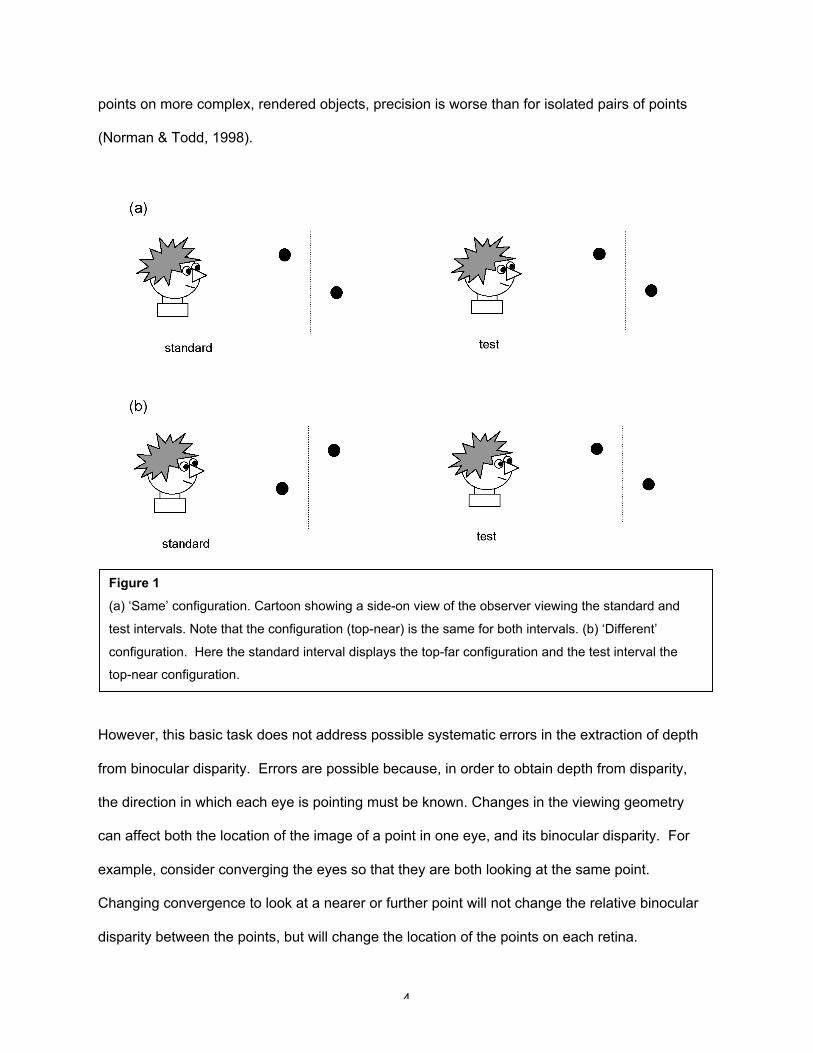
However, this basic task does not address possible systematic errors in the extraction of depth
from binocular disparity. Errors are possible because, in order to obtain depth from disparity,
the direction in which each eye is pointing must be known. Changes in the viewing geometry
can affect both the location of the image of a point in one eye, and its binocular disparity. For
example, consider converging the eyes so that they are both looking at the same point.
Changing convergence to look at a nearer or further point will not change the relative binocular
disparity between the points, but will change the location of the points on each retina.
Figure 1
(a) ‘Same’ configuration. Cartoon showing a side-on view of the observer viewing the standard and
test intervals. Note that the configuration (top-near) is the same for both intervals. (b) ‘Different’
configuration. Here the standard interval displays the top-far configuration and the test interval the
top-near configuration.
5
Cyclotorsion, or rotation of one eye around the visual axis, can affect the disparity of all points
in the image. Thus, if perfect knowledge of the viewing geometry is not available, this will
introduce errors in the perceived three-dimensional location of points. For example, it is well
established that underestimating the distance to an object (equivalent to overestimating the
vergence angle when it is fixated) will lead to an underestimation of the depth difference
between points inferred from their binocular disparity (Johnston, 1991; Brenner and Landy,
1999; Scarfe and Hibbard, 2006).
Our aim here was to devise an experiment to test for the potential influence of ignorance of the
viewing geometry. To do this, one should use a task and stimulus that require correct disparity
recovery and knowledge of viewing geometry. There are many studies that have looked at the
issue of needing to know viewing geometry. We wanted to specifically study this issue in the
context of simple depth discrimination. Here, we chose a task where the observer estimates a
difference in depth separation between pairs of points, shown in two different time intervals.
Figure 1b shows an experimental situation in which an observer is shown two intervals, each
containing pairs of dots with a depth separation. The disparity between them is the same as in
figure 1a, the difference is the configuration of the points (whether the upper one is closer or
farther) between the two intervals. Comparing depth interval judgments from stimuli where both
intervals had the same depth configuration (figure 1a), with judgments where the intervals had
a different configuration (figure 1b), allowed us to explore the extent to which judgements are
affected by errors occurring at the disparity recovery stage, or errors due to imperfect
compensation for viewing geometry at later stages linked to depth extraction.
We will explore two ways in which we expect the visual system to make errors. Mathematical
predictions for the effects of each source of bias are detailed in the Appendix. First, comparing
perceived depth for different configurations allows us to test for disparity recovery errors. When
6
the foveae and the horizontal meridians of the eyes are aligned, points that fall on
corresponding locations in the two eyes are defined as having zero binocular disparity and are
said to fall along the geometrical horopter. The geometric horopter is defined as the locus of
points in space that project to corresponding points in the two eyes: the locus of zero binocular
disparity. Points falling off the geometric horopter have a non-zero binocular disparity. In the
horizontal plane, for close viewing, the horizontal geometrical horopter (also called the Vieth-
Muller circle) is a circle passing through the nodal points of the two eyes and the fixation point.
The vertical geometrical horopter is a vertical line lying in the head’s midsagittal plane and
intersects the Vieth-Muller circle. The empirical horopter is defined as the locus of points that
appear to lie in the same direction from each eye. It is known that the geometric and empirical
horopters are different. The empirical horizontal horopter tends to be less concave than the
Vieth-Muller circle, while the empirical vertical horopter is a line, tilted backwards, in such a way
that it passes through the fixation point, and a point near the feet (e.g. Nakayama, 1977;
Ledgway & Rogers, 1999; Schreiber et al, 2008). This means that points that lie along a line
tilted slightly back from vertical appear to be vertical. This difference between the geometric
and empirical horopters could potentially introduce errors in determining the distance of points
from the observer. If depth judgments were made relative to this tilted vertical horopter,
different depths might be perceived for stimuli tilted top-far (figure 1b, left), as opposed to top-
near (figure 1b, right). More specifically, with a backward tilted vertical horopter, one would
expect greater perceived depth in the top-near condition, which would contain a greater
effective disparity relative to the empirical horopter than the top-far condition (see figure 8 in
Appendix). There is some evidence for anisotropy in depth perception for upper and lower
visual fields, which would be consistent with error due to a backward tilted horopter.
Breitmeyer, Julesz & Kropfl (1975) found that near patches were detected more rapidly than far
patches in the lower visual field, confirmed by Previc et al (1995). However, other labs have
failed to find an anisotropy (Manning et al, 1987).
7
Second, the depth obtained could also depend on the attitude and orientation of the eyes. We
know that the eyes can undergo rotational, torsional movements in opposite directions around
the visual axis (cyclovergence) in response to stimuli that rotate in opposite directions in the
two eyes’ views (e.g. reviewed by Maxwell & Schor, 2006). Whilst the eyes seem to exhibit
very few spontaneous changes in cyclovergence, some observers do show a rotational offset
(a cyclophoria) when fixating a single point, as opposed to a patterned background (van Rijn,
van der Steen, & Collewijn, 1992). If the brain could compensate for the cyclovergence by
combining retinal and extra-retinal information (as it can to some extent for versional eye
movements, synchronous movement of both eyes, e.g. Freeman, 2001, Perrone & Krauzlis,
2008; and horizontal vergence changes, e.g. Nefs & Harris, 2007, 2008), the rotational state of
the eyes would not affect the perception of depth. But there is evidence that such rotational
compensation does not take place (van Ee & van Dam, 2003). Without compensation,
persistent misalignments of the eyes could result in biases in depth perception (see figure 7 in
Appendix). Recent work has suggested that errors in cyclovergence might account for errors in
perceived depth in curved line stereograms (Mitsudo, 2007), and this has been supported by
work showing that perceived depth in such displays can be altered by inducing additional
cyclovergence (Mitsudo, Kaneko & Nishida, 2009).
We explored here whether precision and bias in perceived depth could be linked to the tilt of
the vertical horopter or small, individual-specific offsets in cyclovergence. We measured depth
discrimination for the depth separation between a pair of points, for two different configurations,
specifically testing for biases in the direction predicted by the tilted vertical horopter. In the
same experiment, we measured cyclovergence, to test for the existence of biases linked to
small mis-rotations of the eyes.
8
Methods
Observers
Twenty four observers were recruited, with ages ranging between 18 and 38. Four of these
were experienced psychophysical observers (CG, HN, AC, VD), the others completely naïve to
the purposes of the experiment, with most recruited by an online subject recruitment system.
We pre-screened observers for stereoacuity within the normal range, using the TNO stereotest.
All observers reported normal or corrected-to-normal vision and gave written consent for their
participation. The inexperienced group were paid expenses for their participation. The
University Teaching and Research Ethics Committee (UTREC) of the University of St. Andrews
approved all experiments.
Apparatus
Visual stimuli were displayed on an Iiyama 22in Vision-Master-Pro CRT monitor with a
resolution of 1280 x 1024 pixels and a refresh rate of 100Hz. Stimulus generation and display
was achieved via Matlab and the Psychophysics Toolbox (Brainard, 1997; Pelli, 1997), using a
standard pc workstation. Stimuli were presented side by side on a single monitor and a
modified Wheatstone stereoscope was used to deliver a single stimulus to each eye, at a
viewing distance of 1m. Observers were seated in a darkened room and their position was
stabilised via a chin-rest.
Stimuli and procedure
In a single experiment, we presented observers with two different types of stimulus, and asked
them to perform two tasks at the end of every trial. Task 1 involved judging which of two
intervals contained the pair of points with the larger depth separation. Points were bright dots
(62 cd m-2) on a dark background (luminance effectively 0 cd m-2, below the limit of our Minolta-
100 luminance meter), of diameter 0.28cm (about 1 min arc), presented one above the other,
9
with a height separation of 5cm (2.86 deg). There was a small horizontal offset applied to each
of the top and bottom point, at random (range +- 0.5cm) but in both eyes’ views (no additional
binocular disparity), so that the task could not be completed on the basis of information in a
single eye’s image. Observers viewed a dark screen, in the centre of which was a fixation cross
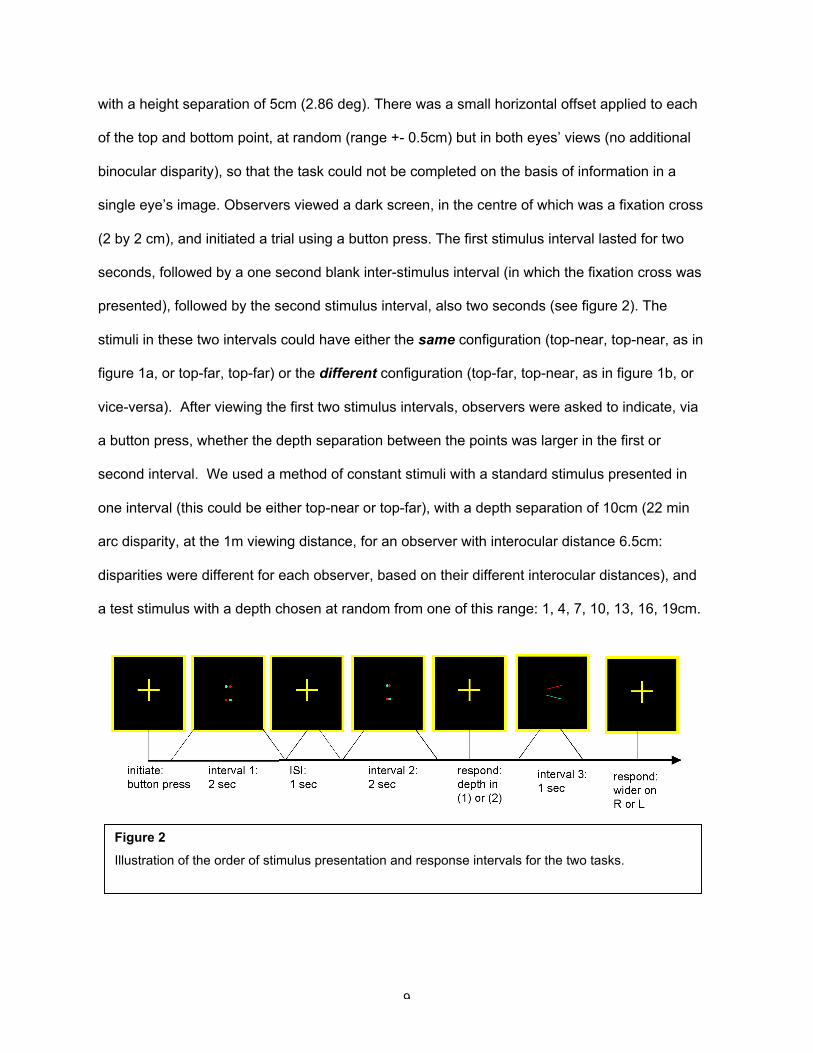
(2 by 2 cm), and initiated a trial using a button press. The first stimulus interval lasted for two
seconds, followed by a one second blank inter-stimulus interval (in which the fixation cross was
presented), followed by the second stimulus interval, also two seconds (see figure 2). The
stimuli in these two intervals could have either the same configuration (top-near, top-near, as in
figure 1a, or top-far, top-far) or the different configuration (top-far, top-near, as in figure 1b, or
vice-versa). After viewing the first two stimulus intervals, observers were asked to indicate, via
a button press, whether the depth separation between the points was larger in the first or
second interval. We used a method of constant stimuli with a standard stimulus presented in
one interval (this could be either top-near or top-far), with a depth separation of 10cm (22 min
arc disparity, at the 1m viewing distance, for an observer with interocular distance 6.5cm:
disparities were different for each observer, based on their different interocular distances), and
a test stimulus with a depth chosen at random from one of this range: 1, 4, 7, 10, 13, 16, 19cm.
Figure 2
Illustration of the order of stimulus presentation and response intervals for the two tasks.
10
Test and standard could each be top-near or top-far and randomly appeared in the first or
second interval. Trials were run in blocks of 112, with the four different conditions randomly
interleaved. In each block, 4 repetitions of each of the 7 depth intervals, in each of the 4
conditions, were presented. Three blocks of trials were completed by each observer, 12 trials
were run per condition for each test depth.
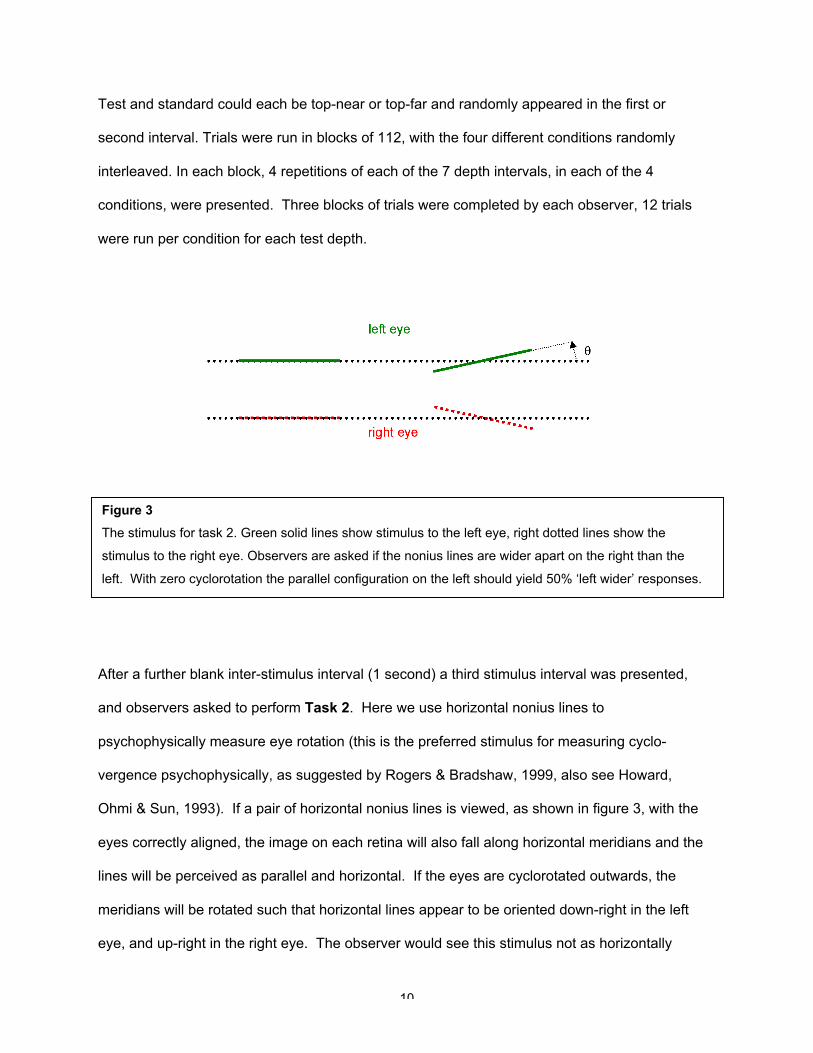
After a further blank inter-stimulus interval (1 second) a third stimulus interval was presented,
and observers asked to perform Task 2. Here we use horizontal nonius lines to
psychophysically measure eye rotation (this is the preferred stimulus for measuring cyclo-
vergence psychophysically, as suggested by Rogers & Bradshaw, 1999, also see Howard,
Ohmi & Sun, 1993). If a pair of horizontal nonius lines is viewed, as shown in figure 3, with the
eyes correctly aligned, the image on each retina will also fall along horizontal meridians and the
lines will be perceived as parallel and horizontal. If the eyes are cyclorotated outwards, the
meridians will be rotated such that horizontal lines appear to be oriented down-right in the left
eye, and up-right in the right eye. The observer would see this stimulus not as horizontally
Figure 3
The stimulus for task 2. Green solid lines show stimulus to the left eye, right dotted lines show the
stimulus to the right eye. Observers are asked if the nonius lines are wider apart on the right than the
left. With zero cyclorotation the parallel configuration on the left should yield 50% ‘left wider’ responses.

11
aligned, but rather the lines would appear to be more widely separated on the left side, than on
the right side. To appear horizontal for such an eye-rotation, the nonius lines would actually
have to have the opposite offset (figure 3, right), more widely separated on the right than the
left. By using a range of stimulus line rotations, it is possible to measure cyclorotation from
psychophysical responses. We used a two-alternative, single interval task, in which observers
were shown one of seven possible stimuli with offset angle, θ (figure 3) drawn from one of: -3, -
2, -1, 0, 1, 2, 3 deg (where a positive angle is consistent with the right side being more widely
separated). Observers were asked to indicate whether the lines were more vertically separated
on the right or the left (“right side wider?”). In preliminary analyses we found no effect of test-
standard order. The point of subjective equality (where the lines appear horizontal) gives a
psychophysical measure of the cyclovergence.
When the observer gave their response, the trial ended, the fixation cross appeared, and when
ready, the observer initiated the next trial with a button press.
Results
Task 1: Depth data analysis and results
We collected data from 24 observers, plotting proportion test-depth-bigger as a function of test
depth, for the four test:standard conditions (‘same’ configurations: top-near-top-near, top-far-
top-far; ‘different configurations’: top-near-top-far, top-far-top-near). One of our aims was to
estimate the size of the bias (the difference between the PSE’s for the two conditions), if any,
between the same and different configurations. To do this, we averaged responses for the two
same configurations. To combine the different conditions, we needed to transform the data,
because the test and standard have opposite configurations for the two conditions. We re-
plotted the data as proportion of ‘top-near-longer’, as a function of top-near minus top-far depth.
12
Now the two different curves should lie close to one another, and responses can be averaged
for each stimulus value. The combined transformed data for each of the same and different
conditions were plotted separately for each observer.
The disparity range we used was specifically set up to be well above depth discrimination
threshold. Previous work has suggested depth pedestal thresholds around 1 min arc, for a 20
min arc depth step (Blakemore, 1970; Badcock & Schor, 1985). Here, our pedestal was
approximately 20 min arc for the standard stimulus. The test stimulus could have disparity as
much as 18 min below that value (1cm depth, 2 min arc disparity), or 19 min above it (19cm, 39
min arc disparity). We had hoped that this large range would allow as many observers as
possible to deliver useful data. However, many observers delivered data where responses for
some, or all, of the range were very close to chance. We therefore started our analysis by
considering whether we had any evidence that observer performance was different from
chance. Rather than relying on poor estimates of slope from a sigmoid curve fit, we kept our
initial analysis simple, and conducted a χ2 test (considering each test value of depth separation
as a depth category) comparing the data with an expectation of chance performance for all
categories.
Only 8 of our 24 data sets passed this test for both same and different conditions, 9 data sets
passed the test if we considered only the same condition, and 10 if we considered only the
different condition. This was a very surprising result, given that our choice of stimuli was based
on making the task as easy as possible, with the stimulus range spanning around ten times
published thresholds for this kind of experiment. Our suspicion is that it is related to our using
naïve and largely unpractised observers. We comment on this point further in the Discussion.
13
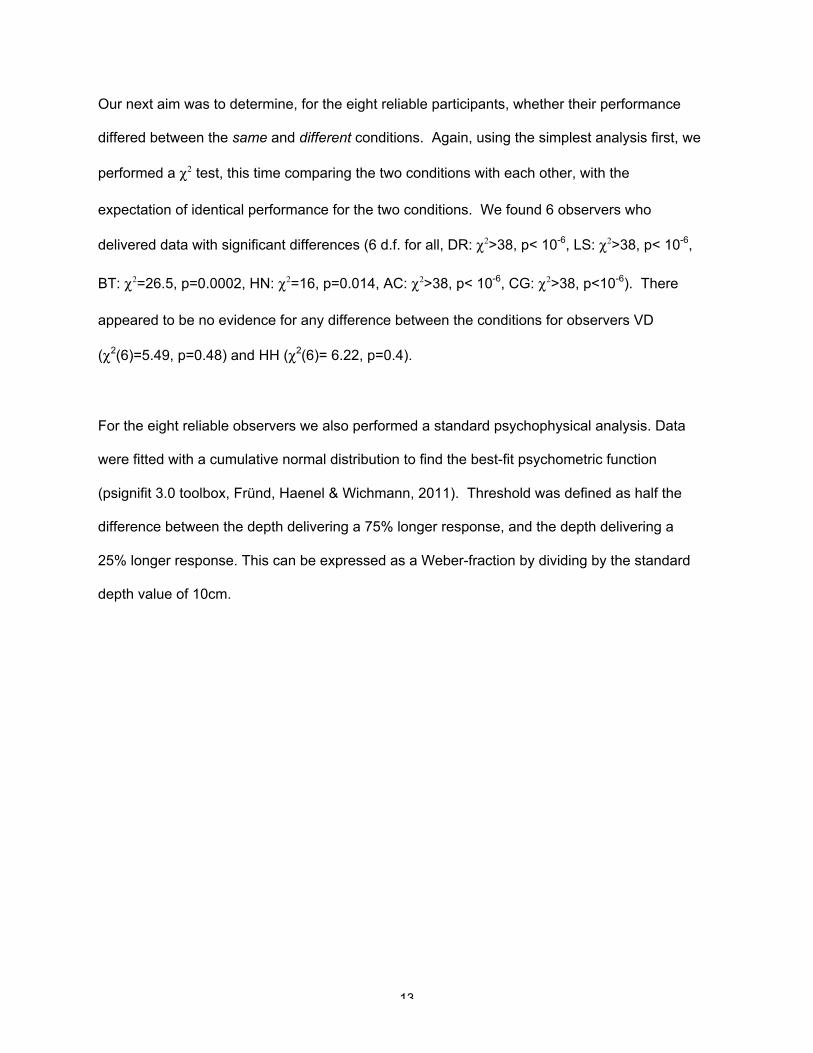
Our next aim was to determine, for the eight reliable participants, whether their performance
differed between the same and different conditions. Again, using the simplest analysis first, we
performed a χ2 test, this time comparing the two conditions with each other, with the
expectation of identical performance for the two conditions. We found 6 observers who
delivered data with significant differences (6 d.f. for all, DR: χ2>38, p< 10-6, LS: χ2>38, p< 10-6,
BT: χ2=26.5, p=0.0002, HN: χ2=16, p=0.014, AC: χ2>38, p< 10-6, CG: χ2>38, p<10-6). There
appeared to be no evidence for any difference between the conditions for observers VD
(χ2(6)=5.49, p=0.48) and HH (χ2(6)= 6.22, p=0.4).
For the eight reliable observers we also performed a standard psychophysical analysis. Data
were fitted with a cumulative normal distribution to find the best-fit psychometric function
(psignifit 3.0 toolbox, Fründ, Haenel & Wichmann, 2011). Threshold was defined as half the
difference between the depth delivering a 75% longer response, and the depth delivering a
25% longer response. This can be expressed as a Weber-fraction by dividing by the standard
depth value of 10cm.
14
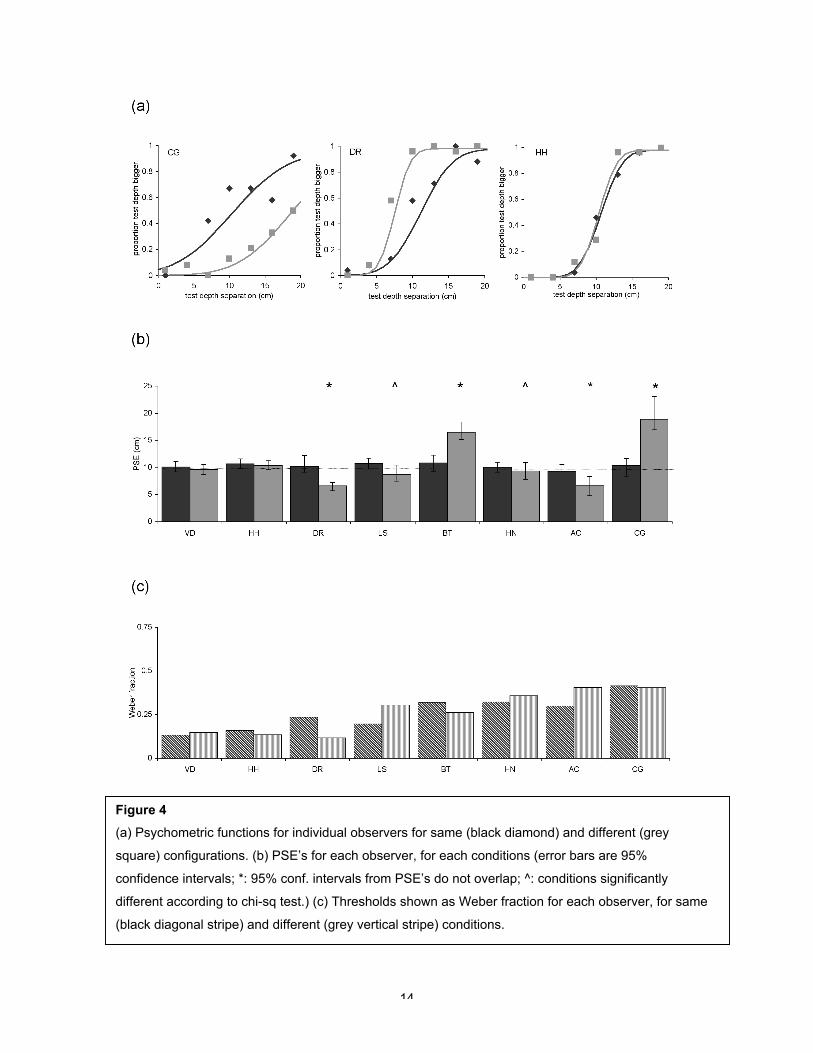
Figure 4
(a) Psychometric functions for individual observers for same (black diamond) and different (grey
square) configurations. (b) PSE’s for each observer, for each conditions (error bars are 95%
confidence intervals; *: 95% conf. intervals from PSE’s do not overlap; ^: conditions significantly
different according to chi-sq test.) (c) Thresholds shown as Weber fraction for each observer, for same
(black diagonal stripe) and different (grey vertical stripe) conditions.
15
Sample data sets from three of the eight reliable observers are shown in figure 4a. The offsets
of the psychometric functions for the same and different conditions, demonstrate that there is a
bias for some observers. Figure 4b shows PSE’s for all 8 observers, for the two conditions,
with error bars indicating 95% confidence intervals for the fits (bootstrapped using 2000 throws
per point, Wichmann & Hill, 2001b). with starred bars showing observers for whom we can
confidently say there is a bias (95% confidence intervals on PSE’s do not overlap) and bars
with a hat (^) showed those for whom the chi-squared test delivered significant differences.
Figure 4c shows thresholds, expressed as Weber fractions, for the two conditions, for the 8
observers. Notice that although thresholds varied between observers, there was no systematic
difference in sensitivity between the same and different conditions (paired t-test, t (7)=0.56,
p=0.62).
Bias was defined as the difference between the same PSE and the different PSE. A positive
bias indicates that the top-near configuration was perceived as having a greater depth
separation than the top-far configuration. Significance was tested based on the overlap of 95%
confidence intervals. A significant difference in PSE, and thus a ‘real’, bias was evident for
observers DR, AC, BT and CG. For the remaining two who passed the χ2 test (LS, HN), this
new analysis did not find a significant difference between conditions. All cumulative normal fits,
apart from the one for CG, condition different, can be described as ‘good’ fits using the criterion
that the observed deviances were within the 95% confidence bounds that we would expect
based on the fitted function (Wichmann & Hill, 2001a).
16
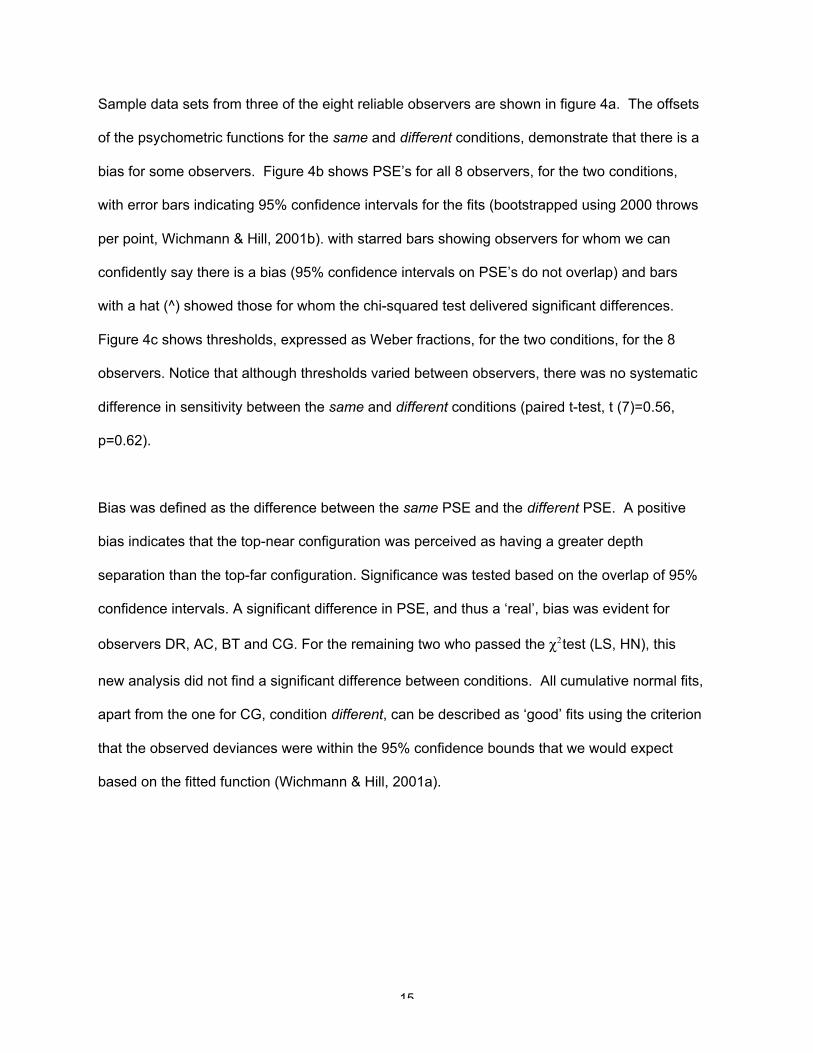
Modelling incorrectly interpreted viewing geometry or eye movements
As discussed in the Introduction, we would expect systematic biases in the perceived depth of
same and different conditions, if either viewing geometry or eye movements were not correctly
interpreted by the visual system.
To extract binocular disparity correctly, the eyes must be in correspondence. This means that
the axes of the two eyes must be aligned, or the viewing geometry known, including the axis
around which torsional eye movements occur. In the Appendix, we describe in detail how the
effects of a torsional eye movement could affect the depth perceived. If each of the eyes were
subject to an outward cyclorotation of θ degrees, the difference in depth between different and
same conditions would be given by:
Zdiff ≈ 4 D Y sinθ / I, (1),
where Y is the vertical separation between the points in the 3-D world (in metres), I is the inter-
ocular separation, and D is the viewing distance to the fixation point.
Slightly different predictions are obtained if the eyes remained aligned, but we consider depth
perception errors occurring due to the tilt of the vertical horopter. That is, perceived depth might
be determined by disparity relative to the tilted empirical vertical horopoter. We know that the
empirical vertical horopter is inclined, (e.g. Siderov et al, 1999; Ledgeway & Rogers, 1999) and
that the inclination is consistent with the vertical meridians in the left and right eyes being
slightly extorted (in other words, the vertical meridians are rotated outwards). This does not
have exactly the same effect on the effective disparities as a cyclorotation, because only the
vertical meridians are rotated, the horizontal meridians remain aligned. However, the effect is
17
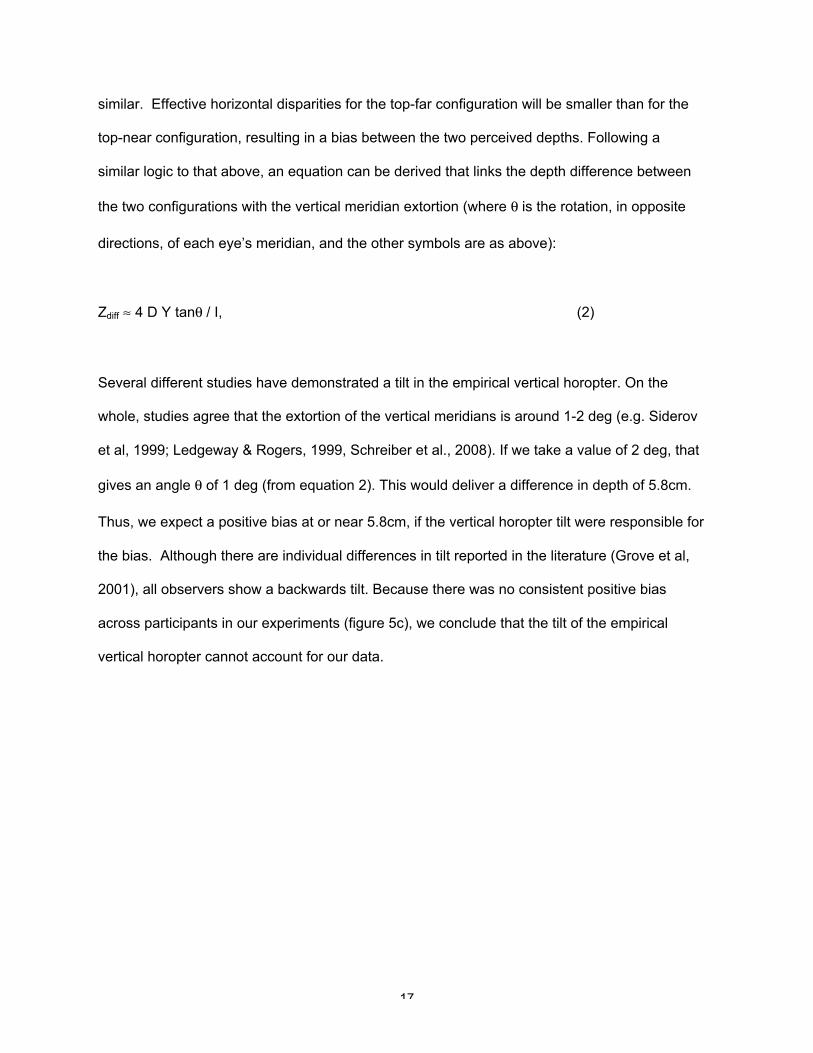
similar. Effective horizontal disparities for the top-far configuration will be smaller than for the
top-near configuration, resulting in a bias between the two perceived depths. Following a
similar logic to that above, an equation can be derived that links the depth difference between
the two configurations with the vertical meridian extortion (where θ is the rotation, in opposite
directions, of each eye’s meridian, and the other symbols are as above):
Zdiff ≈ 4 D Y tanθ / I, (2)
Several different studies have demonstrated a tilt in the empirical vertical horopter. On the
whole, studies agree that the extortion of the vertical meridians is around 1-2 deg (e.g. Siderov
et al, 1999; Ledgeway & Rogers, 1999, Schreiber et al., 2008). If we take a value of 2 deg, that
gives an angle θ of 1 deg (from equation 2). This would deliver a difference in depth of 5.8cm.
Thus, we expect a positive bias at or near 5.8cm, if the vertical horopter tilt were responsible for
the bias. Although there are individual differences in tilt reported in the literature (Grove et al,
2001), all observers show a backwards tilt. Because there was no consistent positive bias
across participants in our experiments (figure 5c), we conclude that the tilt of the empirical
vertical horopter cannot account for our data.
18
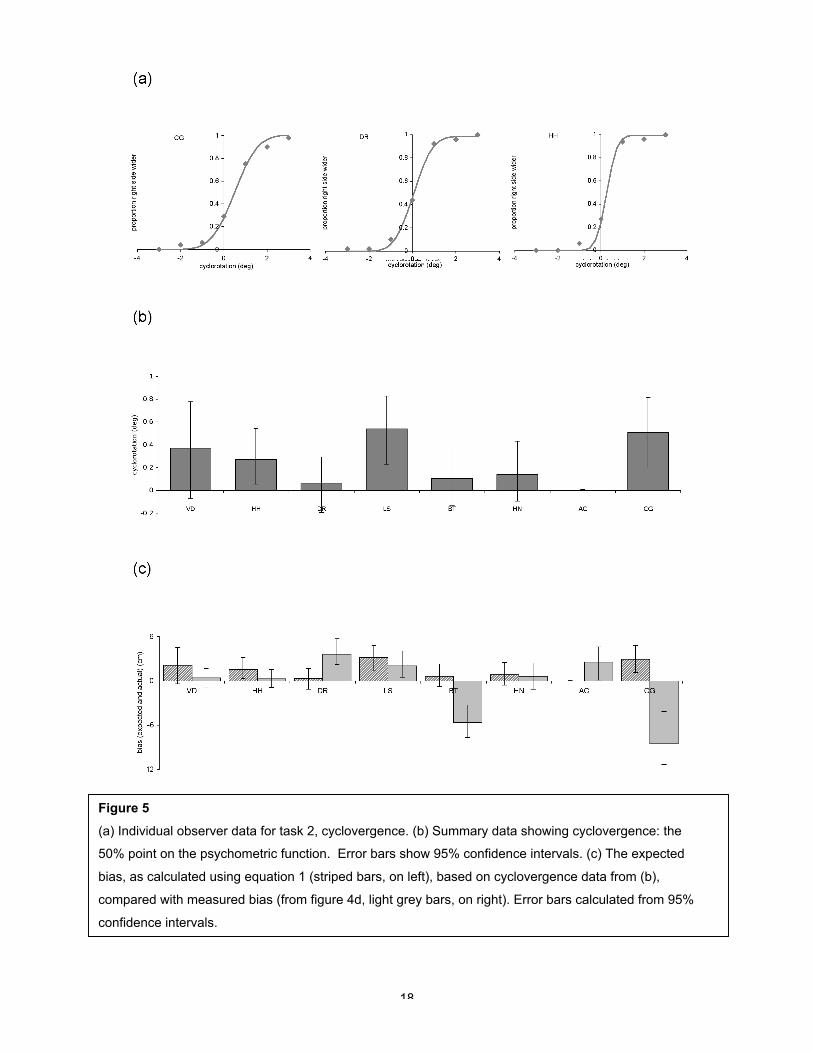
Figure 5
(a) Individual observer data for task 2, cyclovergence. (b) Summary data showing cyclovergence: the
50% point on the psychometric function. Error bars show 95% confidence intervals. (c) The expected
bias, as calculated using equation 1 (striped bars, on left), based on cyclovergence data from (b),
compared with measured bias (from figure 4d, light grey bars, on right). Error bars calculated from 95%
confidence intervals.
19
Comparing bias and cyclovergence data (task 2)
The cyclovergence data were gathered as part of the same experiment as the depth data. We
collected proportion of ‘right side wider’ responses as a function of the rotation applied to the
horizontal nonius line pair (figure 3). Data were fit with a cumulative normal to find the best-
fitting psychometric function. Sample data from three observers are displayed in figure 5a. A
measure of cyclovergence for each eye was given by the PSE of the fitted curve. Positive
values are consistent with outward cylcorotation. Figure 5b shows estimates of cyclorotation
for each of the eight observers. The average rotation was 0.17 deg and was significantly
different from zero (two-tailed paired t-test, t(7)=0.98, p=0.026). In principle, this measured
rotation could be due to two things (a) a fixed amount of rotation for an observer, regardless of
the stimulus, or (b) rotation that is induced by each stimulus. This latter possibility is unlikely,
because the stimuli were small, and previous research suggests that stimuli need to be quite
large to induce cyclovergence. For example, many studies of cyclovergence use stimuli as
large as 50 deg (e.g. Kertesz & Sullivan, 1978) or even 75 deg (Howard & Zacher, 1991).
Howard (2002) suggests that stimuli should be at least 25 deg diameter to induce
cyclovergence.
We used equation 1 to calculate the expected bias that should have resulted in the depth task,
were the bias based entirely on an individual’s cyclotorsion. Figure 5c shows expected biases
for each of the eight observers (diagonal striped bars, on left), compared with the biases
obtained from the depth experiment (light vertical striped bars, on right bars). Expected and
actual biases appear unrelated for each observer. There was no significant correlation between
the two (r = 0.37, p=0.19), suggesting that there is no relationship between bias, as measured
in the depth experiment, and cyclorotation, as measured psychophysically in concurrent trials.
20
The logic of the cyclorotation experiment is that observers might hold a constant cyclorotation
(called a cyclophoria). It is also possible that their eyes might rotate in response to the stimuli
themselves. Given the small size of the stimuli used here, and the fact that a large stimulus is
generally needed to drive cyclorotation, we considered this possibility unlikely. Nevertheless,
the hypothesis can be checked by separately analysing cyclorotation data when the second
depth interval contained a top-far stimulus, and when it contained a top-near stimulus. We
collected proportion ‘right side wider’ responses as a function of the cyclorotation, and fit
separate psychometric functions to the two data sets. Sample data sets for three observers
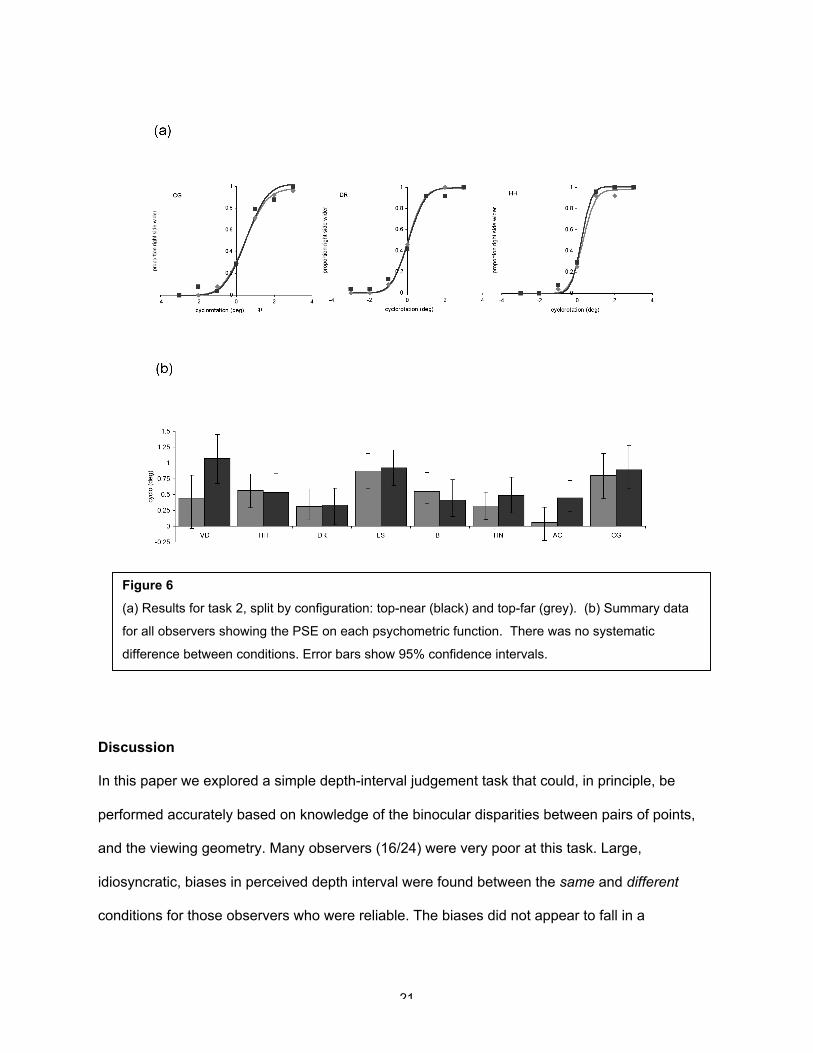
are plotted in figure 6a. Top-near data are shown in black and top-far in grey. These three
observers are representative, in that for most observers very little difference was seen between
the two conditions. Cyclorotation was obtained by measuring PSE’s for each data set, for each
observer, and are plotted in figure 6b. Cyclorotations were very similar for the two conditions,
and there was no significant difference between the two sets of data (paired t-test, t(7)=0.79,
p=0.28).
21
Discussion
In this paper we explored a simple depth-interval judgement task that could, in principle, be
performed accurately based on knowledge of the binocular disparities between pairs of points,
and the viewing geometry. Many observers (16/24) were very poor at this task. Large,
idiosyncratic, biases in perceived depth interval were found between the same and different
conditions for those observers who were reliable. The biases did not appear to fall in a
Figure 6
(a) Results for task 2, split by configuration: top-near (black) and top-far (grey). (b) Summary data
for all observers showing the PSE on each psychometric function. There was no systematic
difference between conditions. Error bars show 95% confidence intervals.
22
systematic direction, across the 8 reliable observers, nor were they of any specific size. In the
sections below we assess whether the issues identified in the Introduction are responsible for
the bias, and the extent to which there is evidence demonstrating biases from other work in the
literature.
Poor performance for many observers
Data from 8/24 observers were investigated in detail. The other 16 produced data where we
could not be sure that performance was different from chance for either the straightforward
same condition or the different condition, or both. This result may appear striking on a casual
inspection of the literature on depth from binocular disparity. Typically, 15-20% of observers in
binocular vision experiments are rejected due to poor performance (report from an informal
survey via the cvnet email group; archived at cvnet or available on request). Most
psychophysical studies use tiny numbers of expert observers. Studies on binocular vision that
have used large numbers of observers have found high proportions of participants who deliver
poor performance. This occurs in other labs, even for what should be relatively easy depth-
related tasks (Wilmer, 2008; Hokoda, 1985, Porcar & Martinez-Palomar, 1997, Watanabe et al,
2008), as well as our own lab where we have explored motion in depth (Nefs, O’Hare & Harris,
2010). Many studies do not report in detail how their observers were chosen, nor how many
were excluded. Our strategy here was to collect data from a sample of a normal young adult
population (most were students), largely without specific training or experience, and to
investigate in detail those whose performance was precise enough to model using standard
psychophysical analyses. This allowed us to study the most reliable individuals in detail, while
obtaining an estimate of how hard the task was for the population at large.
In a previous study, we tested a large number (62) of observers on a series of motion in depth
tasks and a control dot-density task (Nefs et al, 2010). The idea of this latter task was to test
23
whether some of our naïve observers were poorly motivated. If so we expected poor
performance on all tasks. Although 50% of observers were poor at the motion in depth task, all
delivered high sensitivity for the dot-density task. Our naïve observers appear well motivated,
and are paid expenses for their time. These results demonstrated that they were well
motivated, but that many people find tasks involving binocular disparity particularly difficult. We
have no reason to believe that the observers studied here were any less well motivated than
those used by Nefs et al (2010). We would like to speculate that the large proportion of poor
observers may reflect something special about tasks involving binocular disparity: that
considerable practise is required, compared with simpler visual judgments.
The depth task was clearly hard. All observers passed the TNO stereoacuity task, yet when
asked to use their ability to discriminate one disparity step from a slightly larger or smaller one,
they were unable to do so. We believe that several factors contribute to this. First, we chose a
task that would be more difficult than stereoacuity. Depth separation discrimination is such a
task, as has been described before (eg. Norman & Todd, 1998; Blakemore, 1970). Second,
the task was probably made even harder by using a 2-interval design, but this was essential, as
we wanted to ensure observers actually needed to extract the depth increment to perform the
task. Specifically, we used a task in which, for half of the trials, observers were required to
compare depth intervals between points in different configurations. This means that they would
not have been able to rely on a simple strategy, such as comparing the absolute disparities of
points across intervals.
Although our task was chosen to be more challenging than a stereoacuity task, we did take
care to ensure that our stimuli were within a range that was ‘doable’ according to the literature.
First, we used a combination of disparity between the two points, and vertical angular
separation, that ensured the stimuli should be within Panum’s fusional area. The disparity
24
gradient was always well below the recognised fusion limit of 1 (Burt and Julesz, 1980; for the
smallest, 1cm, depth separation the disparity gradient was 0.026 and for the largest, 19cm
separation it was 0.49). Second, our standard depth separation of 10cm (22 min arc) should
deliver a depth discrimination threshold of around 1.7 min arc, or 0.75cm, (Badcock & Schor,
1985), well below the values of depth separations we used for the comparison stimuli.
However, the extant literature could be misleading in terms of what we expect observers to
achieve, because these classic studies used just a handful of expert observers.
One point that is worthy of note is that Howard & Kaneko (1994) explored how cyclorotation of
left and right eye images, in opposite directions, does not always result in apparent inclination,
despite this manipulation adding the appropriate disparities to deliver inclination. Our stimuli
are not unlike some of theirs: we added horizontal disparity between points, while they added
cyclorotation. Further, their behavioural results were also inconsistent with measured
cyclovergence of the eyes.
The 8 reliable observers delivered thresholds (defined as half the difference between 75% and
25% on the fitted psychometric functions) ranging from 1.3 to 4cm. Thus, our best observers’
thresholds were around double those found by Badcock and Schor (1985). Given that they
used simultaneous test-standard presentation, and we used sequential presentation, our best
thresholds are as good as one would expect. Four of our reliable observers were experienced
members of the lab (two postdocs, a PhD student, and one of the authors) who were naïve to
the purposed of the experiment, but who had taken part in several (at least) previous studies
using binocular disparity. In addition, in the group of 8 reliable observers, 4 were completely
naïve, untrained, and unfamiliar with psychophysical experiments. This gave us confidence that
there was not some aspect of the display (dot size, contrast) or apparatus (stereoscope
alignment and arrangement) that was lacking in our experiments, compared to those of others.
25
If there had been such a problem, the experiment should have been very difficult for all but the
most experienced observers and would likely have delivered systematic biases. In sum, we
consider that our small proportion of reliable observers genuinely reflects a population of
‘normal’ observers, who have not been specially chosen for the study.
Binocular disparity relative to the horopter
One way to define binocular disparity is that a non-zero disparity occurs whenever a point in
space lies off the horopter. The issue of which points are on, or off, the horopter is complicated
by the fact that the empirical horopter is different from the theoretical horopter. In particular,
the empirical vertical horopter is known to be ‘tipped back’ slightly, the extent of the declination
varying with viewing distance (Helmholtz, 1962; Cogan, 1979; Siderov, Hawerth and Bedell,
1999, Schreiber et al, 2008).
It is not clear whether the difference between empirical and theoretical horopters has
consequences for depth perception. The empirical horopter is usually measured via alignment:
observers are presented with a vertical line in one eye’s view and asked to rotate a line in the
other eye’s view until aligned (Helmholtz, 1962). Alternatively a ‘criterion of identical visual
direction’ can be used: points are alternately flashed in one eye, then the other, and the
location of one is adjusted until there is no apparent motion between them (Nakayama, 1977,
Ledgway & Rogers, 1999). One study has compared the vertical horopter as measured by
identical visual direction, with a vertical horopter as measured by the maximal sensitivity to
binocular disparity, and found similar results (Siderov, Harwerth & Bedell, 1999).
It is also not obvious how a tilted vertical horopter should affect depth interval judgements. On
the one hand, the visual system might measure the separation between the images of the two
scene points, with respect to the location of the vertical meridian in each eye. One would then
26
expect all observers to show a systematic error, in the same direction, consistent with the
backward tilt causing the ‘effective’ disparity to vary (see Appendix). On the other hand, one
could argue that the visual system is cross-calibrated with other sensory information, such as
from haptics, and may have a built-in mechanism to compensate for the horopter tilt.
The biases found in our experiments were not systematic across observers and certainly
cannot be accounted for by the vertical horopter tilt alone. If there is a systematic bias, it is
hidden by a much larger, idiosyncratic bias, which must be due to other causes.
Viewing geometry
Another potential cause of perceived depth biases could be a failure of the visual system to
compensate for the relative orientations of the eyes. For example, if the eyes undergo
cyclovergence, as can happen for fixation at different viewing distances, biases in depth
perception could occur if disparity were measured with respect to vertical and horizontal
meridians that are assumed to be aligned between the two eyes. This issue was described in
detail earlier, and is shown diagrammatically in figure 7. We psychophysically measured
cyclorotation, during the same experiment in which depth interval judgements were made, but
found no evidence to suggest that the former was linked to the latter (figure 5).
Observers viewed each stimulus for 2 seconds, partly because we found that shorter stimulus
durations resulted in even poorer performance. Its is possible that observers made different
patterns of eye rotations during that 2 second interval. The cyclorotation measure above would
not pick this up, because it only measured final rotation position at the end of a trial. A
reference-frame change due to different patterns of eye movements during viewing of the
‘same’ and ‘different’ stimuli could be a potential explanation of our results. Detailed
measurement of this is beyond the scope of the current manuscript.
27
Other explanations?
So far we have considered how disparity information is obtained by measuring distances
between locations on the retina. If the visual system processed depth in this way, we could
potentially obtain a depth map, detailing a disparity for every location in a scene, relative to
fixation. If our observers had access to this sort of information, then we would have expected
our discrimination task to be a very easy one for them to solve. For both the same and
different conditions, they would merely have had to compare the magnitude of the disparity,
while ignoring its sign. There is some evidence to suggest that this kind of representation is not
used. Instead, it has been suggested that disparity is measured locally, relative to a local
reference frame, determined by the surface on which a point lies (Petrov & Glennerster, 2006;
Glennerster & McKee, 2004).
Consider our simplest condition, same, where for example, a top-far configuration was
compared with another top-far configuration. Using a local reference frame should be
straightforward, because one could imagine a reference frame based on the configuration in
the first interval. The task would be to compare the stimulus in the second interval against that
frame. For example, observers might choose to fixate the lower target (also the nearest).
Essentially, observers could, at least in principle, compare the disparity between the two lower
targets across the two intervals. Or, the disparity of the upper point could be measured with
respect to fixation. The task would be reduced to ‘which interval contained the largest
uncrossed disparity with respect to fixation?’. It is unlikely that observers adopted that easier
‘use disparity’ strategy only for the ‘same’ condition, because we used a non-blocked design:
same and different conditions were randomly interleaved, discouraging observers from
developing specific strategies.
28
The different condition needs additional information for the disparity to be processed without
bias. For example, if observers chose to fixate on the lower target the task would require
comparing opposite disparity sign steps, but for slightly different viewing distances (in one
interval the lower target is the nearer, in the other, it is farther). Hence, an estimate of viewing
distance (alternatively an estimate of eye position) is required to estimate metric depth without
bias. Or, if observers chose to fixate on the nearest target, the task would require comparing
the same sign disparity steps, but at different locations (above versus below fixation). This
requires some knowledge of the shape of the vertical horopter to successfully convert to an
estimate of metric depth.
If observers were simply responding to disparity, and not attempting to extract metric depth, we
would then expect the same pattern of bias for all observers, because errors would be
consistent with an assumption of fixed eye position and constant viewing distance. The
idiosyncratic pattern of bias that we observed is not consistent with this interpretation. We
would also expect a decreased sensitivity for the different condition compared to the same
condition. However, we found no significant difference in sensitivity between those conditions,
only a difference in PSE, reflecting the bias (figure 4b and 4c). The consistent threshold results
could indicate that the brain is attempting to extract metric depth for both tasks, and the
idiosyncratic biases suggest that it is done incorrectly.
Comparing the relative depths between pairs of points, across two intervals in time, appears to
be a very simple task, yet our results have revealed large biases and poor performance in
general. If the issues of eye position and empirical vertical horopter do not account for the bias,
then where does it come from? Almost all previous work on depth interval perception has
explored thresholds, but not biases. It is well known that depth increment thresholds rise with
increasing increment size (Ogle, 1953; Blakemore, 1970, Westheimer & McKee, 1978). Depth
29
interval discrimination for a pair of points is worse than depth order discrimination (Norman &
Todd, 1998). To our knowledge, no other studies have explicitly studied simple changes in
configuration, for point-like objects, as we have done here.
One important point is that we used very sparse stimuli, delivering a minimum amount of
information about the possible viewing distance or viewing geometry. It has previously been
suggested that the disparity distribution present in a scene could, in principle, be used to obtain
an estimate of viewing distance and hence reduce biases in perceived depth (Harris, 2004;
Glennerster et al, 1998). O’Kane and Hibbard (2010) tested this suggestion but found no
evidence for the visual system using more complex contextual information in this way. In their
work, they found that adding a distribution of disparities into a surrounding pattern, specifically
added to make the scene more ecologically valid, had no effect on the depth settings made.
So far, then, there is no evidence that a more complex disparity-defined scene should deliver
more consistent or more accurate performance. Of course, we do acknowledge that adding
other sources of visual information should at some point, improve the perception of distance,
and hence reduce bias. However, the purpose of this study was to specifically explore the
simplest possible sparse scene.
Our stimuli, although very sparse, could in principle be interpreted as either a pair of points
lying on a ground plane, or a pair of points lying on a ceiling plane. It is tempting to suggest
that the visual system may treat these types of pattern differently, because ground-planes are
ubiquitous in the world, and ceiling planes rarer. There is some evidence that the visual
system can treat these differently. McCarley & He (2000) used a visual search task to show
that elements can be searched for more quickly when on a disparity-defined ground-plane than
a ceiling plane. Bian and Anderson (2010) found an advantage in detecting changes to a
ground-plane, or to objects on a ground-plane, in comparison to a ceiling plane. However, we
30
found no systematic differences in sensitivity when comparing the two ‘same’ conditions, one of
which is reminiscent of a ceiling plane and the other a ground plane. So, once again, our data
cannot be explained by this suggestion.
Summary and Conclusions
In conclusion, our observers demonstrated remarkably poor performance in a depth interval
judgement task, showing poor sensitivity to depth differences and large, idiosyncratic biases in
perceived depth as a result of the configuration of points. These data cannot readily be
accounted for by a consideration of possible failures to take account of the shape of the
empirical horopter, the cyclorotation of the eyes, or the coordinate frame with which disparity is
represented. Rather, they suggest that observers do not have ready access to accurate and
reliable information about metric depth relations between points from binocular disparity and
eye position alone.
31
References
Badcock, D.R. & Schor, C.M. (1985). Depth-increment detection function for individual spatial
channels. Journal of the Optical Society of America. A2, 1211-1215.
Bian, Z. & Anderson, G.J. (2010). The advantage of a ground surface in the representation of
visual scenes. Journal of Vision, 10(8):6, 1-19.
Blakemore, C. (1970). The range and scope of binocular depth discrimination in man. Journal
of Physiology, 211, 599-622.
Brainard, D. H. (1997). The Psychophysics Toolbox. Spatial Vision, 10:433-436.
Breitmeyer, B., Julesz, B., & Kropfl, W. (1975). Dynamic random-dot stereograms reveal up-
down anisotropy and left-right isotropy between cortical hemifields. Science, 24, 269-270.
Brenner, E. & Landy, M.S. (1999) Interaction between the perceived shape of two objects.
Vision Research, 39, 3834-3848.
Burt, P. & Julesz, B. (1980) A disparity gradient limit for binocular fusion. Science, 208, 615-
617.
Cogan, A.I. (1979). The relationship between the apparent vertical and the vertical horopter.
Vision Research, 19, 655-665.
van Ee, R., & van Dam, L.C.J. (2003). The influence of cyclovergence on unconstrained
stereoscopic matching. Vision Research, 43, 307-319.
Freeman, T.C.A. (2001) Transducer models of head-centred motion perception. Vision
Research, 41, 2741–2755.
Fründ, I., Haenel, N.V. & Wichmann, F.A. (2011) Inference for psychometric functions in the
presence of nonstationary behavior. Journal of Vision (in press).
Glennerster, A, & McKee, S. (2004). Sensitivity to depth relief on slanted surfaces. Journal of
Vision, 4. 378-387.
Glennerster, A., Rogers, B. J. & Bradshaw, M. F. 1998 Cues to viewing distance for
stereoscopic depth constancy. Perception 27, 1357–1366.
32
Grove, P.M., Kaneko, H., & Ono, H. (2001). The backward inclination of a surface defined by
empirical corresponding points. Perception, 30, 411-429.
Harris, J.M. (2004) Binocular vision: moving closer to reality. Philosophical Transactions of the
Royal Society, A. 362, 2721 - 2739.
Helmholtz, H. von (1867/1910/1962). Treatise on physiological optics, vol. III, trans. and ed. J.
P. C. Southall. Dover. (Translated from the 3rd German edition, English edition 1962).
Hokoda, S. C. (1985). General binocular dysfunctions in an urban optometry clinic. Journal of
the American Optometric Association, 56, 560–562.
Howard, I.P. (2002). Seeing in depth: Volume 1 Basic Mechanisms. Oxford University Press,
New York.
Howard, I.P., & Zacher, J.E. (1991). Human cyclovergence as a function of stimulus frequency
and amplitude. Experimental Brain Research, 85, 445-450.
Howard, I.P., Ohmi, M., & Sun, l. (1993). Cyclovergence - a comparison of objective and
psychophysical measurements, Experimental Brain Research, 16, 349-355.
Howard, I. P., & Kaneko, H. (1994). Relative shear disparities and the perception of surface
inclination. Vision Research, 34, 2505-2517.
Johnston, E.B. (1991). Systematic distortions of shape from stereopsis. Vision Research,
31, 1351-1360.
Kertesz, A.E., & Sullivan, M.J. (1978). The effect of stimulus size on human cyclofusional
response. Vision Research, 18, 567-571.
Ledgeway, T., & Rogers, B.J. (1999). The effects of eccentricity and vergence angle upon the
relative tilt of corresponding vertical and horizontal meridian revealed using the minimum
motion paradigm. Perception, 28, 143-153.
Manning, M.L., Finlay, D.C., Neill, R.A., & Frost, B.G. (1987). Detection threshold differences to
crossed and uncrossed disparities. Vision Research, 27, 1683-1686.
33
Maxwell, J.S., & Schor, C.M. (2006). The coordination of binocular eye movements: Vertical
and torsional alignment. Vision Research, 46, 3537-3548.
McCarley, J.S., & He, Z. (2001). Sequential priming of 3-D perceptual organization. Perception
& Psychophysics, 63, 195-208.
Mitsudo, H. (2007). Illusory depth induced by binocular torsional misalignment. Vision
Research, 47, 1303–1314
Mitsudo, H., Kaneko, H., & Nishida, S. (2009). Perceived depth of curved lines in the presence
of cyclovergence. Vision Research, 49, 348-361.
Nakayama, K. (1977). Geometric and physiological aspects of depth perception. Proceedings
of the Society of Photo-Optical Instruments of England, 120, 2-9.
Nefs, H. T., & Harris, J. M. (2007). Vergence effects on the perception of motion in depth,
Experimental Brain Research, 183, 313-322.
Nefs, H. T., & Harris, J. M. (2008). Induced motion in depth and the effects of vergence eye
movements. Journal of Vision, 8(3):8, 1-16
Nefs, H.T., O’Hare, L. & Harris, J.M. (2010). Two independent mechanisms for motion-in-depth
perception: evidence from individual differences. Frontiers in Psychology, 1:155. doi:
10.3389/fpsyg.2010.00155
Norman, J.F., & Todd, J.T. (1998). Stereoscopic discrimination of interval and ordinal depth
relations on smooth surfaces and in empty space. Perception, 27, 257-272
Ogle, K.N. (1953). Precision and validity of stereoscopic depth perception from double images.
Journal of the Optical Society of America, 43, 907-913.
Ogle, K.N. (1958). Note on stereoscopic acuity and observation distance, Journal of the Optical
Society of America, 48, 794-798.
O'Kane LM, & Hibbard PB (2010) Contextual effects on perceived three-dimensional shape.
Vision Research, 50, 1095-1100.
34
Pelli, D. G. (1997). The VideoToolbox software for visual psychophysics: Transforming
numbers into movies. Spatial Vision, 10:437-442.
Perrone, J.A., & Krauzlis, R.J. (2008). Vector subtraction using visual and extraretinal motion
signals: A new look at efference copy and corollary discharge theories. Journal of Vision, 8,
1–14.
Petrov, Y., & Glennerster, A. (2006). Disparity with respect to a local reference plane as a
dominant cue for stereoscopic depth relief. Vision Research, 46, 4321-4332.
Previc, F.H., Breitmeyer, B.G., & Weinstein, L.F. (1995). Discriminability of random-dot
stereograms in three-dimensional space. International Journal of Neuroscience, 80, 247-53.
van Rijn, L.J., Van Der Steen, J., & Collewijn, H. (1992). Visually induced cycloversion and
cyclovergence. Vision Research, 32, 1875-1883.
Porcar, E., and Martinez-Palomera, A. (1997). prevalence of general binocular dysfunction in a
population of university students. Optom. Vision Sci. 74, 111–113.
Rogers, B.J., & Bradshaw, M.F. (1999). Disparity minimisation, cyclovergence, and the validity
of nonius lines as a technique for measuring torsional alignment. Perception, 28, 127-141.
Scarfe, P., & Hibbard, P.B. (2006). Disparity-defined objects moving in depth do not elicit three-
dimensional shape constancy. Vision Research, 46, 1599-1610.
Schreiber, K. M., Hillis, J. M., Filippini, H. R., Schor, C. M., & Banks, M. S. (2008). The surface
of the empirical horopter. Journal of Vision, 8(3):7, 1-20
Siderov, J., Harwerth, R.S., & Bedell, H.E. (1999). Stereopsis, cyclovergence and the
backwards tilt of the vertical horopter. Vision Research, 39, 1347-1357.
Watanabe, Y., Kezuka, T., Harasawa, K., Usui, M., Yaguchi, H., & Shioiri, S. (2008). A new
method for assessing motion-in-depth perception in strabismic patients. British Journal of
Ophthalmology, 92, 47–50.
Westheimer, G., & McKee, S.P. (1978). Stereoscopic acuity for moving retinal images. Journal
of the Optical Society of America, 68, 450-455.
35
Wichmann, F.A., & Hill, N.J. (2001a). The psychometric function: I. Fitting, sampling and
goodness of fit. Perception and Psychophysics, 63(8), 1293-1313
Wichmann, F.A., & Hill, N.J. (2001b). The psychometric function: II. Bootstrap-based
confidence intervals and sampling. Perception and Psychophysics, 63(8), 1314-1329.
Wilmer, J. B. (2008). How to use individual differences to isolate functional organization,
biology, and utility of visual functions; with illustrative proposals for stereopsis. Spat. Vis. 21,
561–579.
36
Appendix
To extract binocular disparity correctly, the eyes must be in correspondence. This means that
Figure 7
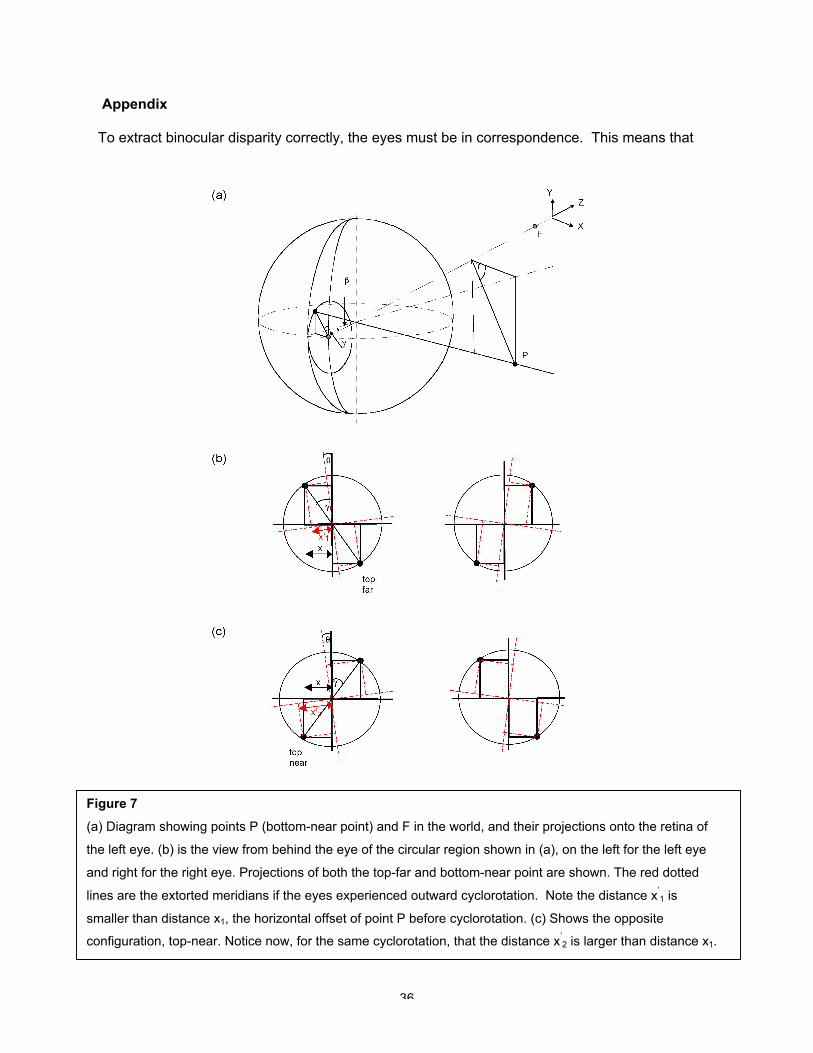
(a) Diagram showing points P (bottom-near point) and F in the world, and their projections onto the retina of
the left eye. (b) is the view from behind the eye of the circular region shown in (a), on the left for the left eye
and right for the right eye. Projections of both the top-far and bottom-near point are shown. The red dotted
lines are the extorted meridians if the eyes experienced outward cyclorotation. Note the distance x’1 is
smaller than distance x1, the horizontal offset of point P before cyclorotation. (c) Shows the opposite
configuration, top-near. Notice now, for the same cyclorotation, that the distance x’2 is larger than distance x1.
37
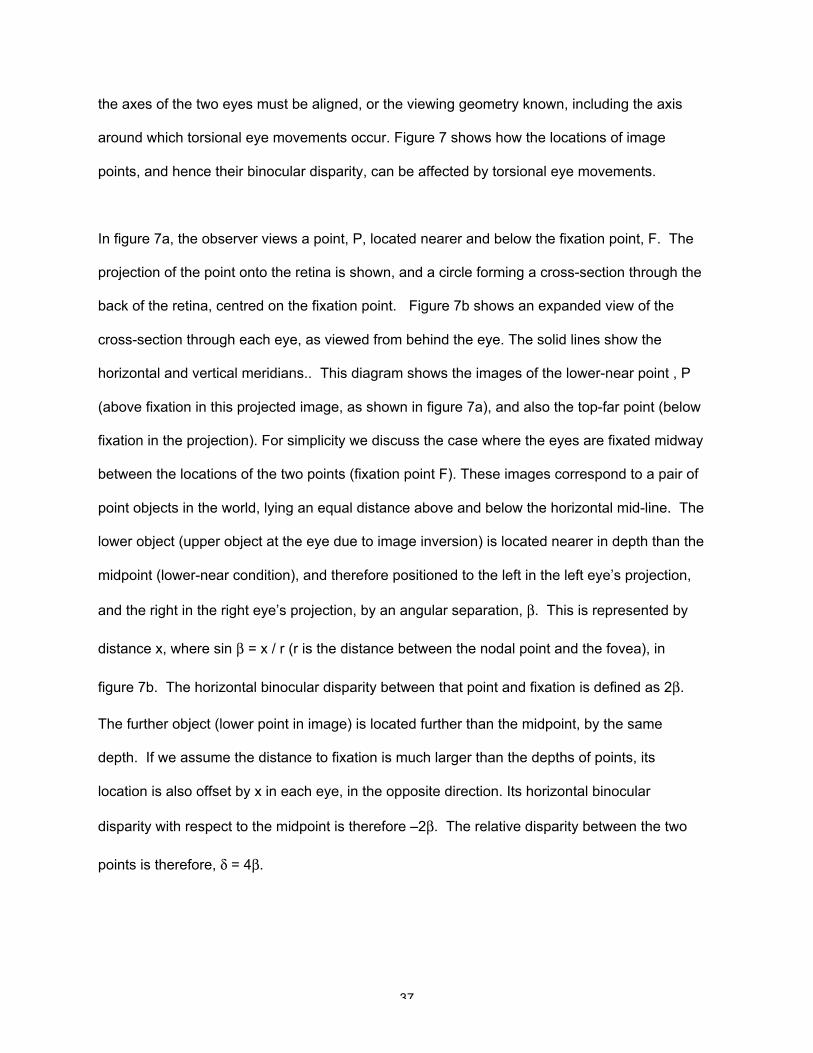
the axes of the two eyes must be aligned, or the viewing geometry known, including the axis
around which torsional eye movements occur. Figure 7 shows how the locations of image
points, and hence their binocular disparity, can be affected by torsional eye movements.
In figure 7a, the observer views a point, P, located nearer and below the fixation point, F. The
projection of the point onto the retina is shown, and a circle forming a cross-section through the
back of the retina, centred on the fixation point. Figure 7b shows an expanded view of the
cross-section through each eye, as viewed from behind the eye. The solid lines show the
horizontal and vertical meridians.. This diagram shows the images of the lower-near point , P
(above fixation in this projected image, as shown in figure 7a), and also the top-far point (below
fixation in the projection). For simplicity we discuss the case where the eyes are fixated midway
between the locations of the two points (fixation point F). These images correspond to a pair of
point objects in the world, lying an equal distance above and below the horizontal mid-line. The
lower object (upper object at the eye due to image inversion) is located nearer in depth than the
midpoint (lower-near condition), and therefore positioned to the left in the left eye’s projection,
and the right in the right eye’s projection, by an angular separation, β. This is represented by
distance x, where sin β = x / r (r is the distance between the nodal point and the fovea), in
figure 7b. The horizontal binocular disparity between that point and fixation is defined as 2β.
The further object (lower point in image) is located further than the midpoint, by the same
depth. If we assume the distance to fixation is much larger than the depths of points, its
location is also offset by x in each eye, in the opposite direction. Its horizontal binocular
disparity with respect to the midpoint is therefore –2β. The relative disparity between the two
points is therefore, δ = 4β.
38
Now consider what happens if the eyes undergo a slight cyclo-rotation outwards (shown by the
red dashed lines). The horizontal offset of each point from the midpoint is now smaller, equal
to x1′, which is related to the original x by:
x1′ = x sin(γ-θ) / sin(γ), (A1)
where γ is the angle between the original vertical axis and a line joining the image of P to the
image of F, and θ is the cyclo-rotation angle of the eye. The apparent angular separation, β’, is
given by:
sin (β’) = x1′ sin (β) / x. (A2)
The effective binocular disparity (relative to the extorted horizontal-vertical axis) between the
two points is therefore given by:
δ1′ = 4 sin-1[ sin(β) sin(γ-θ) / sin(γ)]. (A3)
The same direction of cyclorotation has a different effect on objects arranged in the other
configuration (top-near). Figure 7c shows the effects of cyclorotation when the upper object
(lower in image) is near and the lower object (upper in image) far. Now, the horizontal offset of
each point is larger than before the rotation, given by:
x2′ = x sin(γ+θ) / sin(γ), (A4)
And the effective disparity is correspondingly larger:
39
δ2′ = 4 sin-1[ sin(β) sin(γ+θ) / sin(γ)]. (A5)
Thus, the apparent binocular disparity will be larger for the top-near configuration than for the
top-far configuration. Note that the expressions derived in equations (A3) and (A5) are also
obtained if the observer fixates either target. Using the above equations, is it possible to
predict the expected depth bias, if observers were subject to a small cyclotorsion.
If we make some simplifying assumptions, that the viewing distance to the points is much larger
than the depth separation between them, and that they are located close to, or at, the midline,
the apparent depths can be calculated. Specifically, we assume (i) β ≈ sin β; and (ii) δ1′ ≈ sin
δ1′, and δ2′ ≈ sin δ2′, then from equations A3 and A5, the disparity difference between the two
situations is simplified to:
δ2′ - δ1′ ≈ (4β/ sin(γ))(sin(γ+θ)-sin(γ-θ)) (A6)
and using standard trigonometric identities this becomes:
δ2′ - δ1′ ≈ 8βsinθ/ tan(γ). (A7)
From above, we know that δ = 4β, then equation A7 is simplified to:
δ2′ - δ1′ ≈ 2δsinθ/ (tan(γ)). (A8)
From further trigonometry, we can estimate tan(γ) as:
tan(γ) ≈ IZ/2YD (A9)
40
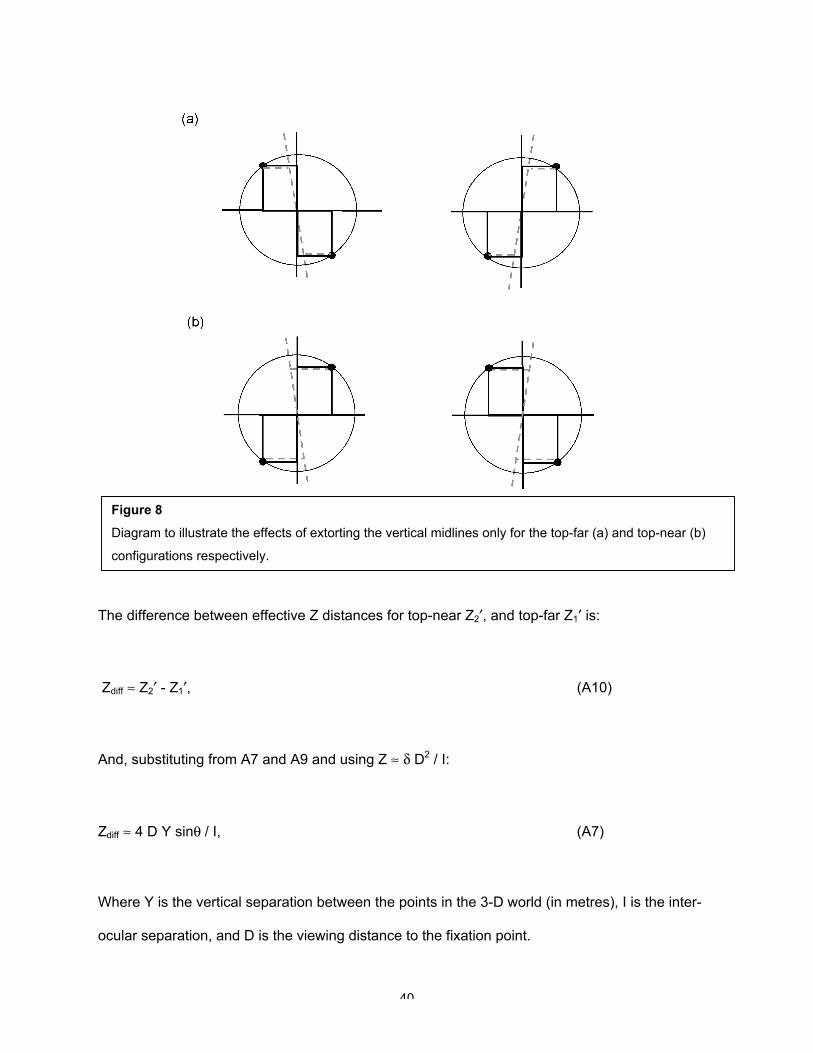
The difference between effective Z distances for top-near Z2′, and top-far Z1′ is:
Zdiff ≈ Z2′ - Z1′, (A10)
And, substituting from A7 and A9 and using Z ≈ δ D2 / I:
Zdiff ≈ 4 D Y sinθ / I, (A7)
Where Y is the vertical separation between the points in the 3-D world (in metres), I is the inter-
ocular separation, and D is the viewing distance to the fixation point.
Figure 8
Diagram to illustrate the effects of extorting the vertical midlines only for the top-far (a) and top-near (b)
configurations respectively.
41
Slightly different predictions are obtained if the eyes remained aligned, but we consider depth
perception errors occurring due to the tilt of the vertical horopter. Following a similar logic to
that above, an equation can be derived that links the depth difference between the two
configurations with the vertical meridian extortion (where θ is now the rotation, in opposite
directions, of each eye’s meridian, and the other symbols are as above):
Zdiff ≈ 4 D Y tanθ / I, (A8)
Equations A7 and A8 provide predictions for the expected depth difference, or bias, between
the two stimulus configurations.