Embed Size (px)
Citation preview
RESEARCH ARTICLE Open Access
Perception of quality health care deliveryunder capitation payment: a cross-sectionalsurvey of health insurance subscribers andproviders in GhanaFrancis-Xavier Andoh-Adjei1*, Eric Nsiah-Boateng1, Felix Ankomah Asante2, Ernst Spaan3 and Koos van der Velden4
Abstract
Background: Ghana introduced capitation payment method in 2012 but was faced with resistance for itsperceived poor quality of care. This paper assesses National Health Insurance Scheme subscribers and careproviders’ perception of quality of care under the capitation payment method.
Methods: This is a cross-sectional survey of subscribers and care providers perception of quality of care in threeadministrative regions of Ghana using a 5-point Likert scale for the assessment based on a set of quality of caremeasures. We performed descriptive analysis to determine average perception of quality of care scores for each ofthe measures used. Bivariate and multivariate analyses were also performed to examine relationships betweenrespondent’s characteristics and their perception of quality of care.
Results: In general, subscribers expressed positive perception about the quality of care though subscribers inAshanti were less positive compared to those in the Central region. A chi-square analysis, however, showedsignificant differences in subscribers’ perception of quality of care by occupation (p = 0.002), region (p = 0.007)length of NHIS membership (p = 0.006), and age (p = 0.014). Multivariate logistic regression analysis also showedthat different factors, other than region of residence, were significantly associated with perceived good quality ofcare. Analysis of health care providers’ responses also showed significant differences in their perception of quality ofcare by region (p = 0.001). Multivariate logistic model showed that health care providers in the Volta region (OR = 0.14, 95% CI: 0.03–0.58) were significantly less likely to perceive quality of care as good compared to those in theAshanti region.
Conclusion: Subscribers and care providers across the three regions have relatively good perception of the qualityof health care in general though subscribers in Ashanti were less positive than those in the Central region. It is,therefore, plausible that capitation payment may have influenced the relatively low perception of quality of care inthe Ashanti region.
Keywords: Capitation payment, Perceived quality of care, Health care providers, Health insurance subscribers,Ghana
* Correspondence: [email protected] 36-6th Avenue, Ridge. PMB Ministries Post Office, Accra, GhanaFull list of author information is available at the end of the article
© The Author(s). 2018 Open Access This article is distributed under the terms of the Creative Commons Attribution 4.0International License (http://creativecommons.org/licenses/by/4.0/), which permits unrestricted use, distribution, andreproduction in any medium, provided you give appropriate credit to the original author(s) and the source, provide a link tothe Creative Commons license, and indicate if changes were made. The Creative Commons Public Domain Dedication waiver(http://creativecommons.org/publicdomain/zero/1.0/) applies to the data made available in this article, unless otherwise stated.
Andoh-Adjei et al. BMC Family Practice (2018) 19:37 https://doi.org/10.1186/s12875-018-0727-4
BackgroundGhana introduced a National Health Insurance Scheme(NHIS) in 2003 to provide financial health protectionagainst the cost of health care services for the popula-tion. Initially, the National Health Insurance Authority(NHIA) applied fee-for-service (FFS) method for thepayment of its credentialed providers but had to intro-duce diagnosis-related-grouping (DRG) payment withthe view to addressing observed increases in utilizationand claims expenditures [1]. Years into the implementa-tion, the DRG was found to have further contributed tocost escalation, almost tripling the claims expendituremade under the fee-for-service dispensation. After care-ful consideration of the issue, the NHIA decided tointroduce capitation payment for primary out-patients’services beginning with a pilot in the Ashanti region ofGhana. The decision to pilot capitation payment in theAshanti region of Ghana, however, engendered variousreactions from providers as well as politicians and civilsociety groups. In a press release carried by the Ghan-aian Times newspaper of 02/01/2012, the Chairman ofthe Association of Private Medical and Dental Practi-tioners was quoted to have stated that “the system (capi-tation payment) is detrimental to quality health careprovision and a major threat to the survival of privatehealth facilities”. This was followed by a publication inthe Daily Guide newspaper of 25/01/2012 which quotedthe President of the Ashanti Development Union(ADU), a civil society group, as saying “informationreaching my office indicates that since the implementa-tion of the (capitation) policy in the region three weeksago hospital attendance has gone down considerably” asituation that suggests perceived poor quality of care onthe part of health insurance subscribers in the regionfollowing the introduction of the capitation paymentpolicy [2]. With the on-going debate on capitation pay-ment and it’s perceived negative effects on careprovision, it is instructive to assess the perception ofboth users and providers of health care services aboutthe quality of care provision. Haddad et al. note that as-sessment of quality of primary care could be enhancedby including patients’ perceptions as well as professionaljudgment of quality [3]. Patients’ perception of servicequality, in particular, has become a vital aspect of qualityassessment of health care because of the relationship be-tween health care utilization and user perception ofquality [4, 5]. Mack et al. are of the view that “without adirect assessment of patients’ values”, policy makers“may create standards of care that meet physicians’values better than those of patients” [6]; and eventhough patients’ perception of quality may not necessar-ily be in conformity with professional standards of qual-ity an exploration of patients’ perception could yielduseful information for improving quality care delivery
[3]. Studies on Ghana’s capitation payment sighted in lit-erature focused on knowledge, perception and expecta-tions of insured clients [7], subscriber-provider trustrelationship [8], the challenges associated with the im-plementation of the capitation payment in the Ashantiregion [9] and capitation payment and membership re-tention [10] . We are yet to find any specific study onNHIS’ provider payment method and how that influencesubscribers and providers’ perception of quality of care.The objective of this study was, therefore, to assessNHIS subscribers and credentialed providers’ perceptionof quality care under the capitation payment regime inthe Ashanti region alongside those of two other regionsthat are yet to implement capitation payment in order toestablish whether capitation payment influences sub-scribers and health care providers’ perception of qualitycare in the Ashanti region. A better understanding ofboth subscribers and providers perspectives having real-world experience of capitation payment in primary caredelivery, will contribute to the on-going debate and pro-vide guidance for the NHIA as they plan to scale upcapitation payment countrywide. It will equally provideguidance to other low/middle-income countries consid-ering capitation payment as a provider payment methodin their health insurance scheme and also add to existingliterature on factors that influence quality of care per-ception of both healthcare providers and users of health-care services.
MethodsStudy designWe adopted a survey design for the study. Since nobaseline study was done prior to the implementation ofthe policy in the Ashanti region to enable comparison inorder to determine the effect of the capitation paymenton subscribers and providers’ perception of quality carein the Ashanti region, we adopted the post-test-onlywith non-equivalent group design [11] and purposivelyselected Volta and Central regions that were being pre-pared for the next implementation phase as “control” re-gions to enable the establishment of any relationshipbetween capitation payment and clients/providers’ per-ceived quality of care in the Ashanti region. We adoptedperceived quality of care frameworks, several of whichhave been developed to help assess users and providersof health care services’ perception of quality care deliv-ery [5]; [12]; [13]; [14, 15], to guide our study. In theirdescription and development of a 16-item scale to meas-ure perceived quality in India, Rao et al. [4] identifiedfive distinct dimensions of perceived quality, namely (i)medicine availability, (ii) medical information given topatients by their physician (iii) staff behavior towards pa-tients, (iv) doctors’ interpersonal behavior such as theirresponsiveness to the patients’ concerns, and (v) the
Andoh-Adjei et al. BMC Family Practice (2018) 19:37 Page 2 of 12
hospitals’ infrastructure such as cleanliness and availabil-ity of other amenities). Amala de Silva [16] also identi-fied dimensions of quality as dignity, autonomy,confidentiality, prompt attention, quality of basic amen-ities, access to social support networks during care andchoice of care provider. Drawing on these and otherexisting frameworks we developed an 18-item scale and12-item scale to assess the perception of subscribers andproviders, respectively, on quality of care under capita-tion payment regime. The item scales were clusteredaround six key dimensions: (i) staff availability andprompt attention; (ii) dignity and respect; (iii) confiden-tiality; (iv) service quality; (v) communication; and (vi)accommodation/cleanliness.
Research settingThe study took place in three regions of Ghana: Ashanti,Volta and Central regions in 2014. The Ashanti region isthe first among the 10 regions in Ghana to begin the im-plementation of the capitation payment policy in 2012,and was therefore selected as the “intervention” regionfor the study. The policy will be implemented in theVolta region from 2016 and in the Central region in
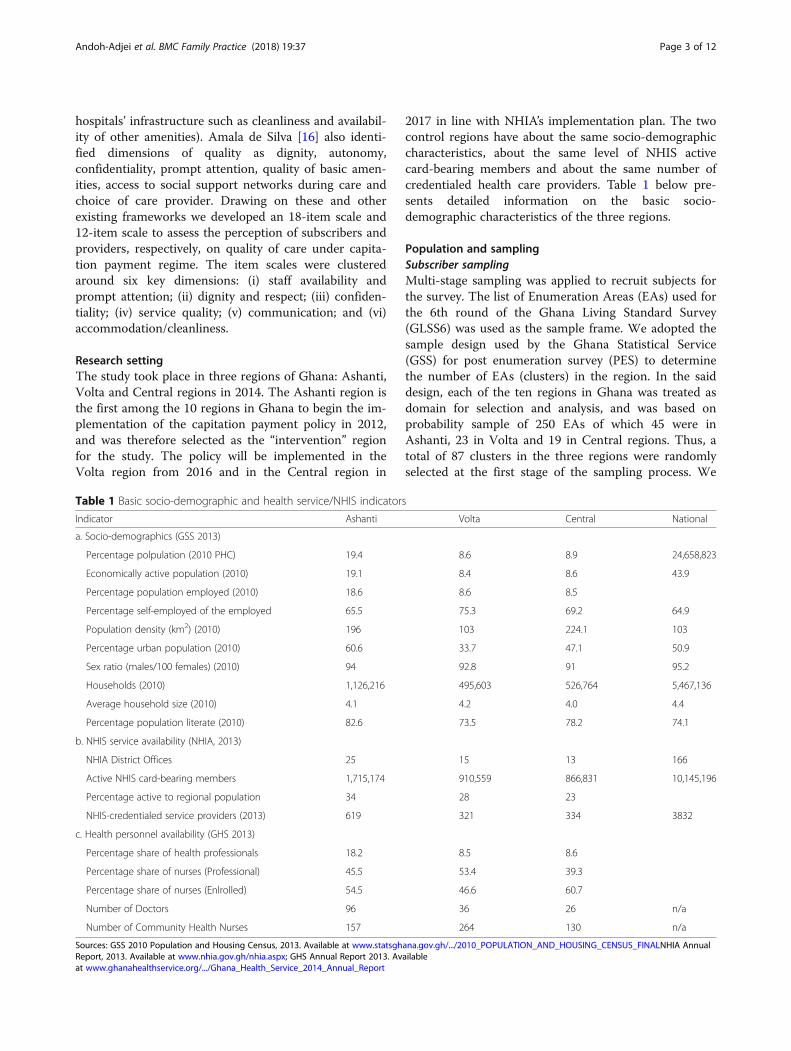
2017 in line with NHIA’s implementation plan. The twocontrol regions have about the same socio-demographiccharacteristics, about the same level of NHIS activecard-bearing members and about the same number ofcredentialed health care providers. Table 1 below pre-sents detailed information on the basic socio-demographic characteristics of the three regions.
Population and samplingSubscriber samplingMulti-stage sampling was applied to recruit subjects forthe survey. The list of Enumeration Areas (EAs) used forthe 6th round of the Ghana Living Standard Survey(GLSS6) was used as the sample frame. We adopted thesample design used by the Ghana Statistical Service(GSS) for post enumeration survey (PES) to determinethe number of EAs (clusters) in the region. In the saiddesign, each of the ten regions in Ghana was treated asdomain for selection and analysis, and was based onprobability sample of 250 EAs of which 45 were inAshanti, 23 in Volta and 19 in Central regions. Thus, atotal of 87 clusters in the three regions were randomlyselected at the first stage of the sampling process. We
Table 1 Basic socio-demographic and health service/NHIS indicators
Indicator Ashanti Volta Central National
a. Socio-demographics (GSS 2013)
Percentage polpulation (2010 PHC) 19.4 8.6 8.9 24,658,823
Economically active population (2010) 19.1 8.4 8.6 43.9
Percentage population employed (2010) 18.6 8.6 8.5
Percentage self-employed of the employed 65.5 75.3 69.2 64.9
Population density (km2) (2010) 196 103 224.1 103
Percentage urban population (2010) 60.6 33.7 47.1 50.9
Sex ratio (males/100 females) (2010) 94 92.8 91 95.2
Households (2010) 1,126,216 495,603 526,764 5,467,136
Average household size (2010) 4.1 4.2 4.0 4.4
Percentage population literate (2010) 82.6 73.5 78.2 74.1
b. NHIS service availability (NHIA, 2013)
NHIA District Offices 25 15 13 166
Active NHIS card-bearing members 1,715,174 910,559 866,831 10,145,196
Percentage active to regional population 34 28 23
NHIS-credentialed service providers (2013) 619 321 334 3832
c. Health personnel availability (GHS 2013)
Percentage share of health professionals 18.2 8.5 8.6
Percentage share of nurses (Professional) 45.5 53.4 39.3
Percentage share of nurses (Enlrolled) 54.5 46.6 60.7
Number of Doctors 96 36 26 n/a
Number of Community Health Nurses 157 264 130 n/a
Sources: GSS 2010 Population and Housing Census, 2013. Available at www.statsghana.gov.gh/.../2010_POPULATION_AND_HOUSING_CENSUS_FINALNHIA AnnualReport, 2013. Available at www.nhia.gov.gh/nhia.aspx; GHS Annual Report 2013. Availableat www.ghanahealthservice.org/.../Ghana_Health_Service_2014_Annual_Report
Andoh-Adjei et al. BMC Family Practice (2018) 19:37 Page 3 of 12
then used the WHO revised Expanded Programme ofImmunization (EPI) survey reference manual [17] asguide for determining the sample size per EA. We optedfor the desired precision level of ±3% and expectedcoverage of 95% to determine the number of subjects forthe survey. On the basis of the WHO immunizationcoverage cluster survey reference manual, we arrived at10 subjects per cluster (EA) for Ashanti giving a repre-sentative sample of 450 households (subjects), 18 sub-jects for Volta giving a sample of 414 households and 21clusters for the central region giving a sample of 399household (Additional file 1). We therefore selected atotal of 1, 263 samples for the study. We then soughtthe assistance of personnel of the Ghana StatisticalService to draw a list of the households and their re-placements which was given to the interviewers foreach of the 3 regions for the field interviews. In eachhousehold an adult card-bearing member aged18 years and above was randomly selected andinterviewed.
Provider samplingWe used the G-power analysis programme (G* Power3.1) [18, 19] to determine the appropriate sample size ofcredentialed providers. We assumed an effect size of 0.4,an alpha (α) of 0.05 and beta (1-β) of 0.80; and allocationratio (N2/N1) of 1.1. The outputs were 200 samples: 95for group one (intervention region) and 105 for grouptwo (the control regions). Based on the total number ofNHIS-credentialed providers in the two control regionsas at the end of year 2013, we proportionally allocated48% of the samples for the control regions to Volta and52% to Central, respectively.
Data collection methodWe administered closed-ended questionnaires on 200credentialed providers and 1263 subscribers in the threeregions using face-to-face interview. The questionnairefocused on socio-demographic characteristics of respon-dents and their perception of quality of care under capi-tation payment regime. We asked both subscribers andhealthcare providers to score the quality of care state-ments on a 5-point Likert scale of don’t know (0);strongly disagree (1); disagree (2); agree (3); and stronglyagree (4) Additional file 2.
Data analysisFirst, we performed a principal component analysis(PCA) to transform the set of statements for asses-sing quality of care into five uncorrelated compo-nents of dignity and respect, confidentiality, servicequality, communication, and accommodation/cleanli-ness [4]; [5]; [12]; [13]; [14]; [15]; [16]. The factorscores obtained from this analysis were used to
estimate mean perception score for each respondent.Respondents who obtained positive mean perceptionscore were assigned to “perceived good quality ofcare” group and those who obtained negative meanscore were assigned to a “perceived poor quality ofcare” group. Subsequently, we performed a Chi-square test to determine relationship between re-spondents’ socio-demographic characteristics and thebinary outcome variable “perception of quality ofcare” (perceived good quality of care = 1; perceivedpoor quality of care = 0). The bivariate analysis wasconducted to test independent associations betweeneach independent variable and the outcome variable,and to only advance those that show statistical significanceat p < 0.10 to a multivariate logistic regression model forfurther analysis (http://www.populationsurvey.com/). Inthe first multivariate logistic regression model to de-termine associations between the independent vari-ables and subscribers “perceived good quality of care”,gender, education level, and card used in past 2 yearswere included in the model despite the set statisticalsignificant threshold for inclusion. In the secondmodel to examine association between the independentvariables and healthcare providers “perceived goodquality of care”, age, gender, primary status at healthfacility, years in practice, health facility ownership andhealth facility were included in model. We decided toinclude all the eight independent variables in thehealthcare providers’ model, having noted in literature[20, 21] that all the variables listed had some relation-ship with quality of care.We also examined the total variance in respon-
dents’ perception of quality of care delivery ex-plained by the components extracted. As a criterion,only components with eigenvalue of one or morewere retained. That is, we dropped any componentthat accounted for less variance than did a singlequestion or variable. Varimax rotation with KaiserNormalization was then employed to minimize thecomplexity of the components by making the largeloadings larger and small loadings smaller withineach component. The PCA produced a Kaiser-Meyer-Olkin (KMO) measure of sampling adequacyof 0.813 and Bartlett’s test of sphericity of p < 0.001for the 18 statements for assessing subscribers per-ception of care and 0.770 and p < 0.001 for the 12statements for healthcare providers’ perception ofquality of care delivery. The proportion of varianceexplained by each component for subscribers’ andhealthcare providers’ perception of quality of careare attached as Additional files 3 and 4, respectively.The analyses were performed using Stata version 13and SPSS version 20 softwares and the results sum-marized in tables.
Andoh-Adjei et al. BMC Family Practice (2018) 19:37 Page 4 of 12
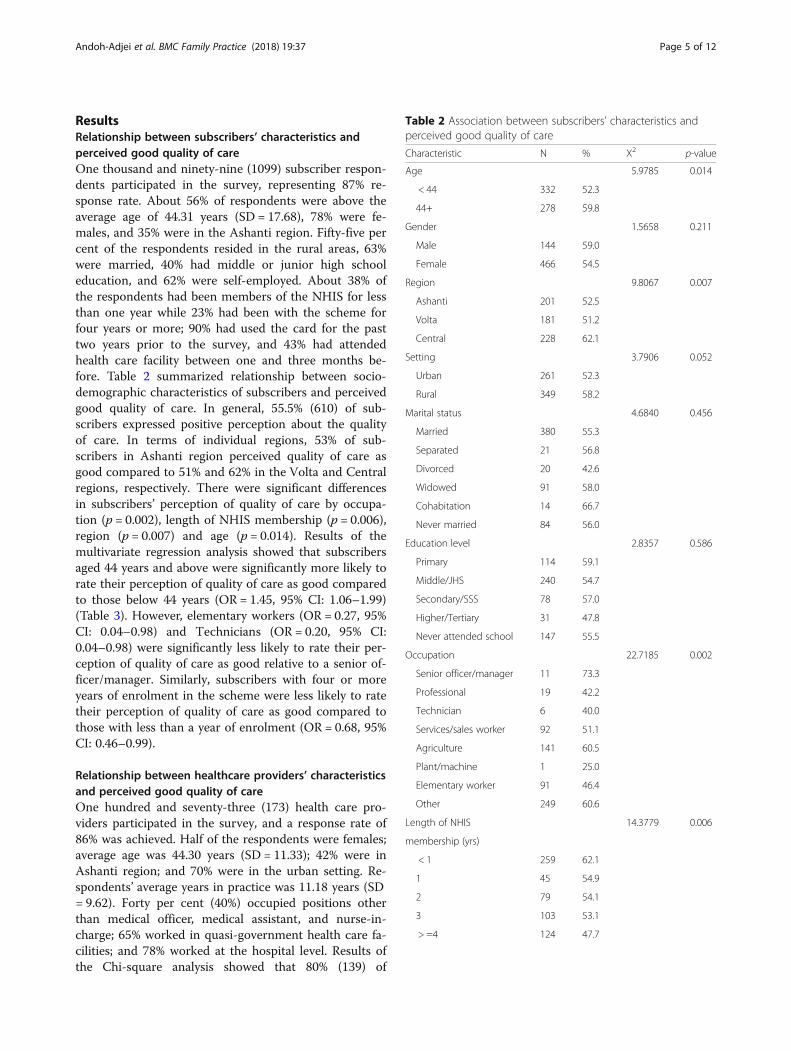
ResultsRelationship between subscribers’ characteristics andperceived good quality of careOne thousand and ninety-nine (1099) subscriber respon-dents participated in the survey, representing 87% re-sponse rate. About 56% of respondents were above theaverage age of 44.31 years (SD = 17.68), 78% were fe-males, and 35% were in the Ashanti region. Fifty-five percent of the respondents resided in the rural areas, 63%were married, 40% had middle or junior high schooleducation, and 62% were self-employed. About 38% ofthe respondents had been members of the NHIS for lessthan one year while 23% had been with the scheme forfour years or more; 90% had used the card for the pasttwo years prior to the survey, and 43% had attendedhealth care facility between one and three months be-fore. Table 2 summarized relationship between socio-demographic characteristics of subscribers and perceivedgood quality of care. In general, 55.5% (610) of sub-scribers expressed positive perception about the qualityof care. In terms of individual regions, 53% of sub-scribers in Ashanti region perceived quality of care asgood compared to 51% and 62% in the Volta and Centralregions, respectively. There were significant differencesin subscribers’ perception of quality of care by occupa-tion (p = 0.002), length of NHIS membership (p = 0.006),region (p = 0.007) and age (p = 0.014). Results of themultivariate regression analysis showed that subscribersaged 44 years and above were significantly more likely torate their perception of quality of care as good comparedto those below 44 years (OR = 1.45, 95% CI: 1.06–1.99)(Table 3). However, elementary workers (OR = 0.27, 95%CI: 0.04–0.98) and Technicians (OR = 0.20, 95% CI:0.04–0.98) were significantly less likely to rate their per-ception of quality of care as good relative to a senior of-ficer/manager. Similarly, subscribers with four or moreyears of enrolment in the scheme were less likely to ratetheir perception of quality of care as good compared tothose with less than a year of enrolment (OR = 0.68, 95%CI: 0.46–0.99).
Relationship between healthcare providers’ characteristicsand perceived good quality of careOne hundred and seventy-three (173) health care pro-viders participated in the survey, and a response rate of86% was achieved. Half of the respondents were females;average age was 44.30 years (SD = 11.33); 42% were inAshanti region; and 70% were in the urban setting. Re-spondents’ average years in practice was 11.18 years (SD= 9.62). Forty per cent (40%) occupied positions otherthan medical officer, medical assistant, and nurse-in-charge; 65% worked in quasi-government health care fa-cilities; and 78% worked at the hospital level. Results ofthe Chi-square analysis showed that 80% (139) of
Table 2 Association between subscribers’ characteristics andperceived good quality of care
Characteristic N % X2 p-value
Age 5.9785 0.014
< 44 332 52.3
44+ 278 59.8
Gender 1.5658 0.211
Male 144 59.0
Female 466 54.5
Region 9.8067 0.007
Ashanti 201 52.5
Volta 181 51.2
Central 228 62.1
Setting 3.7906 0.052
Urban 261 52.3
Rural 349 58.2
Marital status 4.6840 0.456
Married 380 55.3
Separated 21 56.8
Divorced 20 42.6
Widowed 91 58.0
Cohabitation 14 66.7
Never married 84 56.0
Education level 2.8357 0.586
Primary 114 59.1
Middle/JHS 240 54.7
Secondary/SSS 78 57.0
Higher/Tertiary 31 47.8
Never attended school 147 55.5
Occupation 22.7185 0.002
Senior officer/manager 11 73.3
Professional 19 42.2
Technician 6 40.0
Services/sales worker 92 51.1
Agriculture 141 60.5
Plant/machine 1 25.0
Elementary worker 91 46.4
Other 249 60.6
Length of NHIS 14.3779 0.006
membership (yrs)
< 1 259 62.1
1 45 54.9
2 79 54.1
3 103 53.1
> =4 124 47.7
Andoh-Adjei et al. BMC Family Practice (2018) 19:37 Page 5 of 12
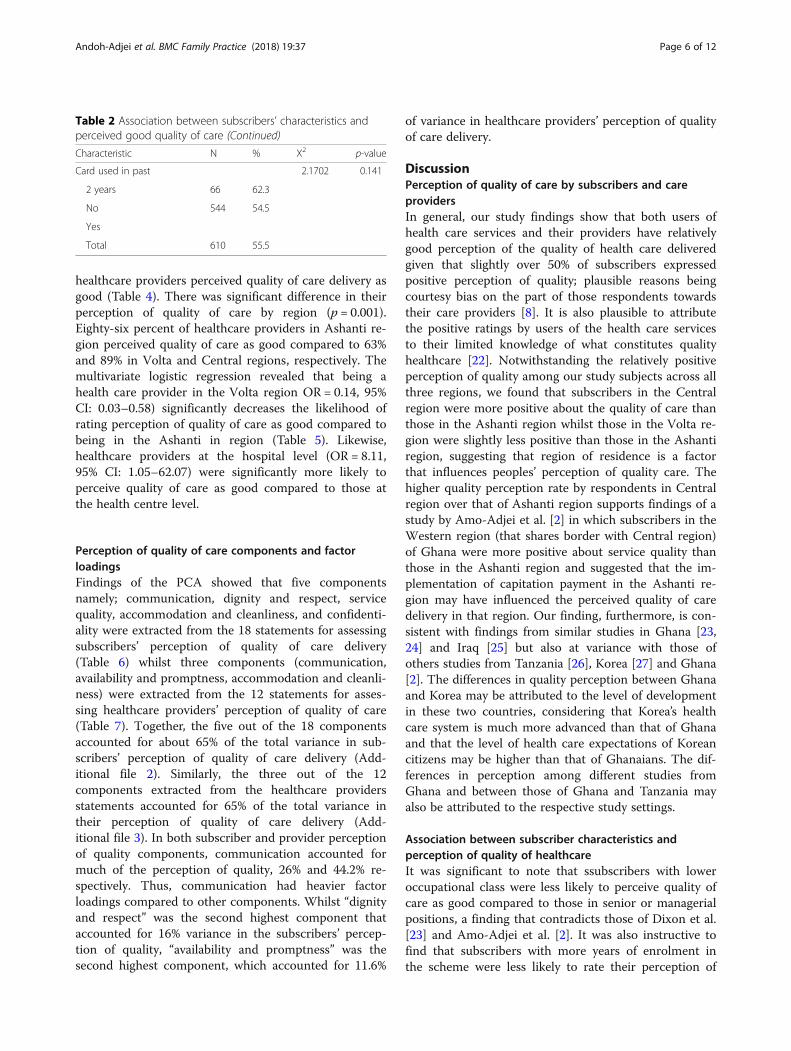
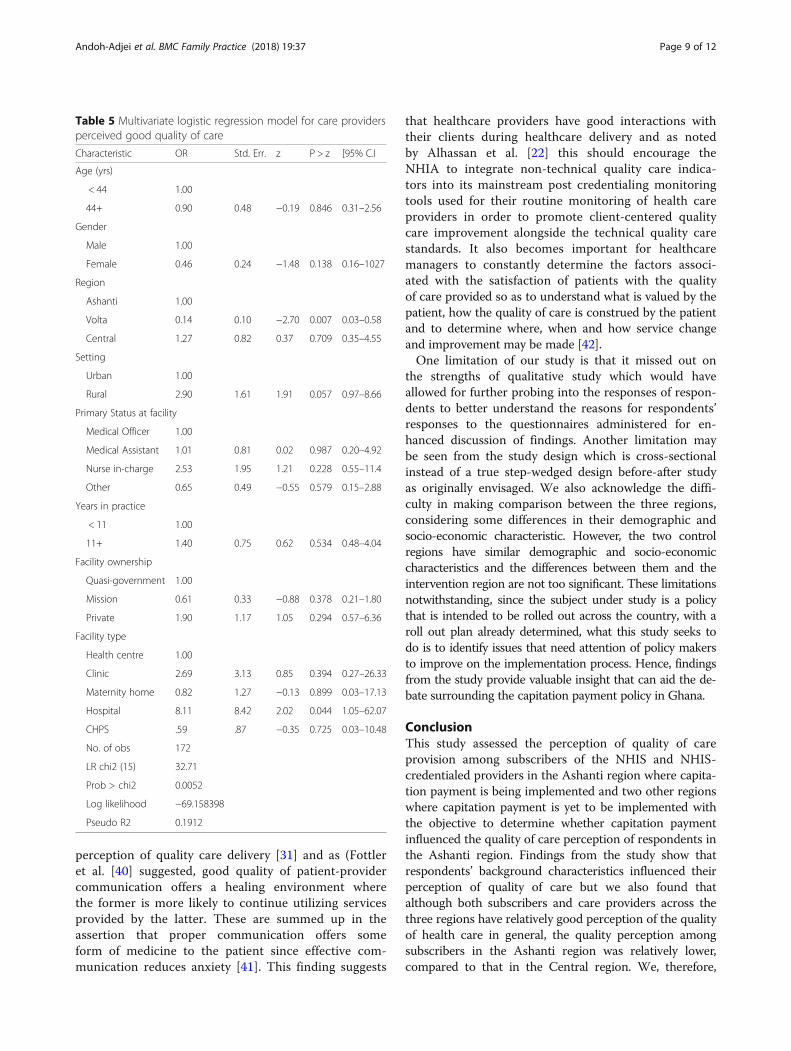
healthcare providers perceived quality of care delivery asgood (Table 4). There was significant difference in theirperception of quality of care by region (p = 0.001).Eighty-six percent of healthcare providers in Ashanti re-gion perceived quality of care as good compared to 63%and 89% in Volta and Central regions, respectively. Themultivariate logistic regression revealed that being ahealth care provider in the Volta region OR = 0.14, 95%CI: 0.03–0.58) significantly decreases the likelihood ofrating perception of quality of care as good compared tobeing in the Ashanti in region (Table 5). Likewise,healthcare providers at the hospital level (OR = 8.11,95% CI: 1.05–62.07) were significantly more likely toperceive quality of care as good compared to those atthe health centre level.
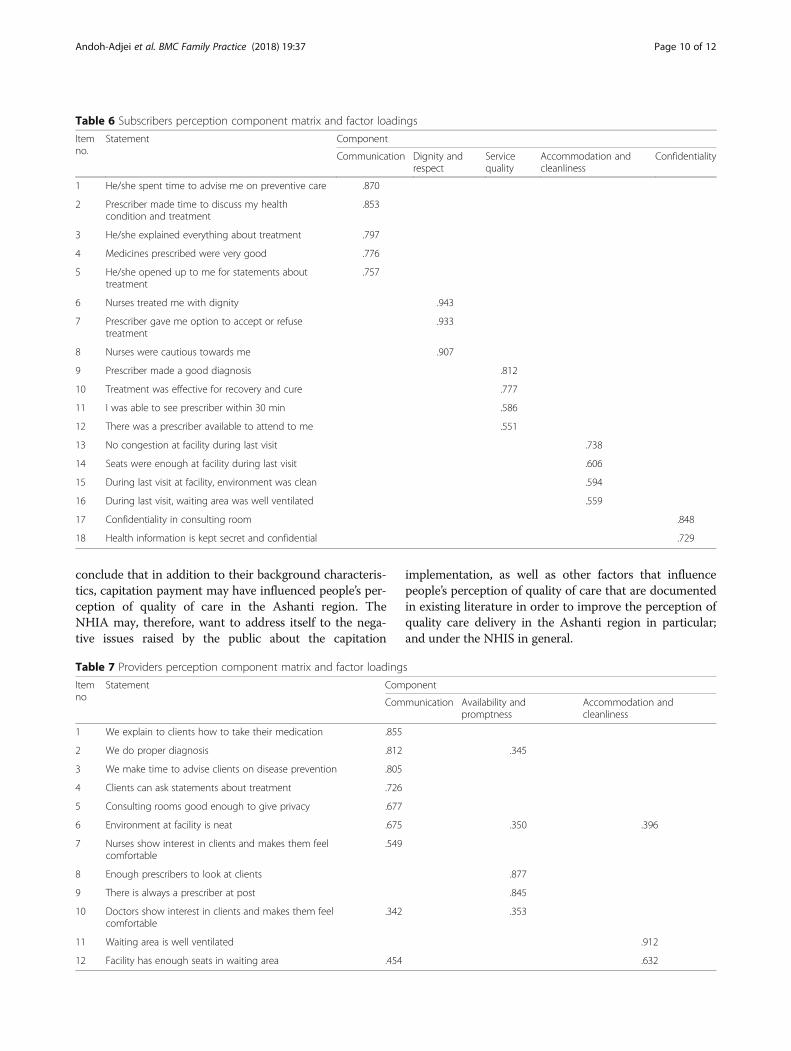
Perception of quality of care components and factorloadingsFindings of the PCA showed that five componentsnamely; communication, dignity and respect, servicequality, accommodation and cleanliness, and confidenti-ality were extracted from the 18 statements for assessingsubscribers’ perception of quality of care delivery(Table 6) whilst three components (communication,availability and promptness, accommodation and cleanli-ness) were extracted from the 12 statements for asses-sing healthcare providers’ perception of quality of care(Table 7). Together, the five out of the 18 componentsaccounted for about 65% of the total variance in sub-scribers’ perception of quality of care delivery (Add-itional file 2). Similarly, the three out of the 12components extracted from the healthcare providersstatements accounted for 65% of the total variance intheir perception of quality of care delivery (Add-itional file 3). In both subscriber and provider perceptionof quality components, communication accounted formuch of the perception of quality, 26% and 44.2% re-spectively. Thus, communication had heavier factorloadings compared to other components. Whilst “dignityand respect” was the second highest component thataccounted for 16% variance in the subscribers’ percep-tion of quality, “availability and promptness” was thesecond highest component, which accounted for 11.6%
of variance in healthcare providers’ perception of qualityof care delivery.
DiscussionPerception of quality of care by subscribers and careprovidersIn general, our study findings show that both users ofhealth care services and their providers have relativelygood perception of the quality of health care deliveredgiven that slightly over 50% of subscribers expressedpositive perception of quality; plausible reasons beingcourtesy bias on the part of those respondents towardstheir care providers [8]. It is also plausible to attributethe positive ratings by users of the health care servicesto their limited knowledge of what constitutes qualityhealthcare [22]. Notwithstanding the relatively positiveperception of quality among our study subjects across allthree regions, we found that subscribers in the Centralregion were more positive about the quality of care thanthose in the Ashanti region whilst those in the Volta re-gion were slightly less positive than those in the Ashantiregion, suggesting that region of residence is a factorthat influences peoples’ perception of quality care. Thehigher quality perception rate by respondents in Centralregion over that of Ashanti region supports findings of astudy by Amo-Adjei et al. [2] in which subscribers in theWestern region (that shares border with Central region)of Ghana were more positive about service quality thanthose in the Ashanti region and suggested that the im-plementation of capitation payment in the Ashanti re-gion may have influenced the perceived quality of caredelivery in that region. Our finding, furthermore, is con-sistent with findings from similar studies in Ghana [23,24] and Iraq [25] but also at variance with those ofothers studies from Tanzania [26], Korea [27] and Ghana[2]. The differences in quality perception between Ghanaand Korea may be attributed to the level of developmentin these two countries, considering that Korea’s healthcare system is much more advanced than that of Ghanaand that the level of health care expectations of Koreancitizens may be higher than that of Ghanaians. The dif-ferences in perception among different studies fromGhana and between those of Ghana and Tanzania mayalso be attributed to the respective study settings.
Association between subscriber characteristics andperception of quality of healthcareIt was significant to note that ssubscribers with loweroccupational class were less likely to perceive quality ofcare as good compared to those in senior or managerialpositions, a finding that contradicts those of Dixon et al.[23] and Amo-Adjei et al. [2]. It was also instructive tofind that subscribers with more years of enrolment inthe scheme were less likely to rate their perception of
Table 2 Association between subscribers’ characteristics andperceived good quality of care (Continued)
Characteristic N % X2 p-value
Card used in past 2.1702 0.141
2 years 66 62.3
No 544 54.5
Yes
Total 610 55.5
Andoh-Adjei et al. BMC Family Practice (2018) 19:37 Page 6 of 12
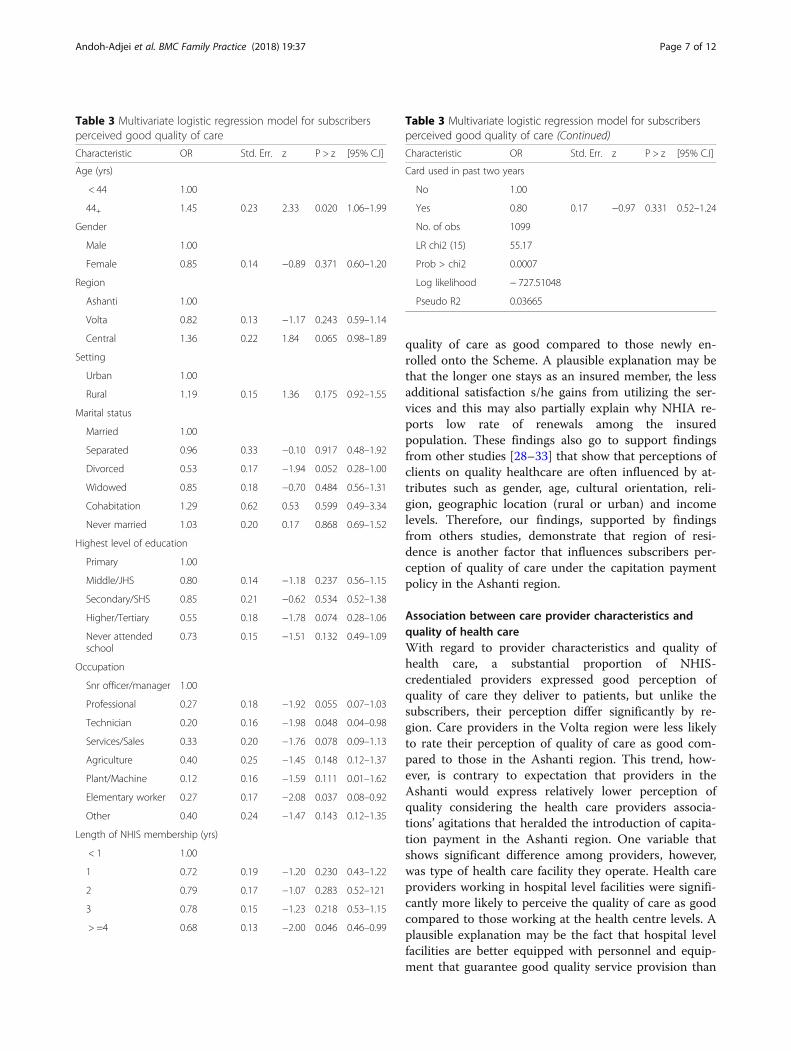
quality of care as good compared to those newly en-rolled onto the Scheme. A plausible explanation may bethat the longer one stays as an insured member, the lessadditional satisfaction s/he gains from utilizing the ser-vices and this may also partially explain why NHIA re-ports low rate of renewals among the insuredpopulation. These findings also go to support findingsfrom other studies [28–33] that show that perceptions ofclients on quality healthcare are often influenced by at-tributes such as gender, age, cultural orientation, reli-gion, geographic location (rural or urban) and incomelevels. Therefore, our findings, supported by findingsfrom others studies, demonstrate that region of resi-dence is another factor that influences subscribers per-ception of quality of care under the capitation paymentpolicy in the Ashanti region.
Association between care provider characteristics andquality of health careWith regard to provider characteristics and quality ofhealth care, a substantial proportion of NHIS-credentialed providers expressed good perception ofquality of care they deliver to patients, but unlike thesubscribers, their perception differ significantly by re-gion. Care providers in the Volta region were less likelyto rate their perception of quality of care as good com-pared to those in the Ashanti region. This trend, how-ever, is contrary to expectation that providers in theAshanti would express relatively lower perception ofquality considering the health care providers associa-tions’ agitations that heralded the introduction of capita-tion payment in the Ashanti region. One variable thatshows significant difference among providers, however,was type of health care facility they operate. Health careproviders working in hospital level facilities were signifi-cantly more likely to perceive the quality of care as goodcompared to those working at the health centre levels. Aplausible explanation may be the fact that hospital levelfacilities are better equipped with personnel and equip-ment that guarantee good quality service provision than
Table 3 Multivariate logistic regression model for subscribersperceived good quality of care
Characteristic OR Std. Err. z P > z [95% C.I]
Age (yrs)
< 44 1.00
44+ 1.45 0.23 2.33 0.020 1.06–1.99
Gender
Male 1.00
Female 0.85 0.14 −0.89 0.371 0.60–1.20
Region
Ashanti 1.00
Volta 0.82 0.13 −1.17 0.243 0.59–1.14
Central 1.36 0.22 1.84 0.065 0.98–1.89
Setting
Urban 1.00
Rural 1.19 0.15 1.36 0.175 0.92–1.55
Marital status
Married 1.00
Separated 0.96 0.33 −0.10 0.917 0.48–1.92
Divorced 0.53 0.17 −1.94 0.052 0.28–1.00
Widowed 0.85 0.18 −0.70 0.484 0.56–1.31
Cohabitation 1.29 0.62 0.53 0.599 0.49–3.34
Never married 1.03 0.20 0.17 0.868 0.69–1.52
Highest level of education
Primary 1.00
Middle/JHS 0.80 0.14 −1.18 0.237 0.56–1.15
Secondary/SHS 0.85 0.21 −0.62 0.534 0.52–1.38
Higher/Tertiary 0.55 0.18 −1.78 0.074 0.28–1.06
Never attendedschool
0.73 0.15 −1.51 0.132 0.49–1.09
Occupation
Snr officer/manager 1.00
Professional 0.27 0.18 −1.92 0.055 0.07–1.03
Technician 0.20 0.16 −1.98 0.048 0.04–0.98
Services/Sales 0.33 0.20 −1.76 0.078 0.09–1.13
Agriculture 0.40 0.25 −1.45 0.148 0.12–1.37
Plant/Machine 0.12 0.16 −1.59 0.111 0.01–1.62
Elementary worker 0.27 0.17 −2.08 0.037 0.08–0.92
Other 0.40 0.24 −1.47 0.143 0.12–1.35
Length of NHIS membership (yrs)
< 1 1.00
1 0.72 0.19 −1.20 0.230 0.43–1.22
2 0.79 0.17 −1.07 0.283 0.52–121
3 0.78 0.15 −1.23 0.218 0.53–1.15
> =4 0.68 0.13 −2.00 0.046 0.46–0.99
Table 3 Multivariate logistic regression model for subscribersperceived good quality of care (Continued)
Characteristic OR Std. Err. z P > z [95% C.I]
Card used in past two years
No 1.00
Yes 0.80 0.17 −0.97 0.331 0.52–1.24
No. of obs 1099
LR chi2 (15) 55.17
Prob > chi2 0.0007
Log likelihood − 727.51048
Pseudo R2 0.03665
Andoh-Adjei et al. BMC Family Practice (2018) 19:37 Page 7 of 12
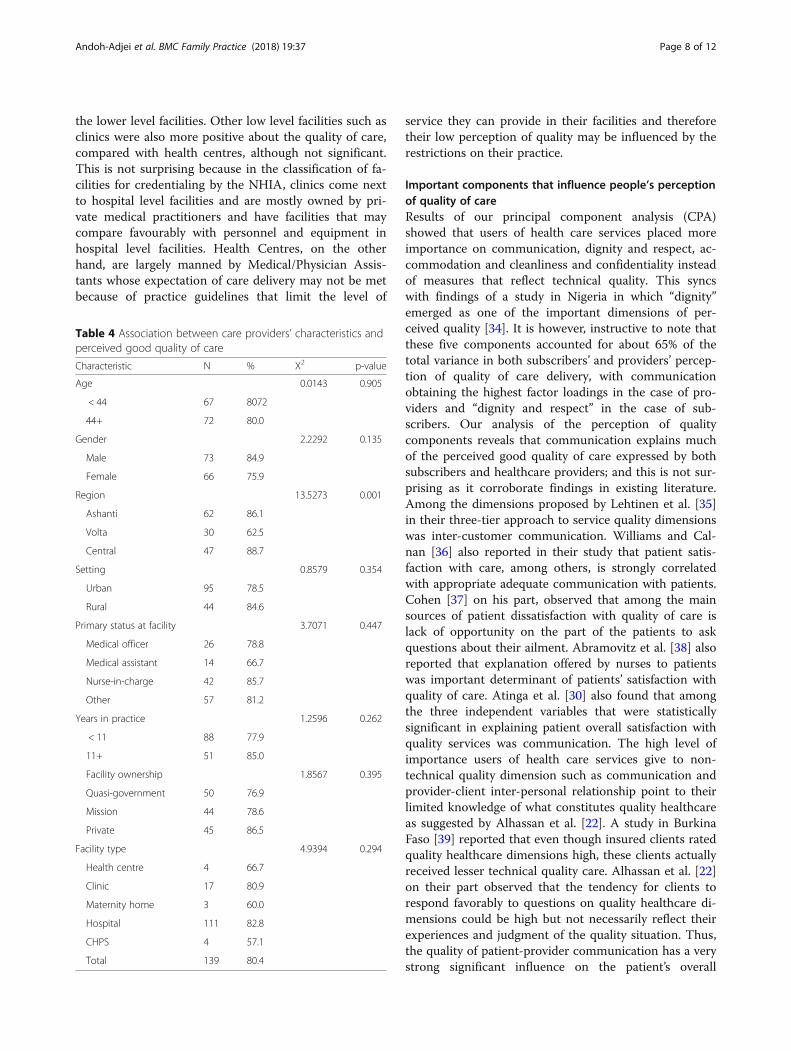
the lower level facilities. Other low level facilities such asclinics were also more positive about the quality of care,compared with health centres, although not significant.This is not surprising because in the classification of fa-cilities for credentialing by the NHIA, clinics come nextto hospital level facilities and are mostly owned by pri-vate medical practitioners and have facilities that maycompare favourably with personnel and equipment inhospital level facilities. Health Centres, on the otherhand, are largely manned by Medical/Physician Assis-tants whose expectation of care delivery may not be metbecause of practice guidelines that limit the level of
service they can provide in their facilities and thereforetheir low perception of quality may be influenced by therestrictions on their practice.
Important components that influence people’s perceptionof quality of careResults of our principal component analysis (CPA)showed that users of health care services placed moreimportance on communication, dignity and respect, ac-commodation and cleanliness and confidentiality insteadof measures that reflect technical quality. This syncswith findings of a study in Nigeria in which “dignity”emerged as one of the important dimensions of per-ceived quality [34]. It is however, instructive to note thatthese five components accounted for about 65% of thetotal variance in both subscribers’ and providers’ percep-tion of quality of care delivery, with communicationobtaining the highest factor loadings in the case of pro-viders and “dignity and respect” in the case of sub-scribers. Our analysis of the perception of qualitycomponents reveals that communication explains muchof the perceived good quality of care expressed by bothsubscribers and healthcare providers; and this is not sur-prising as it corroborate findings in existing literature.Among the dimensions proposed by Lehtinen et al. [35]in their three-tier approach to service quality dimensionswas inter-customer communication. Williams and Cal-nan [36] also reported in their study that patient satis-faction with care, among others, is strongly correlatedwith appropriate adequate communication with patients.Cohen [37] on his part, observed that among the mainsources of patient dissatisfaction with quality of care islack of opportunity on the part of the patients to askquestions about their ailment. Abramovitz et al. [38] alsoreported that explanation offered by nurses to patientswas important determinant of patients’ satisfaction withquality of care. Atinga et al. [30] also found that amongthe three independent variables that were statisticallysignificant in explaining patient overall satisfaction withquality services was communication. The high level ofimportance users of health care services give to non-technical quality dimension such as communication andprovider-client inter-personal relationship point to theirlimited knowledge of what constitutes quality healthcareas suggested by Alhassan et al. [22]. A study in BurkinaFaso [39] reported that even though insured clients ratedquality healthcare dimensions high, these clients actuallyreceived lesser technical quality care. Alhassan et al. [22]on their part observed that the tendency for clients torespond favorably to questions on quality healthcare di-mensions could be high but not necessarily reflect theirexperiences and judgment of the quality situation. Thus,the quality of patient-provider communication has a verystrong significant influence on the patient’s overall
Table 4 Association between care providers’ characteristics andperceived good quality of care
Characteristic N % X2 p-value
Age 0.0143 0.905
< 44 67 8072
44+ 72 80.0
Gender 2.2292 0.135
Male 73 84.9
Female 66 75.9
Region 13.5273 0.001
Ashanti 62 86.1
Volta 30 62.5
Central 47 88.7
Setting 0.8579 0.354
Urban 95 78.5
Rural 44 84.6
Primary status at facility 3.7071 0.447
Medical officer 26 78.8
Medical assistant 14 66.7
Nurse-in-charge 42 85.7
Other 57 81.2
Years in practice 1.2596 0.262
< 11 88 77.9
11+ 51 85.0
Facility ownership 1.8567 0.395
Quasi-government 50 76.9
Mission 44 78.6
Private 45 86.5
Facility type 4.9394 0.294
Health centre 4 66.7
Clinic 17 80.9
Maternity home 3 60.0
Hospital 111 82.8
CHPS 4 57.1
Total 139 80.4
Andoh-Adjei et al. BMC Family Practice (2018) 19:37 Page 8 of 12
perception of quality care delivery [31] and as (Fottleret al. [40] suggested, good quality of patient-providercommunication offers a healing environment wherethe former is more likely to continue utilizing servicesprovided by the latter. These are summed up in theassertion that proper communication offers someform of medicine to the patient since effective com-munication reduces anxiety [41]. This finding suggests
that healthcare providers have good interactions withtheir clients during healthcare delivery and as notedby Alhassan et al. [22] this should encourage theNHIA to integrate non-technical quality care indica-tors into its mainstream post credentialing monitoringtools used for their routine monitoring of health careproviders in order to promote client-centered qualitycare improvement alongside the technical quality carestandards. It also becomes important for healthcaremanagers to constantly determine the factors associ-ated with the satisfaction of patients with the qualityof care provided so as to understand what is valued by thepatient, how the quality of care is construed by the patientand to determine where, when and how service changeand improvement may be made [42].One limitation of our study is that it missed out on
the strengths of qualitative study which would haveallowed for further probing into the responses of respon-dents to better understand the reasons for respondents’responses to the questionnaires administered for en-hanced discussion of findings. Another limitation maybe seen from the study design which is cross-sectionalinstead of a true step-wedged design before-after studyas originally envisaged. We also acknowledge the diffi-culty in making comparison between the three regions,considering some differences in their demographic andsocio-economic characteristic. However, the two controlregions have similar demographic and socio-economiccharacteristics and the differences between them and theintervention region are not too significant. These limitationsnotwithstanding, since the subject under study is a policythat is intended to be rolled out across the country, with aroll out plan already determined, what this study seeks todo is to identify issues that need attention of policy makersto improve on the implementation process. Hence, findingsfrom the study provide valuable insight that can aid the de-bate surrounding the capitation payment policy in Ghana.
ConclusionThis study assessed the perception of quality of careprovision among subscribers of the NHIS and NHIS-credentialed providers in the Ashanti region where capita-tion payment is being implemented and two other regionswhere capitation payment is yet to be implemented withthe objective to determine whether capitation paymentinfluenced the quality of care perception of respondents inthe Ashanti region. Findings from the study show thatrespondents’ background characteristics influenced theirperception of quality of care but we also found thatalthough both subscribers and care providers across thethree regions have relatively good perception of the qualityof health care in general, the quality perception amongsubscribers in the Ashanti region was relatively lower,compared to that in the Central region. We, therefore,
Table 5 Multivariate logistic regression model for care providersperceived good quality of care
Characteristic OR Std. Err. z P > z [95% C.I
Age (yrs)
< 44 1.00
44+ 0.90 0.48 −0.19 0.846 0.31–2.56
Gender
Male 1.00
Female 0.46 0.24 −1.48 0.138 0.16–1027
Region
Ashanti 1.00
Volta 0.14 0.10 −2.70 0.007 0.03–0.58
Central 1.27 0.82 0.37 0.709 0.35–4.55
Setting
Urban 1.00
Rural 2.90 1.61 1.91 0.057 0.97–8.66
Primary Status at facility
Medical Officer 1.00
Medical Assistant 1.01 0.81 0.02 0.987 0.20–4.92
Nurse in-charge 2.53 1.95 1.21 0.228 0.55–11.4
Other 0.65 0.49 −0.55 0.579 0.15–2.88
Years in practice
< 11 1.00
11+ 1.40 0.75 0.62 0.534 0.48–4.04
Facility ownership
Quasi-government 1.00
Mission 0.61 0.33 −0.88 0.378 0.21–1.80
Private 1.90 1.17 1.05 0.294 0.57–6.36
Facility type
Health centre 1.00
Clinic 2.69 3.13 0.85 0.394 0.27–26.33
Maternity home 0.82 1.27 −0.13 0.899 0.03–17.13
Hospital 8.11 8.42 2.02 0.044 1.05–62.07
CHPS .59 .87 −0.35 0.725 0.03–10.48
No. of obs 172
LR chi2 (15) 32.71
Prob > chi2 0.0052
Log likelihood −69.158398
Pseudo R2 0.1912
Andoh-Adjei et al. BMC Family Practice (2018) 19:37 Page 9 of 12
conclude that in addition to their background characteris-tics, capitation payment may have influenced people’s per-ception of quality of care in the Ashanti region. TheNHIA may, therefore, want to address itself to the nega-tive issues raised by the public about the capitation
implementation, as well as other factors that influencepeople’s perception of quality of care that are documentedin existing literature in order to improve the perception ofquality care delivery in the Ashanti region in particular;and under the NHIS in general.
Table 6 Subscribers perception component matrix and factor loadings
Itemno.
Statement Component
Communication Dignity andrespect
Servicequality
Accommodation andcleanliness
Confidentiality
1 He/she spent time to advise me on preventive care .870
2 Prescriber made time to discuss my healthcondition and treatment
.853
3 He/she explained everything about treatment .797
4 Medicines prescribed were very good .776
5 He/she opened up to me for statements abouttreatment
.757
6 Nurses treated me with dignity .943
7 Prescriber gave me option to accept or refusetreatment
.933
8 Nurses were cautious towards me .907
9 Prescriber made a good diagnosis .812
10 Treatment was effective for recovery and cure .777
11 I was able to see prescriber within 30 min .586
12 There was a prescriber available to attend to me .551
13 No congestion at facility during last visit .738
14 Seats were enough at facility during last visit .606
15 During last visit at facility, environment was clean .594
16 During last visit, waiting area was well ventilated .559
17 Confidentiality in consulting room .848
18 Health information is kept secret and confidential .729
Table 7 Providers perception component matrix and factor loadings
Itemno
Statement Component
Communication Availability andpromptness
Accommodation andcleanliness
1 We explain to clients how to take their medication .855
2 We do proper diagnosis .812 .345
3 We make time to advise clients on disease prevention .805
4 Clients can ask statements about treatment .726
5 Consulting rooms good enough to give privacy .677
6 Environment at facility is neat .675 .350 .396
7 Nurses show interest in clients and makes them feelcomfortable
.549
8 Enough prescribers to look at clients .877
9 There is always a prescriber at post .845
10 Doctors show interest in clients and makes them feelcomfortable
.342 .353
11 Waiting area is well ventilated .912
12 Facility has enough seats in waiting area .454 .632
Andoh-Adjei et al. BMC Family Practice (2018) 19:37 Page 10 of 12
Additional files
Additional file 1: Subscriber/household sample size determination.(DOCX 14 kb)
Additional file 2: NHIS-Credentialed provider interview questionnaires.(DOCX 201 kb)
Additional file 3: Proportion of variance explained by each componentin subscribers’ perception of quality of care. (DOCX 21 kb)
Additional file 4: Proportion of variance explained by each componentin healthcare providers’ perception of quality of care. (DOCX 20 kb)
AbbreviationsDRG: Diagnosis-related grouping; EA: Enumeration area; EPI: Expandedprogramme on immunization; FFS: Fee-for-service; GHS: Ghana healthservice; GLSS: Ghana living standard survey; GSS: Ghana statistical service;NHIA: National health insurance authority; NHIS: National health insurancescheme; OPD: Out-patients’ department; PES: Post-enumeration survey;USA: United States of America; WHO: World Health Organization
AcknowledgementsWe acknowledge the Chief Executive Officer of the National HealthInsurance Authority and the Director-General of the Ghana Health Service forgranting permission to use the NHIS and NHIS’ credentialed facilities, respect-ively for the study.
FundingThe authors wish to acknowledge the financial contribution of theNetherlands organization for international co-operation in higher education(NUFFIC) through the Netherlands Fellowship Programme (NFP) now knownas Orange Knowledge Programme (OKP).
Availability of data and materialsRelevant data based on which conclusions were drawn are provided inTables 2-7 in the manuscript and its Additional files 3 and 4.
Authors’ contributionsFAX designed the study and implemented the survey under the supervisionof FAA, ES and KvdV. Data analysis and reporting were jointly done by FAXand ENB. FAX wrote the drafts and updated them into final version forapproval and submission. All co-authors reviewed the drafts critically andmade substantial contributions that were incorporated in the finalmanuscript. All authors read and approved the final manuscript.
Authors’ informationFAX (MSc. MPH) is an employee at the National Health Insurance Authority,Accra-Ghana. ENB (MSc. MPH) is an employee at the National HealthInsurance Authority, Accra-Ghana. ES (PhD) is an Assistant Professor ofInternational Public Health at the Radboud University Medical Centre-RadboudInstitute for Health Sciences in Nijmegen, Netherlands. FAA (PhD) is the Directorfor the Institute of Statistical Social and Economic Research at the Universityof Ghana-Legon, Accra-Ghana. KvdV (PhD) is Professor of Public Healthat the Radboud University Medical Centre-Radboud Institute for HealthSciences, Nijmegen.
Ethics approval and consent to participateWe obtained ethical approval for the study (certified protocol number: UG-ECH 057/13–14) from the University of Ghana Institute of Statistical, Socialand Economic Research (ISSER) Ethics Committee for Humanities (ECH) afterwe had sought official permission from the office of the Director-General ofthe Ghana Health Service (approval letter dated 18/02/2014) to use theNHIS-credentialed health care providers for the study. Participation in thestudy was optional, and the right to respondents’ privacy was guaranteedwith the signing of informed consent by respondents and interviewer.
Consent for publicationNot applicable.
Competing interestsFAX and ENB are employees of NHIA. However, since results from the studyare meant to help improve the policy intervention under consideration, theirrelationship with the organization does not influence the results. All authorsdeclare that they have no competing interests.
Publisher’s NoteSpringer Nature remains neutral with regard to jurisdictional claims inpublished maps and institutional affiliations.
Author details1NHIA 36-6th Avenue, Ridge. PMB Ministries Post Office, Accra, Ghana.2Institute of Statistical, Social and Economic Research (ISSER) University ofGhana, Legon-Accra, Ghana. 3Radboud Institute for Health Science,Department for Health Evidence, Radboud University Medical Center,Nijmegen, Netherlands. 4Radboud Institute for Health Science, Departmentfor Primary and Community Health, Radboud University Medical Centre,Nijmegen, Netherlands.
Received: 9 January 2018 Accepted: 1 March 2018
References1. Nsiah-Boateng E, Jousten A. Eight years of National Health Insurance
Scheme in Ghana: evolution of the health financing sub-functions. In:Ghana Social, Economic and Political Issues. New York: Nova SciencePublishers, Inc; 2014. p. 337–56.
2. Amo-adjei J, Anku PJ, Amo HF, Effah MO: Perception of quality of healthdelivery and health insurance subscription in Ghana. BMC Health Serv Res2016;16(317):1–11.
3. Haddad S, Potvin L, Roberge D, Pineault R, Remondin M. Patient perceptionof quality following a visit to a doctor in a primary care unit. Fam Pract IntJ. 2000;17:21–9.
4. Rao KD, Peters DH, Bandeen-roche K. Towards patient-centered healthservices in India — a scale to measure patient perceptions of quality. Int JQual Heal care. 2006;18:414–21.
5. Shabila NP, Al-Tawil NG, Al-Hadithi TS, Sondorp E: Using Q-methodology toexplore people’s health seeking behaviour and perception of the quality ofprimary care services. BMC Public Health 2014, 14.
6. Mack JW, Hilden JM, Watterson J, Moore C, Turner B, Grier HE, Weeks JC,Wolfe J. Parent and physician perspectives on quality of Care at the end oflife in children with cancer. J Clin Oncol. 2005;23:9155–61.
7. Agyei-Baffour P, Oppong R, Boateng D. Knowledge, perceptions andexpectations of capitation payment system in a health insurance setting: arepeated survey of clients and health providers in Kumasi, Ghana. BMCPublic Health. 2013;13:1220.
8. Andoh-Adjei F-X, Cornelissen D, Asante FA, Spaan E, van der Velden K. Doescapitation payment under national health insurance affect subscribers’ trustin their primary care provider? A cross-sectional survey of insurancesubscribers in Ghana. BMC Health Serv Res. 2016;16:437.
9. Aboagye A. Capitation in healthcare financing in Ghana-an analysis of theAshanti region pilot study.Pdf. East African Med J Med J. 2013;90:227–84.
10. Andoh-Adjei F-X, van der Wal R, Nsiah-Boateng E, Asante FA, van derVelden K, Spaan E. Does a provider payment method affect membershipretention in a health insurance scheme? A mixed method study of Ghana’scapitation payment for primary care. BMC Health Serv Res. 2018;18:52.
11. Creswell J. Research Design: Qualitative, Quantitative and Mixed MethodsApproaches. 4th ed. London: SAGE Publications Ltd; 2014.
12. Bhattacharyya S, Isaac A, Rajbangshi P, Srivastava A, Avan BI. “Neither we aresatisfied nor they” - users and providers’ perspective: a qualitative study ofmaternity care in secondary level public health facilities, Uttar Pradesh,India. BMC Heal Serv Res Res. 2015;15:421–33.
13. Sword W, Heaman MI, Brooks S, Tough S, Janseen PA, Young D, Kingston D,Helewa ME, Akhtar-Danesh N, Hutton E: Women’s and providers’perspecives of quality prenatal care: a qualitative descriptive study. BMCPregnancy Childbirth. 2012;12:29.
14. Papp R, Borbas I, Dobos E, Bredehorst M, Jaruseviciene L, Vehko T, Balogh S:Perceptions of quality in primary care: perspectives of patients andprofessional based on focus group discussions. BMC Fam Pract. 2014;15:128.
15. Atinga RA, Baku AA. Determinants of antenatal care quality in Ghana. Int JSoc Econ. 2013;40:852–65.
Andoh-Adjei et al. BMC Family Practice (2018) 19:37 Page 11 of 12
16. De Silva A: A Framework For measuring responsiveness. GFE Discuss PapSer World Heal Organ 2000. www.portal.pmnch.org/responsiveness/papers/paper32.pd
17. World Health Organization: Immunization coverage cluster survey-referencemanual. Geneva: WHO; 2005.
18. Faul F, Erdfelder E, Lang A-G, Buchner A. G* power 3: a flexibe statisticalpower analyses programme for social, behavioural and biomedical sciences.Behavior Res Methods. 2007;39:175–91.
19. Faul F, Erdfelder E, Buchner A, Lang A-G. Statistical power analyses usingG*power 3.1: tests for correlation and regression analyses. Behav ResMethods. 2009;41:1149–60.
20. Aday LA, Andersen R. A framework for the study of access to medical care.Health Serv Res. 1974;9:208–20.
21. Anderson R, Newman JF. Societal and individual determinants of medicalcare utilization in the United States. The Milbank Quaterly. 2005;83:1–28.
22. Alhassan RK, Duku SO, Janssens W, Nketiah-Amponsah E, Spieker N, vanOstenberg P, Arhinful DK, Pradhan M, Tobias F, de Wit R. Comparison ofperceived and technical healthcare quality in primary health facilities:implications for a sustainable National Health Insurance Scheme in Ghana.PLoS One. 2015;10:1–19.
23. Dixon J, Tenkorang EY, Luginaah I. Ghana’s National Health InsuranceScheme: a national level investigation of members’ perceptions of serviceprovision. BMC Int Health Hum Rights. 2013;13:35.
24. Dalinjong PA, Laar AS. The national health insurance scheme: perceptionsand experiences of health care providers and clients in two districts ofGhana. Health Econ Rev. 2012;2:13.
25. Burnham G, Hoe C, Hung YW, Ferati A, Dyer A, Hifi TA, Aboud R, Hasoon T.Perceptions and utilization of primary health care services in Iraq : findingsfrom a national household survey. BMC Int Heal Hum Rights. 2011;11:1–9.
26. Khamis K, Njau B. Patients ’ level of satisfaction on quality of health care atMwananyamala hospital in Dar es salaam, Tanzania. BMC Health Serv Res.2014;14:1–8.
27. Ock M, Kim J, Jo M, Lee H, Kim HJ, Lee JY. Perceptions of primary care inKorea : a comparison of patient and physician focus group discussions. BMCFam Pract. 2014;15:1–14.
28. Baltussen RM, Yazoume YE, Haddad S, Sauerborn RS. Percieved quality ofcare of primary health care services in Burkina Faso. Health Policy Plan.2002;17:42–8.
29. Baltussen R, Yazoume YE. Quality of care of modern health services aspercieved by users and non-users in Burkina Faso. Int J Qual Heal Care.2006;18:30–4.
30. Atinga R. Healthcare quality under the National Health Insurance Scheme inGhana: perspectives from premium holders. Int J Qual Reliab Manag. 2012;29:144–61.
31. Atinga RA, Abeka-Nkrumah G, Domfeh KA. Managing healthcare quality inGhana: a neccesity of patient satisfaction. Int J Health Care Qual Assur. 2011;24:548–63.
32. Turkson P. Perceived quality of healthcare delivery in a rural district ofGhana. Ghana Med J. 2009, 43:65–70.
33. Nketiah-Amponsah E, Hiemenz U. Determinants of consumer satisfaction ofhealth care in Ghana: does choice of health care provider matter? Glob JHealth Sci. 2009;68:259–67.
34. Mohammed S, Bermejo JL, Souares A, Sauerborn R, Dong H. Assessingresponsiveness of health care services within a health insurance scheme inNigeria : users ’ perspectives. BMC Health Serv Res. 2013;13:1–19.
35. Lehtinen U, Lehtinen JR: Service quality: a study of quality dimensions.Helsinki: Service Management Institute; 1992.
36. William S, Calnan M. Key determinants of consumer satisfaction withgeneral practice. Fam Pract. 1991;8:237–342.
37. Cohen G. Age and health status in a patient satisfaction survey. Soc SciMed. 1996;42:1085–95.
38. Abramowitz S, Cote A, Berry E. Analyzing patient satisfaction: a multianalyticapproach. Qual Rev Bull. 1987;13:122–30.
39. Robyn PJ, Baernighausen T, Souares A, Savadogo G, Bicaba B, Sie A,Sauerborn R: Does enrollment status in community-based insurance lead topoorer quality of care? Evidence from Burkina Faso. Int J Equity Health.2013;12:31
40. Fottler MD, Ford RC, Heaton CP: Achieving service excellence: strategies forhealth. Chicago: Health Administration Press; 2002.
41. Bensing JM, Verhaak PK, van Dulmen AM, Visser AP. Communication: theroyal pathway to patient-centered medicine. Patient Educ Couns. 2000;39:1–3.
42. Zineldin M. The quality of health care and patient satisfaction: anexploratory investigation of the 5Qs model at some Egyptian and Jordanianmedical clinics. Int J Health Care Qual Assur. 2006;19:60–92.
• We accept pre-submission inquiries
• Our selector tool helps you to find the most relevant journal
• We provide round the clock customer support
• Convenient online submission
• Thorough peer review
• Inclusion in PubMed and all major indexing services
• Maximum visibility for your research
Submit your manuscript atwww.biomedcentral.com/submit
Submit your next manuscript to BioMed Central and we will help you at every step:
Andoh-Adjei et al. BMC Family Practice (2018) 19:37 Page 12 of 12