Embed Size (px)
Citation preview
Eurographics Conference on Visualization (EuroVis) 2012S. Bruckner, S. Miksch, and H. Pfister(Guest Editors)
Volume 31 (2012), Number 3
Perception of Animated Node-Link Diagramsfor Dynamic Graphs
S. Ghani, N. Elmqvist, and J. S. Yi
Purdue University, USA
AbstractEffective visualization of dynamic graphs remains an open research topic, and many state-of-the-art tools useanimated node-link diagrams for this purpose. Despite its intuitiveness, the effectiveness of animation in node-link diagrams has been questioned, and several empirical studies have shown that animation is not necessarilysuperior to static visualizations. However, the exact mechanics of perceiving animated node-link diagrams are stillunclear. In this paper, we study the impact of different dynamic graph metrics on user perception of the animation.After deriving candidate visual graph metrics, we perform an exploratory user study where participants are askedto reconstruct the event sequence in animated node-link diagrams. Based on these findings, we conduct a seconduser study where we investigate the most important visual metrics in depth. Our findings show that node speedand target separation are prominent visual metrics to predict the performance of event sequencing tasks.
Categories and Subject Descriptors (according to ACM CCS): H.5.2 [Information Interfaces and Presentation]: UserInterfaces—Interaction styles I.3.6 [Computer Graphics]: Methodology and Techniques—Interaction techniques
1. Introduction
Time-varying or dynamic graphs (graphs that change overtime) are becoming increasingly important for understand-ing evolving mechanisms in engineering, biology, and thesocial sciences. For example, biologists study changes inphenotypes over time using dynamic graphs; crime analystsgather facts about the activities of individuals of interest overa period of time by representing their networks as dynamicgraphs; and social networks such as those from Facebookor LinkedIn can also be represented in the form of dynamicgraphs. The most common approach to visualize dynamicgraphs is through animated node-link diagrams [MMBd05].
However, the effectiveness of animation has been ques-tioned [TMB02], and several empirical studies have shownthat animated visualization is not superior to static visual-ization. For example, showing trends using animation canbe confusing to people, even when they are told where tolook, and small multiples and trace lines may work bet-ter [RFF∗08]. Several recent studies have shown that smallmultiples allow users to perform significantly faster than ani-mation for many graph comprehension tasks [APP10,FQ11].
Several guidelines and metrics exist for how to opti-mize the readability of a static node-link diagram. Unfortu-
nately, little such evidence exists that provides clear under-standing of which aspects of dynamic (i.e., animated) node-link diagram cause these difficulties. Some of the suggestedcauses include movement speeds of nodes and edges, the dis-tances between nodes and edges, and edge/node as well asedge/edge crossings. However, there could exist numerousadditional factors that may also have an impact. If we knewwhich factors were the most influential, we could providespecific solutions to mitigate the impact of these factors.
Thus, the goal of this paper is to understand people’s per-ception of dynamic graphs by characterizing the factors thataffect user perception of animated node-link diagrams. Be-cause we are not certain what those factors are, we begin byderiving visual metrics that characterize a dynamic graph us-ing static graph metrics as a starting point. We then generatea large number of animations and calculate these metrics foreach trial, selecting representative trials for each metric. Wefinally use these trials to perform an exploratory user studyon correctness and cognitive load for addition and deletion ofboth nodes and links. Our study also includes two differentgraph layouts—a fixed layout and a force-directed layout—so that we can study how the movement of nodes affects userperception. We then use these results to run a second sum-mative study that uses distinctive graph metrics as factors.
c© 2012 The Author(s)Computer Graphics Forum c© 2012 The Eurographics Association and Blackwell Publish-ing Ltd. Published by Blackwell Publishing, 9600 Garsington Road, Oxford OX4 2DQ,UK and 350 Main Street, Malden, MA 02148, USA.
DOI: 10.1111/j.1467-8659.2012.03113.x
S. Ghani & N. Elmqvist & J. S. Yi / Perception of Animated Node-Link Diagrams for Dynamic Graphs
2. Background
A dynamic graph is a graph whose structure changes overtime. These topological changes involve either nodes oredges being added to or removed from the graph. A dynamicgraph visualization technique is therefore a graph visualiza-tion technique that is capable of visually conveying thesechanges over time. Note that this delimits our definition tonot include graphs with node and edge attributes that changeover time. Such graphs are outside the scope of this paper.
2.1. Dynamic Graph Visualization
Although there exist a few tools, such as TimeMa-trix [YEL10], that use adjacency matrices for dynamicgraphs, most tools that support dynamic graphs—such as Pa-jek [BM02], KrackPlot [KBM94], and UCINet [BEF02]—use node-link based representations. In general, conveyingtopological changes in time using node-link representationscan be done in several different ways:
• Animation: Animation renders a sequence of succes-sive static snapshots that create the illusion of movement.Whenever there is a temporal domain (like for dynamicgraphs), animation is one of the most common choices topresent the changes over time [MMBd05, TMB02].
• Small multiples: Small multiples show several snapshotsof graphs at different points in time, often side-by-sideor in a temporal sequence. However, choosing suitableand representative snapshots is a non-trivial problem, andaligning them side-by-side may cause the display spaceallocated to each individual snapshot to be small.
• Traces: Another common approach is to transform timeinto space by tracing the movement path of the visual ob-jects [RFF∗08]. This idea can also be applied to graphs,but may give rise to visual clutter and it is not obvious howto represent discrete events, such as additions or deletions.
• 3D: Some graph visualization techniques use the thirddimension (often height) for representing change overtime [BC03]. However, 3D visualization is plagued by in-herent problems such as distortion and occlusion effects.
2.2. Layout for Dynamic Graphs
Graph layout is critical for effective graph visualization ingeneral [BETT99], and there exists a number of graph lay-out algorithms that are solely designed for dynamic graphs.Most strive to maximize the stability of the graph during theanimation to reduce the need for the user to track nodes asthey move around the graph. Several dynamic graph layoutalgorithms exist in the literature [BW97, CDT∗92, DG02].While one outcome for this work may be to help designers ofsuch algorithms build better layouts for dynamic graphs, ourwork addresses more fundamental aspects of human percep-tion than layout. For this reason, we adopt a specific layout—the lin-log force-directed algorithm [Noa05]—as a baselinein our evaluations instead of varying this as a factor.
2.3. Animation for Dynamic Graphs
Animation is used in user interfaces for a variety of pur-poses [BS90], and is also prominent in visualization re-search; examples include transitions of data [HR07], tran-sitions of views [BTC∗06], and trends over time [RFF∗08].Animation is also commonly used for dynamic graphs.
However, several studies question the effectiveness of an-imation over static graphics. Tversky et al. [TMB02] identi-fied flaws in studies purporting to show the effectiveness ofanimation and claimed that it may not be superior to staticgraphics. Archambault et al. [APP10] found that small mul-tiples is better than animation for dynamic graphs. Robertsonet al. [RFF∗08] showed that animation is less effective thanboth static representations and small multiples. Farrugia andQuigley [FQ11] similarly proved that static methods are bet-ter for representing dynamic graphs compared to animation.Interestingly, the effect of animation might not be linearlycorrelated with the animation speed in some tasks [PS08].
Nevertheless, animation is easy to implement, and isseemingly natural and useful. Perhaps for these reasons, an-imation is very prominent in graph visualization tools. How-ever, there exists little knowledge as to which factors, in par-ticular, contribute to making animation difficult to use fordynamic graphs. If we had this knowledge, we could designmethods to mitigate the impact of these factors. This in turnwould let us continue to use node-link diagrams, which af-ter all are the most popular visual representations for graphsbecause of familiarity and graph task utility [LPP∗06].
3. Dynamic Graph Metrics
Visual graph metrics are measures of a graph layout, suchas average edge length and number of edge crossings, andthere exists much work on defining such metrics [BFN85,BETT99] (note that this is different from pure graph metrics,which are invariant to layout). Most of these take an aestheticapproach [CP96], with the reasonable assumption that thiswill transfer to readability. In particular, Purchase [Pur02]proposed a set of seven aesthetic metrics that many tools use.
More recently, Dunne and Shneiderman [DS09] used Pur-chase’s seven metrics as basis to give a set of new metrics forimproving graph readability. They define metrics like nodeocclusion, edge crossing, edge crossing angle, and edge tun-neling, and argue that these can be used to improve graphlayout and presentation. However, all these metrics are de-signed for static and not dynamic graphs, which typicallyhave many additional properties. Many of these metrics alsofocus on aesthetics rather than optimal perception of a graph.
In the below text, we extend these metrics to encompassdynamic graphs, as well as define some new metrics that areunique to dynamic graphs. In the discussion below, we de-fine a target as a graph entity (node or edge) that is addedor removed during the animated sequence. Some metrics are
c© 2012 The Author(s)c© 2012 The Eurographics Association and Blackwell Publishing Ltd.
1206

S. Ghani & N. Elmqvist & J. S. Yi / Perception of Animated Node-Link Diagrams for Dynamic Graphs
only defined when target nodes appear or disappear—nodemetrics (N)—while some are only defined when target edgesappear or disappear—edge metrics (E). A third kind are de-fined for graphs or subgraphs—graph metrics (G). Also, de-pending on the size of the graph, it is possible to computethese metrics for a whole graph, or for smaller subgraphs.
• Node Speed (N, G): Average speed for nodes.• Target Speed (N, G): Average speed for target nodes.• Target Separation (N, E, G): We define this metric as the
average distance between target nodes or edges (similar tothe “minimizing temporal aliases” criterion [BBD09]).
• Target Node Degree (N): This metric yields the averagedegree (the sum of the in-degree and out-degree in a di-rected graph) of all target nodes in the graph.
• Node-Node Distance (N): This metric is motivated byDunne’s and Shneiderman’s Node Occlusion [DS09], andfor static graphs defines how much each node is occludedby any other node. For dynamic graphs, we define nodeocclusion as the minimum distance between a target nodeand any other node during the whole animation.
• Node-Edge Distance (N): This metric is motivated bythe Edge Tunnel metric [DS09], which for static graphsdescribes nodes overlapping with edges. For dynamicgraphs, we define this metric as the minimum distance be-tween each target node and any edge of the graph (apartfrom its own edges) during the whole animation.
• Edge-Edge Distance (E): This metric is similar to theabove two and is defined as the minimum distance be-tween a target edge and any other edge during animation.
• Edge Crossings (E): Edge crossings is one of the mostcommon graph metrics for readability [BETT99]. For dy-namic graphs, we define this metric as the number of sep-arate times that a target edge crosses any other edge.
• Edge Angle Sweep (E): Crossed edges are difficultto perceive as their incident angle decreases [DS09,WPCM02]. For dynamic graphs, we define this as the sumof the angle sweep of a target edge during an animation.
• Edge Length (E): Edge Length is an important metric formany graph layout algorithms since many algorithms tryto reduce intra-node distances. For dynamic graphs, thelength of the edge is not fixed, so we measure two valuesfor each target edge: the minimum length and the maxi-mum change, both of which are problematic to perceive.
There exists additional metrics for dynamic graphs, suchas node size, color, and shape; labels; layout; and edgebends. However, these metrics are more indirect or abstract,and are thus likely to have a negligible impact on user per-ception and thereby outside the scope of our work.
4. Exploratory User Study
In the previous section, we defined a large collection of met-rics for dynamic graphs represented as node-link diagrams.However, no empirical data exists on how accurately thesedifferent metrics predict the difficulty of perceiving dynamic
changes in the graph. To begin investigating this relation be-tween dynamic graph perception and the above metrics, weconducted an exploratory user study where we asked partic-ipants to observe node-link animations. We calculated themetrics for each graph and studied the relations betweenthem and participant performance using statistical methods.
Another goal of this study is to determine the proper ex-perimental settings for further studies. We assume that dy-namic graphs (through force-directed layout) are more dif-ficult to perceive than static graphs; detecting deletion ofnodes are more difficult than addition of nodes; and themore nodes we have, the more difficult to perceive changes.Through this study, we would like to verify those aspects.
4.1. Participants and Apparatus
We recruited 16 paid volunteers (ten male and six female),screened not to be color blind at a compensation of $10per hour. All participants were university students with agesvarying from 20 to 31 years (average 25). Each participantused a 3.00 GHz dual-core PC with 4 GB of memory withthe size of the graph viewport set to 1024×768 pixels.
4.2. Experimental Platform
We built a dynamic graph viewer in Java for this experiment.The viewer shows a node-link representation of the graphso that it is fully contained within the viewport. Mouse orkeyboard interaction inside the viewport was disabled.
4.3. Experimental Factors
We included the below three factors in our study:
• Task Types (T): Nodes being added (NA) or deleted(ND), or edges being added (EA) or deleted (ED).
• Number of Entities (E) Animations become more diffi-cult to perceive and remember as the number of eventsincreases. Therefore, we include the number of entities Eas a condition for how many target entities are added ordeleted from the node-link diagram during the animation.Guided by a pilot study, we use 2, 3, and 5 entities.
• Layout (L): For dynamic graphs, the graph layout is oneof the most important parameters to choose. As discussedin the related work section, there exists several differ-ent layout algorithms solely designed for dynamic graphswhere the main purpose is to dampen the impact on thewhole graph when entities are added or deleted. This pre-sumably makes these events easier to perceive. For thisexperiment we choose two different layouts (which repre-sent realistic upper and lower bounds of stability) to findout whether dynamic graph layouts, which minimize nodemovement, cause more difficulty than static layouts:
– Fixed Layout: We calculate the layout for the com-plete graph (including added or deleted entities) before
c© 2012 The Author(s)c© 2012 The Eurographics Association and Blackwell Publishing Ltd.
1207
S. Ghani & N. Elmqvist & J. S. Yi / Perception of Animated Node-Link Diagrams for Dynamic Graphs
the animation so that entities will be added or deletedwithout any movement in the layout. This layout con-dition was chosen since we think it is the ideal dy-namic graph layout with no node movement at all, i.e.,it is a lower bound on layout stability.
– Force-Directed Layout. We calculate a force-directedlayout (lin-log [Noa05]) for every intermediate graphin the animation, i.e., every time step of the graphwhen an entity has been added or removed. Node po-sitions will be linearly interpolated between these in-termediate layouts during the animation.
It is important to note that the purpose of this experimentis not to validate existing dynamic graph layout algorithms,but rather to determine the factors affecting dynamic graphperception. For this reason, we explicitly chose not to usesuch an optimized layout algorithm in this experiment, butinstead used the above layouts as references.
4.4. Study Design
Given the above factors, we used a within-subject full-factorial design: 4 task types (T ) × 3 number of entities (E)× 2 layouts (L) × 3 repetitions = 72 unique conditions. Wecounterbalanced the order of layout and blocked on this fac-tor. Inside each layout block, we counterbalanced the orderof the task types and blocked on task types. With 16 par-ticipants, we collected total of 1152 trials. The experimentplatform recorded the following metrics:
• Correctness: A binary response to indicate whether theentity order given by the participant was fully accurate.
• Cognitive Load: 1-9 scale representing the participant’sself-reported mental effort for the trial [Paa92].
We debated using correctness measures based on order orposition. However, it is difficult to justify which metric tochoose, so we decided to instead use a binary measure.
4.5. Task
We wanted to choose a representative task where participantswould not only have to perceive changes in the graph topol-ogy, but also maintain the overall mental map of the graphas well as the event chronology throughout the animation.We therefore asked our participants to reconstruct the causalorder of nodes or edges being added or removed from thegraph during the animation, which is an intrinsic task for re-vealing temporal relationships in dynamic graphs. This is arealistic task: consider a social network where a user is an-alyzing the friends added over a time period. In this case,the user may need to know which friend was added first, andhow this caused other friends to be added later on.
A trial starts with a node-link diagram being shown inour graph viewer, with all nodes drawn in gray and edgesin black. During the animation, the graph will successively
change, one entity at a time. The nature of the change de-pends on the task type T : for addition tasks, nodes or edgesare added, whereas for deletion tasks, they are removed. Thenumber of entities added or removed depends on the exper-imental factor E, and they are randomly chosen from thegraph before the start of the trial. Participants will not knowin advance how many entities will be added or removed.
The animation is performed as a linear interpolation ofnode positions. The time between the entities being addedor removed is fixed to 1 second (derived using an initial pilotstudy). The other option was to fix the overall trial time—say to 3 seconds—causing all changes to happen during thistime. However, this would cause different cognitive load onparticipants depending on the number of entities added orremoved; for example, when the number of entities is equalto 2, there will be a 1.5 second gap between the two events,whereas for 5 entities, there will be 600 ms gap betweenevents. By keeping the time between events constant, wetried to balance the cognitive load regardless of the numberof entities. Below we describe the task types:
• Node Addition (NA): In this task, new nodes are suc-cessively added to the graph in a random position on thevisual space and with the same gray color as other nodes.When adding a new node, the edges associated with it arealso added to the graph. For each new node, we then cal-culate a layout for the graph with this node added andanimate the nodes to their new positions in a 1-second an-imation. The trial ends when all entities have been added.
• Node Deletion (ND): Node deletion tasks successivelyremove nodes from the graph, causing a new layout tobe calculated and an animation to the new positions tobe performed. When removing a node, we remove all ofits edges. When the trial ends, we again show the deletednodes (without their edges, since the layout has changed)in the same position from where they were deleted.
• Edge Addition (EA): Edge addition successively addsedges to the graph during the animation. New edges havethe same black color as other edges, and are added to al-ready existing nodes in the graph. After an edge has beenadded, a new layout is calculated and the nodes are thenanimated as they move to their new positions.
• Edge Deletion (ED): Finally, the edge deletion task, anal-ogously to the other tasks, proceeds by removing edgesfrom the graph. The nodes connected to the edge are notremoved, and edges which are the only edge for a partic-ular node are never removed. After each edge is removed,the layout is recalculated and the nodes are animated totheir new positions. When all edges have been removed,we again show the deleted edges (without their nodes,since the graph layout may have changed) in the originalposition from where they were deleted.
After each trial, the target entities were randomly coloredred, green, blue, yellow, and pink. Using these colors, theparticipant was then asked to reconstruct the order of ad-dition or deletion. Because our focus is on investigating the
c© 2012 The Author(s)c© 2012 The Eurographics Association and Blackwell Publishing Ltd.
1208
S. Ghani & N. Elmqvist & J. S. Yi / Perception of Animated Node-Link Diagrams for Dynamic Graphs
impact of changing graph topology on perception, we specif-ically do not use any visual technique—e.g., fading, ghost-ing, highlighting—to draw the user’s attention to changes.
4.6. Trial Generation
We use randomly generated graphs in our evaluation in or-der to cover the full spectrum of possible variations of dif-ferent graph metrics. We specifically avoided using an actualsmall-world social network so as not to bias the perceptualphenomena studied in the experiment. Accordingly, all ofour trials used a relatively small base graph with 25 nodesand 50 edges. However, generating representative trials wasa challenge because no empirical data exists on what con-stitutes a typical node-link animation. We therefore used thegraph metrics to guide our trial generation and selection.
Unfortunately, our graph metrics are descriptive ratherthan generative, and we also do not know the standard dis-tribution for each metric given typical trials. In other words,we have no straightforward way of generating a trial withspecific metric values, and we also do not have a good un-derstanding of which metric values are representative.
To solve these problems, we began by generating a largenumber of random trials by calculating new graph layoutsand metrics for each trial. More specifically, we generated10,000 trials for each task type, for each number of entities,and for each layout (240,000 trials in total) and analyzed theresults statistically. We found significant correlations (p <.05) only between the Node Speed and Target Speed metrics(not surprising); no other metrics were correlated.
Given all of these randomly generated trials, we wantedto randomly select three trials (one per repetition) for eachexperimental condition. For these trials to be representative,however, we must ensure that we choose only trials that arenot abnormal (i.e., outliers) for any metric. To achieve this,we choose trials that fall within the .7 confidence interval foreach metric; for the correlated metrics, we use the .7 confi-dence region in correlated space. Furthermore, we also wantour trials to cover the full domain within each metric distri-bution (but inside the .7 confidence interval); we thereforerandomly select differing trials. This yields 72 unique trialsfor our study that we use for all participants in varying order.
4.7. Procedure
Participants received training before each technique blockto ensure that they knew how to solve each task type usingthe viewer. For each trial, participants clicked on a buttonto indicate they were ready to start the trial. After that theywere shown the graph in its initial phase (before animation)and double-clicked on the viewport to start the animation.
As the animation ended, a dialog box appeared on thescreen where the user was asked to give the order of addedor removed entities using their colors. After recording the
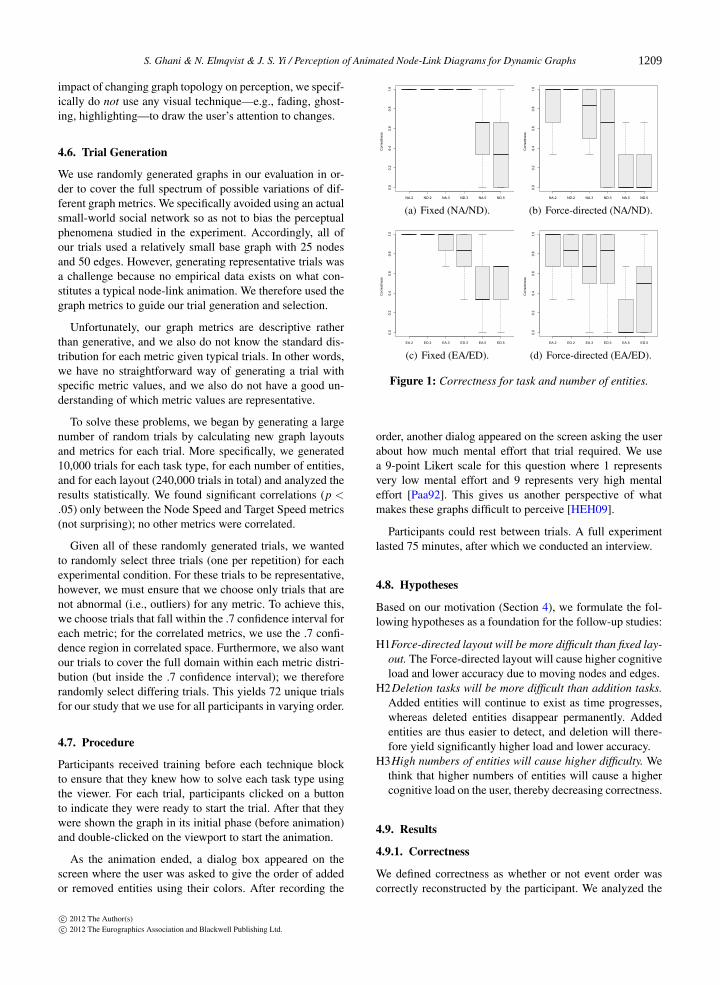
(a) Fixed (NA/ND). (b) Force-directed (NA/ND).
(c) Fixed (EA/ED). (d) Force-directed (EA/ED).
Figure 1: Correctness for task and number of entities.
order, another dialog appeared on the screen asking the userabout how much mental effort that trial required. We usea 9-point Likert scale for this question where 1 representsvery low mental effort and 9 represents very high mentaleffort [Paa92]. This gives us another perspective of whatmakes these graphs difficult to perceive [HEH09].
Participants could rest between trials. A full experimentlasted 75 minutes, after which we conducted an interview.
4.8. Hypotheses
Based on our motivation (Section 4), we formulate the fol-lowing hypotheses as a foundation for the follow-up studies:
H1Force-directed layout will be more difficult than fixed lay-out. The Force-directed layout will cause higher cognitiveload and lower accuracy due to moving nodes and edges.
H2Deletion tasks will be more difficult than addition tasks.Added entities will continue to exist as time progresses,whereas deleted entities disappear permanently. Addedentities are thus easier to detect, and deletion will there-fore yield significantly higher load and lower accuracy.
H3High numbers of entities will cause higher difficulty. Wethink that higher numbers of entities will cause a highercognitive load on the user, thereby decreasing correctness.
4.9. Results
4.9.1. Correctness
We defined correctness as whether or not event order wascorrectly reconstructed by the participant. We analyzed the
c© 2012 The Author(s)c© 2012 The Eurographics Association and Blackwell Publishing Ltd.
1209
S. Ghani & N. Elmqvist & J. S. Yi / Perception of Animated Node-Link Diagrams for Dynamic Graphs
effect of the conditions and metrics on correctness using lo-gistic regression. We found a main effect of layout techniqueon correctness (F(1,1127) = 71.64, p < .0001); fixed lay-out was significantly more correct than force-directed lay-out. We studied graphically (Figure 1) and found the L =Fixed condition had relatively small effects, whereas L =Force-Directed had larger effects, particularly for E = 5.
Not surprisingly, we also found a significant main ef-fect of entity number on the correctness (F(2,1127) =130.19, p < .0001). A Tukey’s HSD test revealed that alldifferences were pairwise significant (p < .05) in the or-der 2 > 3 > 5 for decreasing correctness. Finally, we foundno significant main effect of addition/deletion (F(1,1127) =.98, p = .3218), node/edge (F(1,1127) = .09, p = .7650),and no interaction effects on the correctness. In other words,participants were not doing significantly better or worse withany of the four task types we studied in our experiment.
4.9.2. Cognitive Load
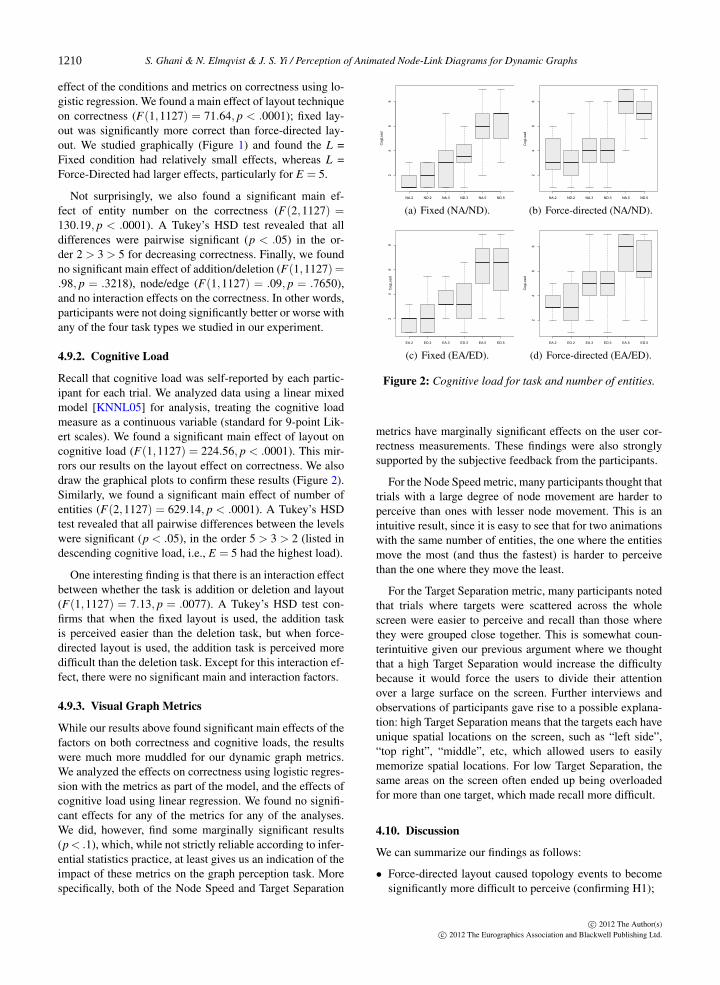
Recall that cognitive load was self-reported by each partic-ipant for each trial. We analyzed data using a linear mixedmodel [KNNL05] for analysis, treating the cognitive loadmeasure as a continuous variable (standard for 9-point Lik-ert scales). We found a significant main effect of layout oncognitive load (F(1,1127) = 224.56, p < .0001). This mir-rors our results on the layout effect on correctness. We alsodraw the graphical plots to confirm these results (Figure 2).Similarly, we found a significant main effect of number ofentities (F(2,1127) = 629.14, p < .0001). A Tukey’s HSDtest revealed that all pairwise differences between the levelswere significant (p < .05), in the order 5 > 3 > 2 (listed indescending cognitive load, i.e., E = 5 had the highest load).
One interesting finding is that there is an interaction effectbetween whether the task is addition or deletion and layout(F(1,1127) = 7.13, p = .0077). A Tukey’s HSD test con-firms that when the fixed layout is used, the addition taskis perceived easier than the deletion task, but when force-directed layout is used, the addition task is perceived moredifficult than the deletion task. Except for this interaction ef-fect, there were no significant main and interaction factors.
4.9.3. Visual Graph Metrics
While our results above found significant main effects of thefactors on both correctness and cognitive loads, the resultswere much more muddled for our dynamic graph metrics.We analyzed the effects on correctness using logistic regres-sion with the metrics as part of the model, and the effects ofcognitive load using linear regression. We found no signifi-cant effects for any of the metrics for any of the analyses.We did, however, find some marginally significant results(p< .1), which, while not strictly reliable according to infer-ential statistics practice, at least gives us an indication of theimpact of these metrics on the graph perception task. Morespecifically, both of the Node Speed and Target Separation
(a) Fixed (NA/ND). (b) Force-directed (NA/ND).
(c) Fixed (EA/ED). (d) Force-directed (EA/ED).
Figure 2: Cognitive load for task and number of entities.
metrics have marginally significant effects on the user cor-rectness measurements. These findings were also stronglysupported by the subjective feedback from the participants.
For the Node Speed metric, many participants thought thattrials with a large degree of node movement are harder toperceive than ones with lesser node movement. This is anintuitive result, since it is easy to see that for two animationswith the same number of entities, the one where the entitiesmove the most (and thus the fastest) is harder to perceivethan the one where they move the least.
For the Target Separation metric, many participants notedthat trials where targets were scattered across the wholescreen were easier to perceive and recall than those wherethey were grouped close together. This is somewhat coun-terintuitive given our previous argument where we thoughtthat a high Target Separation would increase the difficultybecause it would force the users to divide their attentionover a large surface on the screen. Further interviews andobservations of participants gave rise to a possible explana-tion: high Target Separation means that the targets each haveunique spatial locations on the screen, such as “left side”,“top right”, “middle”, etc, which allowed users to easilymemorize spatial locations. For low Target Separation, thesame areas on the screen often ended up being overloadedfor more than one target, which made recall more difficult.
4.10. Discussion
We can summarize our findings as follows:
• Force-directed layout caused topology events to becomesignificantly more difficult to perceive (confirming H1);
c© 2012 The Author(s)c© 2012 The Eurographics Association and Blackwell Publishing Ltd.
1210

S. Ghani & N. Elmqvist & J. S. Yi / Perception of Animated Node-Link Diagrams for Dynamic Graphs
• There was no significant difference on cognitive load orcorrectness for the different tasks (rejecting H2); and
• The number of entities had a significant impact on bothcorrectness and cognitive load (confirming H3).
This initial exploratory study gave us basic informationon dynamic graph perception. Guided by these findings, ournext step is to design a summative user study where wechoose the most important graph metrics as factors, selectingparticular levels from the value ranges we explored here.
Because the effects on correctness were most significantfor force-directed layout, we restrict our summative study tothese conditions. This is not surprising, since these were alsothe only trials with animated nodes and edges.
Furthermore, we also found that correctness was signifi-cantly impacted by the number of entities, with E = 5 see-ing the most difference. This is again not surprising, and itsuggests that our chosen difficulty levels were indeed repre-sentative of the full range of easy to hard tasks. Regardless,these results allow us to focus our summative study on thesesituations and discard conditions where E = 2 or E = 3.
Finally, our findings on the graph metrics indicate thatonly a few of the long list of metrics that we derived actuallyhave a significant impact on graph perception, at least giventhe constraints of the present study. Based on the discussionabove, we found that the target separation and the node speedmetrics were the dominant ones that best predicted dynamicgraph perception performance. In other words, these metricsare good candidates for further investigation.
5. Summative User Study
We follow up with a summative study where we evaluatethose metrics that played a significant role in user perceptionfor dynamic graphs in the exploratory study. For this study,the apparatus, experimental platform, task, dataset, and pro-cedure were the same as in the previous study.
5.1. Participants
We recruited 12 paid volunteers (six male and six female),screened not to be color blind. All participants were univer-sity students with ages varying from 20 to 26 years (average22). None of the participants from the exploratory study par-ticipated in this second summative study.
5.2. Experimental Factors
We use the following factors for this study:
• Task Types (T): We only used one task (node addition,NA) in this study since all the result from the exploratorystudy showed no significant difference for different tasks.
• Number of Entities (E): Based on our reasoning above,we chose the number of entities to be 5 (the level that hadthe highest variance in the exploratory study).
• Layout (L): Since the fixed layout had significantly betterperformance, we only used the force-directed layout here.
• Target Separation (S): From the exploratory study, wefound that when targets are separated on the screen theyare easier to perceive and recall compared to when theyare close. Therefore, we adopted three different target sep-aration ranges relative to the screen size: low (20-25% ofscreen size), medium (35-40%), and high (50-55%).
• Node Speed (V): The last study showed that the fartherthe nodes travel, the more difficult they are to track. Basedon this argument, we introduced three ranges to be trav-eled for this condition relative to the size of the screen:low (10-20%), medium (30-40%), and high (60-75%).
5.3. Study Design
We used a within-subject full-factorial design: 3 separations(S) × 3 node speeds (V ) × 3 repetitions = 27 conditions. Wecounterbalanced target separations and node speeds. With 12participants, we collected a total of 324 trials.
5.4. Trial Generation
We used the same approach for trial generation as in the ear-lier study, but we selected trials using the above intervals forS and V . By using widely separated intervals for each of thefactors, we hoped to be able to include very different trialsin our study, which would allow us to find significant effectson the correctness and cognitive load. We used the same setof trials for all participants, but in varying order.
5.5. Hypotheses
H4High target separation will cause more correctness andlower cognitive load than low separation. Our marginallysignificant results from the exploratory study suggest thattarget separation is influential for spatial recall.
H5High node speed will cause less correctness and highercognitive load than low speed. Our preliminary findingsas well as intuition suggest that the amount of movementin the animation will significantly impact user perception.
5.6. Results
5.6.1. Correctness
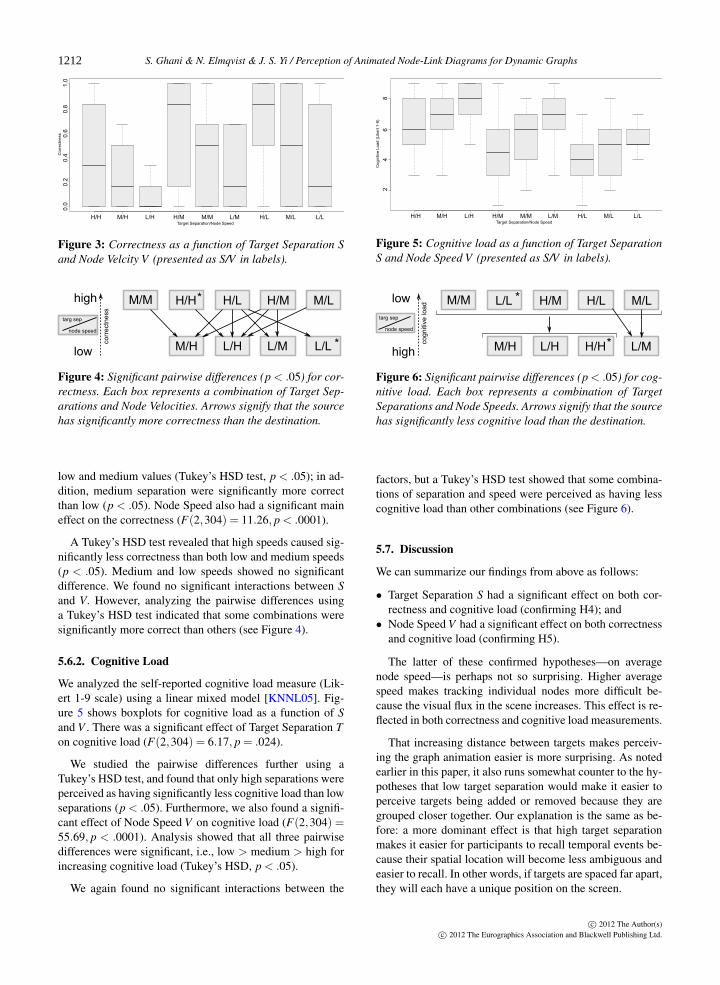
We again defined correctness as whether the participant ex-actly replicated the sequence of events, and analyzed the datausing logistic regression. Figure 3 shows boxplots for cor-rectness as a function of the factors Target Separation S andNode Speed V . Target Separation had a significant main ef-fect on the correctness (F(2,304) = 14.99, p < .0001).
We analyzed the pairwise differences between values forTarget Separation and found that the large separation wassignificantly better (i.e., higher correctness) than both the
c© 2012 The Author(s)c© 2012 The Eurographics Association and Blackwell Publishing Ltd.
1211
S. Ghani & N. Elmqvist & J. S. Yi / Perception of Animated Node-Link Diagrams for Dynamic Graphs0.
2
H/H M/HTarget Separation/Node Speed
L/H H/M M/M L/M H/L M/L L/L
Cor
rect
ness
0.0
0.4
0.6
0.8
1.0
Figure 3: Correctness as a function of Target Separation Sand Node Velcity V (presented as S/V in labels).
M/M H/H H/M
M/H
H/L
L/LL/ML/H
M/L
corr
ectn
ess
high
low
targ sep
node speed
*
*
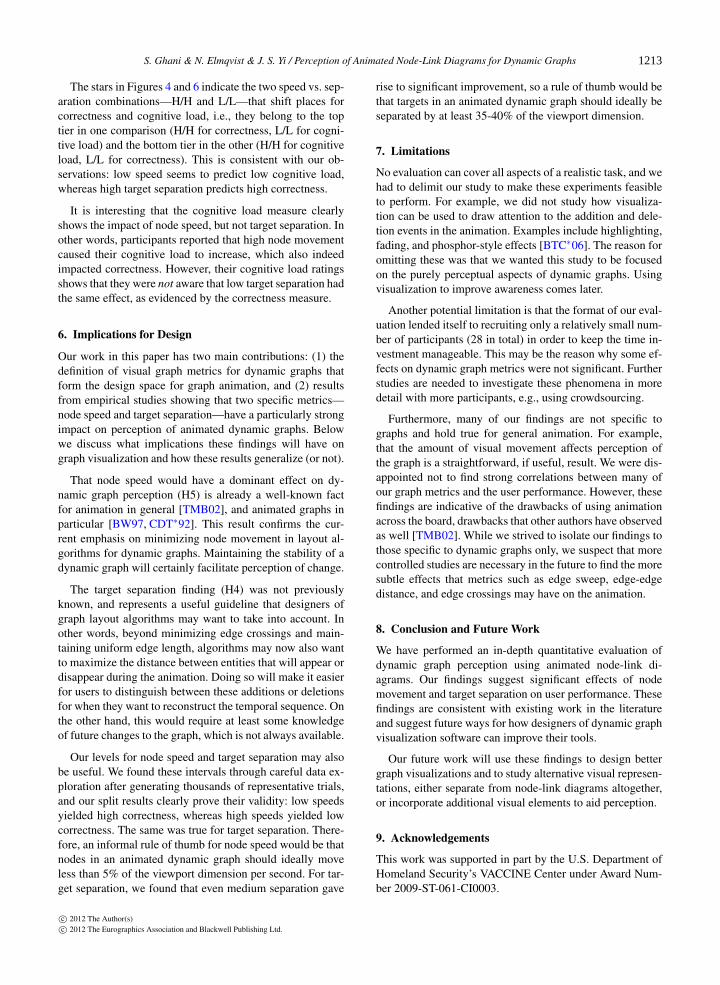
Figure 4: Significant pairwise differences (p < .05) for cor-rectness. Each box represents a combination of Target Sep-arations and Node Velocities. Arrows signify that the sourcehas significantly more correctness than the destination.
low and medium values (Tukey’s HSD test, p < .05); in ad-dition, medium separation were significantly more correctthan low (p < .05). Node Speed also had a significant maineffect on the correctness (F(2,304) = 11.26, p < .0001).
A Tukey’s HSD test revealed that high speeds caused sig-nificantly less correctness than both low and medium speeds(p < .05). Medium and low speeds showed no significantdifference. We found no significant interactions between Sand V. However, analyzing the pairwise differences usinga Tukey’s HSD test indicated that some combinations weresignificantly more correct than others (see Figure 4).
5.6.2. Cognitive Load
We analyzed the self-reported cognitive load measure (Lik-ert 1-9 scale) using a linear mixed model [KNNL05]. Fig-ure 5 shows boxplots for cognitive load as a function of Sand V . There was a significant effect of Target Separation Ton cognitive load (F(2,304) = 6.17, p = .024).
We studied the pairwise differences further using aTukey’s HSD test, and found that only high separations wereperceived as having significantly less cognitive load than lowseparations (p < .05). Furthermore, we also found a signifi-cant effect of Node Speed V on cognitive load (F(2,304) =55.69, p < .0001). Analysis showed that all three pairwisedifferences were significant, i.e., low > medium > high forincreasing cognitive load (Tukey’s HSD, p < .05).
We again found no significant interactions between the
4
H/H M/HTarget Separation/Node Speed
L/H H/M M/M L/M H/L M/L L/L
Cog
nitiv
e Lo
ad (
Like
rt 1
-9)
26
8
Figure 5: Cognitive load as a function of Target SeparationS and Node Speed V (presented as S/V in labels).
M/M
H/H
H/M
M/H
H/LL/L
L/ML/H
M/L
cogn
itive
load
high
low
targ sep
node speed
*
*
Figure 6: Significant pairwise differences (p < .05) for cog-nitive load. Each box represents a combination of TargetSeparations and Node Speeds. Arrows signify that the sourcehas significantly less cognitive load than the destination.
factors, but a Tukey’s HSD test showed that some combina-tions of separation and speed were perceived as having lesscognitive load than other combinations (see Figure 6).
5.7. Discussion
We can summarize our findings from above as follows:
• Target Separation S had a significant effect on both cor-rectness and cognitive load (confirming H4); and
• Node Speed V had a significant effect on both correctnessand cognitive load (confirming H5).
The latter of these confirmed hypotheses—on averagenode speed—is perhaps not so surprising. Higher averagespeed makes tracking individual nodes more difficult be-cause the visual flux in the scene increases. This effect is re-flected in both correctness and cognitive load measurements.
That increasing distance between targets makes perceiv-ing the graph animation easier is more surprising. As notedearlier in this paper, it also runs somewhat counter to the hy-potheses that low target separation would make it easier toperceive targets being added or removed because they aregrouped closer together. Our explanation is the same as be-fore: a more dominant effect is that high target separationmakes it easier for participants to recall temporal events be-cause their spatial location will become less ambiguous andeasier to recall. In other words, if targets are spaced far apart,they will each have a unique position on the screen.
c© 2012 The Author(s)c© 2012 The Eurographics Association and Blackwell Publishing Ltd.
1212
S. Ghani & N. Elmqvist & J. S. Yi / Perception of Animated Node-Link Diagrams for Dynamic Graphs
The stars in Figures 4 and 6 indicate the two speed vs. sep-aration combinations—H/H and L/L—that shift places forcorrectness and cognitive load, i.e., they belong to the toptier in one comparison (H/H for correctness, L/L for cogni-tive load) and the bottom tier in the other (H/H for cognitiveload, L/L for correctness). This is consistent with our ob-servations: low speed seems to predict low cognitive load,whereas high target separation predicts high correctness.
It is interesting that the cognitive load measure clearlyshows the impact of node speed, but not target separation. Inother words, participants reported that high node movementcaused their cognitive load to increase, which also indeedimpacted correctness. However, their cognitive load ratingsshows that they were not aware that low target separation hadthe same effect, as evidenced by the correctness measure.
6. Implications for Design
Our work in this paper has two main contributions: (1) thedefinition of visual graph metrics for dynamic graphs thatform the design space for graph animation, and (2) resultsfrom empirical studies showing that two specific metrics—node speed and target separation—have a particularly strongimpact on perception of animated dynamic graphs. Belowwe discuss what implications these findings will have ongraph visualization and how these results generalize (or not).
That node speed would have a dominant effect on dy-namic graph perception (H5) is already a well-known factfor animation in general [TMB02], and animated graphs inparticular [BW97, CDT∗92]. This result confirms the cur-rent emphasis on minimizing node movement in layout al-gorithms for dynamic graphs. Maintaining the stability of adynamic graph will certainly facilitate perception of change.
The target separation finding (H4) was not previouslyknown, and represents a useful guideline that designers ofgraph layout algorithms may want to take into account. Inother words, beyond minimizing edge crossings and main-taining uniform edge length, algorithms may now also wantto maximize the distance between entities that will appear ordisappear during the animation. Doing so will make it easierfor users to distinguish between these additions or deletionsfor when they want to reconstruct the temporal sequence. Onthe other hand, this would require at least some knowledgeof future changes to the graph, which is not always available.
Our levels for node speed and target separation may alsobe useful. We found these intervals through careful data ex-ploration after generating thousands of representative trials,and our split results clearly prove their validity: low speedsyielded high correctness, whereas high speeds yielded lowcorrectness. The same was true for target separation. There-fore, an informal rule of thumb for node speed would be thatnodes in an animated dynamic graph should ideally moveless than 5% of the viewport dimension per second. For tar-get separation, we found that even medium separation gave
rise to significant improvement, so a rule of thumb would bethat targets in an animated dynamic graph should ideally beseparated by at least 35-40% of the viewport dimension.
7. Limitations
No evaluation can cover all aspects of a realistic task, and wehad to delimit our study to make these experiments feasibleto perform. For example, we did not study how visualiza-tion can be used to draw attention to the addition and dele-tion events in the animation. Examples include highlighting,fading, and phosphor-style effects [BTC∗06]. The reason foromitting these was that we wanted this study to be focusedon the purely perceptual aspects of dynamic graphs. Usingvisualization to improve awareness comes later.
Another potential limitation is that the format of our eval-uation lended itself to recruiting only a relatively small num-ber of participants (28 in total) in order to keep the time in-vestment manageable. This may be the reason why some ef-fects on dynamic graph metrics were not significant. Furtherstudies are needed to investigate these phenomena in moredetail with more participants, e.g., using crowdsourcing.
Furthermore, many of our findings are not specific tographs and hold true for general animation. For example,that the amount of visual movement affects perception ofthe graph is a straightforward, if useful, result. We were dis-appointed not to find strong correlations between many ofour graph metrics and the user performance. However, thesefindings are indicative of the drawbacks of using animationacross the board, drawbacks that other authors have observedas well [TMB02]. While we strived to isolate our findings tothose specific to dynamic graphs only, we suspect that morecontrolled studies are necessary in the future to find the moresubtle effects that metrics such as edge sweep, edge-edgedistance, and edge crossings may have on the animation.
8. Conclusion and Future Work
We have performed an in-depth quantitative evaluation ofdynamic graph perception using animated node-link di-agrams. Our findings suggest significant effects of nodemovement and target separation on user performance. Thesefindings are consistent with existing work in the literatureand suggest future ways for how designers of dynamic graphvisualization software can improve their tools.
Our future work will use these findings to design bettergraph visualizations and to study alternative visual represen-tations, either separate from node-link diagrams altogether,or incorporate additional visual elements to aid perception.
9. Acknowledgements
This work was supported in part by the U.S. Department ofHomeland Security’s VACCINE Center under Award Num-ber 2009-ST-061-CI0003.
c© 2012 The Author(s)c© 2012 The Eurographics Association and Blackwell Publishing Ltd.
1213

S. Ghani & N. Elmqvist & J. S. Yi / Perception of Animated Node-Link Diagrams for Dynamic Graphs
References
[APP10] ARCHAMBAULT D., PURCHASE H., PINAUD B.: An-imation, small multiples, and the effect of mental map preserva-tion in dynamic graphs. IEEE Trans. on Visualization and Com-puter Graphics 7, 4 (2010), 539–552. 1, 2
[BBD09] BECK F., BURCH M., DIEHL S.: Towards an aestheticdimensions framework for dynamic graph visualisations. In Pro-ceedings of the International Conference on Information Visual-ization (2009), pp. 592–597. 3
[BC03] BRANDES U., CORMAN S. R.: Visual unrolling of net-work evolution and the analysis of dynamic discourse. Informa-tion Visualization 2, 1 (2003), 40–50. 2
[BEF02] BORGATTI S., EVERETT M., FREEMAN L.: UCINETfor windows: Software for social network analysis. Harvard An-alytic Technologies 6 (2002). 2
[BETT99] BATTISTA G. D., EADES P., TAMASSIA R., TOL-LIS I. G.: Graph Drawing: Algorithms for the Visualization ofGraphs. Prentice-Hall, 1999. 2, 3
[BFN85] BATINI C., FURLANI L., NARDELLI E.: What is a gooddiagram? A pragmatic approach. In Proceedings of the Interna-tional Conference on the Entity-Relationship Approach (1985),pp. 312–319. 2
[BM02] BATAGELJ V., MRVAR A.: Pajek—analysis and visual-ization of large networks. In Proceedings of the InternationalSymposium on Graph Drawing (2002), pp. 8–11. 2
[BS90] BAECKER R., SMALL I.: Animation at the interface. Theart of human-computer interface design (1990), 251–267. 2
[BTC∗06] BAUDISCH P., TAN D. S., COLLOMB M., ROBBINSD. C., HINCKLEY K., AGRAWALA M., ZHAO S., RAMOS G.:Phosphor: explaining transitions in the user interface using after-glow effects. In Proceedings of the ACM Symposium on UserInterface Software and Technology (2006), pp. 169–178. 2, 9
[BW97] BRANDES U., WAGNER D.: A bayesian paradigm fordynamic graph layout. In Proceedings of the International Sym-posium on Graph Drawing (1997), pp. 236–247. 2, 9
[CDT∗92] COHEN R., DIBATTISTA G., TAMASSIA R., TOLLISI., BERTOLAZZI P.: A framework for dynamic graph drawing.In Proceedings of the Symposium on Computational Geometry(1992), pp. 261–270. 2, 9
[CP96] COLEMAN M., PARKER D.: Aesthetics-based graph lay-out for human consumption. Software: Practice and Experience26, 12 (1996), 1415–1438. 2
[DG02] DIEHL S., GÖRG C.: Graphs, they are changing–dynamic graph drawing for a sequence of graphs. In Proceed-ings of the International Symposium on Graph Drawing (2002),vol. 2528, pp. 23–30. 2
[DS09] DUNNE C., SHNEIDERMAN B.: Improving graph draw-ing readability by incorporating readability metrics: a softwaretool for network analysts. Tech. Rep. HCIL-2009-13, Universityof Maryland, 2009. 2, 3
[FQ11] FARRUGIA M., QUIGLEY A.: Effective temporal graphlayout: a comparative study of animation versus static displaymethods. Information Visualization (2011). 1, 2
[HEH09] HUANG W., EADES P., HONG S.: Measuring effective-ness of graph visualizations: a cognitive load perspective. Infor-mation Visualization 8, 3 (2009), 139–152. 5
[HR07] HEER J., ROBERTSON G. G.: Animated transitions instatistical data graphics. IEEE Trans. on Visualization and Com-puter Graphics 13, 6 (2007), 1240–1247. 2
[KBM94] KRACKHARDT D., BLYTHE J., MCGRATH C.: Krack-plot 3.0: An improved network drawing program. Connections17, 2 (1994), 53–55. 2
[KNNL05] KUTNER M. H., NACHTSHEIM C. J., NETER J., LIW.: Applied linear statistical models. McGraw-Hill, 2005. 6, 8
[LPP∗06] LEE B., PARR C. S., PLAISANT C., BEDERSON B. B.,VEKSLER V. D., GRAY W. D., KOTFILA C.: TreePlus: in-teractive exploration of networks with enhanced tree layouts.IEEE Transactions on Visualization and Computer Graphics 12,6 (2006), 1414–1426. 2
[MMBd05] MOODY J., MCFARLAND D., BENDER-DEMOLLS.: Dynamic network visualization. AJS 110, 4 (2005), 1206–1241. 1, 2
[Noa05] NOACK A.: Energy-based clustering of graphs withnonuniform degrees. In Proceedings of the International Sym-posium on Graph Drawing (2005), pp. 309–320. 2, 4
[Paa92] PAAS F.: Training strategies for attaining transfer ofproblem-solving skill in statistics: A cognitive-load approach.Journal of Educational Psychology 84, 4 (1992), 429. 4, 5
[PS08] PURCHASE H. C., SAMRA A.: Extremes are better: In-vestigating mental map preservation in dynamic graphs. In Pro-ceedings of the International Conference on Diagrammatic Rep-resentation and Inference (2008), vol. 5223 of Lecture Notes inComputer Science, pp. 60–73. 2
[Pur02] PURCHASE H. C.: Metrics for graph drawing aesthetics.Journal of Visual Languages and Computing 13, 5 (2002), 501–516. 2
[RFF∗08] ROBERTSON G. G., FERNANDEZ R., FISHER D., LEEB., STASKO J. T.: Effectiveness of animation in trend visualiza-tion. IEEE Transactions on Visualization and Computer Graph-ics 14, 6 (2008), 1325–1332. 1, 2
[TMB02] TVERSKY B., MORRISON J. B., BÉTRANCOURT M.:Animation: can it facilitate? International Journal of Human-Computer Studies 57, 4 (2002), 247–262. 1, 2, 9
[WPCM02] WARE C., PURCHASE H. C., COLPOYS L.,MCGILL M.: Cognitive measurements of graph aesthetics. In-formation Visualization 1, 2 (2002), 103–110. 3
[YEL10] YI J. S., ELMQVIST N., LEE S.: TimeMatrix: ana-lyzing temporal social networks using interactive Matrix-Basedvisualizations. International Journal of Human-Computer Inter-action 26, 11 (2010), 1031–1051. 2
c© 2012 The Author(s)c© 2012 The Eurographics Association and Blackwell Publishing Ltd.
1214