Embed Size (px)
Citation preview
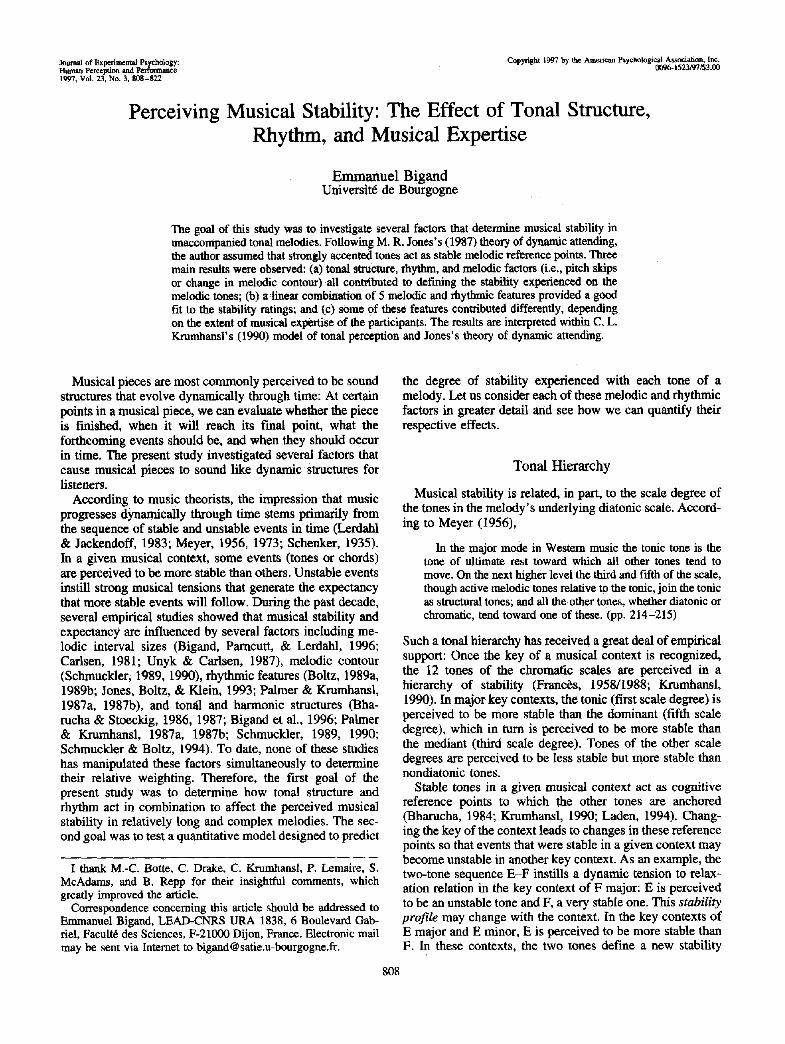
Journal of Experimental Psychology: Copyright 1997 by the American Psychological Association, Inc. Human Perception and Performance 0096-1523/97/$3.00 1997, Vol. 23, No. 3, 808-822
Perceiving Musical Stability: The Effect of Tonal Structure, Rhythm, and Musical Expertise
E m m a n u e l Bigand Universit6 de Bourgogne
The goal of this study was to investigate several factors that determine musical stability in unaccompanied tonal melodies. Following M. R. Jones's (1987) theory of dynamic attending, the author assumed that strongly accented tones act as stable melodic reference points. Three main results were observed: (a) tonal structure, rhythm, and melodic factors (i.e., pitch skips or change in melodic contour)all contributed to defining the stability experienced on the melodic tones; (b) a linear combination of 5 melodic and rhythmic features provided a good fit to the stability ratings; and (c) some of these features contributed differently, depending on the extent of musical expertise of the participants. The results are interpreted within C. L. Krumhansl's (1990) model of tonal perception and Jones's theory of dynamic attending.
Musical pieces are most commonly perceived to be sound structures that evolve dynamically through time: At certain points in a musical piece, we can evaluate whether the piece is finished, when it will reach its final point, what. the forthcoming events should be, and when they should occur in time. The present study investigated several factors that cause musical pieces to sound like dynamic structures for listeners.
According to music theorists, the impression that music progresses dynamically through time stems primarily from the sequence of stable and unstable events in time (Lerdahl & Jackendoff, 1983; Meyer, 1956, 1973; Schenker, 1935). In a given musical context, some events (tones or chords) are perceived to be more stable than others. Unstable events instill strong musical tensions that generate the expectancy that more stable events will follow. During the past decade, several empirical studies showed that musical stability and expectancy are influenced by several factors including me- lodic interval sizes (Bigand, Parncutt, & Lerdahl, 1996; Carlsen, 1981; Unyk & Carlsen, 1987), melodic contour (Schmuckler, 1989, 1990), rhythmic features (Boltz, 1989a, 1989b; Jones, Boltz, & Klein, 1993; Palmer & Krumhansl, 1987a, 1987b), and tonal and harmonic structures (Bha- rucha & Stoeckig, 1986, 1987; Bigand et al., 1996; Palmer & Krumhansl, 1987a, 1987b; Schmuckler, 1989, 1990; Schmuckler & Boltz, 1994). To date, none of these studies has manipulated these factors simultaneously to determine their relative weighting. Therefore, the first goal of the present study was to determine how tonal structure and rhythm act in combination to affect the perceived musical stability in relatively long and complex melodies. The sec- ond goal was to test a quantitative model designed to predict
I thank M.-C. Botte, C. Drake, C. Krnmhansl, P. Lemaire, S. McAdams, and B. Repp for their insightful comments, which greatly improved the article.
Correspondence concerning this article should be addressed to Emmanuel Bigand, LEAD-CNRS URA 1838, 6 Boulevard Gab- riel, Facult6 des Sciences, F-21000 Dijon, France. Electronic mail may be sent via Internet to [email protected].
the degree of stability experienced with each tone of a melody. Let us consider each of these melodic and rhythmic factors in greater detail and see how we can quantify their respective effects.
Tonal Hierarchy
Musical stability is related, in part, to the scale degree of the tones in the melody's underlying diatonic scale. Accord- ing to Meyer (1956),
In the major mode in Western music the tonic tone is the tone of ultimate rest toward which all other tones tend to move. On the next higher level the third and fifth of the scale, though active melodic tones relative to the tonic, join the tonic as structural tones; and all theother tones, whether diatonic or chromatic, tend toward one of these. (pp. 214-215)
Such a tonal hierarchy has received a great deal of empirical support: Once the key of a musical context is recognized, the 12 tones of the chromatic scales are perceived in a hierarchy of stability (Franc~s, 1958/1988; Krurnhansl, 1990). In major key contexts, the tonic (first scale degree) is perceived to be more stable than the dominant (fifth scale degree), which in turn is perceived to be more stable than the mediant (third scale degree). Tones of the other scale degrees are perceived to be less stable but more stable than nondiatonic tones.
Stable tones in a given musical context act as cognitive reference points to which the other tones are anchored (Bharucha, 1984; Krumhansl, 1990; Laden, 1994). Chang- ing the key of the context leads to changes in these reference points so that events that were stable in a given context may become unstable in another key context. As an example, the two-tone sequence E-F instills a dynamic tension to relax- ation relation in the key context of F major: E is perceived to be an unstable tone and F, a very stable one. This stability profile may change with the Context. In the key contexts of E major and E minor, E is perceived to be more stable than F. In these contexts, the two tones define a new stability
808
PERCEIVING MUSICAL STABILITY 809
profile because they instill a relaxation to tension relation. Changes in the musical stability of the tones are of psycho- logical importance because they alter the dynamic shape of the sequence and, subsequently, modify its perceptual iden- tity. Indeed, Dowling (1986) showed that changing the key context of a six-tone melody makes that melody difficult to recognize. Similar results were obtained by Bigand and Pinean (1996) with longer tone sequences.
The cormectionist model of tonal perception developed by Bharucha (1987) provides an elegant account for the effects of key context on musical stability. In this model, the 12 tones of the chromatic scale are linked to major and minor chords and to major and minor keys. Tonal hierarchies are represented by the strength of the connections that link tone units to chord and key units. Musical stability is instantiated by the amount of activation that spreads from key units to tone units. The more activated tone units correspond with the more stable tones in a given context and vice versa, Changing the key context would modify the amount of activation propagating to the tone units, so that a unit that is strongly activated in one context would be less activated in another,
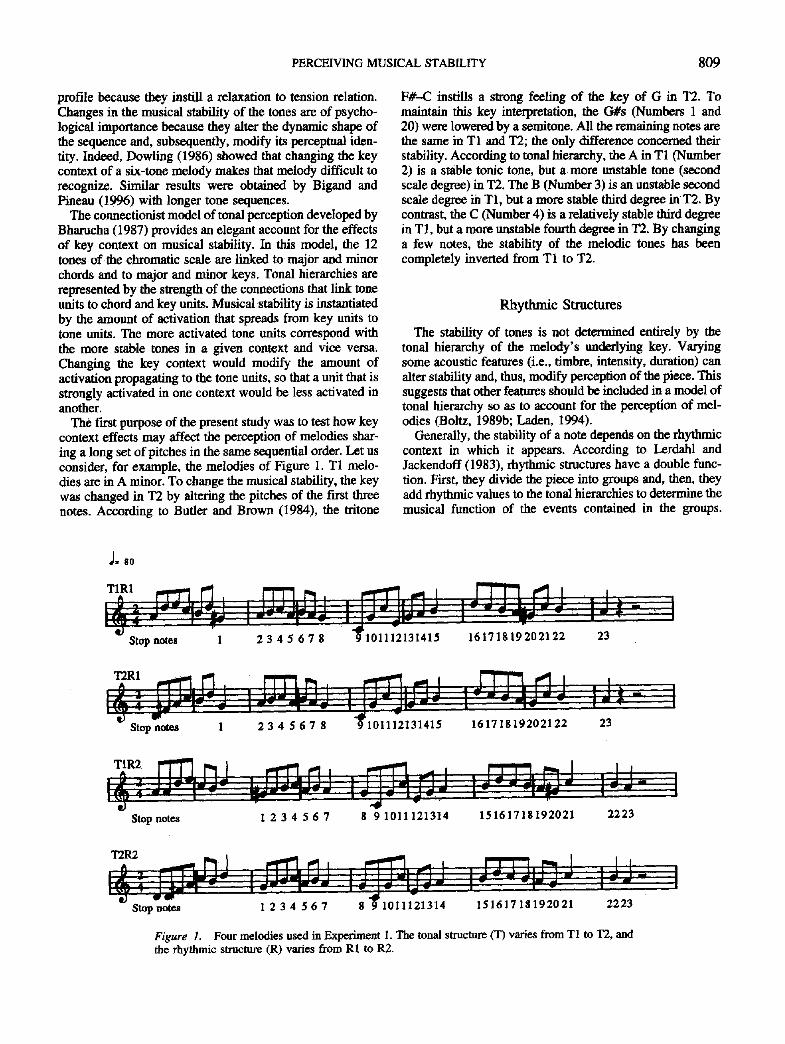
The first purpose of the present study was to test how key context effects may affect the perception of melodies shar- ing a long set of pitches in the same sequential order. Let us consider, for example, the melodies of Figure 1. T1 melo- dies are in A minor. To change the musical stability, the key was changed in T2 by altering the pitches of the fast three notes. According to Butler and Brown (1984), the tritone
F#--C instills a strong feeling of the key of G in T2. To maintain this key interpretation, the G#s (Numbers 1 and 20) were lowered by a semitone. All the remaining notes are the same in T1 and 1"2; the only difference concerned their stability. According to tonal hierarchy, the A in T1 (Number 2) is a stable tonic tone, but a more unstable tone (second scale degree) in T2. The B (Number 3) is an unstable second scale degree in T1, but a more stable third degree inT2. By contrast, the C (Number 4) is a relatively stable third degree in T1, but a more unstable fourth degree in T2. By changing a few notes, the stability of the melodic tones has been completely inverted from T1 to T2.
Rhythmic Structures
The stability of tones is not determined entirely by the tonal hierarchy of the melody's underlying key. Varying some acoustic features (i.e., timbre, intensity, duration) can alter stability and, thus, modify perception of the piece. This suggests that other features should be included in a model of tonal hierarchy so as to account for the perception of mel- odies (Boltz, 1989b; Laden, 1994).
Generally, the stability of a note depends on the rhythmic context in which it appears. According to Lerdahl and Jackendoff (1983), rhythmic structures have a double func- tion. First, they divide the piece into groups and, then, they add rhythmic values to the tonal hierarchies to determine the musical function of the events contained in the groups.
~ 80
Stop notes 101112131415 16171819202122 23
Stop notes 101112131415 16171819202122 23
Stop n~¢s 1 2 34 56 7 8 9 1011121314 15161718192021 2223
Stop notes 1011121314 15161718192021 2223
Figure 1. Four melodies used in Experiment I. The tonal structure (T) varies from T1 to T2, and the rhythmic structure (R) varies from R1 to R2.
810 BIGAND
From a cognitive point of view, the function of rhythm may be to create temporal accents that capture the listeners' attention and emphasize certain relationships among the tones of a melody (Boltz, 1991a, 1993a, 1993b; Jones, 1987). Jones, Boltz, and Kidd (1982) reported that it is easier to discern pitch changes in a melody when these changes occur on temporal accents. Changing the rhythm of a melody modifies the manner in which attention is guided through time, such that tones that capture attention in one rhythmic context fail to do so in another rhythmic context and vice versa (Boltz, 1989a, 1991a; Jones & Boltz, 1989; Jones & Ralston, 1991; Jones, Summerell, & Marshburn, 1987).
The second purpose of the present experiments was to investigate how a change in rhythm affects the stability perceived with each tone of long melody. I assumed that tones that receive rhythmic accents should be perceived to be stable melodic reference points because they can capture the listeners' attention. Changing the rhythm of a melody would shift the rhythmic accents and then alter the overall musical stability profile for this melody. Previous results reported by Palmer and Knmihanal (1987a, 1987b; see also Bigand, 1993) and, more recently, by Laden (1994) sup- ported this assumption.
Integration of the Pitch and Rhythmic Structures
Given that both pitch and rhythmic structures govern the perception of tonal melodies, the third goal of the present study was to investigate how these structures act in combi- nation. Peretz and Kolinsky (1993) distinguished two ac- counts of the processing of pitch and rhythmic structures. One is that pitch and rhythm are two separate perceptual components, so that changing one of them in a melody would not necessarily interfere with the processing of the other. This two.component model was supported by several studies in neuropsychology (Peretz, 1990; Peretz & Kolin- sky, 1993; Peretz & Morais, 1989) and other empirical studies (Haipem, 1984; Monahan & Carterette, 1985; Monahan, Kendall, & Carterette, 1987; Palmer & Krum- hansl, 1987a, 1987b; Smith & Cuddy, 1989).
A second possibility is that pitch and rhythm are pro- cessed integrally, so that a change in one affects the per- ception of the melody as a whole. This single-component model was supported by several studies asking the partici- pants to recall melodies (Bolt.z, 1991a; Boltz & Jones, 1986; Deutsch, 1980), to recognize melodies (Boltz, 1993a; Jones, Summerell, & Marshbum, 1987; Jones & Ralston, 1991), to evaluate how complete a melody is (Boltz, 1989a, 1989b), or to estimate the duration of melodies (Boltz, 1991b, 1993b; Jones, Boltz, & Klein, 1993). According to Boltz (1989a, 1989b), the strongest evidence for a single- component model comes from the presence of interactions between pitch and rhythmic structure. For example, Boltz (1989b) found that melodies were judged to be more com- plete when ending on the dominant tone than when ending on the mediant tone, hut only when the dominant tones were rhythmically accented throughout the melody. The reverse
phenomenon was observed when the mediant tones were rhythmically accented. In a similar vein, Boltz (1989a) argued that the difference in musical relaxation provided by certain pitch intervals may vary strongly depending on whether or not these intervals occur on time, relative to the preceding temporal context. Consistent data were reported by Schmuckler and Boltz (1994) with chord sequences and by Boltz (1993a) in a recognition task. The two sets of conflicting results are difficult to integrate within a single framework.
A third possibility suggested by Peretz and Kolinsky (1993) is that pitch and rhythm are treated independently in an earlier stage of melodic processing and are then fused into a unified dimension in a second stage of processing. However, the question remains of specifying whether inte- gration that may occur at a second stage of processing relies on an additive or on an interactive combination of both structures. No definite answer to this question seems to be available currently. Thus, the third purpose of the present study was to investigate this issue further in an experimental design that differed in several regards from those that are commonly used.
First, two rhythmic structures were crossed with two pitch structures in a 2 × 2 factorial design. Second, the melodies differed in tonal structure but not in melodic features (i.e., pitch skips and melodic contour), which were kept constant (see Figure 1). Third, the degree of musical stability expe- rienced by listeners was registered at several locations in the melodies. Such a design allowed us to determine whether the interactive effect occurs on only one or two specific tones of the melody or on the majority of the melodic tones.
Predicting Perceived Musical Stability
As stated by Boltz (1989b), regardless of their additive or interactive nature, significant effects of both rhythmic and tonal structures would demonstrate "the need to incorporate dynamic pattern influences into models of tonal perception" (p. 12). The fourth goal of the present study was to address this issue in defining a model that would predict the effect of several melodic and temporal factors on the perceived musical stability. The rationale for the present model was provided primarily by Jones (1987) and Jones and Boltz (1989).
According to Jones (1987), pitch and rhythmic structures display several kinds of melodic (m) and temporal (t) ac- cents. The manner in which these accents are temporally phased creates a unified accent structure (called joint accent structure) that dynamically orients the listeners' attention. According to Jones and Boltz (1989) the dynamic shape of a musical sequence refers to the influence that the joint accent structure has on the attentiomfl trajectories developed during the listening of the piece. The main property of a joint accent structure is that it contains melodic markers of different strengths: "coupled or temporally coincident ac- cents (m plus t) yield stronger markers than do single accents (m or t)," (Jones, 1987, p. 625). The strength of a marker was determined by the number of accents that co-
PERCEIVING MUSICAL STABILITY 811
incide in time (Jones & Boltz, 1989). Changing the rhythm of a melody changes the accent coupling, such that strong markers in one rhythmic structure may he weak markers in another and vice versa. Consequently, these changes should alter the dynamic shape of the sequence in that they modify the modes of attentional following in listeners. Changing the pitch structure provokes similar changes in the strength of the markers in the joint'aeeent structure and, thus, in the dynamic shape of the sequence.
In the present study, the influence of several melodic rhythmic features on the dynamic shape of a melody was addressed by considering the effects of these features on the perceived musical stability profiles. Stability profile refers to the alternation of stable and less stable tones in the melody. Strong markers were assumed to act as very stable melodic reference points because of the presumably strong attraction that they exert on the listeners' attention. The computed strengths of accentuation for each tone of a mel- ody should then provide a good fit to the perceived stability.
Following Jones (1987), Jones and Boltz (1989), Se- ratine, Glassrnan, and Overheeke (1989), and Bigand (1993), five predictors were used: tonal weight, duration weight, metric weight, interval size weight, and melodic contour weight. The tonal weights, defined according to Krumhansl's (1990) model of tonal perception, reflect the importance of each tone in the tonal hierarchy of the mel- ody's underlying key. Following Krumhansl and Kessler's findings (I982, Experiment 2), when part of a musical piece suggests a new key (temporary modulation), the present model assigns to this part of the piece the key profile values of this new temporary key (see Experiment 2). How the
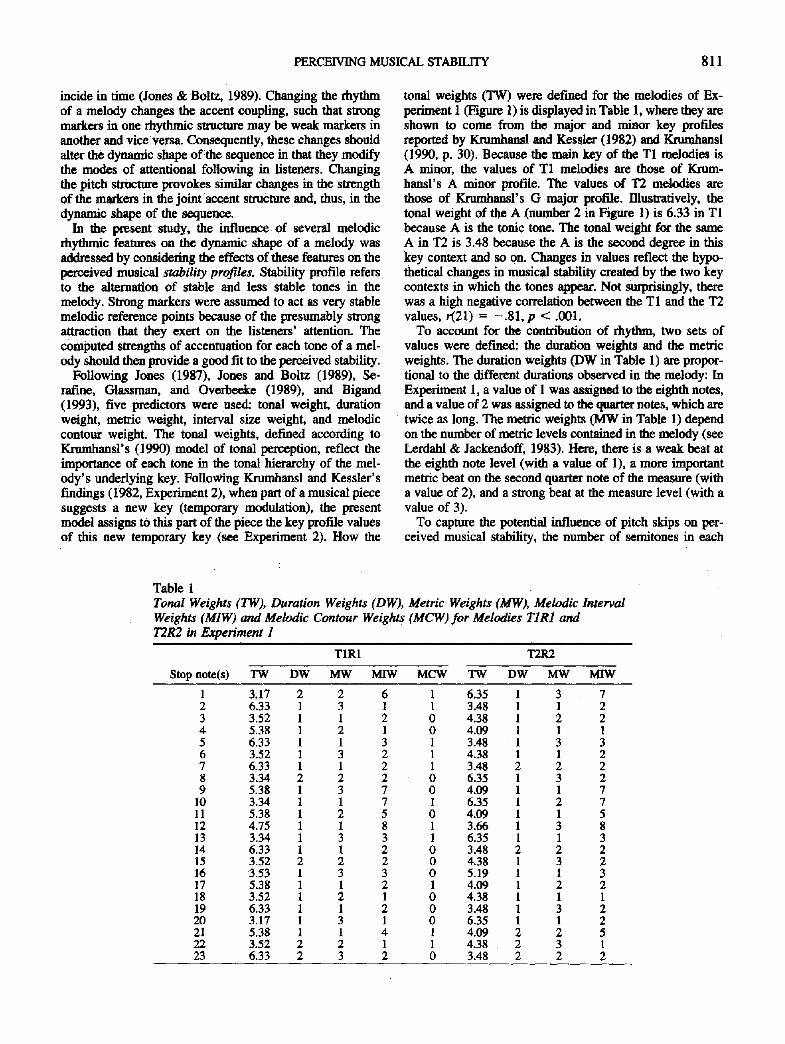
tonal weights (TW) were defined for the melodies of Ex- perinaent 1 (Figure 1) is displayed in Table 1, where they are shown to come from the major and minor key profiles reported by Krumhansl and Kessler (1982) and Krumhansl (1990, p. 30). Because the main key of the T1 melodies is A minor, the values of T1 melodies are those of Krum- hansl's A minor profile. The values of T2 melodies are those of Kntmhansl's G major profile. Illustratively, the tonal weight of the A (number 2 in Figure 1) is 6.33 in T1 because A is the tonic tone. The tonal weight for the same A in T2 is 3.48 because the A is the second degree in this key context and so on. Changes in values reflect the hypo- thetical changes in musical stability created by the two key contexts in which the tones appear. Not surprisingly, there was a high negative correlation between the T1 and the T2 values, r(21) = - .81 , p < .001.
To account for the contribution of rhythm, two sets of values were defined: the duration weights and the metric weights. The duration weights (DW in Table 1) are propor-
tional to the different durations observed in the melody: In Experiment 1, a value of 1 was assigned to the eighth notes, and a value of 2 was assigned to the quarter notes, which are twice as long. The metric weights (MW in Table I) depend on the number of metric levels contained in the melody (see Lerdabl & Jackendoff, 1983). Here, there is a weak heat at the eighth note level (with a value of 1), a more important metric heat on the second quarter note of the measure (with a value of 2), and a strong beat at the measure level (with a value of 3).
To capture the potential influence of pitch skips on per- ceived musical stability, the number of semitones in each
Table 1 Tonal Weights (TW), Duration Weights (DW), Metric Weights (MW), Melodic Interval Weights (MIW) and Melodic Contour Weights (MCW) for Melodies TIR1 and T2R2 in Experiment 1
T1R1 T2R2
Stop note(s) TW DW MW MIW MCW TW DW MW MIW
1 3.17 2 2 6 1 6.35 1 3 7 2 6.33 1 3 1 1 3.48 1 1 2 3 3.52 1 1 2 0 4.38 1 2 2 4 5.38 1 2 1 0 4.09 1 1 1 5 6.33 1 1 3 1 3.48 1 3 3 6 3.52 1 3 2 1 4.38 1 1 2 7 6.33 1 1 2 1 3.48 2 2 2 8 3.34 2 2 2 0 6.35 1 3 2 9 5.38 1 3 7 0 4.09 1 1 7
10 3.34 1 1 7 1 6.35 1 2 7 11 5.38 1 2 5 0 4.09 1 1 5 12 4.75 1 1 8 1 3.66 1 3 8 13 3.34 1 3 3 1 6.35 1 1 3 14 6.33 1 1 2 0 3.48 2 2 2 15 3.52 2 2 2 0 4.38 1 3 2 16 3.53 I 3 3 0 5.19 1 1 3 17 5.38 1 1 2 1 4.09 1 2 2 18 3.52 1 2 1 0 4.38 1 1 1 19 6.33 1 1 2 0 3.48 1 3 2 20 3.17 1 3 1 0 6.35 1 1 2 21 5.38 1 1 4 1 4.09 2 2 5 22 3.52 2 2 1 1 4.38 2 3 1 23 6.33 2 3 2 0 3.48 2 2 2
812 BIGAND
melodic interval was computed (MIW values in Table 1). To account for the potential ir,_fluence of change in melodic contour, a value of 1 was assigned to the tones on which a change in contour occurs. A value of 0 was assigned in the other cases (MCW values in Table 1).
To summarize, we hypothesize that several factors may affect the perception of stability. Two of these (i.e., tonal structure and rhythm) were varied systematically in the following experiments and the others (interval size, melodic contour) were kept constant. Three main assumptions were made:
1. changing the tonal structure of a melody by modifying only a few pitches should strongly affect the stability for the majority of the other tones;
2. changing the rhythmic structure should also affect the stability of the melodic tones; and
3. a combination of five kinds of melodic and rhythmic ac- cents (i.e., tonal, duration, metric, interval size, and me- lodic contour weights) should predict the perceived stability.
In addition, given that some of these factors rely on more superficial features (duration, melodic interval sizes, change in melodic contour) than others (tonal and metric struc- tures), some may be more important for musicians and some for nonmusieians. Thus, testing these factors provided an opportunity to investigate the effect of musical expertise on the perception of musical stability.
Expe r imen t 1
M e ~ o d
Participants. Forty music teachers (hereinafter referred to as musicians) volunteered to participate in the experiment. All held qualifications from a French Music Conservatory and had received at least 10 years of intensive training in music (i.e., music thoory, ear training, and instrumental performance). Forty college-age students (hereinafter referred to as nomuusicians) also took part in the experiment. They had-never played an instrument nor studied music. All were students of psychology and participated in the experiment as volunteers.
Material. Four melodies T1R1, T1R2, T2R1, and T2R2 were defined (Figure 1). The TI melodies differed from the T2 melodies by the key context induced by the first melodic tones. Following Palmer and Krumhansl (1987a, 1987b), the R2 melodies were defined by shifting the rhythmic structure of R1 by one eighth note. Consequently, most of the tones that fall on a strong metric beat in R1 fall on a weak metric beat in R2 and vice versa. Several tones with a long duration in R1 have a short duration in R2 and vice versa. These four melodies were segmented into 23 frag- ments. Each segment started at the beginning of the melody and stopped on a different note called a stop note, For example, in T1R1, the first fragment stopped on G#, the second on A, and so o n .
The 23 fragments were played with sampled piano sounds produced by the EMTIO Yamaha Sound Expander at a tempo of 80 quarter notes per minute. The Yamaha sampler was controlled through a MIDI interface by a Macintosh computer running Per- former software. Velocity, a parameter related to the force with which a key is struck, was held constant for all pitches. The participants were allowed to adjust the output of the amplifier to a
comfortable level. There was no silence between the offset of a tone and the onset of the succeeding tone.
Task. The participants' task, similar to that used by Palmer and Krumhansl (1987a, 1987b), consisted of evaluating the musical stability on each stop note using a judgment scale ranging from 1 (very low stability) to 7 (very great stability). In a preliminary session, the participants listened to musical examples having dif- ferent degrees of stability. They were told that strong stability at the end of a fragment evokes the feeling that the melody todd naturally stop at this point. On the other hand, low stability evokes the feeling that there must be a continuation of the melody. Because stability may be varied in subtle ways in music, the participants were encouraged to use all the degrees of the judgment scale. In addition, at the end of the experiment, the musicians were required to identify the key of the melody that they had listened to and to identify its meter (i.e., they had to draw the bar lines on a score).
Design and procedure. Four independent groups of 10 partic- ipants each were assigned to the four conditions defined by cross- ing the two independent variables: Key context (2) × Rhythm (2). Each participant gave a rating for each of the 23 stop notes of only one melody. The participantswere seated in groups of two, each in front of a M]DI keyboard, connected to the computer, which recorded their answers. Seven keys corresponded to the 7 points of the judgment scale. Before running the experiment, the partici- pants practiced evaluation of musical stability with 12 melodic fragments. No feedback was provided unless they used the scale in the reverse order. The experiment started with the fragment ter- minating on Stop Note 1. The participants had 8 s to give their stability judgment. After that, the fragment terminating on Stop Note 2 was played, then the fragment ending on Stop Note 3, and so on. This makes the judgments collected on stop notes compa- rable because all the stop notes were judged when they were first heard. As observed by Bigand (1993, Experiment 1) random presentation of the fragments greatly confuses the participants because it often appears that a short fragment follows a longer one. In this case, the degree of completeness is defined not only by musical stability but also by the listener's knowledge of the con- tinuation of the melody. As a consequence, the participants (no- tably the nonmusicians) tended to give higher ratings of stability for musical fragments of increasing duration. This suggested that for them, regardless of the musical function of the last tone, the longer the fragment, the higher its degree of completeness. This linear tendency was not observed when the fragments were pre- sented in a sequential order(Bigand, 1993, Experiment 2).
Results
Participant agreement. To assess interparticipant agree- ment, the Kendall coefficient of concordance was computed separately for the musicians and the nonmusieians in each experimental situation. The observed coefficients were all significant (p < .01). This result indicated a significant agreement among the participants' ratings in all experimen- tal situations. The correlations between the musicians' and the nonmusicians' mean ratings were also significant in each experimental condition. The lowest correlation was observed for the T1R1 melody, r(21) = .60, p < .01, and the highest for the T2R1 melody, r(21) = 67, p < .01. The data for T1R1 and T1R2 were then compared with those obtained by Bigand (1993, Experiment 2) with the same melodies. All correlations were significant for both groups,
PERCEIVING MUSICAL STABILITY 813
indicating the reliability of the experimental method. The lowest coefficient was observed for the musicians in T1R1, r(21) = .77, p < .01, and the highest for the nonmusicians in T1R1, r(21) = .85, p < .01.
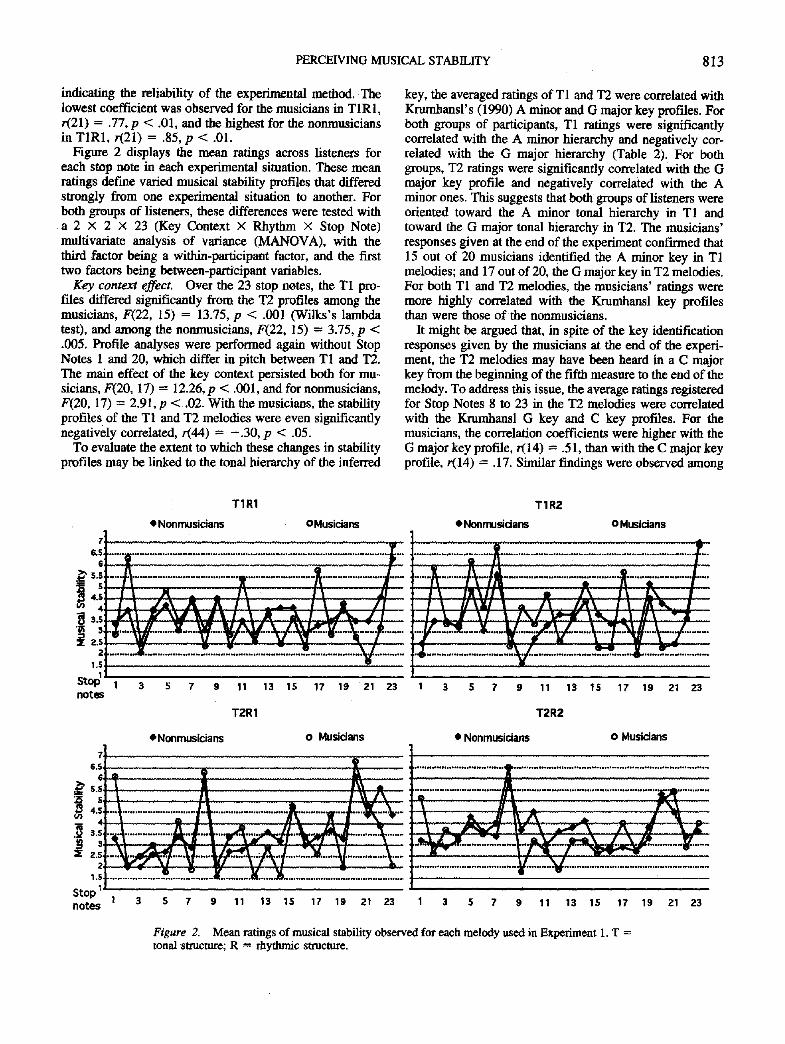
Figure 2 displays the mean ratings across listeners for each stop note in each experimental situation. These mean ratings define varied musical stability profiles that differed strongly from one experimental situation to another. For both groups of listeners, these differences were tested with a 2 × 2 × 23 (Key Context × Rhythm × Stop Note) multivariate analysis of variance (MANOVA), with the third factor being a within-participant factor, and the first two factors being between-participant variables.
Key context effect. Over the 23 stop notes, the T1 pro- files differed significantly from the T2 profiles among the musicians, F(22, 15) = 13.75, p < .001 (Wilks's lambda test), and among the nonmusicians, F(22, 15) = 3.75, p < .005. Profile analyses were performed again without Stop Notes 1 and 20, which differ in pitch between T1 and T2. The main effect of the key context persisted both for mu- sicians, F(20, 17) = 12.26, p < .001, and for nonmusicians, F(20, 17) = 2.91, p < .02. With the musicians, the stability profiles of the T1 and T2 melodies were even significantly negatively correlated, r(44) = - .30, p < .05.
To evaluate the extent to which these changes in stability profiles may be linked to the tonal hierarchy of the inferred
key, the averaged ratings of T1 and T2 were correlated with Krumhansl's (1990) A minor and G major key profiles. For both groups of participants, T1 ratings were significantly correlated with the A minor hierarchy and negatively cor- related with the G major hierarchy (Table 2). For both groups, T2 ratings were significantly correlated with the G major key profile and negatively correlated with the A minor ones. This suggests that both groups of listeners were oriented toward the A minor tonal hierarchy in T1 and toward the G major tonal hierarchy in T2. The musicians' responses given at the end of the experiment confirmed that 15 out of 20 musicians identified the A minor key in T1 melodies; and 17 out of 20, the G major key in T2 melodies. For both T1 and T2 melodies, the musicians' ratings were more highly correlated with the Krumhansl key profiles than were those of the nonmusicians.
It might be argued that, in spite of the key identification responses given by the musicians at the end of the experi- ment, the T2 melodies may have been heard in a C major key from the beginning of the fifth measure to the end of the melody. To address this issue, the average ratings registered for Stop Notes 8 to 23 in the T2 melodies were correlated with the Krumhansl G key and C key profiles. For the musicians, the correlation coefficients were higher with the G major key profile, r(14) = .51, than with the C major key profile, r(14) = .17. Similar findings were observed among
71 s.s~
el .~' s.s i
.~ ~.s!
1 .S 2
sto~ n o t e s
~r
6.s~
TIR1
• Nonmusidans OMusicians
b ~ ] r f k~g Tt l l lA:~ i l~ =k I ~ 1 1
T I R 2
• Nonmusidans o Musicians
... ,.,..:..'.. . V : : . , , - . . : . , ,
1 3 5 7 9 i l 13 15 17 19 21 23 1 3
TER 1
eNonmusidans
S 7 9 11 13 15 17 19 21 23
T2R2
e~ s.s!
i
L . . . .
1 . ~ ,l°°°°,°,oo,°..°°.,,..oo.,i.°°°,°,°°°l.,,,
o Husidans • Nonmusicians o Musidans
E
. . . . . . . . . . .
'.,,o..........,...,..o...,............ ....
Stop I notes
'~T"7""T"T ' , '7 " "7 , 'T 'T 'T"T" ' 'T" 'T ' "7" " '7" ' "
t , J I t l / ~ . - I "~ -
, ~ . - . . 7 . . Z ? Z . . . - . - } r T t ~ . - - ~ - , , . ~ .-..... , , . , , , : , : ........... ........ - V ............................. ' . - ....................
1 3 5 7 9 11 13 15 17 19 21 23 1 3 5 7 9 11 13 15 17 19 21 23
Figure 2. Mean ratings of musical stability observed for each melody used in Experiment 1. T = tonal structure; R = rhythmic structure.
814 BIGAND
Table 2 Correlation (Pearson r) Comparing TI and T2 Ratings With Krumhansl's Key Profiles
r for:
Participants Key T1 T2
Musicians A minor .69** -.54"* G major -.45* .58**
Nonmusicians A minor .53** -.42" G major -.28 .40
*p<.05 . **p<.01.
the nonmusicians so that the correlation with the G major key profile was .43, and the correlation with the C major key profile was - .03. This suggests that even though T2 melodies could theoretically he heard in C major on these stop notes, the participants' responses were more in agree- merit with the G major key profiles.
Effect of rhythm. The MANOVA also revealed that changing the rhythmic structures from R1 to R2 led to significant changes in the musical stability profiles for the musicians, F(22, 15) = 2.87, p < .02 (Wilks's lambda test), and for the nonmusicians, F(22, 15) = 2.99, p < .02. The clearest illustration of this rhythmic effect was observed with Stop Notes 5 and 7 in T1 melodies. The musical stability of these tones increased strongly from R1 to R2, lending to a strong change in the musical stability profile. In the present case, this increase in stability was due to the facts that Stop Note 5 fell on a strong metric beat in R2 (and not in R1) and that Stop Note 7 was of longer duration in R2 than in R1. Furthermore, analyses were then performed to investigate this rhythmic effect in greater detail.
The musicians' responses, given at the end of the exper- iment, were considered first to confirm that a shift in the rhythmic structure from R1 to R2 effectively provoked a shift in the location of the metric strong heats. Among the 20 participants who listened to the R1 melodies, 16 reported a metric structure (identical to the one displayed in Figure 1), in which a bar line occurs between Stop Notes 1 and 2, 5 and 6, 8 and 9, 11 and 12, and so on. Among the 20 musicians who listened to the R2 melodies, 17 reported a metric structure (identical to the one displayed in Figure 1), in which a bar line occurs just before Stop Note 1 and, then between stop notes 4 and 5, 7 and 8, 11 and 12, and so on.
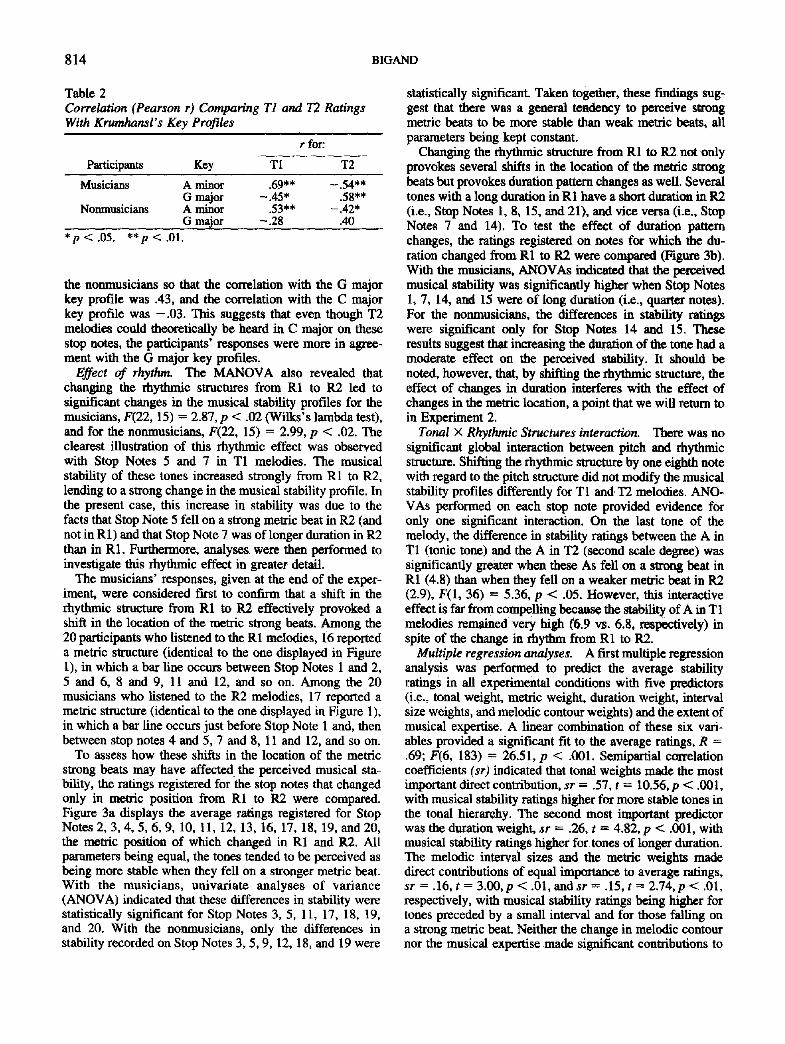
To assess how these shifts in the location of the metric strong beats may have affected the perceived musical sta- bility, the ratings registered for the stop notes that changed only in metric position from RI to R2 were compared. Figure 3a displays the average ratings registered for Stop Notes 2, 3, 4, 5, 6, 9, 10, 11, 12, 13, 16, 17, 18, 19, and 20, the metric position of which changed in R1 and R2. All parameters being equal, the tones tended to be perceived as being more stable when they fell on a stronger metric beat. With the musicians, univariate analyses of variance (ANOVA) indicated that these differences in stability were statistically significant for Stop Notes 3, 5, 11, 17, 18, 19, and 20. With the nonmusicians, only the differences in stability recorded on Stop Notes 3, 5, 9, 12, 18, and 19 were
statistically significant. Taken together, these findings sug- gest that there was a general tendency to perceive strong metric beats to be more stable than weak metric beats, all parameters being kept constant.
Changing the rhythmic structure from R1 to R2 not only provokes several shifts in the location of the metric strong beats but provokes duration pattern changes as well. Several tones with a long duration in R1 have a short duration in R2 (i.e., Stop Notes 1, 8, 15, and 21), and vice versa (i.e., Stop Notes 7 and 14). To test the effect of duration pattern changes, the ratings registered on notes for which the du- ration changed from R1 to R2 were compared (Figure 3b). With the musicians, ANOVAs indicated that the perceived musical stability was significantly higher when Stop Notes I, 7, 14, and 15 were of long duration (i.e., quarter notes). For the nonmusicians, the differences in stability ratings were significant only for Stop Notes 14 and 15. These results suggest that increasing the duration of the tone had a moderate effect on the perceived stability. It should be noted, however, that, by shifting the rhythmic structure, the effect of changes in duration interferes with the effect of changes in the metric location, a point that we will return to in Experiment 2.
Tonal × Rhythmic Structures interaction. There was no significant global interaction between pitch and rhythmic structure. Shifting the rhythmic structure by one eighth note with regard to the pitch structure did not modify the musical stability profiles differently for T1 and T2 melodies. ANO- VAs performed on each stop note provided evidence for only one significant interaction. On the last tone of the melody, the difference in stability ratings between the A in T1 (tonic tone) and the A in T2 (second scale degree) was significantly greater when these As fell on a strong heat in R1 (4.8) than when they fell on a weaker metric beat in R2 (2.9), F(1, 36) = 5,36, p < .05. However, this interactive effect is far from compelling because the stability of A in T1 melodies remained very high (6.9 vs. 6.8, respectively) in spite of the change in rhythm from R1 to R2.
Multiple regression analyses. A first multiple regression analysis was performed to predict the average stability ratings in all experimental conditions with five predictors (i.e., tonal weight, metric weight, duration weight, interval size weights, and melodic contour weights) and the extent of musical expertise. A linear combination of these six vari- ables provided a significant fit to the average ratings, R = ,69; F(6, 183) = 26.51, p < .001. Semipartial correlation coefficients (sr) indicated that tonal weights made the most important direct contribution, sr = .57, t = 10.56,p < .001, with musical stability ratings higher for more stable tones in the tonal hierarchy. The second most important predictor was the duration weight, sr = .26, t = 4.82, p < .001, with musical stability ratings higher for tones of longer duration. The melodic interval sizes and the metric weights made direct contributions of equal importance to average ratings, sr = .16, t = 3.00,p < .01, andsr = .15, t = 2.74,p < .01, respectively, with musical stability ratings being higher for tones preceded by a small interval and for those falling on a strong metric beat. Neither the change in melodic contour nor the musical expertise made significant contributions to
PERCEIVING MUSICAL STABILITY 815
(a) Musidans Nonmusicians
OStrong beat o W e a k beat 7, 6 . 5 - : . . . . . . .
s.5 - ' :
, : . . . . . . . . . . . . . . . . . . . . . . . . . . . . . . . . . . . . . . . . . . . . . . .
S.S L..--.~
1 .S
stop' n o t e s
• Strong beat o W e a k b e a t
;_!7 ....... ::v__:_::______:: 7;IIITIJIT;~;IIITII771!IITITI_~V~/;IIIIII777~;II;IIIITIT;~I~71;;III,;;171 ii;ii 71~i iiiii
2 3 4 5 6 9 10 11 12 13 16 17 18 19 20 2 3 4 $ 6 9 10 11 12 13 16 17 18 19 20
(b) Musidans Nonmuslcians
. • Q~Jarter note o Eighth note *Quarter note 0 Eighth note 7 6.s!
ei s.s~
s: 4.s~
o) ,. s.s'
S2
Stop notes
] = = ...... . . . . . . . . . . . . . . . . ......... :
ii iiiiii!!!iiiiiiiiiiii!i!!i!iii!!i!iiii!!!iiiii!iiii!iii iiiiiiiiiii!iiiii iiiiiii iiiiiii!iiiiii!iiiiii!!iiiii!ii!ii!!iiiiiiiiiiiii!!iiiiii!i!ii!ii!i!ii!iiiii!!i 1 7 8 14 15 21 I 7 8 14 15 21
Figure 3. Effects of metric (a) and duration (b) on musical stability.
average ratings. However, additional analysis revealed a significant interaction between tonal weights and the extent of musical expertise, t = 3.22, p < .01, suggesting that tonal weights contributed differently for musicians and nonmusicians.
To analyze the Tonal Weights X Musical Expertise in- teraction further, multiple regression analyses were per- formed separately for each group of participants (Table 3). The semipartial correlation coefficients indicated that the tonal weights made a greater direct contribution to stability ratings for the musicians than for the nonmusieians. By contrast, the duration weights made a greater direct contri- bution for the nonmusicians than for the musicians. For both groups, the metric weights and the melodic interval sizes made direct contributions of nearly equal importance, and the changes in melodic contour never significantly contrib- uted to the musical stability ratings.
Discussion
This experirnent demonstrates that melodies with highly similar superficial structures (i.e., the same rhythm and same melodic contour) and a long set of identical pitches in the same sequential order may be perceived in different ways. The pitch structure'of T1 and T2 (29 tone melodies)
differed on five tones. In spite of this, the perceptual dif- ferences between these melodies were important and very specific. As previously shown, the perceived musical sta- bility of the T1 and T2 melodies was significantly correlated with the tonal hierarchy of different keys (T1 to A minor key and T2 to G major key): The greater' the tone's struc-
Table 3 Summary of Multiple Regression Analyses Predicting the Average Ratings by a Combination of the Five Factors in Experiment I
Participants and factor sr t p
Musicians" Tonal .65 8.75 <.001 Duration .19 2.51 <.001 Metric .15 2.01 <.02 Interval size .14 1.95 <.05 Melodic contour .07 <1 <.06
Nonmusieians b Tonal .48 6.28 <.001 Duration .37 4.81 <.001 Metric .15 1.98 <.001 Interval size .19 2.48 <.06 Melodic contour .00 < 1 <.02
aR = .72; F(5, 86) = 18.64. b R = .69; F(5, 86) = 16.13.
816 BIGAND
tural importance in the key, the higher the perceived musical stability. This provides some evidence that changing only a few notes in a melody can influence listeners; they infer different keys, maintain a given key interpretation over a relatively long time span, and then attribute different sta- bility to the tones of the melody. Such key contexts effects led the participants to perceive physically identical acoustic events as being very different auditory events.
In addition, this experiment demonstrates that perceived stability is not entirely determined by the tonal structures of the melody: Changing the rhythm is sufficient to provoke significant changes in the perceived stability profiles. The primary tendency appears to be that tones are perceived as being more stable when they are of long duration or when they fall on a strong metric beat. Consistent findings were reported by Laden (1994). These rhythmic effects may be understood further in light of the overall lack of interaction between pitch and rhythmic structure. Indeed, we assumed that an increase in duration or a change in metric position would have a different effect on musical stability depending on the location of the notes inside the tonal hierarchy. However, among the 23 stop tones tested, the only evidence for such an interaction was observed among the musicians on the last tone of the melodies. This result differed from the one pointed out by Bigand (1993), who observed an overall significant interaction between pitch and rhythm within the musicians. The only difference between the present exper- iment and that conducted by Bigand is that the change in tonal structure was achieved here without changing the pitches and the melodic intervals of the T1 and T2 melodies. That the present experiment failed to replicate the interac- tion observed by Bigand suggests that tonal structure and rhythm do not necessarily interact when all other features (i.e., melodic contour, interval sizes, pitches) are kept constant.
Finally, the present experiment provided evidence that a linear combination of five predictors accounted for a sig- nificant part of the variance in the stability ratings recorded throughout the entire experimental situations. Except for the melodic contour weight, all predictors (i.e., tonal, duration, metric, and interval size weights) made significant contri- butions to the participants' ratings. Some of them contrib- uted differently, according to their extent of musical exper- rise. The tonal weight was a more important contributor for the musicians than for the noumusicians. The opposite was observed for the duration weight. This interaction with musical expertise suggests that musicians may have based their responses primarily on the tonal hierarchy of the melody's underlying key, whereas the noumusicians were more influenced by the more superficial features of the melodies (tone duration).
In summary, the fwst experiment demonstrates that sta- bility arises from a convergence of melodic and temporal factors, the influences of which may be quantified and seem to vary depending on musical expertise. The purpose of Experiment 2 was to replicate the previous findings with more dynamic melodies.
Experiment 2
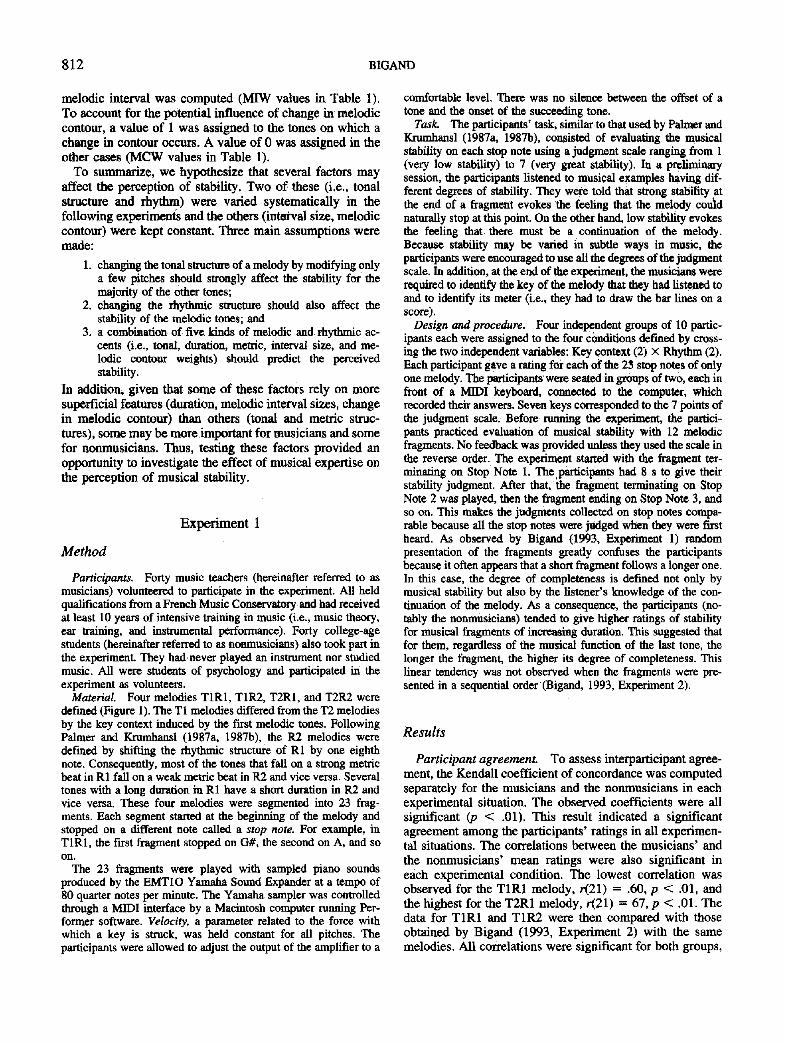
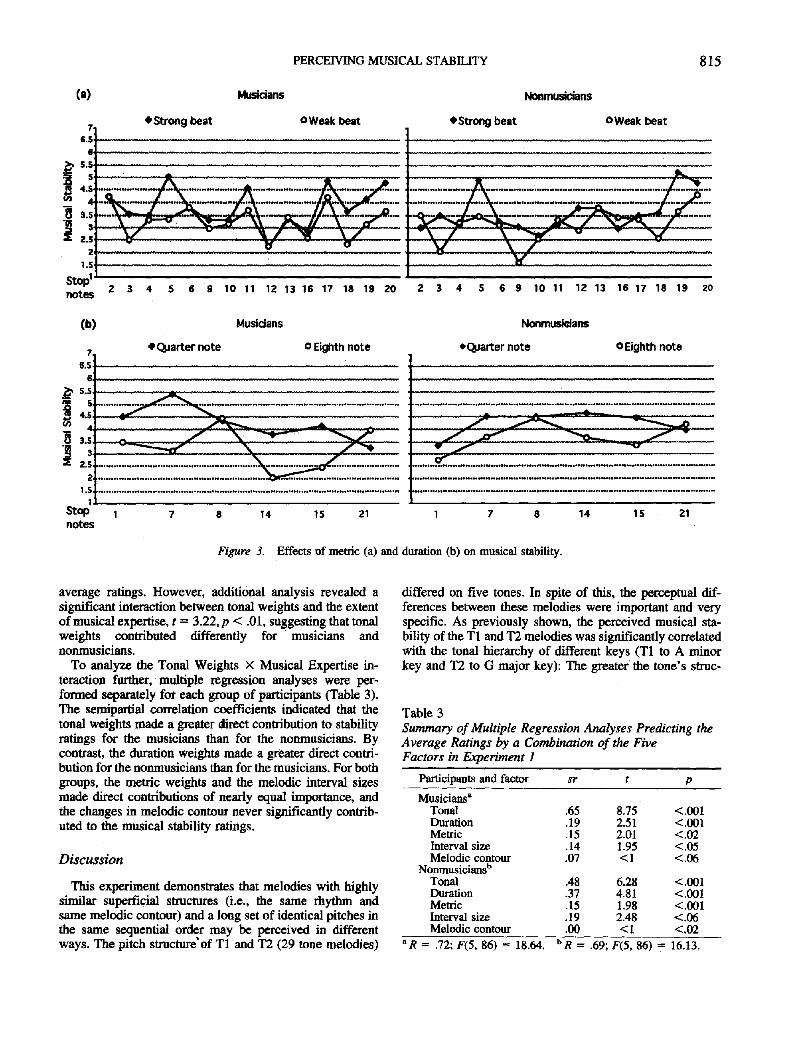
The original melody (Figure 4) for Experiment 2 was chosen from a music text book and is claimed to be in the style of Rossini (Gartenlaub, 1978). This melody is much more complex than that used in Experiment 1. First, the tonal pitch structure contains a descending circle of fifth progression in Measures 5 to 8 that strongly suggests the key of A (Measures 5 and 6) and then the key of G (Measures 7 and 8). The main key of F major is then clearly reaffirmed. I will refer to this tonal progression as F-A-G-F. Second, the rhythmic structure contains richer patterns of duration (16th note, dotted eighth, etc,) and complex metric patterns such as the syncopated tones in Measures 5, 7, and 9. Finally, there are numerous large pitch skips and changes in the melodic contour. Therefore, the melody contains a strong dynamic structure defined by a balanced complexity of the five musical features of interest. Consequently, we expected stronger effects from the change in the pitch and rhythmic structures, a greater number of interactions be- tween tonal and rhythmic structures, and greater differences between the two groups of listeners. In addition, we ex- pected a greater contribution from the duration and the melodic weights (i.e., interval sizes and changes in melodic contour) to the multiple regression analyses.
M e ~ o d
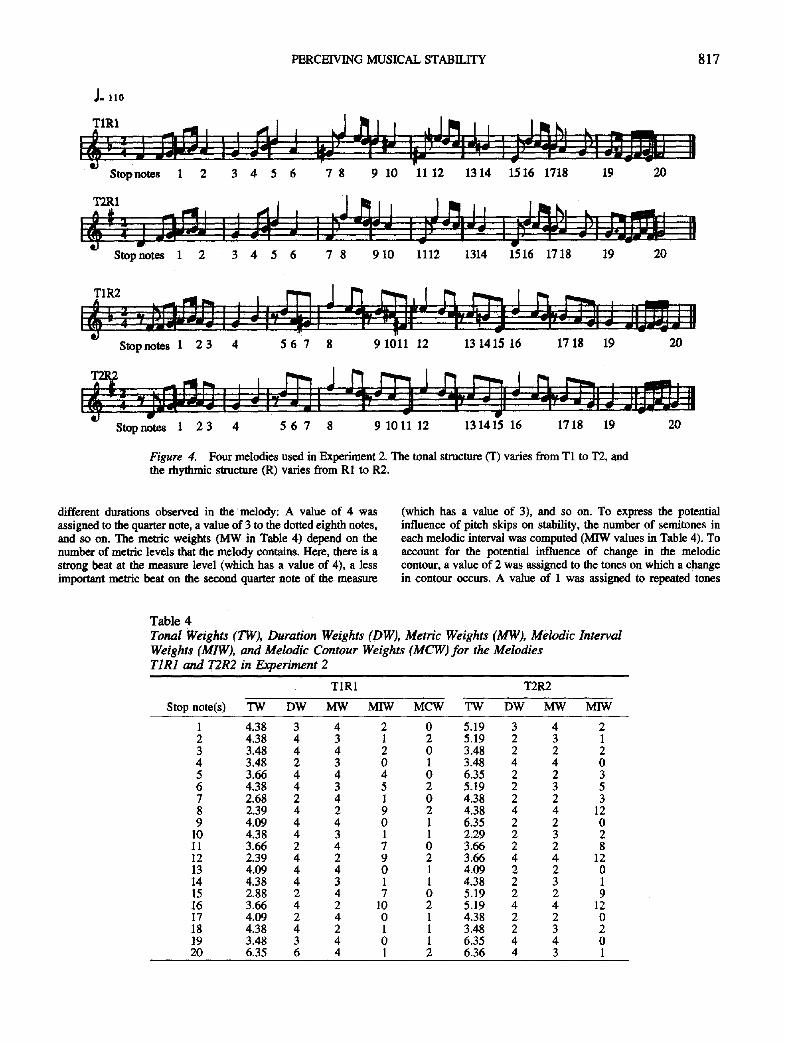
Material. Figure 4 displays the melodies used in the experi- ment. Because they were long, 19 stop notes were defined. The last stop note (20) was used only to verify the key interpretation of the musicians and the nonmusicians. Until Stop Note 19, the key was varied by shifting 8 notes one semitone up or down, 3 notes by two semitones, and 1 note by three semitones. The T2 melodies start in D major and modulate from Stop Note 10 to the end toward G major. I will refer to this tonal progression as D-G. TI and T2 melodies share identical melodic contours and rhythmic structures over the 19 stop notes and identical pitches on 12 of them (1, 2, 3, 4, 5, 6, 9, 13, 14, 16, 18, and 19). Several rhythmic changes were effected that were designed to alter musical stability without rendering the melodies as being too awkwardsounding. Moreover, these rhythmic changes allow us to define notes changing in duration but not in metric position (Stop Notes 2, 6, 10, and 14) and notes changing in metric position without changing in duration (Stop Notes 8, 12, 16). The four melodies (T1R1, TIR2, T2R1, and T2R2) were segmented into several fragments; each started from the beginning of the melody and stopped on a different stop note. The 20 fragments were produced in the same manner as in Experiment 1.
The predicted values for stability were defined as in Experiment 1. The tonal weights of the T1 melodies are those of the Krumhansl (1990) F major key profile to Stop Note 6 (TW in Table 4). The A major key profile values are used from Stop Notes 7 to 10, and the G major key profile values from Stop Notes 11 to 14. The F major key profile values are then used again. These values are referred to as the F-A-G-F key profile. In the T2 melodies, the D major key profile values are used from Stop Notes 1 to 10, and the G major key profile values from Stop Note 11 to the end of the melody. These values are labeled as the D-G key profile. The correlation between the tonal weights of T1 and T2 was positive but not significant, r(18) = .25.
The duration weights (DW in Table 4) are proportional to the
PERCEIVING MUSICAL STABILITY 817
J. 110
^TIR1 ..... r ll , , ,J I , I • - . ,, , ~ , ~ i , . , I . 1., . , , . , i
. . . . . 2,:'-', ~d Stop 1' . . . . te 2 3 4 5 6 7 8 9 10 11 12 1 3 1 4 1 5 1 6 1718 19 2 0
, ~ . . . . . , _., ~ i i , I ~ , , ' r i i t t , I l l - - i ~ , I . 1 0 ~ I . . . . .
i ' ~ ~ 1 . . . . . . . . . i l . . . . . . . . I --~ g , . - - . l . . , I ) ~ ' I
. . - , " ] , . . I . I "1"" - I -~'-"-'-,,~-~ ..
Stopnotes 1 2 3 4 5 6 7 8 910 1112 1314 1516 1718 19 20
Stopnotes 1 2 3 4 5 6 7 8 9 1 0 1 1 12 13 1415 16 17 18 19 20
t I r m a l ] 1 ] ~ ~ ! i ! I [ ! i l l n ~ - . . . . . . : - _ - - , _ , _ - . , , , ~ . . ~ ; , . ~- I |1 ] l ~ ' l m[ I I I . [ I I I v ' - - l ~ d I |1 I I v I I W l l v i ~ , l l l 8 1 I I I I l i p I ~ l I . i n , i - i l r i ~ i i i l , ~ ,11 | q l w i n mw~l i ~ i .
eJ w • Stopnotes 1 2 3 4 5 6 7 8 9 1011 12 131415 16 1718 19 20
Figure 4. Four melodies used in Experiment 2. The tonal structure (T) varies from T1 to T2, and the rhythmic slructure (R) varies from R1 to R2.
different durations observed in the'melody: A value of 4 was assigned to the quarter note, a value of 3 to the dotted eighth notes, and so on. The metric weights (MW in Table 4) depend on the number of metric levels that the melody contains. Here, there is a strong beat at the measure level (which has a value of 4), a less important metric beat on the second quarter note of the measure
(which has a value of 3), and so on. To express the potential influence of pitch skips on stability, the number of semitones in each melodic interval was computed (MIW values in Table 4). To account for the potential influence of change in the melodic contour, a value of 2 was assigned to the tones on which a change in contour occurs. A value of 1 was assigned to repeated tones
Table 4 Tonal Weights (TW), Duration Weights (DW), Metric Weights (MW), Melodic Interval Weights (MIW), and Melodic Contour Weights (MCW) for the Melodies TIR1 and T2R2 in Experiment 2
TIR1
Stop note(s) TW DW MW MIW MCW
T2R2
TW DW MW MIW
1 4.38 3 4 2 0 5.19 3 4 2 2 4.38 4 3 1 2 5.19 2 3 1 3 3.48 4 4 2 0 3.48 2 2 2 4 3.48 2 3 0 1 3.48 4 4 0 5 3.66 4 4 4 0 6.35 2 2 3 6 4.38 4 3 5 2 5.19 2 3 5 7 2.68 2 4 1 0 4.38 2 2 3 8 2.39 4 2 9 2 4.38 4 4 12 9 4.09 4 4 0 1 6.35 2 2 0
10 4.38 4 3 1 1 2.29 2 3 2 I 1 3.66 2 4 7 0 3.66 2 2 8 12 2.39 4 2 9 2 3.66 4 4 12 13 4.09 4 4 0 1 4.09 2 2 0 14 4.38 4 3 1 1 4.38 2 3 1 15 2.88 2 4 7 0 5.19 2 2 9 16 3.66 4 2 10 2 5.19 4 4 12 17 4.09 2 4 0 1 4.38 2 2 0 18 4.38 4 2 1 1 3.48 2 3 2 19 3.48 3 4 0 1 6.35 4 4 0 20 6.35 6 4 1 2 6.36 4 3 1
818 B I O A N D
(e.g., Stop Note 4) because repeated notes introduce only a weak change in the melodic contour. For the same reason, a value of 1 was assigned to the tones that immediately follow a repeated tone (e.g., Stop Note 10). A value of 0 was assigned in the other cases (MCW values in Table 4).
Participants, procedure, and design. Experiment 2 was con- ducted with the 40 young music teachers and the 40 undergraduate students in psychology who participated in Experiment 1. The participants' task, the procedure, and the design were identical to those of Experiment 1.
Results
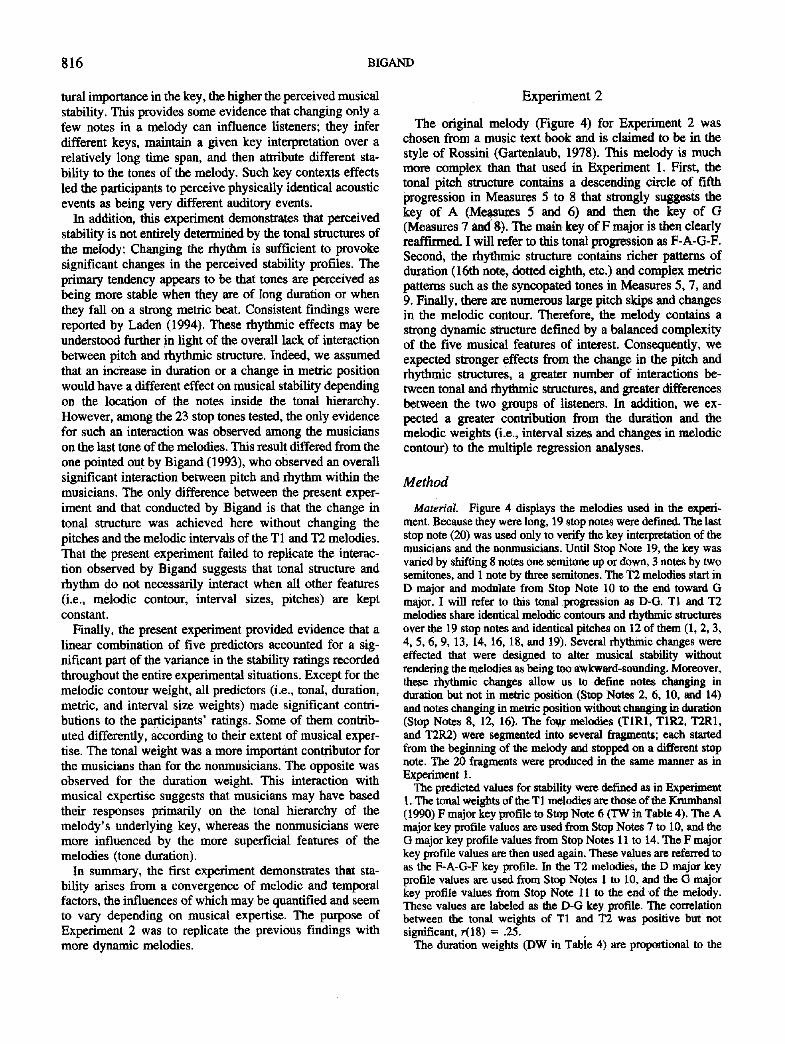
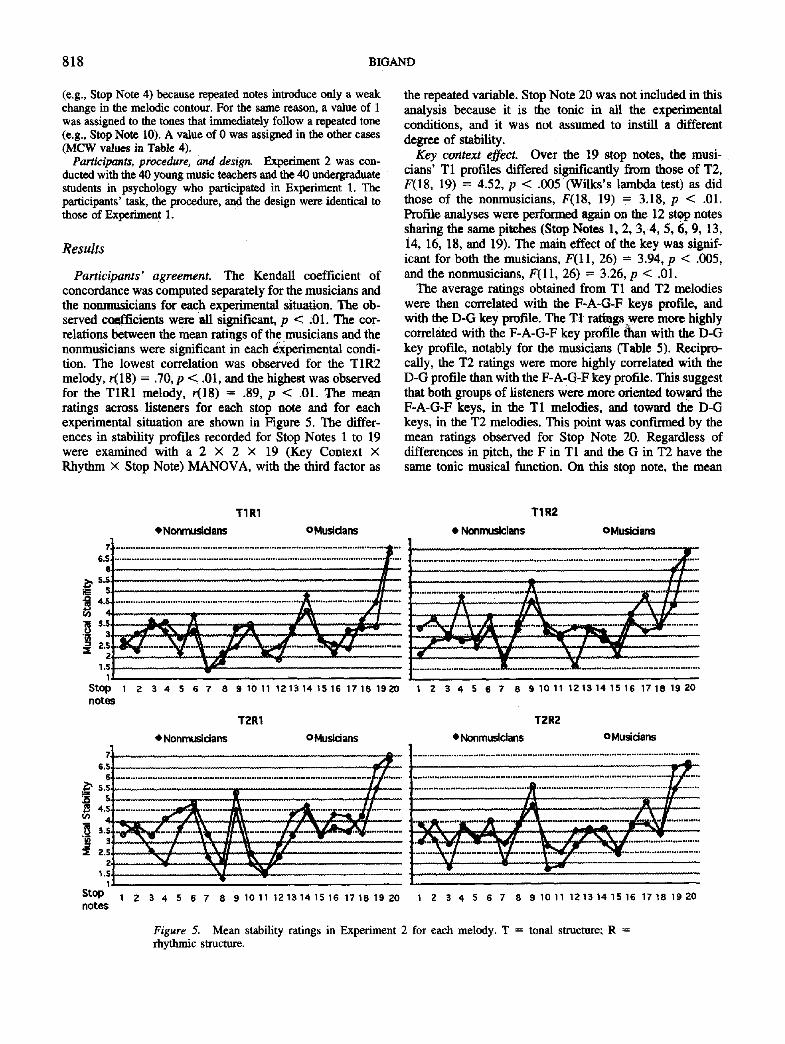
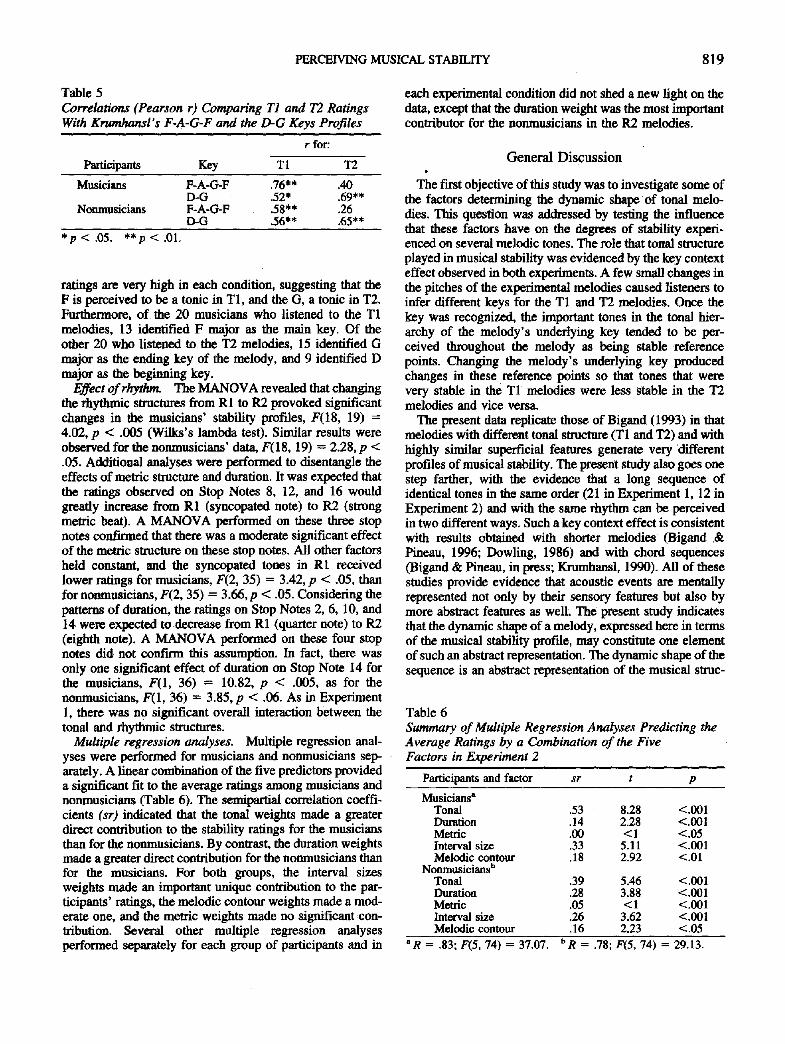
Participants' agreement. The Kendall coefficient of concordance was computed separately for the musicians and the nonmusicians for each experimental situation. The ob- served co¢Ificients were all significant, p < ,01. The cor- relations between the mean ratings of the musicians and the nonmusicians were significant in each e)(perimental condi- tion. The lowest correlation was observed for the TIR2 melody, r(18) = .70, p < .01, and the highest was observed for the TIRI melody, r(18) ---- .89, p < .01. The mean ratings across listeners for each stop note and for each experimental situation are shown in Figure 5. The differ- enccs in stability profiles recorded for Stop Notes 1 to 19 were examined with a 2 × 2 × 19 (Key Context × Rhythm × Stop Note) MANOVA, with the third factor as
the repeated variable. Stop Note 20 was not included in this analysis because it is the tonic in all the experimental conditions, and it was not assumed to instill a different d e g r e e of stability.
Key context effect. Over the 19 stop notes, the musi- cians' T l profiles differed significantly from those of T2, ]7(18, 19) = 4.52, p < .005 (Wilks's lambda test) as did those of the nonmusicians, F(18, 19) = 3.18, p < .01. Profde analyses were performed again on the 12 stop notes sharing the same pi~ches (Stop Notes l, 2, 3, 4, 5, 6, 9, 13, 14, 16, 18, and 19). The main effect of the key was signif- icant for both the musicians, F(11, 26) = 3.94, p < .005, and the nonmusicians, F ( l l , 26) = 3.26, p < .01.
The average ratings obtained from T1 and T2 melodies were then correlated with the F-A-G-F keys profile, and with the D-G key profile. The TI ratings:were more highly correlated with the F-A-G-F key profile &an with the D-G key profile, notably for the musicians (Table 5). Recipro- cally, the T2 ratings were more highly correlated with the D-G profile than with thc F-A-G-F key profile. This suggest that both groups of listeners were more oriented toward the F-A-G-F keys, in the T1 melodies, and toward the D-G keys, in the T2 melodies. This point was confn-rned by the mean ratings observed for Stop Note 20. Regardless of differences in pitch, the F in T1 and the G in T2 have the same tonic musical function. On this stop note, the mean
T1R1
eNonmus idans OMusidans
" ' : : : : : : : " ; : : ; ..................... ......... ........... ::;4 . . . . . . . . . 7" 4: --
1 . S . ~
1 '
i--
T I R 2
• Nonmusidans OMusidans
:::::::::::::::::::::::::::::::::::::::::::: ....... ::::::::::::::::::::::::::::::::::::::::::::::::::
'~4t" " , V \ I ~ / .. : : . : . . .L . . . . . . . . . . . . . ,_ , IL ._ . . . . . . . , . . . : ._~: ........ . . . , : . . . , , . .L: . . . . . . : : ........
Stop 1 2 3 4 5 6 7 8 9 1 0 1 1 1 2 1 3 1 4 1 5 1 6 1 7 1 8 1 9 2 0 1 2 3 4 5 6 7 8 9 1 0 1 1 1 2 1 3 1 4 1 5 1 6 1 7 1 8 1 9 2 0 notes
T2R1 T2R2
• Nonmusidans o Musidans • Nonmusicians OMusidans
7 t . . . . . . . . . . , ~ - . . . . . . . . . . . . . . . . . . . . . . . . . . . . . . . . . . . . . . . . . . . . . . . . . . . . . . . . . . . . . . . . . . . . . . . . . . . . . . . . . . . . . . . . . . . . . . . . . . . . . . . . . . . . . . . . . . . . .
Stop 1 2 3 4 5 6 7 8 9 1011 1 2 1 3 1 4 1 5 1 6 1 7 1 8 1 9 2 0 i 2 3 4 5 6 7 8 9 1 0 1 1 1 2 1 3 1 4 1 5 1 6 1 7 1 8 1 9 2 0 notes
Figure 5. Mean stability ratings in Experiment 2 for each melody. T = tonal structure; R = rhythmic structure.
PERCEIVING MUSICAL STABILITY 819
Table 5 Correlations (Pearson r) Comparing T1 and T2 Ratings With Krumhansl's F-A-G-F and the D-G Keys Profiles
r for:
Participants Key T 1 T2
Musicians F-A-G-F .76** .40 D-G .52* .69**
Nonmusieians F-A-G-F .58** .26 D-G .56** .65**
*p< .05 . **p<.01.
ratings are very high in each condition, suggesting that the F is perceived to be a tonic in T1, and the G, a tonic in "1"2. Furthermore, o f the 20 musicians who listened to the T1 melodies, 13 identified F major as the main key. Of the other 20 who listened to the T2 melodies, 15 identified G major as the ending key of the melody, and 9 identified D major as the beginning key.
Effect ofrhythnt The MANOVA revealed that changing the rhythmic structures from R1 to R2 provoked significant changes in the musicians' stability profiles, F(18, 19) = 4.02, p < .005 (Wilks's lambda test). Similar results were observed for the nonmusicians' data, F(18, 19) = 2.28, p < .05. Additional analyses were performed to disentangle the effects of metric structure and duration. It was expected that the ratings observed on Stop Notes 8, 12, and 16 would greatly increase from R1 (syncopated note) to R2 (strong metric beat). A MANOVA performed on these three stop notes confirmed that there was a moderate significant effect of the metric structure on these stop notes. All other factors held constant, and the syncopated tones in RI: received lower ratings for musicians, F(2, 35) = 3.42, p < .05, than for nonmusicians, F(2, 35) = 3.66, p < .05. Considering the patterns of duration, the ratings on Stop Notes 2, 6, 10, and 14 were expected to decrease from R1 (quarter note) to R2 (eighth note). A MANOVA performed on these four stop notes did not confirm this assumption. In fact, there was only one significant effect of duration on Stop Note 14 for the musicians, F(1, 36) = 10.82, p < .005, as for the nonmusicians, F(1, 36) = 3.85, p < .06. As in Experiment 1, there was no significant overall interaction between the tonal and rhythmic structures.
Multiple regression analyses. Multiple regression anal- yses were performed for musicians and nonmusicians sep- arately. A linear combination of the five predictors provided a significant fit to the average ratings among musicians and noomnsicians (Table 6). The semipartial correlation coeffi- cients (sr) indicated that the tonal weights made a greater direct contribution to the stability ratings for the musicians than for the nonmnsicians. By contrast, the duration weights made a greater direct contribution for the nonmusicians than for the musicians. For both groups, the interval sizes weights made an important unique contribution to the par- ticipants' ratings, the melodic contour weights made a mod- erate one, and the metric weights made no significant con- tribution. Several other multiple regression analyses performed separately for each group of participants and in
each experimental condition did not shed a new light on the data, except that the duration weight was the most important contributor for the nonmnsicians in the R2 melodies.
General Discussion
The first objective of this study was to investigate some of the factors determining the dynamic shape of tonal melo- dies. This question was addressed by testing the influence that these factors have on the degrees of stability experi- enced on several melodic tones. The role that tonal structure played in musical stability was evidenced by the key context effect observed in both experiments. A few small changes in the pitches of the experimental melodies caused listeners to infer different keys for the T1 and T2 melodies. Once the key was recognized, the important tones in the tonal hier- archy of the melody's underlying key tended to be per- ceived throughout the melody as being stable reference points. Changing the melody's underlying key produced changes in these reference points so that tones that were very stable in the TI melodies were less stable in the T2 melodies and vice versa.
The present data replicate those of Bigand (1993) in that melodies with different tonal structure (T1 and T2) and with highly similar superficial features generate very different profiles of musical stability. The present study also goes one step farther, with the evidence that a long sequence of identical tones in the same order (21 in Experiment 1, 12 in Experiment 2) and with the same rhythm can be perceived in two different ways. Such a key context effect is consistent with results obtained with shorter melodies (Bigand & Pineau, 1996; Dowling, 1986) and with chord sequences (Bigand & Pineau, in press; Krumhansl, 1990). All of these studies provide evidence that acoustic events are mentally represented not only by their sensory features but also by more abstract features as well. The present study indicates that the dynamic shape of a melody, expressed here in terms of the musical stability profile, may constitute one element of such an abstract representation. The dynamic shape of the sequence is an abstract representation of the musical strut-
Table 6 Summary of Multiple Regression Analyses Predicting the Average Ratings by a Combination of the Five Factors in Experiment 2
Participants and factor sr t p
Musicians a Tonal .53 8.28 <.001 Duration .14 2.28 <.001 Metric .00 < 1 <.05 Interval size .33 5.11 <.001 Melodic contour .18 2.92 <.01
Nonmusicians b Tonal .39 5.46 <.001 Duration .28 3.88 <.001 Metric .05 <1 <.001 Interval size .26 3.62 <.001 Melodic contour .16 2.23 <.05
aR = .83; F(5, 74) = 37.07. bR = .78; F(5, 74) = 29.13.
820 BIGAND
ture that may play an important role in several complex listening situations, such as perceiving a link between a musical theme and its variation (Bigand, 1990).
Musical stability of tones is not determined entirely by the tonal hierarchy of the underlying key. In the two present experiments, changes in the rhythmic structures alone were sufficient to alter significantly the musical stability profiles. All other parameters being equal, the stability of melodic tones was dependent on the rhythmic structure in which they appeared. As a weak tendency, stability increased for tones of longer duration and for tones falling on a strong metric beat (see also Laden, 1994). Therefore, the present findings provide evidence that pitch and rhythm acted in combination to determine the stability of tones in a given melodic context: The stability of a tone is generally deter- mined by its stability in the tonal hierarchy plus its stability in the rhythmic structure. Recent findings obtained with the same set of melodies (Bigand & Pineau, 1996) indicated that these effects of pitch and rhythm are not limited to the present experimental task. In Bigand's experiment, the par- ticipants were asked to evaluate the percentage of pitches that had been changed from a standard to a comparison melody. In some pairs, the R1 melodies were the standard melodies, and the R2s were the comparison melodies. In other pairs, the R2 melodies were the standard ones, and the R1 melodies were the comparison ones. It appeared that a change in rhythm alone was enough to affect the perception of the pitch structure. Indeed, even participants with a great deal of musical expertise judged, on average, that 41% of the pitches were modified when the rhythmic structure of the comparison melody was shifted backward, as displayed in Figure 1. Similar findings were observed with the melo- dies displayed in Figure 4 in which changes in rhythm from R1 to R2 melodies caused the musicians to estimate that 24% of the pitches, in average, had been changed in the comparison melody. This suggests that Changing the rhythm from R1 to R2 provoked changes in the musical stability profiles that, in turn, rendered the overall pitch structure difficult to recognize. Consequently, the listeners were in- clined to believe that several pitches had been modified in the comparison melodies, whereas only the rhythm had been altered. Such findings are consistent with others re- ported by Boltz (1991a); Boltz and Jones (1986); Jones and Boltz (1989); Jones and Ralston (1991); and Jones, Sum- merell, and Marshbum (1987). All these studies suggest that tonal and rhythmic structures are integrated in a unified dimension that defines the dynamic shape of the musical sequences. Changing one of the structures modifies this dynamic shape and, consequently affects the perception of the melody as a whole.
The second goal of this study was to test a model pre- dicting the stability of tones experienced in a given melodic context. A similar model, calculating musical tension or stability, already exists for harmonic structures (Bigand et al., 1996; Lerdahl, 1988, 1996). The rationale for the present model is derived primarily from Jones's (1987) theory of dynamic attending. According to Jones, pitch and rhythmic structures displayed several accents with the psychological function to capture listeners' attention and to orient the
attentional trajectories. In the present study, accented tones were assumed to act as stable melodic reference points because they attract the listeners' attention. Inversely, non- accented tones were assumed to act as unstable melodic tones because they fail to capture attention. The model defined in the present study predicts musical stability in considering the five kinds of accents distinguished by Jones (1987) and by Jones and Boltz (1989). The strength of accents created by the tonal structure (i.e., tonal weights) was determined according to Krumhansl's model of tonal perception in which the higher the stability of a tone in the tonal hierarchy of the underlying key, the stronger the tonal accent. The strength of accents created by the duration of tones (duration weights) was proportional to the different durations observed in the melody. The strength of accents created by the metric structure (metric weights) was depen- dent on the number of metric levels contained in the mel- ody. A tone falling on a strong metric beat at all levels of the metric structure was assumed to be more accented than a tone falling on a strong metric beat at only one or two levels of the metric structure (see Lerdahl & Jackendoff, 1983). In addition, two other kinds of melodic accents were quantified in the present model. Tones on which a change in melodic contour occurs and tones that precede pitch skips were assumed to receive melodic contour accents (melodic weights), and pitch interval accents (pitch interval weights), respectively.
In both experiments, a linear combination of these five kinds of melodic and temporal accents provided a good fit to the stability ratings for both musicians and nonmusicians in that, as a main tendency, tones of great tonal weight and of long duration, falling on a strong metrical beat (Experi- ment 1) and on which a melodic contour change occurred (Experiment 2), tended to be perceived as being more stable than tones with weaker accents. This suggests that tones on which several accents coincided tended to act as stable cognitive reference points in a given melodic context (see Laden, 1994, for consistent results). The main effect of tonal structure and rhythm on stability observed in both experi- ments can thus be explained by the fact that changing either structure modifies the manner in which these melodic and temporal accents are coupled in time, which in turn affects the overall dynamic shape of the melodies.
Some of these accents may have more or less important influences on stability; depending on the melodies consid- ered. Because the present experiments were performed with tonal melodies, it is not surprising to observe that tonal weights were an important predictor in both experiments. A different result would probably arise with atonal melodies or with more ambiguous tonal melodies. In a similar vein, that the melodic contour weights Contributed significantly in Experiment 2 but not in Experiment 1 may be explained by the fact that the melodies used in Experiment 1 displayed only weak changes in melodic contour. The present model offers no way to quantify how important is the contribution of each of these accents in a given melody. However, it clearly establishes that several kinds of melodic and rhyth- mic features have to be incorporated into models of tonal perception to account for the stability perceived in a given
PERCEIVING MUSICAL STABILITY 821
melodic sequence. In terms of Bharucha's connectionist model (1987), this integration may be instantiated by mod- nlating the amount of activation propagating to tone units by several other parameters related to tone duration, metric location of the tones, pitch interval, and melodic contour.
However, the model defined in the present study could be fine-tuned by greater refinements. One weakness of the present model is to quantify the tonal structure by consid- ering only the scale degree of the tone in the melodic underlying key. In spite of the fact that such a simple quantification captured a significant par t of the perceived musical stability, one may object that tonal smacture is too complex to be characterized in such a unidimensional fash- ion. Indeed, the stability of a tone in a given melodic context not only depends on the tonal hierarchy of the underlying key but also on its chordal position in the implied harmonic progression. The present model does not express the poten- tial influence of the implied harmonic progression on mu- sical stability. Therefore, quantifying the tonal stability of the melodic tones in reference to both the tonal hierarchy and the tonal function of the tones in the implied harmonic progression would probably be a more sophisticated way to formalize the influence of the tonal structure on musical stability. Lerdahl's tonal pitch space theory (Lerdahl, 1988, 1996) offers one possible framework for such a quantification.
The final goal of this study was to investigate the effect of musical expertise on perceived musical stability. One of the most striking findings concerns the very slight differences in musical stability profiles for musicians and nonmusicians in all experimental situations and in both experiments. This result is consistent with other results reported with melodies (Bharucha, 1984; Bigand, 1993; Bigand & Pineau, 1996; Boltz, 1989a; Laden, 1994; Smith & Cuddy, 1989) and with chord sequences (Bigand, 1993; Bigand et al., 1996; Bigand & Pineau, in press). This suggests that the explicit learning of music may not be necessary to perceive subtle structures in tonal musical sequences.
Above and beyond similar patterns of results among musicians and nonmusicians, the present study revealed some differences between both groups of listeners. In both experiments, weak interactions were found in multiple re- gression analyses between the tonal and the duration weights and musical expertise. The former variable contrib- uted more to the musicians' ratings; the latter contributed more to the nonmusicians' ratings. Similar interactions were also observed by Bigand et al. (1996) with short chord sequences in which the musicians' ratings were determined primarily by the tonal function of the chord, whereas those of the nonmusicians were influenced mostly by more su- perficial features (notably pitch interval). Musicians and nonmusicians may roughly be sensitive to the same kinds of musical features, but the former tended to emphasize their knowledge of tonal hierarchy.
References
Bharucha, J. J. (1984). Anchoring effects in music: The resolution of dissonance. Cognitive Psychology, 16, 485-518.
Bharucha, J. J. (1987). Music cognition and perceptual facilitation: A connectionist framework. Music Perception, 5, 1-30.
Bharucha, J. J., & Stoeckig, K. (1986). Reaction time and musical expectancy: Priming of chords. Journal of Experimental Psy- chology: Human Perception and Performance, 12, 403-410.
Bharucha, J. J., & Stoeckig, K. (1987). Priming of chords: Spread- ing activation or overlapping frequency spectra? Perception & Psychophysics, 41, 519-524.
Bigand, E. (1990). Abstraction of two forms of underlying struc- tttre in a tonal melody. Psychology of Music, 18, 45-60.
Bigand, E. (1993). The influence of implicit harmony, rhythm and musical training on the abstraction of "tension-relaxation sche- mas" in tonal musical phrases, Contemporary Music Review, 9, 123-137.
Bigand, E., Parneutt, R., & Lerdahl, F. (1996). Perception of musical tension in short chord sequences: The influence of harmonic function, sensory dissonance, horizontal motion, and musical training. Perception & Psychophysics, 58, 125-141.
Bigand, E., & Pineau, M. (1996). Context effects on melody recognition: A dynamic interpretation. Current Psychology of Cognition, 15, 121-134.
Bigand, E., & Pineau, M. (in press). Context effects on musical expectancy. Perception & Psychophysics.
Boltz, M. G. (1989a). Perceiving the end: Effects of tonal relation- ships on melodic completion. Journal of Experimental Psychol- ogy: Human Perception and Performance, 15, 749-761.
Boltz, M.G. (1989b). Rhythm and "good endings": Effects of temporal structure on tonality judgments. Perception & Psycho- physics, 46, 9-17:
Boltz, M, G. (1991a). Some structural determinants of melody recall. Memory & Cognition, 19, 239-251.
Boltz, M. G: (1991b). Time estimation and attentional perspective. Perception & Psychophysics, 49,422-433.
Boltz, M.G. (1993a). The generation of temporal and melodic expectancies during musical listening. Perception & Psycho- physics, 53, 585-600.
Boltz, M. G. (1993b). Time estimation and expectancies. Memory and Cognition, 21, 853--863.
Boltz, M. G., & Jones, M.R. (1986). Does rule recursion make melodies easier to reproduce? If not, what does? Cognitive Psychology, 18, 389-431.
Buffer, D., & Brown, H. (1984). Tonal structure versus function: Studies of the recognition of harmonic motion. Music Percep- tion, 2, 6-24.
Carlsen, Ji C. (1981). Some factors which influence melodic ex- pectancy. Psychomusicology, 1, 12-29.
Deutsch, D. (1980). The processing of structured and unstructured tonal sequences. Perception & Psychophysics, 28, 381-389.
Dowling, J.W. (1986). Context effects on melody recognition: Scale-step versus interval representation. Music Perception, 3, 281-296.
Franc~s, R. (1958). La perception de la musique. Pads: Vrin. The perception of music, by J. W. Dowling, Trans., 1988, Hillsdale, NJ: Erlbaum.
Gartenlaub, O. (1978). 14 lefons de solfdge it chanter [Fourteen solfeggio lessons for singing]. Pads: Edition du Rideau Rouge.
Halpern, A. (1984). Perception of structure in novel music. Mem- ory & Cognition, 12, 163-170.
Jones, M. R. (1987). Dynamic pattern structure in music: Recent theory and research. Perception & Psychophysics, 41, 621-634.
Jones, M.R., & Boltz, M.G. (1989). Dynamic attending and responses to time. Psychological Review, 96, 459-491.
Jones, M. R., Boltz, M., & Klein, J. M. (1993). Expected endings and judged duration. Memory and Cognition, 21, 646-665.
822 BIGAND
Jones, M. R., Boltz, M. G., & Kidd, G. (1982). Controlled attend- ing as a function of melodic and temporal context. Perception & Psychophysics, 32, 211-218. ~
Jones, M. R., & Ralston, J.T. (1991). Some influence of accent structure on melody recognition. Memory & Cognition, 19, 8-20.
Jones, M. R., Summel~ll, L., & Marshburn, E. (1987). Recogniz- ing melodies: A dynamic interpretation. Quarterly Journal of Experimental Psychology, 39A, 89-121.
Knnnhausl, C. L. (1990). Cognitive foundations of musical pitch. New York: Oxford University Press.
Krumhansl, C. L., & Kessler, E.J. (1982). Tracing the dynamic changes in perceived tonal organisation in a spaeial representa- tion of musical keys. Psychological Review, 89, 334-368.
Laden, B. (1994). Melodic anchoring and tone duration. Music Perception, 12, 199-212.
Lerdahl, F. (1988). Tonal pitch space. Music Perception, 5, 315-345.
Lerdahl, F. (1996). Calculating tonal tension. Music Perception, 3, 319-363.
Lerdahl, F., & Jaekendoff, R. (1983). A generative theory of tonal music. Cambridge, MA: M1T Press.
Meyer, L.B. (1956). Emotion and meaning in music. Chicago: University of Chicago Press.
Meyer, L. B. (1973). Explaining music: Essays and explorations. Chicago: University of Chicago Press.
Monahan, C. B., & Carterette, E. C. (1985). Pitch and duration as determinants of musical space. Music Perception, 3, 1-32.
Monahan, C. B., Kendall, R. A., & Carterette, E. C. (1987). The effect of melodic and temporal contour on recognition memory for pitch change. Perception & Psychophysics, 41, 576-600.
Palmer, C., & Krumhausl, C.L. (1987a). Independent temporal and pitch structures in determination of musical phrases. Journal of Experimental Psychology: Human Perception & Perfor- mance, 13, 116-126.
Palmer, C., & Krumhansl, C.L. (1987b). Pitch and temporal contributions to musical phrase perception: Effects of harmony, performance timing, and familiarity. Perception & Psychophys- ics, 41, 505-518.
Peretz, I. (1990). Processing of local and global musical informa- tion in unilateral brain-damaged patients. Brain, 113, 1185-1205.
Peretz, I., & Kolinsky, R. (1993). Boundaries of separability between melody and rhythm in music discrimination: A neuro- psychological perspective. Quarterly Journal of Experimental Psychology: Human Experimental Psychology, 46A, 301-327.
Peretz, I., & Morals, J. (1989). Music and modularity. Contempo- rary Music Review, 4, 279-295.
Schenker, H. (1935). Der Freie Satz [Free composition]. Transl. E. Oster (1979) Free Composition, New York: Longman.
Schmuckler, M. A. (1989). Expectation in music: Investigation of melodic and harmonic processes. Music Perception, 7, 109-150.
Schmuckler, M. A. (1990). The performance of global expecta- tions. Psychomusicology, 9, 122-147.
Schmuckler, M. A., & Boltz, M. G. (1994). Harmonic and rhyth- mic influences on musical expectancy. Perception & Psycho- physics, 56, 313-325.
Serafine, M.-L., Glassman, N., & Overbeeke, C. (1989). The Cognitive Reality of Hierarchic Structure in Music. Music Per- ception, 6, 397-430.
Smith, K., & Cuddy, L. (1989). Effects of metric and harmonic rhythm on the detection of pitch alteration in melodic sequences. Journal of Experimental Psychology: Human Perception and Performance, 15, 457-471.
Unyk, A. M., & Carlsen, J. C. (1987). The influence of expectancy on melodic perception. Psychomusicology, 7, 3-23.
Received December 10, 1993 Revision received December 20, 1995
Accepted February 16, 1996 •