Embed Size (px)
Citation preview

© Petersen and Kumar
Perceived Risk, Product Returns, and Optimal Resource Allocation:
Evidence from a Field Experiment
J. Andrew PetersenAssistant Professor of Marketing and Assistant Director of the Center for Integrated Marketing and Sales (CIMS)
– Kenan-Flagler Business School, University of North Carolina at Chapel Hill
V. Kumar Regents’ Professor, Chang Jiang Scholar, Richard and Susan Lenny Distinguished Chair & Professor of
Marketing, Executive Director, Center for Excellence in Brand & Customer Management (CEBCM), and Director of the Ph.D. Program in Marketing – J. Mack Robinson College of Business, Georgia State University, Atlanta GA
Applying Field Experimentation to Behavior ResearchMarch 14 – 15, 2014
Field Experiments Marketing Conference

© Petersen and Kumar
Economics of Product Returns
2
Current Cost
$100 Billion in Reverse Logistics
Reduces profit by around 3.8% per retailer
About 6% of all products are returned(Some categories with rates > 25%)

© Petersen and Kumar
Why Return Products?
3
*Source: Lawton (2008)
1• “No Trouble Found” (68%)
2• “Buyer’s Remorse” (27%)
3• “Defective” (5%)
A study found that 95% of all product returns occurred for two main reasons:

© Petersen and Kumar
Who Returns Products?
Firm% of Customers Who Returned a Product
or Filed a Complaint
High-tech B2B Firm 64%
Catalog Apparel Retailer 70%
General Merchandise Retailer 75%
Financial Services Firm 77%
4

© Petersen and Kumar
What are Firms Doing?
5
Product Return Policy Decisions
Firms often make product return policies more strict through changes in return timing (e.g. 30 day limit), restocking fees (e.g. 15%), etc.
Firms are spending fewer marketing resources on customers who return products (Petersen and Kumar 2009) or not even considering product returns at all
Resource Allocation Decisions

© Petersen and Kumar
What are Firms Doing? (cont.)
6
Resource Allocation Strategy
No Formal
Allocation
Model
Based on
Rank-
order
Use an
ORA
Algorithm
Customer
Value
Measure
No Formal Measure 2 0 0 2 (3.5%)
RFM/PCV 11 12 0 23 (41%)
CLV w/o Product Returns 5 5 1 11 (20%)
CLV w/ Net Buying 10 7 1 18 (32%)
CLV w/ Product Returns 0 0 2 2 (3.5%)
28 (50%) 24 (43%) 4 (7%) 56
Results of a Survey of 56 Managers of Retail Firms

© Petersen and Kumar
How Do Customers React?
7
Do Product Return Policies and Product Return Behaviors Impact Customer Purchase Behaviors?
Used as a signal for purchase (Nasr-Bechwati and Siegal 2005)
Higher leniency = higher purchase rates (Wood 2001)
Free-based (versus fee-based) product returns generate more future purchases (Bower and Maxham 2012)
The more a customer returns (to a threshold), the more a customer purchases in the future (Petersen and Kumar 2009)

© Petersen and Kumar
Cost and Perceived Risk
8
The Role of Product Returns
Increases costs through reverse logistics and losses of revenues from purchases
Lowers perceived risks which positively influences future purchase behavior
© Petersen and Kumar
Key Research Questions
9
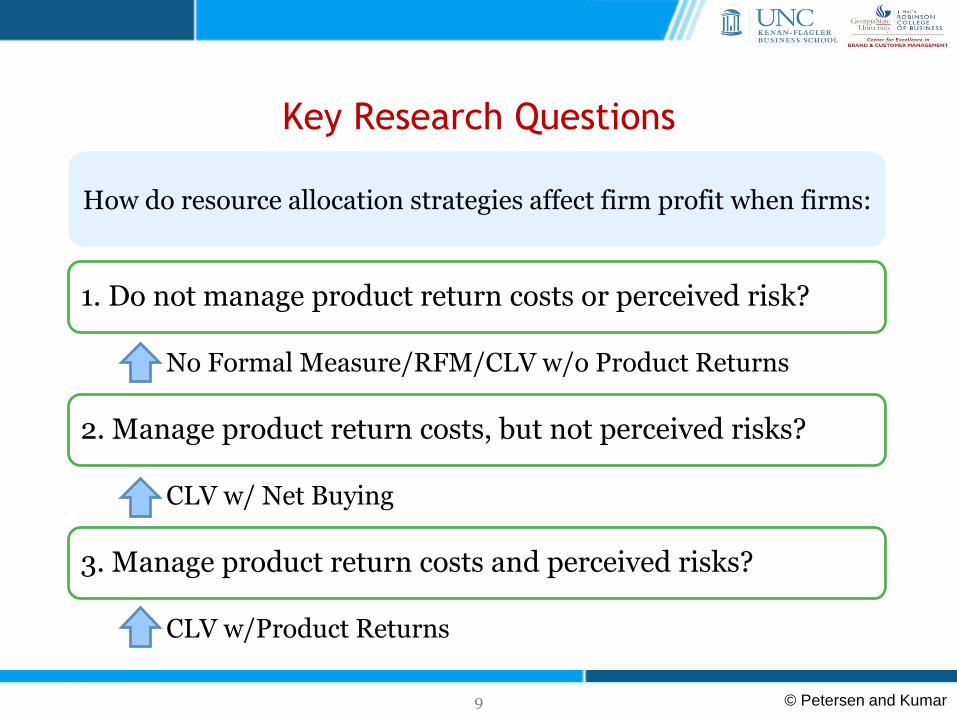
How do resource allocation strategies affect firm profit when firms:
1. Do not manage product return costs or perceived risk?
• No Formal Measure/RFM/CLV w/o Product Returns
2. Manage product return costs, but not perceived risks?
• CLV w/ Net Buying
3. Manage product return costs and perceived risks?
• CLV w/Product Returns

© Petersen and Kumar
Data
10
• B2C firm which sells footwear, apparel, and accessories through the Internet and mail order catalogs
Source
• A cohort of 935 customers who made their first purchase in Quarter 2 of 2003 is used for the model validation stage
Model Validation
• A random sample of 26,000 customers is used for the field experiment stage
Field Experiment
• Lenient return policy (100% money back with no time limit)Return Policy

© Petersen and Kumar
Measurement
11
1• No Formal Measure (Control Group)
2• Firm Strategy (RFM-based)
3• CLV w/o Product Returns (Benchmark Model 1)
4• CLV w/ Net Buying (Benchmark Model 2)
5• CLV w/ Product Returns (Proposed Model)
We use 5 different objective functions based on the types of strategies firm use for resource allocation:
We need to develop objective functionswhich can help firms optimally allocate resources

© Petersen and Kumar
Measurement (cont.)
12
T
tt
itittiti
r)(1
Marketing)sπ(PurchaseipRelationshPCLV
11,0, )(MODEL 3
MODEL 4
T
t
titi PCLV1
t
itit1,0,
r)(1
Marketing)asesπ(NetPurch)ipRelationsh(
MODEL 5
T
t
titi PCLV1
t
ititit1,0,
r)(1
Marketing)π(Returns)sπ(Purchase)ipRelationsh(
MODEL 1
No Formal Model
MODEL 2
Firm Strategy (RFM-based)
© Petersen and Kumar
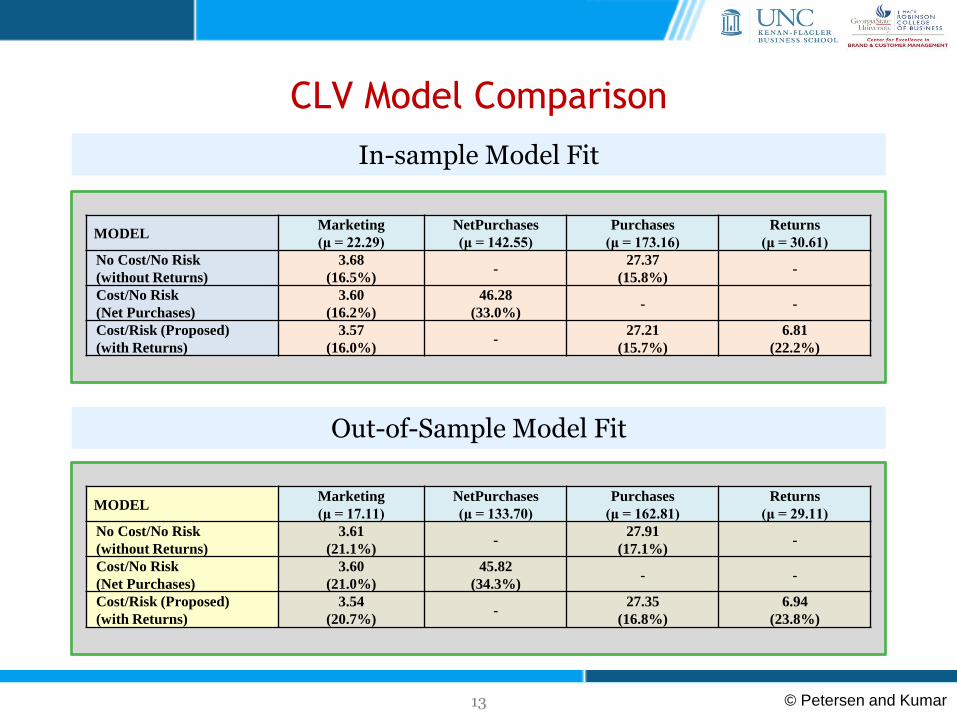
CLV Model Comparison
13
MODELMarketing
(μ = 22.29)
NetPurchases
(μ = 142.55)
Purchases
(μ = 173.16)
Returns
(μ = 30.61)
No Cost/No Risk
(without Returns)
3.68
(16.5%)-
27.37
(15.8%)-
Cost/No Risk
(Net Purchases)
3.60
(16.2%)
46.28
(33.0%)- -
Cost/Risk (Proposed)
(with Returns)
3.57
(16.0%)-
27.21
(15.7%)
6.81
(22.2%)
MODELMarketing
(μ = 17.11)
NetPurchases
(μ = 133.70)
Purchases
(μ = 162.81)
Returns
(μ = 29.11)
No Cost/No Risk
(without Returns)
3.61
(21.1%)-
27.91
(17.1%)-
Cost/No Risk
(Net Purchases)
3.60
(21.0%)
45.82
(34.3%)- -
Cost/Risk (Proposed)
(with Returns)
3.54
(20.7%)-
27.35
(16.8%)
6.94
(23.8%)
Out-of-Sample Model Fit
In-sample Model Fit
© Petersen and Kumar
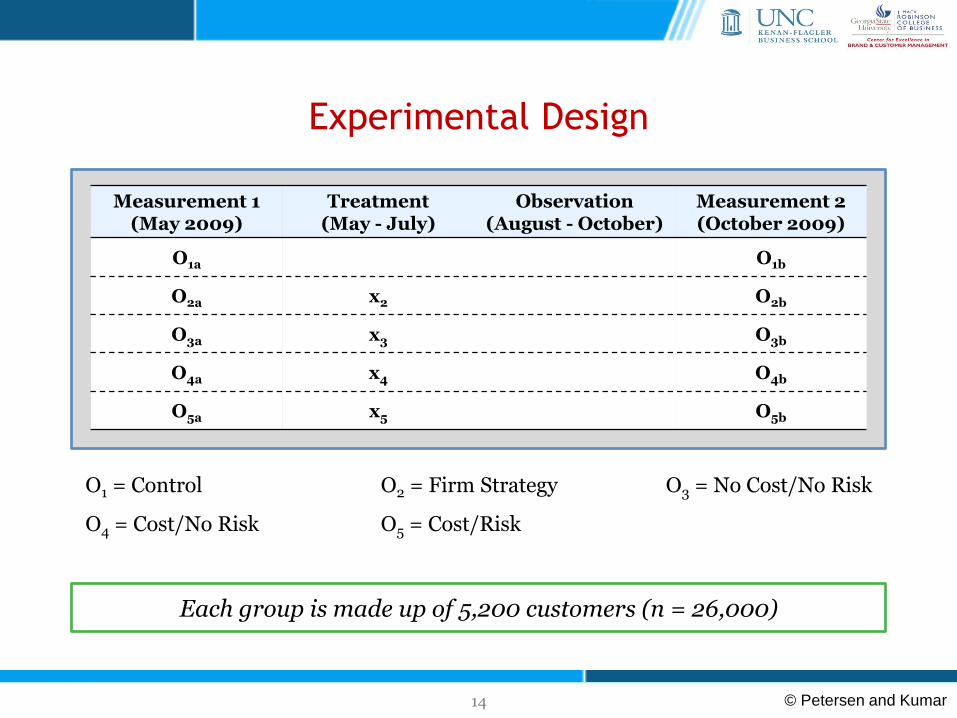
Experimental Design
14
Measurement 1(May 2009)
Treatment (May - July)
Observation (August - October)
Measurement 2(October 2009)
O1a O1b
O2a x2 O2b
O3a x3 O3b
O4a x4 O4b
O5a x5 O5b
Each group is made up of 5,200 customers (n = 26,000)
O1 = Control O2 = Firm Strategy O3 = No Cost/No Risk
O4 = Cost/No Risk O5 = Cost/Risk

© Petersen and Kumar
Field Experiment Results
15
Customer Group
Total Profit
from Purchases
in 6 Months
Total Profit Lost
from Product
Returns in 6
Months
Total Catalogs
and Emails Sent
in the First 3
Months
Average Profit
Per Customer
During the 6
Months
Average CLV
Per Customer
Post Study
Control $1.60M $403.20k 0 $235.20 $1,088.89
Firm’s Strategy $1.62M $373.20k 19,760 $240.55 $1,087.03
No Cost/No Risk
(without Returns)$1.71M $290.16k 17,199 $273.48 $1,172.17
Cost/No Risk
(Net Purchases)$1.80M $270.21k 14,664 $294.21 $1,223.16
Cost/Risk (Proposed)
(with Returns)$2.02M $201.16k 12,090 $352.77* $1,402.96*
* The values found for average profit per customer during the 6 months and average CLV per customer post study for the Proposed Model are statistically
significantly larger from each of the other segments

© Petersen and Kumar
Field Experiment Results (cont.)
16
Relative Gains for the Proposed Model
MODELProfit from
Purchases
Profit Lost from
Product Returns
Marketing
Costs
Average
Profit Per
Customer
Average
CLV Per
Customer
Control 26.3% -50.1% N/A 51.5% 28.8%
Firm’s Strategy 24.7% -46.1% -38.8% 46.6% 29.1%
No Cost/No Risk
(without Returns)18.1% -30.7% -29.7% 28.5% 19.7%
Cost/No Risk
(Net Purchases)12.2% -25.6% -17.6% 19.1% 14.7%
* The percentages in each cell represent the benefit the Proposed Model strategy provides the firm relative to the other strategy
© Petersen and Kumar
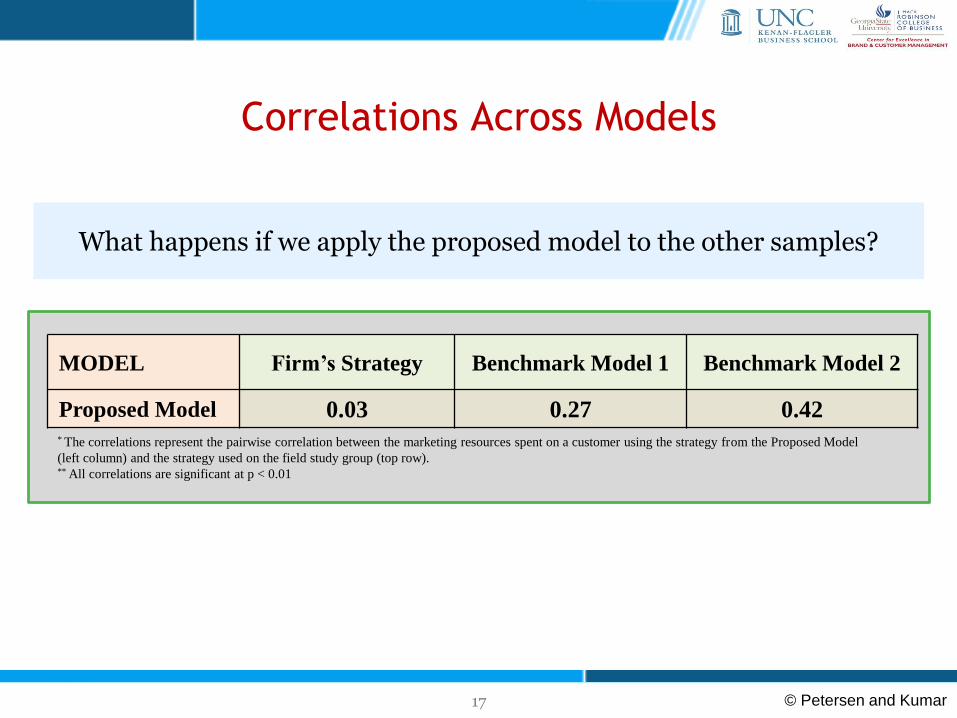
Correlations Across Models
17
What happens if we apply the proposed model to the other samples?
MODEL Firm’s Strategy Benchmark Model 1 Benchmark Model 2
Proposed Model 0.03 0.27 0.42* The correlations represent the pairwise correlation between the marketing resources spent on a customer using the strategy from the Proposed Model
(left column) and the strategy used on the field study group (top row).** All correlations are significant at p < 0.01

© Petersen and Kumar
Implications
18
Product returns play a significant role in lowering perceived risk and should not just be a managed cost
Managing costs and perceived risks can lead to both short- and long-term gains in firm profitability
Applying this framework as a field experiment provides significant value to managers

© Petersen and Kumar
Thank You!!!