Embed Size (px)
Citation preview

MMMMASTERTHESIS PSYCHOLOASTERTHESIS PSYCHOLOASTERTHESIS PSYCHOLOASTERTHESIS PSYCHOLOGYGYGYGY
M. Bourgondiën MSc.
Studentnumber: 0220795
Nijmegen, January 2011
Supervisors TNO: mw. dr. M. de Goede
mw. drs. T. Hof
Supervisors Twente University: mw. dr. L.M.A. Braakman – Jansen
dhr. dr. M. Pieterse
Perceived physical environmental factors related to walking and cycling for transport in rural and urban areas in the Netherlands

1
Perceived physical environmental factors related to walking and cycling for
transport in rural and urban areas in the Netherlands
Abstract
Background: The transport related physical activity levels of people have steadily declined, while the health benefits
from active modes of transport are substantial. Coupled with the negative impact of high volumes of motorized
transportation on environmental air quality, this has led to increased interest in understanding the determinants of
transport related physical activity. The aim of this study was to investigate the association of the perceived physical
environment with bicycling and walking for transport for different areas (rural, suburban and urban), in order to
promote physical activity in a planned and systematic way.
Methods: Participants were surveyed by e-mail. The study included 803 inhabitants of the Netherlands, addressing
walking and cycling behavior and associated perceived physical environmental, personal and social environmental
factors. Logistic regression analyses were used to examine the associations between physical environmental variables
and the two outcomes, stratified for perceived degree of urbanization. Furthermore it was investigated to what extent
this relationship is moderated by age and gender.
Results: Respondents who averaged 42 years of age reported 170 min/week cycling and 93 min/week walking for
transportation. Significantly more people in strong urban areas than in rural areas cycled a lot for transport purposes.
No significant differences between location and walking for transport were found. Aesthetics was associated with
higher levels of cycling for transport for people living in strong urban locations. Besides, functionality and safety
appeared to be important influences of higher levels of cycling for people living in rural locations, in models that
controlled for demographic variables, self efficacy and social support. No associations were found with walking for
transport.
Conclusions: Different physical environmental variables were associated with cycling for transport, but not with
walking for transport. These associations differed between people living in rural, suburban and strong urban settings.
Enhancing these environmental attributes may be effective in promoting resident’s transport-related physical activity.
Keywords: Physical activity; Physical environment; Transportation; Rural; Urban; Walking; Bicycling; Netherlands
Introduction
The physical activity levels of populations of industrialized countries have steadily declined in the last
three decades (World Health Organization, 2002). Our current environment tends to discourage physical
activity: increased car ownership and improvements in roadway infrastructure for the purposes of
automobile use have resulted in significant reductions in the frequency and length of active forms of
transport (Cerin, Leslie & Owen, 2009). According to Susilo and Maat (2007), the trend from urbanization
towards suburbanization also greatly affects the way people travel. The relocation of urban functions from
city cores to suburban development nodes or city outskirts tends to be accompanied by a decline in
cycling and walking.
Many journeys are short and cars, however, are the dominant mode of travel. More than 50 percent of car
trips in Europe cover distances of less than five kilometers (Titze, Stronegger, Janschitz & Oja, 2008). Also

2
. | .
in the Netherlands, cars are the dominant mode of travel for short distances. For more than 70 percent of
all trips made by car, the distance is shorter than 3 km (RIVM,2009). These short trips could be walked or
bicycled easily, thereby providing the recommended amount of daily physical activity (recent guidelines
for physical activity recommend that adults accumulate, on most days, 30 minutes or more of moderate-
intensity physical activity, in minimum bouts of around ten minutes (Jacobsen, Racioppi & Rutter, 2009).
In the Netherlands, 44 percent of the population does not meet the Dutch standard for healthy physical
activity (CBS,2008). So, by stimulating transport related physical activity a larger percentage of the Dutch
population will reach this physical activity standard.
Yet physical inactivity is a major contributor to many of the leading causes of death, including obesity and
chronic disease (Lorenc, Brunton, Oliver, Oliver & Oakley, 2008). The prevalence of overweight in the
Netherlands is 53 percent for the Dutch male population and 42 percent for the Dutch female population,
with a further respectively 11 and 12 percent reaching weights defined as obese (CBS, 2009).
Besides, the different significant health benefits of physical activity, encouraging active modes of
transports will give considerable advantages for the environment. Switching from driving to walking or
cycling is important for reducing CO2 emissions (Jacobsen et al., 2009). Especially these short distances by
car are accountable for high fuel consumption and the dispersal of fines into the air. Exactly the dispersal
of these short trips often takes place in the residential area. By this, the effect on the public health is large,
because breathing in pollute fines is unhealthy. Considering the positive effects for the environment and
public health it is very important to promote active ways of transport, like walking and cycling.
A better understanding of the relation between perceived environmental characteristics and walking and
cycling would enable more successful interventions aimed at increasing physical activity. Social ecological
models have increasingly been applied to understand the determinants of physical activity and inactivity
(Pikora, Giles-Corti, Bull, Jamrozik & Donovan, 2003). Ecological models specify that physical
environments, social environments and personal-level attributes may influence health behavior and
physical activity. There is a growing body of evidence showing that characteristics of the physical
environment have a significant influence on the active lifestyle choices of adults (Cerin, Leslie, du Toit,
Owen & Frank, 2007; Duncan & Mummery, 2005; Giles-Corti., Kelty, Zubrick & Vallanueva, 2009; Humpel,
Owen, Iverson, Leslie & Bauman, 2004). As Giles-Corti and Donovan (2002) state: ‘the physical
environment provides cues and opportunities for physical activity’ (p.1794).
Physical activity takes place in different domains, which include household, transportation and leisure.
Sugiyama, Leslie, Giles-Corti and Owen (2009) emphasize that different physical environment settings
have different determinants and stress the importance of examining context specific behaviour measures
and using context specific environmental attributes. Therefore, our primary interest is to determine the
associations between physical environmental variables and walking and cycling for transport, while also
considering personal (self efficacy) and social environmental factors (social influences).
The physical environmental features that emerge as important across multiple studies include ‘safety’,
‘aesthetics’ ‘functionality’ and ‘destination’ (Pikora et al., 2003). The safety feature reflects the need to
provide safe physical environments for people and incorporates two elements of safety: personal safety
(such as presence of lighting) and traffic safety (such as the availability of crossings). Weinstein, Feigley,

3
Pullen, Mann and Redan (1999) found that people who perceive their neighbourhood as unsafe, are less
physically active.
The aesthetic feature refers to a pleasant, relatively quiet, landscaped, well maintained environment
where people will take pleasure (Pikora et al, 2003). Literature shows that people are inclined to
undertake physical activity in aesthetically appealing (interesting and pleasing) environments (King,
Stokols & Talen, 2002). Following Maas, Verheij, Spreeuwenberg and Groenwegen (2008), natural
environments are perceived to be more aesthetically appealing than built-up environments.
The destination feature relates to the availability of community and commercial facilities in
neighbourhoods. Where there are appropriate local destinations, there is an increased chance that people
will walk. Relevant facilities in the neighbourhood include post boxes, parks, schools, shops and transport
facilities such as bus stops and train stations. Access to destinations showed a positive correlation with
walking for transport (Cerin et al., 2007).
Finally, the functional feature relates to the physical attributes of the street and path that reflect the
fundamental structural aspects of the local environment. Factors that influence this feature include the
directness of routes to destinations and path maintenance (Pikora et al., 2003).
The personal factor self efficacy is concerned with people’s belief in their capabilities to perform a specific
action required to attain a desired outcome (Conner & Norman, 2008). In this case, the belief in their
capabilities to walk or cycle for transport. Past research has shown that self efficacy is a relevant and
promising determinant of behaviour change related to the process of becoming and staying physically
active (Stevens, Bakker-van Dijk, De Greef, Lemmink & Rispens, 2001; Troped, Saunders, Pate, Reininger &
Addy, 2003; Duncan & Mummery, 2005).
Subjective norms and social support form the social environmental influences. Subjective norms can be
divided in what significant others think the person should do and what significant others are perceived
doing with respect to the behaviour in question (Ajzen, 2006). Social support takes the form of
encouragement of others to try physical activity behavior. Social support has been found to have small to
moderate effects on maintenance of physical activity (Sherwood & Jeffery, 2000).
Studies about the influence of the physical environment have largely occurred in urban settings. This
while urban and rural physical environments are different. These differences often make findings
obtained in urban settings invalid in rural settings (Moore, Jillcot, Shores, Evenson, Brownson & Novick,
2010). Troped et al. (2003) recommended as option for future research to identify shared and unique
correlates of transportation physical activity in urban, suburban and rural settings. Therefore, this study
distinguishes people who are living in rural, suburbanized and strong urbanized areas when investigating
which factors influence transport related physical activity.
There are a number of urban residential characteristics of Europe. As a means of reducing energy
consumption by transport many European cities have implemented measures to limit urban sprawl and
promote the development of compact urban forms (Susilo & Maat, 2007). European cities tend to have a
high density across space. What counts for Europe, counts even more for the Netherlands: the urban
density across space is considerably higher than in the neighbouring countries. As a result, car ownership
is lower in Europe than in US and more people use public transport and bicycles in Europe than in the US
(Susilo & Maat, 2007). Especially in the Netherlands, there is a strong cycling culture: of the 16 million

4
. | .
inhabitants more than 13 million people own a bicycle. The Netherlands has a high cycle-density and
many cycle-tracks. Whereas in most countries the bike has a recreational function, the bicycle is pre-
eminently a means of transport in the Netherlands.
This explorative study investigates the assumption that people in urban residents are more physical active
for transport purposes than people living in rural residents. Work in the field of transportation has found
people living in certain types of places walk more for travel (Forsyth, Oakes, Lee & Schmitz, 2009).
Walking is more often seen as convenient in urban areas, and cycling in more rural areas (Lorenc et al.,
2008).
Further, we investigate the assumption that different aspects of the physical environment are important
for different urbanization settings. Since rural areas have low population density, there is higher
likelihood that rural residents will live further from activity areas compared to people who live in strong
urbanized locations. The high availability of facilities (e.g. shops and services) at walking and cycling
distance in urban areas will encourage people to walk or cycle. On the other hand, urban areas are also
often characterized by limited green space, which will not contribute to an interesting and pleasing
physical environment that will encourage people to walk or cycle. In rural areas there is lots of green
space, but people often have to use the car to visit facilities (Maas et al., 2008).
The aim of this study is to investigate whether there is an association between the physical environmental
and the level of physical activity (i.e. both walking and cycling) analyzed for different perceived degrees of
urbanization (i.e. rural, suburban and urban). Furthermore we investigate to what extent this relationship
is moderated by age and gender. This paper focuses on transport-related physical activity, here defined as
cycling and walking done to travel to and from work, to do errands, or to go from place to place (Cerin,
Leslie & Owen, 2009). More specifically, the following research questions will be addressed:
1. Is there a difference in the level of cycling and/or walking for transport between people
living in rural, suburban or urban environments?
2. To what extent is there an association between the perceived physical environment and
cycling and walking for transport for people living in rural, suburban or urban
environments?
3. What is the moderating role of age and gender in the influence of the perceived physical
environment on walking and cycling for transport?
Methods
Study design and participants
A cross sectional survey of Dutch inhabitants aged 17-80 was conducted between August and September
2010. An e-mail with an URL to the webquestionnaire, was sent to different persons. At the same time we
asked the potential respondents to send the e-mail through to other potential participants. A lottery-based
incentive was provided. 1137 people opened the questionnaire, of whom 803 completed the whole
questionnaire (70.6 percent). Of these 803 respondents, 694 respondents walk and cycle, 23 respondents
only walk, 64 respondents only cycle and 22 respondents never walk or cycle (of which three persons due

5
health problems) for transport purposes. We used the data of the 694 respondents who both cycle and
walk for transport for our analysis. The time it took to fill out all the questions was approximately fifteen
minutes.
Figure 1
Conceptual model
Study Measures
Perceived physical environmental, perceived social environmental, personal and demographic data were
examined as potential correlates of transportation related physical activity (i.e. walking and cycling) (see
figure 1). The selection of these variables was based on scientific literature about ecological framework,
behaviour change models, the physical activity determinants literature and the ‘Neighborhood
Environment Walkability Scale’ (Saelens, Sallis, Black & Chen, 2003). Our primary interest was to
determine the associations between physical environmental variables and physical activity (i.e. walking
and cycling), while also considering perceived social environmental, personal and demographic factors
Walking for transport
Cycling for transport
Demographics
Age
Gender
Educational attainment
BMI
Availability car
Health status
Perceived physical
environment
Safety
Aesthetics
Functionality
Destination
Perceived social
environment
Subjective norms
Perceived Degree of
Urbanization
Rural
Suburban
Urban
Social support
Self efficacy

6
. | .
and whether these possible relations differ for people living in urban areas compared to people living in
rural areas.
Dependent variables (outcome measures)
Participants reported which destinations they had visited in the past seven days from a list of ten common
destinations. These were: ‘school’, ‘work’, ‘shops and services’, ‘bus/train stop’, ‘family or friends’,
‘restaurant or café’, ‘park’, ‘gym or sport facilities’, ‘health institutions’ or ‘other’. Participants reported by
each visited destination their travel mode (walking, cycling or using any other kind of vehicle) and how
many minutes the trip took to reach that particular destination. We computed the minutes walking and we
computed the minutes cycling separately. The outcome variables of the study were the total weekly
minutes of cycling for transport and the total weekly minutes of walking for transport. Since the
distributions of the variables were highly skewed, they were dichotomized using median split for analyses
(see appendix B).
Independent variables
Demographic characteristics
The survey included questions on age, gender, educational attainment, perceived general health, height,
weight, availability of bicycle, availability of car and postal code. We categorized the level of educational
attainment from nine categories into three categories (low, moderate and high) based on the International
Standard Classification of Education (ISCED, Verweij, 2008).
Perceived general health was self-rated by respondents by replying to the following statement: in general,
would you say that your health is: …. They could respond by one of the following categories: bad,
moderate, average, good, very good.
Combining the height and weight, we generated a BMI index for each respondent. We also included a
dummy variable, indicating whether or not respondents had overweight (BMI > 25). We checked the
normality distribution of the independent variables: the significant values in the Kolmogorov-Smirnov test
indicates a deviation from normality of the independent variables (see appendix C).
Perceived physical environmental attributes
Nineteen items were used to assess the perceived environment for cycling and nineteen items were used
to assess the perceived environment for walking. Based on Pikora et al. (2003), these nineteen items
represented four different categories: ‘safety’, ‘aesthetics’, ‘functionality’ and ‘destination’ and provided
the conceptual framework for the perceived physical environment. The items were assessed on a seven
point Likert Scale ranging from 1 (strongly disagree) to 7 (strongly agree). See appendix A for a full list of
items.
The four factors of the perceived physical environment are formative constructs; the items of the
construct do not necessarily coincide. Instead, together they make up the construct. Therefore, it is not
relevant to check its reliability (Hair, Black, Babin, Anderson & Taham, 2006).

7
Self efficacy
Self-efficacy for performing transport related cycling was assessed with four items using a seven point
Likert scale from ‘very difficult’ to ‘very easy’. Respondents were required to rate how easy or difficult it is
for them to cycle for transport to their most visited destination ‘even when the weather is bad’, ‘when it is
very hot outside’, ‘when you are tired’ and ‘when you feel you don’t have time’. The Cronbach’s alpha for
these four items was .81; indicating a high level of internal consistency. The participants also rated the
same items for walking for transport to their most visited walk destination. The Cronbach’s alpha for the
four items ‘self efficacy walking’ was .88, indicating also a high level of internal consistency.
Social influences
Respondents were asked to rate on a seven point Likert scale (strongly disagree – strongly agree) the
following five items: ‘My friends, family and/or colleagues think that I should cycle’, ‘It is expected of me
that I cycle’, ‘My family, friends and/or colleagues frequently use the cycle for transportation’, ‘Many
people like me cycle to such a destination’ and ‘My family, friends and/or colleagues encourage me to use
the bicycle to go to this destination’. The same items were also used for walking.
The Cronbach’s alpha for the five items ‘social influences cycling’ was .81. The Cronbach’s alpha for the
‘social influences walking’ was .88. They both indicate a high level of internal consistency.
Degree of urbanization
This study distinguished between people who are living in rural, suburban and urban areas in
investigating whether perceived physical environmental factors influence transport related physical
activity. We assessed the degree of urbanization on two ways. First on a subjective manner, by asking how
respondents would classify their own neighborhood: rural, suburbanized or urbanized. Second on an
objective manner, based on the number of addresses per square km by checking the postal code of the
respondents. This is measured at municipal level (rural: <1000 addresses per square km, suburban:
1000-15000 addresses per square km and urban environment: >1500 addresses per square km). This
indicator is widely used in the Netherlands (Maas et al., 2008).
Data analysis
Analyses were carried out using SPSS 15.0 software. Descriptive statistics were used to summarize
characteristics of the respondents and to summarize both the independent variables and the two physical
activity outcomes. Items in each factor were averaged to provide a total score for each independent
variable. This method facilitated comparison across the categories, with all having a final score from one
till seven (see table 3).
For the bivariate analyses, the scores on perceived physical environment perceived social influences and
self efficacy were transformed into categorical variables with three levels: low (a less positive perception
of the environment); moderate; or high (a positive perception of the environment). The cutoff point used
for these levels were those that most closely approximated the tertiles of the distribution. The outcome
measures (cycling and walking) were dichotomized at the median split and analyzed separately. By using
bivariate analyses we could discover possible curvilinear relationships.
8
. | .
Pearson’s correlations were used to analyze the associations between the different constructs. We
conducted also analyses with Spearman correlations because there was an indication that the variables
deviated from normality.
Anova analyses were used to find out whether there was a significant difference between the average
distance to the most accessed walking and cycling destination for people living in rural, suburban or urban
areas. Further we conducted an anova analysis to find out whether there was a difference in total cycling
and walking minutes and perceived degree of urbanization.
The bivariate relationships (χ2) between the perceived physical environmental, perceived social
environmental, personal and demographic variables and walking and cycling were analyzed. All variables
with p-values less than .25 in the bivariate χ2 analysis were entered into logistic regression analyses. The
reason for carrying out a logistic regression was that it is robust against violations of normality and
violations of the equal variance-covariance across groups (Hair et al., 2006, p.275).
In the models for cycling for transport purposes, we controlled for age, gender, perceived health status
and the availability of a car. Additionally, in the models for walking for transport purposes, we controlled
for age, educational attainment, perceived health status and the availability of a car.
As we think that the association between perceived physical environment and walking and cycling for
transport differs for people living in rural, suburban and urban environments, all models were stratified
by the perceived degree of urbanization, by means of the split file method. In the logistic regression
analyses we first entered the socio-demographic variables, followed by the perceived physical
environmental variables and third the two variables ‘self efficacy’ and ‘social influences’. Furthermore,
Baranowski, Cullen, Nicklas, Thomson and Baranowski (2003) suggested that as human behaviour is very
complex, the presence of interaction terms seems be likely and these terms should be sought. So we tested
for interaction effects between the perceived physical environment and the demographic variables age
and gender.
To minimize the impact of one respondent or a small group of respondents on our results, we checked for
outliers for the two physical activity outcomes. We exclude eleven respondents who are more than 1000
minutes per week physically active for transport purposes.
Results
Degree of urbanization
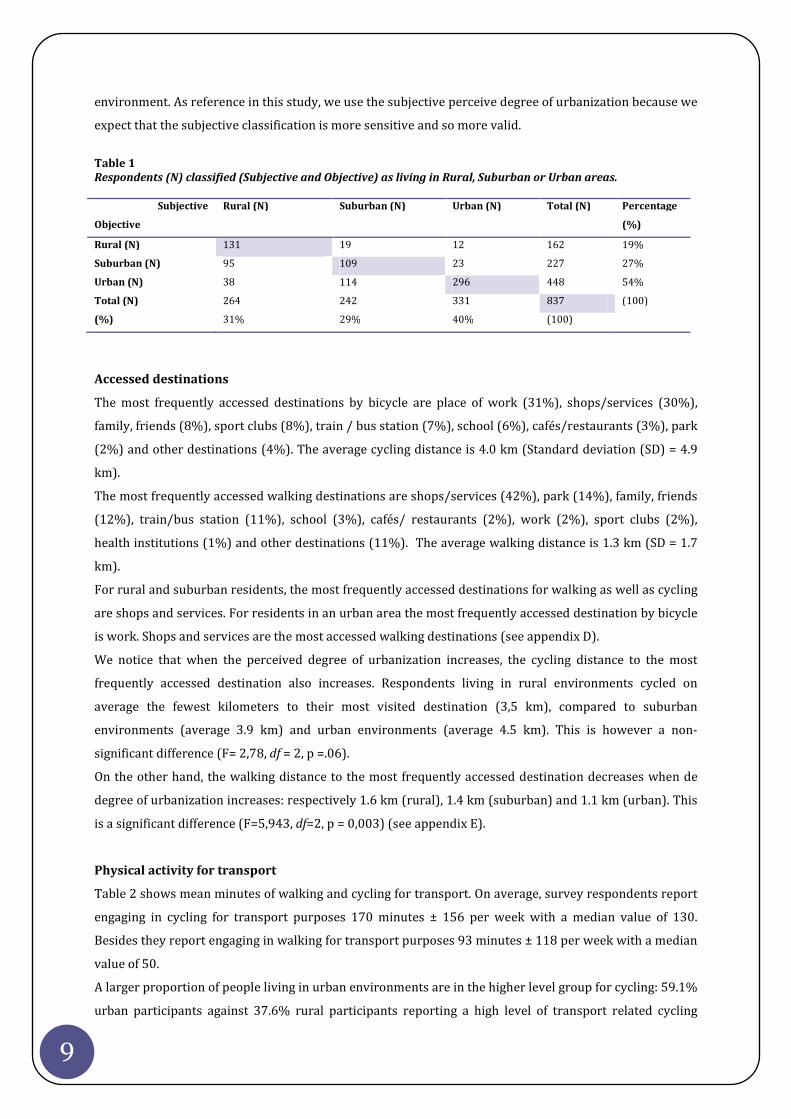
This study distinguishes people who are living in rural, suburban and urban areas. When respondents are
classified based on the number of households per square kilometers (objective classification), 162
respondents (19%) live in a rural environment (<1000 addresses per square km), 227 respondents (27%)
in a suburban environment (1000-15000 addresses per square km) and 448 respondents (54%) live in a
strong urban environment (>1500 addresses per square km). When classifying the respondents based on
how they perceive their own neighbourhood; 233 people (31%) live in a rural environment, 242 people
(29%) live in a suburban environment and 331 (40%) live in a urban environment (see table 1).
Considering these differences, respondents perceive themselves as more often living in a rural or
suburban setting while the objective method classifies them more often as a resident of a strong urban
9
environment. As reference in this study, we use the subjective perceive degree of urbanization because we
expect that the subjective classification is more sensitive and so more valid.
Table 1
Respondents (N) classified (Subjective and Objective) as living in Rural, Suburban or Urban areas.
Subjective
Objective
Rural (N) Suburban (N) Urban (N) Total (N) Percentage
(%)
Rural (N) 131 19 12 162 19%
Suburban (N) 95 109 23 227 27%
Urban (N) 38 114 296 448 54%
Total (N) 264 242 331 837 (100)
(%) 31% 29% 40% (100)
Accessed destinations
The most frequently accessed destinations by bicycle are place of work (31%), shops/services (30%),
family, friends (8%), sport clubs (8%), train / bus station (7%), school (6%), cafés/restaurants (3%), park
(2%) and other destinations (4%). The average cycling distance is 4.0 km (Standard deviation (SD) = 4.9
km).
The most frequently accessed walking destinations are shops/services (42%), park (14%), family, friends
(12%), train/bus station (11%), school (3%), cafés/ restaurants (2%), work (2%), sport clubs (2%),
health institutions (1%) and other destinations (11%). The average walking distance is 1.3 km (SD = 1.7
km).
For rural and suburban residents, the most frequently accessed destinations for walking as well as cycling
are shops and services. For residents in an urban area the most frequently accessed destination by bicycle
is work. Shops and services are the most accessed walking destinations (see appendix D).
We notice that when the perceived degree of urbanization increases, the cycling distance to the most
frequently accessed destination also increases. Respondents living in rural environments cycled on
average the fewest kilometers to their most visited destination (3,5 km), compared to suburban
environments (average 3.9 km) and urban environments (average 4.5 km). This is however a non-
significant difference (F= 2,78, df = 2, p =.06).
On the other hand, the walking distance to the most frequently accessed destination decreases when de
degree of urbanization increases: respectively 1.6 km (rural), 1.4 km (suburban) and 1.1 km (urban). This
is a significant difference (F=5,943, df=2, p = 0,003) (see appendix E).
Physical activity for transport
Table 2 shows mean minutes of walking and cycling for transport. On average, survey respondents report
engaging in cycling for transport purposes 170 minutes ± 156 per week with a median value of 130.
Besides they report engaging in walking for transport purposes 93 minutes ± 118 per week with a median
value of 50.
A larger proportion of people living in urban environments are in the higher level group for cycling: 59.1%
urban participants against 37.6% rural participants reporting a high level of transport related cycling

10
. | .
(χ2=24,20, df=2, p=.000). Participants living in strong urban locations (mean minutes =192) cycle
significantly more minutes for transport than participants living in rural locations (mean minutes =145)
(F=5,93, df=2, p=.003). We found no association between degree of urbanization and walking for transport
(F= 0.198, df=2, p=.821) (see appendix F and G).
Those respondents reporting high values for aesthetics (57,8%; χ2=9,69, df=2, p=.008) and those
reporting a high self efficacy for cycling (59,7%, χ2 =28,17, df =2, p=.000) cycle more minutes for
transport purposes. Remarkably, those respondents reporting a lot of social influences cycle significant
less for transport (54.7%, χ2 =6.97, df =2, p=.031). Respondents who walk more minutes for transport are
found among those with low values for safety (55,5%, χ2=6,09, p=.048) (see appendix H).
Table 2
Mean, median and Standard Deviation (SD) of minutes cycling and walking for transportation for people in rural, suburban en
urban environments.
Demographic characteristics
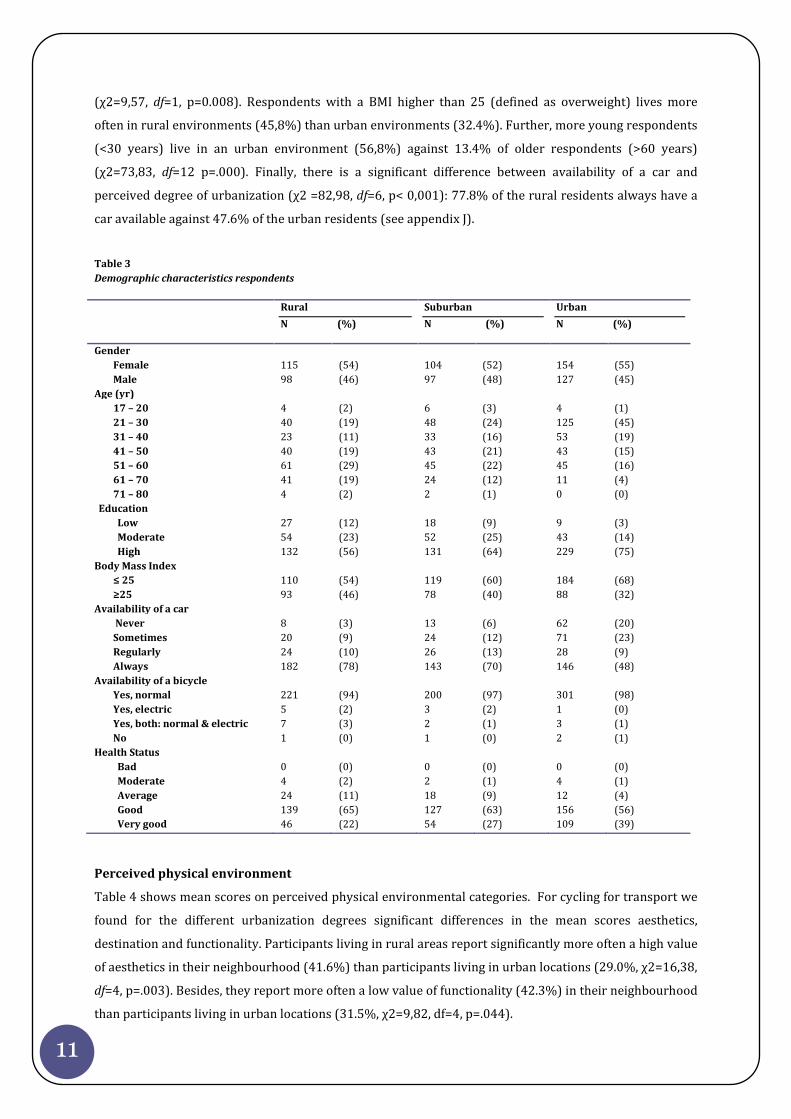
Table 3 shows the descriptive characteristics of the respondents. The mean age of women in the sample is
37 (SD=13.6) and the mean age of men of the sample is 47 (SD=14.1). The participants are overall a
relatively healthy group; 91 percent of the respondents define their health as good or very good. 99.5
percent of the respondents have a bicycle of which 1.6 percent has an electric bicycle.
There are no significant differences between age and transportation related physical activity (cycling:
χ2=8,34, df=6, p=.214; walking: χ2=8,77, df=6, p=.187). Neither a significant association is found between
BMI > 25 and cycling or walking for transport (χ2 = 1,13, df=1, p=.288; χ2=0,07, df=1, p=.788). A
significant difference between men and women is found for cycling, but not for walking: the proportion of
men (55.8%) who are in the higher level group for cycling are significant larger than the proportion
women (45,1%, χ2=7,84, df=1, p=.005). Significantly larger proportions of those cycling for transport are
found among those who perceive their general health as very good (58,3 %, χ2=11,14, df=3, p=.011)
compared to people who perceived their general health as moderate. Besides, more people with a low
education (64.2%) are in the higher level group for walking (χ2=6,46, df=2, p=.040). Significantly larger
proportions of those cycling and walking are found among those who never have the availability of a car
(resp. 63,4%, χ2=25,28, df=3, p=.000; 64,6%, χ2=10,25, df=3, p=0.017) (see appendix I).
There are no significant gender differences for place of residence: as much men as women live in rural,
suburban and urban environments (χ2=0,46, df=2, p=.797). The proportion of participants with a high
education living in a strong urban environment (46,5%) is significantly higher than for those with a low
education(16.7%; χ2=30,59, df=4, p=0.000). There is also an association between BMI > 25 and location
Total
N Mean, median (SD)
Rural
N Mean, median,(SD)
Suburban
N Mean, median, (SD)
Urban
N Mean, median, (SD)
Cycling for
transport
734 17170, 130, (156) 229 145, 80, (160) 202 163, 125, (128) 303 192, 165, (156)
Walking for
transport
734 93, 50, (118) 229 89, 50, (118) 202 97, 50, (123) 303 92, 55, (116)
11
(χ2=9,57, df=1, p=0.008). Respondents with a BMI higher than 25 (defined as overweight) lives more
often in rural environments (45,8%) than urban environments (32.4%). Further, more young respondents
(<30 years) live in an urban environment (56,8%) against 13.4% of older respondents (>60 years)
(χ2=73,83, df=12 p=.000). Finally, there is a significant difference between availability of a car and
perceived degree of urbanization (χ2 =82,98, df=6, p< 0,001): 77.8% of the rural residents always have a
car available against 47.6% of the urban residents (see appendix J).
Table 3
Demographic characteristics respondents
Rural
N (%)
Suburban
N (%)
Urban
N (%)
Gender
Female
Male
115
98
(54)
(46)
104
97
(52)
(48)
154
127
(55)
(45)
Age (yr)
17 – 20
21 – 30
31 – 40
41 – 50
51 – 60
61 – 70
71 – 80
4
40
23
40
61
41
4
(2)
(19)
(11)
(19)
(29)
(19)
(2)
6
48
33
43
45
24
2
(3)
(24)
(16)
(21)
(22)
(12)
(1)
4
125
53
43
45
11
0
(1)
(45)
(19)
(15)
(16)
(4)
(0)
Education
Low
Moderate
High
27
54
132
(12)
(23)
(56)
18
52
131
(9)
(25)
(64)
9
43
229
(3)
(14)
(75)
Body Mass Index
≤ 25
≥25
110
93
(54)
(46)
119
78
(60)
(40)
184
88
(68)
(32)
Availability of a car
Never
Sometimes
Regularly
Always
8
20
24
182
(3)
(9)
(10)
(78)
13
24
26
143
(6)
(12)
(13)
(70)
62
71
28
146
(20)
(23)
(9)
(48)
Availability of a bicycle
Yes, normal
Yes, electric
Yes, both: normal & electric
No
221
5
7
1
(94)
(2)
(3)
(0)
200
3
2
1
(97)
(2)
(1)
(0)
301
1
3
2
(98)
(0)
(1)
(1)
Health Status
Bad
Moderate
Average
Good
Very good
0
4
24
139
46
(0)
(2)
(11)
(65)
(22)
0
2
18
127
54
(0)
(1)
(9)
(63)
(27)
0
4
12
156
109
(0)
(1)
(4)
(56)
(39)
Perceived physical environment
Table 4 shows mean scores on perceived physical environmental categories. For cycling for transport we
found for the different urbanization degrees significant differences in the mean scores aesthetics,
destination and functionality. Participants living in rural areas report significantly more often a high value
of aesthetics in their neighbourhood (41.6%) than participants living in urban locations (29.0%, χ2=16,38,
df=4, p=.003). Besides, they report more often a low value of functionality (42.3%) in their neighbourhood
than participants living in urban locations (31.5%, χ2=9,82, df=4, p=.044).

12
. | .
For walking for transport we found for the different urbanization degrees significant differences in the
mean scores on safety, aesthetics, functionality and destination. Participants living in urbanized areas
report significantly more often a high value of safety (38.2%) than participants living in rural areas
(23.3%, χ2 = 18,55, df=4, p=.001). Besides, participants living in rural locations report significantly more
often a high value of aesthetics in their neighbourhood (47,9%) than participants living in urban locations
(23.3%, χ2 = 56,86, p = .000) and they also report more often a low value of functionality in their
neighbourhood (43.2%) compared to participants living in a urban environment (26.6%, χ2 = 14,43, p =
0.001). Finally, respondents living in strongly urbanized environments report more often a high value of
destinations (54,1%) compared to respondents living in a rural environment (19.2%, χ2 = 84,00, df=4,
p=.000) (see Appendix K).
Table 4
Mean scores on physical environmental attribute categories (7 point Likert Scale: 1 low, 7 high). SD = standard deviation.
Total
N Mean, (SD)
Rural
N Mean, (SD)
Suburban
N Mean, (SD)
Urban
N Mean, (SD)
Cycling
for
transport
Safety 669 4.97 (0.9) 209 4.96 (0.9) 188 4.93 (0.9) 272 5.01 (0.9)
Aesthetics
703 4.47 (1.1) 219 4.73 (1.0) 201 4.41 (1.1) 283 4.30 (1.0)
Destination
747 6.14 (1.2) 234 5.69 (1.4) 206 6.10 (1.2) 307 6.51 (1.0)
Functionality 716 5.42 (1.0) 222 5.33 (1.1) 202 5.43 (1.0) 292 5.48 (0.9)
Walking
for
transport
Safety 663 5.20 (0.9) 206 5.12 (0.8) 182 5.02 (0.9) 275 5.37 (0.9)
Aesthetics
703 4.27 (1.1) 219 4.69 (1.0) 201 4.27 (1.0) 283 3.93 (1.1)
Destination
747 6.14 (1.2) 234 5.69 (1.4) 206 6.10 (1.2) 307 6.51 (1.0)
Functionality 707 5.02 (1.2) 220 4.82 (1.4) 201 4.89 (1.1) 286 5.26 (1.0)
Results correlation analysis
Self efficacy significantly correlates with cycling for transport, for participants living in rural, suburban
and urban environments (respectively: r=0.21, r=0.24 and r=0.21). Furthermore a positive correlation
exists between aesthetics and cycling and walking for transport for people living in urban environments
(r=.12, r=.12). The two dependent variables (walking and cycling for transport purposes) are correlated
for people who live in a rural environment (r = .19), but not for people who live in suburban or urban
environment. There are some significant correlations between the different independent variables.
Although these correlations are significant, the correlations are weak (r<0.3).
As mentioned before, the distributional assumptions are violated. So, we also checked the correlations
with Spearman’s Rho, but no significant different correlations existed (see appendix L and M).
13
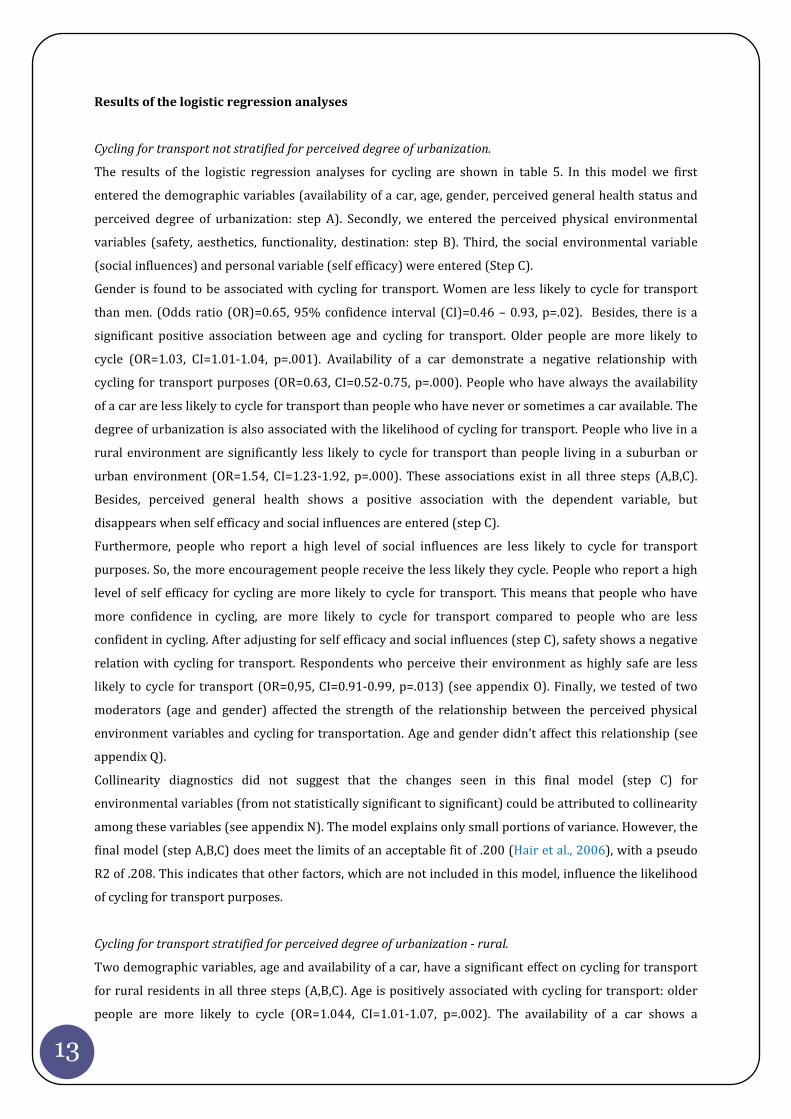
Results of the logistic regression analyses
Cycling for transport not stratified for perceived degree of urbanization.
The results of the logistic regression analyses for cycling are shown in table 5. In this model we first
entered the demographic variables (availability of a car, age, gender, perceived general health status and
perceived degree of urbanization: step A). Secondly, we entered the perceived physical environmental
variables (safety, aesthetics, functionality, destination: step B). Third, the social environmental variable
(social influences) and personal variable (self efficacy) were entered (Step C).
Gender is found to be associated with cycling for transport. Women are less likely to cycle for transport
than men. (Odds ratio (OR)=0.65, 95% confidence interval (CI)=0.46 – 0.93, p=.02). Besides, there is a
significant positive association between age and cycling for transport. Older people are more likely to
cycle (OR=1.03, CI=1.01-1.04, p=.001). Availability of a car demonstrate a negative relationship with
cycling for transport purposes (OR=0.63, CI=0.52-0.75, p=.000). People who have always the availability
of a car are less likely to cycle for transport than people who have never or sometimes a car available. The
degree of urbanization is also associated with the likelihood of cycling for transport. People who live in a
rural environment are significantly less likely to cycle for transport than people living in a suburban or
urban environment (OR=1.54, CI=1.23-1.92, p=.000). These associations exist in all three steps (A,B,C).
Besides, perceived general health shows a positive association with the dependent variable, but
disappears when self efficacy and social influences are entered (step C).
Furthermore, people who report a high level of social influences are less likely to cycle for transport
purposes. So, the more encouragement people receive the less likely they cycle. People who report a high
level of self efficacy for cycling are more likely to cycle for transport. This means that people who have
more confidence in cycling, are more likely to cycle for transport compared to people who are less
confident in cycling. After adjusting for self efficacy and social influences (step C), safety shows a negative
relation with cycling for transport. Respondents who perceive their environment as highly safe are less
likely to cycle for transport (OR=0,95, CI=0.91-0.99, p=.013) (see appendix O). Finally, we tested of two
moderators (age and gender) affected the strength of the relationship between the perceived physical
environment variables and cycling for transportation. Age and gender didn’t affect this relationship (see
appendix Q).
Collinearity diagnostics did not suggest that the changes seen in this final model (step C) for
environmental variables (from not statistically significant to significant) could be attributed to collinearity
among these variables (see appendix N). The model explains only small portions of variance. However, the
final model (step A,B,C) does meet the limits of an acceptable fit of .200 (Hair et al., 2006), with a pseudo
R2 of .208. This indicates that other factors, which are not included in this model, influence the likelihood
of cycling for transport purposes.
Cycling for transport stratified for perceived degree of urbanization - rural.
Two demographic variables, age and availability of a car, have a significant effect on cycling for transport
for rural residents in all three steps (A,B,C). Age is positively associated with cycling for transport: older
people are more likely to cycle (OR=1.044, CI=1.01-1.07, p=.002). The availability of a car shows a

14
. | .
negative relationship with cycling for transport (OR=0.48, CI=0.31-0.76, p=.002). Perceived general health
is no longer statistically significant when the two variables social influences en self efficacy are entered
(step C). A positive effect is found for the self efficacy (OR=1.124, CI=1.05-1.21, p=.002). So, people who
have more confidence in cycling are more likely to cycle for transport compared to people who are less
confident in cycling. Social influences shows a negative relation (OR=0.92, CI=0.87–0.97, p=.004). One
physical environment variable, functionality, shows a positive significant effect: rural residents who
perceive their environment as highly functional are more likely to cycle for transport (OR=1.136, CI=1.03-
1.25, p=0.008). And one physical environment variable shows after adjusting for the variables self efficacy
and social influences (step C) a significant effect: rural residents who perceive their environment as highly
safe are less likely to cycle for transport purposes (OR=0.92, CI=0.86-1.0, p=0.036).
The model explains only small portions of variance. However, it does meet the limits of an acceptable fit of
.200 (Hair et al., 2006), with a pseudo R2 of .28. This indicates that other factors, which are not included in
this model, influence the likelihood of cycling for transport for people living in rural areas (see appendix
P).
Cycling for transport stratified for perceived degree of urbanization - suburban.
Also for suburban residents, in all three steps (A,B,C) age is positively associated with cycling for transport
(OR=1.027, CI=1.0-1.06, p=0.053). Gender and the availability of a car show a negative relationship.
Women are less likely to cycle for transport purposes than women (OR = 0.42, CI = 0.21-0.86, p=0.017).
People who always have a car available are less likely to cycle for transport than people who do not have a
car at their disposal (OR = 0.57, CI = 0.38-0.85, p<0.05). Self efficacy shows a positive effect with cycling:
the more confidence people have in cycling for transport the more likely they are going to cycle (OR=1.18,
CI=1.05-1.19, p=.001). The logistic regression model for suburban residents found no perceived
environmental attributes associated with cycling for transport.
The model explains only small portions of variance. However, it does meet the limits of an acceptable fit of
.200 (Hair et al., 2006), with a pseudo R2 of .22. This indicates that other factors, which are not included in
this model, influence the likelihood of cycling for transport for people living in suburbanized areas (see
appendix P).
Cycling for transport stratified for perceived degree of urbanization - urban.
Gender and the availability of a car show a negative relationship with cycling for residents in urban
environments in all three steps. Men are more likely to cycle for transport purposes (OR=0.54, CI=0.26-
0.80, p= .006). People who always have a car available are less likely to cycle for transport than people
who do not have a car at their disposal (OR=0.70, CI=0.55-0.90, p=.006). Besides, perceived general health
shows a positive association with the dependent variable, but disappears when the variables self efficacy
and social influences are entered (step C). One physical environment variable shows a significant effect:
residents living in strong urbanized environments who report a high value of aesthetics are more likely to
cycle for transport purposes (OR=1.07, CI=1.02-1.13, p=.012). Finally, a positive relationship is found for
the self efficacy: people who report a high level of self efficacy are more likely to cycle for transport
(OR=1.10, CI=1.04-1.16, p=.002).

15
The model explains only small portions of variance. It doesn’t meet the limits of an acceptable fit of .200
(Hair et al., 2008), with a pseudo R2 of .192. But the logistic regression model reports still significance
(χ2=41.04, df=10, p=.000) (See appendix P).
Table 5
Odds ratio’s (95%CI) for environmental variables and likelihood of people being high cyclers.
* p < .05
** p < .001
CI = Confidence Interval
Walking for transport not stratified for perceived degree of urbanization.
The results of the logistic regression analyses for walking are shown in table 6. In this model we first
entered the demographic variables (age, educational attainment, perceived degree of urbanization,
perceived general health: step A). Secondly, we entered the perceived physical environmental variables
(safety, aesthetics, functionality, destination: step B). Third, the social environmental variable (social
influences) and personal variable (self efficacy) were entered (Step C).
Only two demographic variables show an association with walking for transport. Availability of car
demonstrates a negative relationship with walking for transport purposes. So, people who always have a
car available are less likely to walk for transport than people who do not have a car at their disposal
(OR=0.80, CI=0.68-0.94, p=.008). Besides, there is a significant positive association between age and
walking for transport: older people are more likely to walk (OR = 1.02, CI = 0.68-0.94, p <0.05). These
associations exist in all three steps (A,B,C) None of the perceived physical environmental variables show
an association with walking for transport (see appendix R).
Total
Odds ratio’s (95% CI)
Rural
Odds ratio’s (95% CI)
Suburban
Odds ratio’s (95% CI)
Urban
Odds ratio’s (95% CI)
Gender 0.65 (0.46-0.93)* 0.68 (0.33-1.42) 0.42 (0.21-0.86)* 0.45 (0.26-0.80)*
Age 1.03 (1.01-1.04)** 1.04 (1.02-1.07)* 1.03 (1.00-1.06)* 1.01 (0.96-1.03)
Availability Car 0.63 (0.52 – 0.75)** 0.48 (0.31-0.76)* 0.57 (0.38-0.85)* 0.70 (0.55-0.90)*
Perceived
degree of
Urbanization
1.54 (1.23 – 1.92)** - - -
Perceived
physical health
1.27 (0.96-1.69) 1.44 (0.81-2.55) 1.18 (0.69 – 2.04) 1,29 (0.81-2.06)
Aesthetics 1.03 (0.99 – 1.06) 0.98 (0.92-1.05) 1.03 (0.96 – 1.09) 1.07 (1.02-1.13)*
Safety 0.95 (0.92 – 0.99)* 0.92 (0.86-1.00)* 0.93 (0.86 – 1.00) 0.98 (0.93-1.05)
Destination 0.99 (0.95 – 1.046) 0.95 (0.87 – 1.03) 1.08 (0.98-1.19) 0.92 (0.81-1.04)
Functionality 1.02 (0.98 – 1.07) 1.14 (1.03-1.25)* 1.04 (0.95-1.15) 0.95 (0.88-1.02)
Self efficacy 1.10 (1.07 – 1.14)** 1.12 (1.05 – 1.21)* 1.12 (1.05-1.19)** 1.10 (1.04-1.16)*
Social influences 0.97 (0.94 – 0.99)* 0.92 (0.87 – 0.97)* 0.98 (0.93-1.03) 0.99 (0.94-1.04)
Nagelkerke’s R2 .28 .28 .22 .19
÷2, p 110.99 (df=11) p=.000 45,41 (df=10), p=.000 33,80 (df =10), p=.000 41.04 (df=10), p=.000
N 655 202 185 268
16
. | .
Finally, we tested of two moderators (age and gender) affected the relationship between perceived
physical environment variables and walking for transportation. Age and gender didn’t affect this
relationship (see appendix T).
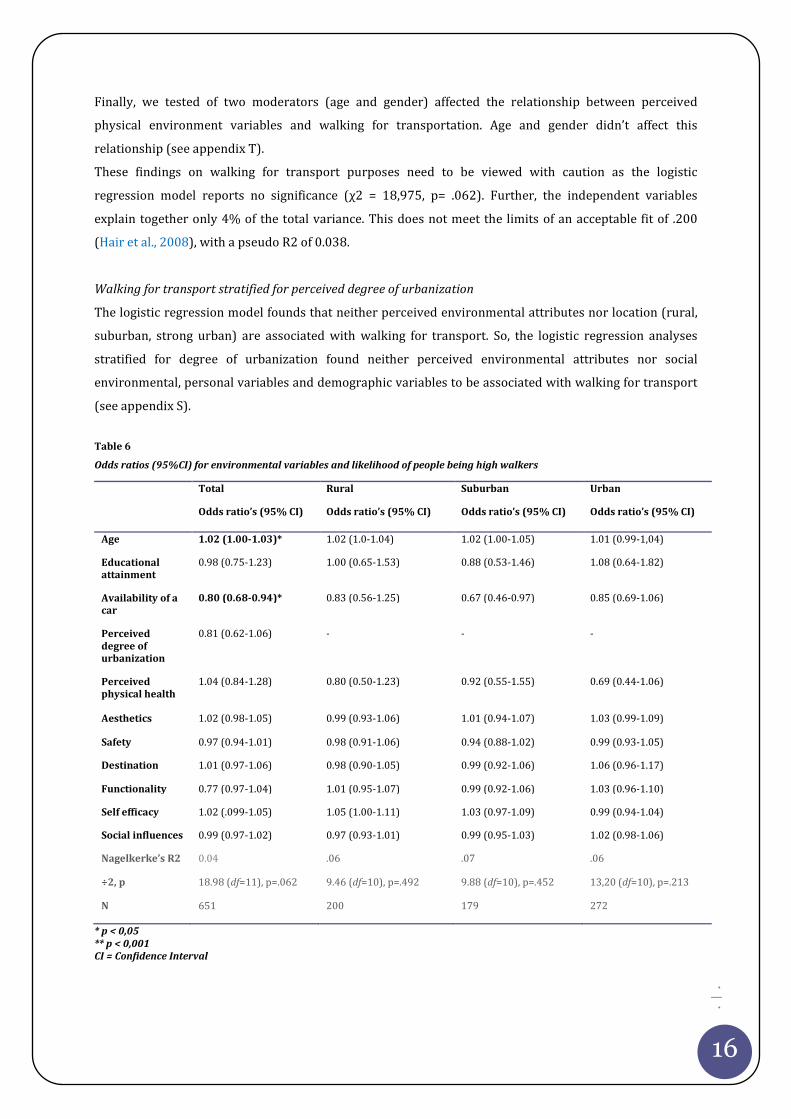
These findings on walking for transport purposes need to be viewed with caution as the logistic
regression model reports no significance (χ2 = 18,975, p= .062). Further, the independent variables
explain together only 4% of the total variance. This does not meet the limits of an acceptable fit of .200
(Hair et al., 2008), with a pseudo R2 of 0.038.
Walking for transport stratified for perceived degree of urbanization
The logistic regression model founds that neither perceived environmental attributes nor location (rural,
suburban, strong urban) are associated with walking for transport. So, the logistic regression analyses
stratified for degree of urbanization found neither perceived environmental attributes nor social
environmental, personal variables and demographic variables to be associated with walking for transport
(see appendix S).
Table 6
Odds ratios (95%CI) for environmental variables and likelihood of people being high walkers
* p < 0,05
** p < 0,001
CI = Confidence Interval
Total
Odds ratio’s (95% CI)
Rural
Odds ratio’s (95% CI)
Suburban
Odds ratio’s (95% CI)
Urban
Odds ratio’s (95% CI)
Age 1.02 (1.00-1.03)* 1.02 (1.0-1.04) 1.02 (1.00-1.05) 1.01 (0.99-1,04)
Educational
attainment
0.98 (0.75-1.23) 1.00 (0.65-1.53) 0.88 (0.53-1.46) 1.08 (0.64-1.82)
Availability of a
car
0.80 (0.68-0.94)* 0.83 (0.56-1.25) 0.67 (0.46-0.97) 0.85 (0.69-1.06)
Perceived
degree of
urbanization
0.81 (0.62-1.06) - - -
Perceived
physical health
1.04 (0.84-1.28) 0.80 (0.50-1.23) 0.92 (0.55-1.55) 0.69 (0.44-1.06)
Aesthetics 1.02 (0.98-1.05) 0.99 (0.93-1.06) 1.01 (0.94-1.07) 1.03 (0.99-1.09)
Safety 0.97 (0.94-1.01) 0.98 (0.91-1.06) 0.94 (0.88-1.02) 0.99 (0.93-1.05)
Destination 1.01 (0.97-1.06) 0.98 (0.90-1.05) 0.99 (0.92-1.06) 1.06 (0.96-1.17)
Functionality 0.77 (0.97-1.04) 1.01 (0.95-1.07) 0.99 (0.92-1.06) 1.03 (0.96-1.10)
Self efficacy 1.02 (.099-1.05) 1.05 (1.00-1.11) 1.03 (0.97-1.09) 0.99 (0.94-1.04)
Social influences 0.99 (0.97-1.02) 0.97 (0.93-1.01) 0.99 (0.95-1.03) 1.02 (0.98-1.06)
Nagelkerke’s R2 0.04 .06 .07 .06
÷2, p 18.98 (df=11), p=.062 9.46 (df=10), p=.492 9.88 (df=10), p=.452 13,20 (df=10), p=.213
N 651 200 179 272
17
Discussion
The present study addresses the physical activity level for transport purposes and the influence of the
perceived physical environment on active modes of transport purposes in the Dutch population (17 years
and older).
The reported amount of time spent on cycling and walking for transport purposes by the population in
this study (respectively 170 minutes and 96 minutes weekly on average) is higher than other comparable
studies. Troped et al. (2003) found that English adults spend on average 142 minutes on transport related
physical activity (walking and cycling together) weekly. Van Dyck et al. (2010) conducted a study in a
Belgian population and found on average of 154 minutes walking weekly, including walking for
transportation ànd during leisure time. Humpel et al. (2004) looked at the walking minutes for transport,
and reported an average amount of only 32 minutes of weekly walking to get to and from places by
Australian participants aged > 40.
Participants in our study may have overestimated their total physical activity level. The self reported data
might have been influenced by social desirability. Further, the questionnaire took place in the summer
months. It is more likely that people walk or cycle more for transport in the summer than in the winter
months, due to the better weather circumstances. Further, most respondents in this study had a good or
very good physical general health status (91%) which could also explain the high physical activity level.
The first research question assessed the differences in reported amount of time spent on physical activity
for transport purposes between people living in rural, suburban and strong urban settings. Significant
more people in strong urban regions cycle more minutes per week for transport compared to people in
rural areas. No significant differences exist for walking. This is partly in accordance with the study of
Schutysern and Vienne (2004), where urban residents cycle, but also walk more for transport than people
living in rural or suburban areas.
Ecological models of health behaviour suggest that different environmental attributes may be associated
with different physical activity behaviours. The second research question assessed to what extent there is
an association between the perceived physical environment and cycling for transport and between the
perceived physical environment and walking for transport for people living in a rural, suburban and urban
environment. To date the majority of studies focus on physical active behavior (walking and cycling
together) or on walking for transport alone. Data focusing on the potential determinants of cycling for
transportation are rather scarce.
The key finding of this study is that physical environmental factors are associated with cycling for
transport, whereas physical environmental variables were not related to walking for transport. One
perceived environmental variable (safety) showed a bivariate association with walking for transport, but
in the logistic regression model with age, educational attainment, availability of a car, perceived physical
general health, self efficacy and social influences included, this factor did not contribute significantly with
walking for transport purposes. Neither for rural, nor for suburban and nor for residents living in strong
urban environments. An explanation for this null finding could be that people doesn’t consider walking as
a means of transport. As mentioned before: whereas in most countries the bike has a recreational
function, the bicycle is pre-eminently a means of transport in the Netherlands. Perhaps, people consider a

18
. | .
bicycle as a substitute for a car, but they doesn’t consider walking as an alternative for a car. In line with
our findings for walking for transport purposes, Humpel et al. (2004) also concluded from their study that
no association exists between perceived environmental attributes (accessibility of facilities for walking,
aesthetics, safety, weather) or location (perceiving beach or lake within walking distance) and walking to
get to and from places. Nevertheless, Giles-Corti & Donovan (2002) found that, after adjustment for
demographic variables and motor vehicle ownership, perceiving sidewalks in the neighbourhood, having a
shop with walking distance, and more traffic and busy roads were independently associated with walking
for transport.
It is notable that there is even not a significant relation between self-efficacy and transport related
walking, as self efficacy is documented as a consistent correlate of activity (Sallis & Owen, 2002). Duncan
and Mummery (2005) argues that it is possible that self efficacy does not influence lower intensity
activities such as walking as strongly as it does for higher intensity activities. This may explain its lack of
association in the model examining walking.
In this study, in contrast to walking for transport, three physical environmental factors (functionality,
aesthetics and safety) show statistically significant associations with cycling for transportation. These
associations vary for rural, suburban and urban areas. For residents living in a suburban environment no
physical environmental variables are associated with cycling for transport. However, for rural residents
safety and functionality are associated with cycling. The functional aspect is positively associated with
cycling for transportation: people who find that there is enough space for cycling, the cycling paves are
well maintained, there are shortcuts compared with cars and there are different routes to take, are more
likely to cycle for transport. This finding is congruent with a study of Titze et al (2008). In their study, bike
lane connectivity (‘there are bicycle tracks’; ‘it is possible to take shortcuts with the bicycle compared to
cars’) was positively associated with cycling for transportation. The finding that the functional aspect is
only of influence for cycling for transport for rural residents and not for suburban or urban residents
could be explained by the fact that residents who live in suburban and urban areas perceive their
environment as a highly functional area. This is plausible, because as mentioned before, The Netherlands
have the most cycle tracks of the world, especially in more urbanized areas.
Paradoxically, we found for people living in a rural environment perceived safety was negatively related
to cycling in our study. This counter intuitive relationship could be explained by the fact that those who
spend more time cycling are more aware of a lack of safety (Duncan & Mummory, 2005). This negative
association is in accordance with Humpel et al (2004). The fact that safety did not prove to be an
important influence on cycling for transport for suburban and strong urban residents could be explained
by the participants’ perception of living in a low-crime area.
Our study indicates that for residents living in a strong urbanized environment, aesthetics are associated
with cycling for transport. Those who perceived that they lived in areas with attractive natural and built
features, free from litter with many trees, gardens and green spaces, were more likely to cycle to get to
and from places. This is consistent with previous studies that show the relevance of aesthetically pleasing
environments and physical activity levels. The fact that aesthetics did not prove to be an important
influence on cycling for transport for rural and suburban residents could be explained by the participants’
perception of living all in a highly aesthetical appealing environment. It is possible that there was

19
insufficient variability in perceived environmental characteristics to detect associations with transport
related physical activity.
The third and last research question assessed the moderating role of age and gender in the influence of the
perceived physical environment on walking and cycling for transport. Both age and gender didn’t affect
the (strength of) the relationship between these independent variables and cycling or walking for
transport. In contrast to our study, gender affected the strength of the relationship between the perceived
physical environment variables and cycling in the study of Titze et al. (2008).
Although not the main focus of this study, gender was significantly associated with cycling for residents
living in suburbanized and urbanized areas. The finding that a greater proportion of men than women
were physically active for transport is consistent with other studies (Booth, Owen, Bauman, Clavisi &
Leslie, 2000). This suggests that a stronger emphasis on the needs and interest of women in physical
activity promotion strategies is appropriate. Further, significant positive association of age with cycling
for transport was found as well for rural and suburban residents. It may be that older people perceived
cycling as a more appropriate means of transport. Having high self efficacy was strongly associated with
cycling for transport purposes for people in all types of environment (rural, suburban and strong urban).
Research suggests that self efficacy is important in the initiation and maintenance of physical activity
(Booth et al., 2000; Conner & Norman, 2008). Finally, it is notable that we found a small but significant
negative relationship between social influences and cycling for transport for rural residents. This
association is puzzling because in contrast to our finding, results from Titze et al. (2008) showed that
social support/modeling was positively related with cycling for transport. Similarly, social support from
friends and modeling was positively associated with active transport in a study among Portuguese and
Belgian students (De Bourdeaudhuij, Teixeira, Cardon & Deforche, 2005). It may be that there is some
capitalization on chance, due to multiple testing. Further studies are needed to clarify this issue.
There are several limitations in the present study. First, this study’s cross-sectional design allowed us to
determine whether environmental factors were correlated with activity, but could not be used to
demonstrate that these factors were determinants of transportation activity (i.e. had a causal
relationship). But consistent associations in this and other studies, implies the possibility of a causal
relationship.
Second, we used a self report measure for physical activity which is the most commonly used measure for
assessing physical activity (Maas et al., 2008). Using a self-report measure for physical activity has the
advantage that it is easy to administer and generally acceptable to participants, and can measure a wide
range of values. Yet, self report measures have the disadvantage of incomplete recall and exaggeration of
the amount of activity (due social desirability). In this study we have tried to minimize the disadvantage of
incomplete recall by not simply asking the general amount of minutes that people walk and cycle for
transport purposes. The respondents reported (from a list of ten) the destinations they had visited per
day in the last week, how many minutes the trip took and the transport mode to reach this destination.
Besides, it will not likely that people living in rural environments will exaggerate more or less than people
living in more urbanized environments. So, there will be no bias with relation to degree of urbanization.
Finally, compared to the Dutch population, the sample was more highly educated. Moreover, the
Netherlands have high cycling rates relative to many other countries. These issues may limit the

20
. | .
generalizability of our findings to Netherland and other European countries. On the other hand this study
may provide insights to support cycling in other countries.
The strength of the current study is that it focused on cycling and separately examined walking as active
modes of transport. The reason for this is that different types of active travel behaviours likely have
different determinants, requiring distinct explanatory models (Giles-Corti, Timperio, Bull & Pikora, 2005).
Although the perceived environment had a small, yet significant association with cycling for transport a
recommendation for future studies is the use of both self report as well as objective measurement of the
physical environment. This way, one will be able to analyze whether perceived or objective measures has
the greatest influence of walking and cycling for transportation. The inclusion of objective measures in
future studies would have the advantage of using concrete and absolute measures of the environment,
which could help establish a direct link between physical activity and interventions in the physical
environment to support active living (Lin & Moudon, 2010).
Finally, in order to be able to identify factors of causality, the use of a longitudinal design would be
recommended.
Conclusion
This study indicates that the physical environment can act as a facilitator for a more active lifestyle among
its residents. Although small, the associations identified in this study do add to the body of data on the
influence of perceived environmental attributes on cycling. The differences for rural, suburban and strong
urban residences emphasize that different aspect of the environment may be of differing importance for
different settings. Further this study indicates that different types of physical activity (i.e. walking and
cycling) have different determinants. Promoting a more active lifestyle by improving the physical
environment (safety, aesthetics and functionality) is the key message of this study.
References
Ajzen, I. (2006). Constructing a TPB Questionnaire: Conceptual and Methodological Considerations,
retrieved from: www.people.umass.edu/aizen/pdf/tpb.measurement.pdf
Baranowski, T., Cullen, K.W., Nicklas, T., Thomson, D., Baranowski, J., 2003. Are current health behavior
change models helpful in guiding prevention of weight gain efforts? Obes. Res. 11, S23-S43.
Booth, M.L., Owen, N., Bauman, A. Clavisi, O. & Leslie E. (2000). Social-Cognitive and Perceived
Environment Influences Associated with Physical Activity in Older Australians. Preventive Medicine, 31
(1), 15-22.
Centraal Bureau voor de Statistiek, (2009). Gezondheid, leefstijl gebruik van zorg, retrieved from Centraal
Bureau voor de Statistiek website :
http://statline.cbs.nl/StatWeb/publication/?DM=SLNL&PA=03799&D1=267-271&D2=0-
17&D3=0&D4=a&VW=T
Cerin, E., Leslie, E., du Toit, L., Owen N. & Frank, L.D. (2007). Destinations that matter: associations with
walking for transport, Health & Place, 13, 713-724.

21
Cerin, E., Lesie, E. & Owen, N. (2009). Explaining socio-economic status differences in walking for
transport: an ecological analysis of individual, social and environmental factors, Social Science &
Medicine, 68, 1013-1020.
Conner, M. & Norman, P. (2008). Predicting health Behaviour, Open University Press, Berkshire.
De Bourdeaudhuij, I., Teixeira, P., Cardon, G. & Deforche, B. (2005). Environmental and psychosocial
correlates of physical activity in Portugese and Belgian adults, Public Health Nutrition, 8, 886-895
Dijck, D. van, Cardon, G., Deforche, D., Sallies, J.F., Owen, N. & De Bourdeaudhuij, I. (2010). Neighborhood
SES and walkability are related to physical activity behavior in Belgian adults, Preventive Medicine, 50,
574-579.
Duncan, M. & Mummery, K. (2005). Psychosocial and environmental factors associated with physical
activity among city dwellers in regional Queensland, Preventive Medicine, 40, 363-372.
Forsyth, A., Oakes, J.M., Lee, B., Schmitz, K.H. (2009). The built environment, walking and physical activity:
is the environment more important to some people than others? Transportation Research, Part D 14,
42-49.
Giles-Corti. B. & Donovan, R.J. (2002). The relative influence of individual, social and physical environment
determinants of physical activity, Social Science & Medicine, 54, 1793-1812.
Giles-Corti, B., Timperio, A., Bull, F. & Pikora, T. (2005). Understanding physical activity environmental
correlates: increased specifity for ecological models. Exercise and sport sciences Reviews, 33 (4), 175-
181.
Giles-Corti, B., Kelty, S.F., Zubrick, S.R. & Villanueva, K.P. (2009). Encouraging walking for transport and
physical activity in children and adolescents. How important is the built environment? Sports Medicine,
39 (12), 995-1009.
Hair, J., Black, W., Babin, B., Anderson, R. & Taham, R. (2006). Multivariate Data Analysis, Pearson Prentice
Hall, Upper Saddle River.
Humpel, N., Owen, N., Iverson, D., Leslie, E., Bauman, A. (2004). Perceived environment attributes,
residential location, and walking for particular purposes, American Journal Preventive Medicine, 26 (2),
119-125.
Jacobsen, P.L., Racioppi, F. & Rutters, H. (2009). Who owns the roads? How motorised traffic discourages
walking and bicycling. Injury Prevention, 15, 369-373.
King, A.C., Stokols, D. & Talen, E. (2002). Theoretical approaches to the promotion of physical activity:
forging a transdisciplinary paradigm. American Journal of Preventive Medicine, 23, 15-25.
Lin, L., & Moudon, A.V. (2010). Objective versus subjective measures of the built environment, which are
most effective in capturing associations with walking? Health & Place, 16, 339-348.
Lorenc, T., Brunton, G., Oliver, S., Oliver, K. & Oakley, A. (2008). Attitudes to walking and cycling among
children, young people and parents: a systematic review. Epidemiol Community Health, 62, 852-857.
Maas, J., Verheij, R.A., Spreeuwenberg, P. & Groenewegen, P.P. (2008). Physical activity as a possible
mechanism behind the relationship between green space and health: a multilevel analysis.
BioMedCentral Public Health, 8, 206-219.

22
. | .
Moore, J.B., Jilcott, S.B., Shores, K.A., Evension, K.R., Brownson, R.C. & Novick, L.F. (2010). A qualitative
examination of perceived barriers and facilitators of physical activity for urban and rural youth, Health
Education Research, 25 (2), 355-367.
Pikora T., Giles-Corti, B., Bull, F., Jamrozik, K. & Donovan, R. (2003). Developing a framework for
assessment of the environmental determinants of walking and cycling, Social Science & Medicine, 56,
1693-1703.
RIVM, Kennis en Informatie Punt Milieu & Gezondheid, (2009). Inspiratie voor gezonde mobiliteit,
retrieved from: www.rivm.nl/milieuportaal/dossier/milieuengezondheid.
Sallis, J.F. & Owen, N. (2002). Ecological models of health behavior. In Glanz K, Rimer BK, Lewis FM, eds,
Health Behavior and Health Education: Theory, Research, and Practice, 3rd ed. San Francisco: Jossey-
Bass, 462-484.
Saelens, B.E., Sallis, J.F., Black, J.B. & Chen, D. (2003). Preliminary evaluation of the neighborhood
Environment Walkability Scale and neighborhood walking differences in physical activity. American
Journal of Public Health, 93, 1152-1158.
Schutyser, K. & Vienne, S. (2004). ‘Invloed van omgevingsdeterminanten op fysieke activiteit: een
vergelijking tussen stad, randstad en platteland (Unpublished doctoral dissertation). Retrieved from
University of Gent.
Sherwood, N.E. & Jeffery, R.W. (2000). The behavioural determinants of exercise: implications for physical
activity interventions, Annual Review of Nutrition, 20, 21-44.
Stevens, M., Bakker – van Dijk, A., Greef, M.H.G. de, Lemmink, K.A.P.M & Rispens, P. (2001). A Dutch
translation of a questionnaire assessing self-efficacy in leisure-time physical activity, Journal of aging
and physical activity, 9, 223-232.
Sugiyama,T., Leslie, E., Giles-Corti, B & Owen, N. (2009). Physical activity for recreation or exercise on
neighbourhood streets: associations with perceived environmental attributes. Health & Place, 15,
1058-1063.
Susilo, Y.O. & Maat, K. (2007). The influence of built environment to the trends in commuting journeys in
the Netherlands. Transportation, 34, 589-609.
Titze, S., Stronegger, W.J., Janschitz, S. & Oja, P. (2008). Association of built environment, social
environment and personal factors with bicycling as a mode of transportation among Austrian city
dwellers. Preventive Medicine, 47, 252-259.
Troped, P.J., Saunders, R.P., Pate, R.R., Reininger, B. & Addy, C.L. (2003). Correlates of recreational and
transportation physical activity among adults in New England community, preventive medicine, 37,
304-310.
Verweij, A. (RIVM). (2008). Indeling opleidingsniveau. In: Volksgezondheid Toekomst Verkenning,
Nationaal Kompas Volksgezondheid. Bilthoven: RIVM, <http://www.nationaalkompas.nl> Nationaal
Kompas Volksgezondheid\Bevolking\Scholing en opleiding
Weinstein, A., Feigley, P., Pullen, P., Mann, L. & Redan, L. (1999). Neigbourhood safety and the prevalence
of physical inactivity- selected states 1996. JAMA, 281.
World Health Organization (2002). Physical activity through transport as part of daily activities. Retrieved
from: www.euro.who.int/__data/assets/pdf_file/0011/87572/E75662.pdf

Appendixes
MMMMASTERTHESIS PSYCHOLOASTERTHESIS PSYCHOLOASTERTHESIS PSYCHOLOASTERTHESIS PSYCHOLOGYGYGYGY
M. Bourgondiën MSc.
Studentnumber: 0220795
Nijmegen, January 2011
Supervisors TNO: mw. dr. M. de Goede
mw. drs. T. Hof
Supervisors Twente University: mw. dr. L.M.A. Braakman – Jansen
dhr. dr. M. Pieterse

1
. | .
Content:
APPENDIX A WEB-SURVEY ................................................................................................................................................................ 2
APPENDIX B NORMALITIES DEPENDENT VARIABLE ................................................................................................................... 12
APPENDIX C NORMALITIES INDEPENDENT VARIABLE ............................................................................................................... 13
APPENDIX D ACCESSED DESTINATIONS ....................................................................................................................................... 18
APPENDIX E ANOVA ANALYSES DISTANCE MOST ACCESSED DESTINATIONS .......................................................................... 19
APPENDIX F Χ2 ANALYSES PERCEIVED DEGREE OF URBANIZATION - DEPENDENT VARIABLE ............................................ 21
APPENDIX G ANOVA ANALYSES PERCEIVED DEGREE OF URBANIZATION - DEPENDENT VARIABLE ................................... 22
APPENDIX H Χ2 ANALYSES INDEPENDENT VARIABLES – DEPENDENT VARIABLES............................................................... 23
APPENDIX I Χ2 ANALYSES DEMOGRAPHIC CHARACTERISTICS – DEPENDENT VARIABLES ................................................... 29
APPENDIX J Χ2 ANALYSES DEMOGRAPHIC VARIABLES – PERCEIVED DEGREE OF URBANIZATION ...................................... 35
APPENDIX K Χ2 ANALYSES PERCEIVED DEGREE OF URBANIZATION - PERCEIVED PHYSICAL ENVIRONMENT VARIABLES39
APPENDIX L CORRELATIONS PEARSON ........................................................................................................................................ 43
APPENDIX M CORRELATIONS SPEARMAN .................................................................................................................................... 45
APPENDIX N COLLINEARITY STATISTICS FOR CYCLING AND WALKING FOR TRANSPORT .................................................... 47
APPENDIX O LOGISTIC REGRESSION ANALYSES CYCLING- NOT STRATIFIED ......................................................................... 48
APPENDIX P LOGISTIC REGRESSION ANALYSES CYCLING- STRATIFIED FOR PERCEIVED DEGREE OF URBANIZATION ..... 51
APPENDIX Q LOGISTIC REGRESSION ANALYSES CYCLING (NOT STRATIFIED) – INTERACTION TERM INCLUDED ............ 59
APPENDIX R LOGISTIC REGRESSION WALKING- NOT STRATIFIED ........................................................................................... 61
APPENDIX S LOGISTIC REGRESSION ANALYSES WALKING- STRATIFIED FOR PERCEIVED DEGREE OF URBANIZATION ... 64
APPENDIX T LOGISTIC REGRESSION ANALYSES CYCLING (NOT STRATIFIED) – INTERACTION TERM INCLUDED ............. 72
APPENDIX U- POPULATION DENSITY PER PROVINCE IN THE NETHERLANDS AND ORIGIN RESPONDENTS ........................ 74

2
. | .
Appendix A Web-survey
Dear participant,
This questionnaire is about walking and cycling for transport purposes. You can think about walking and
cycling to go to stores, your work or to visit your family or friends, for example.
This research is conducted in cooperation with TNO and the Twente University. We are interested in the
factors which influence walking an cycling to get from place to place.
The survey takes about twenty minutes. Please fill in the answers as honest and completely as possible:
there are no good or wrong answers. Your individual responses will be treated completely confidentially
and anonymously. By filling out the survey you will be entered into a drawing to win one of the five 50
euro gift cheques.
Thank you for participating.
The following questions are about your direct neighborhood. This means the surrounding within 5 km
from your home. Please circle the answer that best applies to you.
1. What is your postal code?
2. How would you define your neighbourhood? Non urban – slightly urban – moderately urban – highly urban – very highly urban
3. I can do most of my shopping at local stores (< 5 km) Strongly disagree –disagree – slightly disagree – neutral – slightly agree – agree – strongly agree
4. There are many places to go within easy walking or cycling distance of my home (< 5 km) Strongly disagree –disagree – slightly disagree – neutral – slightly agree – agree – strongly agree
5. It is easy to walk to a transit stop (bus, train, tram) from my home Strongly disagree –disagree – slightly disagree – neutral – slightly agree – agree – strongly agree
Please circle the answer that best applies to you.
6. Are you physically able to cycle for 15 minutes? Yes
No
7. Are you physically able to walk for 15 minutes? Yes
No
8. Do you own a bicycle? (Availability of a bicycle for trips in the city?) Yes, a ‘normal’ bicycle
Yes, an electric bicycle
Yes both, a normal and an electric bicycle
No

3
. | .
9. Do you own a car? (Availability of a car for trips in the city) Never
Sometimes
Regular
Always
10. Do you ever walk or cycle to reach a destination? You can think to get from house to the
supermarket, your work or to visit family and friends. Yes
No
Which destinations did you visit last week?* Please indicate your destinations per day.
* when your walk and cycle behavior deviates from the normal behavior (i.e. through illness or holiday),
please take a normal weak to answer the questions below.
11. Which destination(s) did you visit last Monday?
(When visit no destination, please click the button ‘further’) School
Work
Stores / facilities (i.e. supermarket, hairdresser)
Train / bus stop
Family / friends / neighbors
Hotel / restaurant / café / place of entertainment
Park
Gym or fitness facilities (i.e. tennis court, swimming pool)
Health institutes (i.e. general practice, pharmacy/drugstore, hospital)
12. A. How much time did you spend on walking from place to place
on Monday (in minutes)?
B. How much time did you spend to bicycle from place to place
on Monday (in minutes)?
C: How much time did you spend traveling in a train, bus, car, tram
or other kind of vehicle on Monday (in minutes)?
13. Which destination(s) did you visit last Tuesday?
When visit no destination, please click the button ‘further’. School
Work
Stores / facilities (i.e. supermarket, hairdresser)
Train / busstop
Family / friends / neighbors
Hotel / restaurant / café / place of entertainment
Park
Gym or fitness facilities (i.e. tennis court, swimmingpool)
Health institutes (i.e. general practice, pharmacy/drugstore, hospital)
14. A. How much time did you spend on walking from place to place
Tuesday (in minutes)?
B. How much time did you spend to bicycle from place to place
Tuesday (in minutes)?
C: How much time did you spend traveling in a train, bus, car, tram
or other kind of (motor) vehicle Tuesday (in minutes)?

4
. | .
15. Which destination(s) did you visit last Wednesday?
When visit no destination, please click the button ‘further’. School
Work
Stores / facilities (i.e. supermarket, hairdresser)
Train / busstop
Family / friends / neighbors
Hotel / restaurant / café / place of entertainment
Park
Gym or fitness facilities (i.e. tennis court, swimmingpool)
Health institutes (i.e. general practice, pharmacy/drugstore, hospital)
16. A. How much time did you spend on walking from place to place
Wednesday (in minutes)?
B. How much time did you spend to bicycle from place to place
Wednesday (in minutes)?
C: How much time did you spend traveling in a train, bus, car, tram
or other kind of (motor) vehicle Wednesday (in minutes)?
17. Which destination(s) did you visit last Thursday?
When visit no destination, please click the button ‘further’. School
Work
Stores / facilities (i.e. supermarket, hairdresser)
Train / busstop
Family / friends / neighbors
Hotel / restaurant / café / place of entertainment
Park
Gym or fitness facilities (i.e. tennis court, swimmingpool)
Health institutes (i.e. general practice, pharmacy/drugstore, hospital)
18. A. How much time did you spend on walking from place to place
Thursday (in minutes)?
B. How much time did you spend to bicycle from place to place
Thursday (in minutes)?
C: How much time did you spend travelling in a train, bus, car, tram
or other kind of (motor) vehicle Thursday (in minutes)?
19. Which destination(s) did you visit last Friday?
When visit no destination, please click the button ‘further’. School
Work
Stores / facilities (i.e. supermarket, hairdresser)
Train / busstop
Family / friends / neighbors
Hotel / restaurant / café / place of entertainment
Park
Gym or fitness facilities (i.e. tennis court, swimmingpool)
Health institutes (i.e. general practice, pharmacy/drugstore, hospital)
20. A. How much time did you spend on walking from place to place
Friday (in minutes)?
B. How much time did you spend to bicycle from place to place
Friday (in minutes)?
C: How much time did you spend traveling in a train, bus, car, tram
or other kind of (motor) vehicle Friday (in minutes)?

5
. | .
21. Which destination(s) did you visit last Saturday?
When visit no destination, please click the button ‘further’. School
Work
Stores / facilities (i.e. supermarket, hairdresser)
Train / busstop
Family / friends / neighbors
Hotel / restaurant / café / place of entertainment
Park
Gym or fitness facilities (i.e. tennis court, swimmingpool)
Health institutes (i.e. general practice, pharmacy/drugstore, hospital)
22. A. How much time did you spend on walking from place to place
Saturday (in minutes)?
B. How much time did you spend to bicycle from place to place
Saturday (in minutes)?
C: How much time did you spend traveling in a train, bus, car, tram
or other kind of (motor) vehicle Saturday (in minutes)?
23. Which destination(s) did you visit last Sunday?
When visit no destination, please click the button ‘further’. School
Work
Stores / facilities (i.e. supermarket, hairdresser)
Train / busstop
Family / friends / neighbors
Hotel / restaurant / café / place of entertainment
Park
Gym or fitness facilities (i.e. tennis court, swimmingpool)
Health institutes (i.e. general practice, pharmacy/drugstore, hospital)
24. A. How much time did you spend on walking from place to place
Sunday (in minutes)?
B. How much time did you spend to bicycle from place to place
Sunday (in minutes)?
C: How much time did you spend traveling in a train, bus, car, tram
or other kind of (motor) vehicle Sunday (in minutes)?
The most visited destination within your own neighbourhood.
25. To which destination within your own neighbourhood you cycle most often? (one answer
possible). Please circle the category to which this destination belongs. School
Work
Shop / service
Train / bus station
Family / friends
Cafés / restaurants
Park
Sport clubs
Health institution
Other desintation
No any destination: I don’t cycle (within my neighborhood)

6
. | .
26. To which destination within your own neighbourhood you walk most often? (one answer
possible). Please circle the category to which this destination belongs. School
Work
Shop / service
Train / bus station
Family / friends
Cafés / restaurants
Park
Sport clubs
Health institution
Other desintation
No any destination: I don’t cycle (within my neighborhood)
We are going to look to your most frequently accessed destination by bicycle.
You reported that … is the destination to which you most often cycle. Keep this destination in mind for the
following questions.
27. What is the distance in meters from your home to this destination? (1 km = 1000 meter)
Please circle the answer that best applies to you. How easy or difficult is it for you to cycle to this
destination even when…
28. The weather is bad Very difficult - difficult – slightly difficult – neutral – slightly easy – easy – very easy
29. It is very hot outside Very difficult - difficult – slightly difficult – neutral – slightly easy – easy – very easy
30. You are tired Very difficult - difficult – slightly difficult – neutral – slightly easy – easy – very easy
31. You feel you don’t have time Very difficult - difficult – slightly difficult – neutral – slightly easy – easy – very easy
Please circle the answer that best applies to you. Keep the destination in mind to which you most often
cycle.
32. My family, friends and / or colleagues think that I should cycle to this destination Strongly agree – agree – slightly agree – neutral – slightly disagree – disagree – strongly disagree
33. It is expected of me that I cycle to this destination Strongly agree – agree – slightly agree – neutral – slightly disagree – disagree – strongly disagree
34. My family, friends and / or colleagues frequently use cycling for transportation to visit such a
destination Strongly agree – agree – slightly agree – neutral – slightly disagree – disagree – strongly disagree
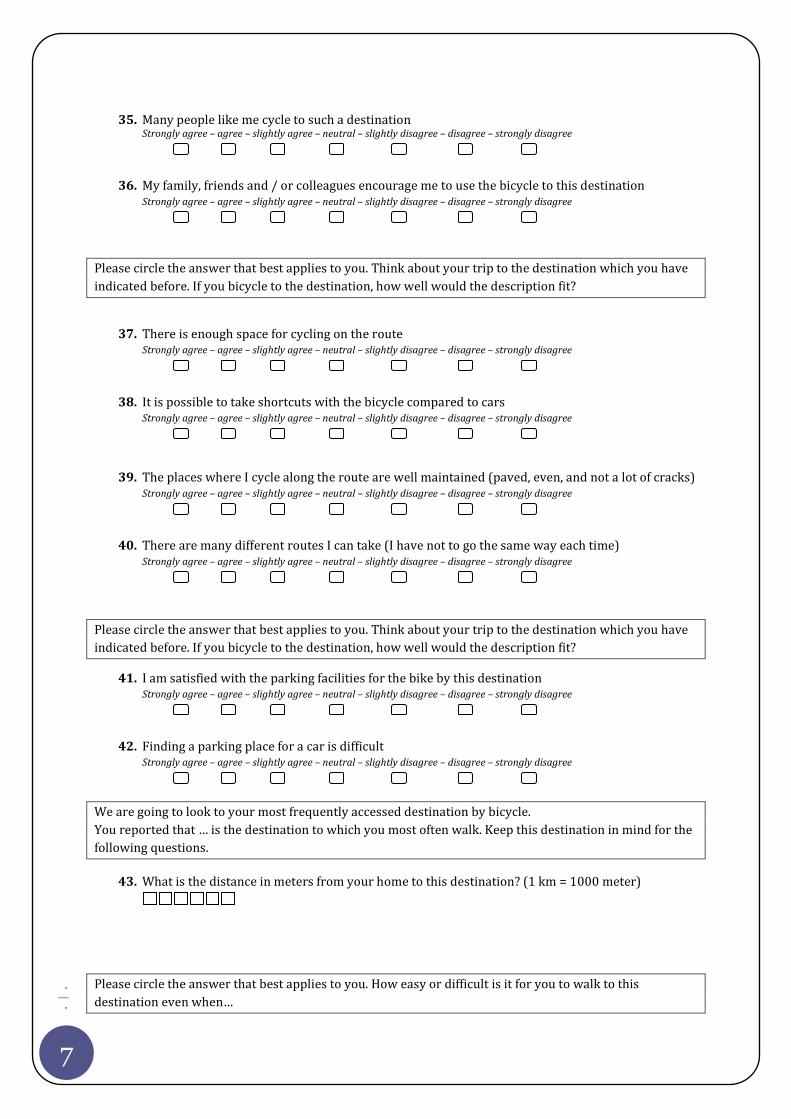
7
. | .
35. Many people like me cycle to such a destination Strongly agree – agree – slightly agree – neutral – slightly disagree – disagree – strongly disagree
36. My family, friends and / or colleagues encourage me to use the bicycle to this destination Strongly agree – agree – slightly agree – neutral – slightly disagree – disagree – strongly disagree
Please circle the answer that best applies to you. Think about your trip to the destination which you have
indicated before. If you bicycle to the destination, how well would the description fit?
37. There is enough space for cycling on the route
Strongly agree – agree – slightly agree – neutral – slightly disagree – disagree – strongly disagree
38. It is possible to take shortcuts with the bicycle compared to cars Strongly agree – agree – slightly agree – neutral – slightly disagree – disagree – strongly disagree
39. The places where I cycle along the route are well maintained (paved, even, and not a lot of cracks) Strongly agree – agree – slightly agree – neutral – slightly disagree – disagree – strongly disagree
40. There are many different routes I can take (I have not to go the same way each time) Strongly agree – agree – slightly agree – neutral – slightly disagree – disagree – strongly disagree
Please circle the answer that best applies to you. Think about your trip to the destination which you have
indicated before. If you bicycle to the destination, how well would the description fit?
41. I am satisfied with the parking facilities for the bike by this destination Strongly agree – agree – slightly agree – neutral – slightly disagree – disagree – strongly disagree
42. Finding a parking place for a car is difficult
Strongly agree – agree – slightly agree – neutral – slightly disagree – disagree – strongly disagree
We are going to look to your most frequently accessed destination by bicycle.
You reported that … is the destination to which you most often walk. Keep this destination in mind for the
following questions.
43. What is the distance in meters from your home to this destination? (1 km = 1000 meter)
Please circle the answer that best applies to you. How easy or difficult is it for you to walk to this
destination even when…

8
. | .
44. The weather is bad Very difficult - difficult – slightly difficult – neutral – slightly easy – easy – very easy
45. It is very hot outside Very difficult - difficult – slightly difficult – neutral – slightly easy – easy – very easy
46. You are tired Very difficult - difficult – slightly difficult – neutral – slightly easy – easy – very easy
47. You feel you don’t have enough time Very difficult - difficult – slightly difficult – neutral – slightly easy – easy – very easy
Please circle the answer that best applies to you. Keep the destination in mind to which you most
often walk.
48. My family, friends and / or colleagues think that I should walk to this destination Strongly agree – agree – slightly agree – neutral – slightly disagree – disagree – strongly disagree
49. It is expected of me that I walk to this destination Strongly agree – agree – slightly agree – neutral – slightly disagree – disagree – strongly disagree
50. My family, friends and / or colleagues frequently walk for transportation to visit such a
destination Strongly agree – agree – slightly agree – neutral – slightly disagree – disagree – strongly disagree
51. Many people like me walk to such a destination Strongly agree – agree – slightly agree – neutral – slightly disagree – disagree – strongly disagree
52. My family, friends and / or colleagues encourage me to walk to this destination Strongly agree – agree – slightly agree – neutral – slightly disagree – disagree – strongly disagree
Please circle the answer that best applies to you. Think about your trip to the destination which you
have indicated before. If you walk to the destination, how well would the description fit?
53. There is enough space for walking on the route Strongly agree – agree – slightly agree – neutral – slightly disagree – disagree – strongly disagree
54. It is possible to take shortcuts walking compared to cars Strongly agree – agree – slightly agree – neutral – slightly disagree – disagree – strongly disagree
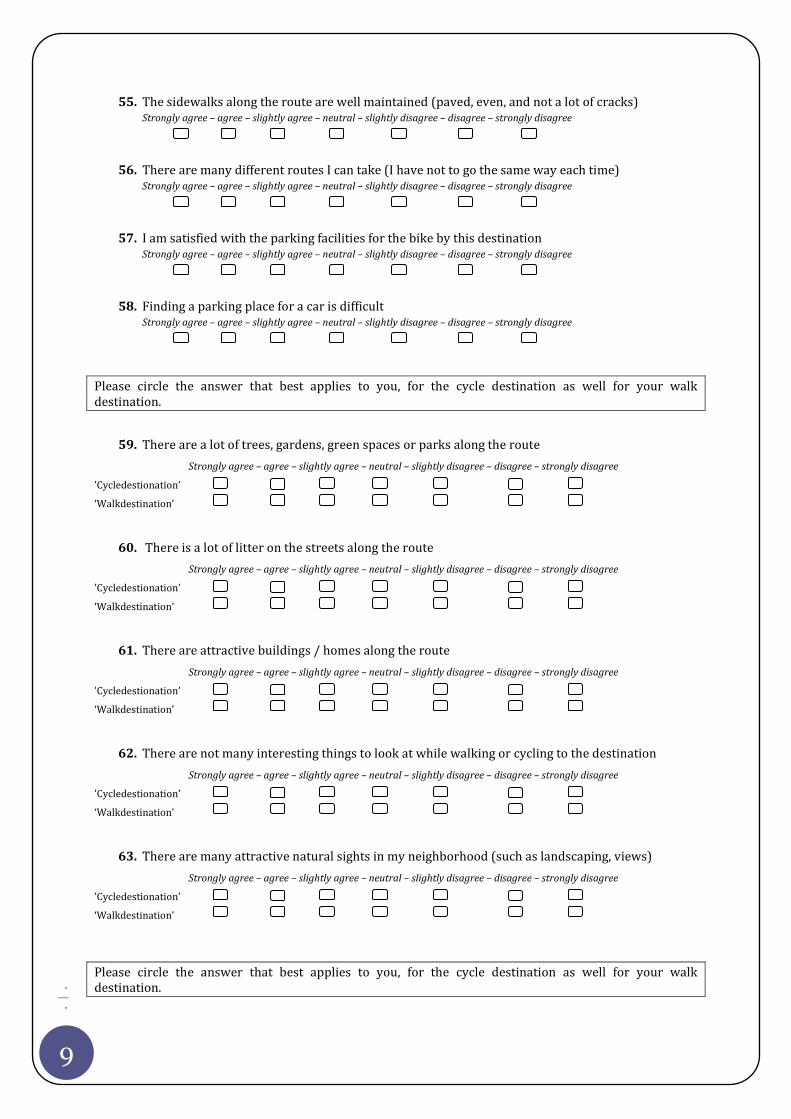
9
. | .
55. The sidewalks along the route are well maintained (paved, even, and not a lot of cracks) Strongly agree – agree – slightly agree – neutral – slightly disagree – disagree – strongly disagree
56. There are many different routes I can take (I have not to go the same way each time) Strongly agree – agree – slightly agree – neutral – slightly disagree – disagree – strongly disagree
57. I am satisfied with the parking facilities for the bike by this destination Strongly agree – agree – slightly agree – neutral – slightly disagree – disagree – strongly disagree
58. Finding a parking place for a car is difficult
Strongly agree – agree – slightly agree – neutral – slightly disagree – disagree – strongly disagree
Please circle the answer that best applies to you, for the cycle destination as well for your walk
destination.
59. There are a lot of trees, gardens, green spaces or parks along the route
Strongly agree – agree – slightly agree – neutral – slightly disagree – disagree – strongly disagree
’Cycledestionation’
‘Walkdestination’
60. There is a lot of litter on the streets along the route
Strongly agree – agree – slightly agree – neutral – slightly disagree – disagree – strongly disagree
’Cycledestionation’
‘Walkdestination’
61. There are attractive buildings / homes along the route
Strongly agree – agree – slightly agree – neutral – slightly disagree – disagree – strongly disagree
’Cycledestionation’
‘Walkdestination’
62. There are not many interesting things to look at while walking or cycling to the destination
Strongly agree – agree – slightly agree – neutral – slightly disagree – disagree – strongly disagree
’Cycledestionation’
‘Walkdestination’
63. There are many attractive natural sights in my neighborhood (such as landscaping, views)
Strongly agree – agree – slightly agree – neutral – slightly disagree – disagree – strongly disagree
’Cycledestionation’
‘Walkdestination’
Please circle the answer that best applies to you, for the cycle destination as well for your walk
destination.
10
. | .
64. Most drivers exceed the posted speed limits while driving in my neighborhood
Strongly agree – agree – slightly agree – neutral – slightly disagree – disagree – strongly disagree
’Cycledestionation’
‘Walkdestination’
65. Crossing busy roads is a big problem along the route
Strongly agree – agree – slightly agree – neutral – slightly disagree – disagree – strongly disagree
’Cycledestionation’
‘Walkdestination’
66. There is so much traffic along the route that it makes it difficult or unpleasant to walk or cycle
Strongly agree – agree – slightly agree – neutral – slightly disagree – disagree – strongly disagree
’Cycledestionation’
‘Walkdestination’
67. The streets along the route are well lit at night
Strongly agree – agree – slightly agree – neutral – slightly disagree – disagree – strongly disagree
’Cycledestionation’
‘Walkdestination’
68. Overall, I feel safe when walking/ cycling along the route
Strongly agree – agree – slightly agree – neutral – slightly disagree – disagree – strongly disagree
’Cycledestionation’
‘Walkdestination’
Finally, some questions about your demographic features. Please circle the answer that best applies to
you.
69. What is your gender?
Male
Female
70. What is your age?
71. What is your residence?
72. What is your heighest completed education?
Geen opleiding
Lager onderwijs
Middelbaar algemeen voortgezet onderwijs (MAVO/VMBO)
Hoger algemeen voortgezet onderwijs (HAVO)
Voorbereidend Wetenschappelijk Onderwijs (VWO)
Lager beroepsonderwijs (LBO)
Middelbaar beroepsonderwijs (MBO)
Hoger Beroepsonderwijs (HBO)
11
. | .
Univeristy
Other, namely
73. In general, my state of health is:
Bad
Moderate
Average
Good
Very good
74. What is your weight (kilograms?)
75. What is your length (in centimeters)?
76. In general, how many days per week are you at least 30 minutes physical
active? Physical active means at least the same effort as walk at a stiff
pace or stiff cycling.
77. Do you have any remarks? Please fill in:
Thanks for your participation
This is the end of the questionnaire. We would like to thank you for your participation.
Please fill in your e-mail address when you would like to have a chance of winning one of the five cheques
to the value of 50 euro. The anonymity will be guaranteed.
E-mail address:

12
. | .
Appendix B Normalities dependent variable
Cycling
Walking

13
. | .
Appendix C Normalities independent variable
Cycling:
Self efficacy cycling
Social influences cycling
Safety cycling
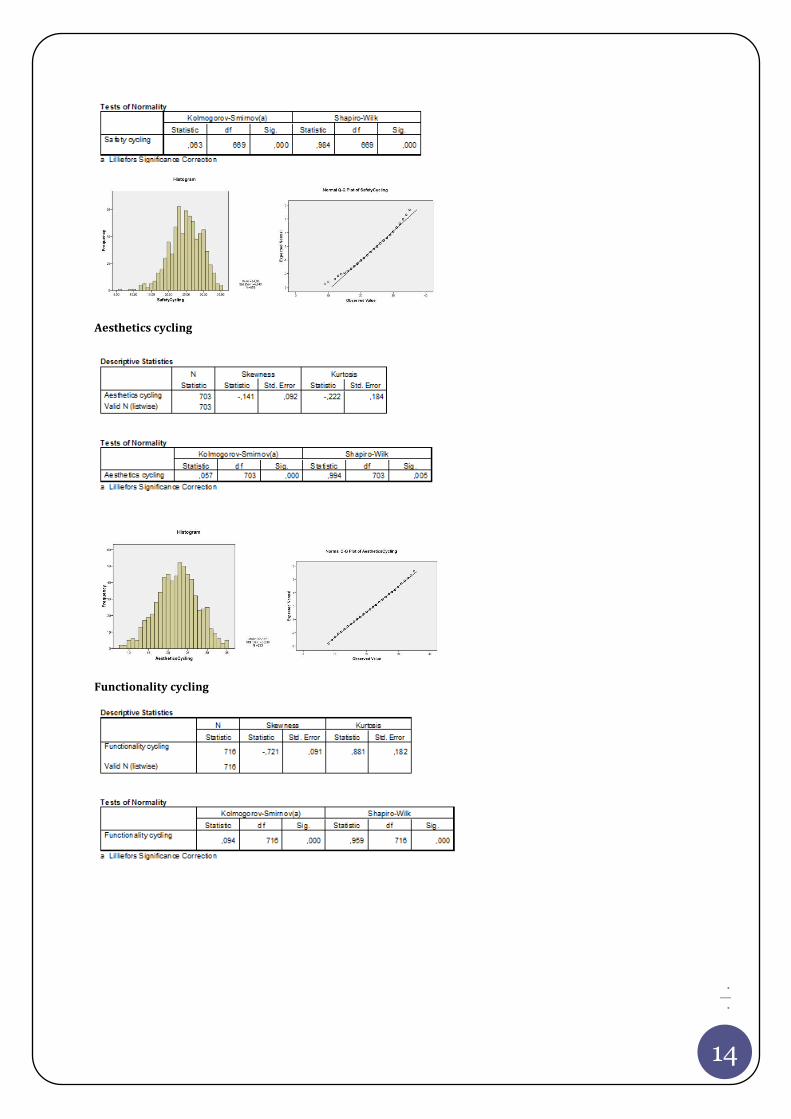
14
. | .
Aesthetics cycling
Functionality cycling

15
. | .
WALKING:
Self efficacy walking
Social influences walking
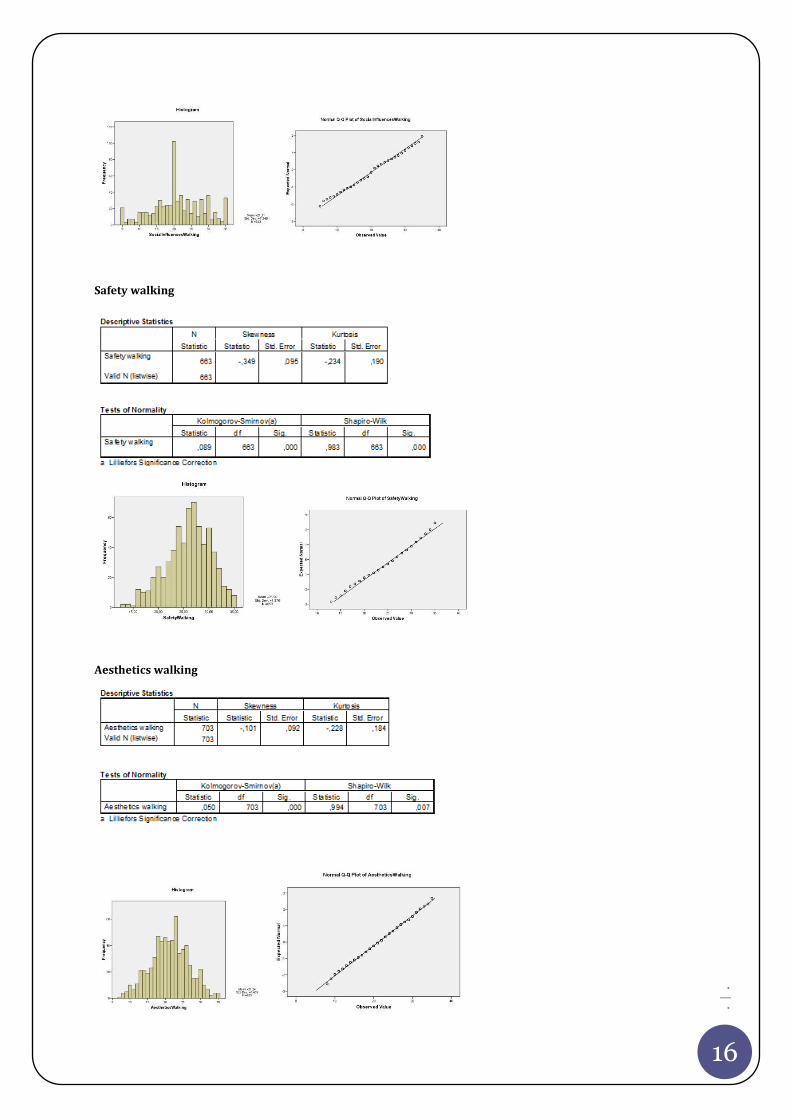
16
. | .
Safety walking
Aesthetics walking

17
. | .
Functionality walking
Destination

18
. | .
Appendix D Accessed Destinations
School
Work
Shop/service
Train / busstation
Family / friends
Café/ restaurant
Park
Sport club
Health institution
Other destination
Rural cycle destinations: Rural walk destinations:
Suburban Cycle destination s: Suburban walk destinations:
Urban Cycle destinations: Urban walk destinations:
Perceived3categorieën: Rural
Perceived3categorieën: Between
Perceived3categorieën: Between
Perceived3categorieën: Urban Perceived3categorieën: Urban

19
. | .
Appendix E Anova analyses distance most accessed destinations
Cycling:
Distance most accessed cycle destination – perceived degree of urbanization (subjective)
Post Hoc Tests
Distance most accessed cycle destination – degree of urbanization (objective)
Post Hoc Tests

20
. | .
Walking:
Distance most accessed walk destination – perceived degree of urbanization
Post hoc test
Distance most accessed walk cycle destination – degree of urbanization (objective)
Post hoc test

21
. | .
Append ix F χ2 anal yses Perceived d egree of u rbaniz ation - Dep endent variable
Cycling:
Walking

22
. | .
Append ix G Anova anal yses Perceived d egree of u rbaniz ation - Depend ent
variabl e
CYCLING:
WALKING:

23
. | .
Append ix H χ2 analyses Ind epend ent variables – Depend ent variables
Cycling:
Self efficacy cycling * cycling
Social influences cycling * cycling

24
. | .
Safety cycling * Cycling
Aesthetics cycling * Cycling

25
. | .
Functionality cycling * Cycling
Destination * Cycling
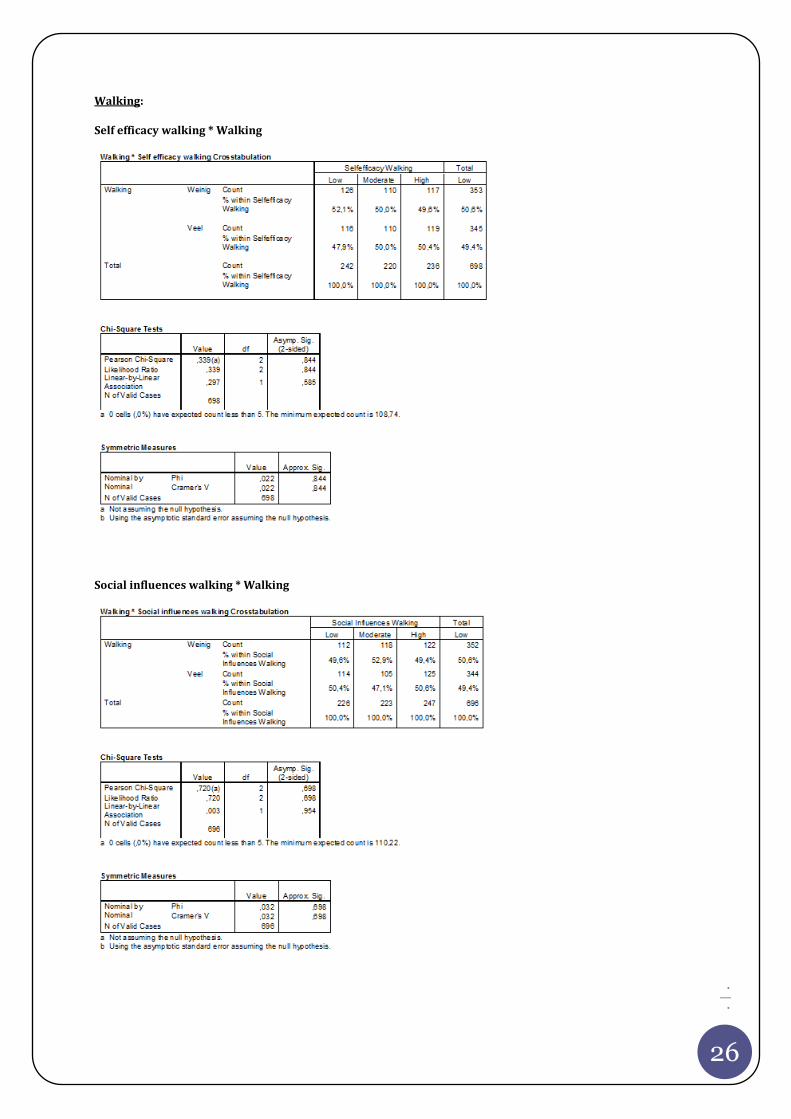
26
. | .
Walking:
Self efficacy walking * Walking
Social influences walking * Walking
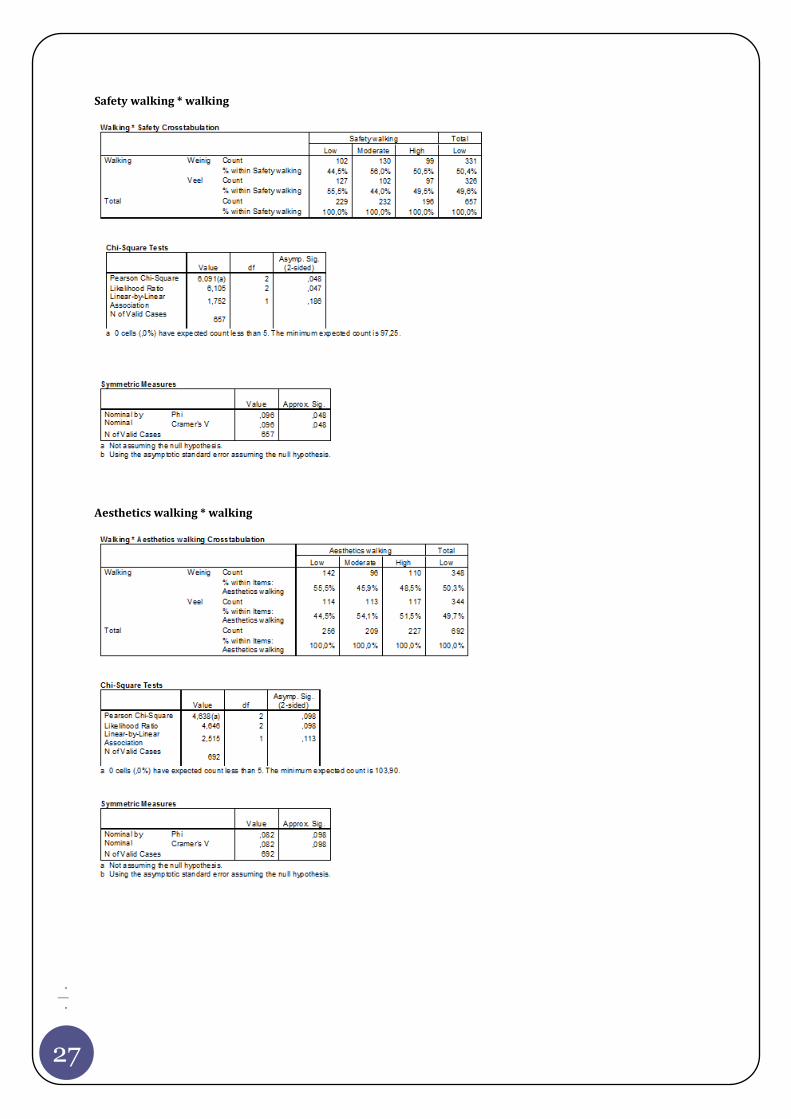
27
. | .
Safety walking * walking
Aesthetics walking * walking

28
. | .
Functionality walking * walking
Destination * walking

29
. | .
Append ix I χ2 analyses Dem ographic ch aracteristics – Depend ent variabl es
Cycling:
Age categories – cycling
Cycling * Age categories Crosstabulation
Gender - cycling

30
. | .
BMI > 25 - cycling
Educational attainment - cycling

31
. | .
Availability of a car – cycling
Perceived general health - cycling
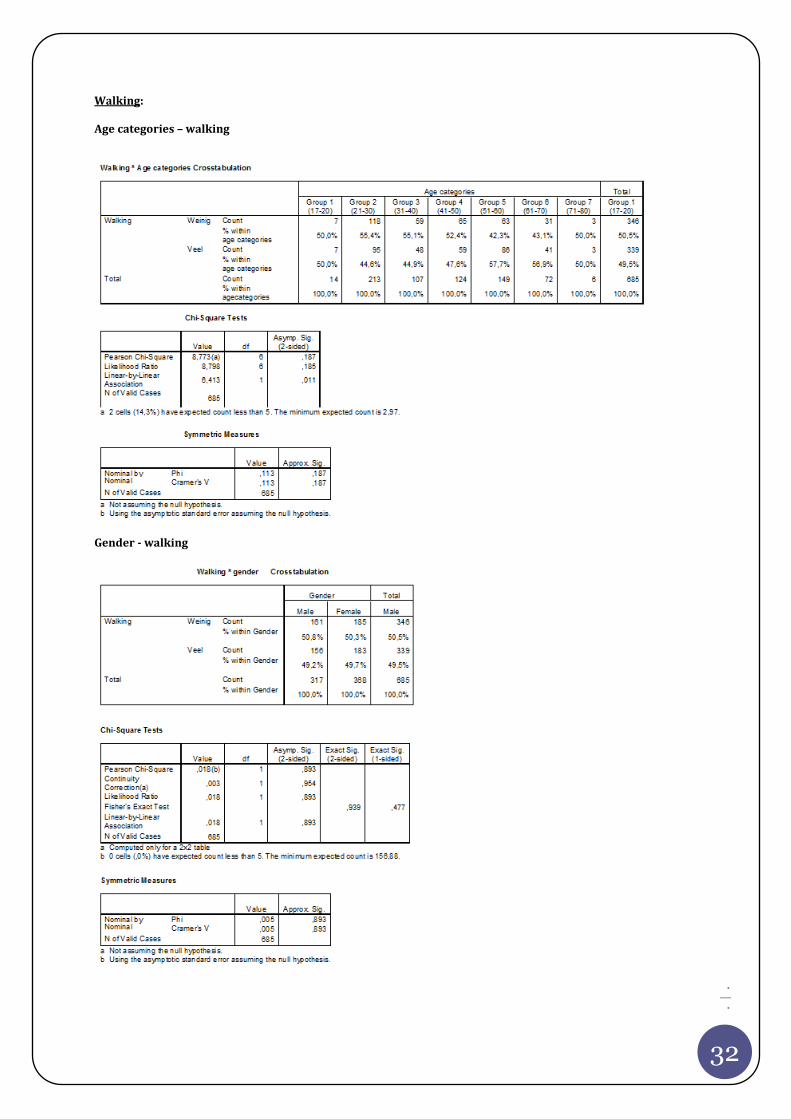
32
. | .
Walking:
Age categories – walking
Gender - walking

33
. | .
BMI > 25 – walking
Educational attainment - walking

34
. | .
Walking * availability of a car:
Perceived general health - walking

35
. | .
Append ix J χ 2 analyses Dem ographic variables – Perceived degree of
urbaniz ation
Age - Perceived degree of urbanization
*Not fulfilling the condition of Cochran
Age (*fulfilling condition of Cochran) – Perceived degree of urbanization

36
. | .
Gender – Perceived degree of urbanization
Educational attainment - Perceived degree of urbanization

37
. | .
BMI > 25 - Perceived degree of urbanization
Availability of a car – Perceived degree of urbanization

38
. | .
Perceived general health status - Perceived degree of urbanization
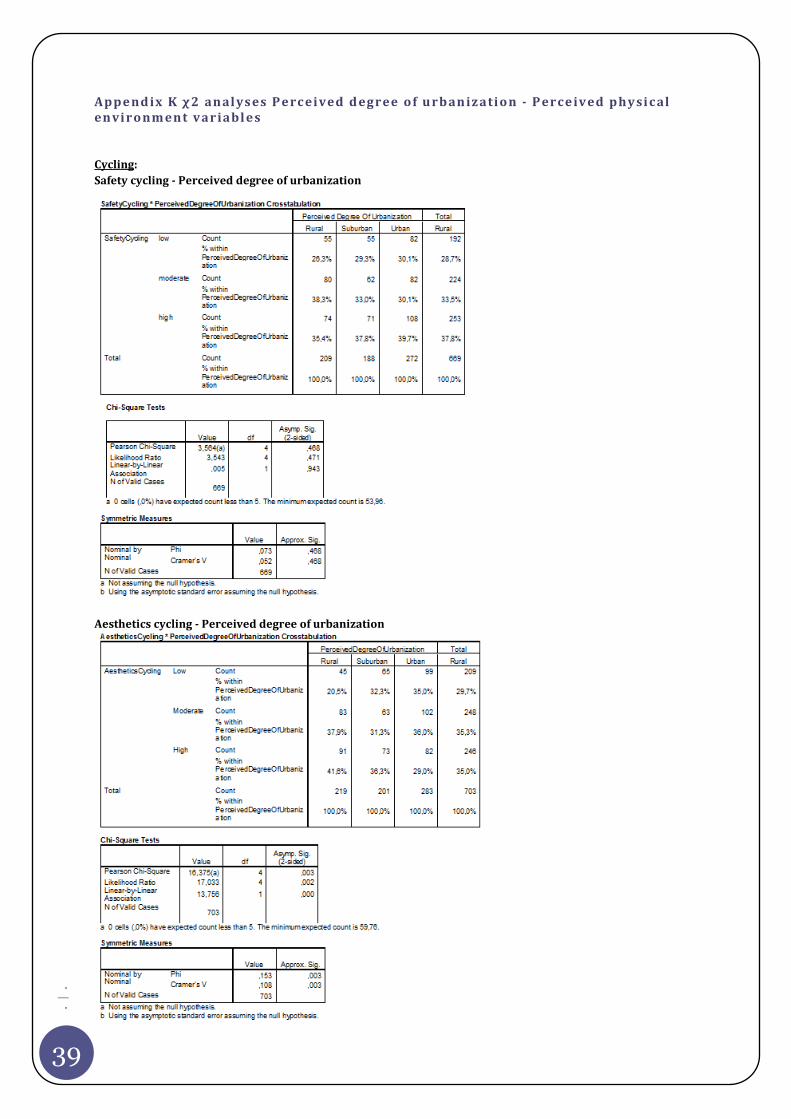
39
. | .
Append ix K χ 2 anal yses Perceived d egree of u rbaniz ation - Perceived physical
environm ent variabl es
Cycling:
Safety cycling - Perceived degree of urbanization
Aesthetics cycling - Perceived degree of urbanization

40
. | .
Functionality cycling - Perceived degree of urbanization
Destination - Perceived degree of urbanization

41
. | .
Walking:
Safety walking - Perceived degree of urbanization
Aesthetics walking - Perceived degree of urbanization

42
. | .
Functionality walking - Perceived degree of urbanization

43
. | .
Append ix L Correl ations Pearson

44
. | .

45
. | .
Append ix M C orrel ations Spearm an

46
. | .

47
. | .
Append ix N C oll inearity statistics for C ycl ing and W al king for transp ort
These results are based on a linear regression, which was performed just to obtain the statistics on
collinearity.
Cycling:
Walking:

48
. | .
Append ix O Logistic Regression Analyses Cycling- not stratif ied
Model for cycling with all variables p.25 included

49
. | .

50
. | .

51
. | .
Append ix P L ogistic Regression Analyses Cycling- stratif ied for p erceived degree
of u rbaniz ation
Model for cycling with all variables p<.25 included, stratified by perceived degree of urbanization
Perceived degree of urbanization = Rural

52
. | .
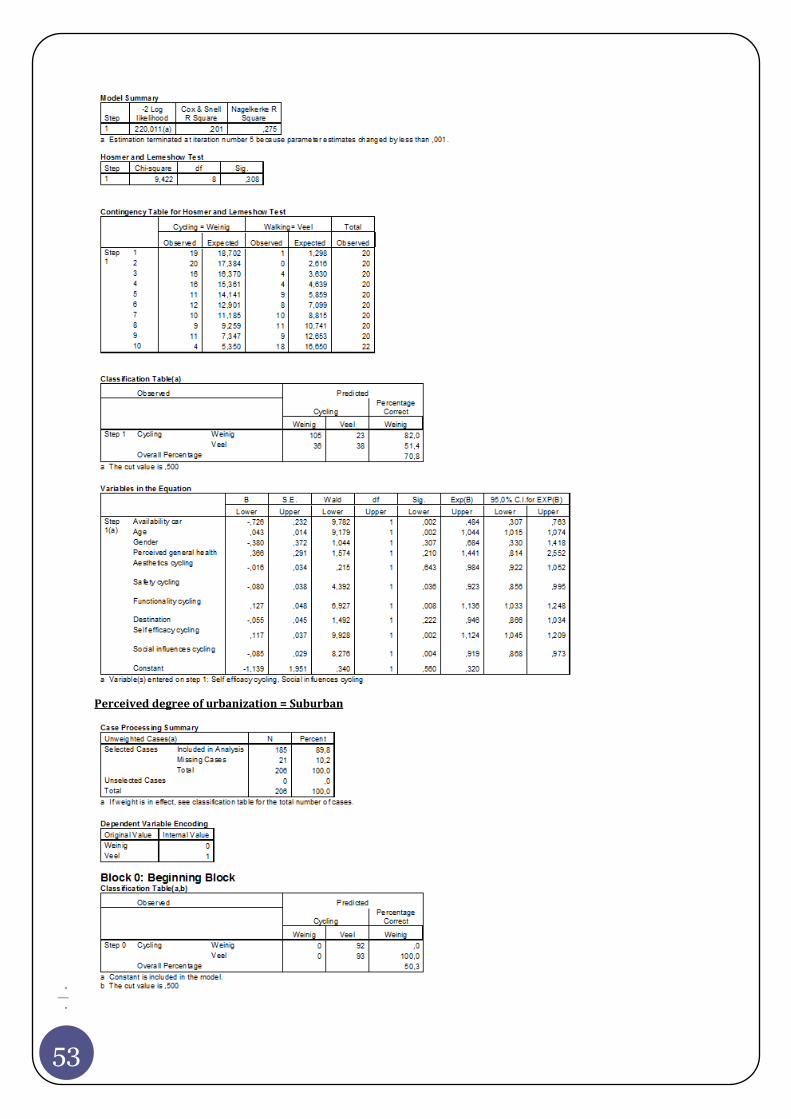
53
. | .
Perceived degree of urbanization = Suburban

54
. | .
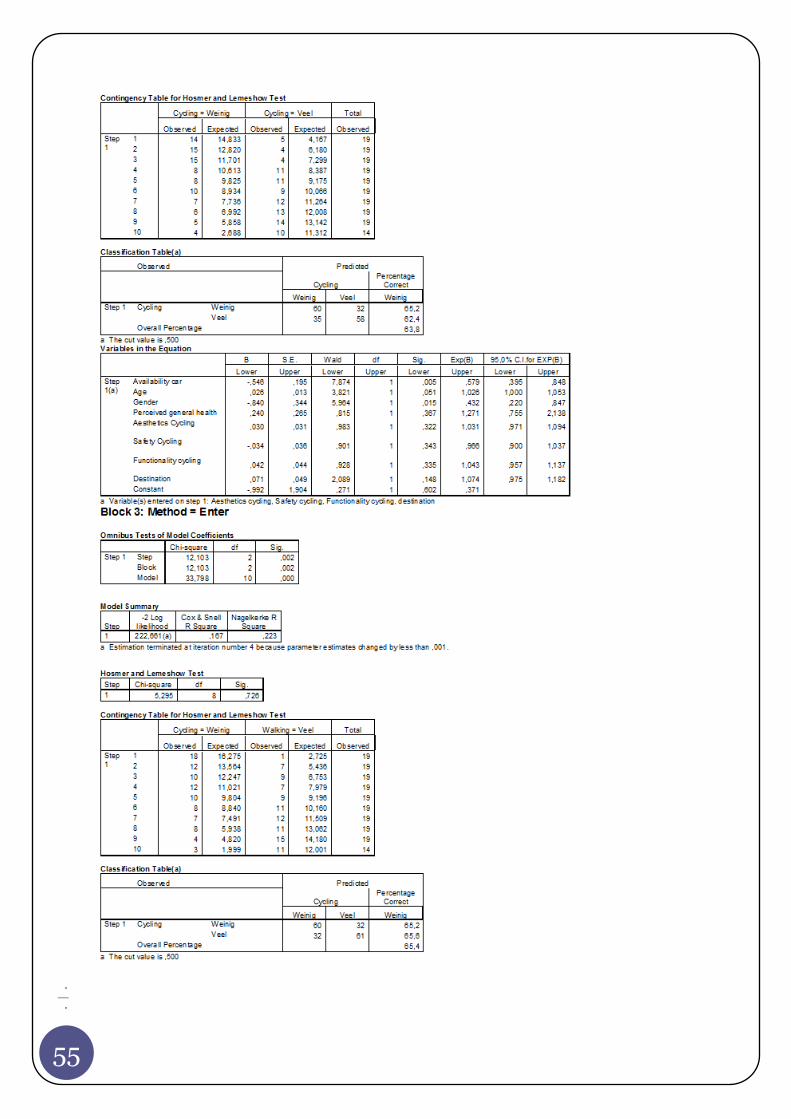
55
. | .

56
. | .
Perceived degree of urbanization = Urban

57
. | .

58
. | .
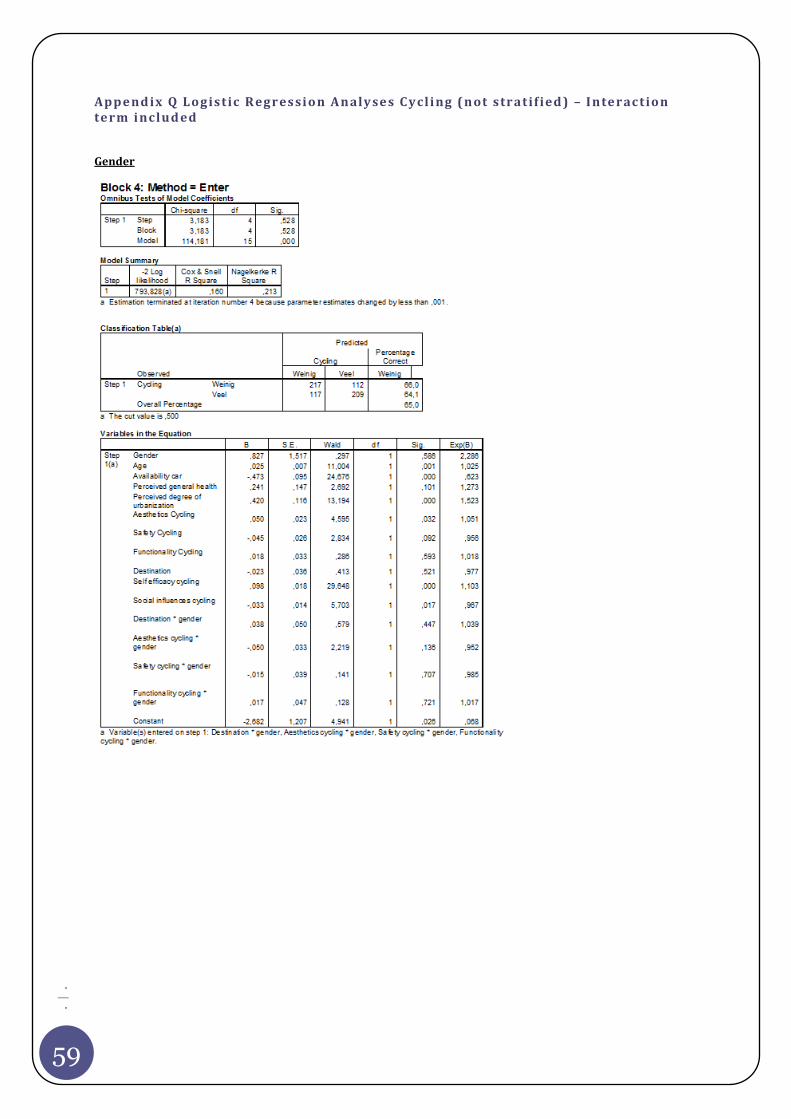
59
. | .
Append ix Q Logistic Regression Analyses Cycling ( not stratif ied ) – Interaction
term includ ed
Gender

60
. | .
Age
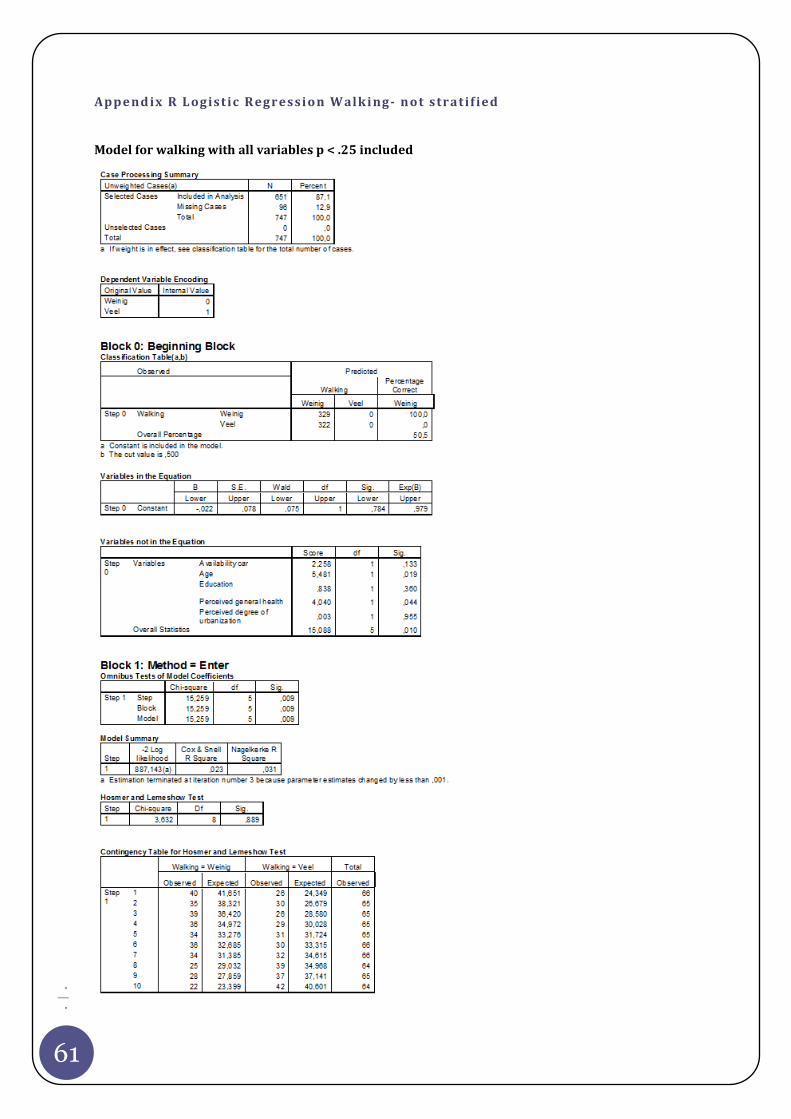
61
. | .
Append ix R L ogistic Regression W alking- not stratif ied
Model for walking with all variables p < .25 included

62
. | .

63
. | .

64
. | .
Append ix S Logistic Regression Analyses W al king- stratif ied for perceived d egree
of u rbaniz ation
Perceived degree of urbanization = Rural

65
. | .
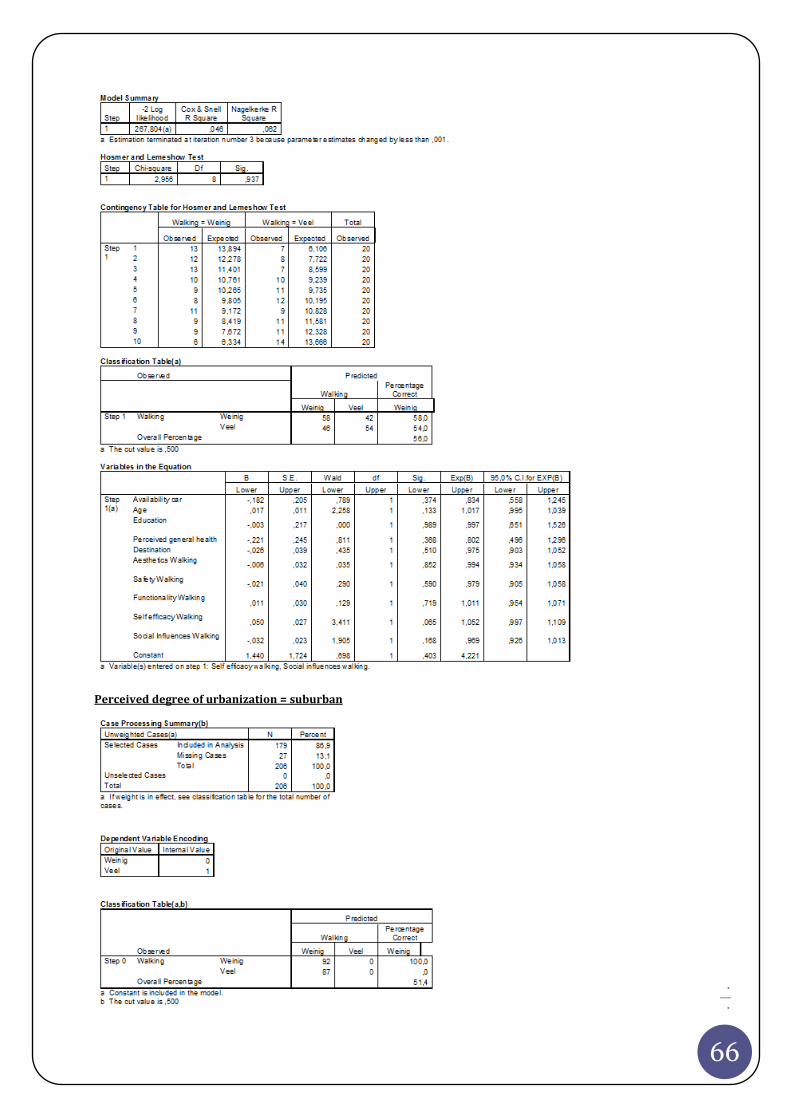
66
. | .
Perceived degree of urbanization = suburban

67
. | .

68
. | .

69
. | .
Perceived degree of urbanization = urban

70
. | .

71
. | .

72
. | .
Append ix T L ogistic Regression Analyses Cycling ( not stratif ied ) – interaction
term includ ed
Gender:

73
. | .
Age:

74
. | .
Append ix U Popul ation d ensity per p rovince in th e Netherl ands and origin
resp ondents
CBS, 2006