Embed Size (px)
Citation preview
Louisiana State UniversityLSU Digital Commons
LSU Doctoral Dissertations Graduate School
2003
Perceived fairness of and satisfaction with employeeperformance appraisalMarie Burns WalshLouisiana State University and Agricultural and Mechanical College, [email protected]
Follow this and additional works at: https://digitalcommons.lsu.edu/gradschool_dissertations
Part of the Human Resources Management Commons
This Dissertation is brought to you for free and open access by the Graduate School at LSU Digital Commons. It has been accepted for inclusion inLSU Doctoral Dissertations by an authorized graduate school editor of LSU Digital Commons. For more information, please [email protected].
Recommended CitationWalsh, Marie Burns, "Perceived fairness of and satisfaction with employee performance appraisal" (2003). LSU Doctoral Dissertations.3380.https://digitalcommons.lsu.edu/gradschool_dissertations/3380
PERCEIVED FAIRNESS OF AND SATISFACTION WITH EMPLOYEE PERFORMANCE APPRAISAL
A Dissertation
Submitted to the Graduate Faculty of the Louisiana State University and
Agricultural and Mechanical College in partial fulfillment of the
requirements for the degree of Doctor of Philosophy
in
The School of Human Resource Education and Workforce Development
by Marie Burns Walsh
B.S., Louisiana State University, 1981 Master of Engineering, Louisiana State University, 1985
December, 2003
ACKNOWLEDGEMENTS My sincere thanks are given to each of my committee members for their participation
in my academic efforts. Through the years I have learned from them and appreciated the
opportunity they have afforded me in pursuing this degree. I am particularly thankful to Dr.
Michael Burnett for his unfailing patience and guidance during the research and preparation
of this dissertation. He shared his love of knowledge and research with me along with his
time to help ensure successful completion of my academic journey.
My family has offered me unconditional love and support through the years that it has
taken me to complete this degree. My children, Catharine, Elizabeth and Matthew, have
endured late meals, countless frozen pizzas and learned the fine arts of housekeeping and
laundry while I attended night classes and worked on my research. I have been blessed with
my husband, Michael, who kept the home-fires burning, drove carpool and attended endless
school activities and sporting events, often without me. I truly cannot express my
appreciation for his love and the complete support that he has unselfishly given to me.
My family and friends have also proved time and again their willingness to lend a
hand when needed. I thank my parents for their constant love and initial encouragement of
my academic pursuits. My sister-in-law, Maud Walsh, also deserves special thanks. She
never failed to volunteer her time to help us out and didn’t flinch when asked to use her
editorial review skills. Finally, I thank our life-long friends, the Frosts. A continuation of
our family, I could not have hoped for better friends during these many years. My heartfelt
gratitude to all of you. I look forward to beginning the next step in the journey.
ii
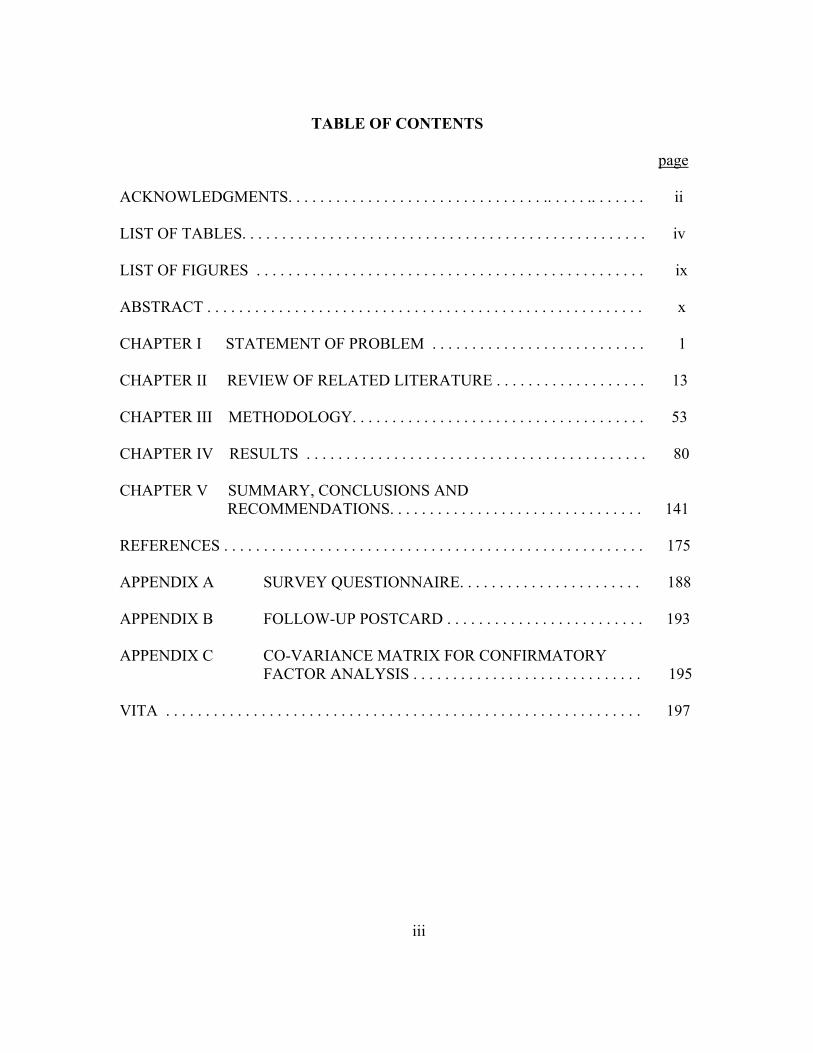
TABLE OF CONTENTS page ACKNOWLEDGMENTS. . . . . . . . . . . . . . . . . . . . . . . . . . . . . . . . .. . . . . .. . . . . . . ii LIST OF TABLES. . . . . . . . . . . . . . . . . . . . . . . . . . . . . . . . . . . . . . . . . . . . . . . . . . . iv LIST OF FIGURES . . . . . . . . . . . . . . . . . . . . . . . . . . . . . . . . . . . . . . . . . . . . . . . . . ix ABSTRACT . . . . . . . . . . . . . . . . . . . . . . . . . . . . . . . . . . . . . . . . . . . . . . . . . . . . . . . x CHAPTER I STATEMENT OF PROBLEM . . . . . . . . . . . . . . . . . . . . . . . . . . . 1 CHAPTER II REVIEW OF RELATED LITERATURE . . . . . . . . . . . . . . . . . . . 13 CHAPTER III METHODOLOGY. . . . . . . . . . . . . . . . . . . . . . . . . . . . . . . . . . . . . 53 CHAPTER IV RESULTS . . . . . . . . . . . . . . . . . . . . . . . . . . . . . . . . . . . . . . . . . . . 80 CHAPTER V SUMMARY, CONCLUSIONS AND
RECOMMENDATIONS. . . . . . . . . . . . . . . . . . . . . . . . . . . . . . . . 141 REFERENCES . . . . . . . . . . . . . . . . . . . . . . . . . . . . . . . . . . . . . . . . . . . . . . . . . . . . . 175 APPENDIX A SURVEY QUESTIONNAIRE. . . . . . . . . . . . . . . . . . . . . . . 188 APPENDIX B FOLLOW-UP POSTCARD . . . . . . . . . . . . . . . . . . . . . . . . . 193 APPENDIX C CO-VARIANCE MATRIX FOR CONFIRMATORY FACTOR ANALYSIS . . . . . . . . . . . . . . . . . . . . . . . . . . . . . 195 VITA . . . . . . . . . . . . . . . . . . . . . . . . . . . . . . . . . . . . . . . . . . . . . . . . . . . . . . . . . . . . 197
iii
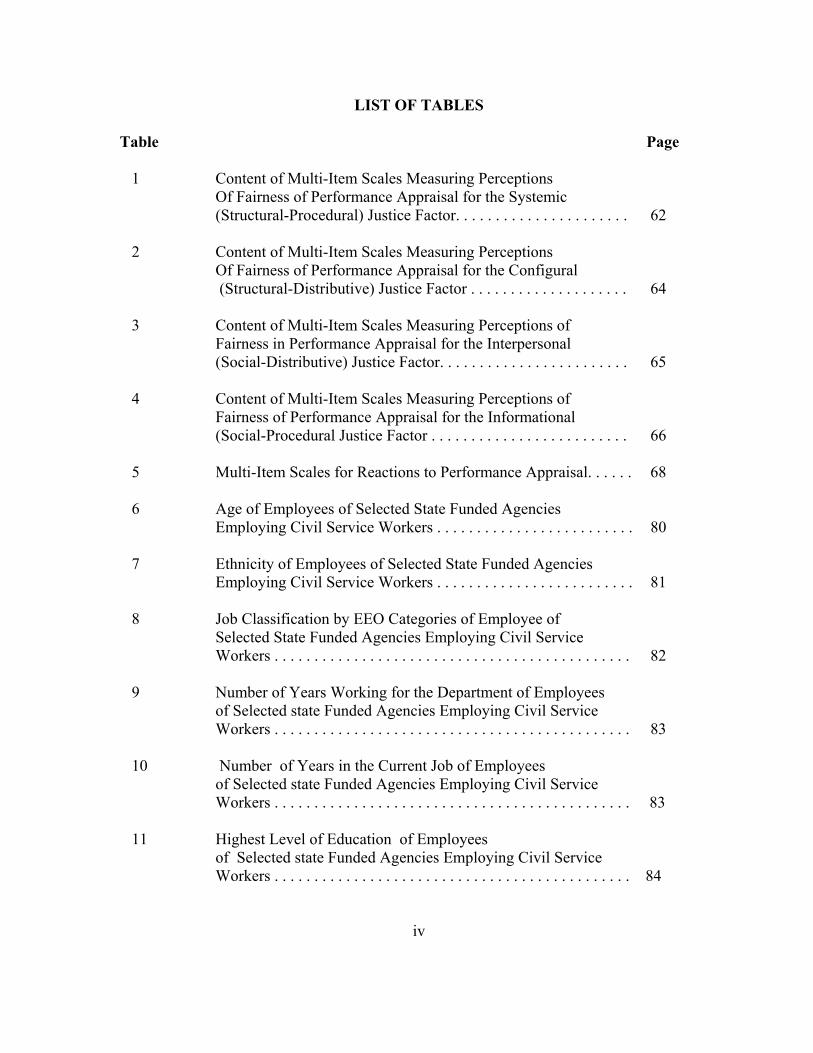
LIST OF TABLES
Table Page
1 Content of Multi-Item Scales Measuring Perceptions Of Fairness of Performance Appraisal for the Systemic (Structural-Procedural) Justice Factor. . . . . . . . . . . . . . . . . . . . . . 62
2 Content of Multi-Item Scales Measuring Perceptions
Of Fairness of Performance Appraisal for the Configural (Structural-Distributive) Justice Factor . . . . . . . . . . . . . . . . . . . . 64
3 Content of Multi-Item Scales Measuring Perceptions of
Fairness in Performance Appraisal for the Interpersonal (Social-Distributive) Justice Factor. . . . . . . . . . . . . . . . . . . . . . . . 65
4 Content of Multi-Item Scales Measuring Perceptions of
Fairness of Performance Appraisal for the Informational (Social-Procedural Justice Factor . . . . . . . . . . . . . . . . . . . . . . . . . 66
5 Multi-Item Scales for Reactions to Performance Appraisal. . . . . . 68
6 Age of Employees of Selected State Funded Agencies
Employing Civil Service Workers . . . . . . . . . . . . . . . . . . . . . . . . . 80
7 Ethnicity of Employees of Selected State Funded Agencies Employing Civil Service Workers . . . . . . . . . . . . . . . . . . . . . . . . . 81
8 Job Classification by EEO Categories of Employee of
Selected State Funded Agencies Employing Civil Service Workers . . . . . . . . . . . . . . . . . . . . . . . . . . . . . . . . . . . . . . . . . . . . . 82
9 Number of Years Working for the Department of Employees
of Selected state Funded Agencies Employing Civil Service Workers . . . . . . . . . . . . . . . . . . . . . . . . . . . . . . . . . . . . . . . . . . . . . 83
10 Number of Years in the Current Job of Employees
of Selected state Funded Agencies Employing Civil Service Workers . . . . . . . . . . . . . . . . . . . . . . . . . . . . . . . . . . . . . . . . . . . . . 83
11 Highest Level of Education of Employees
of Selected state Funded Agencies Employing Civil Service Workers . . . . . . . . . . . . . . . . . . . . . . . . . . . . . . . . . . . . . . . . . . . . . 84
iv
12 Factor Loadings for Items Representing Reactions Toward
Your Last Performance Rating for Employees of Selected State Funded Agencies Employing Civil Service Workers . . . . . 86
13 Summary of Reactions Toward Your Last PPR Performance
Rating Of Employees of Selected State Funded Agencies Employing Civil Service Workers. . . . . . . . . . . . . . . . . . . . . . . . . 87
14 Factor Loading for Items Representing Reactions to the
PPR for Employees of Selected State Agencies Employing Civil Service Workers . . . . . . . . . . . . . . . . . . . . . . . . . . . . . . . . . . 88
15 Summary of Reactions to the PPR of Employees Of Selected
State Funded Agencies Employing Civil Service Workers . . . . . . 89
16 Factor Loading for Items Representing Reactions Toward Your Supervisor of Employees of Selected State Funded Agencies Employing Civil Service Workers . . . . . . . . . . . . . . . . . 90
17 Summary of Reactions Toward Your Supervisor of Employees
of Selected State Funded Agencies Employing Civil Service Workers . . . . . . . . . . . . . . . . . . . . . . . . . . . . . . . . . . . . . . . . . . . . . 91
18 Factor Loading for Items Representing Perceptions of Setting
Expectations of Employees of Selected State Agencies Employing Civil Service Workers. . . . . . . . . . . . . . . . . . . . . . . . . 93
19 Summary of Perceptions of Setting Performance Expectations of Employees of Selected State Funded Agencies Employing
Civil Service Workers . . . . . . . . . . . . . . . . . . . . . . . . . . . . . . . . . . 94
20 Factor Loading for Items Representing Perceptions of Rater Confidence of Employees of Selected State Agencies Employing Civil Service Workers. . . . . . . . . . . . . . . . . . . . . . . . 96
21 Summary of Perceptions of Rater Confidence of Employees
of Selected State Funded Agencies Employing Civil Service Workers . . . . . . . . . . . . . . . . . . . . . . . . . . . . . . . . . . . . . . . . . . . . . 96
22 Factor Loading for Items Representing Perceptions of
Seeking Appeals of Employees of Selected State Agencies Employing Civil Service Workers . . . . . . . . . . . . . . . . . . . . . . . . . 98
v
23 Summary of Items Representing Perceptions of Seeking Appeals of Employees of Selected State Agencies Employing Civil Service Workers. . . . . . . . . . . . . . . . . . . . . . . . . . . . . . . . . . . 98 24 Factor Loading for Items Representing Perceptions of
Clarifying Performance Expectations of Employees of Selected State Agencies Employing Civil Service Workers . . . . 100
25 Summary of Perceptions of Clarifying Performance
Expectations of Employees of Selected State Funded Agencies Employing Civil Service Workers . . . . . . . . . . . . . . . . 101
26 Factor Loading for Items Representing Perceptions of
Providing Feedback of Employees of Selected State Agencies Employing Civil Service Workers. . . . . . . . . . . . . . . . . 103
27 Summary of Perceptions of Providing Feedback of
Employees of Selected State Funded Agencies Employing Civil Service Workers . . . . . . . . . . . . . . . . . . . . . . . . . . . . . . . . . . 104
28 Factor Loading for Items Representing Perceptions of
Explaining Rating Decisions of Employees of Selected State Agencies Employing Civil Service Workers . . . . . . . . . . . . . . . . . 105
29 Summary of Perceptions of Explaining Rating Decisions
of Employees of Selected State Agencies Employing Civil Service Workers . . . . . . . . . . . . . . . . . . . . . . . . . . . . . . . . . . . . . . . 106
30 Factor Loading for Items Representing Perceptions of Accuracy
of Ratings of Employees of Selected State Agencies Employing Civil Service Workers . . . . . . . . . . . . . . . . . . . . . . . . . . . . . . . . . . . 107
31 Summary of Perceptions of Accuracy of Ratings of Employees
of Selected State Agencies Employing Civil Service Workers . . . 108
32 Factor Loading for Items Representing Perceptions of Concern Over Ratings of Employees of Selected State Agencies Employing Civil Service Workers . . . . . . . . . . . . . . . . . . . . . . . . . . 110
33 Summary of Perceptions of Concern Over Ratings of Employees
of Selected State Agencies Employing Civil Service Workers . . . . 111
vi
34 Factor Loading for Items Representing Perceptions of Respect in Supervision of Employees of Selected State Agencies Employing Civil Service Workers . . . . . . . . . . . . . . . . . . . . . . . . . . 112
35 Summary of Perceptions of Respect in Supervision of Employees
of Selected State Agencies Employing Civil Service Workers . . . . 113
36 Factor Loading for Items Representing Perceptions of Sensitivity in Supervision of Employees of Selected State Agencies Employing Civil Service Workers . . . . . . . . . . . . . . . . . . . . . . . . . 114
37 Summary of Perceptions of Sensitivity in Supervision of
Employees of Selected State Agencies Employing Civil Service Workers . . . . . . . . . . . . . . . . . . . . . . . . . . . . . . . . . . . . . . . . . . . . . . 115
38 Summary For Perceptions of Fairness Scales as Applied to
Performance Appraisal by Employees of Selected State Funded Organizations . . . . . . . . . . . . . . . . . . . . . . . . . . . . . . . . . . 116
39 Correlation Coefficients For Perceptions of Fairness in Performance Appraisal and the Independent Variable Age . . . . . . 117
40 t-Test of Means for Respondent’s Perceptions of Fairness of
Performance Appraisal by Gender. . . . . . . . . . . . . . . . . . . . . . . . . 119
41 t-Test of means for Respondent’s Perceptions of Fairness of Performance Appraisal by Race . . . . . . . . . . . . . . . . . . . . . . . . . . . 120
42 Correlation Coefficients of Perceptions of Fairness of
Performance Appraisal with Years in the Department . . . . . . . . . . 121 43 Correlation Coefficient of Perception of Fairness of
Performance Appraisal with Years in the Current Job . . . . . . . . . . . 122
44 Correlation Coefficient of Perception of Fairness of Performance Appraisal with Educational Level . . . . . . . . . . . . . . . . 123
45 Analysis of Variance for Overall Means of Respondent's
Perceptions of Providing Feedback by Educational Level. . . . . . . . . 123
46 Group Mean Comparisons of the Perceptions of Fairness of Performance Appraisal As Measured by “Providing Feedback” Scale Responses by Educational Level of Employees of Publicly Funded Organizations . . . . . . . . . . . . . . . . . . . . . . . . . . . . . . . . . . . 124
vii
47 Analysis of Variance for Overall Means of Respondent's Perceptions of Respect In Supervision by Educational Level. . . . . . . . . . . . . . . 125
48 Group Mean Comparisons of the Perceptions of Fairness of
Performance Appraisal As Measured by “Respect in Supervision” Scale Responses by Educational Level of Employees of Publicly Funded Organizations. . . . . . . . . . . . . . . . . . . . . . . . . . . . . . . . . . . . 125
49 Comparison of the Perceptions of Fairness of the Performance
Appraisal System by the Subscales Representing Justice by Job Classifications. . . . . . . . . . . . . . . . . . . . . . . . . . . . . . . . . . . . . . . . . 126
50 ANOVA for Subscale Means of Respondent’s Perceptions of
Respect in Supervision By Job Classification. . . . . . . . . . . . . . . . . 127
51 Group Mean Comparisons of the Perceptions of Fairness of Performance Appraisal As Measured by “Respect in Supervision” Scale Responses by Job Classification of Employees of Publicly Funded Organizations. . . . . . . . . . . . . . . . . . . . . . . . . . . . . . . . . . 127
52 ANOVA for Subscale Means of Respondent’s Perceptions of
Providing Feedback by Job Classification . . . . . . . . . . . . . . . . . . 128
53 Group Mean Comparisons of the Perceptions of Fairness of Performance Appraisal As Measured by “Providing in Feedback” Scale Responses by Job Classification of Employees of Publicly Funded Organizations . . . . . . . . . . . . . . . . . . . . . . . . 128
54 t-Tests for Means of Respondent’s Perceptions of Fairness of
Performance Appraisal by Supervisor Responsibility. . . . . . . . . . 129
55 Fit Indices for Competing Models of Justice As Applied to Perceptions of Fairness of Performance Appraisal. . . . . . . . . . . . . . 131
56 Comparison of Nested Models of Alternative Factor Structure
For Justice Perceptions Applied to Performance Appraisal. . . . . . . 136
57 B-Values for Structural, Informational and Interpersonal Model Representing Factor Structure of Perceptions of Fairness of Performance Appraisal. . . . . . . . . . . . . . . . . . . . . . . . . . . . . . . . . 137
viii
LIST OF FIGURES
Figure Page
1 Greenberg's (1993b) Taxonomy of Justice Perceptions (in Thurston, 2001). . . . . . . . . . . . . . . . . . . . . . . . . . . . . . . . . . . 37
2 Greenberg's (1993) Taxonomy of Justice Perceptions Applied to Performance Appraisal (Thurston, 2001). . . . . . . . . . 45
3 Description of Competing Models Compared in Nested Confirmatory Factor Analysis. . . . . . . . . . . . . . . . . . . . . . . . . . . 78
ix
ABSTRACT Employee performance appraisal is one of the most commonly used management
tools in the United States. Over 90 percent of large organizations including 75 percent of
state employment systems require some type of annual performance appraisal (Seldon,
Ingraham & Jacobson, 2001). Performance appraisal is one of the most widely researched
areas in industrial/organizational psychology (Murphy & Cleveland, 1993). However, the
traditional research agenda has done little to improve the usefulness of performance appraisal
as a managerial tool.
Recent research has moved away from studies of rater accuracy and psychometric
measures to themes of employee reactions towards performance appraisal as indicators of
system satisfaction and efficacy. Employee perception of fairness of performance appraisal
has been studied as a significant factor in employee acceptance and satisfaction of
performance appraisal.
This study investigated employee reactions to fairness of and satisfaction with an
existing performance appraisal system utilizing a hypothesized four-factor model
(Greenberg, 1993) of organizational justice as the theoretical basis. The underlying
hypothesis was that the conceptualized four-factor model, which differentiated between the
constructs of interactional and procedural justice, would best represent the underlying factor
structure of the data.
Data were obtained via a survey questionnaire from 440 participants from two
organizations that were part of a large public employment system. Ten multi-item scales
x
representing four factors of organizational justice and performance appraisal fairness and
three scales indicating satisfaction were included.
The findings of the study indicated that respondents perceived the performance
appraisal system was to be fair as indicated by their agreement with 9 of the 10 scales used to
measure reactions to fairness. The respondents also indicated their relative satisfaction with
their most recent performance appraisal rating and with their supervisor. Less satisfaction
(although not dissatisfaction) was indicated with the performance appraisal system overall.
The conceptualized four-factor model was not found to represent the underlying
factor structure substantially better than alternative plausible three-factor models. The best
fit three–factor model, however, provided some support for the differentiation between
procedural and interactional organizational justice factors, which is a distinction that has
been debated in the organizational justice literature.
xi
1
CHAPTER 1
STATEMENT OF PROBLEM
Introduction
Employee performance appraisal, whereby a superior evaluates and judges the work
performance of subordinates, is one of the most common management practices utilized in
organizations in the United States. Over 90 percent of large organizations employ some
performance appraisal system and over 75 percent of state employment systems require
annual performance appraisal (Locker & Teel, 1988; Murphy & Cleveland, 1991; Seldon,
Ingraham & Jacobson, 2001). The widespread use of performance appraisal can be
attributed to the belief by many managers and human resource professionals that
performance appraisal is a critically needed tool for effective human resource management
and performance improvement (Longenecker & Goff, 1992). The assumption appears to be
that an effectively designed, implemented, and administered performance appraisal system
can provide the organization, the manager, and the employee with a plethora of benefits
(Cascio, 1987; Coens & Jenkins, 2000).
In spite of its widespread use, or perhaps because of it, the practice of formal
performance appraisal continues to come under considerable scrutiny and criticism.
Performance appraisal is one of the most widely researched areas in industrial/organizational
psychology (Murphy & Cleveland, 1991.) Researchers have developed and practitioners
have implemented various changes to the evaluation criteria, rating instruments, and
appraisal procedures in an effort to improve the accuracy and perceived fairness of the
process (Banks & Murphy, 1985). However, in spite of the attention and resources applied to
2
the practice, dissatisfaction with the process still abounds and systems are often viewed by
employees as inaccurate and unfair (Church, 1985).
Evaluation of Performance Appraisal Efficacy
Widespread frustration and dissatisfaction with performance appraisal has challenged
researchers and practitioners in both the private and public sectors to evaluate the
effectiveness of performance appraisal systems. Evaluation of the success of a performance
appraisal system is recommended as part of the system implementation and management
process. However, comprehensive research of the evaluation of performance appraisal
system in a field setting is scarce. Murphy and Cleveland (1991) advise that problems with
current methods for evaluating performance appraisal systems represent some of the most
practical problems facing practitioners. Traditional approaches to evaluating performance
appraisal systems have not adequately considered the complex personal, interpersonal, and
organizational factors that affect the efficacy of performance appraisal in the organization
setting (Mohrman & Lawler, 1983; Murphy & Cleveland, 1991). A significant amount of
performance appraisal research has focused on the rater and evaluation of rating accuracy,
which is often studied in an isolated context, generally in a laboratory setting. Extensive
research has concentrated on the cognitive processes of the rater and psychometric
measurements of performance appraisal. This research agenda has done little to improve the
usefulness of performance appraisal as a managerial decision-making tool (Banks & Murphy,
1985; Landy & Farr, 1980; Napier & Latham, 1986).
The traditional research themes of rater accuracy, psychometric measures, and
technical considerations have recently been expanded to include organizational acceptance,
employee attitudes toward the organization, and the performance appraisal system and
3
employee satisfaction as key indicators of performance appraisal efficacy (Cleveland &
Murphy, 1992; Murphy & Cleveland, 1991; Tziner, Murphy & Cleveland, 2001). Murphy
and Cleveland (1995) suggested that employee reaction to appraisals is a class of neglected
criteria that should be considered in evaluating the success of a system. Bernardin and
Beatty (1984) also suggested that employee reactions to a performance appraisal system are
usually better indicators of the overall viability of a system than the more narrow
psychometric indices. A performance appraisal system can be psychometrically sound in
design and construction but still wholly ineffective in practice due to resistance or lack of
acceptance on the part of users. Thus, the effectiveness of a system is particularly contingent
on the attitudes of the system users, both raters and ratees (Roberts, 1990).
The literature indicates that there are many factors to consider in the evaluation of
performance appraisal including employee attitudes towards variables such as perceptions of
fairness. Bretz, Milkovich and Read (1992) indicate that the most important performance
appraisal issue faced by organizations is the perceived fairness of the performance review
and the performance appraisal system. Their findings suggested that most employees
perceive their performance appraisal system as neither accurate nor fair. Skarlicki and Folger
(1997) suggest that the appraisal process can become a source of extreme dissatisfaction
when employees believe the system is biased, political, or irrelevant. In general, research
indicates that perceptions of fairness arise from consideration of the outcomes received
(outcome fairness); the procedures used to determine those outcomes (procedural fairness);
and the way in which the decision-making procedures were implemented and explained
(interpersonal fairness) (Smither, 1998). This description of the components of fairness
draws heavily on the research and literature in the area of organizational justice.
4
Fairness in organizations has been studied extensively by researchers in the field of
organizational justice. Organizational justice theory has been applied to many organizational
systems and provides a theoretical basis to explore the complexities of performance appraisal
more thoroughly.
Organizational Justice Theory
Organizational justice may be defined as the study of fairness at work (Byrne &
Cropanzano, 2001). Organizational justice researchers have reached general agreement that
fairness can be divided into two primary types with a third, less clearly defined type often
proposed. The first commonly accepted type of justice is referred to as "distributive" justice.
Distributive justice considers the fairness of the outcomes of a particular decision.
"Procedural" justice, the second type, is generally defined as the fairness of the processed
that lead to the outcome. These two areas form the foundation for the majority of research
conducted in the field in the last twenty years (Byrne & Cropanzano, 2001). Research
indicates that people will accept a certain amount of unfairness in distribution if they
perceive that the process by which the distribution decisions were made is fair. A third type
of justice is often referred to as "interactional" justice. Bies and Moag (1986) defined
interactional justice as the fairness of the interpersonal treatment that one receives at the
hands of an authority figure during enactment of organizational processes and distribution of
outcomes. The interactional justice concept has been included as an interpersonal aspect of
procedural justice and also as a distinct construct along with procedural and distributive
justice (Skarlicki & Folger, 1997).
Greenberg (1993b) emphasized the need to more fully consider the social
determinants of fairness that were not recognized by the prevailing emphasis on the structural
5
aspects of outcome of distributions and procedures. He proposed a taxonomy of justice
classes formed by cross-cutting the two commonly accepted categories of justice, procedural,
and distributive, with two focal determinants, social and structural. The distinction between
social and structural determinants is based on the immediate focus of the just action
(Greenberg, 1993). Structural determinants reflect the situation whereby justice is sought by
focusing on the environmental context in which the event occurs and ensures fairness by
structuring a decision-making context. The social determinants of justice focus on the
treatment of individuals and help ensure fairness by focusing on the interpersonal treatment
one receives. Greenberg's four proposed classes of justice include: systemic (structural-
procedural); configural (structural-distributive); informational (social-procedural); and,
interpersonal (social-distributive).
The concepts of procedural and distributive justice are relatively well accepted in the
study of organizational justice. However, researchers have not agreed on the integration of
the social, interactional, or interpersonal aspects of justice into a commonly accepted model
of organizational justice. Researchers have proposed a variety of models ranging from the
two-factor distributive and procedural factor model excluding interactional type justice to
two and three factor models incorporating interactional justice as part of procedural justice or
as a stand alone component. Greenberg's four-factor model is an additional proposition
which may help researchers and practitioners in sorting through the complex issues of
performance appraisal.
Organizational Justice Theory and Performance Appraisal
Greenberg (1986a) was one of the first to apply organizational justice theory to
performance evaluation. His basic research question focused on what makes a performance
6
appraisal appear to be fair. He investigated if it was what one receives (rating or other
outcome) or how it is decided that makes an appraisal seem fair. Greenberg's (1986) work
supported earlier research by Landy, Barnes, and Murphy (1978) which showed that
employees were more likely to accept an appraisal system and believe that their performance
was rated fairly under certain conditions. Landy and Farr (1980) generalized that a fair
evaluation is one that contains certain procedural elements regardless of the outcomes of the
evaluations themselves.
Folger, Konovsky and Cropanzano (1992) used a "due process" metaphor to extend
the application of justice to performance appraisal. Three essential factors including
adequate notice, fair hearing, and judgment based on evidence were used to describe a
procedurally fair system. Subsequent work by Taylor, Tracy, Renard, Harrison, & Carroll
(1995) showed that the due process model is consistent with the procedural justice theoretical
model.
Other justice research related to performance appraisal has found relationships
between interactional justice and organizational citizenship (Moorman, 1991) and
satisfaction and acceptance of performance appraisal (Roberts & Reed, 1996).
Recent research has attempted to clarify the organizational justice literature and
integrate the various factors related to performance appraisal to more fully explain
employees' perceptions of fairness concerning performance appraisal. Greenberg's (1993)
proposed four-factor model as applied to performance appraisal may be a way to further
evaluate the complex phenomena of performance appraisal. Each of the four categories of
the taxonomy can be used to address a specific aspect of an organization's performance
appraisal system. There is limited research indicating that the four-factor model can represent
7
the perceptions of employees regarding the fairness of performance appraisal (Thurston
2001).
Statement of Problem
Performance appraisal in American organizations remains a widespread and common
practice despite documented criticism of the process by practitioners and researchers alike.
Exhaustive research has been conducted on a range of related topics with limited advances in
the understanding and practice of performance appraisal.
Lack of efficient ways to evaluate performance appraisal systems within
organizations has discouraged advances in theory related to performance appraisal as an
organizational phenomenon. However, studying individual variables has proved so
inadequate at explaining the intricacies of performance appraisal that researchers are
attempting more comprehensive evaluation techniques. Attitudes and perceptions of
performance appraisal by participants within the context of the organization in which the
process operates are now being conducted.
The literature suggests relative agreement regarding the structural and procedural
components of a “well-designed” performance appraisal system. Many organizations have
implemented systems which are based on accepted practices and procedures only to have
them rejected by the users. Clearly there is more to an effective performance appraisal
system than a technically sound rating format and well defined policies and procedures.
There is however, no commonly accepted method or efficient approach to evaluating
the effectiveness or success of a performance appraisal system based on a set of well-defined
variables. Identifying and organizing the most important variables in performance appraisal
has proved to be a challenging task to researchers and practitioners. Fairness however, is one
8
variable that has been indicated to be a key component in the ultimate success of
performance appraisal systems. Evaluating appraisal systems using a theoretical foundation
drawn from organizational justice offers researchers the opportunity to examine how the
fairness of different aspects of performance appraisal may affect the ultimate success of such
organizational systems.
Purpose
The purpose of this study was to measure perceptions of fairness of and satisfaction
with performance appraisal using Greenberg's hypothesized four-factor of organizational
justice as a theoretical framework. Better understanding of the perceptions of the fairness
based on the concepts of systemic, configural, informational, and interpersonal justice of
performance appraisal and related employee reactions to such systems should provide
decision makers with more specific information needed to improve the effectiveness of the
system in achieving organizational goals. Multi-item scales based on the research of
performance appraisal effectiveness and fairness were utilized to measure individuals'
perceptions of the extent to which fair processes and interactions are manifested in an
organization's performance appraisal system.
The second goal of the study was to test the theoretical structure of Greenberg’s four-
factor model of justice using the scales designed to measure perceptions of fair appraisal
practices. The scales were allocated across Greenberg's (1993) taxonomy of justice
perceptions that has been proposed to be a theoretical model that best integrates the various
justice factors into a single model (Thurston, 2001).
The study was conducted in a large state government employment system located in
the southern United States in the spring of 2003. Two separate agencies were selected for the
9
study. Both agencies have used the same performance appraisal process since it was
introduced as a mandatory requirement by the state civil service management division in
1997. The agencies have significantly different missions and work processes and employ
different classifications of employees; one is predominantly technical and scientific with
many professional and clerical positions while the other is a health care provider. The
oversight for the statewide performance appraisal system is maintained by the central civil
service management department but each individual organization is responsible for
implementing the system. The only measurement of the performance appraisal system to this
point has been the determination of the rate of usage of the system.
Research Objectives
The following research objectives will be explored in guiding this researcher in
addressing the research problem:
1. Describe employees of selected publicly funded organizations that utilize a state civil
service employment system on the following selected personal demographic
characteristics:
• Age
• Gender
• Ethnic Group
• Job classification defined by the EEOC Codes
• Length or tenure in the present position (or with the present
organization)
• Highest level of education completed
10
• Whether or not the employee has supervisory responsibility and
functions as a rater in the performance appraisal system.
2. Determine the satisfaction with the performance appraisal system currently being
used as perceived by the employees of selected public funded organizations that
utilize a state civil service system as measured by the reactions to the system, to the
most recent rating and to the rater using the following scales: “Reactions to the
PPR”; “Reactions Toward Your Last PPR Performance Rating” and “Reaction
Toward Your Supervisor.”
3. Determine the fairness and justice of the performance appraisal system currently
being used, as perceived by the employees of selected public funded organizations
that utilize a state civil service employment system, as measured by ten scales
representing factors of organizational justice which were based on Greenberg's four-
factor taxonomy of justice (Thurston, 2001).
4. Determine if a relationship exists between the fairness and justice of the performance
appraisal system currently being used as perceived by the employees of selected
publicly funded organizations that utilize a state civil service employment system
and the following selected personal demographic characteristics:
• Age
• Gender
• Ethnic Group
• Job classification defined according to the EEO codes
• Length or tenure in the present position (or with the present
organization)
11
• Highest level of education completed
5. Compare the fairness and justice of the performance appraisal system currently being
used as perceived by the employees of selected publicly funded organizations that
utilize a state civil service system as measured by the scales organizational justice
based on Greenberg's (1993) four-factor taxonomy of justice by whether or not the
employees report that they have supervisory responsibilities.
The following objectives of the study were established as hypotheses based on the available
performance appraisal and organizational justice literature and Greenberg's 1993 four-factor
taxonomy of organizational justice.
1. The ten scales of organizational justice as applied to performance appraisal will form
four distinct constructs which conform to Greenberg's (1993) four factor taxonomy of
organizational justice with data collected from the employees of selected public
funded organizations that utilize a state civil service employment system and a
standardized performance appraisal system.
2. A positive relationship will exist between the scales measuring configural justice
(structural-distributive form) and satisfaction with the performance appraisal system
currently being used as perceived by employees of selected public funded
organizations that utilize a state civil service employment system as measured by the
scales “Reactions Toward the Most Recent PPR Performance Rating” and “Reactions
to the PPR”.
3. A positive relationship will exist between the scales measuring interpersonal justice
(social-distributive) and satisfaction with the performance appraisal system currently
being used as perceived by the employees of selected public funded organizations that
12
utilize a state civil service employment system as measured by the scale “Reactions
Toward Your Supervisor”.
4. A positive relationship will exist between the scales measuring informational justice
(social-procedural) and satisfaction with the performance appraisal system currently
being used as perceived by the employees of selected publicly funded organizations
that utilize a state civil service employment system as measured by the scale
“Reactions Toward Your Supervisor.”
5. A positive relationship will exist between the scales measuring systemic justice
(structural-procedural form) and satisfaction with the performance appraisal system
currently being used as perceived by the employees of selected publicly funded
organizations that utilize a state civil service employment system as measured by the
scale “Reaction to the PPR”.
13
CHAPTER 2
REVIEW OF RELATED LITERATURE
Introduction
This chapter served as the foundation for the development of this study. An overview
of the extensive historical research related to performance appraisal is presented.
Application of the concepts of organizational justice as a way to understand the dynamics of
performance appraisal and to aid in the evaluation of performance appraisal systems is
addressed.
Definition and Description of Performance Appraisal
Performance appraisal is a process by which a superior evaluates and judges the work
performance of a subordinate. Performance appraisal systems include the processes and
procedures involved in implementing, managing, and communicating the events involved in
performance appraisal. In many cases it is a formal process and is a part of the personnel
management policy.
Numerous organizations employ a formal or informal assessment system that
measures employee performance and contribution (Carroll & Schneier, 1982). Coens and
Jenkins (2000) suggest that performance appraisal is a mandated process in which, for a
specified period of time, all or a group of an employee's work behaviors or traits are
individually rated, judged, or described by a rater and the results are kept by the organization.
Karol (1996) considered performance appraisal to include a communication event scheduled
between a manager and an employee expressly for the purposes of evaluating that employee's
past job performance and discussing relevant areas for future job performance. DeNisi,
Cafferty, and Meglino (1984) indicated that performance appraisal is an exercise in social
14
perception and cognition embedded in an organizational context requiring both formal and
implicit judgment.
A variety of components may be included in the performance appraisal process.
Landy and Farr (1980) presented a model of performance appraisal that included 13
interacting factors: position characteristics, organization characteristics, the purpose of
the rating, the rating process, scale development, the rating instrument, rater and ratee
characteristics, the observation and storage of performance data, the retrieval and judgment
of that performance, analysis of this information, performance description and in the end,
personnel action. According to Mohrman, Resnick-West and Lawler (1989) there are four
activities in the performance appraisal cycle in organizations: 1) defining what performance
is or should be; 2) measuring and evaluating performance; 3) feeding information about that
performance back to the individual; and 4) providing information to other organizational
systems that use it. Latham and Wexley (1981) listed similar requisite components but
added a review of legal requirements, development of an appraisal instrument, selection and
training of observers, and praise or reward for performance.
Regardless of the definition or the specific components included, performance
appraisal in most organizations is formal, structured, and required. The process is generally
defined to include an interview between the rater and the ratee as well as performance
documentation required by the formal evaluation system. One descriptor left out of most
definitions is that performance appraisal is often dreaded by participants. Folger and Lewis
(1993) suggest that performance appraisals typically engender the same degree of enthusiasm
as paying taxes.
15
Performance Appraisal in American Organizations
The importance of the performance appraisal process or system is underscored by the
sheer number of U.S. organizations utilizing the process in one form or another. The number
of businesses conducting formal performance appraisal has steadily increased throughout this
century. Surveys indicate that between 74 to 89% of firms conduct formal performance
appraisals (Murphy & Cleveland, 1991). A 1987 survey of more than 300 organizations
belonging to the Personnel and Industrial Relations Association of Southern California
examined appraisal trends in private industry and compared the results with those of a similar
survey conducted in 1977. Results showed that 94 percent of organizations had formal
appraisal systems, as compared with 89 percent in 1977. In both years appraisals were most
often used to make salary decisions, to improve individual performance, and to provide
feedback to employees (Locker & Teel, 1988).
This percentage is similar for public organizations as well. A recent survey of human
resource professionals in state governments indicated that over 75% of the state employment
systems required an annual formal appraisal. Eleven states actually required supervisors to
evaluate their staff twice a year and several utilized a process, which includes a series of
planned meetings (Roberts, 1995). Only Rhode Island reported no required performance
appraisal system (Seldon, Ingraham, & Jacobson, 2001).
Another study by England and Pearle (1987) of non-managerial performance
appraisal systems in the municipal public sectors found that 86 percent of 142 municipal
governments appraised their employee's performance on an annual basis.
The results of a major survey distributed in 1998 to members of the International
Personnel Management Association (IPMA) and American Society for Public Administration
16
suggested that the current and future importance of performance appraisal in the public sector
will not diminish. The intent of the survey, conducted in 1998, was to gauge the respondent's
perceptions on the relative importance of various personnel techniques, activities and values.
Respondents predicted that the widespread use of performance appraisal will continue,
ranking it first in importance among human resource management issues at the time of the
survey and in future years (Hays and Kearny, 2001).
Dissatisfaction with Performance Appraisal
In spite of the current ubiquitous use of performance appraisal systems and its
perceived importance in the future there is considerable contention over its efficacy and
usefulness. Surveys through the years have indicated relative lack of satisfaction towards the
effectiveness of performance appraisal systems in both private and public organizations.
Bricker (1992) reported survey results indicating that just 20 percent of American companies
were very satisfied with their performance review process. A 1990 Industry Week survey of
readers indicated that only 18 percent responding that their reviews were very effective. This
was down from 20 percent in 1987. Thirty-one percent of the respondents found reviews to
be not very effective or a waste of time (Verespej, 1990). A Wyatt Company survey of 900
companies found that only ten percent of companies indicated satisfaction with their
employee evaluation programs (Small Business Report, 1993). Thirty percent were
dissatisfied and 60 percent were not convinced one way or another. A 1997 nationwide
survey of human resource professionals by the Society for Human Resource Management
found that only five percent of the respondents were very satisfied with their organization’s
performance evaluation system and that 42 percent were dissatisfied to some extent (Barrier,
1998).
17
It should be noted that most of these figures were obtained from surveys often
completed by human resource professionals and other organizational managers and do not
reflect any rigorous evaluation of performance appraisal processes or systems.
Overview of Past Research and Literature
The amount of research regarding performance appraisal is vast. However, the
limitation of much of this research to the advancement of the understanding or practice of
performance appraisal is generally acknowledged (Latham & Lee, 1986; Murphy &
Cleveland, 1991). Prior to the early 1980's the majority of theoretical and empirical studies
focused on improving the psychometric characteristics of the rating instrument in an effort to
reduce the subjectivity inherent in performance ratings (Feldman, 1981). Due in part to the
emphasis on psychometric aspects, the development of a “better” rating scale format that was
valid and reliable received a great deal of attention (Woehr & Miller, 1997). Research
focusing on rating scale format and development peaked in the 1960’s and 1970’s with the
development of several new formats including the Behavioral Observation Scale (BOS), the
Behaviorally Anchored Rating Scale (BARS) and the Mixed Standard Scale. Other popular
and related research topics included training raters to reduce rating errors and improve
observational skills and developing performance appraisal practices. Research examining the
efficacy of the different rating scales format generally indicated that ratings were not affected
by changes in the rating scale format (Woehr & Miller, 1997). According to Arvey and
Murphy’s (1998) review of the research, there were literally hundreds of studies between
1950 and 1980 on the different types of rating scales; of rating versus ranking; and ways of
achieving ratings that were objective measures of performance.
18
Landy and Farr (1980) published a highly critical and influential review evaluation of
the performance appraisal research. In this review they called for a moratorium on rating
format research and attempted to redirect research to other areas such as understanding the
rater and the process in an organizational context. Landy and Farr (1980) characterized the
abundance of studies in the following categories: “roles” or characteristics of the rater and
rate; the “vehicle” or rating format and form; the context of the rating including its use; and,
and the rating process which dealt with data analysis and rater training.
The influence of Landy and Farr (1980) and Feldman (1981) resulted in a change of
focus away from the rating scale format and rater training to understanding the rater as a
decision maker who processes information and social cues. Research in the 1980’s and early
1990’s focused on raters and the accuracy of ratings and judgments and the application of
knowledge about the judgment process in the development of performance appraisal systems.
According to Ilgen, Barnes-Farrell and McKellin (1993) the “rater process
perspective” includes three critical sets of operations 1) acquisition of information about
those to be evaluated; 2) organization and storage of this information in memory; and 3)
retrieval and integration of the information in a fashion that leads to the recording of an
evaluation of the person being appraised. Researchers borrowed heavily from basic
psychological research in cognitive psychology and social cognition to address the three
process domains described above and to develop theories of the performance appraisal
process (Denisi, 1984; Feldman, 1981, Ilgen & Feldman, 1983).
Other research included ratee and rater characteristics such as race, gender and
likeability. Rater attributes including race, cognitive style and knowledge of the job to be
rated were examined. Rating scale accuracy continued to be studied and the characteristics
19
of the setting in which appraisal occurs such as the purpose of appraisal, rater training and
other factors were investigated (Ilgen, Barnes-Farrell and McKellin, 1993).
Research on performance rating accuracy and the development of accuracy criteria
was common in the 1980’s. Research focused on common psychometric biases, called rating
errors, such as leniency, central tendency and halo, with the assumption that these implied a
lack of accuracy (Ilgen, Barnes-Farrell, & McKellin, 1993). It was assumed that decreasing
the biases increased accuracy. Researchers argued that this assumption was not necessarily
true in that bias-free ratings were not necessarily more accurate (Hulin, 1982; Murphy &
Balzer, 1989; Roch, 1997). Research on accuracy shifted from rater errors to discrepancy
between ratings and some standard of performance.
Research of the performance appraisal process during the 1980’s contributed a
number of key ideas to the literature including a heightened awareness of the importance of
observation in the appraisal process and how knowledge obtained by raters is utilized. The
research of the 1980’s also helped to clarify or correct some assumptions about performance
appraisal such as the belief that rating errors as commonly defined were evidence for rating
errors when in fact the research indicated that there may not be resulting inaccuracies
(Murphy & Balzer, 1989; Smither & Reilly, 1987). Another contribution related to the use of
performance appraisal ratings. The context in which the ratings were obtained and the
beliefs about the use of such rating were found to influence the results. Researchers further
argued that ratings should only be used for those purposes understood by the raters at the
time of the rating (Murphy, Balzer, Kellem & Armstrong, 1984, Zedeck & Cascio, 1982).
Ilgen, Barnes-Farrell and McKellin (1993) acknowledged these contributions but
stated that the overall impact to the improvement of performance appraisal practice had been
20
limited. Like Landy and Farr in 1980, they called for a redirection of research efforts away
from demonstrations of cognitive effects towards the investigation the content of cognitive
variables, the identification of factors that influence these variables and the design of
appraisal systems that incorporate cognitive principles.
More recent research into performance appraisal has emphasized process and
structural characteristics that influence the attitudes and affective reactions of system
participants in addition to psychometric characteristics. Murphy and Cleveland (1991;
Murphy & Cleveland, 1995) suggest that researchers should consider the rating context
before attempting to analyze or evaluate the effectiveness of ratings or rating systems.
Research has included measures of employee attitudes toward performance appraisal and
system acceptance and rater and ratee satisfaction in the appraisal process (Roberts, 1990).
Bernardin and Beatty (1984) suggested that relative measures of the attitudinal kind may
ultimately prove to be better measure and predictors of rating validity than such traditional
psychometric variables as leniency, halo, and discriminability. A performance appraisal
system can be psychometrically sound in design and construction but still wholly ineffective
in practice due to resistance or lack of acceptance on the part of users. Thus, the effectiveness
of a system is particularly contingent on the attitudes of the system users, both raters and
ratees (Roberts, 1990).
Bretz, Mikovich, and Read (1992) generalized that research in the late 1980's and
early 1990's was heavily weighted toward cognitive process issues. Ratee and rater personal
characteristics and rating errors and accuracy were also researched. The source of appraisal,
appraisal feedback mechanisms, rater training, and performance appraisal format were found
to be studied frequently.
21
Other empirical research has focused on the performance appraisal process and the
factors that influence the communication and behaviors exhibited by the raters and ratees
during evaluation. Most of these studies are in experimental settings and not in the field
(Karol, 1996).
While theoretical research on performance appraisal continues to evolve, practical
literature has focused primarily on improving the performance appraisal process, making the
review interview more positive, improving the contribution of the employee to the process,
emphasizing goal-setting and applying procedural improvements (Karol, 1996). Professional
journals are filled with articles discussing performance appraisal practices in various
organizations under varying conditions. Case studies and "how to" articles are common.
Arvey and Murphy (1998) indicate that the literature indicates a substantial gap
between research and practice in performance appraisal. According to these researchers the
gap between research and practice was apparent in the 1989’s when many studies were
conducted in the laboratory and focused on discrete variables of cognitive processing in
appraisal and evaluation.
Much of the past research has focused on the individual as related to the act of
performance appraisal as opposed to performance appraisal as a system within the larger
context of an organization. More recent research has investigated performance appraisal in a
more comprehensive and organizational context.
Approaches to Evaluating Performance Appraisal
Extensive systematic research has not been conducted on the evaluation of the
success or efficacy of new or existing performance appraisal systems in an organizational
context. Evaluation of the success of a performance appraisal system is recommended as part
22
of the system implementation and management process. However, comprehensive research
of the evaluation of performance appraisal system in a field setting is scarce. This may be
due in part to the complex nature of the systems involved and in selecting proper evaluation
criteria. Murphy and Cleveland (1991) advise that the effectiveness of all human resource
systems including performance appraisal need to be evaluated. They indicate that problems
with currently available methods for evaluating performance appraisal systems represent
some of the most pressing problems facing practitioners. Bernardin, Hagan, Kane and
Villanova (1998) also suggest that the practice of evaluating performance is inadequate.
Researchers have identified components that suggest a greater likelihood successful
performance appraisal system than if these same components were absent. Mohrman,
Resnick-West and Lawler (1989) state that the following key items are part of an appraisal
system: Appraisal tools and methods; the degree of fit between other features of the
organization and the appraisal system; the system design; the proper introduction of the
system; and, training of individual system users. The authors state the performance appraisal
process must be designed to match the organization's goals and the type of work that is
performed. They believe that one of the most critical factors in effective performance
appraisal is clearly defining the purpose of the appraisal system. Possibilities include
monetary compensation, career planning, documentation of staffing changes, work load
evaluation, counseling and development and training.
In their description of a complete appraisal system, Mohrman, Resnick-West and
Lawler (1989) include the following components: 1) two performance appraisal cycles that
deal with immediate feedback and long-term career issues; 2) a decision about who defines
performance; 3) how performance will be measured; 4) who will measure performance; and
23
5) what method will be used to gather performance information; and 6) effective feedback
that is timely correctly and delivered by the appropriate person. Appraisals should be timed
so that they coincide with job characteristics and avoid peak periods of activity. The
performance appraisal system needs support from top management to generate the requisite
commitment from middle managers. An appeal process for employees to question or
challenge their evaluation results lends credibility to the appraisal system.
Summary of the scholarship (Bernardin & Beatty, 1984; Landy & Farr, 1983; Latham &
Wexley, 1981; Lawler, Mohrman, & Resnick, 1984; Murphy & Cleveland, 1995) points
towards the following five areas as measures of an efficacious performance appraisal system:
• Determines pay; explains and communicates pay decisions.
• Provides the subordinate with development information and support.
• Fosters mutual task definition and planning of future work goals.
• Documents and recognizes subordinate's performance
• Allows the subordinate to provide feedback about feelings, supervision and definition
of work.
Other variables that may influence performance system effectiveness include the type
of performance standards employed (Bernardin & Beatty, 1984; Landy & Farr, 1983; Latham
& Wexley, 1981; Roberts, 1990), the frequency of evaluation (Bernardin & Beatty, 1984);
the presence of written administrative procedures; and existence of an appeals process
(Cascio & Bernardin, 1981; Greenberg & Tyler, 1987).
Murphy and Cleveland (1991) state that when the following criteria are met,
performance appraisals are most likely to be perceived by employees as accurate and fair:
24
1) Appraisals are conducted frequently;
2) There is a formal system of appraisal;
3) Supervisors have a high degree of job knowledge;
4) Ratees have an opportunity to appeal ratings;
5) Performance dimensions are seen to be highly relevant;
6) Action plans are formed for dealing with present weaknesses; and
7) The organizational climate is cooperative rather than competitive.
Martin and Bartol (1998) discuss the need to monitor a performance appraisal system
to keep it responsive to the needs of the organization. The major actions required to maintain
a performance appraisal system include three major categories: controlling the system;
monitoring the system; and furnishing feedback to those who use the system. Control of the
system includes the more technical aspects of the system such as rating techniques, rating
periods, rater training, and development of performance standards. Monitoring the system
can include a review of the quality of performance standards; evaluation of the actual
conduct of the appraisal process and interview; and, analysis of the intended, perceived and
actual use of the system. Other factors in monitoring the system include review of the actual
quality of ratings to check for rater biases, inconsistencies, rating inflation and investigation
for any adverse impact as a result of the system. The third primary area to monitor is that of
the amount and quality of feedback generated as part of the performance appraisal process.
Murphy and Cleveland (1991) maintain that the psychometric indices and rater error
measures most often used to evaluate ratings are not adequate criteria for evaluation of
performance appraisal system. As an alternative they suggest: 1) developing information on
employees from a variety of sources and maintaining adequate performance documentation
25
for review; 2) developing methods for measuring the accuracy of ratings 3) determine the
aspects of accuracy that are most relevant to the various uses of performance appraisal; 4)
determining the conditions under which so-called rater errors are beneficial versus harmful;
5) developing practical methods for establishing indifference curves among qualitatively
different outcomes of appraisal; 6) developing methods for monitoring changes in the value
of an organization's members that will necessitate changes in the appraisal system; 7)
determining whether reaction criteria are important and 8) determining whether utility
estimates provide useful and credible information.
In the book Performance Appraisal on the Line, DeVries, Morrison, Schullman and
Gerlach (1984) make the case for evaluating performance appraisal systems based on a ratio
of cost to potential outcomes. Costs include that of system development, system introduction
and system maintenance. Major outcomes include meeting the intended goals of the system
and achieving organizational acceptance. One of the most difficult aspects of assessing (or
creating) a performance appraisal system is to identify a finite set of appropriate goals for the
system. They also state the need for informed participants at all levels throughout the
organization to know why and how they are to do performance appraisal.
Mohrman and Lawler (1983) suggest that researchers should concentrate on how
performance appraisal systems are perceived by organizational members to improve
performance appraisal accuracy. Further, Mohrman and Lawler (1983) suggest that
organizations examine the uses of performance appraisal information to determine if the uses
and functions are conducive to accurate performance appraisal.
Giles and Mossholder (1990) argue that while the context in which appraisal occurs
has been designated as a source of considerable influence in the appraisal process, relatively
26
little research has been conducted on the environmental issues. The researchers attempted to
extend the development of measures that assess contextual aspects of performance appraisal;
to investigate relationships between system contextual variables and employee reactions to
performance appraisal; and, to assess the extent to which system contextual variables were
related to employee satisfaction. The study confirmed that commonly used reaction scales of
fairness, satisfaction, perceived utility and perceived accuracy did indeed represent appraisal
reactions.
Murphy and Cleveland (1995) referred to employee reaction to appraisals as one class
of neglected criteria that might be considered in evaluating performance appraisal systems.
Bernardin and Beatty (1984) suggested that employee reactions to performance appraisal
systems are usually better indicators of the overall viability of a system than the more narrow
psychometric indices such as leniency and halo.
According to Keeping and Levy (2000) employee reactions toward performance
appraisal may be considered important for a number of reasons. First, reactions are of great
interest to practitioners. Second, while reactions have been theoretically linked to
determinants of performance appraisal success and acceptance they have been overlooked in
the research. These issues are both within the context of the gap between research and
practice that has been noted in the performance appraisal literature by a number of
researchers including Banks and Murphy (1985); Bretz, Mikovich and Read (1992); Ilgen,
Barnes-Farrell and McKellin (1993); and Smither (1998).
Researchers have suggested that reaction to performance appraisal is critical to the
acceptance and use of a performance appraisal system (Bernardin & Beatty, 1984; Cardy &
Dobbins, 1994; Murphy & Cleveland, 1995). Reactions may even contribute to the validity
27
of a system (Ostroff, 1993). Cardy and Dobbins (1994) suggest that “with dissatisfaction and
feelings of unfairness in process and inequity in evaluations, any performance appraisal
system will be doomed to failure” (p. 54). Murphy and Cleveland (1995) stated that
“reaction criteria are almost always relevant, and an unfavorable reaction may doom the
carefully constructed appraisal system” (p. 314).
Tziner, Prince and Murphy (1997) measured political considerations in performance
appraisal to determine the extent to which distortions in ratings were present. Their study
investigated evidence that rating inaccuracy has more to do with deliberate volitional
distortion of ratings than lack of training or ability. Deliberate distortion of ratings includes
raters’ conscious efforts to produce ratings that will achieve personal goals such as avoiding
negative consequences; avoiding confrontations or bad feelings with employees; or
portraying the image of a caring boss.
Tziner and Murphy (1999) studied the attitudes of managers towards performance
appraisal and their organizations. Raters who showed low levels of confidence with the
system were more likely to rate employees unusually high and to fail to discriminate well
among ratees. Raters who showed higher levels of attitudinal commitment or who perceived
more risks associated with distorting ratings tended to give lower ratings and to discriminate
more between raters and/or dimensions.
Keeping and Levy (2000) examined the measurement of performance appraisal
reactions. They investigated how well commonly used reaction scales, representative of
those used in the field, measured the substantial constructs of satisfaction. They found that
these scales did a “favorable” job of measuring appraisal reactions. In addition, they found
that the data also fit a higher order appraisal reactions model. Among the reactions
28
investigated were satisfaction (with the system and session), fairness (procedural and
distributive justice) perceived utility and perceived accuracy.
Tziner, Murphy and Cleveland (2001) reported that attitudes and beliefs toward the
organization and about the appraisal system affect how ratings are done and how feedback is
handled. These attitudes and beliefs have an influence on the accuracy and usefulness of
ratings. Their finding showed that beliefs about the performance appraisal system and rater
orientation toward the system explained tendencies to give higher versus lower ratings and to
discriminate between ratees and rating dimensions.
Thomas and Bretz (1994) conclude that performance appraisal continues to be a
vexing human resource challenge that the academic research world has not adequately
addressed. The focus of academic research on appraisal accuracy, rating errors, or an
understanding of the cognitive processes used in the appraisal process are not considered by
practicing managers to be major organizational concerns. Thomas and Bretz (1994) called
for a transition from laboratory studies into the organizational world but realized the lack of
access to organizational settings continues to hamper research. According to Bretz,
Mikovich and Read (1992) research is only beginning to address how context affects
employees, perception of appraisal, reactions to appraisal, outcomes and how appraisal
purposes (administrative vs. developmental) moderate these relationships. The limited
research considering organizational context has focused on system design and characteristics,
system management, and other important performance appraisal issues including fairness and
justice issues.
29
Fairness in Performance Appraisal
A significant direction of research regarding performance appraisal efficacy and
approaches for evaluation has concentrated on employee satisfaction and perceptions of the
process. This direction has lead researchers and practitioners to take a more comprehensive
view of performance appraisal system efficacy and evaluation of systems which include these
factors. One common theme of recent research is that attitudes of the system's users toward
the process determine to a large degree the ultimate effectiveness of a performance appraisal
system (Roberts, 1990).
Employee perceptions of fairness of performance appraisal have been shown to be
linked to satisfaction with the system. Fairness of performance appraisal has been studied by
a number of researchers over time. In their review of performance appraisal research Bretz,
Mikovich and Read (1992) indicated that the most important performance appraisal issue
faced by organizations is the perceived fairness of the performance review and the
performance appraisal system. Their findings suggested that most employees perceive their
performance appraisal system as neither accurate nor fair. Skarlicki and Folger (1997)
suggest that the appraisal process can become a source of extreme dissatisfaction when
employees believe the system is biased, political or irrelevant. A major problem for
organizational leaders is that the performance appraisal process and the performance
evaluation system are often perceived as both inaccurate and unfair (Latham & Wexley,
1981).
Landy, Barnes, and Murphy (1978) studied employee perceptions of the fairness and
accuracy of a performance appraisal system. The researchers found that frequency of
evaluation, identification of goals to eliminate weaknesses, and supervisory knowledge of a
30
subordinate’s level of performance and job duties were significantly related to perceptions of
fairness and accuracy of performance appraisal. Their results confirmed traditionally held
perceptions that performance appraisal should be done as frequently as possible, that the
supervisor should work with the subordinate to agree on responsibilities; and, that the
supervisor should devote sufficient time to observe and evaluate and employee’s
performance.
Greenberg (1986a) studied 217 private sector middle managers and asked them on an
open-ended questionnaire what single factor made a recent performance evaluation fair or
unfair. Factor analysis of the results indicated that soliciting employee input, two-way
performance interview communication, and the ability to challenge or rebut the performance
ratings account for a significant proportion of the variance in perceived efficacy of the
performance appraisal system.
In a study of 367 Washington state government employees, Lovrich, Shaffer, Hopkins
and Yale (1980), found that both ratees (58 percent) and raters (71 percent) believed that
participative performance appraisal was a fairer way of conducting appraisals than non-
participative methods. They also found that, if given a choice, raters and ratees would
choose participative performance appraisal over a non-participative type of system.
Ahmed (1999) investigated the measure of effectiveness that a state agency uses to
assess its performance appraisal function. Some of the criteria for assessment as suggested
by the respondents included impact on employee motivation, employee satisfaction with the
system, employee's perception regarding fairness and objectivity, and the degree to which it
provides adequate and valuable feedback.
31
Gabris and Ihrke (2000) reported that leadership credibility of immediate supervisors
is significantly associated with whether employees perceive performance appraisal systems
as procedurally fair and instrumentally just and appropriate. Their study of county
government professionals explored this issue as well as related issues of job burnout, job
satisfaction, manager innovation and cooperation between organizational units. Boswell &
Boudreau, (2000) found a significant positive relation between employee attitudes and
procedurally just performance appraisals and underscored the importance employees place on
fairness.
The literature as well as the direction of recent research indicates that employee
reactions towards performance appraisal variables such as fairness and satisfaction will
continue to play a role in the evaluation of performance appraisal systems. As will be
discussed, organizational justice theory can also be used to help explain the perceptions of
fairness of performance appraisal as related to performance appraisal system efficacy.
Organizational Justice Theory
Organizational justice may be defined as the study of fairness at work (Byrne and
Cropanzano, 2001). Organizational justice researchers generally agree that fairness can be
divided into two primary types with a third, less clearly defined type often proposed. The
first commonly accepted type of justice is referred to as distributive justice. Distributive
justice considers the fairness of the outcomes of a particular decision. Procedural justice, the
second type, is generally defined as the fairness of the process that leads to the outcome.
These two areas form the backdrop of majority of research conducted in the field in the last
twenty years (Byrne & Cropanzano, 2001). A third type of justice is often referred to as
interactional justice. Bies and Moag (1986) defined interactional justice as the fairness of
32
the interpersonal treatment that one receives at the hands of an authority figure. Bies (1987)
extended this idea by adding the concept of social justice to the factor.
Adams (1963) and Homans (1961) proposed the original social justice theory. It
suggested that people perceived social exchanges to be fair when they felt that their
contributions were in balance with their rewards. Early research focused on this perceived
fairness of resource allocation decisions such as the level of one's pay or departmental budget
allocation. Derived from "equity" theory, this became known as distributive justice because
it involved the allocation or distribution of resources. Subsequent research indicated that
people will accept a certain amount of unfairness in distribution if they perceive that the
process by which the distribution decisions were made is fair. Procedural justice is the term
used to describe this phenomenon (Cropanzano & Folger, 1991; Greenberg, 1990; and
Leventhal, 1980).
Significant research has been conducted in the areas of procedural and distributive
justice. Much of the research relies on a series of studies by Thibaut and Walker (1975) that
investigated individuals' reactions to various dispute resolution techniques. The primary
focus of Thibaut and Walker's work emphasized the amount of influence an individual had in
the decisions that were made and the process used to make the decisions. The opportunity to
present information relevant to a decision enhances judgments of the fairness of the decision
making process. Thibaut and Walker (1975) termed this as the “process control effect” while
Folger (1987) referred to it as the “voice” effect. The voice or process control effect may be
the best documented phenomenon in procedural justice research (Lind, Kanfer & Earley,
1990). Lind, Kanfer and Earley (1990) found that both pre-decision and post-decision voice
33
led to higher fairness judgments than no voice. Pre-decision voice was found to lead to
higher fairness perceptions.
Later work by Leventhal (1980) extended the discussion of distributive and
procedural justice beyond the process to include specific distributive mechanisms and
procedural factors other than process control. Cropanzano and Folger (1989) attempted to
integrate distributive and procedural forms of justice in a referent cognition theory. The goal
of the theory is to describe the role that decision-making procedures play in shaping
perception of unfair treatment. The theory predicts that people will react positively to an
unfair outcome if the procedures used to determine the outcomes were fair and that they will
react negatively if they perceive the procedures as being unfair.
Brockner (2002) reviewed studies on the effects of outcome favorability and
procedural fairness on people’s support for decisions, decision makers and the organizations.
The interactions found indicated that high procedural fairness reduces the effect of an
outcome’s favorability or people’s support, relative to when procedural fairness is low.
Brockner, Siegel, Daly, Tyler and Martin (1997) suggested that it is not the procedural
fairness that interacts with the outcome favorability but rather it is the degree of trust
resulting from procedural fairness of others that interacts with outcome favorability to
influence employee support.
Beyond distributive and procedural justice, the third form of justice proposes that the
quality of interpersonal treatment received during the enactment of organizational processes
and distribution of organizational outcomes is an important contributor to fairness
perceptions (Bies & Moag, 1986; Bies & Shapiro, 1987). Described as "interactional" justice
this concept has been included as an interpersonal aspect of procedural justice and also as a
34
distinct construct along with procedural and distributive justice (Skarlicki & Folger, 1997).
These researchers contend that interactional justice can be understood as separate from
procedural justice on the grounds that it represents the enactment of procedures rather than
the development of the procedures themselves.
The study of interactional justice focuses on how formal agents of the organization
treat those who are subject to their authority, decisions, and actions (Cobb, Wooten & Folger,
1995). Early studies of interactional justice focused on the social accounts or explanations
that agents (most often leaders) gave for their decisions and actions (Bies, 1987; Bies &
Moag, 1986). How leaders enact procedures and treat their followers and why followers
react the way they do to leaders acting fairly or unfairly are topics that have received
increasing attention (Folger & Bies, 1989; Tyler & Lind, 1992). Leaders often come to
personify the organization for many of their followers. As such, subordinates are likely to
assess the fairness of an organization’s procedures by the treatment they receive from their
leaders (Cobb, Vest, & Hills, 1997). Other research has shown that fair treatment by one’s
leaders communicates that subordinates have higher standing in the organization even when
they face disappointing outcomes (Cobb, Wooten & Folger, 1995).
Skarlicki and Folger (1997) found that at high levels of interactional justice the two-
way interaction of distributive and procedural justice was not significant when studying
retaliation in the work place. This result implied to the researchers that when supervisors
show adequate sensitivity and concern towards employees, treating them with dignity and
respect, those employees seem somewhat willing to tolerate the combination of unfair
distributions and procedures. This finding was consistent with Levinson's (1965) argument
that a supervisor personifies the organization for the employees; being able to count on the
35
goodwill of a well-meaning supervisor (perceived interactional justice) makes up for
unfavorable procedures combined with the unfairness of a particular outcome. Skarlicki and
Folger (1997) suggest that procedural and interactional justice are capable of functioning as
substitutes for each other.
Whether considered as part of procedural justice or as an independent construct,
interactional justice can be thought of as having at least two components (Brockner &
Wiesenfeld, 1996; Cropanzano & Greenberg, 1997). The first subpart is interpersonal
sensitivity which prescribes that treatment should be polite and respectful. The second
subpart of interactional justice includes explanations or social accounts. Individuals are more
tolerant of an unfavorable outcome when an adequate justification is provided (Bies &
Shapiro, 1987; Shapiro, 1991; Shapiro, Buttner & Barry, 1994).
Recently, Cropanzano and Ambrose (2001) have suggested that procedural and
distributive justice may not be distinct constructs as traditionally conceptualized. They offer
some evidence that these factors overlap and can affect one another. Individuals can make
references about procedural justice based on distributive justice and outcomes information
and vice versa.
Greenberg (1993) emphasized the need to consider more fully the social determinants
of fairness that were not recognized by the prevailing emphasis on the structural aspects of
outcome of distributions and procedures. He proposed a taxonomy of justice classes formed
by cross cutting the two commonly accepted categories of justice, procedural and
distributive, with two focal determinants, social and structural. The distinction between
social and structural determinants is based on the immediate focus of the just action
(Greenberg, 1993). Structural determinants reflect the situation whereby justice is sought by
36
focusing on the environmental context in which the interaction occurs. Structural
determinants ensure fairness by structuring a decision-making context. The social
determinants of justice focus on the treatment of individuals and help ensure fairness by
focusing on the interpersonal treatment one receives. Greenberg's four proposed classes of
justice include: systemic (structural-procedural); configural (structural-distributive);
informational (social-procedural); and, interpersonal (social-distributive) (Figure 1).
The concepts of procedural and distributive justice are relatively well accepted in the
study of organizational justice. The third component of justice, the interpersonal, social or
interactional factor, is acknowledged, but is not integrated consistently in the formulation of
justice models. Researchers have proposed a variety of models ranging from the two-factor
distributive and procedural factor model excluding interactional type justice to two and three
factor models incorporating interactional justice as part of procedural justice or as a stand-
alone component. Greenberg's four-factor model is an additional proposition that may help
researchers and practitioners in sorting through the complex issues of performance appraisal.
Applying Organizational Justice Theory to Performance Appraisal
Greenberg (1986b) was one of the first to apply organizational justice theory to
performance evaluation. He posed the basic research question as to what makes a
performance appraisal appear to be fair? Further he considered whether it is what one
receives or how the decision is made, or both, that makes performance appraisals seem fair.
Beginning with the two distinct concepts of procedural and distributive justice he proposed
seven categories that contributed to perceptions of fairness. Five procedural categories
included supervisors soliciting input prior to evaluation and use of the input during
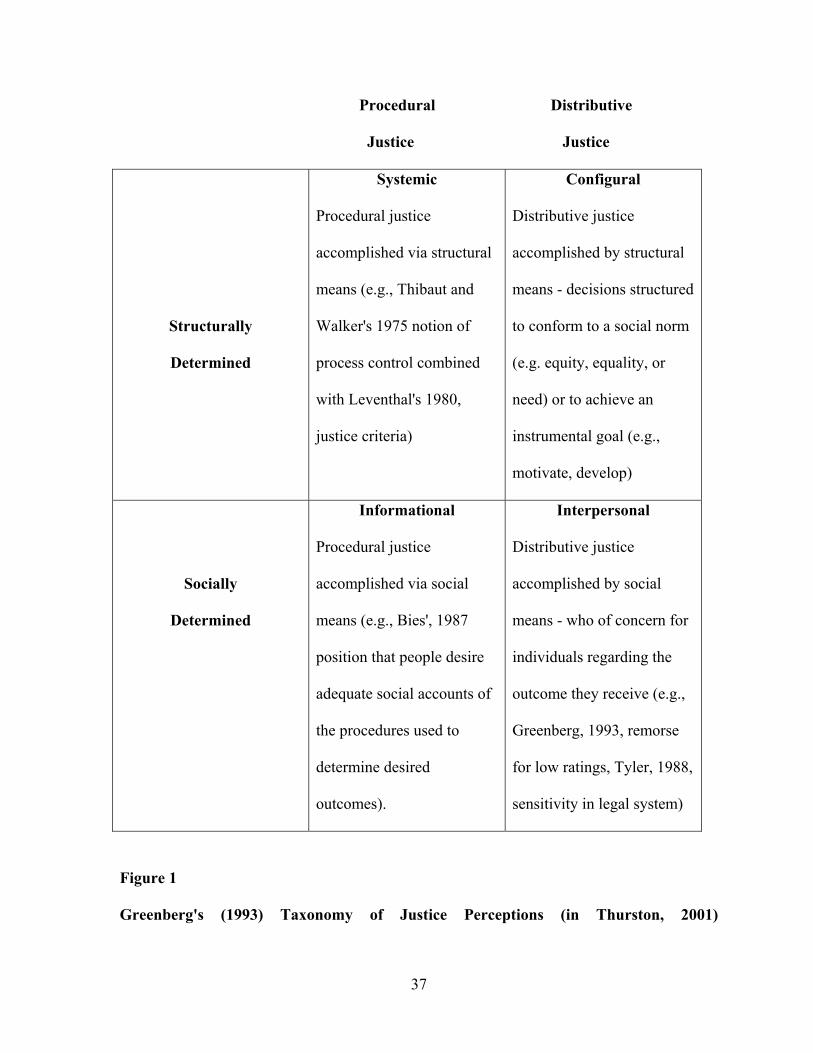
37
Procedural Distributive
Justice Justice
Structurally
Determined
Systemic
Procedural justice
accomplished via structural
means (e.g., Thibaut and
Walker's 1975 notion of
process control combined
with Leventhal's 1980,
justice criteria)
Configural
Distributive justice
accomplished by structural
means - decisions structured
to conform to a social norm
(e.g. equity, equality, or
need) or to achieve an
instrumental goal (e.g.,
motivate, develop)
Socially
Determined
Informational
Procedural justice
accomplished via social
means (e.g., Bies', 1987
position that people desire
adequate social accounts of
the procedures used to
determine desired
outcomes).
Interpersonal
Distributive justice
accomplished by social
means - who of concern for
individuals regarding the
outcome they receive (e.g.,
Greenberg, 1993, remorse
for low ratings, Tyler, 1988,
sensitivity in legal system)
Figure 1
Greenberg's (1993) Taxonomy of Justice Perceptions (in Thurston, 2001)
38
evaluation, two-way communication between supervisor and subordinate during the appraisal
interview, the ability of an employee to dispute or challenge a rating, rater characteristics
such as consistency in applying standards, and rater familiarity with the work being rated.
The occurrence of performance based ratings and pay or promotion outcomes based on the
ratings were included in the distributive category.
Greenberg's (1986) work supported earlier research by Landy, Barnes, and Murphy
(1978) and Landy, Barnes, Farrell, and Cleveland (1980) that showed when certain
conditions were in place employees were more likely to accept a performance appraisal
system and believe that their performance was rated fairly. Identifiable processes within the
appraisal system influenced perceptions of appraisal fairness and this influence was
independent of the perceptions that the actual rating was favorable. The conditions which
helped predict the perception of fairness in the process included frequency of performance
feedback, supervisor familiarity with work performance, the opportunity of employees to
express their feelings during a performance review, and the setting of new performance
goals. Landy (1985) generalized that a fair evaluation is one that contains certain procedural
elements regardless of the outcomes of the evaluations themselves.
Folger, Konovsky and Cropanzano (1992) used a "due process" metaphor to apply the
concept of justice to performance appraisal. Three essential factors were used to describe
nine elements of a procedurally fair system. The three factors included: adequate notice, fair
hearing and judgment based on evidence. Adequate notice requires that organizations set,
publish, distribute and explain standards and criteria to employees before the actual
evaluation and rating. It also includes employee input in developing performance standards
39
and allows employees to question why and how objectives should be met as well as
specifying timely performance feedback on a regular and recurring basis.
The factor of fair hearing requires a face-to-face evaluation meeting or interview with
the rater and a performance evaluation based on adequate opportunity to observe and
evaluate employee behavior and work product. The right of the employee to provide a self-
assessment or other input to the appraisal and to challenge the rating is also included.
Judgment based on evidence requires raters to apply standards honestly and consistently
across employees and to do so without bias or pressure. The opportunity for the employee to
question, discuss or appeal the rating is also indicated.
Subsequent work by Taylor, Tracy, Renard, Harrison, and Carroll (1995) showed that
the due process model is consistent with the procedural justice concept. According to these
researchers, employees involved in a due process performance appraisal system displayed
more favorable reactions regarding the perceived system fairness, appraisal accuracy,
attitudes towards the system, and intention to remain with the organization. Managers also
responded positively reporting greater ability to resolve work problems, satisfaction with the
system and less distortion of appraisal results to further their own self interests.
Roberts and Reed (1996) found evidence of a positive relationship between
satisfaction and acceptance of performance appraisal outcomes with employee perceptions
that their supervisors encouraged participation, assisted in goal setting and provided frequent
feedback.
Korsgaard and Roberson (1995) examined subordinate voice (the practice of allowing
individuals who are affected by a decision to present information relevant to the decision) in
creating positive attitudes in the performance appraisal context. Instrumental and non-
40
instrumental voices were studied. Instrumental voice is described as the perception of
indirect control over decisions when direct control is impossible (Thibaut & Walker, 1975).
Non-instrumental voice refers to the idea that “voice” is valued intrinsically regardless of
whether the impact influences the decision. Their findings indicate that perceptions of
instrumental and non-instrumental voice were independently and comparably predictive of
appraisal satisfaction. Trust in manager was related only to non-instrumental voice. The
difference in the impact of voice components on satisfaction versus trust supports the notion
that instrumental voice is more important to reactions to allocation decision than to attitudes
towards management.
Other researchers reported similar results in which voice affected perceptions of
procedural justice, distributive justice and agreement with the decision (Leung & Li, 1990).
These authors concluded that voice affects distributive justice only when it is considered to
be influential whereas voice only had to be considered by the decision maker to affect
procedural justice.
Cobb and Frey (1996) studied the effects of procedurally fair leadership and payment
outcomes on subordinate reactions to the supervisor. Subordinate’s reactions were measured
for perceptions of supervisory fairness (both procedural and distributive) and the
subordinate’s relationships with the supervisor. The results indicated that procedurally fair
leadership was linked to subordinate perceptions of leader fairness and on their relationships
with the leaders. Subordinates discerned differences in leadership behaviors that enact
procedural fairness. These behaviors affected subordinate assessment of supervisor fairness
and relationships with the supervisor. The researchers found some evidence that unfair
41
behavior can have negative effects on favorable outcomes. When leaders act unfairly their
decisions are seen as unfair even when subordinates benefit from them.
Continued investigation of organizational justice related to performance appraisal has
provided additional insight into perceptions of fairness and employee satisfaction. Tang and
Sarsfield-Baldwin (1996) found a relationship between distributive justice and personal level
job satisfaction and between procedural justice and organizational commitment. These
researchers developed scales for procedural and distributive justice and used them to predict
satisfaction with pay, promotion, supervision and their performance appraisal. A 22 item
scale reflecting aspects of procedural justice formed five factors labeled: fairness; two-way
communication; trust in supervisor; clarity of performance appraisal process; and,
understanding the performance appraisal process.
Bartol, Durham and Poon (2001) investigated the impact of alternative appraisal
categories available for rating employee performance (rating segmentation) on motivation
and perceptions of fairness. The researchers found that the rating system and the
performance rating itself affected perceptions of distributive justice.
Erdogan, Kraimer and Liden (2001) argue that in the performance appraisal context,
procedural justice can be conceptualized as two-dimensional: system procedural justice and
rater procedural justice. Their study indicates that the two factors are independent. Different
components of due process were related to different dimensions of procedural justice.
Knowledge of performance appraisal criteria and validity of appraisal criteria are related to
system procedural justice whereas fair hearing and performance feedback are related to rater
procedural justice. The authors suggest that understanding the source of perceived injustice
can help organizations improve overall justice perceptions by focusing improvement efforts
42
on the appropriate source of either rater procedural justice or system procedural justice.
Employees expect the organization to develop appropriate performance criteria and
communicate these to them. However, it is the role of the supervisor to conduct a fair hearing
through performance appraisal and to provide feedback.
Leung, Su and Morris (2001) found that fair interpersonal treatment by the supervisor
elicits positive attitudinal reactions from recipients towards both the supervisor and the
organization. Fair interpersonal treatment had both direct and indirect paths to attitudes
towards the supervisor while the effects of just formal procedures were primarily directed to
the organization.
Cobb, Vest and Hills (1997) studied whether, and to what extent, workers see either
formal polices and procedures or the organizational agents (their supervisors) who apply
them as the source most responsible for the procedural fairness they receive in their
performance evaluation. Results indicated that workers perceived shared, yet independent
responsibility for delivery of procedural justice between supervisors and formal policies. The
formal policies and procedures related to the structural aspect of justice and the supervisor or
agent to the interactional form. Differences in the perception of the source of justice were
also found between the groups of exempt and non-exempt workers. Non-exempt workers
perceived formal policies as more responsible for procedural fairness than did the exempt
workers. Some support was found for structural dominance of policies and procedures as the
source of procedural justice as opposed to the supervisor in the non-exempt group. Overall,
the study provided support for Tyler and Bies’ (1990) argument that the way agents enact
and apply policies is as important to the worker’s perception of justice as the formal policies
and procedures themselves.
43
The relationships between justice perceptions and reactions to performance appraisal
have been theorized and found to exist by a number of researchers. Respectful treatment, fair
processes, relevant criteria, participation, and information flow all have a positive association
with affective and behavioral responses to performance appraisal. Fairness and justice are
clearly important concepts in many organizational processes including performance
appraisal. Researchers have suggested that additional research is needed to distinguish
between the many types of perceptions involved.
Leventhal's (1980) model and empirical work by Greenberg (1986a) clarify the
distinction and independent contribution of distributive and procedural forms of justice to
other organizational attitudes and behaviors. The due process model proposed by Folger,
Konovsky and Cropanzano (1992) and the subsequent empirical work by Taylor, Tracy,
Renard, Harrison and Carroll (1995) showed that attention to performance appraisal
processes has an impact on several organizational outcomes.
As discussed, much of past justice research has focused on the structural components
of the performance appraisal system (Folger, Konovsky & Cropanzano, 1992; Leventhal,
1980). Comparison of research on structural-procedural and structural-distributive justice
can be directly related to many of the components considered by performance appraisal
researchers to comprise efficacious performance appraisal systems. Many of the structural
justice factors also coincide with recommendations from researchers on fundamental aspects
to be considered in evaluating performance appraisal systems.
The importance of the social aspects of organizational systems such as performance
appraisal cannot be under-estimated (Greenberg, 1993). This may be particularly true for
performance appraisal where the inter-personal relationships and perceptions of raters and
44
ratees are significant to the results of the process. Some researchers have grouped structural
and social determinants without making a distinction between them (Greenberg, 1986a;
Landy, Barnes and Murphy, 1978; and Roberts and Reed, 1996). An integrated framework is
needed that can more clearly distinguish between the various perceptions of organizational
justice. Such a distinction is important to researchers in the area of justice as it applies to
systems such as performance appraisal as well as to practitioners seeking to understand the
actual use and dynamics of performance appraisal in an organization.
An Integrated Justice Theory Applied to Performance Appraisal
In attempt to more fully consider the interactional components of justice and integrate
the different views of organizational justice, Greenberg (1993) crossed the principle types of
justice, procedural and distributive with two determinants of justice perceptions, structural
and social to create a model with four categories of justice perceptions. The proposed model
includes the following four types of justice perceptions: systemic (structural-procedural);
informational (social-procedural); configural (structural-distributive); and interpersonal
(social-distributive).
Greenberg's (1993) conceptualization of the four types of justice provides a basis to
more clearly examine the social perceptions related to organizational justice in systems. It
offers the opportunity to more comprehensively study and organize employees' perceptions
of fairness concerning performance appraisal and appraisal systems. Description of the
perceptions of fairness allocated across the four categories may provide practitioners with
valuable information to better manage the complex system of performance appraisal. Figure
2 shows Greenberg's four-factor taxonomy of justice as applied to performance appraisal.
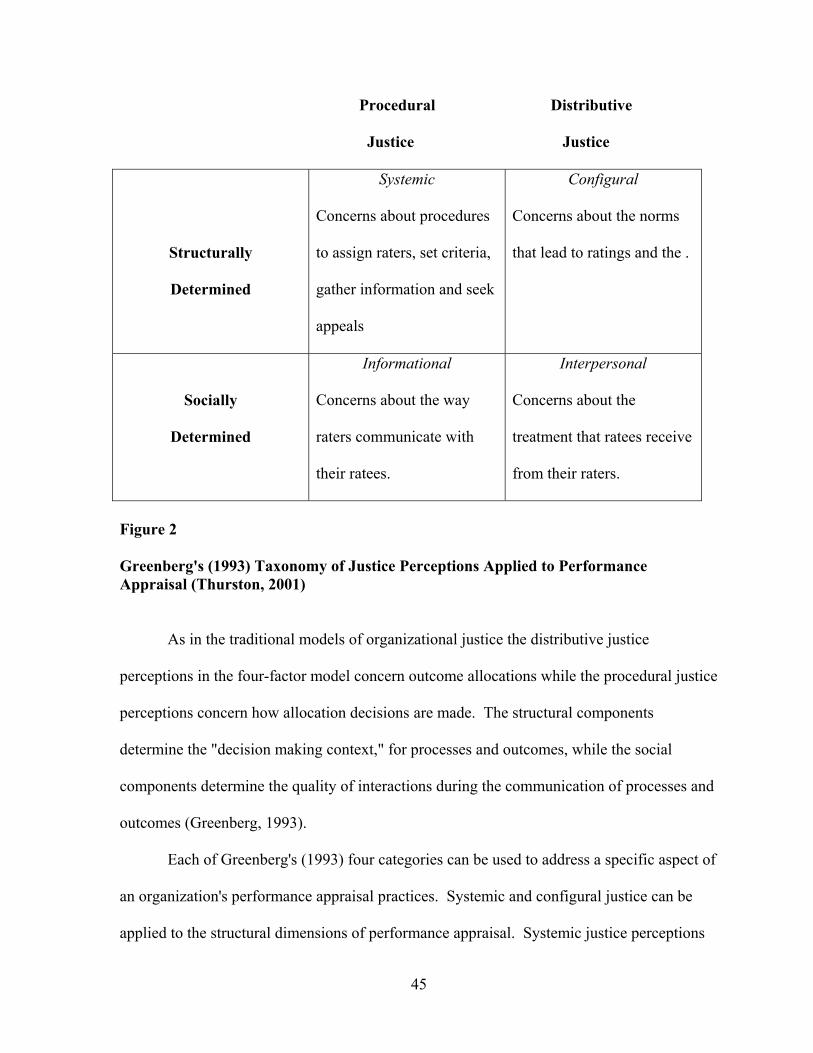
45
Procedural Distributive
Justice Justice
Structurally
Determined
Systemic
Concerns about procedures
to assign raters, set criteria,
gather information and seek
appeals
Configural
Concerns about the norms
that lead to ratings and the .
Socially
Determined
Informational
Concerns about the way
raters communicate with
their ratees.
Interpersonal
Concerns about the
treatment that ratees receive
from their raters.
Figure 2
Greenberg's (1993) Taxonomy of Justice Perceptions Applied to Performance Appraisal (Thurston, 2001)
As in the traditional models of organizational justice the distributive justice
perceptions in the four-factor model concern outcome allocations while the procedural justice
perceptions concern how allocation decisions are made. The structural components
determine the "decision making context," for processes and outcomes, while the social
components determine the quality of interactions during the communication of processes and
outcomes (Greenberg, 1993).
Each of Greenberg's (1993) four categories can be used to address a specific aspect of
an organization's performance appraisal practices. Systemic and configural justice can be
applied to the structural dimensions of performance appraisal. Systemic justice perceptions
46
(structural-procedural) are primarily based on Leventhal's (1980) procedural justice model
and concern perception of performance appraisal procedures (assigning raters, setting
criteria, gathering information, and seeking appeals). The fairness of procedures are
evaluated in terms of whether they promote accuracy, suppress bias, represent recipient's
concerns and if they are correctable and applied consistently. Configural justice perceptions
(structural-distributive) can be applied to the decision norms associated with performance
appraisals including equity and political pressures as well as to the relationships between
performance appraisal and subsequent administrative decisions. A performance appraisal
judgment (configural) based on the quality of an employee’s work according to set
performance standards (systemic) is considered fair based on the norm of equity in the
performance evaluation context (Leventhal, 1980).
The social dimensions of appraisal practices can be represented by interpersonal and
informational justice perceptions. Perceptions of the way that the rater treats the person
being evaluated, such as with respect and sensitivity, concerns interpersonal justice (social-
distributive). Informational justice (social-procedural) reflects fairness perceptions based on
the clarification of performance expectations and standards, feedback received, and
explanation and justification of decisions. An adequate explanation (informational)
clarifying performance expectations or a rating is considered fair based on the
interactional/social component.
Thurston (2001) developed ten scales to reflect Greenberg's (1993) four-factor
taxonomy of justice. These scales were allocated to each factor according to Thurston's
(2001) interpretation of Greenberg's theory. Greenberg's four-factor justice model and
47
Thurston's (2001) application of the concepts to evaluating performance appraisal are
discussed more thoroughly below.
Systemic Justice (Structural-Procedural)
Systemic justice describes the structurally determined justice perceptions of the
procedures that lead to outcomes (Greenberg, 1993). Procedural justice includes processes
and procedures used to make decisions regarding outcomes (Lind & Tyler, 1988; Tyler &
Lind, 1992). The structural determinant sets this factor most prominently at the
organizational level where procedures for performance appraisal are put in place.
Structurally determined events that precede distribution of the reward and the evaluation of
these events will influence the perceived fairness of the components of the performance
appraisal.
Thurston (2001) proposed three scales to represent the systemic aspect of
performance appraisal: assigning rater, setting criteria, and seeking appeals. The content of
the indicators reflect the various justice criteria suggested by Leventhal (1980) as well as
other evaluation criteria suggested by performance appraisal researchers (Mohrman, Resnick-
West & Lawler, 1989; Murphy & Cleveland, 1991; Wexley & Latham, 1981;). According to
Leventhal (1976, 1980) procedures will be considered fair if they are free from bias; are
accurate; correctable; representative of all concerns (voice) and are based upon accepted
ethical standards.
The assignment of raters who have sufficient level of knowledge of the ratee’s job, of
the ratee’s level of performance and knowledge of the performance appraisal system was
found to influence perceptions of fairness by Klasson and Sorbom (1980); Landy, Barnes and
Murphy (1978); and Tang and Sarsfield-Baldwin (1996). Folger and Cropanzano (1998) and
48
the empirical work by Taylor, Tracy, Renard, Harrison, and Carrol (1995) recognized the
relevance of setting criteria and gathering information on perceptions of fairness and
performance appraisal satisfaction. Murphy and Cleveland (1991) suggest that systems will
be considered fair and more acceptable if raters have a high degree of employee job
knowledge; if job dimensions are highly relevant and if there is a formal system of appraisal.
The presence of appeal procedures for ratees has been mentioned many times in the
literature as necessary to a successful system. Stratton (1988) and Alexander and Ruderman
(1987) found that perceptions of appeal procedures were positively related to evaluations of
supervisors, trust in management and job satisfaction and negatively related to turnover and
conflict. The ability to appeal performance ratings; express feeling; correct ratings, etc. have
also been identified as part of procedurally fair systems by Cascio and Bernardin (1981),
Greenberg and Tyler (1986), Leventhal (1976), and Murphy and Cleveland (1991).
Configural Justice (Structural-Distributive)
According to Tyler, the conceptualization of distributive justice was really the
beginning of organizational justice (Byrne and Cropanzano, 2001), and can be traced back as
far a 1965 when Adams (1965) proposed a theory of inequity, most commonly referred to as
equity theory. Equity theory elaborated on the work of Homans (1961) and proposed that
individuals make cognitive evaluations of the difference between their contributions and the
resultant outcomes (economic or social compensation). Adams (1965) suggested that
individuals go beyond a simple ranking system in their assessment of inputs to outputs, to
where they precisely quantify the equity or inequity of the comparison. The result of the
evaluation or comparison is that the individual either feels inadequately, fairly or over-
compensated. In the study of performance appraisal, the performance appraisal can be
49
viewed as an outcome itself, or an input to other administrative decisions (Greenberg, 1986).
Administrative outcomes can include promotion, pay increase, training and career
development opportunities.
Two types of structural forces are associated with the configural justice: decision
norms and personal goals of the raters. Distributions which people believe are based on
existing social norms, like equity, may lead employees to believe that distributions are fair.
This requires that the outcomes are perceived to be commensurate with the level of effort and
quality of work the employees believe to have performed. However, when raters are
perceived to be driven to conform to other distribution norms such as equality, need, or social
status (Leventhal, 1980) they may produce ratings that are not congruent with the prevailing
equity norms and may be perceived to be unfair. Performance appraisal distributive justice is
operationalized as people’s reaction to their formal rating or pay raise (Folger and
Cropanzano, 1998). The perception of the personal goals of the rater, the second structural
force, may influence employee perceptions of the fairness of a decision. Employees may
consider a performance rating unfair if the rater is considered to be attempting to avoid
conflict by inflating ratings; to play favorites; or to yield to political pressures to distort
ratings (Longnecker, C.O., Gioria, D.A. & sims, H.P, 1987; McCarthy 1995).
The configural justice construct may be represented by two scales representing
measures used in prior research, the equity decision norm and absence of politics. Moorman
(1991) and Tang and Sarsfield-Baldwin (1996) used Price and Mueller's (1986) Distributive
Justice Index as the basis for the equity norm indicator. Fairness of organizational decisions
and the influence of political considerations have been evaluated. Tziner, Prince and Murphy
50
(1997) used a 25-item instrument designed to measure raters' goals as related to political
considerations to study organizational political influences.
Interpersonal Justice (Social-Distributive)
The social aspects of performance appraisal as described by interpersonal justice
(Greenberg, 1986a) include perceptions about the way a rater treats the person being
evaluated. The interpersonal justice factor may be considered a subset of interactional justice
which was introduced by Bies and Moag (1986) and Bies and Shapiro (1987). The
informational justice factor contains the other components of interactional justice.
Interpersonal and informational justice both consider that perceptions of justice are based not
only on outcomes or the procedures one experiences but also from the interpersonal
treatment that is received (Bies, Shapiro, & Cummings, 1988). Interpersonal justice can take
the form of any social rewards provided by the supervisor or likewise, can include injustice
such as an insult which is defined as a social interaction and an outcome (Mikula, Petrik &
Tanzer, 1990). A manager’s disrespectful behavior can be considered as an outcome
behaving as a socio-emotional award. Two scales indicated by Bies and Moag (1986) are
used to represent interpersonal justice: Respect in Supervision and Sensitivity in Supervision.
Greenberg (1993) provided evidence that individuals are highly influenced by the
sensitivity they are shown by their supervisors and other representatives within the
organization. This is especially true when raters show concern for individuals regarding the
outcomes they receive. Apologies and other expressions of remorse by raters have been
shown to mitigate ratees' perceptions of unfairness (Greenberg, 1993).
51
Informational Justice (Social-Procedural)
Informational justice focuses on the perceptions of the social aspects of events and
the quality of these events which precede the determinations of the outcomes. It is
differentiated from systemic justice which includes the structural aspects of procedural
justice. Informational justice contains the overlapping areas of interactional (Bies & Moag,
1986; Bies & Shapiro, 1987) and procedural (Leventhal, 1980; Thibaut & Walker, 1975)
justice types. Erdogan, Kraimer & Liden (2001) also argue that procedural justice can be
conceptualized as two dimensional reflecting system procedural justice and rater procedural
justice.
In the context of performance appraisals, the most common interactions will involve
the setting of performance goals and standards, routine feedback, and explanations during the
performance appraisal interview. Informational justice is concerned with the quality of the
interactions of implementing and communicating the procedural aspects of the system.
Three scales indicated by previous theoretical and empirical research represent this construct.
These are clarifying performance expectations and standards, providing feedback and
explaining and justifying decisions (Thurston, 2001).
Organizational justice theory offers a rich theoretical basis from which to consider the
complex phenomenon of performance appraisal. The different justice models that have been
proposed in the organizational justice and performance appraisal literature to represent the
perceptions of fairness provide alternative, yet related, ways to approach evaluating
performance appraisal system. Limited research has focused on the integration of the
different models and justice constructs into a more cohesive model (Thurston, 2001) based
on Greenberg's hypothesized four-factor model. For researchers and practitioners this more
52
cohesive and integrated model may serve to increase the understanding of the complexity of
performance appraisal and its management.
The sum of the research indicates that performance appraisal is a complicated activity
involving a number of complex individual level, process and organizational factors. The
complexity of the process has contributed to the past predominance of research examining
isolated factors in controlled settings. Recent research has included more field studies and
relied on surveys and self-report measures with some review of actual performance appraisal
documentation to investigate the phenomena of organizational context and attitudinal
influences on raters, ratees and the results of performance appraisal. A principal
consideration in evaluation of any performance appraisal system must be employee
satisfaction. Employee satisfaction is linked to employee perception of fairness of the
organization's system. Perceptions of fairness of performance appraisal can be considered
using the concepts of organizational justice. Organizational justice theory provides several
ways to apply the concept.
Organizational justice theory will provide the organizing structure for this study to
evaluate the satisfaction with and perceptions of fairness of an existing performance appraisal
system in a large, public employment system.
53
CHAPTER 3
METHODOLOGY
Introduction
This study was designed to investigate perceptions of fairness of performance
appraisal and satisfaction with a performance appraisal system. The study included
measurement of employee perceptions of the fairness of performance appraisal based on a
hypothesized four-factor model of organizational justice (Greenberg, 1993) as
operationalized by Thurston (2001). The relationships of these perceptions to employee
reactions indicating satisfaction with key components of performance appraisal were
investigated. Confirmatory factor analysis using the LISREL 8.51 (Joreskog and Sorbom,
1993) structural equation model (SEM) was conducted to determine if the scales used to
measure perceptions of fairness formed four distinct constructs and supported the proposed
four-factor model. A competing models strategy was used to determine if the proposed
model best represented the underlying factor structure of the data. Relationships between the
scales used to measure perceptions of fairness and the respondent’s reactions indicating
satisfaction were also investigated.
The study was conducted in two organizations within a large state government
employment system located in the southern United States in the spring of 2003. The data
were obtained using a four-part questionnaire. Participants were asked to respond in their role
as a ratee in the performance appraisal system referred to by the organizations as the PPR
(Performance Planning and Review). Part I of the survey contained 56 items allocated to ten
scales representing perceptions of fairness of performance appraisal. Part II included three
multi-item scales designed to determine satisfaction of respondents with performance
54
appraisal by measuring reactions toward the supervisor, reaction to the most recent rating,
and reactions to the system. Part III contained demographic questions.
This chapter presents the methodology used to select the sample, develop the survey
questionnaire; collect the data; and, analyze the data according to the objectives and
hypotheses of the study.
Selection of Participating Organizations
Two separate state-funded governmental agencies employing civil service workers
were selected for the study. The selection of these agencies was made in conjunction with
the central state civil service department that initially agreed to participate in the study. The
civil service department maintains the responsibility for implementation and monitoring of
the performance appraisal system across all state agencies. The state's performance appraisal
system was implemented in 1997. Use of the system (or an authorized modified version) is
required by state legislation for all organizations employing workers subject to the state's
civil service rules and regulations. Several dozen organizations ranging in size from over
10,000 employees to fewer than 100 employees are required to utilize the system for over
63,000 state workers. To date, monitoring and assessment of the efficacy of the system has
been limited to measuring organizational utilization levels and numbers of appeals of ratings.
The state civil service department agreed to allow the current study in selected departments
to facilitate data collection about the PPR system and to increase understanding of its
effectiveness.
The two departments were initially selected based on utilization rates of the system.
Both departments reported that over 87% of the required performance reviews are conducted
and reported to the departmental human resources departments. Both departments have been
55
using the same performance appraisal process since it was introduced as a mandatory
requirement by the state civil service management division in 1997. Other considerations for
selection of the two organizations included management support for a study, number of
employees, diversity of jobs within the organization, and central location of most personnel
to facilitate data collection.
The agencies have significantly different missions and work processes and employ
different classifications of employees. One is predominantly technical and scientific with
many professional and clerical positions while the other is a health care provider with more
employees and more types of job classifications. In spite of the differences in the operations,
both utilize exactly the same performance appraisal system.
Sample
Data were collected from the administrative, clerical, professional, supervisory and
managerial staff in the two public (government) organizations in the late spring of 2003. The
accessible population was defined as those administrative, clerical, technical, professional,
supervisory and managerial staff in the two departments who have participated as ratees in
the performance appraisal process.
The frame of the accessible population was identified by the personnel records of the
individual departments. The list of employee participants was provided directly by each of
two the departments from their personnel management databases. The total number of
eligible personnel in the technical agency was 390 and 730 in the health care provider.
Selection of a random sample from each organization to receive the survey was
proposed by the researcher to the organizational management. To confirm that an adequate
number of responses were received, the sample size was determined using Cochran's sample
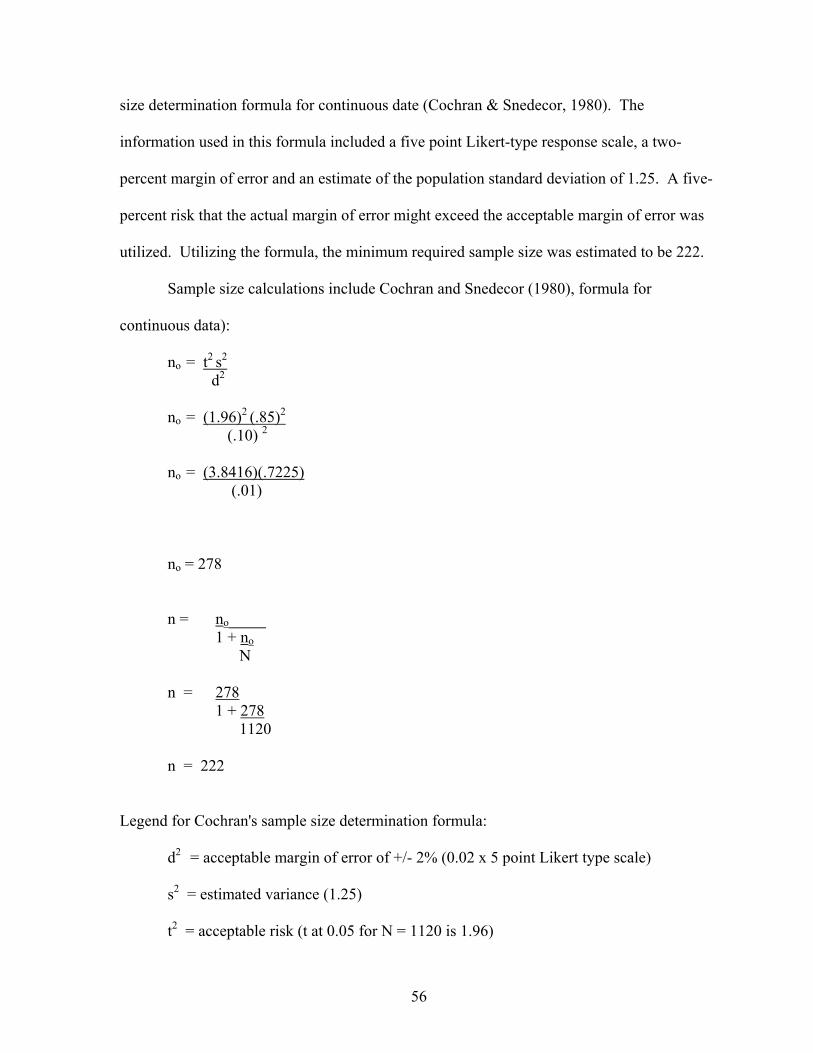
56
size determination formula for continuous date (Cochran & Snedecor, 1980). The
information used in this formula included a five point Likert-type response scale, a two-
percent margin of error and an estimate of the population standard deviation of 1.25. A five-
percent risk that the actual margin of error might exceed the acceptable margin of error was
utilized. Utilizing the formula, the minimum required sample size was estimated to be 222.
Sample size calculations include Cochran and Snedecor (1980), formula for
continuous data):
no = t2 s2 d2
no = (1.96)2 (.85)2 (.10) 2
no = (3.8416)(.7225) (.01) no = 278 n = no_______
1 + no N n = 278 1 + 278 1120 n = 222
Legend for Cochran's sample size determination formula:
d2 = acceptable margin of error of +/- 2% (0.02 x 5 point Likert type scale)
s2 = estimated variance (1.25)
t2 = acceptable risk (t at 0.05 for N = 1120 is 1.96)
57
N = population size
no = unadjusted sample size
n = adjusted sample size
Based on communication with representatives in each organization an estimated
maximum return rate of 50 percent was anticipated. This indicated that the sample must be
sent to a minimum of 444 people. After consultation with representatives of the state civil
service agency and the participating departments, the organizations decided to include all
employees in the sample for the study. A 100% sample of the defined accessible population
received the survey questionnaire. This decision was made based primarily on the desire to
eliminate the perception of "singling" out individual employees to participate.
Data Collection Procedures
Surveys were distributed to eligible personnel through each department’s inter-office
mail. Each employee who participated in the performance appraisal system (excluded were
medical doctors; political appointees; and, new employees) received a questionnaire
delivered to their work station. A letter from the researcher describing the study and
instructions was included in the packet along with a return envelope to the researcher’s
attention via the organization’s Human Resource Department. The cover letter was prepared
according to Dillman's (1978) suggestions. The letter and the survey are included in
Appendix A. The survey items are discussed in detail later in this chapter. A follow-up post
card (Appendix B) was sent to all eligible employees ten working days after the survey was
sent. This postcard encouraged completion and return of the surveys.
58
Four hundred forty completed or partially completed surveys were returned. Of
these, four were unusable due to either patterned responses or substantial lack of completion.
A total of 436 useable surveys were used in the analyses.
Instrumentation
A survey instrument was used to collect data in this study from eligible employees
defined as those clerical, technical, professional , supervisory, managerial and administrative
staff required to participate in the State’s PPR system. All participants were asked to respond
in their role as a ratee.
Part I of the survey included ten scales containing items measuring perceptions of
fairness of performance appraisal. Part II of the questionnaire included measures of
employee reactions to their most recent performance appraisal rating, reaction to the
performance appraisal system, and reaction toward their supervisor. These components are
considered to be indicators of employee satisfaction with the overall performance appraisal
process. Part III includes a short demographic questionnaire. A description of each part of
the survey questionnaire follows:
Part I: Perceptions of Fairness of Performance Appraisal
The items and scales utilized in this study to measure perceptions of performance
appraisal fairness are based on Greenberg's (1993) four-factor model of organizational
justice. The four factors include systemic, configural, informational and interpersonal
aspects of justice. Systemic (structural-procedural) and configural (structural-distributive)
justice perceptions include structural dimensions of performance appraisal practices.
Informational and interpersonal include the social aspects of performance appraisal.
59
The items included in the survey were initially based on fifty items proposed in
Thurston's (2001) research to represent the content of ten scales designed to measure
perceptions of fairness and justice in performance appraisal. The content development
capitalized on theoretical conceptualization in the organizational justice and performance
appraisal literature (Adams, 1963; Folger & Cropanzano, 1998; Leventhal, 1980) and
empirical research on justice perceptions and effectiveness of performance appraisal (Gabris
and Irhke, 2000; Greenberg, 1986b; Keeping & Levy, 2001; Landy, Barnes, & Murphy,
1978; Taylor, Tracy, Renard, Harrison & Carroll, 1995; Williams & Levy, 2000).
The content validity of the scales for use in this study was further established through
use of an expert panel consisting of human resources department staff, representatives of
other departments familiar with the performance appraisal system and representatives of the
state civil service agency. Wording of the questions was modified as appropriate and
additional questions added to satisfy the needs of the department. The final ten scales
designed to measure perceptions of fairness included 56 items. Perceptions of fairness were
measured on a five point scale with 1 = strongly agree; 2 = agree; 3 = neither agree nor
disagree; 4 = disagree; and, 5 = strongly disagree.
Systemic Justice Scales
Systemic justice procedures, which are primarily based on Leventhal's (1980)
procedural justice model, concern perceptions of performance appraisal procedures that
determine how decisions regarding performance appraisal ratings and other outcomes are
determined. They represent ratee concerns regarding the system’s consistency in procedural
aspects and in addressing employee concerns regarding performance expectations. The
qualifications and ability of raters to accurately rate performance based on job knowledge
60
and knowledge of employee performance are included. The safeguards provided by the
system to allow ratees to appeal a performance appraisal rating are also assessed in these
factors. Scales allocated to this factor include “Rater Confidence,” “Setting Criteria,” and
“Seeking Appeals”.
The scales representing the systemic justice factor also reflect other justice criteria
suggested by organizational justice researchers. Leventhal (1976 and 1980) suggests that
procedures will be considered fair if they are free from bias; are accurate; correctable;
representative of all concerns (voice) and are based on accepted ethical standards. The
systemic justice scales also take in consideration evaluation criteria suggested by
performance appraisal researchers (Mohrman, Resnick-West & Lawler, 1989; Murphy &
Cleveland, 1991; Wexley & Latham, 1981;).
The assignment of raters who have sufficient level of knowledge of the ratee’s job,
their level of performance and performance appraisal system knowledge was found to
influence perceptions of fairness by Landy, Barnes and Murphy (1978), Murphy and
Cleveland (1991), and Tang and Sarsfield-Baldwin (1996). The scale “Rater Confidence”
contains five items addressing these criteria. Examples of the items included in the Rater
Confidence scale include “My organization makes sure that I am assigned a rater who is
qualified to evaluate my work” and “My organization makes sure that I am assigned a rater
who understands the requirements and difficulty of my work.”
Folger and Cropanzano (1998) and the empirical work by Taylor, Tracy, Renard,
Harrison, and Carrol (1995) recognize the relevance of setting criteria and Murphy and
Cleveland (1991) suggest that systems will be perceived as more fair if job dimensions are
highly relevant. The six item scale “Setting Performance Expectations” includes items such
61
as “The PPR process makes sure that my performance expectations measure what I really do
for the organization,” “The expectations set during the Performance and Planning Session
reflect the most important factors in my job,” and “The PPR process allows me to help set the
performance standards that my supervisor will use to rate my performance.”
The ability to appeal a rating which is considered unfair, inaccurate or biased is cited
frequently in the literature as being an important component to ensuring perceptions of
procedural fairness (Alexander & Ruderman, 1987; Cascio & Bernardin, 1981; Greenberg &
Tyler, 1987, and Murphy & Cleveland, 1991; Leventhal, 1976; and, Stratton, 1988).
Examples of the items in the Seeking Appeals scale include “I have ways to appeal a
performance rating that I think is biased or inaccurate,” and “I know I can get a fair review of
my performance rating if I request one.” Table 1 presents the content of the three scales of
the Systemic Justice Factor.
Configural Justice Scales
Configural (structural-distributive) justice represents an outcome or the distributive
aspect of the performance appraisal system. In the study of performance appraisal, the
performance appraisal and rating can be viewed as an outcome itself, or as an input to other
administrative decisions. Administrative outcomes can include promotion, pay increase,
training and career opportunities (Greenberg, 1986a). Configural justice perceptions can be
applied to the performance appraisal process by considering the way in which rating
decisions are made reflecting such criteria as accuracy and equity of ratings and the
consideration of bias due to social or political influences on the rater. Raters whom display
personal goals besides those perceived to support equity and accuracy may be viewed as
unfair and the ratings they issue viewed as unfair also. Other goals may include the desire to
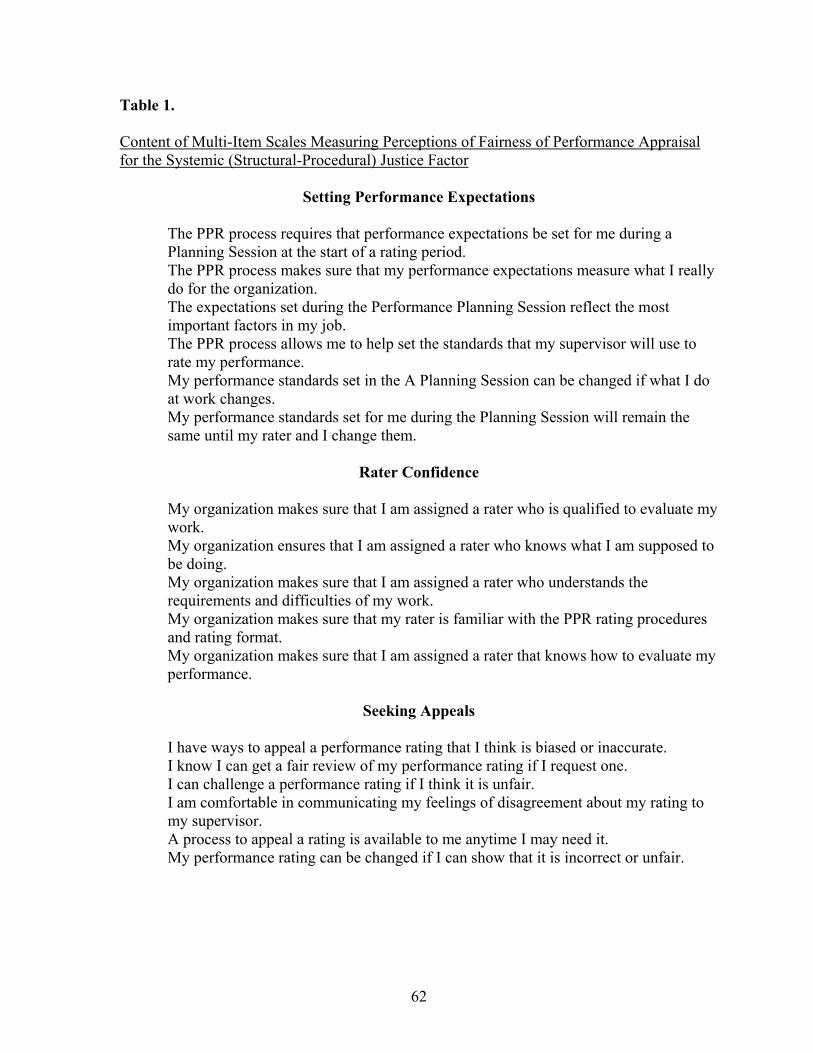
62
Table 1. Content of Multi-Item Scales Measuring Perceptions of Fairness of Performance Appraisal for the Systemic (Structural-Procedural) Justice Factor
Setting Performance Expectations
The PPR process requires that performance expectations be set for me during a Planning Session at the start of a rating period.
The PPR process makes sure that my performance expectations measure what I really do for the organization. The expectations set during the Performance Planning Session reflect the most important factors in my job. The PPR process allows me to help set the standards that my supervisor will use to rate my performance. My performance standards set in the A Planning Session can be changed if what I do at work changes. My performance standards set for me during the Planning Session will remain the same until my rater and I change them.
Rater Confidence
My organization makes sure that I am assigned a rater who is qualified to evaluate my work. My organization ensures that I am assigned a rater who knows what I am supposed to be doing. My organization makes sure that I am assigned a rater who understands the requirements and difficulties of my work. My organization makes sure that my rater is familiar with the PPR rating procedures and rating format. My organization makes sure that I am assigned a rater that knows how to evaluate my performance.
Seeking Appeals
I have ways to appeal a performance rating that I think is biased or inaccurate. I know I can get a fair review of my performance rating if I request one. I can challenge a performance rating if I think it is unfair. I am comfortable in communicating my feelings of disagreement about my rating to
my supervisor. A process to appeal a rating is available to me anytime I may need it. My performance rating can be changed if I can show that it is incorrect or unfair.
63
avoid conflict by inflating ratings, to play favorites or to yield to political (organizational
norms) pressure to distort ratings (Tziner, Murphy & Cleveland, 2001; Tziner, Prince, &
Murphy, 1997).
Moorman (1991) and Tang and Sarsfield-Baldwin (1996) used Price and Mueller’s
(1986) Distributive Justice Index as the basis for the equity norm indicator. The scale
“Accuracy of Ratings” reflected perceptions of equity of ratings based on a modified version
of the Distributive Justice Index (Thurston, 2001). Items included in the “Accuracy of
Ratings” scale include “My performance rating is based on how well I do my work” and “My
most recent performance rating is based on the effort I put into the job.”
The presence of organizational norms or political pressure may cause a rater to
produce ratings that are not congruent with the prevailing equity norms and thus be seen as
unfair. Tziner, Prince, and Murphy (1997) used a 25- item instrument designed to measure
rater’s goals as related to political considerations to study organizational political influences.
A subset of this instrument is included in the scale “Concern Over Ratings”. Items included
in the “Concern Over Ratings” scale include “My rater is not the results of my rater trying to
avoid bad feelings among his or her employees” and “The rating I get is a result of my rater
applying performance rating standards consistently across employees.” The content of the
scales representing Configural Justice is presented in Table 2.
Interpersonal Justice Scales
Interpersonal and informational justice perceptions are part of the important social
and interactonal dimension of performance appraisal practices (Bies, 1986; Greenberg,
1993). Interpersonal justice concerns the perceptions by the ratee of the way in which they
are treated by the rater. Interpersonal justice has a distributive component as well as a social
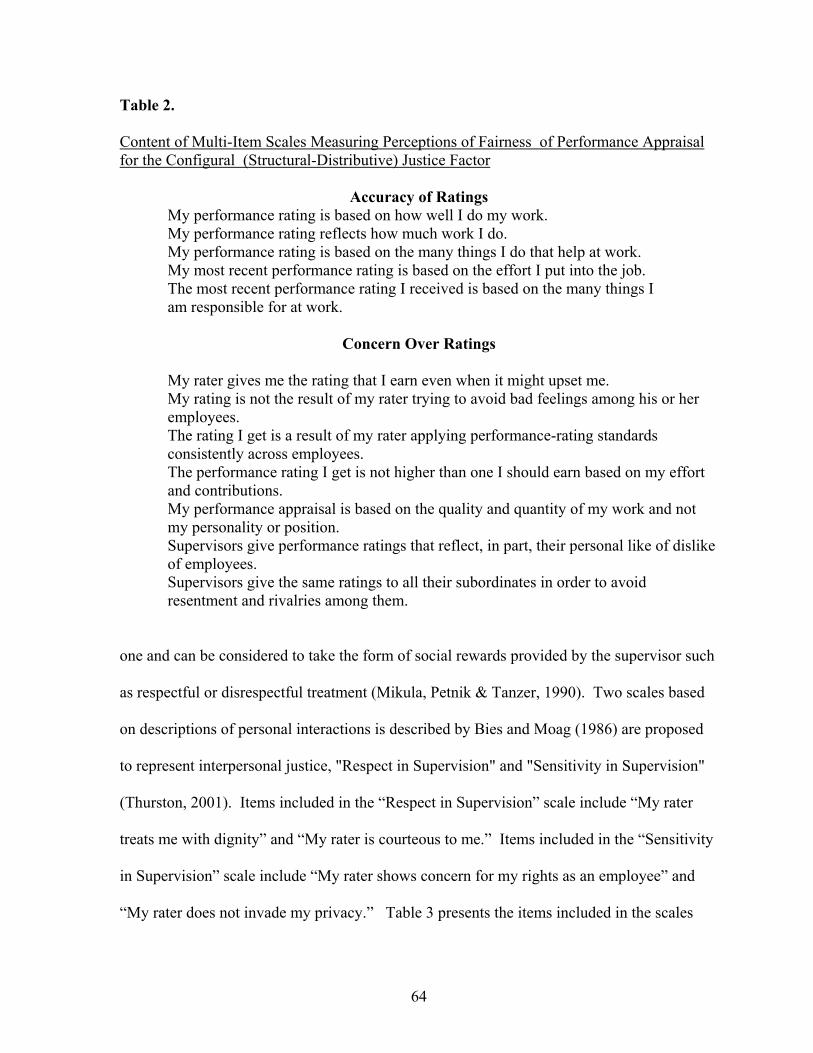
64
Table 2. Content of Multi-Item Scales Measuring Perceptions of Fairness of Performance Appraisal for the Configural (Structural-Distributive) Justice Factor
Accuracy of Ratings
My performance rating is based on how well I do my work. My performance rating reflects how much work I do. My performance rating is based on the many things I do that help at work. My most recent performance rating is based on the effort I put into the job. The most recent performance rating I received is based on the many things I
am responsible for at work.
Concern Over Ratings
My rater gives me the rating that I earn even when it might upset me. My rating is not the result of my rater trying to avoid bad feelings among his or her
employees. The rating I get is a result of my rater applying performance-rating standards
consistently across employees. The performance rating I get is not higher than one I should earn based on my effort
and contributions. My performance appraisal is based on the quality and quantity of my work and not
my personality or position. Supervisors give performance ratings that reflect, in part, their personal like of dislike
of employees. Supervisors give the same ratings to all their subordinates in order to avoid resentment and rivalries among them.
one and can be considered to take the form of social rewards provided by the supervisor such
as respectful or disrespectful treatment (Mikula, Petnik & Tanzer, 1990). Two scales based
on descriptions of personal interactions is described by Bies and Moag (1986) are proposed
to represent interpersonal justice, "Respect in Supervision" and "Sensitivity in Supervision"
(Thurston, 2001). Items included in the “Respect in Supervision” scale include “My rater
treats me with dignity” and “My rater is courteous to me.” Items included in the “Sensitivity
in Supervision” scale include “My rater shows concern for my rights as an employee” and
“My rater does not invade my privacy.” Table 3 presents the items included in the scales
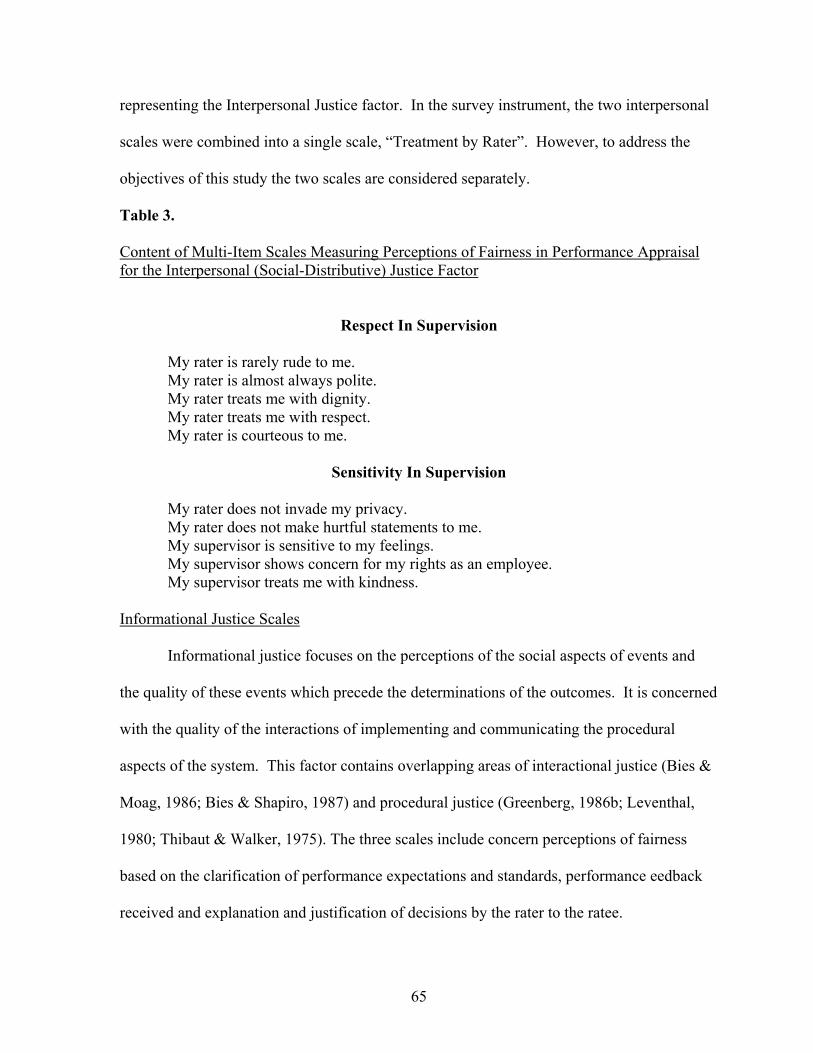
65
representing the Interpersonal Justice factor. In the survey instrument, the two interpersonal
scales were combined into a single scale, “Treatment by Rater”. However, to address the
objectives of this study the two scales are considered separately.
Table 3. Content of Multi-Item Scales Measuring Perceptions of Fairness in Performance Appraisal for the Interpersonal (Social-Distributive) Justice Factor
Respect In Supervision
My rater is rarely rude to me. My rater is almost always polite. My rater treats me with dignity. My rater treats me with respect. My rater is courteous to me.
Sensitivity In Supervision
My rater does not invade my privacy. My rater does not make hurtful statements to me. My supervisor is sensitive to my feelings. My supervisor shows concern for my rights as an employee. My supervisor treats me with kindness.
Informational Justice Scales
Informational justice focuses on the perceptions of the social aspects of events and
the quality of these events which precede the determinations of the outcomes. It is concerned
with the quality of the interactions of implementing and communicating the procedural
aspects of the system. This factor contains overlapping areas of interactional justice (Bies &
Moag, 1986; Bies & Shapiro, 1987) and procedural justice (Greenberg, 1986b; Leventhal,
1980; Thibaut & Walker, 1975). The three scales include concern perceptions of fairness
based on the clarification of performance expectations and standards, performance eedback
received and explanation and justification of decisions by the rater to the ratee.
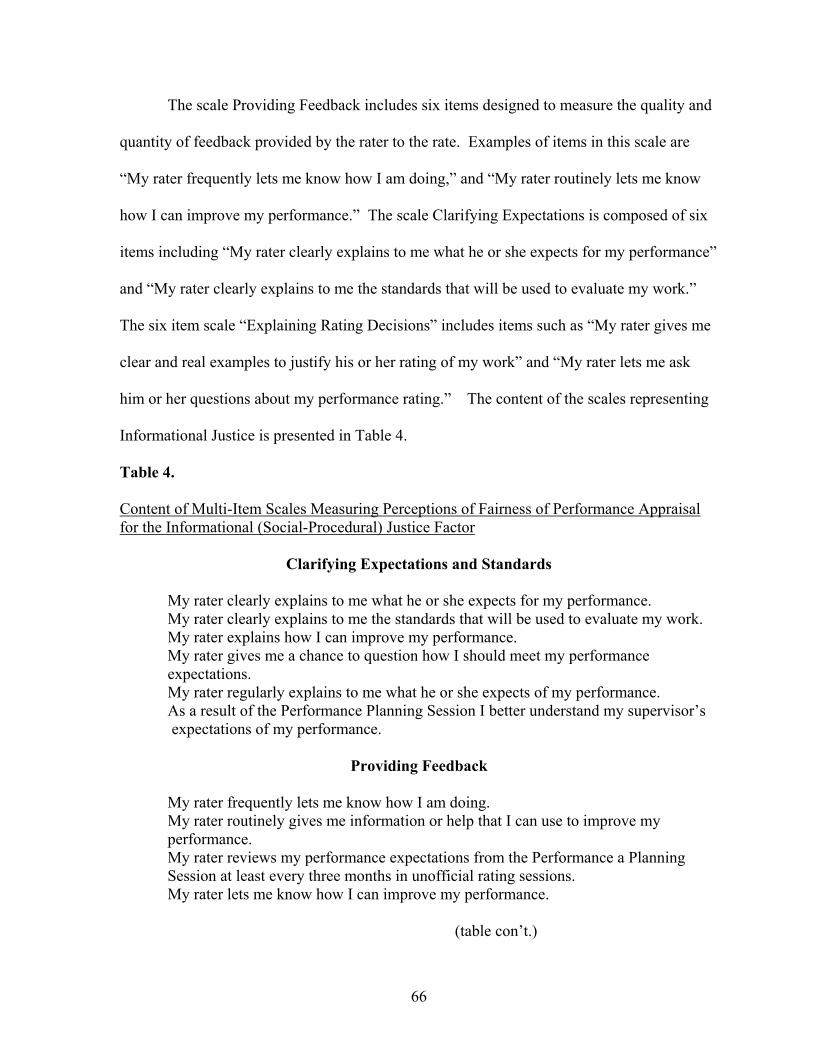
66
The scale Providing Feedback includes six items designed to measure the quality and
quantity of feedback provided by the rater to the rate. Examples of items in this scale are
“My rater frequently lets me know how I am doing,” and “My rater routinely lets me know
how I can improve my performance.” The scale Clarifying Expectations is composed of six
items including “My rater clearly explains to me what he or she expects for my performance”
and “My rater clearly explains to me the standards that will be used to evaluate my work.”
The six item scale “Explaining Rating Decisions” includes items such as “My rater gives me
clear and real examples to justify his or her rating of my work” and “My rater lets me ask
him or her questions about my performance rating.” The content of the scales representing
Informational Justice is presented in Table 4.
Table 4. Content of Multi-Item Scales Measuring Perceptions of Fairness of Performance Appraisal for the Informational (Social-Procedural) Justice Factor
Clarifying Expectations and Standards
My rater clearly explains to me what he or she expects for my performance. My rater clearly explains to me the standards that will be used to evaluate my work. My rater explains how I can improve my performance. My rater gives me a chance to question how I should meet my performance
expectations. My rater regularly explains to me what he or she expects of my performance. As a result of the Performance Planning Session I better understand my supervisor’s
expectations of my performance.
Providing Feedback
My rater frequently lets me know how I am doing. My rater routinely gives me information or help that I can use to improve my
performance. My rater reviews my performance expectations from the Performance a Planning
Session at least every three months in unofficial rating sessions. My rater lets me know how I can improve my performance.
(table con’t.)
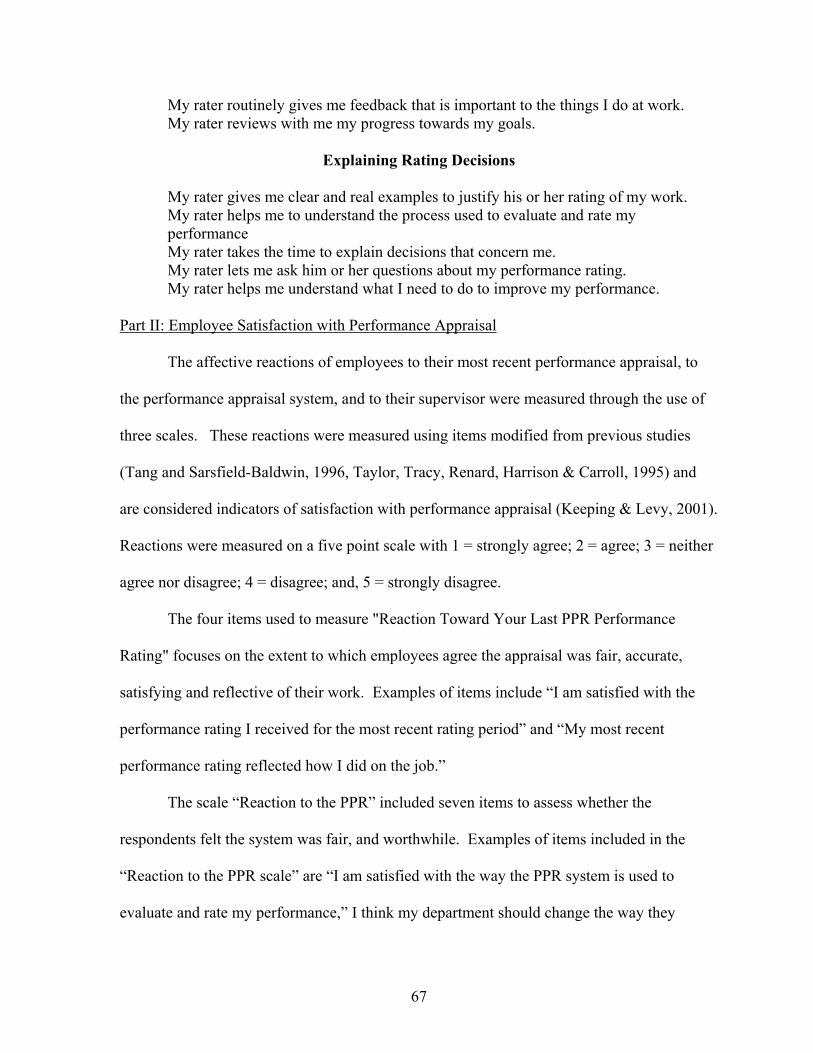
67
My rater routinely gives me feedback that is important to the things I do at work. My rater reviews with me my progress towards my goals.
Explaining Rating Decisions
My rater gives me clear and real examples to justify his or her rating of my work. My rater helps me to understand the process used to evaluate and rate my performance My rater takes the time to explain decisions that concern me. My rater lets me ask him or her questions about my performance rating. My rater helps me understand what I need to do to improve my performance.
Part II: Employee Satisfaction with Performance Appraisal
The affective reactions of employees to their most recent performance appraisal, to
the performance appraisal system, and to their supervisor were measured through the use of
three scales. These reactions were measured using items modified from previous studies
(Tang and Sarsfield-Baldwin, 1996, Taylor, Tracy, Renard, Harrison & Carroll, 1995) and
are considered indicators of satisfaction with performance appraisal (Keeping & Levy, 2001).
Reactions were measured on a five point scale with 1 = strongly agree; 2 = agree; 3 = neither
agree nor disagree; 4 = disagree; and, 5 = strongly disagree.
The four items used to measure "Reaction Toward Your Last PPR Performance
Rating" focuses on the extent to which employees agree the appraisal was fair, accurate,
satisfying and reflective of their work. Examples of items include “I am satisfied with the
performance rating I received for the most recent rating period” and “My most recent
performance rating reflected how I did on the job.”
The scale “Reaction to the PPR” included seven items to assess whether the
respondents felt the system was fair, and worthwhile. Examples of items included in the
“Reaction to the PPR scale” are “I am satisfied with the way the PPR system is used to
evaluate and rate my performance,” I think my department should change the way they
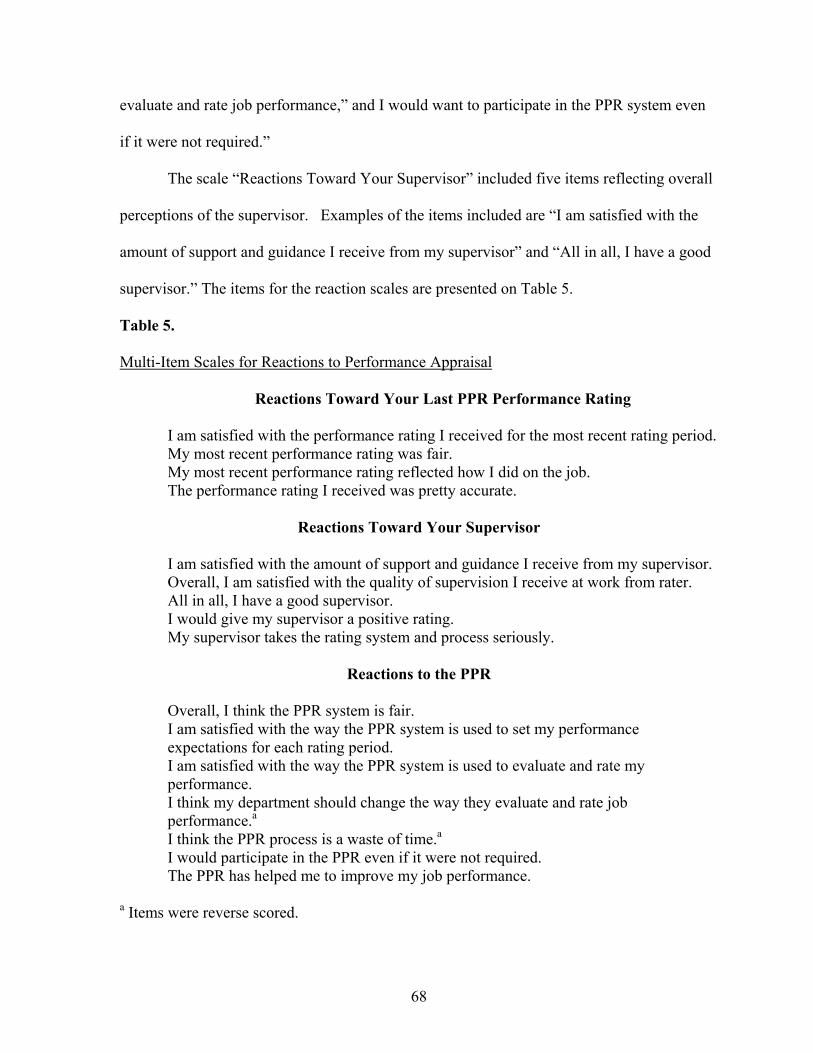
68
evaluate and rate job performance,” and I would want to participate in the PPR system even
if it were not required.”
The scale “Reactions Toward Your Supervisor” included five items reflecting overall
perceptions of the supervisor. Examples of the items included are “I am satisfied with the
amount of support and guidance I receive from my supervisor” and “All in all, I have a good
supervisor.” The items for the reaction scales are presented on Table 5.
Table 5.
Multi-Item Scales for Reactions to Performance Appraisal
Reactions Toward Your Last PPR Performance Rating
I am satisfied with the performance rating I received for the most recent rating period. My most recent performance rating was fair. My most recent performance rating reflected how I did on the job. The performance rating I received was pretty accurate.
Reactions Toward Your Supervisor
I am satisfied with the amount of support and guidance I receive from my supervisor. Overall, I am satisfied with the quality of supervision I receive at work from rater. All in all, I have a good supervisor. I would give my supervisor a positive rating. My supervisor takes the rating system and process seriously.
Reactions to the PPR
Overall, I think the PPR system is fair. I am satisfied with the way the PPR system is used to set my performance expectations for each rating period. I am satisfied with the way the PPR system is used to evaluate and rate my performance. I think my department should change the way they evaluate and rate job performance.a I think the PPR process is a waste of time.a I would participate in the PPR even if it were not required. The PPR has helped me to improve my job performance.
a Items were reverse scored.
69
Part III: The Demographic Questionnaire
The Demographic Data Questionnaire requested a limited amount of information
related to personal and professional demographic characteristics. Content validity was
established by a panel of experts consisting of human resource department staff,
representatives of other departments in which the performance appraisal system is used and
representatives of the State Civil Service Department. The following variables were
measured: Age, ethnic background, gender, number of years with the department, number of
years in the current job, educational level, Civil Service Classification or EEOC code, and
supervisory responsibility. The effect of demographic characteristics in the performance
appraisal process has been found to vary in different studies. Some researchers have found
little to no significance of demographic characteristics on the perceptions of performance
appraisal process or its outcomes while others have shown mixed results. However, from a
practitioner point of view if different groups of employees are shown to perceive the
performance appraisal system differently, interventions to improve the process might be
structures to address specific groups more effectively.
Analysis of Data
The data were analyzed according to the objectives of the study. The individual
analysis of each objective is presented in this section.
Objective 1
Objective 1 described participants based on specific demographic characteristics.
Demographic characteristics were summarized using frequencies and percentages for all
70
variables including: age; gender; ethnic group; job classification; years on the job; years in
the department; educational level; and supervisory responsibility.
Objective 2
Objective 2 included determination of indications of performance appraisal
satisfaction using three reaction scales including “Reactions to the PPR”; “Reactions Toward
Your Most Recent PPR Performance Rating”; and, “Reactions Toward Your Supervisor.
Reactions to performance appraisal were measured on a five point scale with 1 = strongly
agree; 2 = agree; 3 = neither agree nor disagree; 4 = disagree; and, 5 = strongly disagree. To
aid in the interpretation of these scales, the researcher established an interpretive scale for the
results as follows: 1.50 or less = Strongly Agree; 1.51-2.5 = Agree; 2.51 – 3.49 = Neither
Agree nor Disagree; 3.50 – 4.49 = Disagree; and 4.5 or greater = Strongly Disagree.
The mean and standard deviation were calculated for each item in each of the three
scales. To further summarize the findings from the responses to the individual scales, the
factor analysis procedure was used on each of the individual scales to determine if the items
assigned to the three scales were components of a common construct for each scale. To
accomplish this, a principal component factor analysis was used for each scale with the
specification that all items be forced into a single factor. This procedure allows the
researcher to determine if the items included as part of the scale will produce factor loadings
indicating that they can be considered to be part of a single construct. For the purposes of
this study, a minimum loading of .50 was used to establish verification of the unity of the
scales.
If the individual factor analysis of each of the three scales determined that the items
measured a single construct, an overall score for the items in the scales was calculated as the
71
mean of the ratings assigned to the individual items in each scale. The Cronbach’s alpha
internal consistency coefficient was used to estimate the reliability of each of the three scales.
Acceptable limits of alpha were set at a minimum of .70. This standard of reliability is
consistent with recommendations for research designed to make decisions affecting groups
(Nunnally & Bernstein, 1994).
Objective 3
This objective involved describing employee satisfaction with the performance
appraisal system as evaluated by measuring perceptions of fairness based on organizational
justice theory. Responses to the ten scales representing perceptions of performance appraisal
fairness based on the hypothesized four-factor model were analyzed. The items measuring
perceptions to the fairness of performance appraisal were measured on a five point scale with
1 = strongly agree; 2 = agree; 3 = neither agree nor disagree; 4 = disagree; and, 5 = strongly
disagree. To aid in the interpretation of these scales, the researcher established an
interpretive scale for the results as follows: 1.50 or less = Strongly Agree; 1.51-2.5 = Agree;
2.51 – 3.49 = Neither Agree nor Disagree; 3.50 – 4.49 = Disagree; and 4.5 or greater =
Strongly Disagree.
The following procedure was conducted for the group of items assigned to each of the
ten scales in ten separate analyses. The mean and standard deviation were calculated for
each item in each of the ten scales. To further summarize the findings from the item
responses for each scale, the following procedure was used. The factor analysis procedure
was applied to determine if the items assigned to the individual scale were components of a
common construct. To accomplish this, a principal component factor analysis was used for
each scale with the specification that all items be forced into a single factor. This procedure
72
allows the researcher to determine if the items included as part of the scale will produce
factor loadings indicating that they can be considered to be part of a single construct. For the
purposes of this study, a minimum loading of .50 was used to establish verification of the
unity of the scales.
If the individual factor analysis of scale determined that the items measured a single
construct, an overall score for the items in the scale was calculated as the mean of the ratings
of the items. The Cronbach’s alpha internal consistency coefficient was used to estimate the
reliability of each of the ten scales. Acceptable limits of alpha were set at a minimum of .70.
This standard of reliability is consistent with recommendations for research designed to make
decisions affecting groups (Nunnally & Bernstein, 1994).
Objective 4
This objective measured the relationships between the fairness and justice scales and
the selected demographic characteristics, appropriate correlation coefficients and/or
comparative measures were used as described below.
a. Age: The relationships between perceptions of fairness of performance
appraisal as measured by the ten scales of justice with the independent
variable age were evaluated using the Kendall’s Tau correlation
coefficient.
b. Gender: The independent t-test was used to determine if differences in
perceptions of performance appraisal fairness as measured by the ten
scales of justice existed based on gender.
c. Ethnicity: The independent t-test was used to determine if differences in
perceptions of performance appraisal fairness as measured by the ten
73
scales of justice by race. The t-test was selected after it was determined
that nearly 92 percent of all respondents were either Caucasian or
African-American. The other four racial groups represented in the study
had fewer than ten respondents each making statistical comparisons
impractical. The other respondents which accounted for less than five
percent of the total were divided between categories of Asian; Hispanic;
Native American; and, other.
d. Tenure in department and in current job: Relationships between tenure
with the department and length of time in the current job and perceptions
of performance appraisal fairness as measured by the ten scales
representing fairness were evaluated using the Kendall’s Tau correlation
coefficient.
e. Highest Level of Education: The analysis of variance procedure was
used to determine if differences existed in the perceptions of
performance appraisal fairness as measured by the ten scales of justice
by categories of the variable, highest level of education completed.
f. Job Classification: The analysis of variance was used to determine if
differences existed in the perceptions of performance appraisal fairness
as measured by the ten scales of justice and the independent variable, job
classification.
Objective 5
An independent t-test was used to determine if significant differences existed in the
perceptions of performance appraisal fairness as measured by the ten scales of justice by the
74
category of supervisory responsibility, specifically between those respondents reporting
supervisory responsibility and those who reported no such responsibility.
The hypotheses proposed by this study were tested using a variety of statistical
methods.
Hypothesis 1
The ten scales of organizational justice as applied to performance appraisal will form
four distinct constructs which conform to Greenberg's 1993 four factor Taxonomy of
Organizational Justice with data collected from the employees of selected public funded
organizations that utilize a state civil service employment system and a standardized
performance appraisal system.
The hypothesis was tested through confirmatory factor analysis conducted using the
LISREL 8.51 (Joreskog & Sorbom, 1993) structural equation model (SEM). Unlike
exploratory factor analysis, structural equation modeling can play a confirmatory role by
enabling the researcher control over the specification of indicators for each construct.
Additionally, SEM allows for a statistical test of the goodness of fit for the proposed factor
solution. “Confirmatory factor analysis is particularly useful in the validation of scales for
the measurement of specific constructs,” (Hair, Anderson, Tatham, & Black, 1998, p. 617).
Confirmatory factor analysis utilizing the covariance matrix (Appendix C) for the ten scales
measuring perceptions of fairness in performance appraisal was conducted using the LISREL
8-51 (Joreskog & Sorbum, 1993). To create the covariance e matrix, data were imported
from an SPSS file using a PRELIS command. The structural equation modeling method
analyzes the observed covariance matrix of a set of variables in terms of a hypothesized
structure. Selected goodness of fit indices generated by the model was evaluated to
75
determine absolute goodness of fit of the hypothesized four factor model to the data. The
most essential measure of overall fit is the chi-square statistic (Joreskog & Sorbom, 1984).
However, the chi-square fit index is extremely sensitive to sample size and violations of the
assumption of multivariate normality. Alternate fit indexes should be considered and no
single index should be relied upon exclusively (Bollen & Long, 1993). The indices selected
for evaluation included the traditional chi-square test, Joreskog and Sorbom’s (1993)
goodness of fit index (GFI), the comparative fit index (CFI), the non-normed fit index
(NNFI) and the root mean square residual (RMR). The GFI can be considered measures of
the relative amount of variance and covariance in the data accounted for by the model being
tested. The CFI is an index of a model fit that compares the theoretical model with a poorly
fitting model. The CFI can range from 0 to 1.00. Values closer to 1.00 indicate better fitting
models. It is generally recognized that GFI and CFI values close to or above .90 indicate
satisfactory model fit. The RMR is a measure of the average of the fitted residuals
(unexplained variances and co-variances) in the model. This index should close to zero if the
data fit the model. The non-normed fit index (NNFI) compares the model being tested to a
baseline (null) model taking into account the degrees of freedom and is considered a relative
fit index.
Since proving that a model has an acceptable fit only confirms that the model may be
one of several plausible models that are acceptable, a competing models strategy was used to
compare the hypothesized four-factor model to several other theoretically based models.
The models selected for the competing model strategy were based on “simpler” (less
constrained) models of organizational justice suggested in the literature. Beginning with the
most loosely constrained model, more constraints in the form of constructs or factors, were
76
subsequently added until the most restrictive model, the hypothesized four-factor of justice
(Greenberg, 1993) was tested. The most loosely constrained model was a single factor model
combining all four factors and all ten scales.
To be consistent with the four-factor theoretical structure utilized throughout this
study, the four factors were maintained as categories during this analysis although they were
combined with other factors to form more general constructs. For instance in the first two-
factor model tested, the systemic justice factor was combined with the configural justice
factor to form a “structural” factor. The allocation of the individual subscales to the four
factors was also held constant.
After the first unconstrained model was tested, two different two-factor models were
tested. The first two-factor model included structural and social constructs. The structural
construct included the systemic justice factor and the associated scales and the configural
justice factor and scales. The social construct included the informational and interpersonal
constructs. The second two-factor model reflects a more traditional approach including the
procedural and distributive constructs (Greenberg, 1986a; Tang & Sarsfield-Baldwin, 1996).
The procedural construct includes the systemic and informational factors and the distributive
construct is comprised of the configural and interpersonal factors.
Two three-factor models were then derived from each of the two factor models.
Moorman (1991) indicated the presence of three underlying factors (distributive, procedural
and interactional). Moorman combined some of the informational scales with systemic
scales to form the procedural justice construct and combined other information scales with
interpersonal and configural scales to form an interactional justice construct. Skarlicki and
Folger (1997) also proposed a three-factor model which included procedural, distributive and
77
interactional factors. The more restrictive models were based on allocating the scales and
factors according to organizational justice theories that reflect the uncertainty over the
relationships of social and interactional constructs to the more traditional and accepted
factors of procedural and distributive justice. The competing models were compared using
the fit indices presented in this section. Figure 3 shows the structure of the competing
models tested in this analysis.
Hypothesis 2:
Hypothesis 2 suggests that a positive relationship exists between the scales measuring
configural justice (structural-distributive form), including the scales of "Accuracy of Rating",
and "Concern Over Ratings", and satisfaction with the performance appraisal system being
used as measured by the scale “Reactions to Your Last PPR Performance Rating” and the
scale “Reactions to the PPR”. The Pearson Product Moment correlation coefficient was used
to evaluate the relationships.
Hypothesis 3
This hypothesis proposes that a positive relationship will exist between the scales
representing interpersonal justice which include "Respect in Supervision" and "Sensitivity in
Supervision" and satisfaction with the performance appraisal system as measured by the
reaction scale of "Reactions Toward Your Supervisor." Analysis of this these relationships
was accomplished by applying the Pearson Product Moment correlation coefficient.
Hypothesis 4
Hypothesis 4 proposes that a positive relationship will exist between scales measuring
informational justice including the scales of "Clarifying Expectations", "Providing
Feedback", and "Explaining Decisions", and satisfaction with performance appraisal as
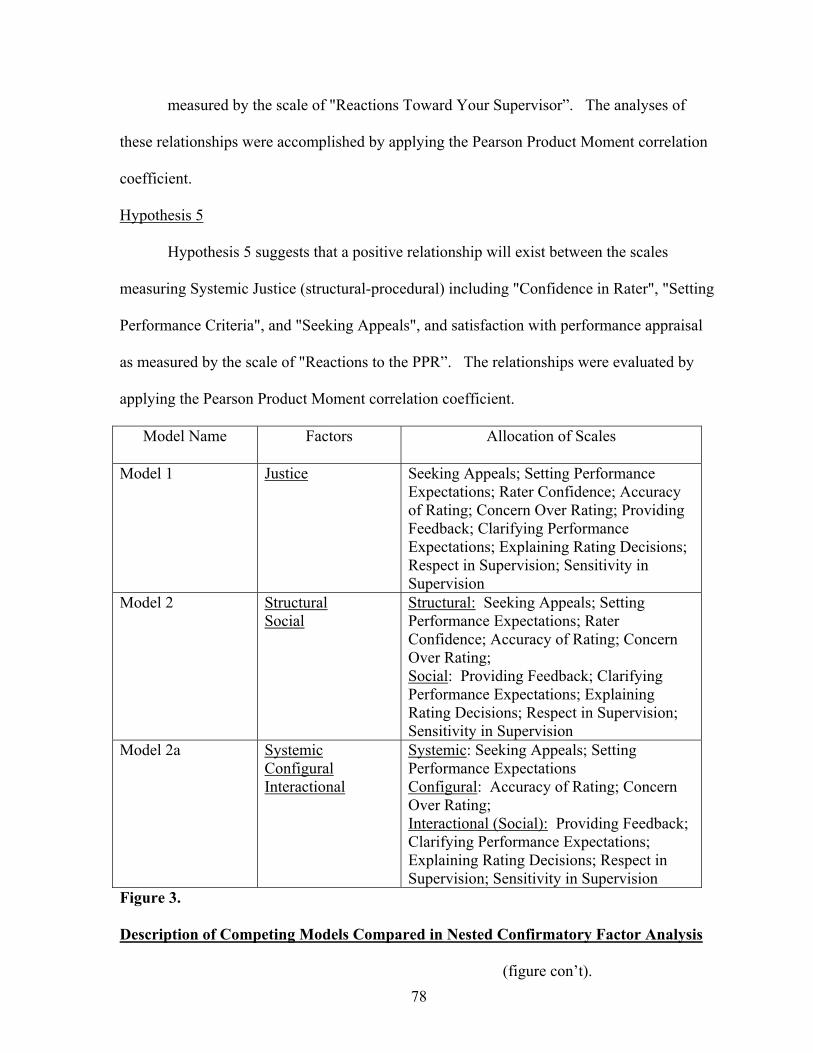
78
measured by the scale of "Reactions Toward Your Supervisor”. The analyses of
these relationships were accomplished by applying the Pearson Product Moment correlation
coefficient.
Hypothesis 5
Hypothesis 5 suggests that a positive relationship will exist between the scales
measuring Systemic Justice (structural-procedural) including "Confidence in Rater", "Setting
Performance Criteria", and "Seeking Appeals", and satisfaction with performance appraisal
as measured by the scale of "Reactions to the PPR”. The relationships were evaluated by
applying the Pearson Product Moment correlation coefficient.
Model Name Factors Allocation of Scales
Model 1 Justice Seeking Appeals; Setting Performance Expectations; Rater Confidence; Accuracy of Rating; Concern Over Rating; Providing Feedback; Clarifying Performance Expectations; Explaining Rating Decisions; Respect in Supervision; Sensitivity in Supervision
Model 2 Structural Social
Structural: Seeking Appeals; Setting Performance Expectations; Rater Confidence; Accuracy of Rating; Concern Over Rating; Social: Providing Feedback; Clarifying Performance Expectations; Explaining Rating Decisions; Respect in Supervision; Sensitivity in Supervision
Model 2a Systemic Configural Interactional
Systemic: Seeking Appeals; Setting Performance Expectations Configural: Accuracy of Rating; Concern Over Rating; Interactional (Social): Providing Feedback; Clarifying Performance Expectations; Explaining Rating Decisions; Respect in Supervision; Sensitivity in Supervision
Figure 3. Description of Competing Models Compared in Nested Confirmatory Factor Analysis (figure con’t).
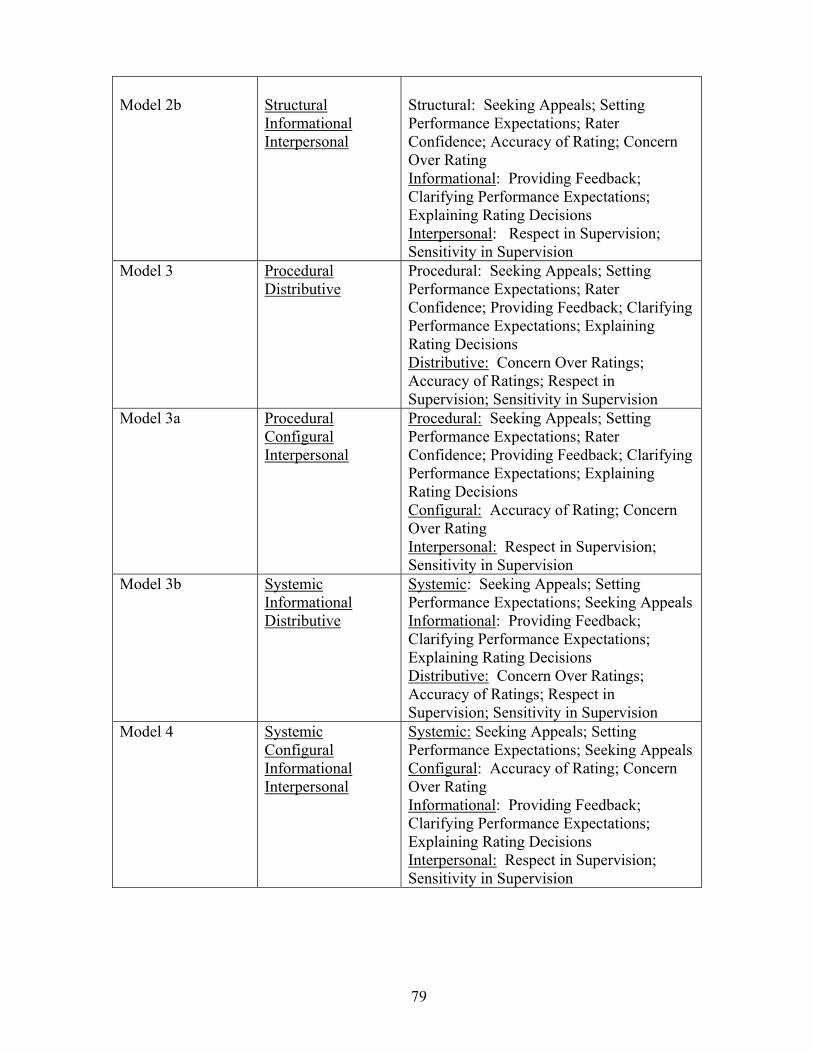
79
Model 2b
Structural Informational Interpersonal
Structural: Seeking Appeals; Setting Performance Expectations; Rater Confidence; Accuracy of Rating; Concern Over Rating Informational: Providing Feedback; Clarifying Performance Expectations; Explaining Rating Decisions Interpersonal: Respect in Supervision; Sensitivity in Supervision
Model 3 Procedural Distributive
Procedural: Seeking Appeals; Setting Performance Expectations; Rater Confidence; Providing Feedback; Clarifying Performance Expectations; Explaining Rating Decisions Distributive: Concern Over Ratings; Accuracy of Ratings; Respect in Supervision; Sensitivity in Supervision
Model 3a Procedural Configural Interpersonal
Procedural: Seeking Appeals; Setting Performance Expectations; Rater Confidence; Providing Feedback; Clarifying Performance Expectations; Explaining Rating Decisions Configural: Accuracy of Rating; Concern Over Rating Interpersonal: Respect in Supervision; Sensitivity in Supervision
Model 3b Systemic Informational Distributive
Systemic: Seeking Appeals; Setting Performance Expectations; Seeking Appeals Informational: Providing Feedback; Clarifying Performance Expectations; Explaining Rating Decisions Distributive: Concern Over Ratings; Accuracy of Ratings; Respect in Supervision; Sensitivity in Supervision
Model 4 Systemic Configural Informational Interpersonal
Systemic: Seeking Appeals; Setting Performance Expectations; Seeking Appeals Configural: Accuracy of Rating; Concern Over Rating Informational: Providing Feedback; Clarifying Performance Expectations; Explaining Rating Decisions Interpersonal: Respect in Supervision; Sensitivity in Supervision
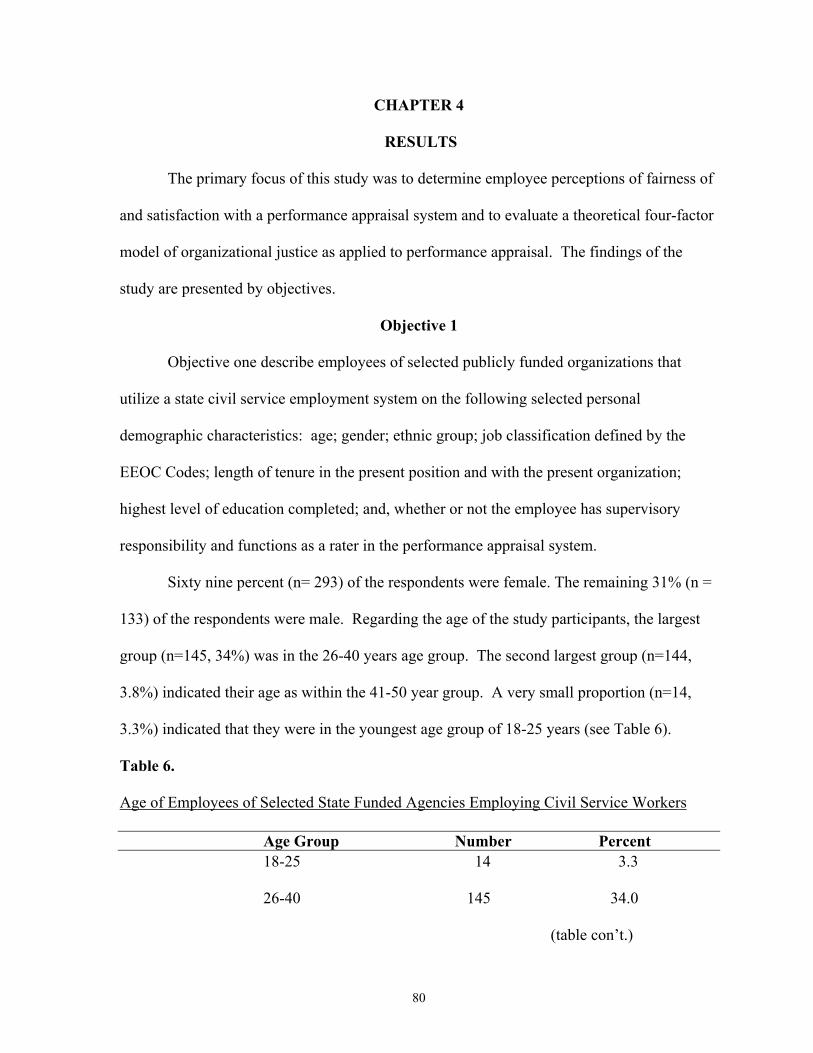
80
CHAPTER 4
RESULTS
The primary focus of this study was to determine employee perceptions of fairness of
and satisfaction with a performance appraisal system and to evaluate a theoretical four-factor
model of organizational justice as applied to performance appraisal. The findings of the
study are presented by objectives.
Objective 1
Objective one describe employees of selected publicly funded organizations that
utilize a state civil service employment system on the following selected personal
demographic characteristics: age; gender; ethnic group; job classification defined by the
EEOC Codes; length of tenure in the present position and with the present organization;
highest level of education completed; and, whether or not the employee has supervisory
responsibility and functions as a rater in the performance appraisal system.
Sixty nine percent (n= 293) of the respondents were female. The remaining 31% (n =
133) of the respondents were male. Regarding the age of the study participants, the largest
group (n=145, 34%) was in the 26-40 years age group. The second largest group (n=144,
3.8%) indicated their age as within the 41-50 year group. A very small proportion (n=14,
3.3%) indicated that they were in the youngest age group of 18-25 years (see Table 6).
Table 6. Age of Employees of Selected State Funded Agencies Employing Civil Service Workers
Age Group Number Percent 18-25 14 3.3
26-40 145 34.0
(table con’t.)
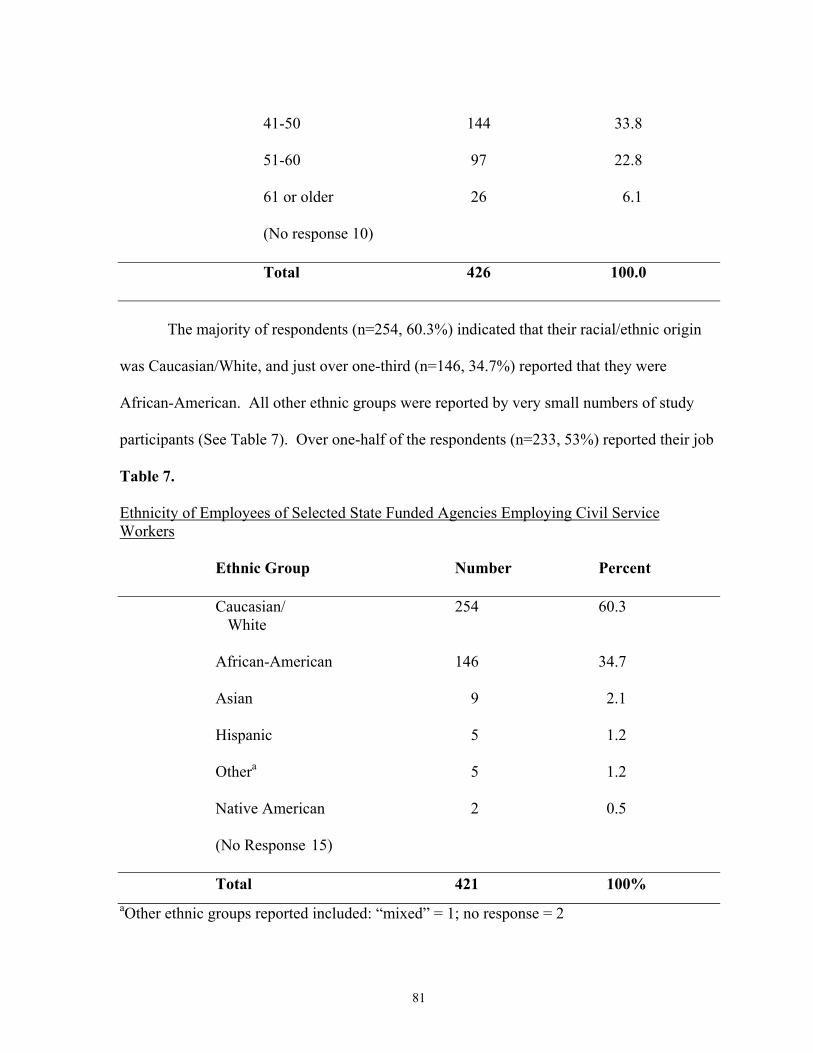
81
41-50 144 33.8 51-60 97 22.8 61 or older 26 6.1
(No response 10)
Total 426 100.0
The majority of respondents (n=254, 60.3%) indicated that their racial/ethnic origin
was Caucasian/White, and just over one-third (n=146, 34.7%) reported that they were
African-American. All other ethnic groups were reported by very small numbers of study
participants (See Table 7). Over one-half of the respondents (n=233, 53%) reported their job
Table 7. Ethnicity of Employees of Selected State Funded Agencies Employing Civil Service Workers
Ethnic Group Number Percent Caucasian/ 254 60.3 White
African-American 146 34.7 Asian 9 2.1
Hispanic 5 1.2 Othera 5 1.2 Native American 2 0.5
(No Response 15) Total 421 100% aOther ethnic groups reported included: “mixed” = 1; no response = 2
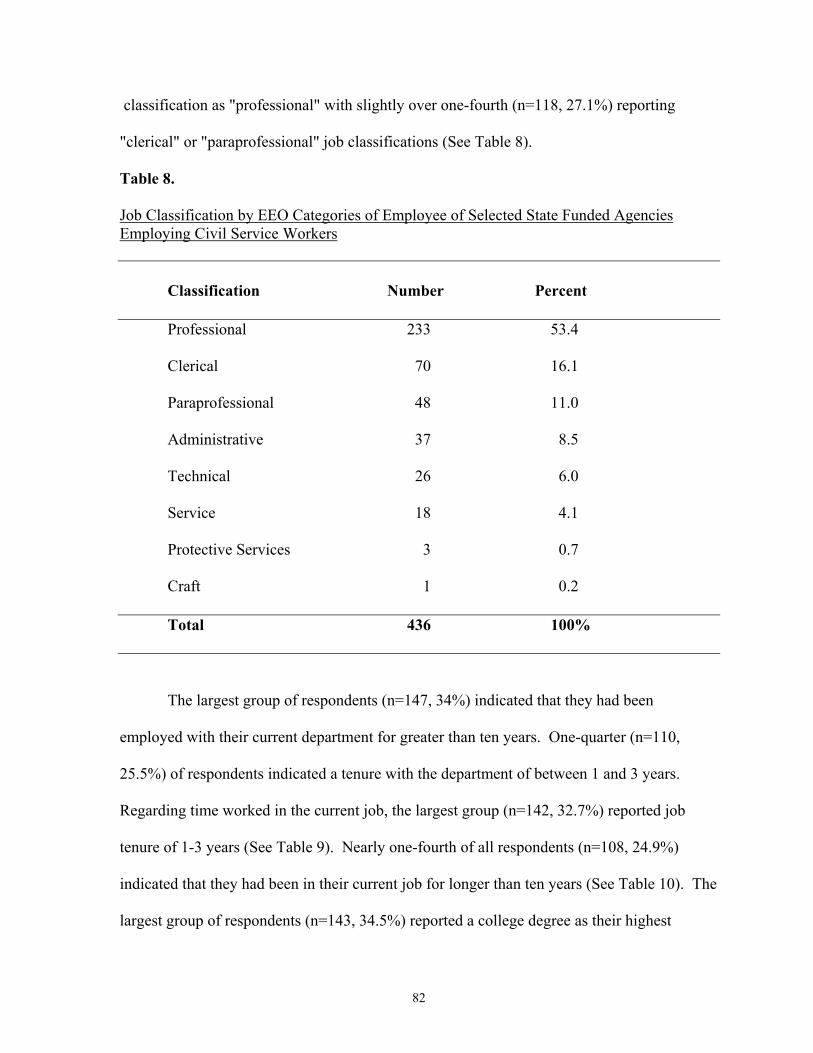
82
classification as "professional" with slightly over one-fourth (n=118, 27.1%) reporting
"clerical" or "paraprofessional" job classifications (See Table 8).
Table 8. Job Classification by EEO Categories of Employee of Selected State Funded Agencies Employing Civil Service Workers
Classification Number Percent
Professional 233 53.4 Clerical 70 16.1
Paraprofessional 48 11.0
Administrative 37 8.5
Technical 26 6.0 Service 18 4.1 Protective Services 3 0.7 Craft 1 0.2
Total 436 100%
The largest group of respondents (n=147, 34%) indicated that they had been
employed with their current department for greater than ten years. One-quarter (n=110,
25.5%) of respondents indicated a tenure with the department of between 1 and 3 years.
Regarding time worked in the current job, the largest group (n=142, 32.7%) reported job
tenure of 1-3 years (See Table 9). Nearly one-fourth of all respondents (n=108, 24.9%)
indicated that they had been in their current job for longer than ten years (See Table 10). The
largest group of respondents (n=143, 34.5%) reported a college degree as their highest
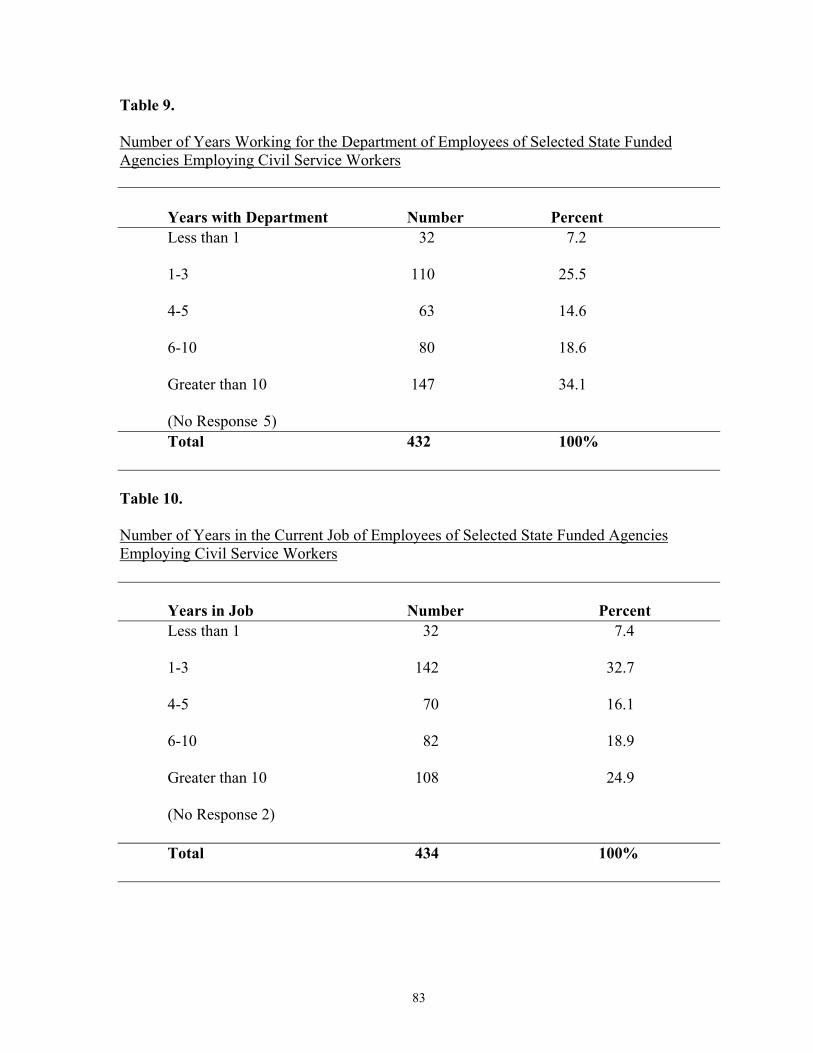
83
Table 9.
Number of Years Working for the Department of Employees of Selected State Funded Agencies Employing Civil Service Workers
Years with Department Number Percent Less than 1 32 7.2 1-3 110 25.5 4-5 63 14.6 6-10 80 18.6 Greater than 10 147 34.1
(No Response 5) Total 432 100%
Table 10. Number of Years in the Current Job of Employees of Selected State Funded Agencies Employing Civil Service Workers
Years in Job Number Percent Less than 1 32 7.4 1-3 142 32.7 4-5 70 16.1 6-10 82 18.9 Greater than 10 108 24.9 (No Response 2) Total 434 100%
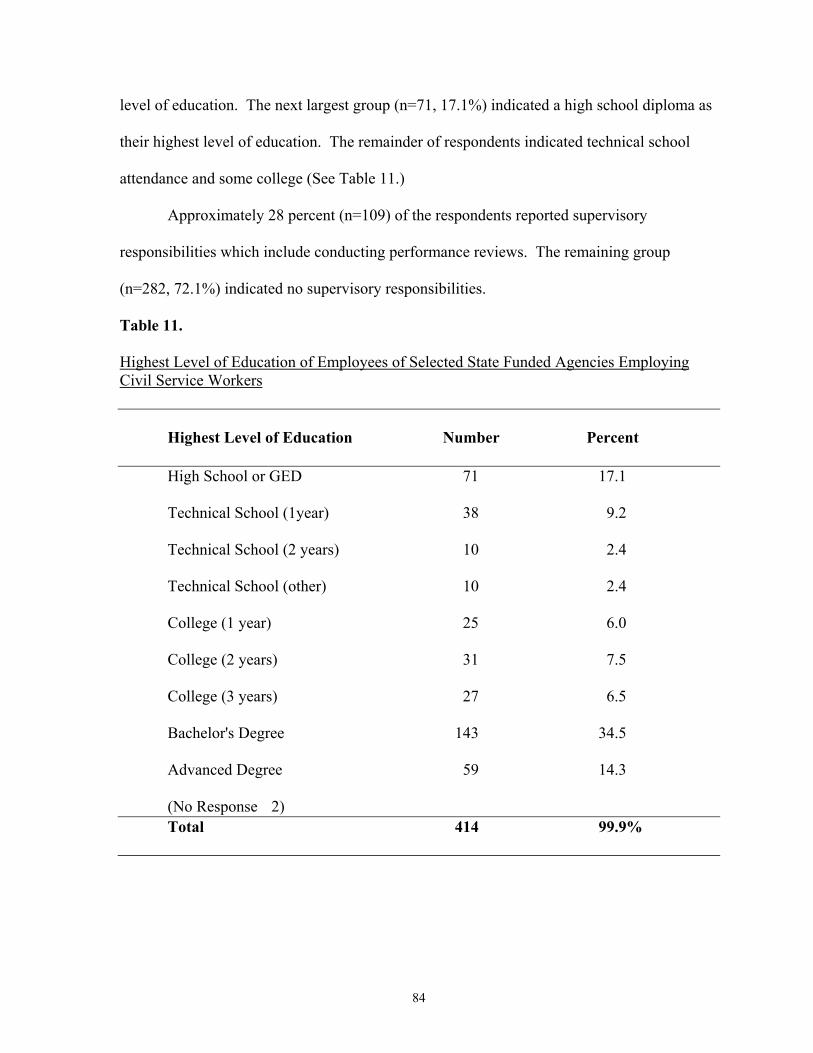
84
level of education. The next largest group (n=71, 17.1%) indicated a high school diploma as
their highest level of education. The remainder of respondents indicated technical school
attendance and some college (See Table 11.)
Approximately 28 percent (n=109) of the respondents reported supervisory
responsibilities which include conducting performance reviews. The remaining group
(n=282, 72.1%) indicated no supervisory responsibilities.
Table 11. Highest Level of Education of Employees of Selected State Funded Agencies Employing Civil Service Workers
Highest Level of Education Number Percent
High School or GED 71 17.1 Technical School (1year) 38 9.2 Technical School (2 years) 10 2.4 Technical School (other) 10 2.4 College (1 year) 25 6.0 College (2 years) 31 7.5 College (3 years) 27 6.5 Bachelor's Degree 143 34.5 Advanced Degree 59 14.3 (No Response 2) Total 414 99.9%
85
Objective 2
This objective is to determine the satisfaction with the performance appraisal system
currently being used as perceived by the employees of selected public funded organizations
that utilize a state civil service system as measured by the three reaction scales similar to
those proposed by Thurston (2001): “Reactions to the PPR”; “Reaction Toward Your Last
PPR Rating”; and, “Reaction Toward Your Supervisor.”
Reactions on all three scales were measured on a five point scale with 1 = strongly
agree; 2 = agree; 3 = neither agree nor disagree; 4 = disagree; and, 5 = strongly disagree. To
aid in the interpretation of these three scales, the researcher established an interpretive scale
for the results as follows: 1.50 or less = Strongly Agree; 1.51-2.5 = Agree; 2.51 – 3.49 =
Neither Agree nor Disagree; 3.50 – 4.49 = Disagree; and 4.5 or greater = Strongly Disagree.
Reactions Toward Your Last PPR Performance Rating
Respondents “Agreed” (item scores between 1.51 and 2.50) with all four of the items
included in the scale “Reactions Toward Your Last PPR Performance Rating”. The items
with which they most agreed were “My most recent performance rating was fair” (mean =
2.09) and “I am satisfied with the performance rating I received for the most recent rating
period” (mean = 2.09).
To further summarize the findings from the responses to this scale, the researcher
used the factor analysis procedure to determine if the items in the scale were components of a
common construct. To accomplish this, a principal components factor analysis was used
with the specification that all items be forced into a single factor. This procedure allows the
researcher to determine if the items included as part of the scale will produce factor loadings
indicating that they can be considered to be part of a single construct. For this purpose, a
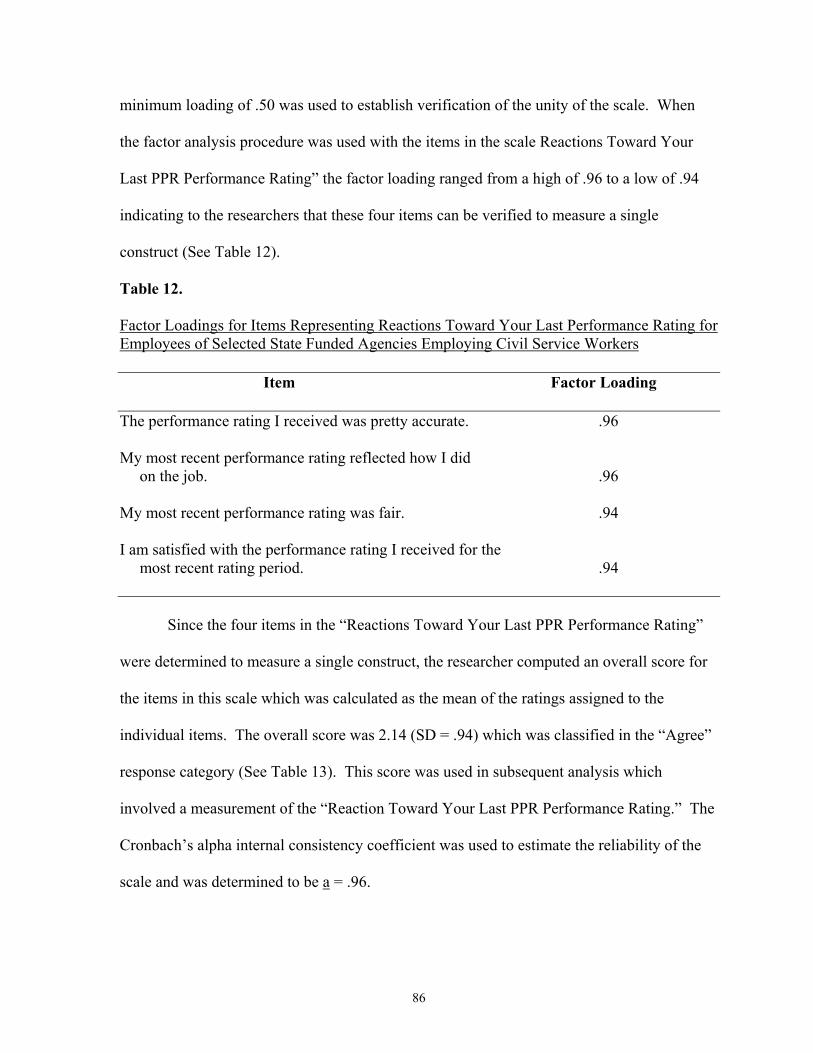
86
minimum loading of .50 was used to establish verification of the unity of the scale. When
the factor analysis procedure was used with the items in the scale Reactions Toward Your
Last PPR Performance Rating” the factor loading ranged from a high of .96 to a low of .94
indicating to the researchers that these four items can be verified to measure a single
construct (See Table 12).
Table 12.
Factor Loadings for Items Representing Reactions Toward Your Last Performance Rating for Employees of Selected State Funded Agencies Employing Civil Service Workers Item Factor Loading The performance rating I received was pretty accurate. .96 My most recent performance rating reflected how I did on the job. .96 My most recent performance rating was fair. .94 I am satisfied with the performance rating I received for the most recent rating period. .94
Since the four items in the “Reactions Toward Your Last PPR Performance Rating”
were determined to measure a single construct, the researcher computed an overall score for
the items in this scale which was calculated as the mean of the ratings assigned to the
individual items. The overall score was 2.14 (SD = .94) which was classified in the “Agree”
response category (See Table 13). This score was used in subsequent analysis which
involved a measurement of the “Reaction Toward Your Last PPR Performance Rating.” The
Cronbach’s alpha internal consistency coefficient was used to estimate the reliability of the
scale and was determined to be a = .96.
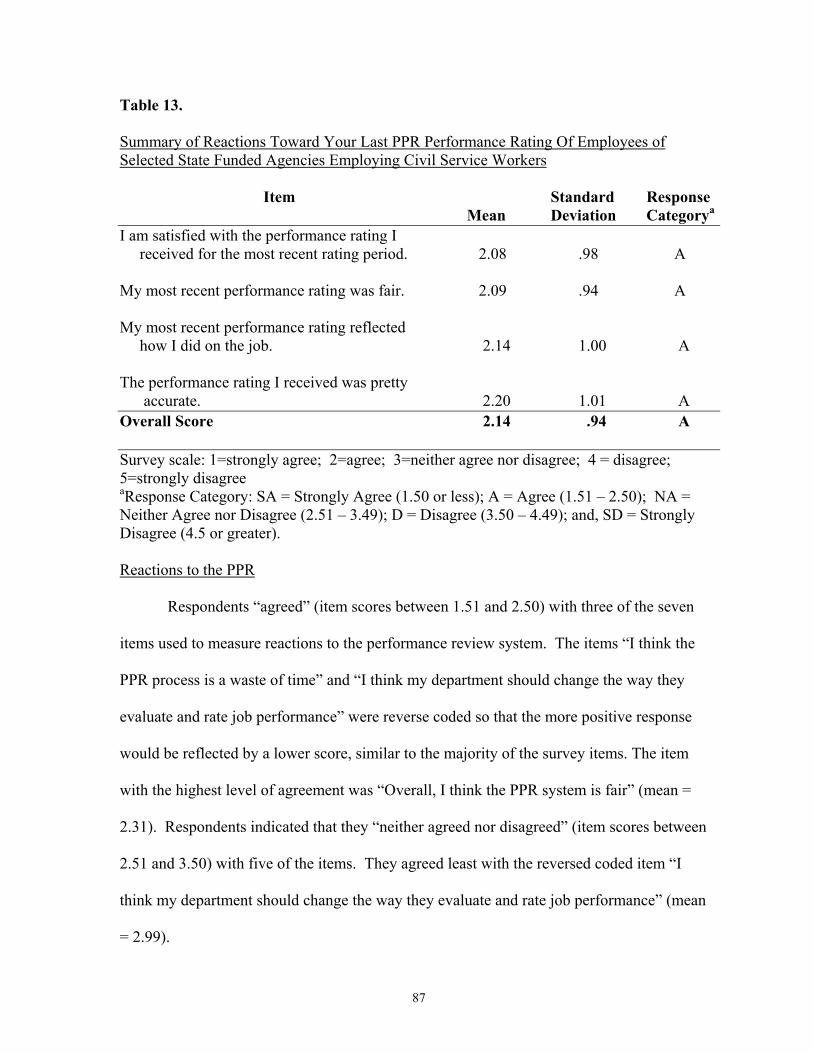
87
Table 13. Summary of Reactions Toward Your Last PPR Performance Rating Of Employees of Selected State Funded Agencies Employing Civil Service Workers Item Standard Response Mean Deviation Categorya I am satisfied with the performance rating I received for the most recent rating period. 2.08 .98 A My most recent performance rating was fair. 2.09 .94 A My most recent performance rating reflected how I did on the job. 2.14 1.00 A The performance rating I received was pretty accurate. 2.20 1.01 A Overall Score 2.14 .94 A Survey scale: 1=strongly agree; 2=agree; 3=neither agree nor disagree; 4 = disagree; 5=strongly disagree aResponse Category: SA = Strongly Agree (1.50 or less); A = Agree (1.51 – 2.50); NA = Neither Agree nor Disagree (2.51 – 3.49); D = Disagree (3.50 – 4.49); and, SD = Strongly Disagree (4.5 or greater). Reactions to the PPR
Respondents “agreed” (item scores between 1.51 and 2.50) with three of the seven
items used to measure reactions to the performance review system. The items “I think the
PPR process is a waste of time” and “I think my department should change the way they
evaluate and rate job performance” were reverse coded so that the more positive response
would be reflected by a lower score, similar to the majority of the survey items. The item
with the highest level of agreement was “Overall, I think the PPR system is fair” (mean =
2.31). Respondents indicated that they “neither agreed nor disagreed” (item scores between
2.51 and 3.50) with five of the items. They agreed least with the reversed coded item “I
think my department should change the way they evaluate and rate job performance” (mean
= 2.99).
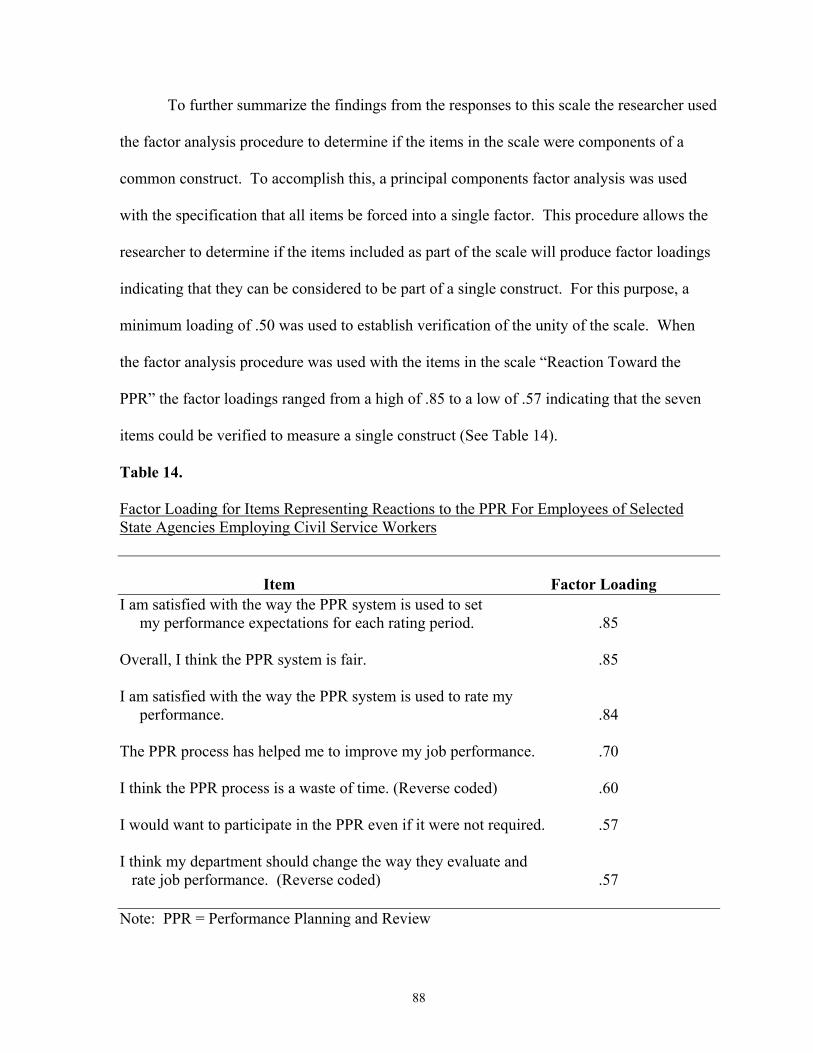
88
To further summarize the findings from the responses to this scale the researcher used
the factor analysis procedure to determine if the items in the scale were components of a
common construct. To accomplish this, a principal components factor analysis was used
with the specification that all items be forced into a single factor. This procedure allows the
researcher to determine if the items included as part of the scale will produce factor loadings
indicating that they can be considered to be part of a single construct. For this purpose, a
minimum loading of .50 was used to establish verification of the unity of the scale. When
the factor analysis procedure was used with the items in the scale “Reaction Toward the
PPR” the factor loadings ranged from a high of .85 to a low of .57 indicating that the seven
items could be verified to measure a single construct (See Table 14).
Table 14. Factor Loading for Items Representing Reactions to the PPR For Employees of Selected State Agencies Employing Civil Service Workers Item Factor Loading I am satisfied with the way the PPR system is used to set my performance expectations for each rating period. .85 Overall, I think the PPR system is fair. .85 I am satisfied with the way the PPR system is used to rate my performance. .84 The PPR process has helped me to improve my job performance. .70 I think the PPR process is a waste of time. (Reverse coded) .60 I would want to participate in the PPR even if it were not required. .57 I think my department should change the way they evaluate and rate job performance. (Reverse coded) .57 Note: PPR = Performance Planning and Review
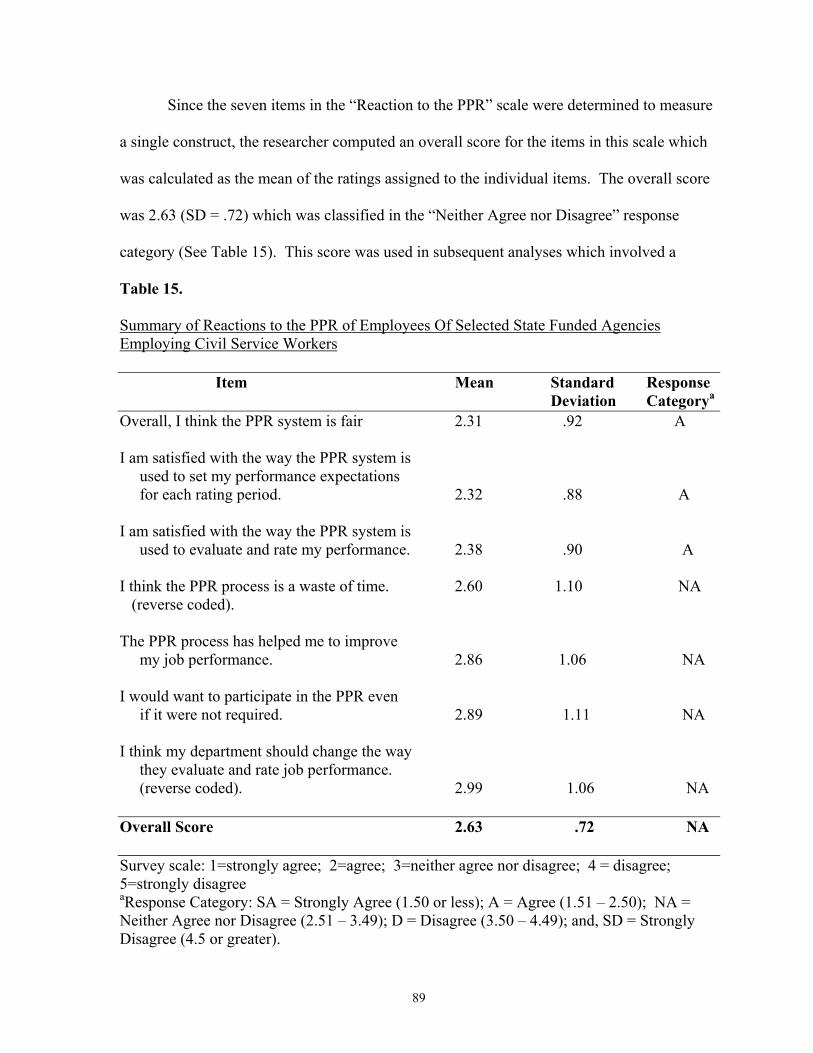
89
Since the seven items in the “Reaction to the PPR” scale were determined to measure
a single construct, the researcher computed an overall score for the items in this scale which
was calculated as the mean of the ratings assigned to the individual items. The overall score
was 2.63 (SD = .72) which was classified in the “Neither Agree nor Disagree” response
category (See Table 15). This score was used in subsequent analyses which involved a
Table 15.
Summary of Reactions to the PPR of Employees Of Selected State Funded Agencies Employing Civil Service Workers Item Mean Standard Response Deviation Categorya
Overall, I think the PPR system is fair 2.31 .92 A I am satisfied with the way the PPR system is used to set my performance expectations for each rating period. 2.32 .88 A I am satisfied with the way the PPR system is used to evaluate and rate my performance. 2.38 .90 A I think the PPR process is a waste of time. 2.60 1.10 NA (reverse coded). The PPR process has helped me to improve my job performance. 2.86 1.06 NA I would want to participate in the PPR even if it were not required. 2.89 1.11 NA I think my department should change the way they evaluate and rate job performance. (reverse coded). 2.99 1.06 NA Overall Score 2.63 .72 NA Survey scale: 1=strongly agree; 2=agree; 3=neither agree nor disagree; 4 = disagree; 5=strongly disagree aResponse Category: SA = Strongly Agree (1.50 or less); A = Agree (1.51 – 2.50); NA = Neither Agree nor Disagree (2.51 – 3.49); D = Disagree (3.50 – 4.49); and, SD = Strongly Disagree (4.5 or greater).
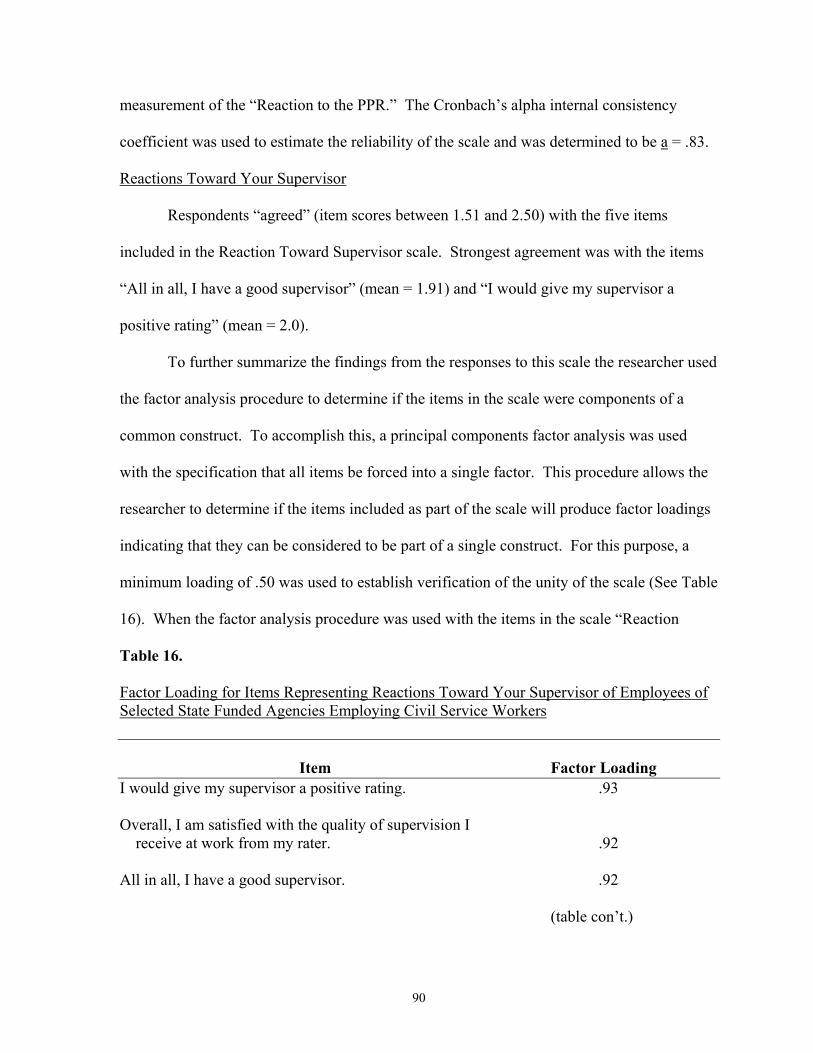
90
measurement of the “Reaction to the PPR.” The Cronbach’s alpha internal consistency
coefficient was used to estimate the reliability of the scale and was determined to be a = .83.
Reactions Toward Your Supervisor
Respondents “agreed” (item scores between 1.51 and 2.50) with the five items
included in the Reaction Toward Supervisor scale. Strongest agreement was with the items
“All in all, I have a good supervisor” (mean = 1.91) and “I would give my supervisor a
positive rating” (mean = 2.0).
To further summarize the findings from the responses to this scale the researcher used
the factor analysis procedure to determine if the items in the scale were components of a
common construct. To accomplish this, a principal components factor analysis was used
with the specification that all items be forced into a single factor. This procedure allows the
researcher to determine if the items included as part of the scale will produce factor loadings
indicating that they can be considered to be part of a single construct. For this purpose, a
minimum loading of .50 was used to establish verification of the unity of the scale (See Table
16). When the factor analysis procedure was used with the items in the scale “Reaction
Table 16. Factor Loading for Items Representing Reactions Toward Your Supervisor of Employees of Selected State Funded Agencies Employing Civil Service Workers Item Factor Loading I would give my supervisor a positive rating. .93 Overall, I am satisfied with the quality of supervision I receive at work from my rater. .92 All in all, I have a good supervisor. .92 (table con’t.)
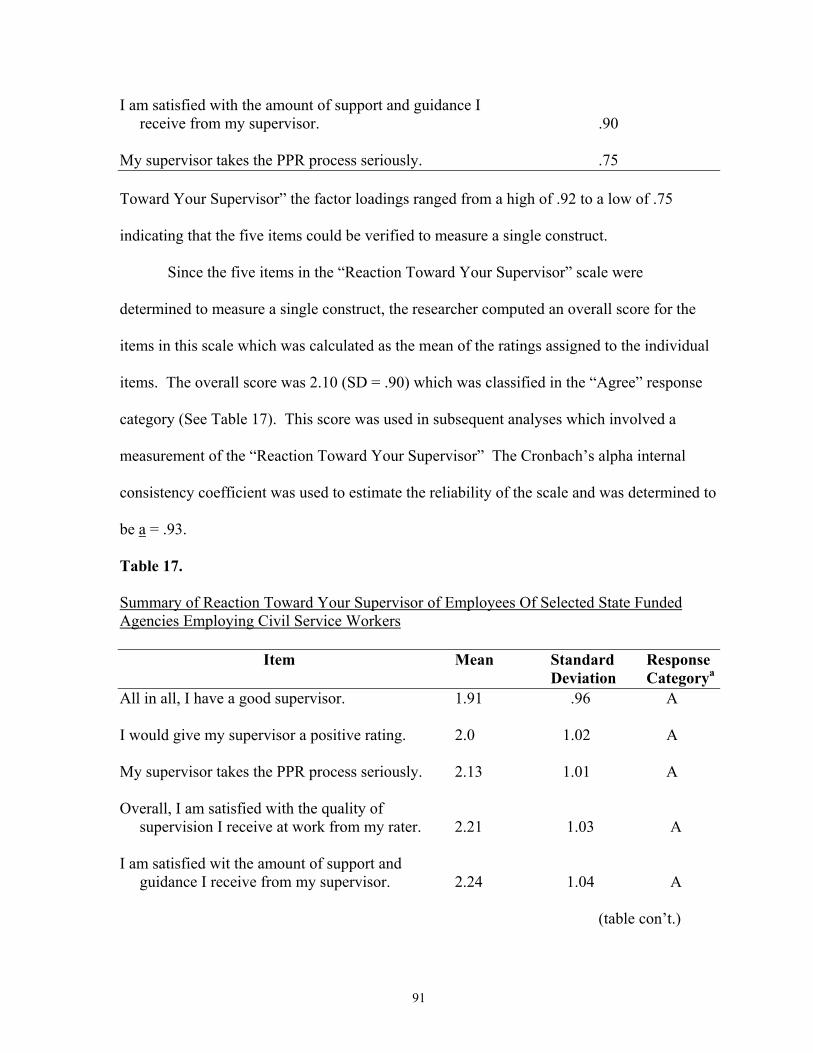
91
I am satisfied with the amount of support and guidance I receive from my supervisor. .90 My supervisor takes the PPR process seriously. .75 Toward Your Supervisor” the factor loadings ranged from a high of .92 to a low of .75
indicating that the five items could be verified to measure a single construct.
Since the five items in the “Reaction Toward Your Supervisor” scale were
determined to measure a single construct, the researcher computed an overall score for the
items in this scale which was calculated as the mean of the ratings assigned to the individual
items. The overall score was 2.10 (SD = .90) which was classified in the “Agree” response
category (See Table 17). This score was used in subsequent analyses which involved a
measurement of the “Reaction Toward Your Supervisor” The Cronbach’s alpha internal
consistency coefficient was used to estimate the reliability of the scale and was determined to
be a = .93.
Table 17.
Summary of Reaction Toward Your Supervisor of Employees Of Selected State Funded Agencies Employing Civil Service Workers Item Mean Standard Response Deviation Categorya
All in all, I have a good supervisor. 1.91 .96 A I would give my supervisor a positive rating. 2.0 1.02 A My supervisor takes the PPR process seriously. 2.13 1.01 A Overall, I am satisfied with the quality of supervision I receive at work from my rater. 2.21 1.03 A I am satisfied wit the amount of support and guidance I receive from my supervisor. 2.24 1.04 A (table con’t.)
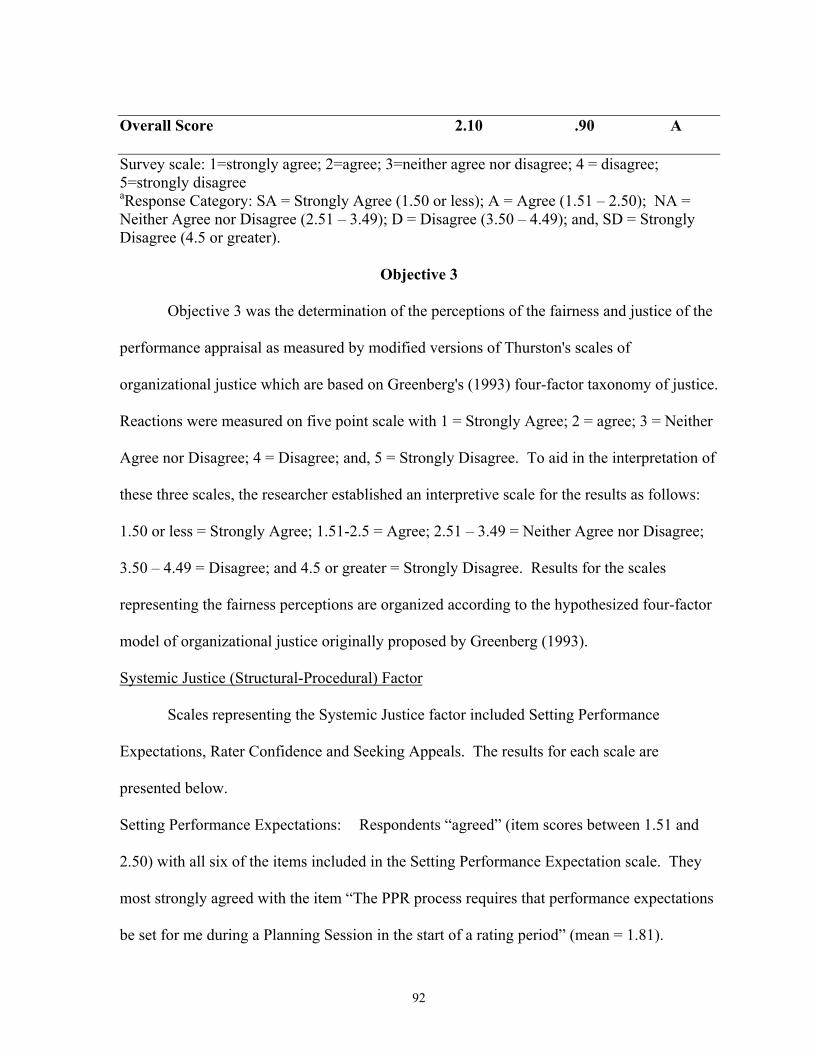
92
Overall Score 2.10 .90 A Survey scale: 1=strongly agree; 2=agree; 3=neither agree nor disagree; 4 = disagree; 5=strongly disagree aResponse Category: SA = Strongly Agree (1.50 or less); A = Agree (1.51 – 2.50); NA = Neither Agree nor Disagree (2.51 – 3.49); D = Disagree (3.50 – 4.49); and, SD = Strongly Disagree (4.5 or greater).
Objective 3
Objective 3 was the determination of the perceptions of the fairness and justice of the
performance appraisal as measured by modified versions of Thurston's scales of
organizational justice which are based on Greenberg's (1993) four-factor taxonomy of justice.
Reactions were measured on five point scale with 1 = Strongly Agree; 2 = agree; 3 = Neither
Agree nor Disagree; 4 = Disagree; and, 5 = Strongly Disagree. To aid in the interpretation of
these three scales, the researcher established an interpretive scale for the results as follows:
1.50 or less = Strongly Agree; 1.51-2.5 = Agree; 2.51 – 3.49 = Neither Agree nor Disagree;
3.50 – 4.49 = Disagree; and 4.5 or greater = Strongly Disagree. Results for the scales
representing the fairness perceptions are organized according to the hypothesized four-factor
model of organizational justice originally proposed by Greenberg (1993).
Systemic Justice (Structural-Procedural) Factor
Scales representing the Systemic Justice factor included Setting Performance
Expectations, Rater Confidence and Seeking Appeals. The results for each scale are
presented below.
Setting Performance Expectations: Respondents “agreed” (item scores between 1.51 and
2.50) with all six of the items included in the Setting Performance Expectation scale. They
most strongly agreed with the item “The PPR process requires that performance expectations
be set for me during a Planning Session in the start of a rating period” (mean = 1.81).
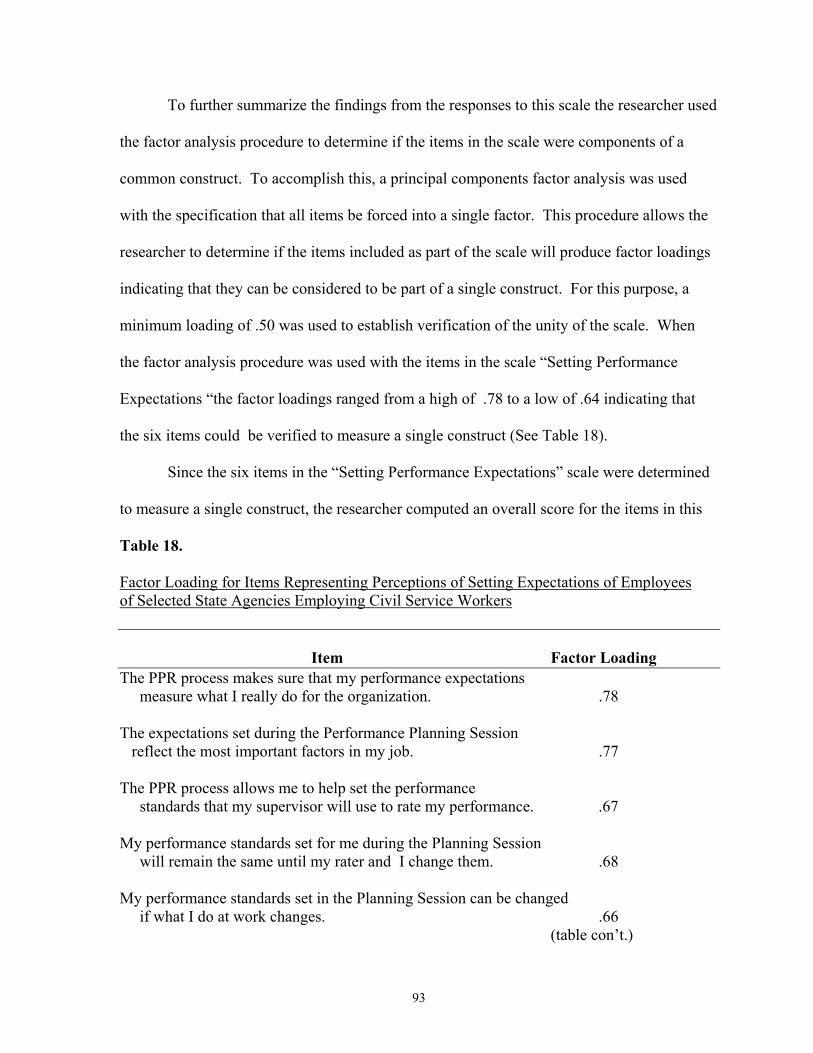
93
To further summarize the findings from the responses to this scale the researcher used
the factor analysis procedure to determine if the items in the scale were components of a
common construct. To accomplish this, a principal components factor analysis was used
with the specification that all items be forced into a single factor. This procedure allows the
researcher to determine if the items included as part of the scale will produce factor loadings
indicating that they can be considered to be part of a single construct. For this purpose, a
minimum loading of .50 was used to establish verification of the unity of the scale. When
the factor analysis procedure was used with the items in the scale “Setting Performance
Expectations “the factor loadings ranged from a high of .78 to a low of .64 indicating that
the six items could be verified to measure a single construct (See Table 18).
Since the six items in the “Setting Performance Expectations” scale were determined
to measure a single construct, the researcher computed an overall score for the items in this
Table 18. Factor Loading for Items Representing Perceptions of Setting Expectations of Employees of Selected State Agencies Employing Civil Service Workers Item Factor Loading The PPR process makes sure that my performance expectations measure what I really do for the organization. .78 The expectations set during the Performance Planning Session reflect the most important factors in my job. .77 The PPR process allows me to help set the performance standards that my supervisor will use to rate my performance. .67 My performance standards set for me during the Planning Session will remain the same until my rater and I change them. .68 My performance standards set in the Planning Session can be changed if what I do at work changes. .66 (table con’t.)
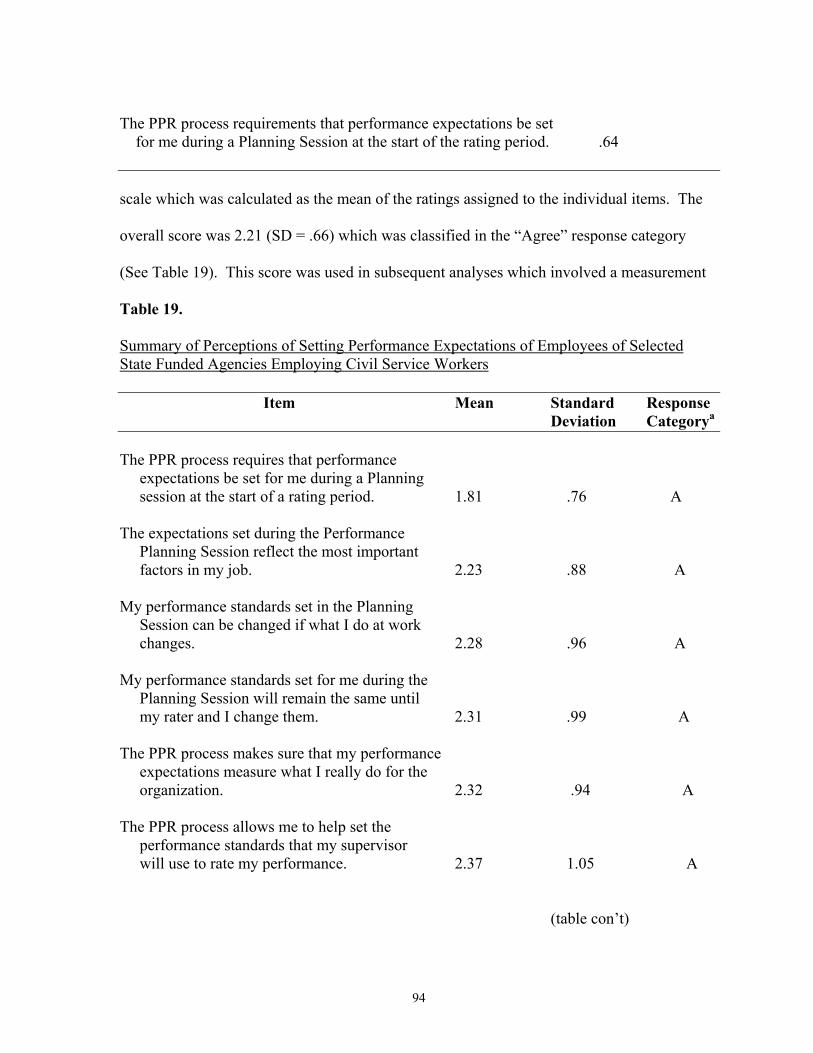
94
The PPR process requirements that performance expectations be set for me during a Planning Session at the start of the rating period. .64 scale which was calculated as the mean of the ratings assigned to the individual items. The
overall score was 2.21 (SD = .66) which was classified in the “Agree” response category
(See Table 19). This score was used in subsequent analyses which involved a measurement
Table 19. Summary of Perceptions of Setting Performance Expectations of Employees of Selected State Funded Agencies Employing Civil Service Workers Item Mean Standard Response Deviation Categorya The PPR process requires that performance expectations be set for me during a Planning session at the start of a rating period. 1.81 .76 A The expectations set during the Performance Planning Session reflect the most important factors in my job. 2.23 .88 A My performance standards set in the Planning Session can be changed if what I do at work changes. 2.28 .96 A My performance standards set for me during the Planning Session will remain the same until my rater and I change them. 2.31 .99 A The PPR process makes sure that my performance expectations measure what I really do for the organization. 2.32 .94 A The PPR process allows me to help set the performance standards that my supervisor will use to rate my performance. 2.37 1.05 A (table con’t)
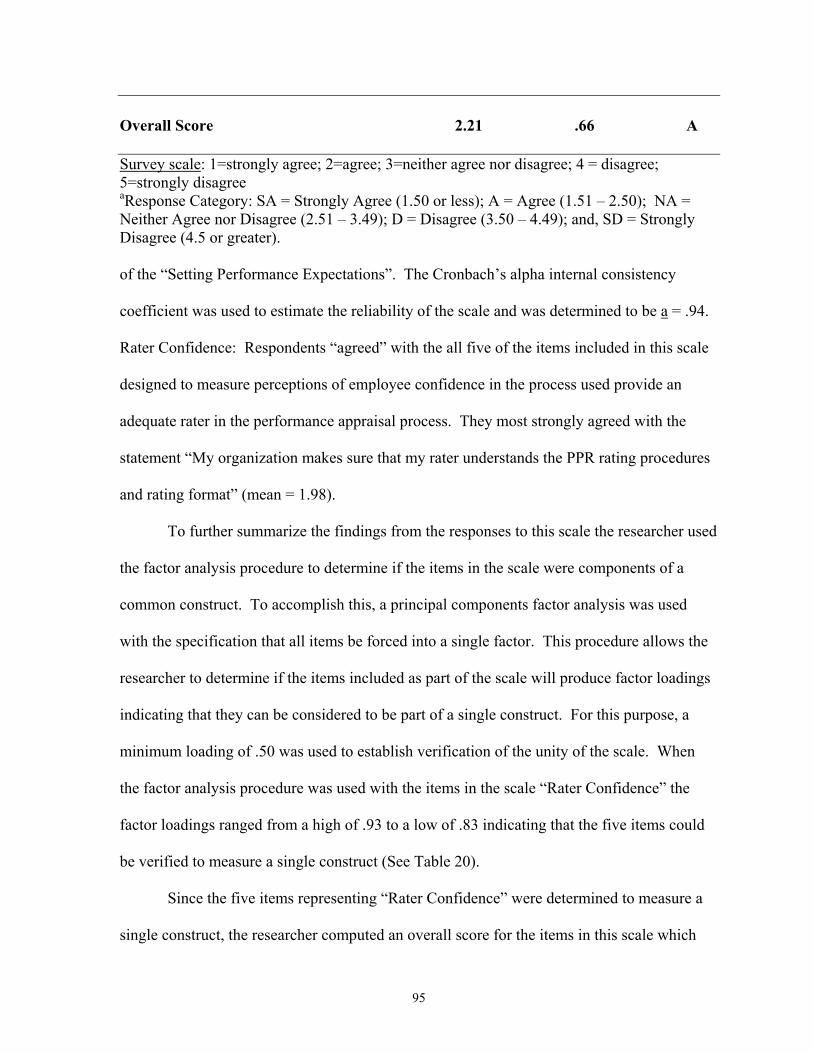
95
Overall Score 2.21 .66 A Survey scale: 1=strongly agree; 2=agree; 3=neither agree nor disagree; 4 = disagree; 5=strongly disagree aResponse Category: SA = Strongly Agree (1.50 or less); A = Agree (1.51 – 2.50); NA = Neither Agree nor Disagree (2.51 – 3.49); D = Disagree (3.50 – 4.49); and, SD = Strongly Disagree (4.5 or greater). of the “Setting Performance Expectations”. The Cronbach’s alpha internal consistency
coefficient was used to estimate the reliability of the scale and was determined to be a = .94.
Rater Confidence: Respondents “agreed” with the all five of the items included in this scale
designed to measure perceptions of employee confidence in the process used provide an
adequate rater in the performance appraisal process. They most strongly agreed with the
statement “My organization makes sure that my rater understands the PPR rating procedures
and rating format” (mean = 1.98).
To further summarize the findings from the responses to this scale the researcher used
the factor analysis procedure to determine if the items in the scale were components of a
common construct. To accomplish this, a principal components factor analysis was used
with the specification that all items be forced into a single factor. This procedure allows the
researcher to determine if the items included as part of the scale will produce factor loadings
indicating that they can be considered to be part of a single construct. For this purpose, a
minimum loading of .50 was used to establish verification of the unity of the scale. When
the factor analysis procedure was used with the items in the scale “Rater Confidence” the
factor loadings ranged from a high of .93 to a low of .83 indicating that the five items could
be verified to measure a single construct (See Table 20).
Since the five items representing “Rater Confidence” were determined to measure a
single construct, the researcher computed an overall score for the items in this scale which
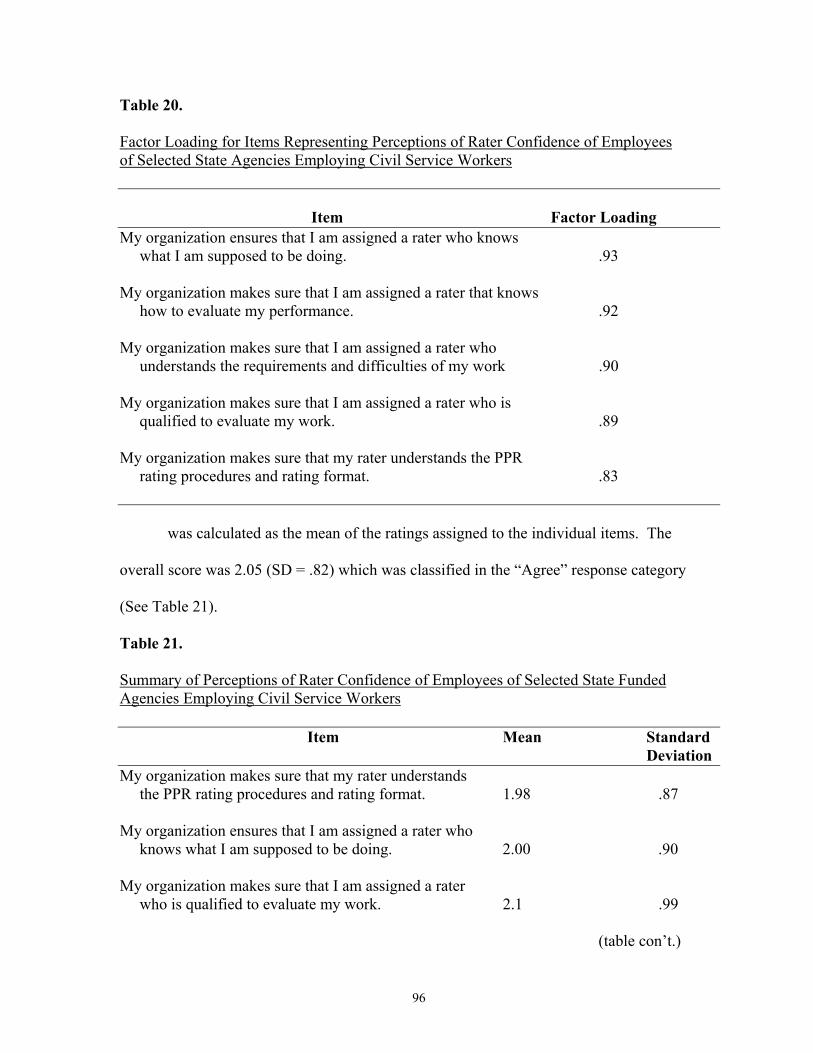
96
Table 20. Factor Loading for Items Representing Perceptions of Rater Confidence of Employees of Selected State Agencies Employing Civil Service Workers Item Factor Loading My organization ensures that I am assigned a rater who knows what I am supposed to be doing. .93 My organization makes sure that I am assigned a rater that knows how to evaluate my performance. .92 My organization makes sure that I am assigned a rater who understands the requirements and difficulties of my work .90 My organization makes sure that I am assigned a rater who is qualified to evaluate my work. .89 My organization makes sure that my rater understands the PPR rating procedures and rating format. .83
was calculated as the mean of the ratings assigned to the individual items. The
overall score was 2.05 (SD = .82) which was classified in the “Agree” response category
(See Table 21).
Table 21.
Summary of Perceptions of Rater Confidence of Employees of Selected State Funded Agencies Employing Civil Service Workers Item Mean Standard Deviation My organization makes sure that my rater understands the PPR rating procedures and rating format. 1.98 .87 My organization ensures that I am assigned a rater who knows what I am supposed to be doing. 2.00 .90 My organization makes sure that I am assigned a rater who is qualified to evaluate my work. 2.1 .99 (table con’t.)
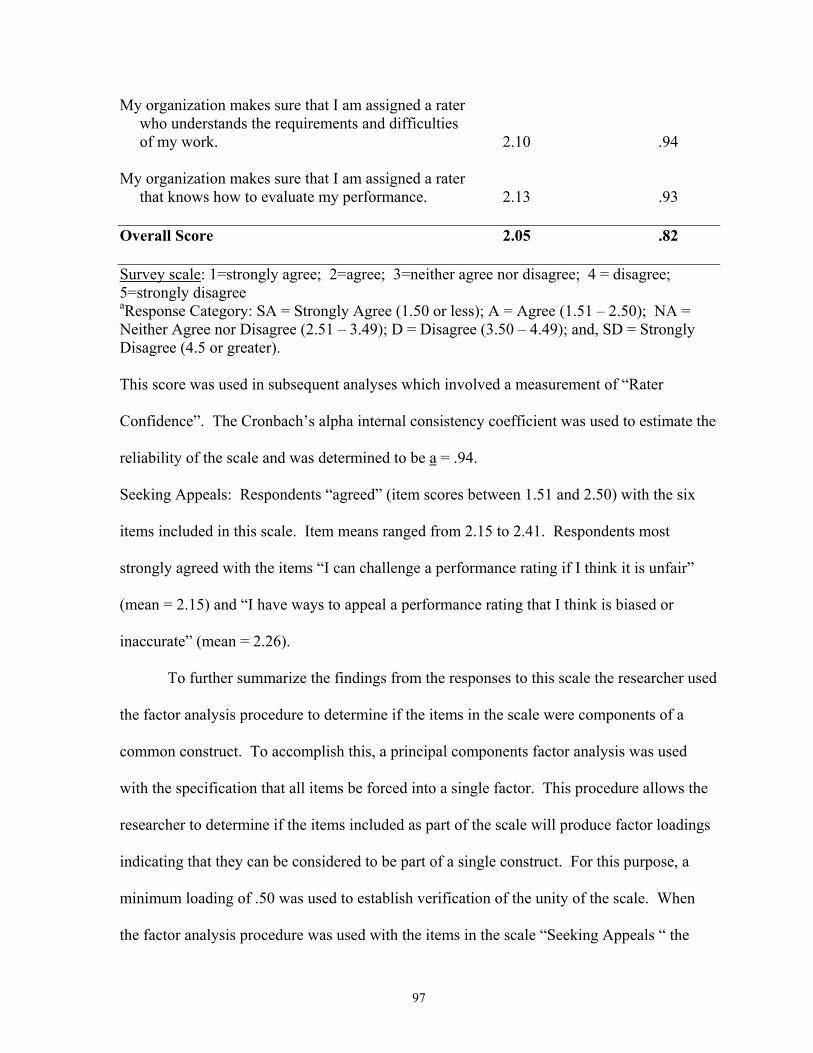
97
My organization makes sure that I am assigned a rater who understands the requirements and difficulties of my work. 2.10 .94 My organization makes sure that I am assigned a rater that knows how to evaluate my performance. 2.13 .93 Overall Score 2.05 .82 Survey scale: 1=strongly agree; 2=agree; 3=neither agree nor disagree; 4 = disagree; 5=strongly disagree aResponse Category: SA = Strongly Agree (1.50 or less); A = Agree (1.51 – 2.50); NA = Neither Agree nor Disagree (2.51 – 3.49); D = Disagree (3.50 – 4.49); and, SD = Strongly Disagree (4.5 or greater). This score was used in subsequent analyses which involved a measurement of “Rater
Confidence”. The Cronbach’s alpha internal consistency coefficient was used to estimate the
reliability of the scale and was determined to be a = .94.
Seeking Appeals: Respondents “agreed” (item scores between 1.51 and 2.50) with the six
items included in this scale. Item means ranged from 2.15 to 2.41. Respondents most
strongly agreed with the items “I can challenge a performance rating if I think it is unfair”
(mean = 2.15) and “I have ways to appeal a performance rating that I think is biased or
inaccurate” (mean = 2.26).
To further summarize the findings from the responses to this scale the researcher used
the factor analysis procedure to determine if the items in the scale were components of a
common construct. To accomplish this, a principal components factor analysis was used
with the specification that all items be forced into a single factor. This procedure allows the
researcher to determine if the items included as part of the scale will produce factor loadings
indicating that they can be considered to be part of a single construct. For this purpose, a
minimum loading of .50 was used to establish verification of the unity of the scale. When
the factor analysis procedure was used with the items in the scale “Seeking Appeals “ the
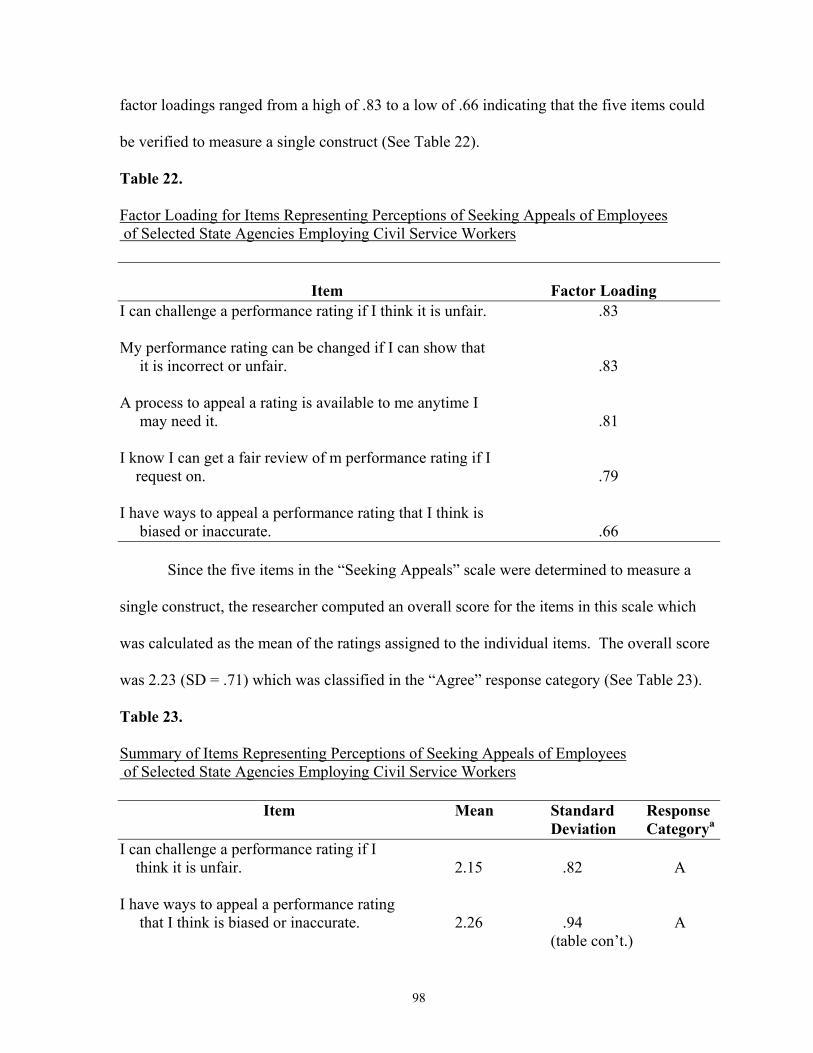
98
factor loadings ranged from a high of .83 to a low of .66 indicating that the five items could
be verified to measure a single construct (See Table 22).
Table 22. Factor Loading for Items Representing Perceptions of Seeking Appeals of Employees of Selected State Agencies Employing Civil Service Workers Item Factor Loading I can challenge a performance rating if I think it is unfair. .83 My performance rating can be changed if I can show that it is incorrect or unfair. .83 A process to appeal a rating is available to me anytime I may need it. .81 I know I can get a fair review of m performance rating if I request on. .79 I have ways to appeal a performance rating that I think is biased or inaccurate. .66
Since the five items in the “Seeking Appeals” scale were determined to measure a
single construct, the researcher computed an overall score for the items in this scale which
was calculated as the mean of the ratings assigned to the individual items. The overall score
was 2.23 (SD = .71) which was classified in the “Agree” response category (See Table 23).
Table 23. Summary of Items Representing Perceptions of Seeking Appeals of Employees of Selected State Agencies Employing Civil Service Workers Item Mean Standard Response Deviation Categorya I can challenge a performance rating if I think it is unfair. 2.15 .82 A I have ways to appeal a performance rating that I think is biased or inaccurate. 2.26 .94 A (table con’t.)
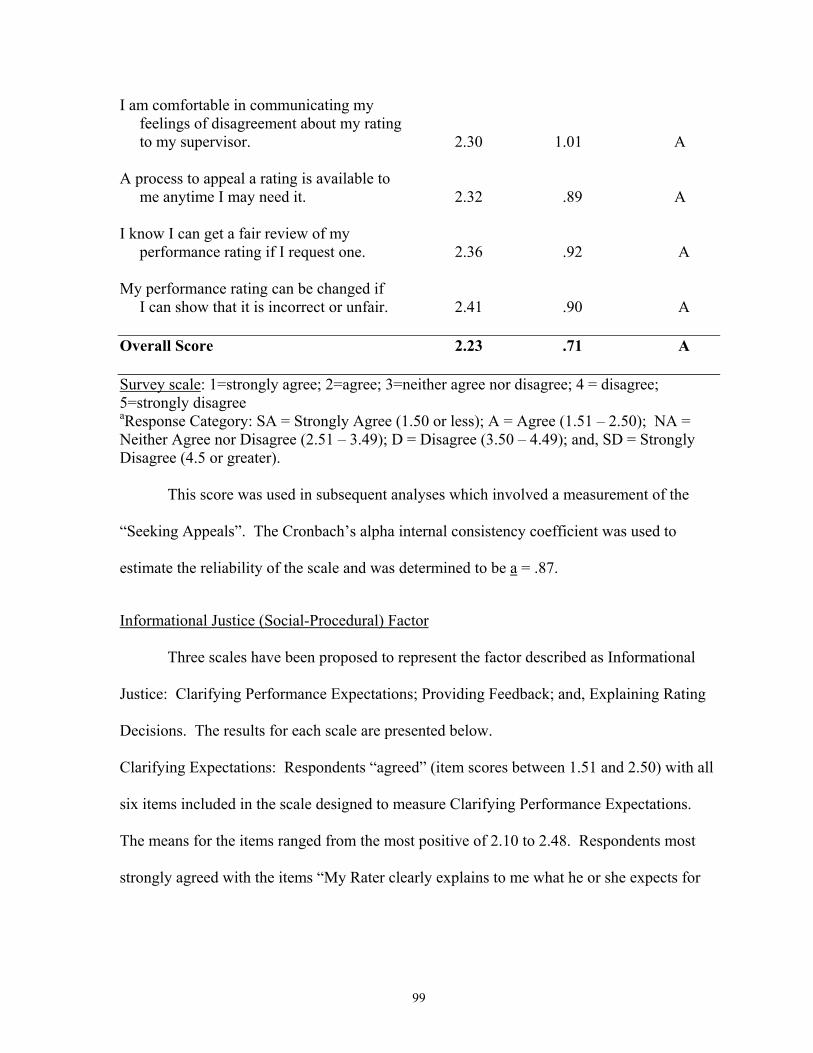
99
I am comfortable in communicating my feelings of disagreement about my rating to my supervisor. 2.30 1.01 A A process to appeal a rating is available to me anytime I may need it. 2.32 .89 A I know I can get a fair review of my performance rating if I request one. 2.36 .92 A My performance rating can be changed if I can show that it is incorrect or unfair. 2.41 .90 A Overall Score 2.23 .71 A Survey scale: 1=strongly agree; 2=agree; 3=neither agree nor disagree; 4 = disagree; 5=strongly disagree aResponse Category: SA = Strongly Agree (1.50 or less); A = Agree (1.51 – 2.50); NA = Neither Agree nor Disagree (2.51 – 3.49); D = Disagree (3.50 – 4.49); and, SD = Strongly Disagree (4.5 or greater).
This score was used in subsequent analyses which involved a measurement of the
“Seeking Appeals”. The Cronbach’s alpha internal consistency coefficient was used to
estimate the reliability of the scale and was determined to be a = .87.
Informational Justice (Social-Procedural) Factor
Three scales have been proposed to represent the factor described as Informational
Justice: Clarifying Performance Expectations; Providing Feedback; and, Explaining Rating
Decisions. The results for each scale are presented below.
Clarifying Expectations: Respondents “agreed” (item scores between 1.51 and 2.50) with all
six items included in the scale designed to measure Clarifying Performance Expectations.
The means for the items ranged from the most positive of 2.10 to 2.48. Respondents most
strongly agreed with the items “My Rater clearly explains to me what he or she expects for
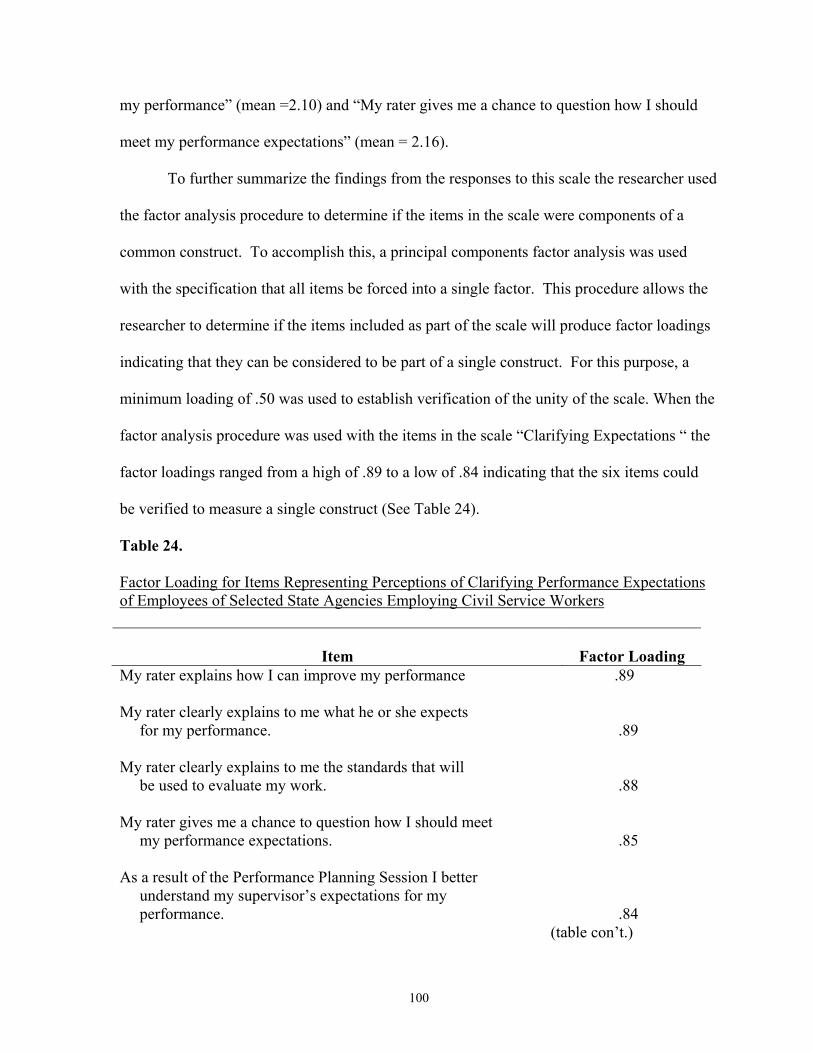
100
my performance” (mean =2.10) and “My rater gives me a chance to question how I should
meet my performance expectations” (mean = 2.16).
To further summarize the findings from the responses to this scale the researcher used
the factor analysis procedure to determine if the items in the scale were components of a
common construct. To accomplish this, a principal components factor analysis was used
with the specification that all items be forced into a single factor. This procedure allows the
researcher to determine if the items included as part of the scale will produce factor loadings
indicating that they can be considered to be part of a single construct. For this purpose, a
minimum loading of .50 was used to establish verification of the unity of the scale. When the
factor analysis procedure was used with the items in the scale “Clarifying Expectations “ the
factor loadings ranged from a high of .89 to a low of .84 indicating that the six items could
be verified to measure a single construct (See Table 24).
Table 24. Factor Loading for Items Representing Perceptions of Clarifying Performance Expectations of Employees of Selected State Agencies Employing Civil Service Workers
Item Factor Loading My rater explains how I can improve my performance .89
My rater clearly explains to me what he or she expects for my performance. .89 My rater clearly explains to me the standards that will be used to evaluate my work. .88 My rater gives me a chance to question how I should meet my performance expectations. .85 As a result of the Performance Planning Session I better understand my supervisor’s expectations for my performance. .84 (table con’t.)
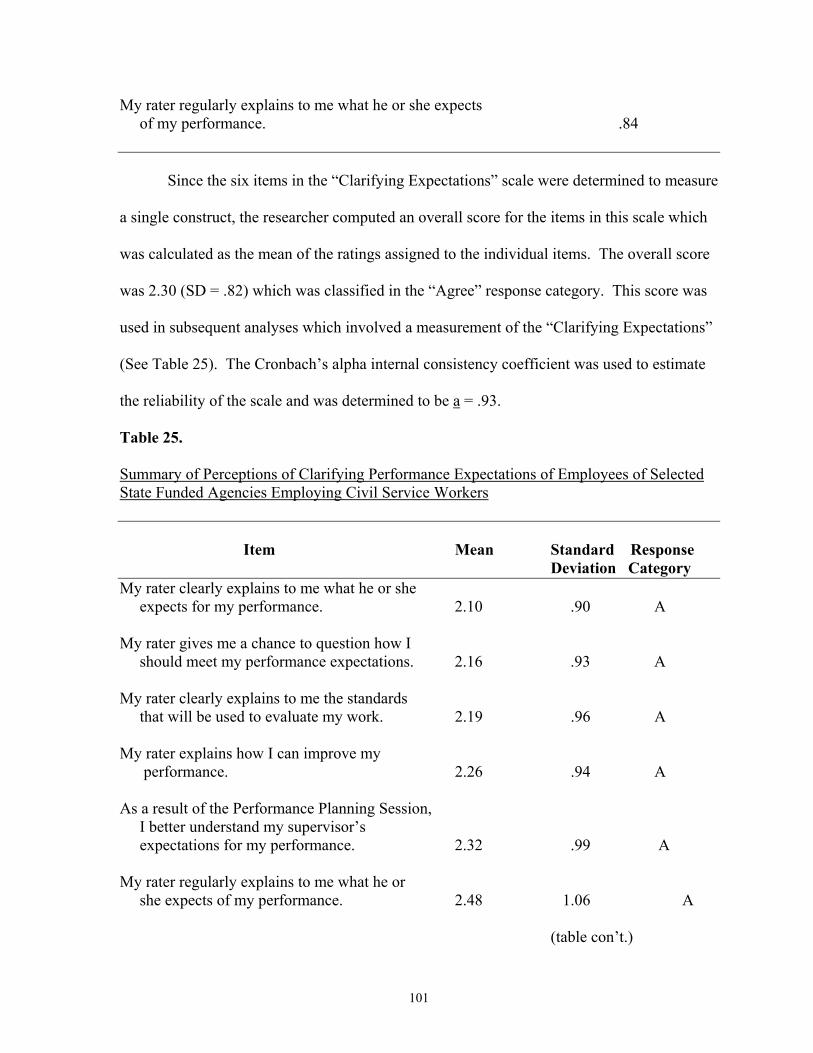
101
My rater regularly explains to me what he or she expects of my performance. .84
Since the six items in the “Clarifying Expectations” scale were determined to measure
a single construct, the researcher computed an overall score for the items in this scale which
was calculated as the mean of the ratings assigned to the individual items. The overall score
was 2.30 (SD = .82) which was classified in the “Agree” response category. This score was
used in subsequent analyses which involved a measurement of the “Clarifying Expectations”
(See Table 25). The Cronbach’s alpha internal consistency coefficient was used to estimate
the reliability of the scale and was determined to be a = .93.
Table 25. Summary of Perceptions of Clarifying Performance Expectations of Employees of Selected State Funded Agencies Employing Civil Service Workers Item Mean Standard Response Deviation Category My rater clearly explains to me what he or she expects for my performance. 2.10 .90 A My rater gives me a chance to question how I should meet my performance expectations. 2.16 .93 A My rater clearly explains to me the standards that will be used to evaluate my work. 2.19 .96 A My rater explains how I can improve my performance. 2.26 .94 A As a result of the Performance Planning Session, I better understand my supervisor’s expectations for my performance. 2.32 .99 A My rater regularly explains to me what he or she expects of my performance. 2.48 1.06 A (table con’t.)
102
Overall Score 2.30 .83 A Survey scale: 1=strongly agree; 2=agree; 3=neither agree nor disagree; 4 = disagree; 5=strongly disagree aResponse Category: SA = Strongly Agree (1.50 or less); A = Agree (1.51 – 2.50); NA = Neither Agree nor Disagree (2.51 – 3.49); D = Disagree (3.50 – 4.49); and, SD = Strongly Disagree (4.5 or greater). Providing Feedback: Respondents indicated that they “neither agreed nor disagreed” (item
scores between 2.51 and 3.50) with the items included in the scale Providing Feedback.
They indicated their most positive perceptions of the item “My rater routinely gives me
feedback that is important to the things I do at work” (mean = 2.51). They responded least
positively to the item “My rater reviews my performance expectations from the Performance
Planning Session at least every three months in unofficial rating sessions” (mean = 3.33).
The mean for this item is categorized in the “neither agree nor disagree” range.
To further summarize the findings from the responses to this scale the researcher used
the factor analysis procedure to determine if the items in the scale were components of a
common construct. To accomplish this, a principal components factor analysis was used
with the specification that all items be forced into a single factor. This procedure allows the
researcher to determine if the items included as part of the scale will produce factor loadings
indicating that they can be considered to be part of a single construct. For this purpose, a
minimum loading of .50 was used to establish verification of the unity of the scale. When
the factor analysis procedure was used with the items in the scale “Providing Feedback “ the
factor loadings ranged from a high of .89 to a low of .75 indicating that the six items could
be verified to measure a single construct (See Table 26).
Since the six items in the “Providing Feedback” scale were determined to measure a
single construct, the researcher computed an overall score for the items in this scale which
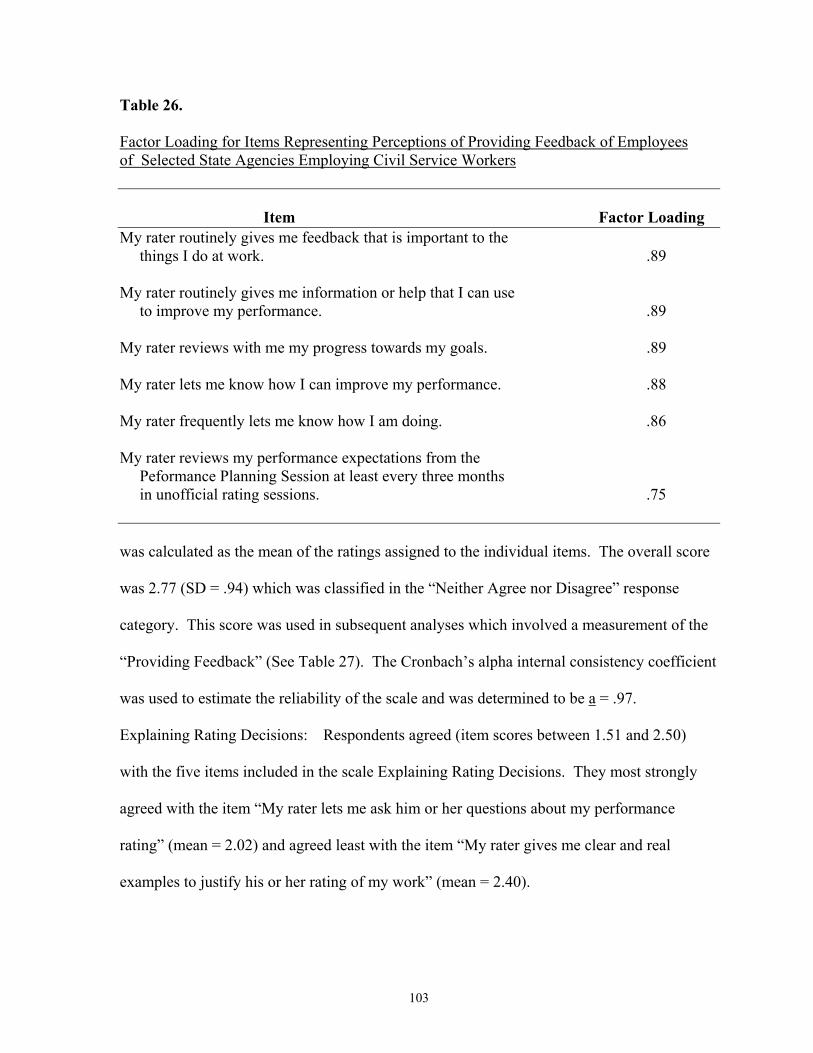
103
Table 26. Factor Loading for Items Representing Perceptions of Providing Feedback of Employees of Selected State Agencies Employing Civil Service Workers Item Factor Loading My rater routinely gives me feedback that is important to the things I do at work. .89 My rater routinely gives me information or help that I can use to improve my performance. .89 My rater reviews with me my progress towards my goals. .89 My rater lets me know how I can improve my performance. .88 My rater frequently lets me know how I am doing. .86 My rater reviews my performance expectations from the Peformance Planning Session at least every three months in unofficial rating sessions. .75 was calculated as the mean of the ratings assigned to the individual items. The overall score
was 2.77 (SD = .94) which was classified in the “Neither Agree nor Disagree” response
category. This score was used in subsequent analyses which involved a measurement of the
“Providing Feedback” (See Table 27). The Cronbach’s alpha internal consistency coefficient
was used to estimate the reliability of the scale and was determined to be a = .97.
Explaining Rating Decisions: Respondents agreed (item scores between 1.51 and 2.50)
with the five items included in the scale Explaining Rating Decisions. They most strongly
agreed with the item “My rater lets me ask him or her questions about my performance
rating” (mean = 2.02) and agreed least with the item “My rater gives me clear and real
examples to justify his or her rating of my work” (mean = 2.40).
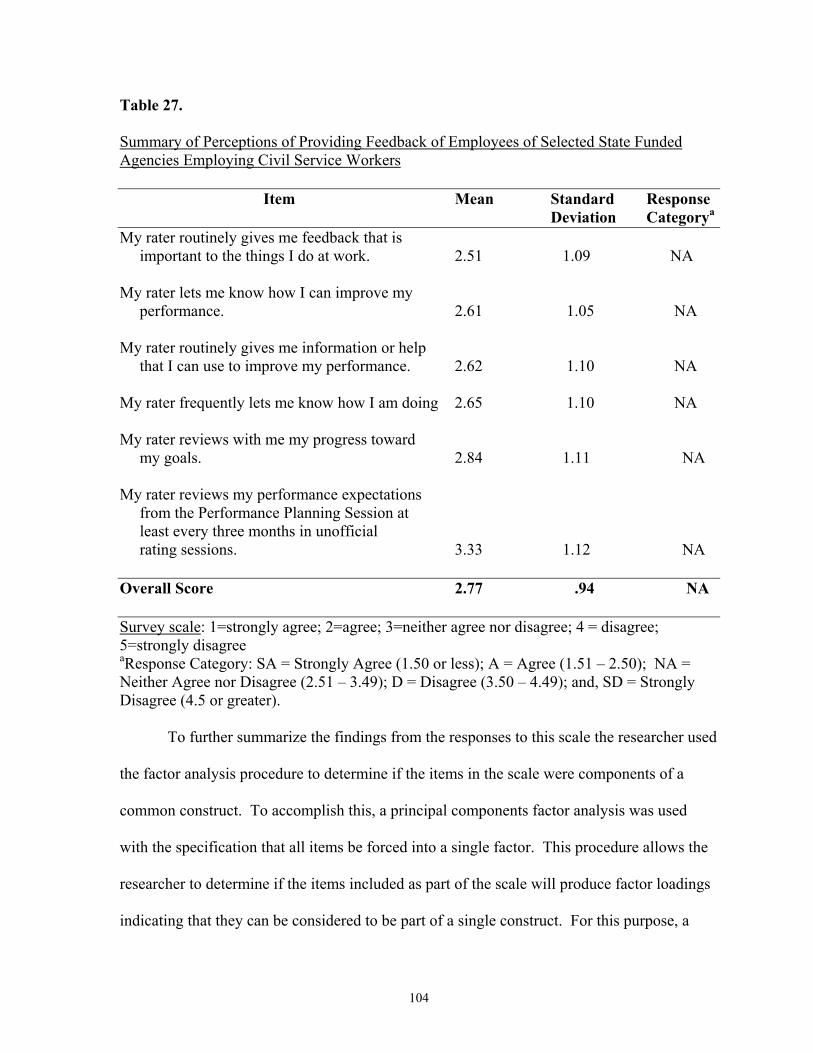
104
Table 27. Summary of Perceptions of Providing Feedback of Employees of Selected State Funded Agencies Employing Civil Service Workers Item Mean Standard Response Deviation Categorya My rater routinely gives me feedback that is important to the things I do at work. 2.51 1.09 NA My rater lets me know how I can improve my performance. 2.61 1.05 NA My rater routinely gives me information or help that I can use to improve my performance. 2.62 1.10 NA My rater frequently lets me know how I am doing 2.65 1.10 NA My rater reviews with me my progress toward my goals. 2.84 1.11 NA My rater reviews my performance expectations from the Performance Planning Session at least every three months in unofficial rating sessions. 3.33 1.12 NA Overall Score 2.77 .94 NA Survey scale: 1=strongly agree; 2=agree; 3=neither agree nor disagree; 4 = disagree; 5=strongly disagree aResponse Category: SA = Strongly Agree (1.50 or less); A = Agree (1.51 – 2.50); NA = Neither Agree nor Disagree (2.51 – 3.49); D = Disagree (3.50 – 4.49); and, SD = Strongly Disagree (4.5 or greater).
To further summarize the findings from the responses to this scale the researcher used
the factor analysis procedure to determine if the items in the scale were components of a
common construct. To accomplish this, a principal components factor analysis was used
with the specification that all items be forced into a single factor. This procedure allows the
researcher to determine if the items included as part of the scale will produce factor loadings
indicating that they can be considered to be part of a single construct. For this purpose, a
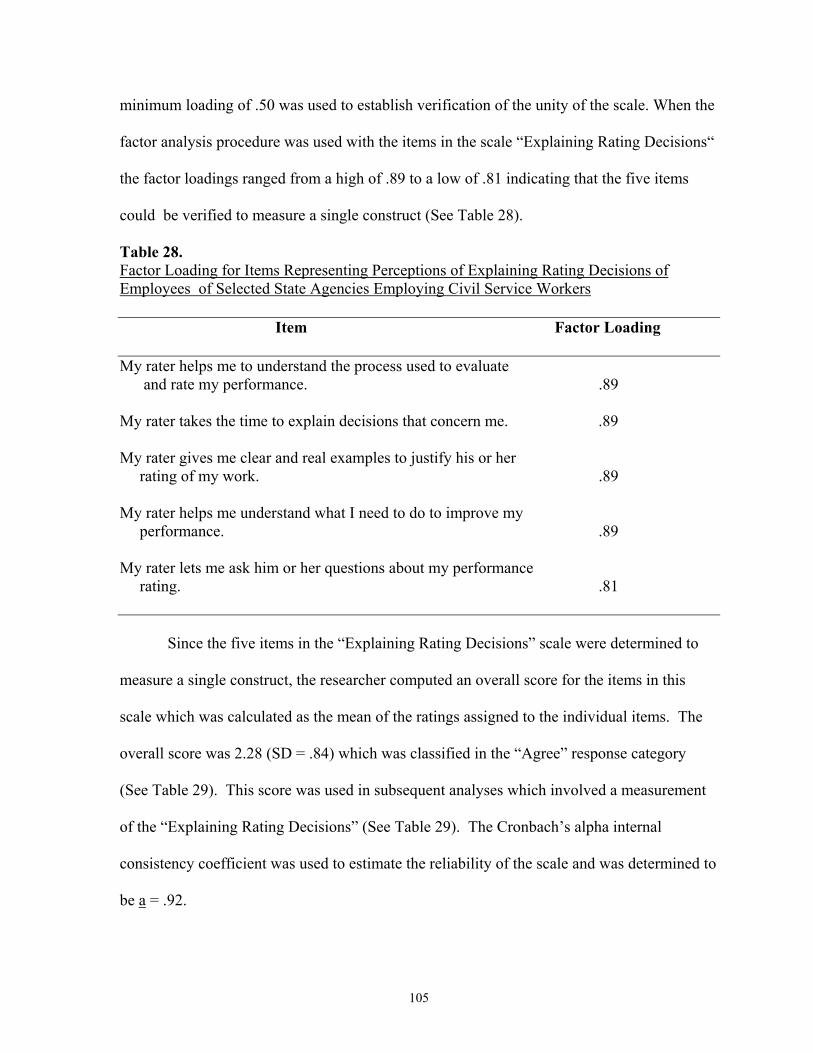
105
minimum loading of .50 was used to establish verification of the unity of the scale. When the
factor analysis procedure was used with the items in the scale “Explaining Rating Decisions“
the factor loadings ranged from a high of .89 to a low of .81 indicating that the five items
could be verified to measure a single construct (See Table 28).
Table 28. Factor Loading for Items Representing Perceptions of Explaining Rating Decisions of Employees of Selected State Agencies Employing Civil Service Workers
Item Factor Loading My rater helps me to understand the process used to evaluate and rate my performance. .89 My rater takes the time to explain decisions that concern me. .89 My rater gives me clear and real examples to justify his or her rating of my work. .89 My rater helps me understand what I need to do to improve my performance. .89 My rater lets me ask him or her questions about my performance rating. .81
Since the five items in the “Explaining Rating Decisions” scale were determined to
measure a single construct, the researcher computed an overall score for the items in this
scale which was calculated as the mean of the ratings assigned to the individual items. The
overall score was 2.28 (SD = .84) which was classified in the “Agree” response category
(See Table 29). This score was used in subsequent analyses which involved a measurement
of the “Explaining Rating Decisions” (See Table 29). The Cronbach’s alpha internal
consistency coefficient was used to estimate the reliability of the scale and was determined to
be a = .92.
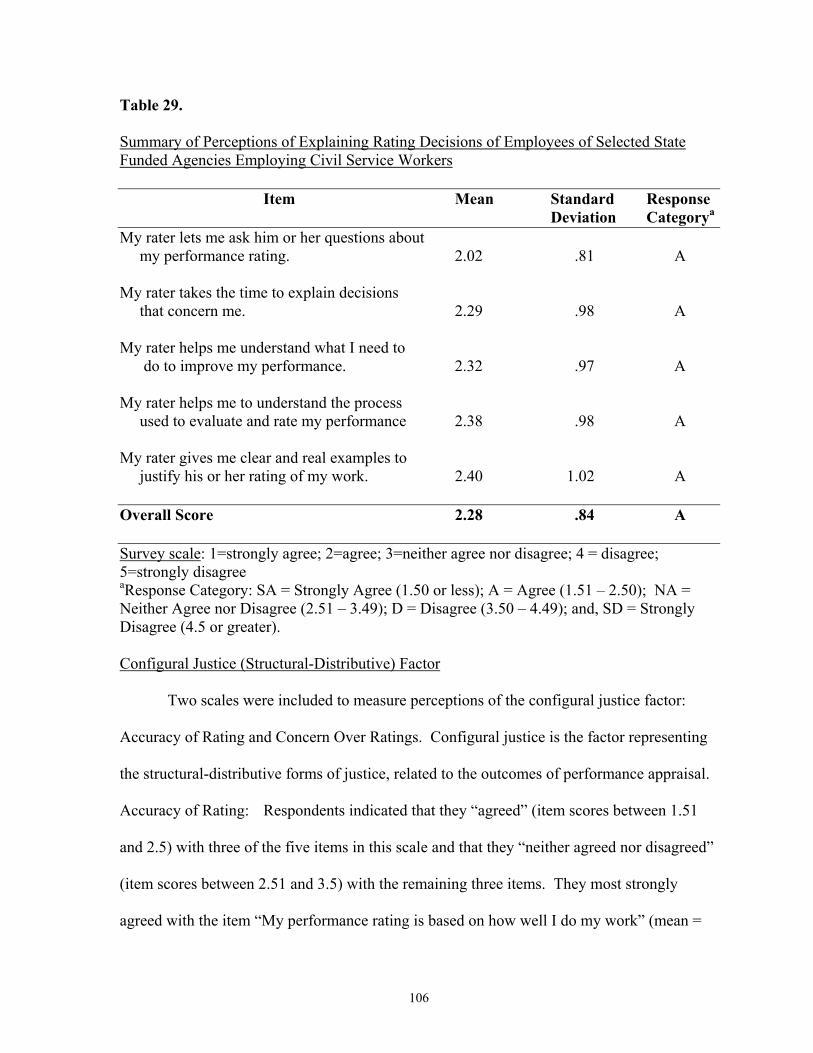
106
Table 29. Summary of Perceptions of Explaining Rating Decisions of Employees of Selected State Funded Agencies Employing Civil Service Workers Item Mean Standard Response Deviation Categorya My rater lets me ask him or her questions about my performance rating. 2.02 .81 A My rater takes the time to explain decisions that concern me. 2.29 .98 A My rater helps me understand what I need to do to improve my performance. 2.32 .97 A My rater helps me to understand the process used to evaluate and rate my performance 2.38 .98 A My rater gives me clear and real examples to justify his or her rating of my work. 2.40 1.02 A Overall Score 2.28 .84 A Survey scale: 1=strongly agree; 2=agree; 3=neither agree nor disagree; 4 = disagree; 5=strongly disagree aResponse Category: SA = Strongly Agree (1.50 or less); A = Agree (1.51 – 2.50); NA = Neither Agree nor Disagree (2.51 – 3.49); D = Disagree (3.50 – 4.49); and, SD = Strongly Disagree (4.5 or greater). Configural Justice (Structural-Distributive) Factor
Two scales were included to measure perceptions of the configural justice factor:
Accuracy of Rating and Concern Over Ratings. Configural justice is the factor representing
the structural-distributive forms of justice, related to the outcomes of performance appraisal.
Accuracy of Rating: Respondents indicated that they “agreed” (item scores between 1.51
and 2.5) with three of the five items in this scale and that they “neither agreed nor disagreed”
(item scores between 2.51 and 3.5) with the remaining three items. They most strongly
agreed with the item “My performance rating is based on how well I do my work” (mean =
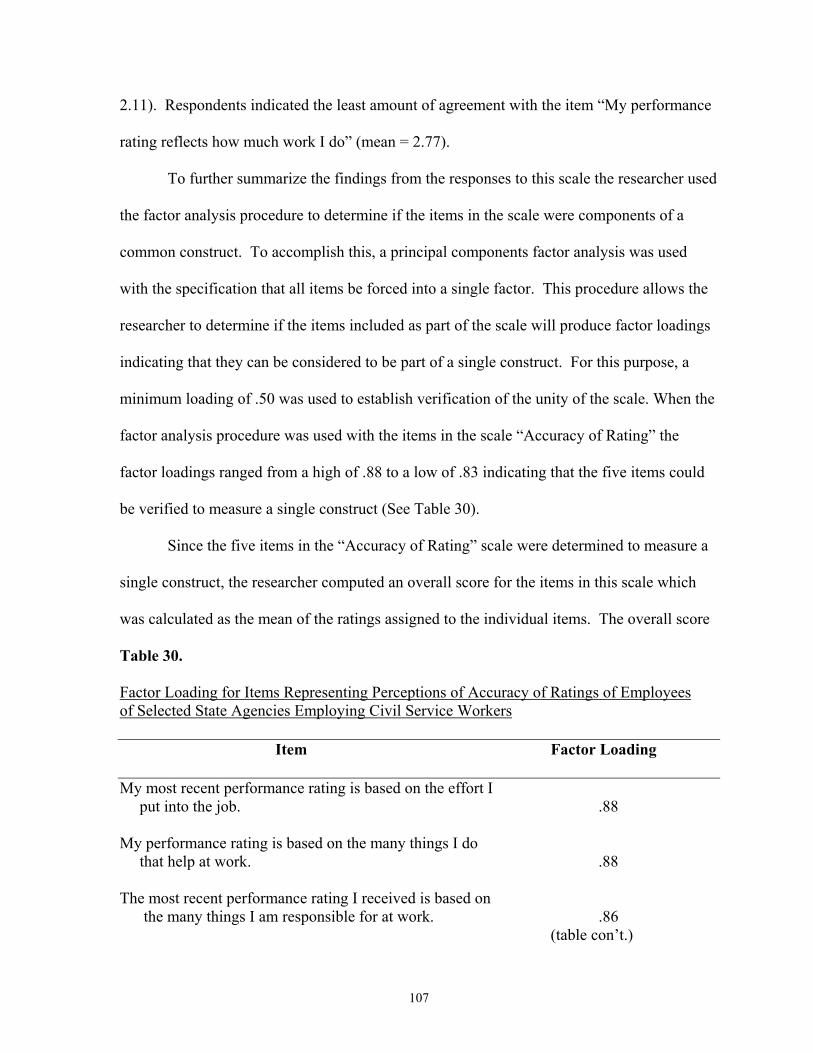
107
2.11). Respondents indicated the least amount of agreement with the item “My performance
rating reflects how much work I do” (mean = 2.77).
To further summarize the findings from the responses to this scale the researcher used
the factor analysis procedure to determine if the items in the scale were components of a
common construct. To accomplish this, a principal components factor analysis was used
with the specification that all items be forced into a single factor. This procedure allows the
researcher to determine if the items included as part of the scale will produce factor loadings
indicating that they can be considered to be part of a single construct. For this purpose, a
minimum loading of .50 was used to establish verification of the unity of the scale. When the
factor analysis procedure was used with the items in the scale “Accuracy of Rating” the
factor loadings ranged from a high of .88 to a low of .83 indicating that the five items could
be verified to measure a single construct (See Table 30).
Since the five items in the “Accuracy of Rating” scale were determined to measure a
single construct, the researcher computed an overall score for the items in this scale which
was calculated as the mean of the ratings assigned to the individual items. The overall score
Table 30. Factor Loading for Items Representing Perceptions of Accuracy of Ratings of Employees of Selected State Agencies Employing Civil Service Workers Item Factor Loading My most recent performance rating is based on the effort I put into the job. .88 My performance rating is based on the many things I do that help at work. .88 The most recent performance rating I received is based on the many things I am responsible for at work. .86 (table con’t.)
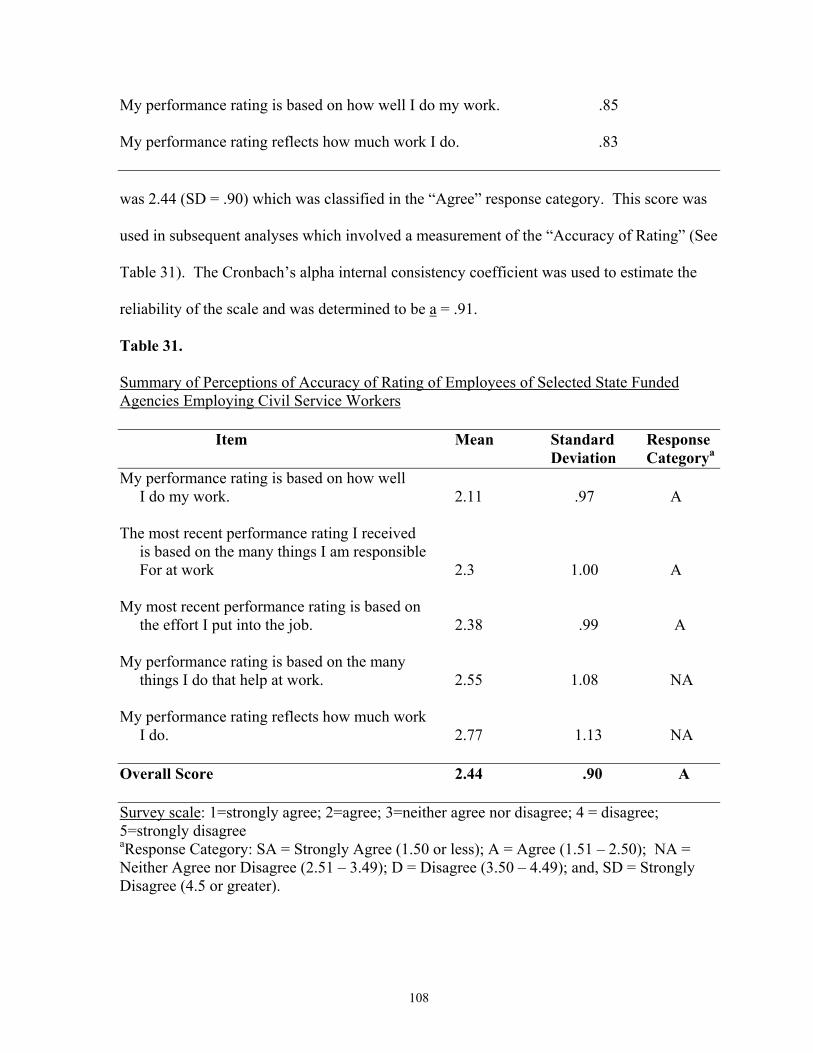
108
My performance rating is based on how well I do my work. .85 My performance rating reflects how much work I do. .83 was 2.44 (SD = .90) which was classified in the “Agree” response category. This score was used in subsequent analyses which involved a measurement of the “Accuracy of Rating” (See
Table 31). The Cronbach’s alpha internal consistency coefficient was used to estimate the
reliability of the scale and was determined to be a = .91.
Table 31. Summary of Perceptions of Accuracy of Rating of Employees of Selected State Funded Agencies Employing Civil Service Workers Item Mean Standard Response Deviation Categorya My performance rating is based on how well I do my work. 2.11 .97 A The most recent performance rating I received is based on the many things I am responsible For at work 2.3 1.00 A My most recent performance rating is based on the effort I put into the job. 2.38 .99 A My performance rating is based on the many things I do that help at work. 2.55 1.08 NA My performance rating reflects how much work I do. 2.77 1.13 NA Overall Score 2.44 .90 A Survey scale: 1=strongly agree; 2=agree; 3=neither agree nor disagree; 4 = disagree; 5=strongly disagree aResponse Category: SA = Strongly Agree (1.50 or less); A = Agree (1.51 – 2.50); NA = Neither Agree nor Disagree (2.51 – 3.49); D = Disagree (3.50 – 4.49); and, SD = Strongly Disagree (4.5 or greater).
109
Concern Over Ratings: Respondents “Agreed” (item score between 1.51 and 2.50) with
five of the seven items initially included in the “Concern Over Rating” scale and “Neither
Agreed Nor Disagreed” (item scores between 2.51 and 3.50) with two of the seven. The
items with which they most strongly agreed were “My rating is not the result of my rater
trying to avoid bad feelings among his or her employees” (mean = 2.19) and “The
performance rating I get is not higher than one I should earn based on my effort and
contributions” (mean = 2.20). The items with which respondents least agreed were
“Supervisors give performance ratings that reflect, in part, their personal like or dislike of
employees” mean = 2.85” and “Supervisors give the same PPR ratings to all their
subordinates in order to avoid resentment and rivalries among them” (mean = 2.57). These
items were reverse coded in the analyses so that the more positive the rating, the lower the
score.
To further summarize the findings from the responses to this scale the researcher used
the factor analysis procedure to determine if the items in the scale were components of a
common construct. To accomplish this, a principal components factor analysis was used
with the specification that all items be forced into a single factor. This procedure allows the
researcher to determine if the items included as part of the scale will produce factor loadings
indicating that they can be considered to be part of a single construct. For this purpose, a
minimum loading of .50 was used to establish verification of the unity of the scale.
When the factor analysis procedure was used with the items in the scale “Concern
Over Ratings “ the factor loadings ranged from a high of .82 to a low of .23 (See Table 32).
The factor loadings of .23 and .40 were below the established minimum loading .50 to be
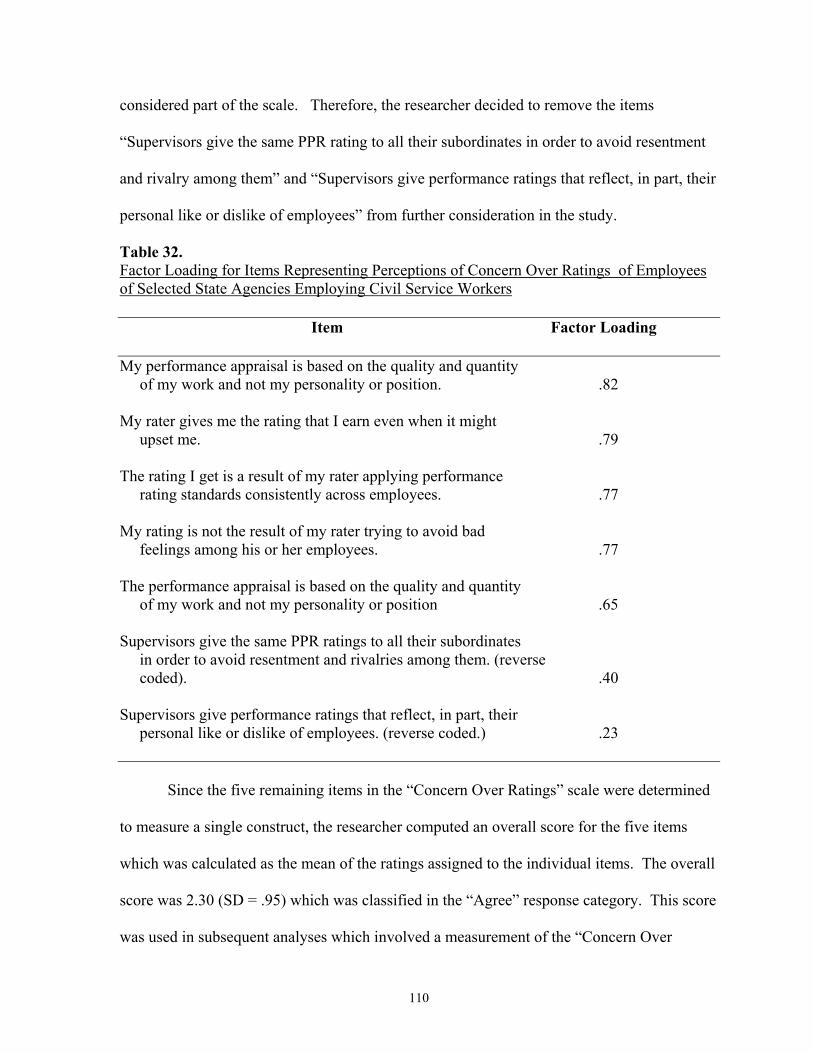
110
considered part of the scale. Therefore, the researcher decided to remove the items
“Supervisors give the same PPR rating to all their subordinates in order to avoid resentment
and rivalry among them” and “Supervisors give performance ratings that reflect, in part, their
personal like or dislike of employees” from further consideration in the study.
Table 32. Factor Loading for Items Representing Perceptions of Concern Over Ratings of Employees of Selected State Agencies Employing Civil Service Workers Item Factor Loading My performance appraisal is based on the quality and quantity of my work and not my personality or position. .82 My rater gives me the rating that I earn even when it might upset me. .79 The rating I get is a result of my rater applying performance rating standards consistently across employees. .77 My rating is not the result of my rater trying to avoid bad feelings among his or her employees. .77 The performance appraisal is based on the quality and quantity of my work and not my personality or position .65 Supervisors give the same PPR ratings to all their subordinates in order to avoid resentment and rivalries among them. (reverse coded). .40 Supervisors give performance ratings that reflect, in part, their personal like or dislike of employees. (reverse coded.) .23
Since the five remaining items in the “Concern Over Ratings” scale were determined
to measure a single construct, the researcher computed an overall score for the five items
which was calculated as the mean of the ratings assigned to the individual items. The overall
score was 2.30 (SD = .95) which was classified in the “Agree” response category. This score
was used in subsequent analyses which involved a measurement of the “Concern Over
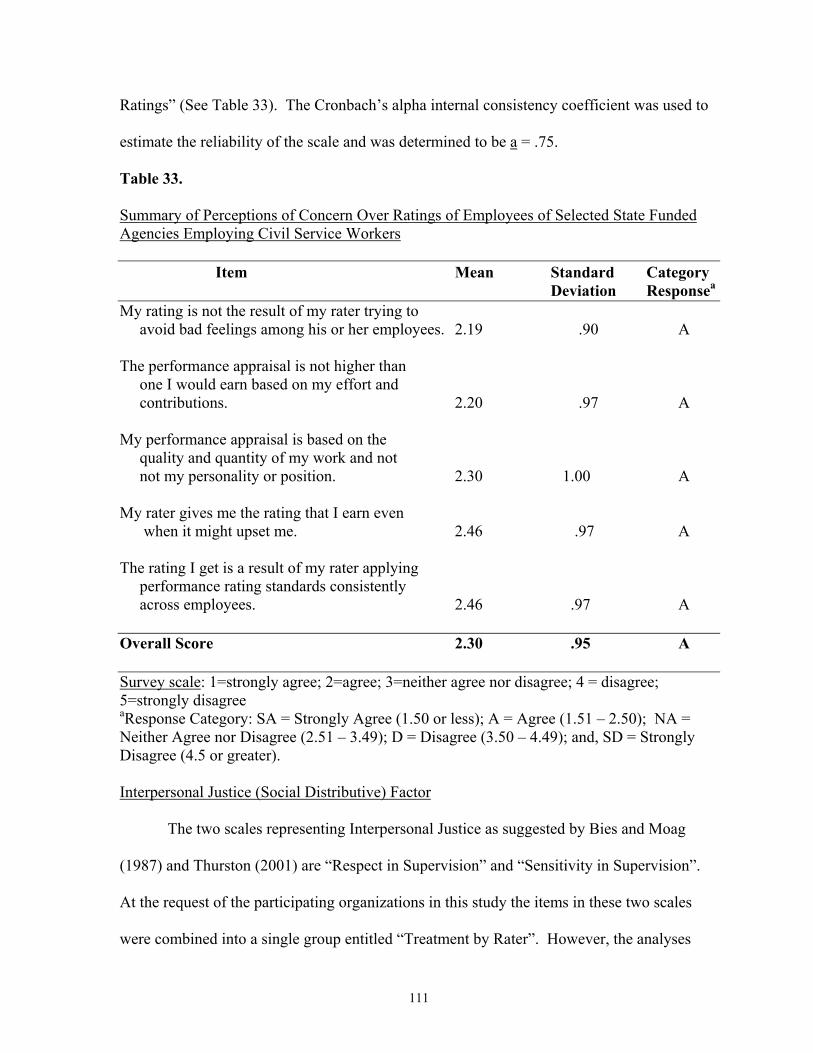
111
Ratings” (See Table 33). The Cronbach’s alpha internal consistency coefficient was used to
estimate the reliability of the scale and was determined to be a = .75.
Table 33. Summary of Perceptions of Concern Over Ratings of Employees of Selected State Funded Agencies Employing Civil Service Workers Item Mean Standard Category Deviation Responsea My rating is not the result of my rater trying to avoid bad feelings among his or her employees. 2.19 .90 A The performance appraisal is not higher than one I would earn based on my effort and contributions. 2.20 .97 A My performance appraisal is based on the quality and quantity of my work and not not my personality or position. 2.30 1.00 A My rater gives me the rating that I earn even when it might upset me. 2.46 .97 A The rating I get is a result of my rater applying performance rating standards consistently across employees. 2.46 .97 A Overall Score 2.30 .95 A Survey scale: 1=strongly agree; 2=agree; 3=neither agree nor disagree; 4 = disagree; 5=strongly disagree aResponse Category: SA = Strongly Agree (1.50 or less); A = Agree (1.51 – 2.50); NA = Neither Agree nor Disagree (2.51 – 3.49); D = Disagree (3.50 – 4.49); and, SD = Strongly Disagree (4.5 or greater). Interpersonal Justice (Social Distributive) Factor
The two scales representing Interpersonal Justice as suggested by Bies and Moag
(1987) and Thurston (2001) are “Respect in Supervision” and “Sensitivity in Supervision”.
At the request of the participating organizations in this study the items in these two scales
were combined into a single group entitled “Treatment by Rater”. However, the analyses
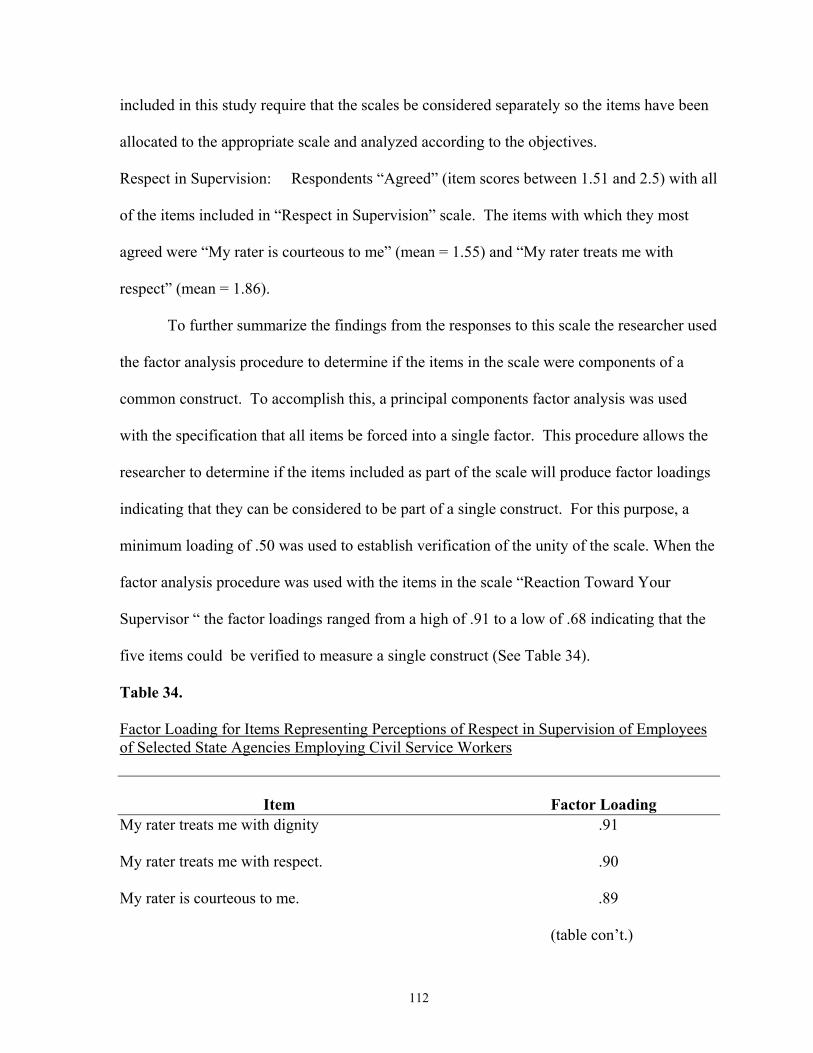
112
included in this study require that the scales be considered separately so the items have been
allocated to the appropriate scale and analyzed according to the objectives.
Respect in Supervision: Respondents “Agreed” (item scores between 1.51 and 2.5) with all
of the items included in “Respect in Supervision” scale. The items with which they most
agreed were “My rater is courteous to me” (mean = 1.55) and “My rater treats me with
respect” (mean = 1.86).
To further summarize the findings from the responses to this scale the researcher used
the factor analysis procedure to determine if the items in the scale were components of a
common construct. To accomplish this, a principal components factor analysis was used
with the specification that all items be forced into a single factor. This procedure allows the
researcher to determine if the items included as part of the scale will produce factor loadings
indicating that they can be considered to be part of a single construct. For this purpose, a
minimum loading of .50 was used to establish verification of the unity of the scale. When the
factor analysis procedure was used with the items in the scale “Reaction Toward Your
Supervisor “ the factor loadings ranged from a high of .91 to a low of .68 indicating that the
five items could be verified to measure a single construct (See Table 34).
Table 34. Factor Loading for Items Representing Perceptions of Respect in Supervision of Employees of Selected State Agencies Employing Civil Service Workers Item Factor Loading My rater treats me with dignity .91
My rater treats me with respect. .90
My rater is courteous to me. .89
(table con’t.)
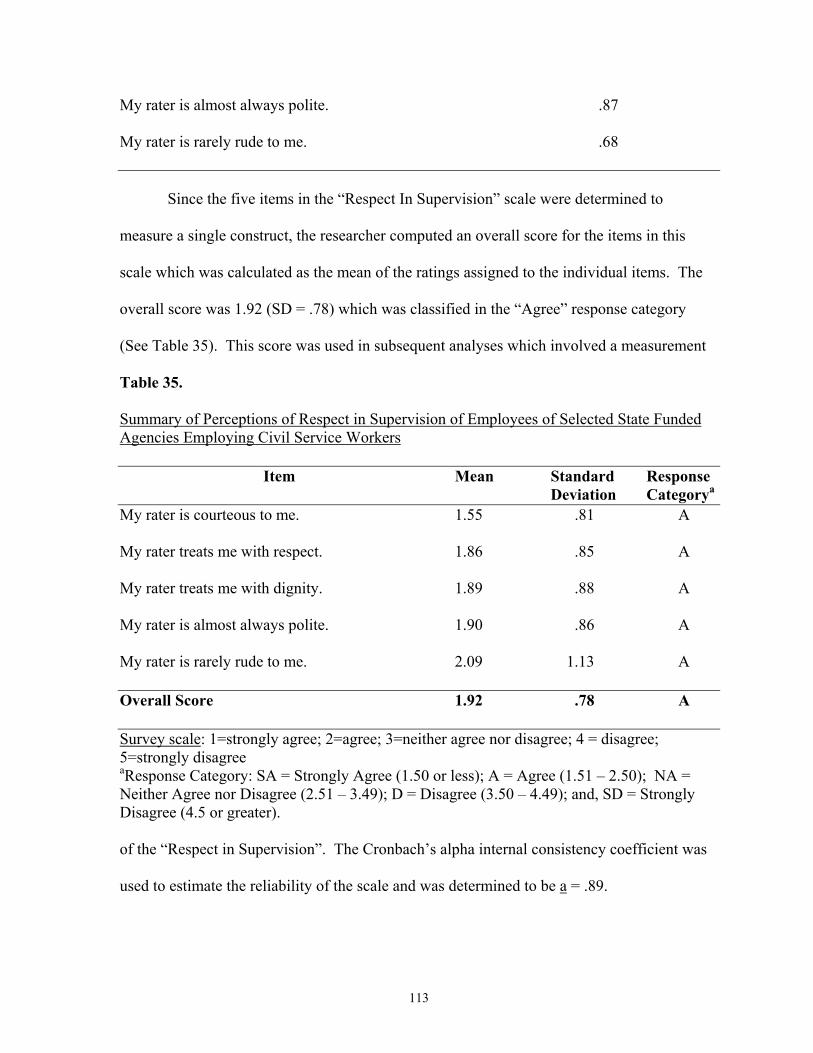
113
My rater is almost always polite. .87
My rater is rarely rude to me. .68
Since the five items in the “Respect In Supervision” scale were determined to
measure a single construct, the researcher computed an overall score for the items in this
scale which was calculated as the mean of the ratings assigned to the individual items. The
overall score was 1.92 (SD = .78) which was classified in the “Agree” response category
(See Table 35). This score was used in subsequent analyses which involved a measurement
Table 35.
Summary of Perceptions of Respect in Supervision of Employees of Selected State Funded Agencies Employing Civil Service Workers Item Mean Standard Response Deviation Categorya My rater is courteous to me. 1.55 .81 A My rater treats me with respect. 1.86 .85 A My rater treats me with dignity. 1.89 .88 A My rater is almost always polite. 1.90 .86 A My rater is rarely rude to me. 2.09 1.13 A Overall Score 1.92 .78 A Survey scale: 1=strongly agree; 2=agree; 3=neither agree nor disagree; 4 = disagree; 5=strongly disagree aResponse Category: SA = Strongly Agree (1.50 or less); A = Agree (1.51 – 2.50); NA = Neither Agree nor Disagree (2.51 – 3.49); D = Disagree (3.50 – 4.49); and, SD = Strongly Disagree (4.5 or greater). of the “Respect in Supervision”. The Cronbach’s alpha internal consistency coefficient was
used to estimate the reliability of the scale and was determined to be a = .89.
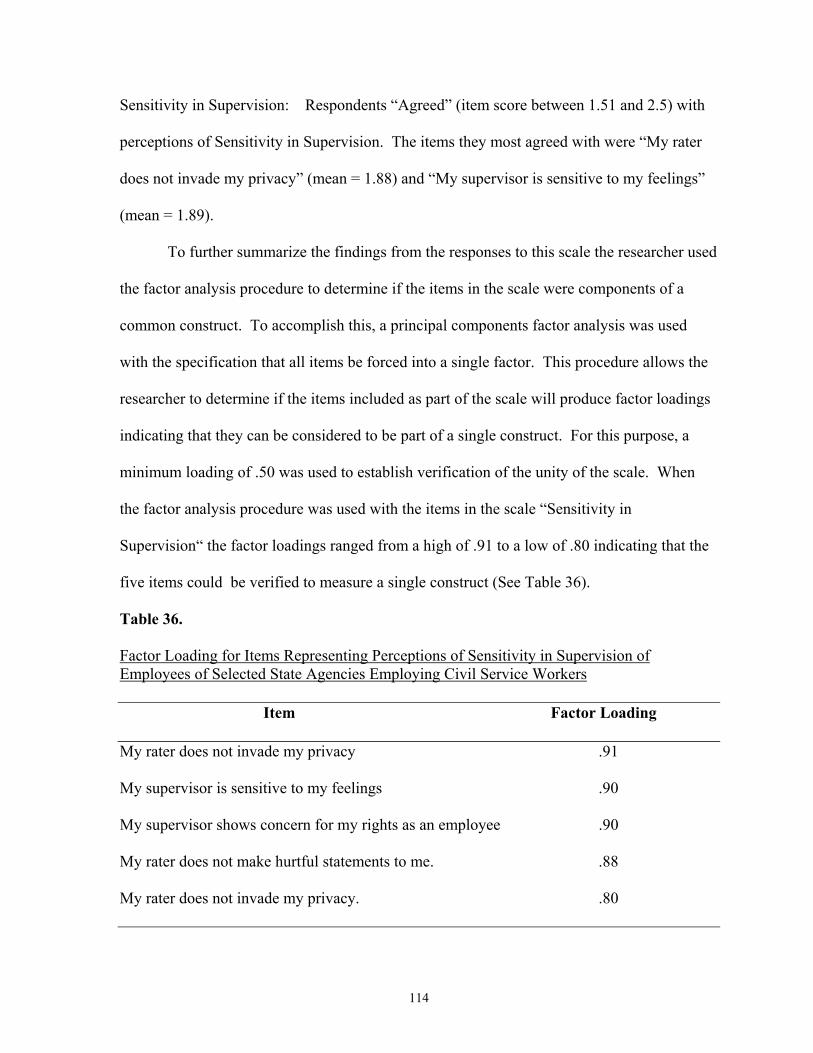
114
Sensitivity in Supervision: Respondents “Agreed” (item score between 1.51 and 2.5) with
perceptions of Sensitivity in Supervision. The items they most agreed with were “My rater
does not invade my privacy” (mean = 1.88) and “My supervisor is sensitive to my feelings”
(mean = 1.89).
To further summarize the findings from the responses to this scale the researcher used
the factor analysis procedure to determine if the items in the scale were components of a
common construct. To accomplish this, a principal components factor analysis was used
with the specification that all items be forced into a single factor. This procedure allows the
researcher to determine if the items included as part of the scale will produce factor loadings
indicating that they can be considered to be part of a single construct. For this purpose, a
minimum loading of .50 was used to establish verification of the unity of the scale. When
the factor analysis procedure was used with the items in the scale “Sensitivity in
Supervision“ the factor loadings ranged from a high of .91 to a low of .80 indicating that the
five items could be verified to measure a single construct (See Table 36).
Table 36.
Factor Loading for Items Representing Perceptions of Sensitivity in Supervision of Employees of Selected State Agencies Employing Civil Service Workers Item Factor Loading My rater does not invade my privacy .91
My supervisor is sensitive to my feelings .90
My supervisor shows concern for my rights as an employee .90
My rater does not make hurtful statements to me. .88
My rater does not invade my privacy. .80
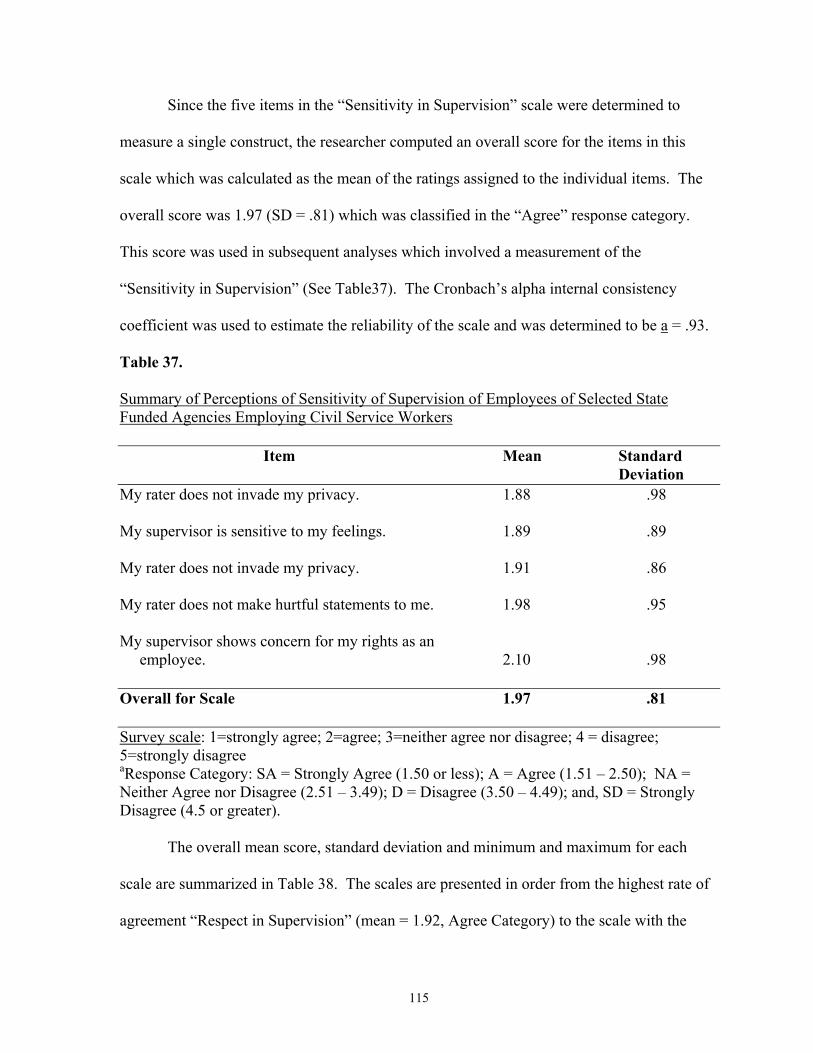
115
Since the five items in the “Sensitivity in Supervision” scale were determined to
measure a single construct, the researcher computed an overall score for the items in this
scale which was calculated as the mean of the ratings assigned to the individual items. The
overall score was 1.97 (SD = .81) which was classified in the “Agree” response category.
This score was used in subsequent analyses which involved a measurement of the
“Sensitivity in Supervision” (See Table37). The Cronbach’s alpha internal consistency
coefficient was used to estimate the reliability of the scale and was determined to be a = .93.
Table 37. Summary of Perceptions of Sensitivity of Supervision of Employees of Selected State Funded Agencies Employing Civil Service Workers Item Mean Standard Deviation My rater does not invade my privacy. 1.88 .98 My supervisor is sensitive to my feelings. 1.89 .89 My rater does not invade my privacy. 1.91 .86 My rater does not make hurtful statements to me. 1.98 .95 My supervisor shows concern for my rights as an employee. 2.10 .98 Overall for Scale 1.97 .81 Survey scale: 1=strongly agree; 2=agree; 3=neither agree nor disagree; 4 = disagree; 5=strongly disagree aResponse Category: SA = Strongly Agree (1.50 or less); A = Agree (1.51 – 2.50); NA = Neither Agree nor Disagree (2.51 – 3.49); D = Disagree (3.50 – 4.49); and, SD = Strongly Disagree (4.5 or greater). The overall mean score, standard deviation and minimum and maximum for each
scale are summarized in Table 38. The scales are presented in order from the highest rate of
agreement “Respect in Supervision” (mean = 1.92, Agree Category) to the scale with the
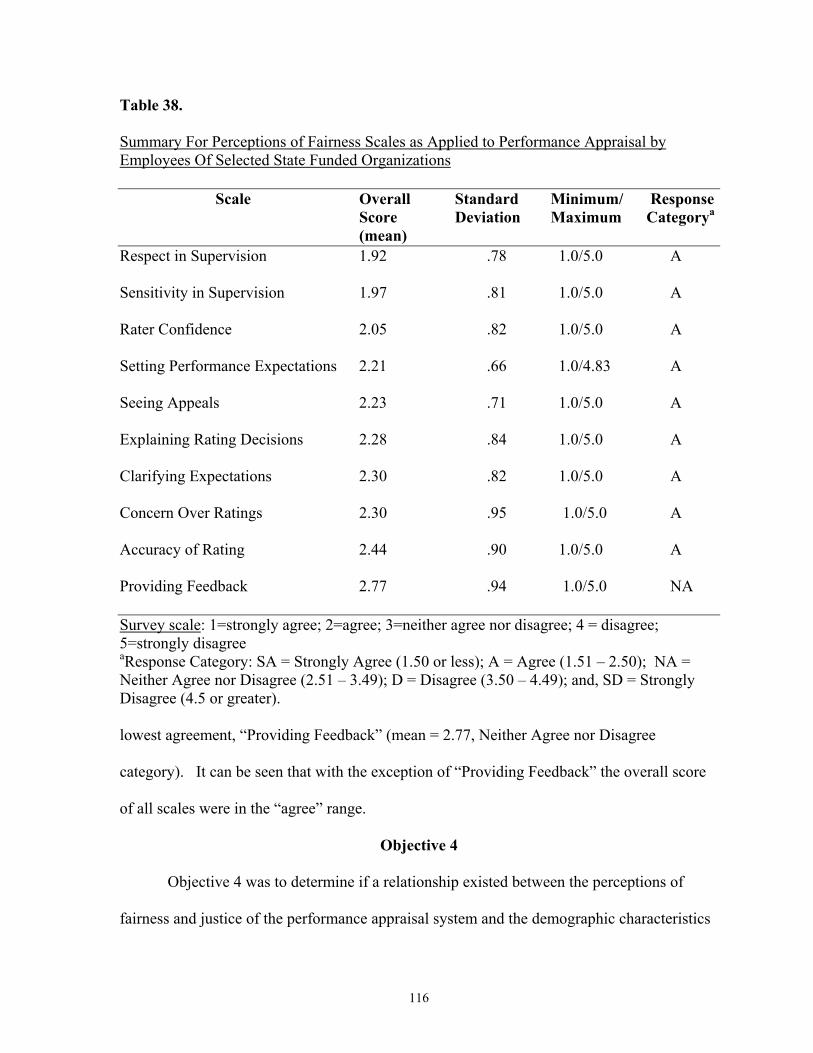
116
Table 38.
Summary For Perceptions of Fairness Scales as Applied to Performance Appraisal by Employees Of Selected State Funded Organizations Scale Overall Standard Minimum/ Response Score Deviation Maximum Categorya (mean) Respect in Supervision 1.92 .78 1.0/5.0 A Sensitivity in Supervision 1.97 .81 1.0/5.0 A Rater Confidence 2.05 .82 1.0/5.0 A Setting Performance Expectations 2.21 .66 1.0/4.83 A Seeing Appeals 2.23 .71 1.0/5.0 A Explaining Rating Decisions 2.28 .84 1.0/5.0 A Clarifying Expectations 2.30 .82 1.0/5.0 A Concern Over Ratings 2.30 .95 1.0/5.0 A Accuracy of Rating 2.44 .90 1.0/5.0 A Providing Feedback 2.77 .94 1.0/5.0 NA Survey scale: 1=strongly agree; 2=agree; 3=neither agree nor disagree; 4 = disagree; 5=strongly disagree aResponse Category: SA = Strongly Agree (1.50 or less); A = Agree (1.51 – 2.50); NA = Neither Agree nor Disagree (2.51 – 3.49); D = Disagree (3.50 – 4.49); and, SD = Strongly Disagree (4.5 or greater). lowest agreement, “Providing Feedback” (mean = 2.77, Neither Agree nor Disagree
category). It can be seen that with the exception of “Providing Feedback” the overall score
of all scales were in the “agree” range.
Objective 4
Objective 4 was to determine if a relationship existed between the perceptions of
fairness and justice of the performance appraisal system and the demographic characteristics
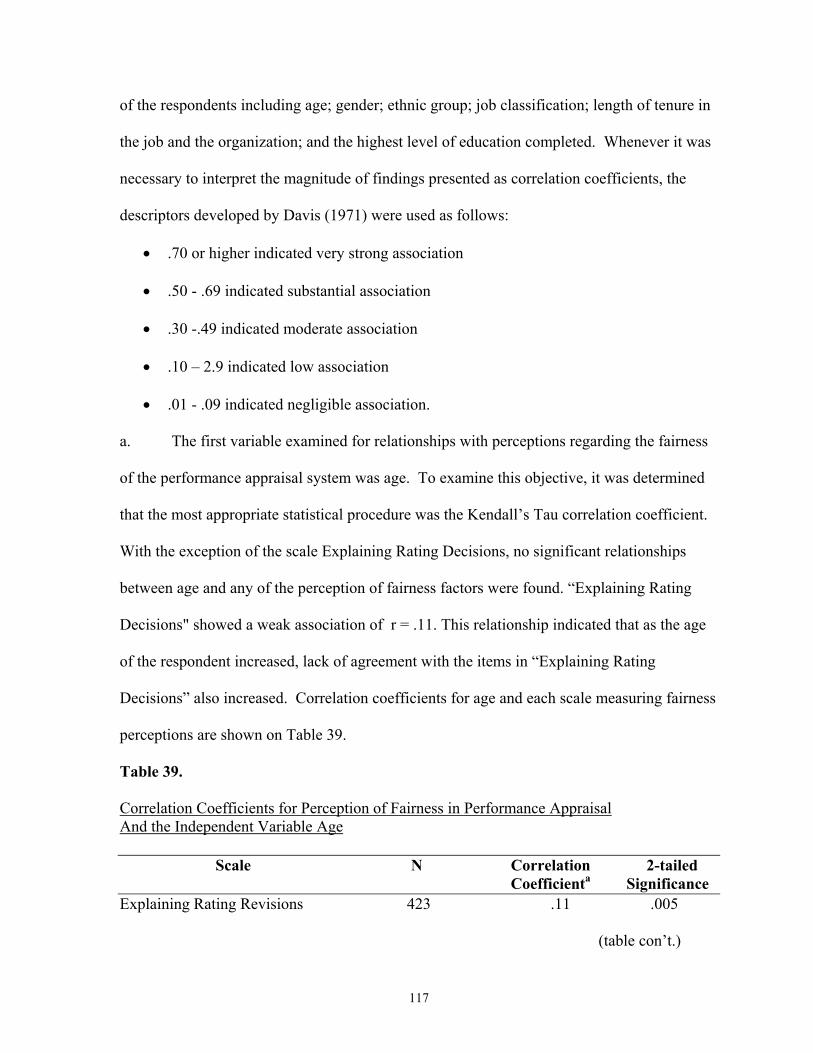
117
of the respondents including age; gender; ethnic group; job classification; length of tenure in
the job and the organization; and the highest level of education completed. Whenever it was
necessary to interpret the magnitude of findings presented as correlation coefficients, the
descriptors developed by Davis (1971) were used as follows:
• .70 or higher indicated very strong association
• .50 - .69 indicated substantial association
• .30 -.49 indicated moderate association
• .10 – 2.9 indicated low association
• .01 - .09 indicated negligible association.
a. The first variable examined for relationships with perceptions regarding the fairness
of the performance appraisal system was age. To examine this objective, it was determined
that the most appropriate statistical procedure was the Kendall’s Tau correlation coefficient.
With the exception of the scale Explaining Rating Decisions, no significant relationships
between age and any of the perception of fairness factors were found. “Explaining Rating
Decisions" showed a weak association of r = .11. This relationship indicated that as the age
of the respondent increased, lack of agreement with the items in “Explaining Rating
Decisions” also increased. Correlation coefficients for age and each scale measuring fairness
perceptions are shown on Table 39.
Table 39.
Correlation Coefficients for Perception of Fairness in Performance Appraisal And the Independent Variable Age Scale N Correlation 2-tailed Coefficienta Significance Explaining Rating Revisions 423 .11 .005 (table con’t.)
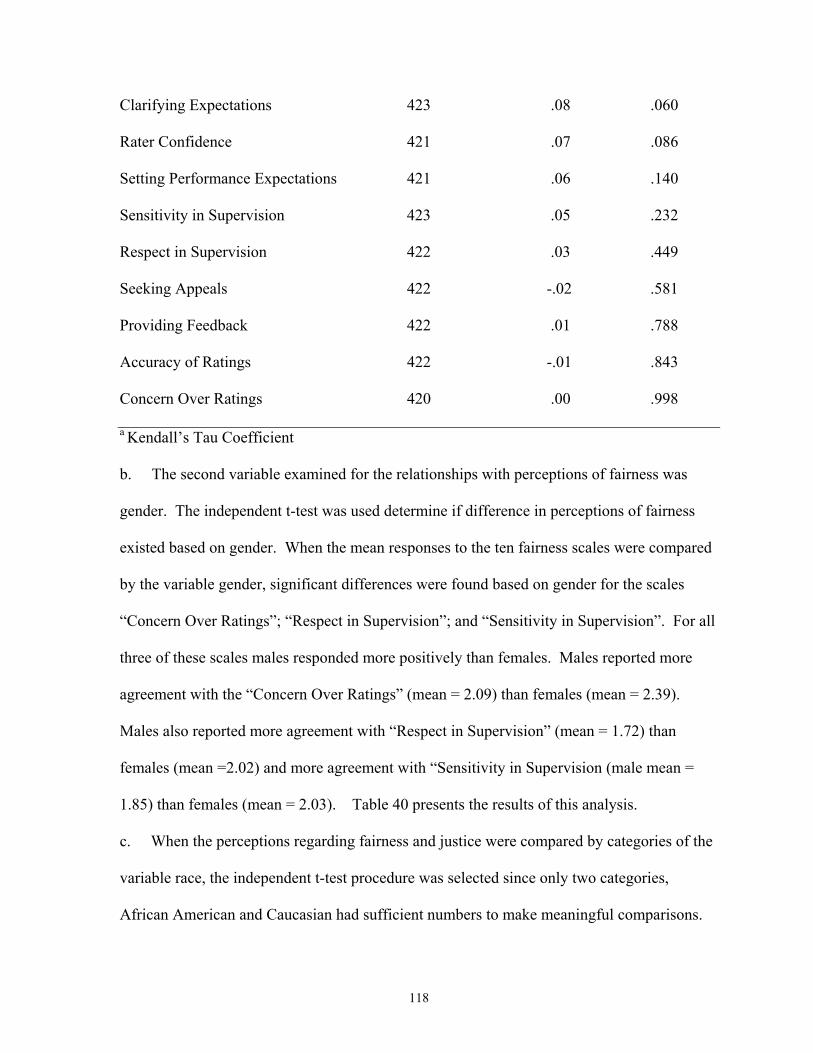
118
Clarifying Expectations 423 .08 .060 Rater Confidence 421 .07 .086 Setting Performance Expectations 421 .06 .140 Sensitivity in Supervision 423 .05 .232 Respect in Supervision 422 .03 .449 Seeking Appeals 422 -.02 .581 Providing Feedback 422 .01 .788 Accuracy of Ratings 422 -.01 .843 Concern Over Ratings 420 .00 .998 a Kendall’s Tau Coefficient b. The second variable examined for the relationships with perceptions of fairness was
gender. The independent t-test was used determine if difference in perceptions of fairness
existed based on gender. When the mean responses to the ten fairness scales were compared
by the variable gender, significant differences were found based on gender for the scales
“Concern Over Ratings”; “Respect in Supervision”; and “Sensitivity in Supervision”. For all
three of these scales males responded more positively than females. Males reported more
agreement with the “Concern Over Ratings” (mean = 2.09) than females (mean = 2.39).
Males also reported more agreement with “Respect in Supervision” (mean = 1.72) than
females (mean =2.02) and more agreement with “Sensitivity in Supervision (male mean =
1.85) than females (mean = 2.03). Table 40 presents the results of this analysis.
c. When the perceptions regarding fairness and justice were compared by categories of the
variable race, the independent t-test procedure was selected since only two categories,
African American and Caucasian had sufficient numbers to make meaningful comparisons.
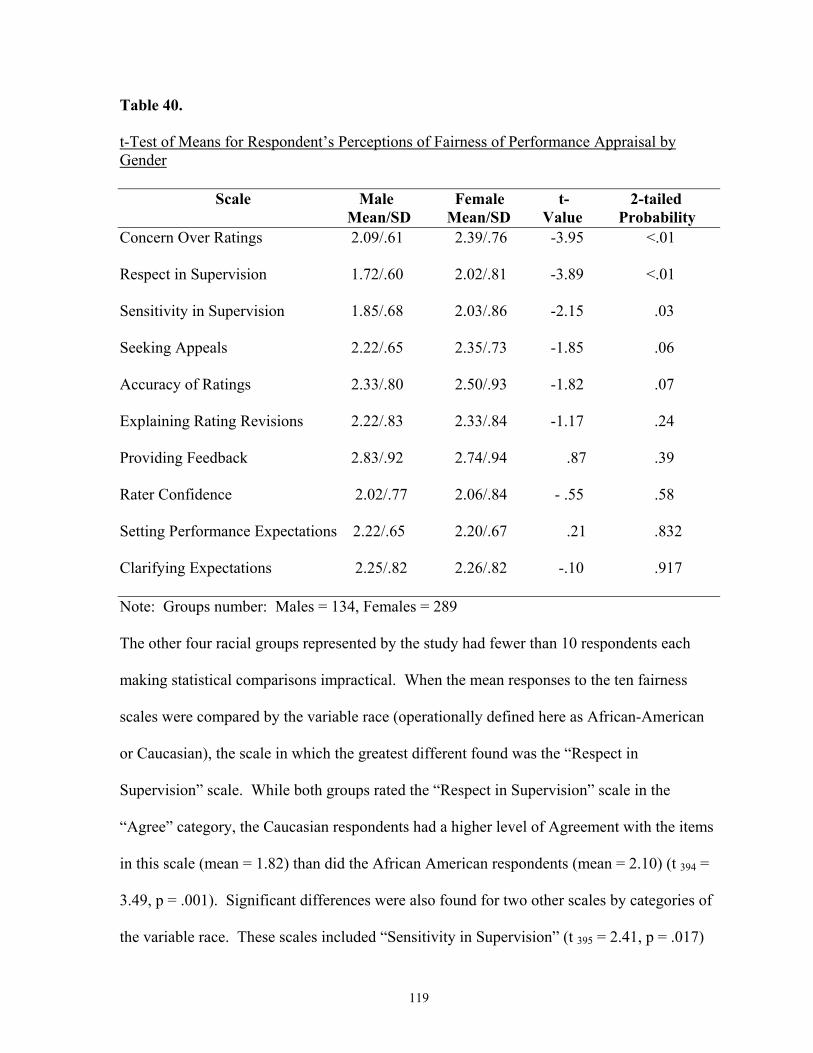
119
Table 40. t-Test of Means for Respondent’s Perceptions of Fairness of Performance Appraisal by Gender Scale Male Female t- 2-tailed Mean/SD Mean/SD Value Probability Concern Over Ratings 2.09/.61 2.39/.76 -3.95 <.01 Respect in Supervision 1.72/.60 2.02/.81 -3.89 <.01 Sensitivity in Supervision 1.85/.68 2.03/.86 -2.15 .03 Seeking Appeals 2.22/.65 2.35/.73 -1.85 .06 Accuracy of Ratings 2.33/.80 2.50/.93 -1.82 .07 Explaining Rating Revisions 2.22/.83 2.33/.84 -1.17 .24 Providing Feedback 2.83/.92 2.74/.94 .87 .39 Rater Confidence 2.02/.77 2.06/.84 - .55 .58 Setting Performance Expectations 2.22/.65 2.20/.67 .21 .832 Clarifying Expectations 2.25/.82 2.26/.82 -.10 .917 Note: Groups number: Males = 134, Females = 289 The other four racial groups represented by the study had fewer than 10 respondents each
making statistical comparisons impractical. When the mean responses to the ten fairness
scales were compared by the variable race (operationally defined here as African-American
or Caucasian), the scale in which the greatest different found was the “Respect in
Supervision” scale. While both groups rated the “Respect in Supervision” scale in the
“Agree” category, the Caucasian respondents had a higher level of Agreement with the items
in this scale (mean = 1.82) than did the African American respondents (mean = 2.10) (t 394 =
3.49, p = .001). Significant differences were also found for two other scales by categories of
the variable race. These scales included “Sensitivity in Supervision” (t 395 = 2.41, p = .017)
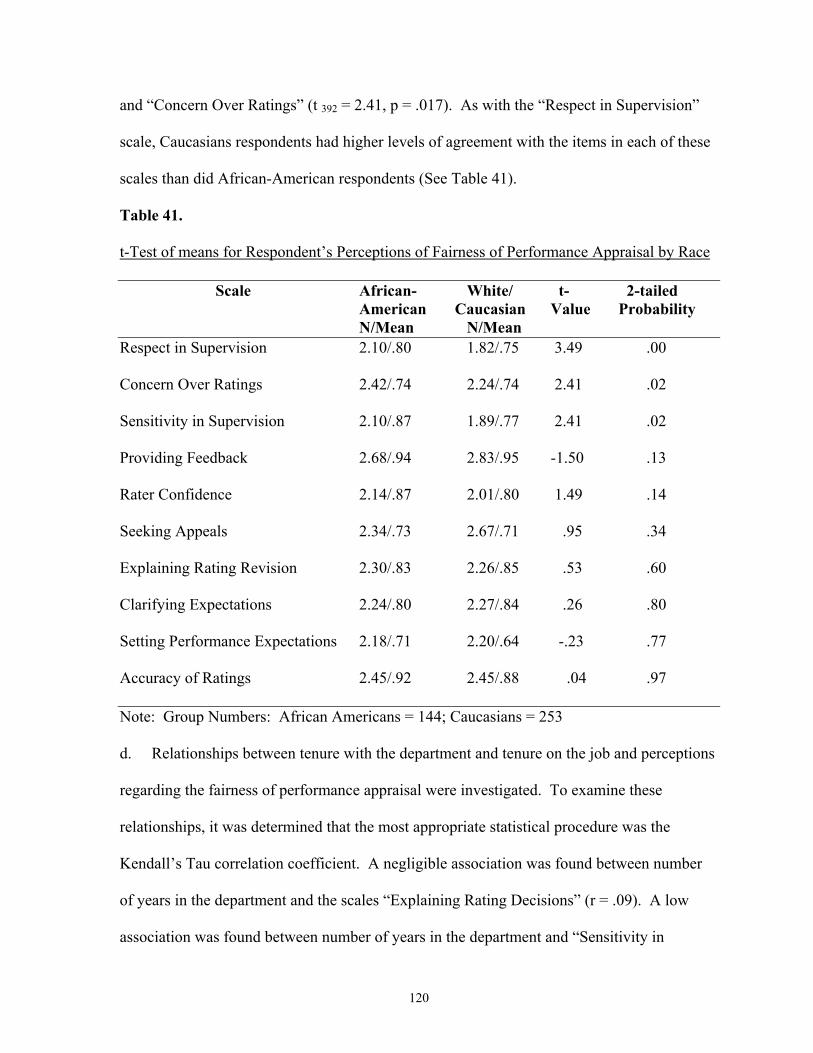
120
and “Concern Over Ratings” (t 392 = 2.41, p = .017). As with the “Respect in Supervision”
scale, Caucasians respondents had higher levels of agreement with the items in each of these
scales than did African-American respondents (See Table 41).
Table 41. t-Test of means for Respondent’s Perceptions of Fairness of Performance Appraisal by Race Scale African- White/ t- 2-tailed American Caucasian Value Probability N/Mean N/Mean Respect in Supervision 2.10/.80 1.82/.75 3.49 .00 Concern Over Ratings 2.42/.74 2.24/.74 2.41 .02 Sensitivity in Supervision 2.10/.87 1.89/.77 2.41 .02 Providing Feedback 2.68/.94 2.83/.95 -1.50 .13 Rater Confidence 2.14/.87 2.01/.80 1.49 .14 Seeking Appeals 2.34/.73 2.67/.71 .95 .34 Explaining Rating Revision 2.30/.83 2.26/.85 .53 .60 Clarifying Expectations 2.24/.80 2.27/.84 .26 .80 Setting Performance Expectations 2.18/.71 2.20/.64 -.23 .77 Accuracy of Ratings 2.45/.92 2.45/.88 .04 .97 Note: Group Numbers: African Americans = 144; Caucasians = 253 d. Relationships between tenure with the department and tenure on the job and perceptions
regarding the fairness of performance appraisal were investigated. To examine these
relationships, it was determined that the most appropriate statistical procedure was the
Kendall’s Tau correlation coefficient. A negligible association was found between number
of years in the department and the scales “Explaining Rating Decisions” (r = .09). A low
association was found between number of years in the department and “Sensitivity in
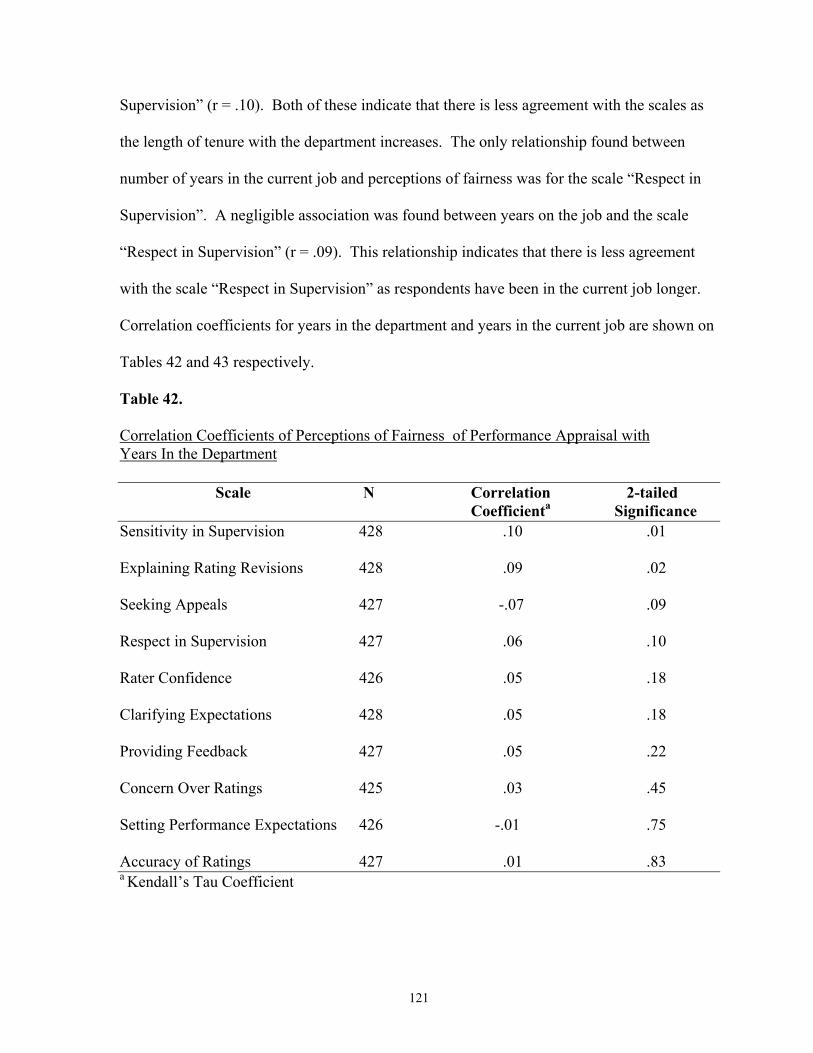
121
Supervision” (r = .10). Both of these indicate that there is less agreement with the scales as
the length of tenure with the department increases. The only relationship found between
number of years in the current job and perceptions of fairness was for the scale “Respect in
Supervision”. A negligible association was found between years on the job and the scale
“Respect in Supervision” (r = .09). This relationship indicates that there is less agreement
with the scale “Respect in Supervision” as respondents have been in the current job longer.
Correlation coefficients for years in the department and years in the current job are shown on
Tables 42 and 43 respectively.
Table 42. Correlation Coefficients of Perceptions of Fairness of Performance Appraisal with Years In the Department Scale N Correlation 2-tailed Coefficienta Significance Sensitivity in Supervision 428 .10 .01 Explaining Rating Revisions 428 .09 .02 Seeking Appeals 427 -.07 .09 Respect in Supervision 427 .06 .10 Rater Confidence 426 .05 .18 Clarifying Expectations 428 .05 .18 Providing Feedback 427 .05 .22 Concern Over Ratings 425 .03 .45 Setting Performance Expectations 426 -.01 .75 Accuracy of Ratings 427 .01 .83 a Kendall’s Tau Coefficient
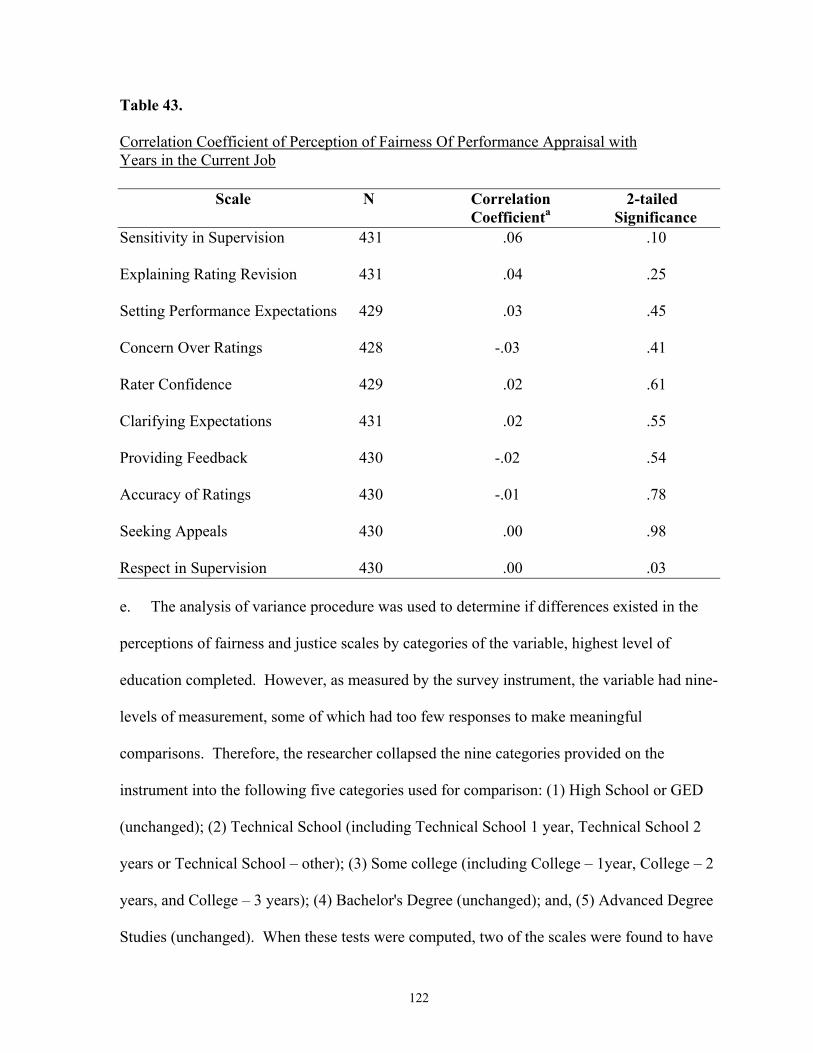
122
Table 43. Correlation Coefficient of Perception of Fairness Of Performance Appraisal with Years in the Current Job Scale N Correlation 2-tailed Coefficienta Significance Sensitivity in Supervision 431 .06 .10
Explaining Rating Revision 431 .04 .25
Setting Performance Expectations 429 .03 .45
Concern Over Ratings 428 -.03 .41
Rater Confidence 429 .02 .61
Clarifying Expectations 431 .02 .55
Providing Feedback 430 -.02 .54
Accuracy of Ratings 430 -.01 .78
Seeking Appeals 430 .00 .98
Respect in Supervision 430 .00 .03 e. The analysis of variance procedure was used to determine if differences existed in the
perceptions of fairness and justice scales by categories of the variable, highest level of
education completed. However, as measured by the survey instrument, the variable had nine-
levels of measurement, some of which had too few responses to make meaningful
comparisons. Therefore, the researcher collapsed the nine categories provided on the
instrument into the following five categories used for comparison: (1) High School or GED
(unchanged); (2) Technical School (including Technical School 1 year, Technical School 2
years or Technical School – other); (3) Some college (including College – 1year, College – 2
years, and College – 3 years); (4) Bachelor's Degree (unchanged); and, (5) Advanced Degree
Studies (unchanged). When these tests were computed, two of the scales were found to have
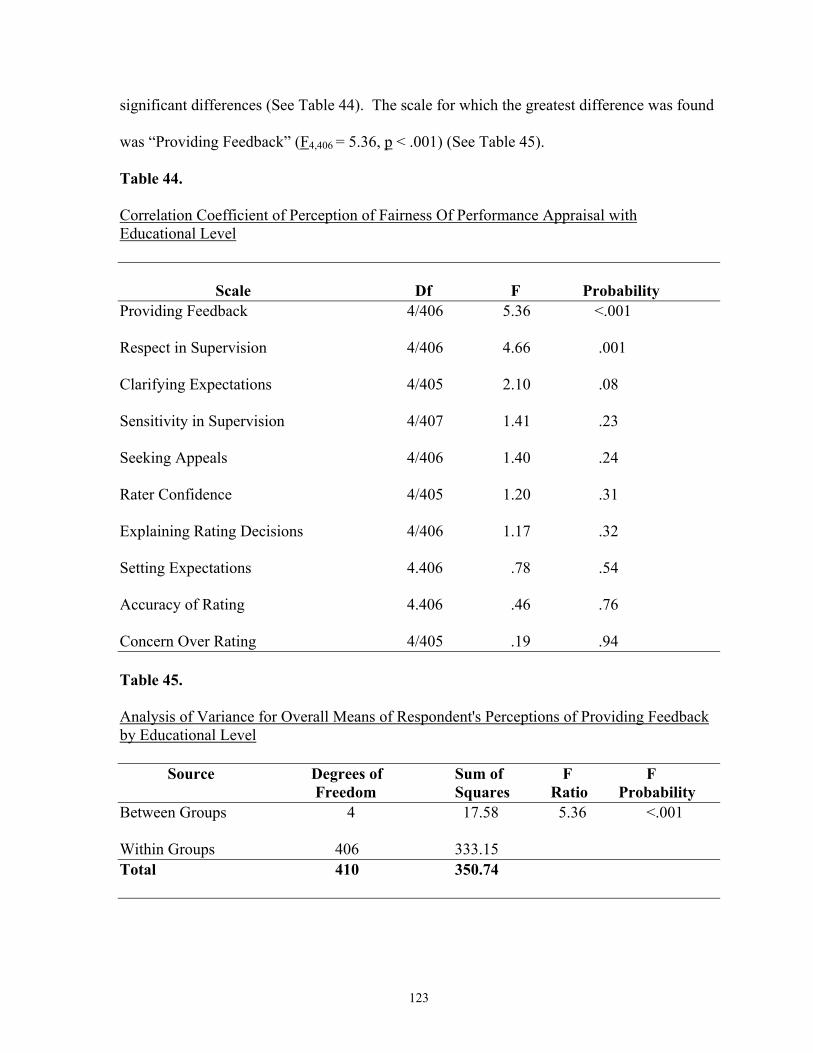
123
significant differences (See Table 44). The scale for which the greatest difference was found
was “Providing Feedback” (F4,406 = 5.36, p < .001) (See Table 45).
Table 44. Correlation Coefficient of Perception of Fairness Of Performance Appraisal with Educational Level Scale Df F Probability Providing Feedback 4/406 5.36 <.001 Respect in Supervision 4/406 4.66 .001 Clarifying Expectations 4/405 2.10 .08 Sensitivity in Supervision 4/407 1.41 .23 Seeking Appeals 4/406 1.40 .24 Rater Confidence 4/405 1.20 .31 Explaining Rating Decisions 4/406 1.17 .32 Setting Expectations 4.406 .78 .54 Accuracy of Rating 4.406 .46 .76 Concern Over Rating 4/405 .19 .94 Table 45. Analysis of Variance for Overall Means of Respondent's Perceptions of Providing Feedback by Educational Level Source Degrees of Sum of F F Freedom Squares Ratio Probability Between Groups 4 17.58 5.36 <.001 Within Groups 406 333.15 Total 410 350.74
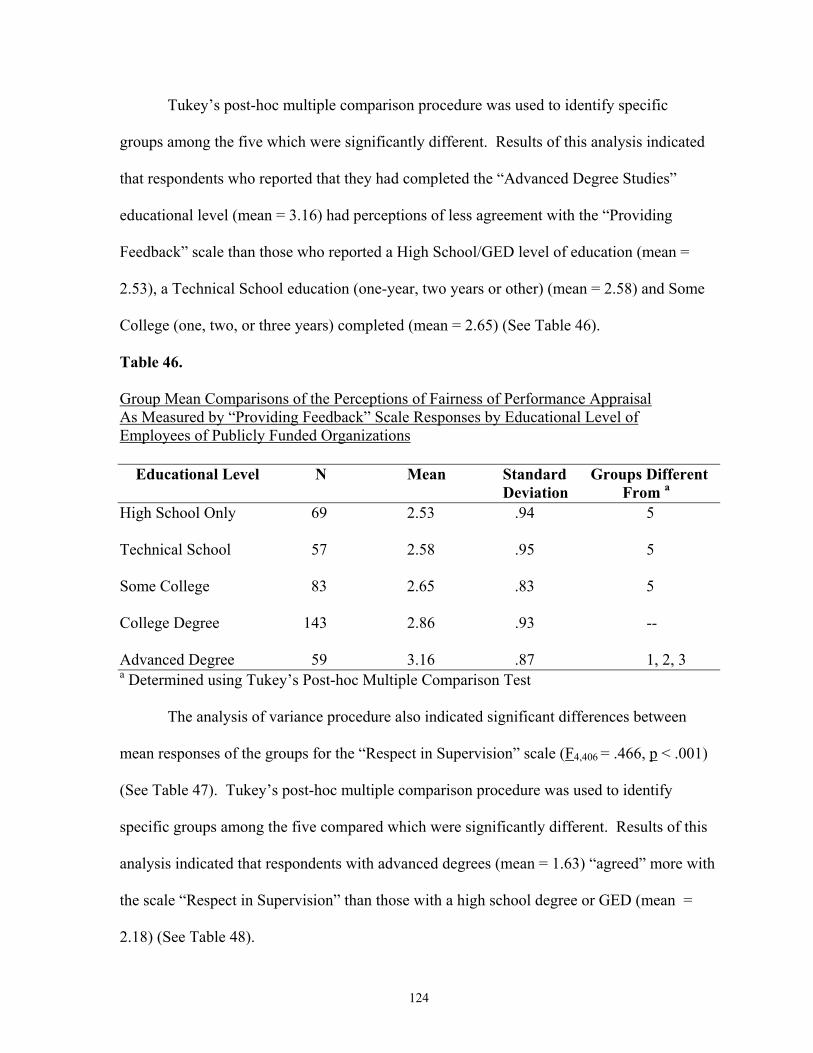
124
Tukey’s post-hoc multiple comparison procedure was used to identify specific
groups among the five which were significantly different. Results of this analysis indicated
that respondents who reported that they had completed the “Advanced Degree Studies”
educational level (mean = 3.16) had perceptions of less agreement with the “Providing
Feedback” scale than those who reported a High School/GED level of education (mean =
2.53), a Technical School education (one-year, two years or other) (mean = 2.58) and Some
College (one, two, or three years) completed (mean = 2.65) (See Table 46).
Table 46. Group Mean Comparisons of the Perceptions of Fairness of Performance Appraisal As Measured by “Providing Feedback” Scale Responses by Educational Level of Employees of Publicly Funded Organizations Educational Level N Mean Standard Groups Different Deviation From a High School Only 69 2.53 .94 5 Technical School 57 2.58 .95 5 Some College 83 2.65 .83 5 College Degree 143 2.86 .93 -- Advanced Degree 59 3.16 .87 1, 2, 3 a Determined using Tukey’s Post-hoc Multiple Comparison Test
The analysis of variance procedure also indicated significant differences between
mean responses of the groups for the “Respect in Supervision” scale (F4,406 = .466, p < .001)
(See Table 47). Tukey’s post-hoc multiple comparison procedure was used to identify
specific groups among the five compared which were significantly different. Results of this
analysis indicated that respondents with advanced degrees (mean = 1.63) “agreed” more with
the scale “Respect in Supervision” than those with a high school degree or GED (mean =
2.18) (See Table 48).
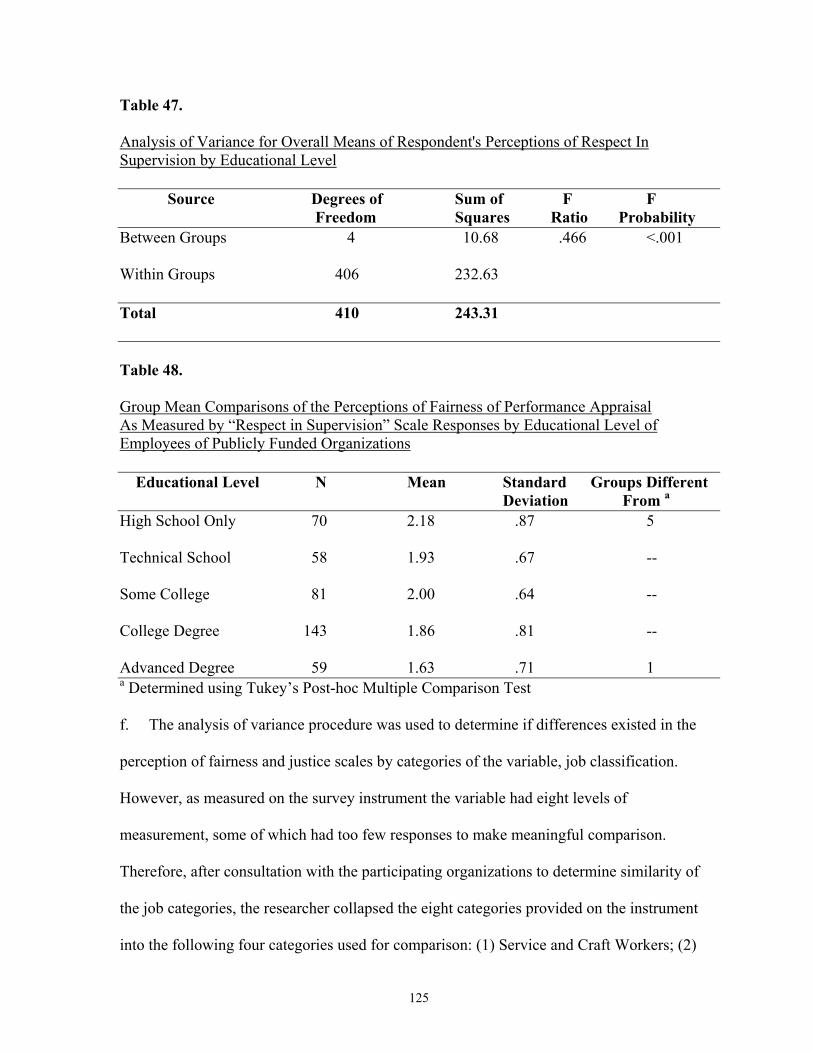
125
Table 47. Analysis of Variance for Overall Means of Respondent's Perceptions of Respect In Supervision by Educational Level Source Degrees of Sum of F F Freedom Squares Ratio Probability Between Groups 4 10.68 .466 <.001 Within Groups 406 232.63 Total 410 243.31 Table 48. Group Mean Comparisons of the Perceptions of Fairness of Performance Appraisal As Measured by “Respect in Supervision” Scale Responses by Educational Level of Employees of Publicly Funded Organizations Educational Level N Mean Standard Groups Different Deviation From a High School Only 70 2.18 .87 5 Technical School 58 1.93 .67 -- Some College 81 2.00 .64 -- College Degree 143 1.86 .81 -- Advanced Degree 59 1.63 .71 1 a Determined using Tukey’s Post-hoc Multiple Comparison Test
f. The analysis of variance procedure was used to determine if differences existed in the
perception of fairness and justice scales by categories of the variable, job classification.
However, as measured on the survey instrument the variable had eight levels of
measurement, some of which had too few responses to make meaningful comparison.
Therefore, after consultation with the participating organizations to determine similarity of
the job categories, the researcher collapsed the eight categories provided on the instrument
into the following four categories used for comparison: (1) Service and Craft Workers; (2)
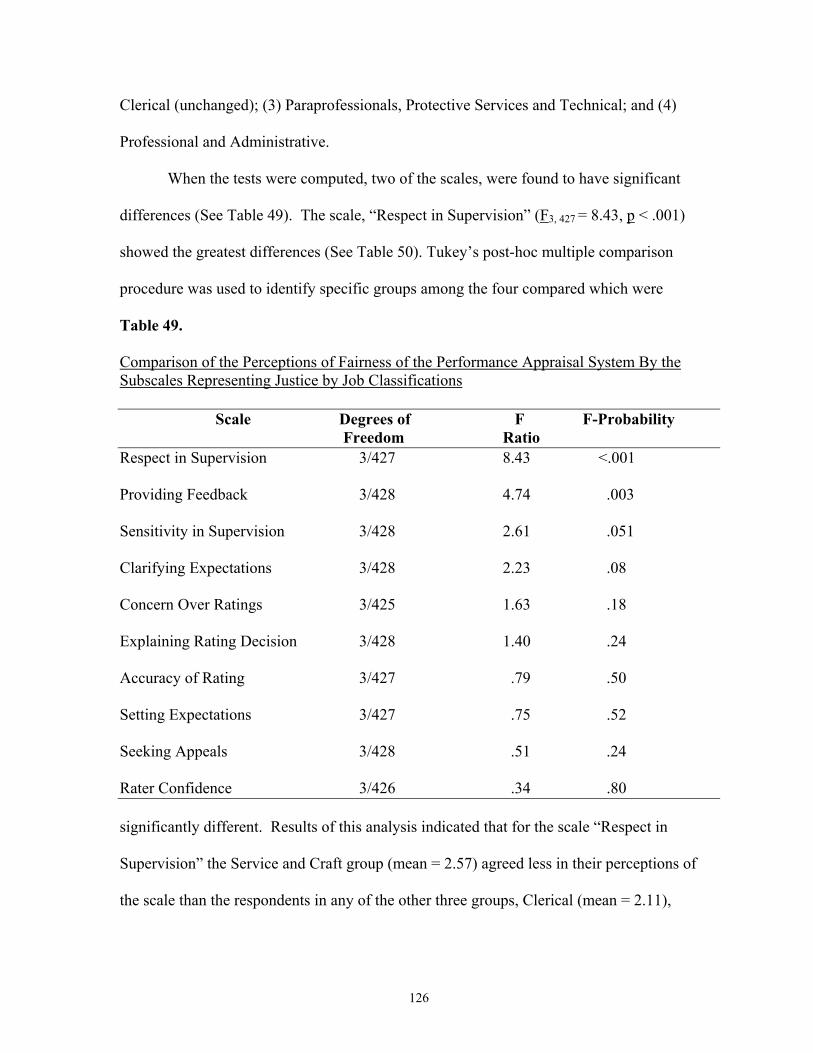
126
Clerical (unchanged); (3) Paraprofessionals, Protective Services and Technical; and (4)
Professional and Administrative.
When the tests were computed, two of the scales, were found to have significant
differences (See Table 49). The scale, “Respect in Supervision” (F3, 427 = 8.43, p < .001)
showed the greatest differences (See Table 50). Tukey’s post-hoc multiple comparison
procedure was used to identify specific groups among the four compared which were
Table 49.
Comparison of the Perceptions of Fairness of the Performance Appraisal System By the Subscales Representing Justice by Job Classifications Scale Degrees of F F-Probability Freedom Ratio Respect in Supervision 3/427 8.43 <.001
Providing Feedback 3/428 4.74 .003
Sensitivity in Supervision 3/428 2.61 .051
Clarifying Expectations 3/428 2.23 .08
Concern Over Ratings 3/425 1.63 .18
Explaining Rating Decision 3/428 1.40 .24
Accuracy of Rating 3/427 .79 .50
Setting Expectations 3/427 .75 .52
Seeking Appeals 3/428 .51 .24
Rater Confidence 3/426 .34 .80
significantly different. Results of this analysis indicated that for the scale “Respect in
Supervision” the Service and Craft group (mean = 2.57) agreed less in their perceptions of
the scale than the respondents in any of the other three groups, Clerical (mean = 2.11),
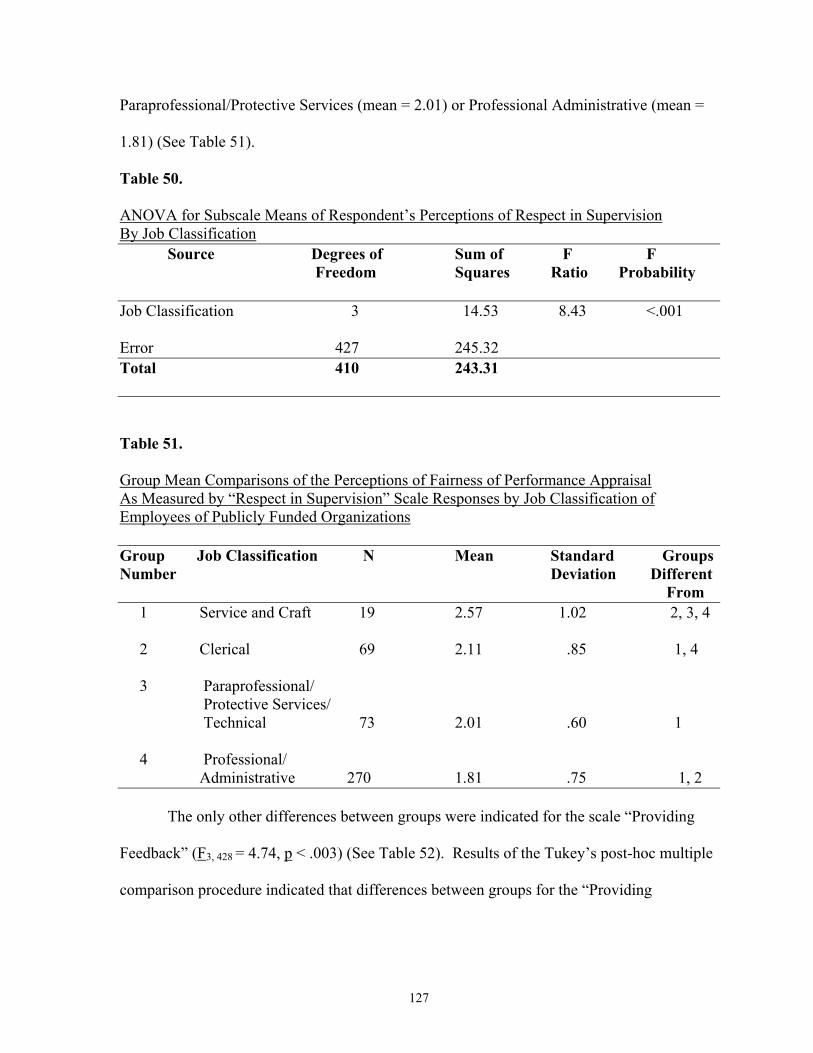
127
Paraprofessional/Protective Services (mean = 2.01) or Professional Administrative (mean =
1.81) (See Table 51).
Table 50. ANOVA for Subscale Means of Respondent’s Perceptions of Respect in Supervision By Job Classification Source Degrees of Sum of F F Freedom Squares Ratio Probability Job Classification 3 14.53 8.43 <.001 Error 427 245.32 Total 410 243.31 Table 51. Group Mean Comparisons of the Perceptions of Fairness of Performance Appraisal As Measured by “Respect in Supervision” Scale Responses by Job Classification of Employees of Publicly Funded Organizations Group Job Classification N Mean Standard Groups Number Deviation Different From 1 Service and Craft 19 2.57 1.02 2, 3, 4 2 Clerical 69 2.11 .85 1, 4
3 Paraprofessional/ Protective Services/ Technical 73 2.01 .60 1 4 Professional/
Administrative 270 1.81 .75 1, 2 The only other differences between groups were indicated for the scale “Providing
Feedback” (F3, 428 = 4.74, p < .003) (See Table 52). Results of the Tukey’s post-hoc multiple
comparison procedure indicated that differences between groups for the “Providing
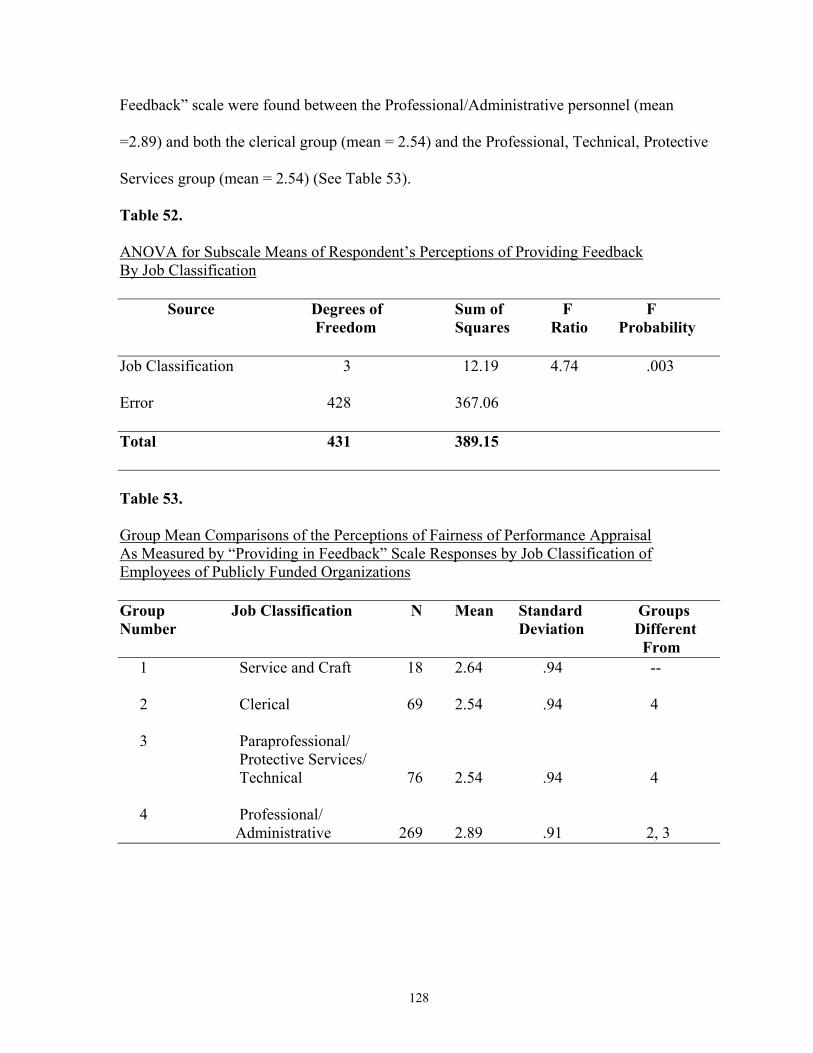
128
Feedback” scale were found between the Professional/Administrative personnel (mean
=2.89) and both the clerical group (mean = 2.54) and the Professional, Technical, Protective
Services group (mean = 2.54) (See Table 53).
Table 52. ANOVA for Subscale Means of Respondent’s Perceptions of Providing Feedback By Job Classification Source Degrees of Sum of F F Freedom Squares Ratio Probability Job Classification 3 12.19 4.74 .003 Error 428 367.06 Total 431 389.15 Table 53. Group Mean Comparisons of the Perceptions of Fairness of Performance Appraisal As Measured by “Providing in Feedback” Scale Responses by Job Classification of Employees of Publicly Funded Organizations Group Job Classification N Mean Standard Groups Number Deviation Different From 1 Service and Craft 18 2.64 .94 --
2 Clerical 69 2.54 .94 4
3 Paraprofessional/ Protective Services/ Technical 76 2.54 .94 4 4 Professional/ Administrative 269 2.89 .91 2, 3
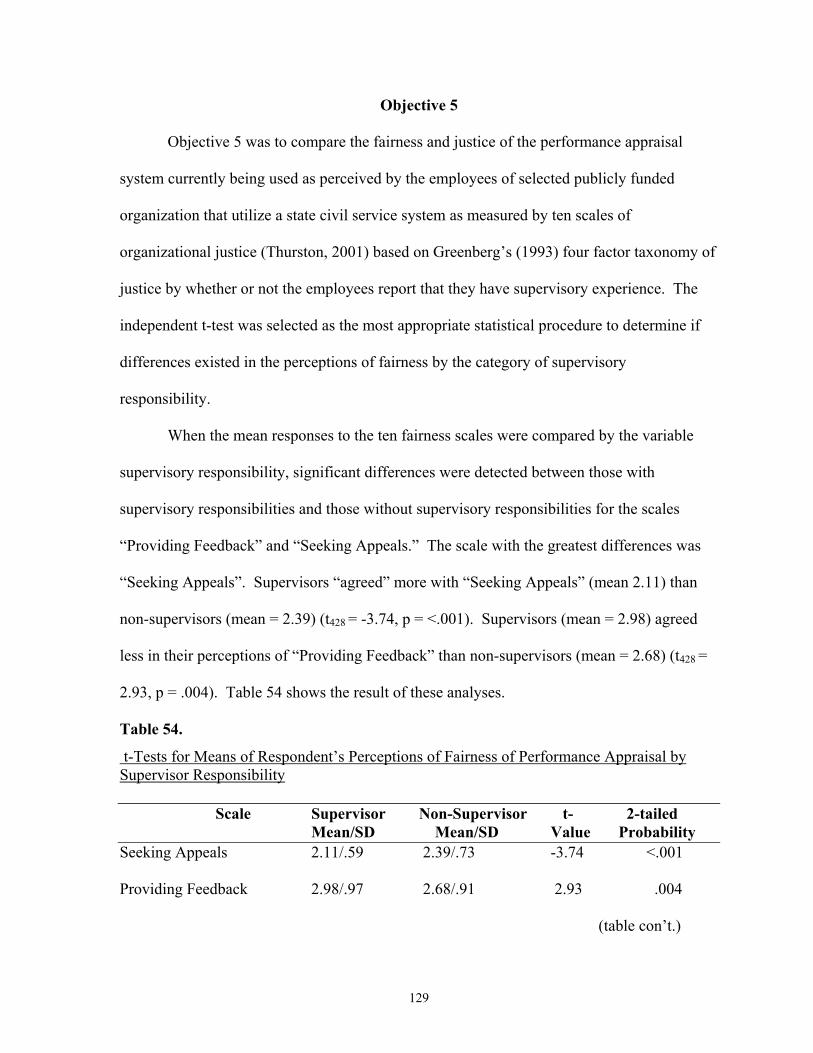
129
Objective 5
Objective 5 was to compare the fairness and justice of the performance appraisal
system currently being used as perceived by the employees of selected publicly funded
organization that utilize a state civil service system as measured by ten scales of
organizational justice (Thurston, 2001) based on Greenberg’s (1993) four factor taxonomy of
justice by whether or not the employees report that they have supervisory experience. The
independent t-test was selected as the most appropriate statistical procedure to determine if
differences existed in the perceptions of fairness by the category of supervisory
responsibility.
When the mean responses to the ten fairness scales were compared by the variable
supervisory responsibility, significant differences were detected between those with
supervisory responsibilities and those without supervisory responsibilities for the scales
“Providing Feedback” and “Seeking Appeals.” The scale with the greatest differences was
“Seeking Appeals”. Supervisors “agreed” more with “Seeking Appeals” (mean 2.11) than
non-supervisors (mean = 2.39) (t428 = -3.74, p = <.001). Supervisors (mean = 2.98) agreed
less in their perceptions of “Providing Feedback” than non-supervisors (mean = 2.68) (t428 =
2.93, p = .004). Table 54 shows the result of these analyses.
Table 54.
t-Tests for Means of Respondent’s Perceptions of Fairness of Performance Appraisal by Supervisor Responsibility Scale Supervisor Non-Supervisor t- 2-tailed Mean/SD Mean/SD Value Probability Seeking Appeals 2.11/.59 2.39/.73 -3.74 <.001
Providing Feedback 2.98/.97 2.68/.91 2.93 .004
(table con’t.)
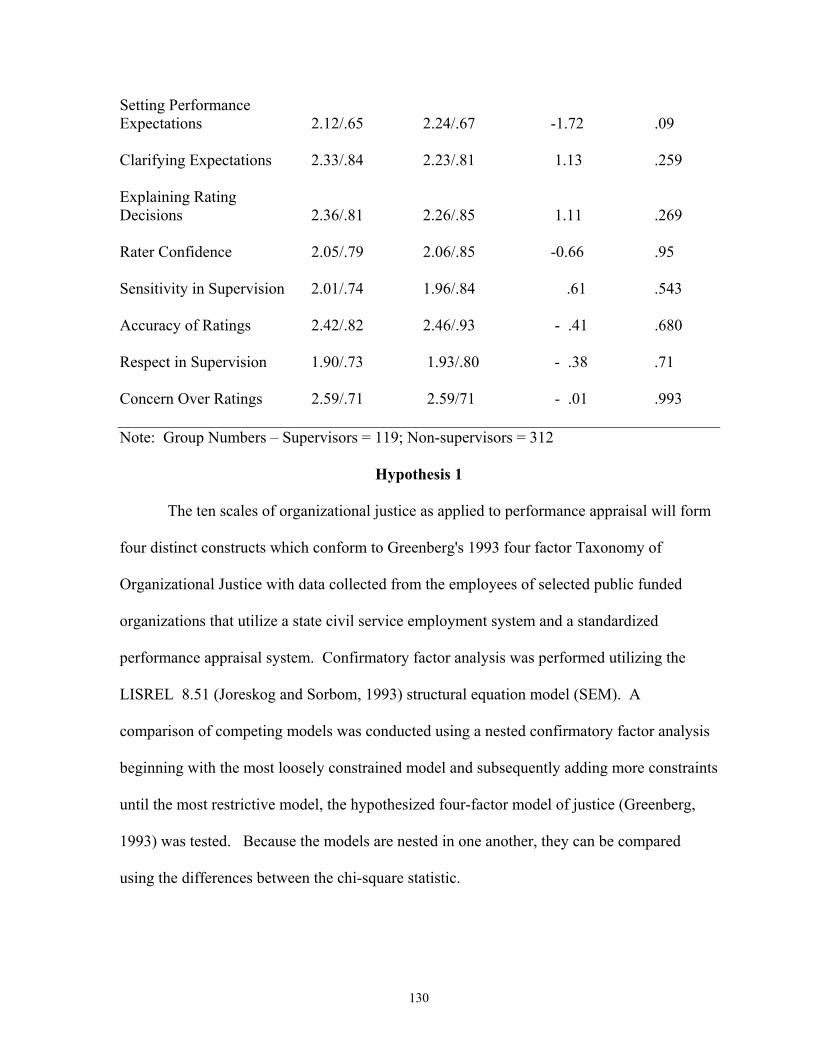
130
Setting Performance Expectations 2.12/.65 2.24/.67 -1.72 .09 Clarifying Expectations 2.33/.84 2.23/.81 1.13 .259 Explaining Rating Decisions 2.36/.81 2.26/.85 1.11 .269 Rater Confidence 2.05/.79 2.06/.85 -0.66 .95 Sensitivity in Supervision 2.01/.74 1.96/.84 .61 .543 Accuracy of Ratings 2.42/.82 2.46/.93 - .41 .680 Respect in Supervision 1.90/.73 1.93/.80 - .38 .71 Concern Over Ratings 2.59/.71 2.59/71 - .01 .993 Note: Group Numbers – Supervisors = 119; Non-supervisors = 312
Hypothesis 1
The ten scales of organizational justice as applied to performance appraisal will form
four distinct constructs which conform to Greenberg's 1993 four factor Taxonomy of
Organizational Justice with data collected from the employees of selected public funded
organizations that utilize a state civil service employment system and a standardized
performance appraisal system. Confirmatory factor analysis was performed utilizing the
LISREL 8.51 (Joreskog and Sorbom, 1993) structural equation model (SEM). A
comparison of competing models was conducted using a nested confirmatory factor analysis
beginning with the most loosely constrained model and subsequently adding more constraints
until the most restrictive model, the hypothesized four-factor model of justice (Greenberg,
1993) was tested. Because the models are nested in one another, they can be compared
using the differences between the chi-square statistic.
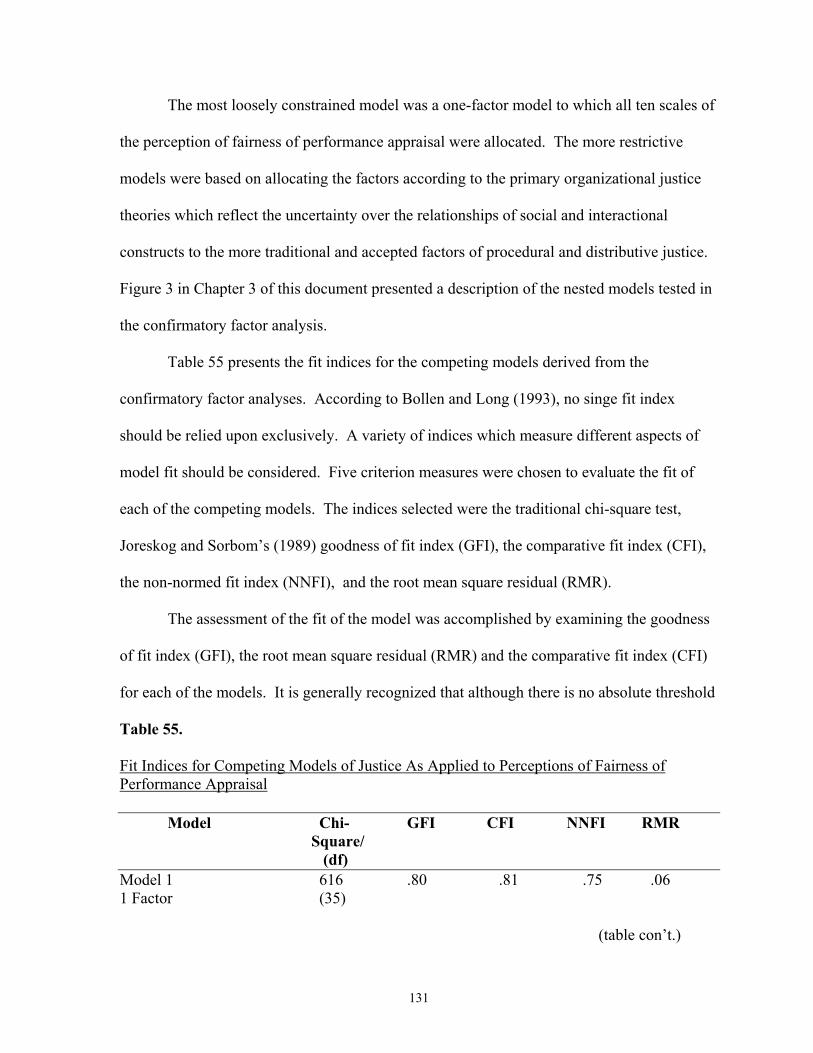
131
The most loosely constrained model was a one-factor model to which all ten scales of
the perception of fairness of performance appraisal were allocated. The more restrictive
models were based on allocating the factors according to the primary organizational justice
theories which reflect the uncertainty over the relationships of social and interactional
constructs to the more traditional and accepted factors of procedural and distributive justice.
Figure 3 in Chapter 3 of this document presented a description of the nested models tested in
the confirmatory factor analysis.
Table 55 presents the fit indices for the competing models derived from the
confirmatory factor analyses. According to Bollen and Long (1993), no singe fit index
should be relied upon exclusively. A variety of indices which measure different aspects of
model fit should be considered. Five criterion measures were chosen to evaluate the fit of
each of the competing models. The indices selected were the traditional chi-square test,
Joreskog and Sorbom’s (1989) goodness of fit index (GFI), the comparative fit index (CFI),
the non-normed fit index (NNFI), and the root mean square residual (RMR).
The assessment of the fit of the model was accomplished by examining the goodness
of fit index (GFI), the root mean square residual (RMR) and the comparative fit index (CFI)
for each of the models. It is generally recognized that although there is no absolute threshold
Table 55. Fit Indices for Competing Models of Justice As Applied to Perceptions of Fairness of Performance Appraisal Model Chi- GFI CFI NNFI RMR Square/ (df) Model 1 616 .80 .81 .75 .06 1 Factor (35) (table con’t.)
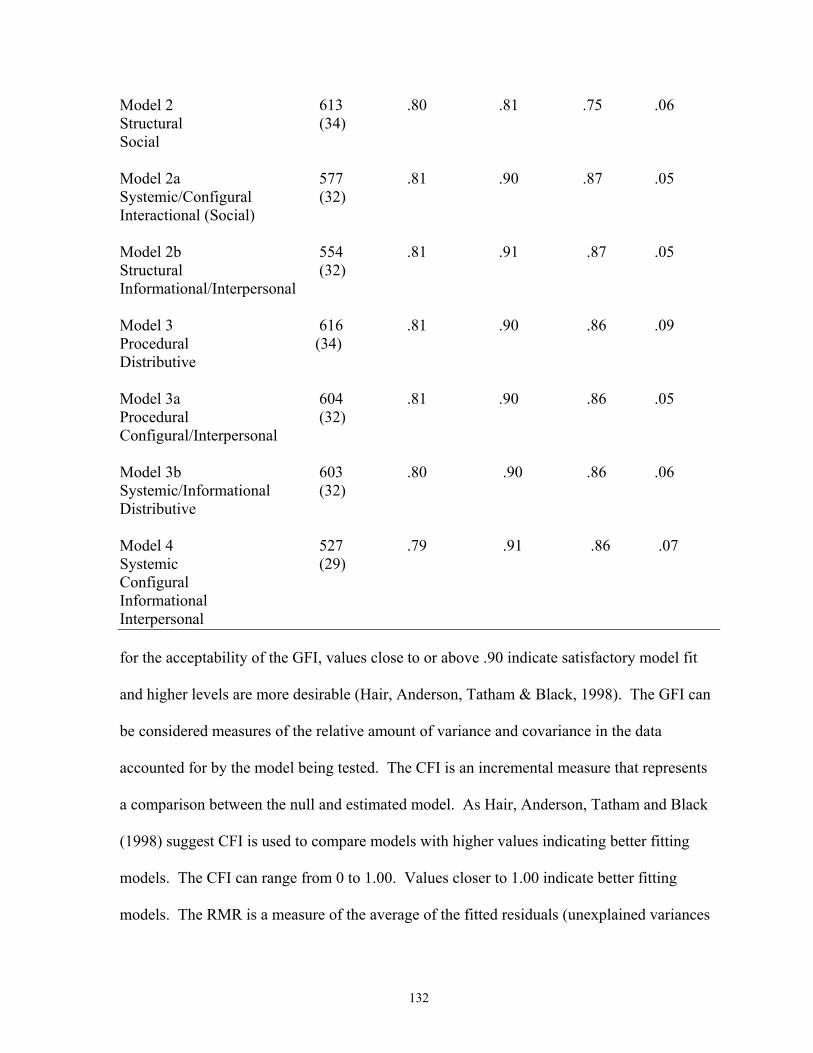
132
Model 2 613 .80 .81 .75 .06 Structural (34) Social Model 2a 577 .81 .90 .87 .05 Systemic/Configural (32) Interactional (Social) Model 2b 554 .81 .91 .87 .05 Structural (32) Informational/Interpersonal Model 3 616 .81 .90 .86 .09 Procedural (34) Distributive Model 3a 604 .81 .90 .86 .05 Procedural (32) Configural/Interpersonal Model 3b 603 .80 .90 .86 .06 Systemic/Informational (32) Distributive Model 4 527 .79 .91 .86 .07 Systemic (29) Configural Informational Interpersonal for the acceptability of the GFI, values close to or above .90 indicate satisfactory model fit
and higher levels are more desirable (Hair, Anderson, Tatham & Black, 1998). The GFI can
be considered measures of the relative amount of variance and covariance in the data
accounted for by the model being tested. The CFI is an incremental measure that represents
a comparison between the null and estimated model. As Hair, Anderson, Tatham and Black
(1998) suggest CFI is used to compare models with higher values indicating better fitting
models. The CFI can range from 0 to 1.00. Values closer to 1.00 indicate better fitting
models. The RMR is a measure of the average of the fitted residuals (unexplained variances
133
and co-variances) in the model. This index should be close to zero if the data fit the model
(Hair, Anderson, Tatham, & Black, 1998). The non-normed fit index (NNFI) compares the
model being tested to a baseline (null) model taking into account the degrees of freedom and
is considered a relative fit index. Similar to the GFI, values greater than or equal to .90 are
considered to be desirable.
As shown on Table 55 the GFI for the models range from .79 for the four-factor
model to .81 for models 2a, 2b, and 3a, less than the desirable level of .90. The CFI for
Models 1 and 2 is .81 but increases to at least .90 for the other models. The RMR ranges
from .05 for Models 2a, 2b, and 3a to .09 for Model 3 indicating that very few of the
variances and co-variances are left unexplained by the models. The NNFI ranges from a low
of .75 for Models 1 and 2 to a high of .87 for Models 2a and 2b.
The fit indices do not indicate an excellent fit for the hypothesized four factor model
or the alternative models. However, the indices indicate at least marginal fit based on the
GFI, CFI, NNFI and RMR indices for Models 2a, 3, 3a, 3b and 4.
A comparison of the nested models was conducted to select the model which best
represents the underlying factor structure of the data. Nested models can be compared using
the differences in Chi-square statistic (Hair, Anderson, Tatham & Black, 1998). This
technique was applied to determine the best model to represent the underlying factor
structure of the ten scales and is described below.
The Models 2 and 3 are both nested in the one-factor justice model. Model 2
represents the structural and social constructs of justice. The social construct is involved
with the implementation of the structural aspects of the process. The traditional distributive
component is allocated across both the social and structural factors. Model 3 represents the
134
more traditional approach to organizational justice with the two constructs of procedural and
distributive justice. Because both Model 2 and Model 3 are nested in Model 1 they can be
compared using the differences in the chi-square statistic. A substantial reliable difference
between Model 1 and Model 2 or Model 1 and Model 3 implies that breaking the one factor
model into a two factor structure provides a better explanation of the underlying patterns in
the measured variables. A comparison of the differences in the chi-square and degrees of
freedom and the fit indices between Model 1 and Models 2 and 3 show little difference. The
Chi-square for Model 1 is 616 with 35 degrees of freedom which improves only slightly to
613 in Model 2 and does not change at all in Model 3 (616). With the exception of a .09
improvement in the CFI between Model 1 and Model 3 there is virtually no difference
between this set of nested models (See Table 56).
The three factor models 2a and 2b are nested in Model 2. Model 2a breaks the
structural component into two separate factors, systemic and configural, while leaving the
social component intact. This is most similar to Skarlicki and Folger’s (1977) hypothesized
justice structure in which interpersonal and informational aspects are combined into a single
factor. Model 2b leaves the structural component in place and breaks the social factor into
informational and interpersonal factors. Since these models are nested in Model 2 they can
be compared using the difference between the Chi square statistic. A substantial difference
between Model 2 and Model 2a or between Model 2 and 2b indicates that the separation of
either the structural or social components provides a better explanation of the underlying
patterns in the measured variables. Model 2a shows a slight improvement over Model 2 with
the Chi-squared ∆(2) = 36 and a change in CFI of .09. The GFI improved only slightly (.01).
Model 2b also showed a slight improvement over Model 2 reflecting a Chi-square ∆ (2) = 59
135
and improvement in the CFI of 0.1. As with Model 2a, the GFI improved only slightly
(0.01).
Models 3a and 3b are nested in the two-factor model representing the traditional
procedural and distributive model of organizational justice. Model 3a distinguishes two
forms of distributive justice, configural and interpersonal, while leaving the procedural factor
in place. This is most similar to the structure proposed by Moorman (1991). Model 3b
leaves the distributive factor in place but breaks the procedural component down into the
systemic and informational components. These three factor models are both nested in the
two-factor procedural and distributive model and can be compared using the differences in
the Chi-square statistic. As seen on Table 56, Models 3a and 3b showed only slight
differences in the Chi-square statistic. Model 3a exhibited differences in the Chi-square of
Chi-square ∆(2) = 12 over Model 3 and Model 3b showed Chi-square ∆(3) = 13.
Improvement in the GFI and CFI was negligible for Models 3a and 3b over Model 3.
Greenberg’s hypothesized model is nested in the three factor models separating the
main theoretical constructs to yield four factors with a model that is one step more
constrained than any of the three factor models. An improvement in fit would provide
evidence to support the hypothesis that the four-factor model best represents the justice factor
structure as measured by the ten scales of justice.
A significant improvement of Model 4 over the three factor models, Model 2a and
Model 2b, would support the separation of the structural factor into the systemic and
configural factors and the social (interactional) into informational and interpersonal. A
significant improvement over Models 3a and 3b would support the separation of the
procedural factors into the systemic and informational components and the distributive factor
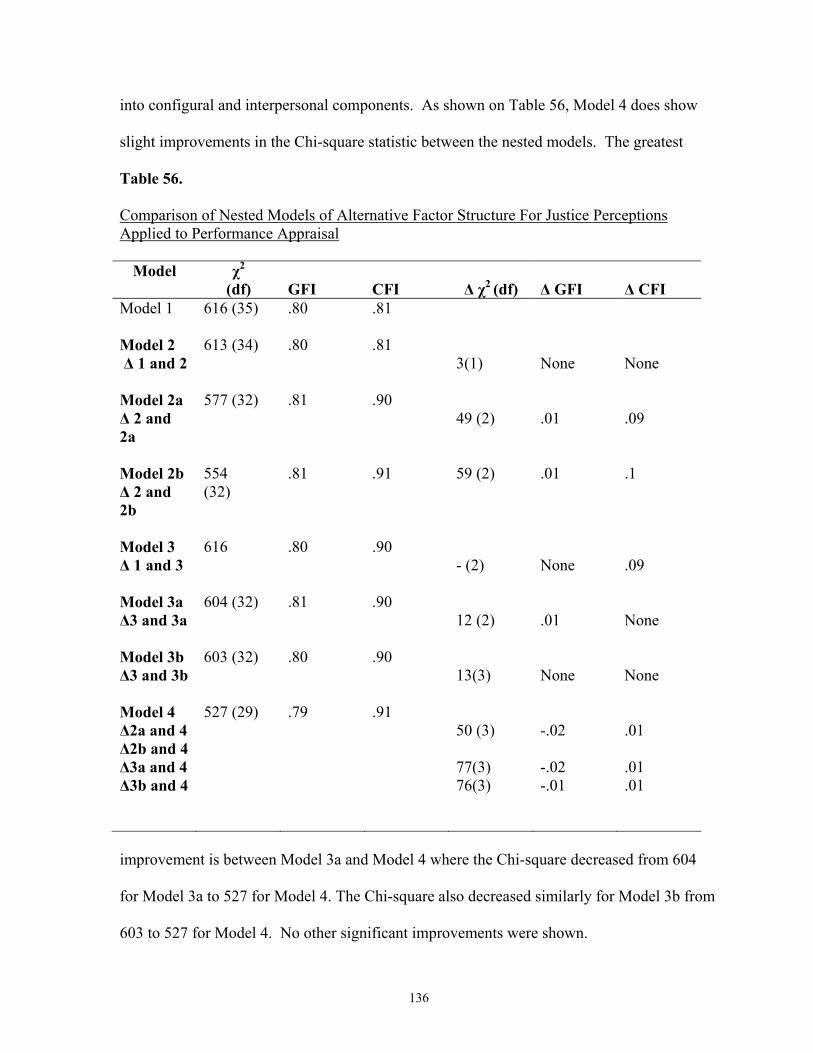
136
into configural and interpersonal components. As shown on Table 56, Model 4 does show
slight improvements in the Chi-square statistic between the nested models. The greatest
Table 56. Comparison of Nested Models of Alternative Factor Structure For Justice Perceptions Applied to Performance Appraisal
Model χ2 (df)
GFI
CFI
∆ χ2 (df)
∆ GFI
∆ CFI
Model 1 616 (35) .80 .81
Model 2 ∆ 1 and 2
613 (34) .80 .81 3(1)
None
None
Model 2a ∆ 2 and 2a
577 (32) .81 .90 49 (2)
.01
.09
Model 2b ∆ 2 and 2b
554 (32)
.81 .91 59 (2)
.01 .1
Model 3 ∆ 1 and 3
616 .80 .90
- (2)
None
.09
Model 3a ∆3 and 3a
604 (32) .81 .90 12 (2)
.01
None
Model 3b ∆3 and 3b
603 (32) .80 .90 13(3)
None
None
Model 4 ∆2a and 4 ∆2b and 4 ∆3a and 4 ∆3b and 4
527 (29) .79 .91 50 (3) 77(3) 76(3)
-.02 -.02 -.01
.01 .01 .01
improvement is between Model 3a and Model 4 where the Chi-square decreased from 604
for Model 3a to 527 for Model 4. The Chi-square also decreased similarly for Model 3b from
603 to 527 for Model 4. No other significant improvements were shown.
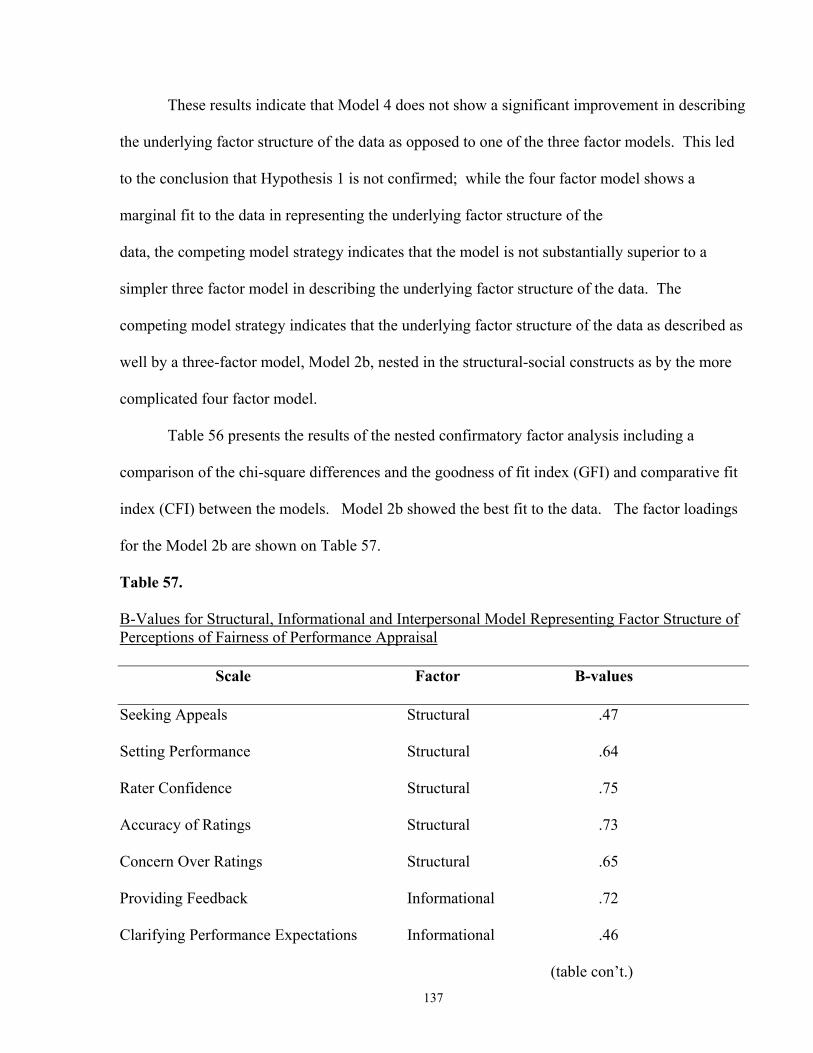
137
These results indicate that Model 4 does not show a significant improvement in describing
the underlying factor structure of the data as opposed to one of the three factor models. This led
to the conclusion that Hypothesis 1 is not confirmed; while the four factor model shows a
marginal fit to the data in representing the underlying factor structure of the
data, the competing model strategy indicates that the model is not substantially superior to a
simpler three factor model in describing the underlying factor structure of the data. The
competing model strategy indicates that the underlying factor structure of the data as described as
well by a three-factor model, Model 2b, nested in the structural-social constructs as by the more
complicated four factor model.
Table 56 presents the results of the nested confirmatory factor analysis including a
comparison of the chi-square differences and the goodness of fit index (GFI) and comparative fit
index (CFI) between the models. Model 2b showed the best fit to the data. The factor loadings
for the Model 2b are shown on Table 57.
Table 57. B-Values for Structural, Informational and Interpersonal Model Representing Factor Structure of Perceptions of Fairness of Performance Appraisal Scale Factor B-values Seeking Appeals Structural .47 Setting Performance Structural .64 Rater Confidence Structural .75 Accuracy of Ratings Structural .73 Concern Over Ratings Structural .65 Providing Feedback Informational .72 Clarifying Performance Expectations Informational .46 (table con’t.)
138
Explaining Rating Decisions Informational .43 Respect in Supervision Interpersonal .57 Sensitivity in Supervision Interpersonal .56
The modification indices provided by the LISREL program were studied but no
theoretically supported changes were indicated and no modifications were made.
Hypotheses 2, 3, 4, and 5 include the analyses of relationships between the scales
measuring perceived fairness in performance appraisal as allocated to the hypothesized four-
factor of justice model with the three scales used to indicate performance appraisal satisfaction:
“Reactions to the PPR”; “Reactions Toward Your Last PPR Performance Rating”; and “Reactions
Toward Your Supervisor”. The descriptors developed by Davis (1971) were used to interpret the
magnitude of the findings presented as correlation coefficients as follows:
• .70 or higher indicated very strong association
• .50 - .69 indicated substantial association
• .30 - .49 indicated moderate association
• .10 - .29 indicated low association
• .01 - .09 indicated negligible association.
Hypothesis 2
A positive relationship will exist between the scales measuring configural justice
(structural-distributive form), “Accuracy of Ratings” and “Concern Over Ratings”, and
satisfaction with the performance appraisal currently being used as perceived by employees of
selected public funded organizations that utilize a sate civil service employment system. The
satisfaction with performance appraisal was measured by the following scales: “Reactions
Toward Your Last PPR Performance Rating” and “Reactions to the PPR”. The relationships were
analyzed using the Pearson Product Moment Correlation Coefficient. The relationships between
139
the specified configural justice scales and “Reactions Toward Your Last Performance Rating”
were r = .64 (p <.001) with the “Accuracy of Ratings” scale and r = .64 (p <.001) with the
“Concern Over Ratings” scale. These relationships indicated “substantial association” between
the two scales and respondent reaction towards their last rating.
Regarding the relationships between the configural justice scales and the dimension of
satisfaction with performance appraisal as measured by the “Reactions to the PPR,” the computed
correlations supported the hypothesis that a positive relationship exists between the configural
justice scales and reactions to the PPR system. The correlations included the following:
correlation between “Accuracy of Ratings” scale and “Reactions to the PPR” was r = .55 (p
<.001); and correlation between “Concern Over Ratings” and “Reactions to the PPR” was r = .54
(p <.001). These relationships indicate substantial associations between the scales representing
configural justice and respondent reactions to the PPR system.
Hypothesis 3
A positive relationship will exist between the scales measuring interpersonal justice
(“Respect in Supervision” and “Sensitivity in Supervision”) and satisfaction with the performance
appraisal system currently being used as perceived by the employees of selected public funded
organizations that utilize a state civil service employment system. Satisfaction with performance
appraisal was measured by the reaction scale, “Reactions Toward You Supervisor.” The
correlation was analyzed using the Pearson Product Moment correlation coefficient. The
relationship between “Respect in Supervision” and “Reactions Toward Your Supervisor” was r =
.61 (p <.001) indicating a “substantial association” (Davis, 1971). The relationship between
“Sensitivity in Supervision” and “Reactions Toward Your Supervisor” was r = .73 (p <.001)
reflecting a “very strong association” (Davis, 1978). Therefore, the hypothesis was confirmed
140
that a positive relationship exists between the scales representing interpersonal justice and
“Reactions Toward Your Supervisor.”
Hypothesis 4
A positive relationship will exist between the scales measuring informational justice,
(Clarifying Expectations; Providing Feedback; and Explaining Rating Decisions) and satisfaction
with the performance appraisal system as measured by the scale “Reaction Toward Your
Supervisor”. The relationships between these three scales and “Reactions Toward Your
Supervisor” are as follows: Clarifying Expectations, r = .58 (p <.001); Providing Feedback, r =
.55 (p <.001); and, Explaining Rating Decisions, r = .67 (p <.001). These relationships are
indicated to be substantial associations by Davis (1978). Therefore, hypothesis is confirmed that
a positive relationship will exist between the three scales representing Informational justice and
the scale “Reaction Toward Your Supervisor.”
Hypothesis 5
A positive relationship will exist between the scales representing systemic justice
(“Setting Performance Expectations”, “Rater Confidence”, and “Seeking Appeals”) and
satisfaction with the performance appraisal system as measured by the scale “Reactions to the
PPR”. The relationship was analyzed using the Pearson Product Moment Correlation
Coefficient. The relationship between “Reactions to the PPR” and the scales representing
systemic justice is as follows: “Setting Performance Expectations,” r = .52 (p <.001); “Rater
Confidence, r = .51 (p <.001); and, “Seeking Appeals,” r = .53 (p <.001). These correlations all
indicated “substantial” associations (Davis, 1971). Therefore, the hypothesis that a positive
relationship will exist between the scales representing systemic justice and reactions toward the
current performance appraisal system is confirmed.
141
CHAPTER 5
SUMMARY, CONCLUSIONS AND RECOMMENDATIONS
Purpose and Objectives
The purpose of this study was to evaluate employee satisfaction with a performance
appraisal system as well as perceptions of fairness to components of the system. Further, the
study sought to clarify the application of organizational justice models in the context of
performance appraisal by confirming a hypothesized four-factor model of organizational
justice as applied to performance appraisal.
Summary of Study Objectives
This study was guided by the following objectives regarding perceptions of fairness
of and satisfaction with performance appraisal and the examination of a hypothetical model
of organizational justice as applied to performance appraisal.
1. Describe employees of selected publicly funded organizations that utilize a state civil
service employment system on the following selected personal demographic
characteristics:
• Age
• Gender
• Ethnic Group
• Job classification defined by the EEOC Codes
• Length or tenure in the present position (or with the present organization)
• Highest level of education completed
• Whether or not the employee has supervisory responsibility and functions as a
rater in the performance appraisal system.
142
2. Determine the satisfaction with the performance appraisal system currently being
used as perceived by the employees of selected public funded organizations that
utilize a state civil service system as measured by the three reaction scales similar to
those proposed by Thurston (2001): “Reaction to the PPR”; “Reactions to Your Last
PPR Performance Rating”; and, “Reactions toward Your Supervisor”.
3. Determine the fairness and justice of the performance appraisal system currently
being used, as perceived by the employees of selected public funded organizations
that utilize a state civil service employment system, as measured by ten scales of
organizational justice which were designed based on Greenberg's four-factor
taxonomy of justice as operationalized by Thurston, 2001.
4. Determine if a relationship exists between the fairness and justice of the performance
appraisal system currently being used as perceived by the employees of selected
publicly funded organizations that utilize a state civil service employment system
and the following selected personal demographic characteristics:
• Age
• Gender
• Ethnic Group
• Job classification defined according to the EEO codes
• Length or tenure in the present position (or with the present organization)
• Highest level of education completed
5. Compare the fairness and justice of the performance appraisal system currently being
used as perceived by the employees of selected publicly funded organizations that
143
utilize a state civil service system by whether or not the employees report that they
have supervisory responsibilities.
The following objectives of the study were established as hypotheses based on the available
performance appraisal and organizational justice literature and Greenberg's 1993 four-factor
taxonomy of organizational justice.
1. The ten scales of organizational justice as applied to performance appraisal will form
four distinct constructs which conform to Greenberg's (1993) four factor Taxonomy
of Organizational Justice with data collected from the employees of selected public
funded organizations that utilize a state civil service employment system and a
standardized performance appraisal system.
2. A positive relationship will exist between the two scales measuring configural justice
(structural-distributive form), “Accuracy of Ratings” and “Concern Over Ratings”
and satisfaction with the performance appraisal system currently being used as
perceived by employees of selected public funded organizations that utilize a state
civil service employment system as measured by the following reaction scales:
“Reaction to Your Last PPR Performance Rating” and “Reaction to the PPR”.
3. A positive relationship will exist between the scales measuring interpersonal justice
(social-distributive), “Respect in Supervision” and “Sensitivity with Supervision” and
satisfaction with the performance appraisal system currently being used as perceived
by the employees of selected public funded organizations that utilize a state civil
service employment system as measured by the scale “Reactions Toward Your
Supervisor.”
144
4. A positive relationship will exist between the scales measuring information justice
(social-procedural), “Clarifying Expectations”, “Providing Feedback” and
“Explaining Rating Decisions” and satisfaction with the performance appraisal
system currently being used as perceived by the employees of selected publicly
funded organizations that utilize a state civil service employment system as measured
by the scale “Reactions Toward Your Supervisor.”
5. A positive relationship will exist between the scales measuring systemic justice
(structural-procedural form), “Rater Confidence”, “Setting Performance
Expectations” and “Seeking Appeals” and satisfaction with the performance appraisal
system currently being used as perceived by the employees of selected publicly
funded organizations that utilize a state civil service employment system as measured
by the following scale “Reactions to the PPR.”
Methodology
A survey questionnaire was administered to eligible employees (n = 1120) in two
state-funded agencies in the Southeastern United States in the spring of 2003. A total of 436
useable surveys (39%) were returned through inner-departmental mail which exceeded the
minimum required sample size calculated using Cochran and Snedechor’s (1980) formula for
continuous data (n = 222).
The survey instrument consisted of the following three parts which are described as
follows. Part I of the instrument included consisted of ten scales designed to measure
perceptions of fairness of performance appraisal. The scales including “Setting Performance
Expectations”, “Rater Confidence”, “Seeking Appeals”, “Clarifying Expectations”,
“Explaining Rating Decisions”, “Providing Feedback”, “Accuracy of Ratings”, “Concern
145
Over Ratings”, “Respect in Supervision” and “Sensitivity in Supervision”. Responses to the
items were measured on five point scale with 1 = strongly agree; 2 = agree; 3 = neither agree
nor disagree; 4 = disagree; and, 5 = strongly disagree. Survey participants were asked to
respond to all items in their role as a ratee in the performance appraisal process.
Part II of the instrument included three scales designed to measure the respondent’s
satisfaction with the performance appraisal process. The scales used to indicate satisfaction
included, “Reactions toward Your Last PPR Performance Rating,” “Reactions toward Your
Supervisor” and “Reactions to the PPR”. Reactions were measured on five point scale with 1
= strongly agree; 2 = agree; 3 = neither agree nor disagree; 4 = disagree; and, 5 = strongly
disagree. Survey participants were asked to respond to all items in their role as a ratee in the
performance appraisal process. Part III of the instrument was a researcher designed
demographic survey measuring selected personal and professional demographic
characteristics of the respondents.
Major Findings
The first objective was to describe employees of selected publicly funded
organizations that utilize a state civil service employment system on selected demographic
characteristics. The majority of the respondents in the survey were female (n = 293, 69%).
Slightly over 60 percent (n= 254) of the respondents reported they were Caucasian while
nearly 35 percent (n = 146) reported their race as African-American. More than one-half (n
= 233) of the respondents reported a job classification of “professional” and slightly over
one-fourth (n = 118, 27.1%) as “clerical” or “paraprofessionals.” A college degree was
reported most frequently (n=143, 34.5%) as the highest level of education, followed by
respondents indicating a high school degree (17.1%, n = 71). Approximately 28 percent (n =
146
109) of the respondents reported supervisory responsibilities including performance ratings
while the remainder (n = 282, 72.1 %) reported no supervisory responsibility.
Objective 2 was to determine the satisfaction with the performance appraisal system
being used as perceived by the employees of selected publicly funded organizations that
utilize a state employment system, as measured by the reactions to the system, to the most
recent rating and to the rater. Respondents indicated greater satisfaction with their supervisor
and their most recent performance appraisal than with the performance appraisal system
overall as measured by three reaction scales. Satisfaction was measured by the scales
“Reaction Toward Your Supervisor” (mean = 2.10), “Reactions Toward You Most Recent
PPR Performance Rating” (mean = 2.14), and “Reaction to the PPR” (mean = 2.63). The
mean scores for the scales reflecting satisfaction with the supervisor and with the most recent
rating were both in the “agree” category (item scores between 1.51 and 2.50) while the score
for the “Reaction to the PPR” was in the “neither agree nor disagree category” (item scores
between 2.51 and 3.49).
Objective 3 included determining the fairness and justice of the performance
appraisal system currently being used, as perceived by the employees of selected public
funded organizations that utilize a civil service employment system, as measured by the ten
scales of organizational justice which were based on Greenberg’s (1993) four-factor
taxonomy of justice. Respondents “agreed” with nine of the ten scales (item scores between
1.51 and 2.5) measuring perceptions of fairness and “neither agreed nor disagreed” (item
scores between 2.51 and 3.5) with one scale. They most strongly agreed with the scales
representing treatment by their raters, “Respect in Supervision” and “Sensitivity in
Supervision”. The scale that respondents agreed with the least was that regarding the
147
quantity and quality of performance feedback as measured by the “Providing Feedback”
scale (mean = 2.77).
Objective 4 was to determine if a relationship exists between the fairness and justice
of the performance appraisal system currently being used as perceived by the employees of
selected publicly funded organizations that utilize a state civil service employment system
and the demographic characteristics of the respondents. Few significant differences were
found between perceptions of fairness based on the demographic characteristics based on job
classification, length of tenure with the organization or in the current job, or highest level of
education. The most significant differences between groups based on demographic
characteristics were found for gender and ethnicity. Females agreed less than males with the
scales regarding treatment by their rater and with the “Concern Over Ratings” scale.
African-American respondents agreed less than Caucasians with the scales regarding
treatment by their rater and with the “Concern Over Ratings” scale. While differences were
found, the mean scale scores were all still in the “agree” range for women and African-
Americans.
Objective 5 included comparison of the fairness and justice of the performance
appraisal system as perceived by the employees of selected publicly funded organizations
that utilize a state civil service employment system as measured by the ten scales based on
Greenberg’s (1993) four-factor taxonomy of justice by whether or not the employees report
that they have supervisory responsibilities. There were only two differences in perceptions
of fairness as measured by the ten scales representing fairness in performance appraisal
between supervisory and non-supervisory respondents. Supervisors agreed more with the
148
scale “Seeking Appeals” than non-supervisors and less with the scale “Providing Feedback”
than those without supervisory responsibility.
The following hypotheses were tested in the study. Hypothesis 1 suggested that the
ten scales of organizational justice as applied to performance appraisal will form four distinct
constructs which conform to Greenberg’s (1993) four factor taxonomy of organizational
justice with data collected from the employees of selected publicly funded organizations that
utilize a state civil service employment system and standardized performance appraisal
system. This hypothesis was not confirmed. The four-factor model of organizational justice
that breaks conventional factors of justice into four discrete factors, as suggested by
Greenberg (1993), was not supported as the best descriptor of the underlying factor structure
of the variables. Using a competing model strategy a three factor model based on structural
and social determinants was determined to be the most satisfactory in describing the
underlying factor structure of the ten scales of justice included in the study.
It was suggested in Hypotheses 2, 3, 4 and 5 that the specific scales allocated to the
four hypothesized justice factors would have positive relationships with the three reaction
scales used as indicators of satisfaction. The hypotheses reflect relationships of the scales
allocated to each of the four justice factors to one or more of the scales representing
satisfaction with performance appraisal. The scales representing satisfaction included
“Reactions to the PPR”, “Reactions Toward Your Supervisor” and “Reactions Toward Your
Last PPR Performance Rating”. All four of the hypotheses regarding positive associations
between the selected scales (by justice factor) measuring perceptions of justice and specific
reaction scales indicating satisfaction with performance appraisal were confirmed.
149
Hypothesis 2 proposed that a positive relationship will exist between the two scales
measuring configural justice (structural-distributive form), “Accuracy of Ratings” and
“Concern Over Ratings” and satisfaction with the performance appraisal system currently
being used as perceived by employees of selected public funded organizations that utilize a
state civil service employment system as measured by the following reaction scales:
“Reaction to Your Last PPR Performance Rating” and “Reaction to the PPR”. The scales
“Accuracy of Rating” and “Concern over Ratings” which comprise the configural justice
factor showed substantial correlation with the scales “Reaction To Your Last PPR
Performance Rating” and “Reactions to the PPR”.
Hypothesis 3 suggested that a positive relationship will exist between the scales
measuring interpersonal justice (social-distributive), “Respect in Supervision” and
“Sensitivity with Supervision” and satisfaction with the performance appraisal system
currently being used as perceived by the employees of selected public funded organizations
that utilize a state civil service employment system as measured by the scale “Reactions
Toward Your Supervisor.” The two scales comprising the Interpersonal Justice factor,
“Respect in Supervision” and “Sensitivity in Supervision” were substantially correlated to
the scale “Reactions Toward Your Supervisor.”
Hypothesis 4 proposed that a positive relationship will exist between the scales
measuring informational justice (social-procedural), “Clarifying Expectations”, “Providing
Feedback” and “Explaining Rating Decisions”, and satisfaction with the performance
appraisal system currently being used as perceived by the employees of selected publicly
funded organizations that utilize a state civil service employment system as measured by the
scale “Reactions Toward Your Supervisor.” The scales allocated to the Informational Justice
150
factor indicated substantial positive associations with the scale “Reaction Toward Your
Supervisor”.
Finally, Hypothesis 5 suggested that positive relationship will exist between the
scales measuring systemic justice (structural-procedural form), “Rater Confidence”, Setting
Performance Expectations” and “Seeking Appeals” and satisfaction with the performance
appraisal system currently being used as perceived by the employees of selected publicly
funded organizations that utilize a state civil service employment system as measured by the
scale “Reactions to the PPR.”. The scales representing systemic justice, “Rater Confidence”,
“Setting Criteria” and “Seeking Appeals” were substantially associated with the scale
indicating satisfaction with the performance appraisal system, “Reactions to the PPR”.
Conclusions and Recommendations
Based on the findings of the study, the following conclusions, implications and
recommendations are presented.
1. Overall, employee reactions to the PPR system were favorable, indicating that the system
has the potential for use as a management tool. This conclusion is based on the results of
the ten scales measuring perceptions of fairness of performance appraisal and the three
reaction scales used to measure satisfaction with performance appraisal. Respondents
indicated that they “agreed” (item scores between 1.51 and 2.5) with nine of the ten
scales measuring perceptions of fairness and “neither agreed nor disagreed” (item scores
between 2.51 and 3.5) with one scale, “Providing Feedback (mean = 2.77). Respondents
also indicated that they “agreed” with the scales “Reactions Toward Your Supervisor
(mean = 2.10) and “Reactions Toward Your Last PPR Performance Rating” (mean =
2.14.) indicating relative satisfaction with these components. The mean rating of the
151
third scale used as an indicator of satisfaction, “Reactions to the PPR” (mean = 2.63) was
in the “neither agree nor disagree” category.
The results of this study are based on measurement of employee reactions toward
various components of performance appraisal. Measures of employee reactions have been
suggested as being a valuable input into the evaluation of performance appraisal systems.
Evaluation of performance appraisal has been suggested to include different components.
Employee reactions to performance appraisal has been suggested by researchers as being one
of the components important to the acceptance and use of performance appraisal in
organizations (Bernardin & Beatty, 1984; Cardy & Dobbins, 1994; Murphy & Cleveland,
1995) as well as a contributing factor to the validity of an appraisal rating itself (Lawler,
1967).
Cardy and Dobbins (1994) suggest that dissatisfaction, feelings of unfairness in the
performance appraisal process, and perceived inequity in evaluations may “doom” any
performance appraisal system to failure. Murphy and Cleveland (1995) also contend that
reaction criteria are almost always relevant, and unfavorable reactions may result in the
failure of the most carefully constructed appraisal system. The importance of employee
reactions to performance appraisal may play an increasingly important role in the future as
appraisal practices are examined and processes and procedures continue to develop (Hedge &
Borman, 1995). Thus, the importance of employee reactions to performance appraisal, such
as those measured in this study (fairness and component satisfaction) seem to be highly
relevant in the assessment of the success and acceptance of the performance appraisal system
included in this study as well as in other organizations.
152
While the scales in this study were designed to measure perceptions of fairness, they
also contained components indicated to be important to the evaluation of the efficacy of
performance appraisal systems. Researchers such as Mohrman, Resnick-West and Lawler
(1989), Wexley and Latham (1981) and Murphy and Cleveland (1991) all indicated the
importance of evaluating the procedural aspects of performance evaluation systems. The
results of this study indicate that many of the procedural factors suggested by the researchers
have been addressed adequately by the system designers and the organizations included in
this study. Such system procedures include the assignment of knowledgeable raters; use of
performance expectations that are relevant to the individual workers; the presence of an
accessible way to appeal ratings; and an outcome or rating that is accurate and reflective of
the ratee’s work. The inclusion of these factors in the evaluation process in this study
strengthen the conclusion that the reaction measurement used in this study can be considered
to represent at least a component of the performance appraisal system’s efficacy.
The one reaction scale that was not rated in the “agree” category was that of
“Reaction to the PPR” (mean = 2.63). The results of this scale should be considered in
conjunction with the results from the other scales and not as an absolute indicator of
satisfaction, or lack of it, with the system. The lower score on this scale is not untypical of
performance appraisal satisfaction reported by many organizations as indicated by a variety
of surveys and studies. Bricker (1992) reported survey results indicating that just 20 percent
of American companies were “very satisfied” with their performance review process. A
1993 survey of 900 companies (Small Business Report, 1993) found that only ten percent of
those responding indicated “satisfaction” with their employee evaluation programs. A 1997
nationwide survey of human resource professionals by the Society of Human Resource
153
Management found that only five percent were “very satisfied” with their organization’s
performance evaluation system and that 42 percent were dissatisfied to some extent (Barrier,
1998).
While satisfaction has been the most frequently measured appraisal reaction (Giles &
Mossholder, 1990) it has been operationalized in a variety of ways that are often inconsistent
and confounded by the inclusion of more than one construct in the variable (Keeping &
Levy, 2000). Researchers continue to measure system satisfaction in a variety of ways
ranging from using one-item measures (Dipboye & de Pontbriand, 1981) to multi-item scales
(Taylor, Tracy, Renard, Harrison, & Carroll, 1995). Keeping and Levy (2000) used a three
item scale developed by Giles and Mossholder (1990) to measure satisfaction and
subsequently included the construct as a variable in a hierarchical model representing
appraisal effectiveness, not as an end in itself. This indicates the need to consider a variety
of indicators of satisfaction when considering performance appraisal system efficacy.
Some additional insights into the results of the scale “Reaction to the PPR” may be
derived by examining the individual items. Three of the items had mean scores in the
“agree” category. These items dealt with the fairness of the PPR, and satisfaction with the
way performance expectations are set and how performance was rated using the system.
The remaining four items were in the “neither agree nor disagree” range: Two of these
questions indirectly address the usefulness of the system: “I think the PPR process is a waste
of time (mean = 2.60 reverse coded) and “The PPR process has helped me to improve my job
performance” (mean = 2.86). These responses would seem to indicate that respondents do
not agree that the current system has significant value in their individual performance
management process. The item “I would want to participate in the PPR even if it were not
154
required” (mean = 2.89) also indirectly addresses the perceived value of the system to the
employee.
The researcher recommends that routine evaluation of this PPR system be conducted
to generate additional information regarding perceptions of fairness, satisfaction, and efficacy
of the system in the two departments that participated in this study and in other organizations
using the system. Additional reaction measurements regarding the system could include
employee reactions to the actual performance planning session and reactions to the
performance appraisal rating interview. Specific factors to be evaluated include satisfaction
with the amount of input to the process (voice) (Korsgaard & Roberson, 1995); opportunity
to plan goals (Cleveland & Murphy, 1992); opportunity to question expectations and goals;
and, satisfaction with the rater as a consequence of the rating interview.
The researcher recommends that the organizations employ a systematic approach to
routinely collect employee reaction data within a specified time after the actual rating
interview. A routine and systematic approach to evaluating the performance appraisal
system would serve several purposes. First, it would provide more timely information to
decision makers charged with managing the system and service to operationalize evaluation
of the system as part of the performance appraisal process. Secondly, it would provide
supervisors with real time data regarding their employee’s perception of the performance
appraisal and the success of the process. Thirdly, it would serve as an intervention itself by
allowing employee input and feedback to the process.
The researcher recommends additional research be conducted to investigate actual
performance appraisal numerical ratings and the content of the performance expectations. A
weakness often cited in performance appraisal research is the lack of such data to incorporate
155
in the evaluation of a performance appraisal system. The continued lack of such information
may be attributed to the amount of work involved in collecting such data after the fact.
However, new data collection and management systems are making generation of this type of
information easier and the state civil service human resource data management system is
being modified to make such data more accessible. Data collection and analysis should
include quality and consistency of performance expectations; actual ratings as compared to
the performance expectations for accuracy and consistency; and analysis of the ratings issued
by supervisors and divisions throughout the organizations. Analysis of the actual numerical
ratings will help to determine if raters are indeed discriminating between high, low and
mediocre performance by the ratees. A lack of discrimination or differentiation between
employees may result in the actual numerical rating being nearly useless for administrative
decisions such as promotions or reduction in force decisions. This discrimination will
become more important as government agencies continue to consider moving more towards
“pay for performance” systems driven in part by performance ratings.
Additional research should be conducted on the validity of reactions to performance
appraisal as indicators of system fairness, satisfaction and efficacy. The more extensive data
set resulting from additional evaluation and study should be used in future research to
develop (or populate) a model designed to predict performance appraisal efficacy using a
mixture of reactions, satisfaction indices and actual data.
2. Respondents perceived the performance appraisal system (PPR) to be fair. This
conclusion is based on respondents indicating that they “agreed” (item scores 1.51 – 2.50)
with nine of the ten scales measuring perceptions of fairness and “neither agreed nor
disagreed” (item scores 2.51 – 3.50) with only one scale “Providing Feedback”. Since the
156
results indicate no “disagreement” with the perceptions of fairness, the participating
organizations are faced with the challenge of determining what level of response from the
study may indicate areas of opportunity to either make improvement or capitalize on
strengths.
Researchers have indicated that a performance appraisal system has a better chance of
acceptance and subsequent success if the employees perceive that the system is “fair”.
Fairness has been measured in a number of ways by researchers from one item measures to
multi-item scales evaluating different perspectives of fairness. The multi-items scales in this
study were developed to provide more comprehensive measures of the key components of
fairness in performance appraisal as indicated in the literature regarding organizational
justice concepts and performance appraisal. The scales also included indications of the
efficacy of the system as proposed by performance appraisal researchers.
The current study utilized scales initially proposed by Thurston (2001) to measure
perceptions of fairness of performance appraisal. The results of the current study were
similar to those found by Thurston in his study of perceptions of fairness for four
organizations utilizing a required performance appraisal system. The respondents in
Thurston’s study indicated agreement with all of the scales measuring perceptions of fairness
with the mean scores for the ten scales in the “agree” category. As found in the current
study, the respondents in Thurston’s study indicated the greatest agreement with the scales
reflecting treatment by their rater, “Respect in Supervision” and Sensitivity in Supervision”.
Similar to this study, the scale “Providing Feedback” was rated lower in the previous study
than most of the other scales although, “Clarifying Expectations” was the scale with which
respondents indicated the least agreement. Overall, the respondents in Thurston’s study
157
indicated slightly more agreement with the scales measuring perceptions of fairness than
those in the current study.
The researcher recommends that future research be conducted to refine the ten scales
used to measure perceptions of fairness to further clarify the constructs. The scales in the
informational justice factor, “Clarifying Expectations” and “Providing Feedback” may
benefit from revisions to more closely link the items in these scales to the performance
appraisal system instead of the more general topic of “performance”. Evaluation of the
systemic justice factor would be strengthened by the addition of a scale or items assessing the
processes of performance sampling, gathering of information for the rating and
documentation. Clarification of the configural justice factor (structural-distributive) should
be pursued through addition of items to more clearly discern perceptions of the outcomes of
the current performance and determine if other outcomes are perceived to occur beyond the
rating itself.
Lastly, the researcher recommends that the organizations evaluate the validity of the
rating form itself. Rating forms and formats have been researched through the years and
shown to be of varying influence on the perceptions of fairness or satisfaction with a
performance appraisal system. However, the prescribed use of the same form for over
63,000 employees at different organizational levels and with varying degrees of education
does raise the question of its usefulness for so many employees in such different job
classifications and types of organizations.
Additional research is recommended into the use of reactions to measure fairness and
other performance appraisal characteristics to clarify importance of the use of reactions in
evaluating the success and efficacy of performance appraisal. The complex nature of
158
performance appraisal indicates that no single component or factor will be a sufficient
indicator of the efficacy of a system. The development of reliable reaction measures to
evaluate the fairness of performance appraisal will provide researchers and practitioners with
a more substantial foundation to consider in the evaluation of performance appraisal systems.
3. Effective feedback from supervisors regarding subordinate work performance is not
occurring in a consistent and frequent manner. This finding is based on the results of the
study which indicate that respondents “neither agreed nor disagreed” with items regarding
the quality and quantity of feedback included in the “Providing Feedback” scale.
The importance of performance feedback in organizations has been studied
extensively (Ashford & Cummings, 1983; Davis & Mount, 1984; Fisher & Taylor, 1979;
Greller, 1975; Murphy & Cleveland, 1995). A major theme of this research is that several
conflicts are built into the appraisal and feedback process (Murphy & Cleveland, 1995). As
an example, ratees may “want” feedback but they also prefer positive feedback and tend to
dismiss negative feedback. The performance appraisal process puts the rater in the position of
being a judge who issues ratings and of a counselor who provides advice and coaching on
how to improve performance (Kay, Meyer, & French, 1965). Despite conflict involved in
giving and receiving feedback, there is consensus that high-quality feedback can be
extremely beneficial to both the individual and the organization (Landy, 1985).
A significant potential limitation to the value of performance feedback is that
feedback is often biased, incomplete or inaccurate (Murphy & Cleveland, 1995). This may
be the result of the feedback provider not understanding the job being done by the employee
or the job related constraints that may present the employee with difficulty. If performance
feedback is biased, inaccurate or simply incomplete, the actual benefits may be limited.
159
There are even circumstances where feedback can be harmful such as when it is improperly
delivered in the form of negative criticism or in a disrespectful, personal or unspecific
manner. However, performance feedback carries such a wide array of benefits that even a
limited amount of usable feedback may be worthwhile.
In this study, respondents indicated that they have confidence in their rater (Rater
Confidence, mean = 2.05) to possess the skills and knowledge to adequately rate their
performance. It is reasonable to expect that these same raters should also be in a position to
deliver meaningful feedback. The items in the scale “Providing Feedback” related primarily
to the frequency and the usefulness or type of feedback provided by the rater. The lack of
agreement by respondents indicated the perception that feedback from the rater is provided
on a less than routine or frequent basis and is not of the type to provide sufficient information
to improve job performance.
The literature suggests recommendations for enhancing perceptions of fairness in the
feedback process:
• Ensure that employees are given a voice during the feedback process
(Korsgaard & Roberson, 1995) and are allowed to participate in two way
communication regarding feedback (Giles & Mossholder, 1990).
• Allow employees the opportunity to challenge or rebut their evaluations
(Greenberg, 1986b). This includes both formal and informal mechanisms.
• Ensure that feedback is job relevant and does not reflect personal bias
(Armentrout, 1996; Noe, Hollenbeck, Gerhart & Wright, 1997).
• Provide timely feedback – Research has long demonstrated the important of
timely feedback in changing performance and promoting interpersonal
160
fairness (Ilgen, Fisher & Taylor, 1979). Tyler and Bies (1990) also
considered perceptions of interpersonal fairness and highlight the importance
of providing timely feedback. Smither (1998) suggests that feedback, whether
formal or informal, should be delivered much more frequently and even on a
continual basis and certainly should not be limited to an annual event.
• Provide feedback in an atmosphere of respect and courtesy. Research has
shown that an employee’s perception of trust and the supervisor’s ability to
treat employees with courtesy and respect are strong determinants to
perceptions of interpersonal fairness (Tyler & Bies, 1990).
• Avoid surprises during the formal performance review and feedback session
by providing ongoing feedback. Perceptions of outcome unfairness can arise
when outcome expectations are not met. If supervisors do an effective job of
providing continual feedback to their employees, the employees should be
prepared for the outcome of the formal session.
The researcher recommends that the organizations include a greater emphasis on the need
for performance feedback and its role in the ongoing performance management process.
Employee focus groups are recommended to collect additional information regarding
employee perceptions of the definition of performance feedback and how it should be
conducted. Another piece of data that should be collected is employee perceptions of
whether ongoing feedback is perceived to be a part of the performance appraisal system or
rather a supervisory responsibility independent of the system. Focus groups comprised of
supervisors should also be conducted to determine rater perceptions of the feedback process
and its role in performance appraisal.
161
The results from the focus groups should be used to guide any interventions that are
considered. Likely outcomes may include training on the process of giving and receiving
effective feedback for both supervisors and raters. Two-way communication in the process
should be emphasized. Considering the importance and benefits of performance feedback,
the organizations may wish to formalize the quarterly feedback sessions which are currently
“suggested” by the managers of the PPR system. The organizations should consider making
feedback sessions required steps in the performance management process at some specified
intervals.
4. The model selected to best represent the underlying factor structure of the ten scales
used to measure perceptions of fairness a) supports consideration of interactional justice as a
construct separate from procedural justice and b) discounts the performance rating itself as a
distributive outcome of organizational justice in this performance appraisal system.
This conclusion is based on selection of a three factor model which combines the two
structural factors (systemic and configural) into one construct and differentiates between the
two social factors (informational and interactional). The three factor model was selected as
the best-fit for the representation of the underlying factor structure of the data after
consideration of the results of a confirmatory factor analysis utilizing the LISREL structural
equation model program and the conduct of a competing model strategy. The confirmatory
factor analyses generated standard fit indices to evaluate absolute fit and the competing
model strategy yielded information regarding the fit of plausible alternative models.
The confirmatory factor analysis indicated that the four-factor model provided a
marginal fit to the data. The competing model strategy indicated marginal fit for the several
of the alternate models including the three factor model which indicated a structural factor,
162
an informational factor and an interpersonal factor. Based on the fit indices and the lack of
substantial improvement found when moving from the three-factor to the four factor-model,
the three-factor model was selected to best represent the data.
The results of the confirmatory factor analysis are similar to those found by Thurston
(2001). Thurston indicated some evidence for considering the structurally and socially
determined procedural and distributive constructs separately. He found that the distinction
was clearer for the socially determined procedural and distributive forms of justice as
opposed to the socially and structurally determined types of procedural justice. The results
of the current study partially support Thurston’s conclusions. The current study provides
evidence of the differentiation between the social-procedural (informational justice) construct
and the social-distributive (interpersonal justice) factors. In addition, the results of the
current study provide evidence of the differentiation between the structural-procedural and
the social-procedural factors as indicated by the three factor model which identified three
factors: structural (systemic and configural), informational, and interpersonal.
The selected three-factor model was nested in a two factor model with the primary
factors being structural and social constructs. The three-factor model includes a structural
component, an informational component, and, an interpersonal component. The structural
factor of the model includes Greenberg’s (1993) Systemic (structural-procedural) and
Configural (structural-distributive) factors in one structural component. The Informational
and Interpersonal components of the three factor model are identical to the similarly named
factors in Greenberg’s model.
Researchers have traditionally considered procedural and distributive justice as the
primary constructs underlying the concept of organizational justice. More recent
163
conceptualizations include the fairness inferred by people from the interpersonal treatment
they receive, often called interactional justice or in the case of the three factor model
proposed by this study, informational and interpersonal justice.
Procedural justice has been defined in the justice research as a series of sequential
steps used to guide allocation behaviors or judgments. As individuals participate in these
procedures they form opinions about the fairness of the procedures. As such, procedural
justice can be defined as the fairness of the means by which an allocation decision is made
(Cropanzano & Ambrose, 2001). Distributive justice refers to the perceived fairness of
resources or outcomes received (Greenberg, 1986a). Interactional justice includes the
concern over social interactions between people in organizations and the equality of
interpersonal treatment received during enactment of organizational procedures (Bies, 1987;
Bies & Moag, 1986). Interactional justice was originally theorized by Bies (1987) and Bies
and Moag (1986) as a third form of justice, separate from distributive and procedural justice.
Other researchers have acknowledged the social component of justice, addressing it in a
variety of ways. Some have grouped the structural and social aspects together without
making a distinction (Greenberg,1986a; Landy, Barnes, & Murphy, 1978; Roberts & Reed,
1996). Skarlicki and Folger (1997) treated distributive, procedural and interactional as three
distinct constructs.
The debate over the relationship between procedural (structural) and interactional
justice has focused on whether interactional justice is a separate factor or is subsumed in
procedural justice. Cropanzano and Greenberg (1997) argue that interactional justice is
difficult to distinguish from structural-procedural justice. For one thing, both formal
processes and the interpersonal interactions jointly comprise the process that leads to the
164
allocation decision. Additionally, interactional and structural-procedural justice have similar
consequences and are highly correlated to one-another.
Separating procedural justice from interactional justice involves an especially fine
distinction between the procedure itself and how the procedure is manifested (Cropanzano &
Greenberg, 1997). This is the ambiguity that has led researchers to conceptualize
interactional justice as the social aspect of procedural justice. The procedural aspects of
interactional justice are seen in the informational justice factor of the best-fit model in this
study. The three scales included in this factor include Explaining Rating Decisions,
Providing Feedback and Clarifying Performance Expectations. These scales all reflect
enactment of the procedural aspects of performance appraisal through the social interaction
between the supervisor and the employee.
The factor structure of the best fit model may also indicate that there is no clear
distributive justice factor that is evidenced in this study (Deutsch, 1975). Applying
Greenberg’s four factor model structure, the configural (structural-distributive) justice factor,
composed of the scales “Accuracy of Rating” and “Concern Over Ratings”, is not
distinguished in the three factor model from the structural-procedural construct. The scales,
“Concern Over Ratings” and “Accuracy of Rating”, were theorized in this study to be
sufficient to represent outcomes to the study respondents. This is consistent with
Greenberg’s (1986a) description of distributive justice as well as application of the equity
theory as applied to organizational justice. The lack of distinction between the hypothesized
configural factor and the systemic factor would seem to indicate that respondents do not
clearly see the result of the performance appraisal process in the form of the rating as a
distributive outcome.
165
Interactional justice can also include aspects of distributive justice (Cropanzano &
Ambrose, 2001). Respectful treatment by one’s supervisor may be seen as a valued outcome.
Likewise, an insult may be seen as a negative outcome. To belittle someone is a social
interaction and may result in lowered self-esteem and value by the group. Greenberg’s four-
factor model would place the Interpersonal factor, reflecting respect and sensitivity in
supervision, in the distributive justice realm reflecting an outcome. The three factor model
proposed in this study would support this distinction as a separate interactional-type or
“socio-emotional” type outcome. This type of outcome is distinguished from economic or
more tangible outcomes of a structural-distributive nature such as pay or promotion and also
distinguished from the other interactional justice factor, informational justice.
The researcher recommends that additional study of the hypothesized four-factor
model of justice as applied to performance appraisal be conducted to further evaluate the
relationships of the perceptions of justice measured by the ten scales, in the same or modified
configurations, to confirm the relative influence of the structural aspects versus the social
interactions of performance appraisal. The importance of differentiating between the
structural and social components of justice or, alternately, the procedural and interactional
components, has been debated by organizational justice researchers. However, the
importance of the social interactions in the performance appraisal process is well documented
and relatively well accepted (Folger, Konovsky & Cropanzano, 1992; Gosselin, Werner, &
Halle 1997; Greenberg, 1990; Greenberg, 1993). Performance appraisal systems are
inescapably bound to the interactional experiences between the rater and ratee. Areas to
investigate include the relationships between interactional (informational and interpersonal)
components and the effect of performance appraisal systems with varying degrees of
166
procedural thoroughness or fairness. For instance, can high degrees of interactional fairness
overcome perceptions of unfairness of the procedural aspects of a system when considering
performance appraisal satisfaction or efficacy? Likewise, can a procedurally sound and fair
system compensate for the lack of skill or knowledge on the part of rater who must
implement the system? To what degree is satisfaction and efficacy of a system affected by
this type of relationship? Causal modeling to determine relationships of the different types of
justice factors to a more comprehensive measure of performance appraisal efficacy is
recommended.
The researcher also recommends that the four-factor model of justice be utilized to
evaluate performance appraisal systems in the private sector as opposed to the public sector
organizations included in this study. Distributions or outcomes such as pay increases,
promotions, etc. are generally more strongly associated with the results of performance
appraisal in the private sector than in the civil service. The four-factor model may better
represent the private sector where outcomes are more tangible.
5. The primary differences between perceptions of fairness of performance appraisal and
indications of satisfaction with performance appraisal were found based on gender and
ethnicity. This finding is based on the results of the analyses which showed significant
differences between males and females for the three scales: “Concern Over Ratings”;
“Respect in Supervision” and “Sensitivity in Supervision”. Males responded more positively
(indicated greater agreement) than females for all of the three scales. The study results also
indicate significant differences between Caucasians and African-Americans on the same
three scales. For all three of these scales, Caucasians indicated greater agreement than
African-Americans.
167
A review of the means of the groups for each of the three scales in question indicated
that the scores were all still within the “agree” category. For “Respect in Supervision” and
“Sensitivity in Supervision” the mean scores for women and African-Americans were very
close to the midrange of the agree category which indicates considerable agreement with
items in the scales. The mean scores were somewhat lower for the “Concern Over Ratings”
scale (females, mean = 2.39; African-Americans, mean = 2.42).
Gender differences have been hypothesized to exist in the perceived importance of
justice issues, most specifically, in the area of procedural justice (Sweeney and McFarlin,
1995). Other researchers have found that women put different emphasis on distributive
justice than men (Major, 1987). Men have been shown to be somewhat more outcome
oriented, focusing more on distributive justice and women more concerned with procedural
issues. Sweeney and McFarlin, (1995) indicated that women and men weight procedural and
distributive justice differently with the relationships between procedural justice and various
organizational outcomes being more important to women than men. These findings would
seem to be consistent with women’s more negative view of the scale “Concern Over
Ratings”. The scale measured perceptions about the rater’s use of other factors such as
personality or rater goals in issuing performance ratings instead of strictly performance and
procedural based factors. Other researchers, Eager (1991) and Juett (1996) found no
significant differences based on gender in their studies which examined satisfaction and other
factors of performance appraisal.
The effects of race or ethnicity in regards to performance appraisal have been studied
primarily from the perspective of subgroups receiving different scores on a variety of
performance measures (Arvey & Murphy, 1998; Bigoness, 1976). There is evidence in the
168
performance appraisal literature which indicates that African-Americans receive lower
performance ratings than whites on both subjective and objective measures (Ford, Kraiger, &
Schechtman, 1986, Sackett, Zedeck & Fogli, 1993). Additionally, researchers have found
that an interaction effect exists in performance appraisal for between-race raters and ratees.
Kraiger and Ford (1985) found that white raters rate white ratees higher than they rate black
ratees and that black raters rate black ratees higher than they rate white ratees. This finding
has been disputed in later studies by Pulakos, White, Oppler and Borman, (1989) which
found the race interaction effects to be small. Sackett and Dubois (1991) found that blacks
were rated lower by raters of both races although the differences were not as great for black
raters rating black ratees.
The influence of race and ethnicity as related to perceptions of fairness in
performance appraisal has not been extensively researched. However, procedural justice has
been indicated to be the most important factor across all ethnic groups when examining real
disputes (Huo & Tyler, 2001). Tyler (1988) found no race effects on the perceptions
regarding procedural justice of a legal system. Other researchers have argued that
perceptions of procedural justice can help to bridge differences among diverse groups of
employees (Huo & Tyler, 2001). These researchers found that the implementation of
procedurally just actions seem to be a factor employees seriously consider when evaluating
their supervisors. They also presented evidence that procedural justice is most effective in
same-ethnicity interactions and less so in cross-ethnicity interactions.
The researcher recommends that future research on this system and, on performance
appraisal in general, consider the differences between demographic groups. Perceptions of
fairness of performance appraisal and differences according to gender or ethnicity have not
169
been extensively researched. These differences in perceptions may become more critical as
the workplace becomes more diverse. Huo and Tyler (2001) also suggest that at issue may
be the extent to which people of diverse backgrounds define the concept of procedural justice
in a similar way. Employees may agree that procedures should be fair but differ in their
definition of fairness.
The researcher also recommends that additional research be conducted to determine
the effects of same ethnicity-interactions on the perceptions of procedural and other justice
factors. If perceptions of procedural fairness or the fairness of other justice components are
effected by the existence of same or different ethnicity interactions between supervisors and
subordinates the application of traditional approaches to ensuring procedural justice may be
impacted.
6. The different aspects of performance appraisal fairness are all positively associated with
components of satisfaction with the system. This finding is based on the resulting correlation
coefficients that indicated “substantial” (Davis, 1972) associations between the justice scales
and the related satisfaction scales as hypothesized as well substantial associations that were
not hypothesized between the individual scales and the three components of satisfaction .
The scales representing Configural Justice, “Accuracy of Ratings” and “Concern
Over Ratings” were both substantially associated with the scales indicating satisfaction with
the most recent appraisal rating and with the system, “Reactions toward Most Recent PPR
Rating” and “Reactions to the PPR” as hypothesized. These associations were predicted
based on the justice and performance appraisal literature which indicates that perceptions of a
fair decision (configural justice factor) will result in satisfaction with the outcome and with
the system from which it resulted. In addition, these scales were found to be positively
170
associated with the scale representing satisfaction with supervision, “Reactions Toward Your
Supervisor”. The correlations between these scales and “Reactions Toward Your
Supervisor” were “Accuracy of Ratings” (r = .51, p < .001) and “Concern Over Ratings” (r =
.64, p < .001). These relationships are similar in magnitude to those found for the
hypothesized associations.
The scales representing the interpersonal justice factor, “Respect in Supervision” and
“Sensitivity in Supervision” were positively associated with satisfaction with the supervisor
as measured by the reaction scale “Reactions Toward Your Supervisor” as hypothesized.
“Respect in Supervision” was substantially associated with “Reactions Toward Your
Supervisor” while “Sensitivity in Supervision” showed an even more significant relationship
of “very high association”.
Informational justice is represented by the three scales, “Clarifying Expectations”,
“Providing Feedback” and “Explaining Rating Decisions”. Each of these scales was
substantially associated with satisfaction with supervision as measured by the scale
“Reactions Toward Your Supervisor” as hypothesized. These scales represent the
implementation of the procedural aspects of the performance appraisal system and reflect the
extremely important role of the supervisor in the performance appraisal system. Without the
interactions that are represented in this factor, the structural aspects of the system could not
be enacted and the basis for fair and accurate ratings could not be substantiated to the
employees. Two of the scales representing informational justice, “Clarifying Expectations”
and “Explaining Rating Decisions” also showed substantial associations with the scale
measuring satisfaction with the system, “Reaction to the PPR”. These relationships were
“Clarifying Expectations” r = .56 ( p < .001) and “Explaining Rating Decisions” r = .58, (p <
171
.001) with “Reaction to the PPR”. These associations would indicate that the informational
justice factor is also related to perceptions of the system. The scale “Explaining Rating
Decisions” was also substantially associated (r = .57, p < .001) with satisfaction with the
most recent rating as measured by the scale “Reactions Toward Your Most Recent PPR
Performance Rating”. This association reflects the importance that employees placed on the
adequate explanation and justification of decisions regarding the rating process and outcome.
The scales representing the systemic justice factor, “Rater Confidence”, “Setting
Performance Criteria” and “Seeking Appeals” were substantially and positively associated
with satisfaction with the performance appraisal system as measured by the scale “Reaction
to the PPR” as hypothesized. This indicates that the structural-procedural components of
performance appraisal as measured by these scales are related to the satisfaction of the
overall system. The scale “Rater Confidence” was also found to be positively associated
with the scale “Reactions Toward Your Supervisor”.
Positive associations between all ten of the scales measuring fairness and the three
scales measuring satisfaction with performance appraisal were found in this study. These
results, and most specifically, the substantial associations described above, indicate that
perceptions of fairness, regardless of the justice factor or area of fairness represented, may
influence perceptions of the different components of satisfaction. Keeping and Levy (2000)
indicated that the research literature on appraisal reaction lacks a theoretical framework and
that researchers have not carefully considered how the various reactions might work together.
They suggest that the literature contains various combinations of appraisal reactions and their
bi-variate correlations. Keeping and Levy (2000) indicate that the correlations are often quite
high which leads to the question as to whether the constructs are actually distinct entities.
172
Some researchers have suggested that appraisal reactions are actually measures of an
overall construct of appraisal effectiveness. Cardy and Dobbins (1994) conceptualized
appraisal effectiveness as a multidimensional construct or an ultimate criterion that cannot be
directly measured but rather is assessed through measurement of other subordinate criteria.
They further suggested that subordinate criteria reflect a portion of the overall concept of
appraisal effectiveness. Cardy and Dobbins (1994) go on to suggest that the overall
effectiveness of performance appraisal effectiveness is determined by a combination of
criteria such as rater errors, rating accuracy, and the qualitative aspects of the process such as
appraisal reactions. They suggest that appraisal reactions, considered in the research, (and
this study) to be separate constructs, are actually indicators contributing to a larger overall
construct of appraisal reactions that represents one component of the ultimate criterion
labeled appraisal effectiveness. Keeping and Levy (2000) found that reaction constructs
remain distinct, yet reflect a higher order construct similar to Cardy and Dobbins’ (1994)
conceptualization of appraisal reactions representing one portion of the ultimate criterion of
performance appraisal effectiveness.
The researcher recommends that further research investigate more thoroughly the
reaction measurements of fairness of, and satisfaction with performance appraisal to clarify
the relative influence of the different areas or factors of organizational justice to satisfaction
with performance appraisal and the relationship of these indicators to an ultimate criterion of
appraisal effectiveness.
Limitations
This study suffers from some of the same limitations that much performance appraisal
research has encountered. The data were collected through a pen and pencil survey using
173
predominantly positive statements and a response scale in which agreement was always to
the left. The choice to use positive statements was made in partial response to the
participating organization’s desire to emphasize the positive aspects of performance
appraisal, to simplify responses for the participants and to maintain consistency with past
operational definitions of justice constructs. This format makes it difficult to determine
whether a personal response was measured rather than “acquiescence” or response bias thus
presenting a possible threat to construct validity (Cook and Campbell, 1979). This threat
presents the possibility that the constructs appear more similar than they actually are. This
may be a plausible explanation for the high correlation between all of the scales and the three
satisfaction components.
Another limitation of the study might be the high percentage of females in the study.
While the differences between females and males in response to the perceptions of fairness
were relatively few, they did exist and indicated that females were less positive in their
perceptions than males.
Other limitations include the relatively low response rate. The response of 440
exceeded the required sample size of 222 according to Cochran and Snedechor (1980) but
represented only 39% of the total 1120 participants. However, considering the length of the
survey and the somewhat controversial nature of the study, this return rate was reasonable.
The primary concern is whether there are systematic differences between respondents and
those who did not respond.
Finally, this study suffers from threats to external validity. The two organizations in
this study were chosen based on selected characteristics of usage of the performance
appraisal system, management support for the study and geographical similarity of the

174
employees to aid in data collection. The sample should not be considered representative of
civil service employees working in other organizations or of a larger population.
175
REFERENCES
Adams, J. S. (1963). Toward an Understanding of Inequity. Journal Of Abnormal And Social Psychology, 67, 422-436.
Adams, J. S. (1965). Inequity in Social Exchange. in L. Berkowitz (Ed.),
Advances in Experimental Social Psychology, 2, 267-299. NY: Academic Press.
Ahmed, S. (1999). The Emerging Effectiveness for Human Resource Management: An Exploratory Study with Performance Appraisal. The Journal Of Management Development. 18, 6, 543-556.
Alexander, S. and Ruderman, M. (1987). The Role of Procedural And Distributive Justice in Organizational Behavior. Social Justice Research, 1,177- 198.
Armentrout, B. (1993). Eight Keys to Effective Performance Appraisal.
Human Resource Focus, 70, 4, 13. Arvey, R. D. and Murphy, K. R. (1998). Performance Evaluation in Work
Settings. Annual Review Psychology, 49, 141-168. Ashford, S. J. and Cummings, L.L. (1983). Feedback as an Individual
Resource: Personal Strategies of Creating Information. Organizational Behavior And Human Performance, 32, 370-398.
Banks, C. G. and Murphy, K.R. (1985). Toward Narrowing the Research-Practice Gap in Performance Appraisal. Personnel Psychology, 39, 335-345.
Barrier, M. (1998). Reviewing the Annual Review. Nation's Business, 86, 9, 32.
Bartol, K. M., Durham, C. C. and Poon, J. M. (2001). Influence of Performance Evaluation Rating Segmentation on Motivation And Fairness Perceptions. Journal Of Applied Psychology, 86, 6, 1106-1119.
Bernardin, H. J., and Beatty, R. W. (1984). Performance Appraisal: Assessing Human Behavior at Work. Boston, MA: Kent Publishing Company.
Bernardin, H. J., Hagan, C. M., Kane, J. S. and Villanova, P. (1998). Effective Performance Management: A Focus on Precision, Customers And Situational Constraints. in J. W. Smither (Ed). Performance Appraisal: State of The Art in Practice. San Francisco: Jossey-Bass.
176
Bies, R. J. (1987). The Predicament of Injustice: The Management of Moral Outrage. In Cummings, L. L. And Staw, B. M. (Eds). Research in Organizational Behavior, 9, 289-319. Greenwich CT, JAI Press, Inc.
Bies, R. J. and Moag, J. S. (1986). Interactional Justice: Communication Criteria of Fairness. In Lewecki, R. J., Sheppard, B. H. and Bazerman M. H. (Eds.) Research On Negotiation In Organizations, 1, 43-55. Greenwich, CT, JAI Press, Inc.
Bies, R. J. and Shapiro, D. L. (1987). Interaction Fairness Judgments: The Influence of Causal Accounts. Social Justice Research, 1, 199-218. Bies, R. J., Shapiro, D. L. and Cummings, L.L (1988). Causal Accounts and Managing Organizational Conflicts. Is It Enough To Say It’s Not My Fault? Communications Research, 15, 381 – 399.
Bigoness, W. J. (1976). Effects of Applicant's Sex, Race and Performance on Employer's Performance Ratings: Some Additional Findings. Journal Of Applied Psychology, 61, 80-84.
Bollen, K.A. and Long, J.S. (1993) Testing Structural Equation Models. Newbury Park: Sage Publications
Boswell, W. R. and Boudreau, J. W. (2000). Employee Satisfaction with
Performance Appraisal And Appraisers: The Role Of Perceived Appraisal Use. Human Resource Development Quarterly, 11, 3, 283-299.
Bretz, R.D., Milkovich, G. T., and Read, W. (1992). The Current State of Performance Appraisal Research and Practice: Concerns, Directions, and Implications. Journal Of Management, 18, 2, 321-352.
Bricker, G. A. (1992). Performance Agreements: The Key to Increasing Motivation, Sales and Marketing , 144, 69-70.
Brockner, J. (2002). Making Sense of Procedural Fairness: How High
Procedural Fairness Can Reduce or Heighten the Influence of Outcome Favorability. Academy Of Management Review, 27, 1, 58-78.
Brockner, J., Siegel, P. A., Daly, J., Tyler, T. R. and Martin, C. (1997).
When Trust Matters: The Moderating Effect of Outcome Favorability. Administrative Quarterly, 42, 558-583.
Brockner, J. and Wiesenfeld, B. M. (1996). An Integrated Framework for
Explaining Reactions to Decisions: Interactive Effects of Outcomes and Procedures. Psychological Bulletin, 120, 189-208.
177
Burke, R.J., Wertzel, W. and Weir, T. (1978). Characteristics of Effective Employee Performance Review and Development Interviews: Replication and Extension. Personnel Psychology, 31, 903-909.
Byrne, Z.S. And Cropanzano, R. The History Of Organizational Justice: The Founders Speak. in Cropanzano (Ed.) Justice In The Workplace: From Theory To Practice, 3-26, Mahwah, NJ, Lawrence Erlbaum Associates, Inc.
Cardy, R. L. and Dobbins, S. G. (1994). Performance Appraisal: Alternative Perspectives. Cincinnati, OH, South-Western Publishing.
Carroll, S. J., and Schneier, C. E. (1982). Performance Appraisal and Review Systems: The Identification, Measurement, Development of Performance in Organizations. Dallas: Scott, Foresman and Company.
Cascio, W. F. (1987). Applied Psychology in Personnel Management. 3rd Edition. Englewood Cliffs, NJ, Prentice-Hall.
Cascio, W. F. (1992). Managing Human Resources: Productivity, Quality of Work Life, Projects. (3rd Edition), NY, McGraw-Hill.
Cascio, W. F. and Bernadin, H.J. (1981). Implication of Performance Appraisal Litigation for Personnel Decisions. Personnel Psychology. 34, 2, 211-226.
Church, A. H. (1985). From Both Sides Now, Performance Appraisals: Political Tools or Effective Measures? The Industrial Organizational Psychologist, 33, 57-64.
Cleveland, J.N. and Murphy, K.R. (1992). Analyzing Performance Appraisal as a Goal-Directed Behavior. Research In Personnel and Human Resources Management, 10, 121-185.
Cleveland, J. N., & Murphy, K.R. (1995). Understanding Performance Appraisal: Social, Organizational, and Individual Differences. Thousand Oaks, CA: Sage.
Cleveland, J. N., Murphy, K.R., and Williams, R.E., (1989). Multiple Uses of Performance Appraisal: Prevalence and Correlates, Journal Of Applied Psychology, 74, 1, 130-135.
Cobb, A. T. and Frey, F. M. (1996). The Effects of Leader Fairness and Pay Outcomes in Supervisor/Subordinate Relations. Journal Of Applied Social Psychology, 26, 1401-1426.
178
Cobb, A. T., Vest, M. and Hills, F. (1997). Who Delivers Justice? Source Perceptions of Procedural Fairness. Journal Of Applied Psychology, 27, 12, 1021-1040.
Cobb, A. T., Wooten, K. C. and Folger, R. (1995). Justice in the Making: Toward Understanding the Theory and Practice of Justice in Organizational Change and Development. Research In Organizational Change And Development, 8, 243-295. Cochran, W.G. and Snedecor, G.W. (1980). Statistical Methods. Ames, IA: Iowa State University Press.
Coens, T. and Jenkins, M. ( 2000). Abolishing Performance Appraisals, San Francisco, CA, Berrett-Koehler Publishers, Inc.
Cook, T.V. and Campbell, D. T. (1979). Quasi-Experimentation Design and
Analysis Issues for Field Settings: Chicago: Rand-McNally College Publishing. Cropanzano, R. and Ambrose, M.L. (2001). Procedural And Distributive
Justice Are More Similar Than You Think: A Monastic Perspective and A Research Agenda. In J. Greenberg and R. Cropanzano (Eds) Advances In Organizational Justice, Stanford, CA: Stanford Press.
Cropanzano, R. and Greenberg, J. (1997). Progress in Organizational
Justice. Tunneling Through the Maze. In I.T. Robertson And C. L. Cooper (Eds.) International Review Of Industrial And Organizational Psychology, 12, 317-372, NY: Wiley.
Cropanzano, R. and Folger, R. (1989). Referent Cognitions and Task Decision Autonomy: Beyond Equity Theory. Journal Of Applied Psychology, 74, 293-299.
Cropanzano, R. and Folger, R. (1991). Procedural Justice and Work Motivation. in Steers, R. M. And Porter, L. W. (Eds.) Motivation And Work Behavior, 5th Edition, 131-143. NY: McGraw-Hill.
Davis, J. A. (1971). Elementary Survey Analysis. Englewood Cliffs, NJ;
Prentice-Hall. Davis, B. L and Mount, M. C. (1984). Design and Use Of Performance
Appraisal Feedback Systems. Personnel Administration, 3, 91-107.
Deming, E. (1986). Out Of Crisis. Cambridge, MA: MIT Press.
179
DeNisi, A. S., Cafferty, T. and Meglino, B.M. (1984). A Cognitive View of the Performance Appraisal Process: A Model and Research Propositions Organizational Behavior And Human Performance, 33, 360-396.
Deutsch, M. (1975). Equity, Equality and Need: What Determines Which
Value Will Be Used As The Basis Of Distributive Justice? Journal Of Social Issues, 31, 137– 149.
Devries, D. L., Morrison, A. M., Schullman, S.L. and Gerlach, M.L. (1984). Performance Appraisal On The Line, Greensboro, NC, Center For Creative Leadership.
Dillman, D.A. (1978). Mail and Telephones Surveys: The Total Design
Method. NY: Wiley. Eager, W.G. (1991). Relationship between Organizational Culture and the
Performance Appraisal Process. An unpublished dissertation. Pennsylvania State University/
England, R. E., and Pearle, W. M. (1987). Non-Managerial Appraisal
Practices in Large American Cities. Public Administration Review, 47, 498-504.
Erdogan, B. Kraimer, M. L. And Liden, R. C. (2001). Procedural Justice As A Two-Dimensional Construct, An Examination In The Performance Appraisal Construct. The Journal Of Applied Behavioral Science, 37,.6, 205– 222.
Feldman, J.M. (1981). Beyond Attribution Theory: Cognitive Processes in Performance Appraisal. Journal Of Applied Psychology, 66, 2, 127-148.
Fisher, C. D. And Taylor, M. S. (1979). Consequences of Individual
Feedback On Behavior in Organizations. Journal Of Applied Psychology, 64, 349 – 371.
Folger, R. (1987). Distributive and Procedural Justice in the Workplace. Social Justice Research. L 1, 143-160. Folger, R. and Bies, R. J. (1989). Managerial Responsibilities and Procedural Justice. Employee Responsibilities And Rights Journal, 2, 79-90. Folger, R. and Cropanzano R. (1998) Organizational Justice And Human Resource Management. Thousand Oaks, CA: Sage.
Folger, R. and Konovsky, M.K. (1989). Effects of Procedural and Distributive Justice on Reaction to Pay Raise Decisions. Academy Of Management Journal, 32, 115-130.
180
Folger, R, Konovsky, M. A., and Cropanzano, R. (1992). A Due Process Metaphor for Performance Appraisal. in Staw, B. M. and Cummings, L.L. (Eds.), Research In Organizational Behavior, 14, 129-177. Greenwich, CT: JAI Press.
Folger, R. & Lewis, A. (1993). Self-Appraisal and Fairness in Evaluation. in R. Cropanzano (Ed.) Justice In The Workplace: Approaching Fairness In Human Resource Management ,107-131. Hillsdale, NJ, Lawrence Erlbaum Associates
Ford, J. K., Kraiger, K. and Schetman, S.L. (1986). Study of Rare Effects in Objective Indices and Subjective Evaluation of Performance: A Meta-analysis of Performance Criteria. Psychological Bulletin, 99, 330-337.
Gabris, G. T. and Ihrke, D.M. (2000). Improving Employee Acceptance
Toward Performance Appraisal And Merit Pay Systems. Review Of Public Personnel Administration, Winter 2000, 41-53.
Giles, W. F. and Mossholder, K. W. (1990). Employee Reactions to Contextual and Session Components of Performance Appraisal. Journal Of Applied Psychology, 75, 4, 371-377.
Gosselin, A., Werner, J.M., Halle, N. (1997). Ratee Preferences Concerning Performance Management and Appraisal. HRD Quarterly, 8, 4, 315 – 333.
Greenberg, J. (1986a). Determinants of Perceived Fairness In Performance Evaluation. Journal Of Applied Psychology, 71, 340-342.
Greenberg, J. (1986b) Determinants of Perceived Fairness of Performance
Appraisal Evaluations, in R. J. Lewieki, B. Shepard and M. Bazerman, (Eds.) Negotiations In Organizations. 25 – 41, Greenwich, CT: JAI Press.
Greenberg, J. (1993). The Social Side of Fairness: Interpersonal and
Informational Classes of Organizational Justice. In R. Cropanzano (Ed.) Justice In The Workplace: Approaching Fairness In Human Resource Management (Pp. 79-103)). Hillsdale, NJ: Lawrence Erlbaum Associates.
Greenberg , J. and Tyler, T.R. (1987). Why Procedural Justice in Organizations? Social Justice Research, 1, 127-142.
Greller, M.M. (1975) Subordinate Participation and Reactions to the Appraisal Interview. Journal of Applied Psychology, 60, 554-559.
Hair, J. F., Anderson, R. E., Tatham, R. L. and Black, W.C. (1998).
Multivariate Data Analysis. (5th Edition). Upper Saddle River, N.J., Prentice Hall.
181
Hays, S. W. & Kearney, R. C., 2001. Anticipated Changes in Human Resource Management: Views from the Field. Public Administration Review, 61., 5, 585. Hedge, J. W. and Borman, W. C. (1995). Changing Conceptions and Practices In Performance Appraisal. in A. Howard (Ed.) The Changing Nature Of Work. San Francisco: Jossey-Bass.
Homans, C.C. (1961). Social Behavior: Its Elementary Forms. NY: Harcourt, Brace and World.
Huo, Y. J. and Tyler, T. R. (2001). Ethnic Diversity and The Viability of
Organizations: The Role of Procedural Justice in Bridging Differences. in J. Greenberg and R. Cropanzano (Eds), Advances In Organizational Justice. 213- 245, Stanford, CA: Stanford Press.
Hulin, C. L. (1982) Some Reflections on General Performance Dimensions
and Halo Rating Errors. Journal Of Applied Psychology, 67, 165 – 170.
Ilgen, D. R. and Feldman, J. M. (1983). Performance Appraisal: A Process Focus. in L. L. Cummings and B. M. Staw (Eds.) Research In Organizational Behavior, 5, 141-197. Greenwich, CT: JAI Press.
Ilgen, D. R., Fisher, C. D. and Taylor, S. M. (1979). Consequences of Individual Feedback on Behavior in Organizations. Journal Of Applied Psychology, 64, 347-371.
Ilgen, D. R., Barnes-Farrell, J. L., and McKellin, D. B. (1993). Performance
Appraisal Process Research in The 1980’s: What Has It Contributed to Appraisals in Use? Organizational Behavior And Human Decision Processes, 54, 321 – 368.
Joreskog, K.G., and Sorbom, D. (1993). LISREL- 8. A Guide to the Program and Applications (2nd Ed.), Chicago, IL: Scientific Software International, Inc. Juett, S. J. (1996). Measuring Performance Appraisal Efficacy in the Public Sector Comparing Performance Appraisal System Efficacy with Job Design. Unpublished Doctoral Dissertation, University of Georgia; Athens, GA
Karol, S.H., (1996). The Influence of Planning Activity on Employee Performance Review. Unpublished Dissertation, Evanston, IL.
Kane, J. S. and Lawler, E. E., III, (1979). Performance Appraisal Effectiveness: Its Assessment and Determinants. In Research And Organizational Behavior, 1, 425-278.
182
Kay, E., Meyer, H. and French, T. (1965). Effects of Threat in Performance Interviews. Journal of Applied Psychology, 49, 311-317.
Keeping, L.M. and Levy, P. E. (2000). Performance Appraisal Reactions:
Measurement, Modeling and Method Bias. Journal Of Applied Psychology, 85, 5, 708-723.
Klasson, K. And Sorbom, D.(1993). LISREL 8. Scientific Software
International.
Klores, M. (1966). Rater Bias in Forced Distribution Performance and Ratings. Personnel Psychology, 19, 411-421.
Korsgaard, M. A. and Roberson, L. (1995). Procedural Justice in Performance Evaluation: The Role of Instrumental and Non-Instrumental Voice in Performance Appraisal Discussion. Journal Of Management, 21, 4, 657-669.
Kraiger, K. and Ford, C. (1985). A Meta-Analysis of Rater Race Effects in
Performance Ratings. Journal Of Applied Psychology, 70, 56 – 65. Landy. F. (1985). Psychology Of Work Behavior. Homewood, IL, Dorsey.
Landy, E. F., Barnes, J.L., and Murphy, K.R. (1978). Correlated of
Perceived Fairness and Accuracy of Performance Evaluation. Journal Of Applied Psychology, 63, 751-754.
Landy, E. F., Barnes-Farrell, J.L. and Cleveland, J. N. (1980). Perceived Fairness and Accuracy of Performance Evaluation: A Follow-Up. Journal Of Applied Psychology, 65, 355-356.
Landy, F.J., and Farr, J.L.(1980). Performance Rating. Psychological Bulletin. 87, 1, 72-107.
Landy, F. J. and Farr, J.L. (1983). The Measurement of Work Performance: Methods, Theory and Applications. Orlando, FL, Academic Press.
Latham, G.P. and Lee, T.W. (1986). Goal Setting. In E.A. Locke (Ed.), Generalizing From Laboratory to Field Settings, 101-117. Lexington, MA, Lexington Books.
Latham, G. P., and Wexley, K. N. (1981). Increasing Productivity Through Performance Appraisal. Reading, MA: Addison-Wesley.
Lawler, E. E. (1967). The Multi-Trait-Multivariate Approach to Measuring Managerial Job Performance. Journal Of Applied Psychology, 51, 369-381.
183
Lawler, E. E. (1981). Pay And Organizational Development. Reading, MA: Addison-Wesley.
Lawler, E. E., Mohrman, A. M., and Resnick, S. M. (1984). Performance Appraisal Revisited. Organizational Dynamics, 13, 1, 20-35.
Leung, K. and Li, N. (1990). Psychological Mechanisms of Process Control Effects. Journal Of Applied Psychology, 75, 613-620.
Leung, K., Su, S. and Morris, M.W. (2001). When Is Criticism Not
Constructive? The Roles Fairness Perceptions and Dispositional Attributions in Employee Acceptance of Critical Supervisory Feedback. Human Relations, 54. 9, 1155-1187.
Leventhal, G. S. (1976). The Distribution of Rewards and Resources in
Groups and Organizations. in AL. Berkowitz And E. Walter (Eds.) Advances In Experimental Social Psychology , (Vol. 9, 91-131).
Leventhal, G. S. (1980). What Should Be Done With Equity Theory? in Gergen, K. J., Greenberg, M.S., and Willis, R. H. (Eds.) Social Exchange: Advances In Theory And Research, . 27-55. NY: Plenum. Levinson, H. (1965). Reciprocation: The Relationship between Man and the Organization. Administrative Science Quarterly, 9, 370-390.
Lind, E. A., Kanfer, R. and Earley, R. (1990). Voice, Control and
Procedural Justice: Instrumental and Non-Instrumental Concerns In Fairness Judgments. Journal Of Personality and Social Psychology, 59, 952-959. Lind, E. A. and Tyler, T. R. (1988). The Social Psychology Of Procedural Justice. NY, Plenum.
Locker, A.H. and Teel, K.S. (1988). Assessment: Appraisal Trends. Personnel Journal, 67, 139-145.
Longenecker, C.O. and Goff, S.J. (1992). Performance Appraisal Effectiveness: A Matter of Perspective. Advanced Management Journal. 57, 2, 18-23.
Longenecker, C.O. Gioria, D.A. and Sims, H.P. (1987). Behind the Mask: The Politics of Employee Performance Appraisal. Academy Of Management Executive, 1, 183-193.
Lovrich, Shaffer, Hopkins and Yale (1980). Public Employees and Performance Appraisals: Do Public Servants Welcome or Fear Merit Evaluations of Their Performance? Public Administration, 40, 3 (May/June), 214 - 222.
184
Major, B. (1987). Gender, Justice and the Psychology of Entitlement. in P.
Shaver and C. Hendrick (Eds.), Sex And Gender. Beverly Hills, CA, 124 – 148. Martin, D. C. And Bartol, K. M. (1998). Performance Appraisal:
Maintaining System Effectiveness. Public Personnel Management, 27, 2, 223-230.
McCarthy, Barbara J., 1995, Rater Motivation In Performance Appraisal, Unpublished Dissertation For Ph.D., At The University Of WI, Madison.
Mikula, G., Petrik, B. and Tanzer, N. (1990). What People Regard As Just and Unjust: Types and Structures of Everyday Experiences of Injustice. European Journal Of Social Psychology, 20, 133-149,
Mohrman, Jr. A.M. and Lawler, E.E. 1983. Motivation and Performance Appraisal Behavior. in F. Landry, S. Zedeck and J. Cleveland (Eds.) Performance Measurement And Theory. (Pp. 173 - 189). Hillsdale, NJ: Lawrence Erlbaum Associates Publishers.
Mohrman, A.M., Resnick-West, S. and Lawler, E.E. (1989). Designing Performance Appraisal Systems: Aligning Appraisals and Organizational Realities. San Francisco, CA, Jossey-Bass, Inc.
Moorman, R. H. (1991). Relationships Between Organizational Justice and Organizational Citizenship Behaviors: Do Fairness Perceptions Influence Employee Citizenship? Journal Of Applied Psychology, 76, 845-855. Murphy, K. R. and Balzer, W. K. (1989). Rater Errors and Rating Accuracy. Journal Of Applied Psychology, 74, 619-624.
Murphy, K. R., Balzer, W.K., Kellem, K. and Armstrong, J. (1984). Effects of Purpose of Rating on Accuracy in Observing Teacher Behavior and Evaluating Teacher Performance. Journal Of Educational Psychology, 76, 45-54.
Murphy, K.R. and Cleveland, J.N., (1991). Performance Appraisal. An Organizational Perspective. Needham Heights, MA: Allyn and Bacon.
Murphy, K.R. And Cleveland, J.N. (1995) Understanding Performance Appraisal. Thousand Oaks, CA, Sage.
Murphy, K.R., Cleveland, J.N. Henle, Morgan, Orth and Tziner (1996). Effects of Proximal and Distal Context Variables on Performance Appraisal Quality: A Model For Research. Proceedings of Fifteenth
Napier, N. K. and Latham, G. P. (1986). Outcome Expectancies of People Who Conduct Performance Appraisals. Personnel Psychology, 39, 827-837.
185
Noe, R. A., Hollenbeck, J. R. Gerhart, B. and Wright, P.M. (1997). Human
Resource Management, Gaining A Competitive Advantage, (2nd Edition). Burr Ridge, IL: Irwin.
Nunnally, J. C. and Bernstein, I. H. (1994). Psychometric Theory. NY: McGraw-Hill.
Ostroff, C. (1993). Rater Perceptions, Satisfaction and Performance Ratings. Journal of Organizational Psychology. 66, 345-356.
Price J. L. and Mueller, C.W. (1986). Handbook Of Organizational Measurements. Marshfield, MA: Pittman. Pulakos E.D., White, L.A., Oppler, S.H. and Borman, W.C. (1989). Examination of Race and Sex Effects on Performance Ratings. Journal of Applied Psychology 74, 3, 770-780.
Roberts, G.E., (1990). The Influence of Participation, Goal Setting, Feedback and Acceptance in Measures of Performance Appraisal System Effectiveness. University of Pittsburgh, Unpublished Doctoral Dissertation.
Roberts, G.E., (1995). Municipal Government Performance Appraisal System Practices: Is the Whole Less Than the Sum of Its Parts? Public Personnel Management, 24, 2, 197-221.
Roberts, G. E. and Reed, T. (1996). Performance Appraisal Participation, Goal Setting, and Feedback: The Influence of Supervisory Style. Review Of Public Personnel Administration, 16, 29-60.
Roch, S. G. (1997). The Effect of Rater Motivation on Performance Appraisal Accuracy: An NPI Approach. Unpublished Doctoral Dissertation, College Station, TX, Texas, A&M University.
Sackett, P. R. and Dubois, C. L. (1991). Rater-Ratee Race Effects on Performance Evaluation: Challenging Meta-Analytical Conclusions. Journal of Applied Psychology, 76, 6, 873-877.
Sackett, P. R., Zedeck, S. and Fogli, L. (1988). Relations between Measures
of Typical and Maximum Job Performance. Journal Of Applied Psychology, 73, 482 – 486.
Seldon, S. C., Ingraham, P.W., and Jacobson, W. (2001). Human Resource
Practices in State Government: Findings from a National Survey. Public Administration Review, 61, 598-614.
186
Shapiro, D. L. (1991). The Effects of Explanations on Negative Reactions to Deceit. Administrative Science Quarterly, 36, 614-630. Shapiro, D. L. Buttner, H. B. and Barry, B. (1994). Explanations: What Factors Enhance Their Perceived Adequacy? Organizational Behavior and Human Decision Processes, 58, 346 – 368.
Silverman, D. P. and Wexley, K. N. (1984). Reaction of Employees to Performance Appraisal Interviews as a Function of Their Participation in Rating Scale Development. Personnel Psychology, 37, 703-710.
Skarlicki, D. P. and Folger, R (1997). Retaliation in the Workplace: The Roles of Distributive, Procedural and Interactional Justice. Journal Of Applied Psychology, 82, 434-443.
A Twist on Performance Reviews (1993). Small Business Reports, 18, 27-28.
Smither, J. W. (1998). Lessons Learned: Research Implications For Performance Appraisal and Management. in J.W. Smither (Ed.) Performance Appraisal. San Francisco: Jossey- Bass.
Smither, J. W. and Reilly, R.R. (1987). True Intercorrelation among Job Components, Time Delay in Rating and Rater Intelligence as Determinants of Accuracy in Performance Ratings. Organizational Behavior and Human Decision Processes. 40:369-391.
Stratton, K. (1988). Performance Appraisal and the Need for an Organizational
Grievance Procedure: A Review of the Literature and Recommendations for Future Research. Employee Responsibilities And Rights Journal, 1, 167-179. Sweeney, P. D. and McFarlin, D.B. (1995). Process and Outcome: Gender Differences in the Assessment of Justice. Journal Of Organizational Behavior, 18, 83–98
Tang, T. L. and Sarsfield-Baldwin, L.J. (1996). Distributive and Procedural Justice As Related to Satisfaction and Commitment. SAM Advanced Management Journal, 61, 25-31.
Taylor, M.S. Tracy, K. B., Renard, M.K., Harrison, J.K., and Carrol, S.. (1995). Due Process in Performance Appraisal: A Quasi-Experiment in Procedural Justice. Administrative Science Quarterly, 40, 495 - 523.
Thibaut, J. and Walker, L. (1975). Procedural Justice: A Psychological Analysis. Hillsdale, JN: Erlbaum.
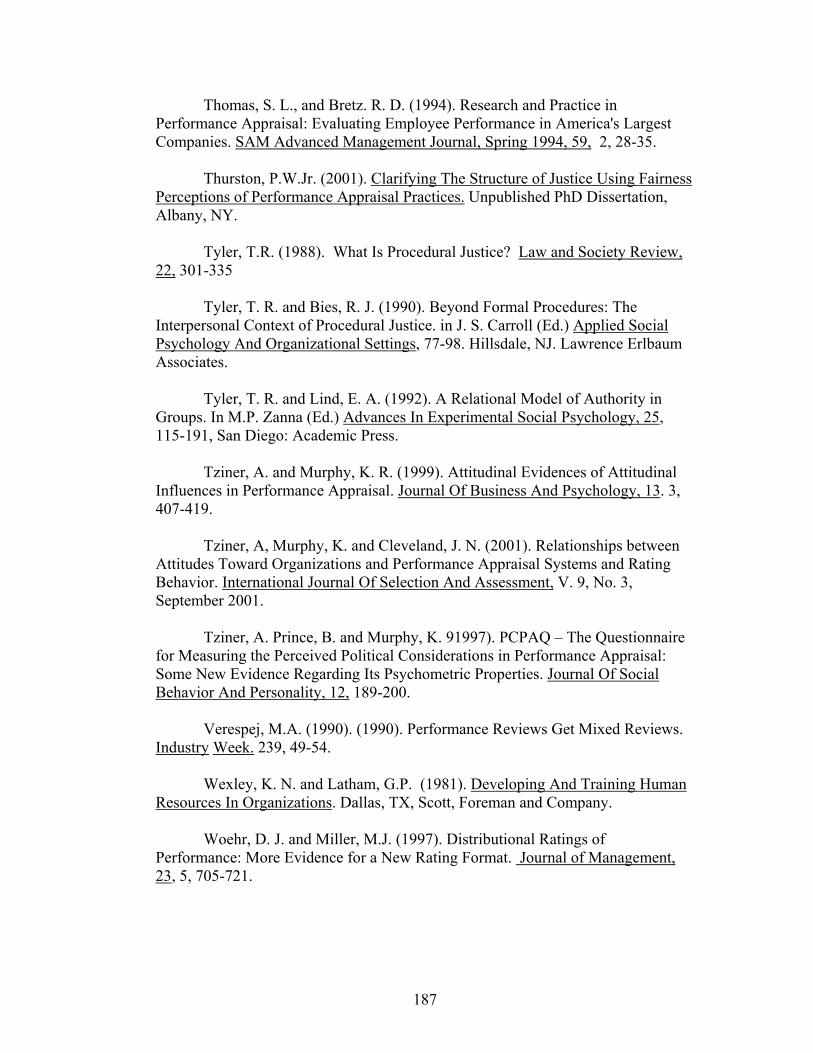
187
Thomas, S. L., and Bretz. R. D. (1994). Research and Practice in Performance Appraisal: Evaluating Employee Performance in America's Largest Companies. SAM Advanced Management Journal, Spring 1994, 59, 2, 28-35. Thurston, P.W.Jr. (2001). Clarifying The Structure of Justice Using Fairness Perceptions of Performance Appraisal Practices. Unpublished PhD Dissertation, Albany, NY. Tyler, T.R. (1988). What Is Procedural Justice? Law and Society Review, 22, 301-335
Tyler, T. R. and Bies, R. J. (1990). Beyond Formal Procedures: The Interpersonal Context of Procedural Justice. in J. S. Carroll (Ed.) Applied Social Psychology And Organizational Settings, 77-98. Hillsdale, NJ. Lawrence Erlbaum Associates. Tyler, T. R. and Lind, E. A. (1992). A Relational Model of Authority in Groups. In M.P. Zanna (Ed.) Advances In Experimental Social Psychology, 25, 115-191, San Diego: Academic Press. Tziner, A. and Murphy, K. R. (1999). Attitudinal Evidences of Attitudinal Influences in Performance Appraisal. Journal Of Business And Psychology, 13. 3, 407-419.
Tziner, A, Murphy, K. and Cleveland, J. N. (2001). Relationships between Attitudes Toward Organizations and Performance Appraisal Systems and Rating Behavior. International Journal Of Selection And Assessment, V. 9, No. 3, September 2001. Tziner, A. Prince, B. and Murphy, K. 91997). PCPAQ – The Questionnaire for Measuring the Perceived Political Considerations in Performance Appraisal: Some New Evidence Regarding Its Psychometric Properties. Journal Of Social Behavior And Personality, 12, 189-200.
Verespej, M.A. (1990). (1990). Performance Reviews Get Mixed Reviews. Industry Week. 239, 49-54.
Wexley, K. N. and Latham, G.P. (1981). Developing And Training Human Resources In Organizations. Dallas, TX, Scott, Foreman and Company. Woehr, D. J. and Miller, M.J. (1997). Distributional Ratings of Performance: More Evidence for a New Rating Format. Journal of Management, 23, 5, 705-721.

188
Zedeck S., and Cascio. W. F. Performance Appraisal Decisions As A Function of Rater Training and Purpose of Appraisal. Journal Of Applied Psychology, 67, 752-758.

APPENDIX A
SURVEY QUESTIONNAIRE
189
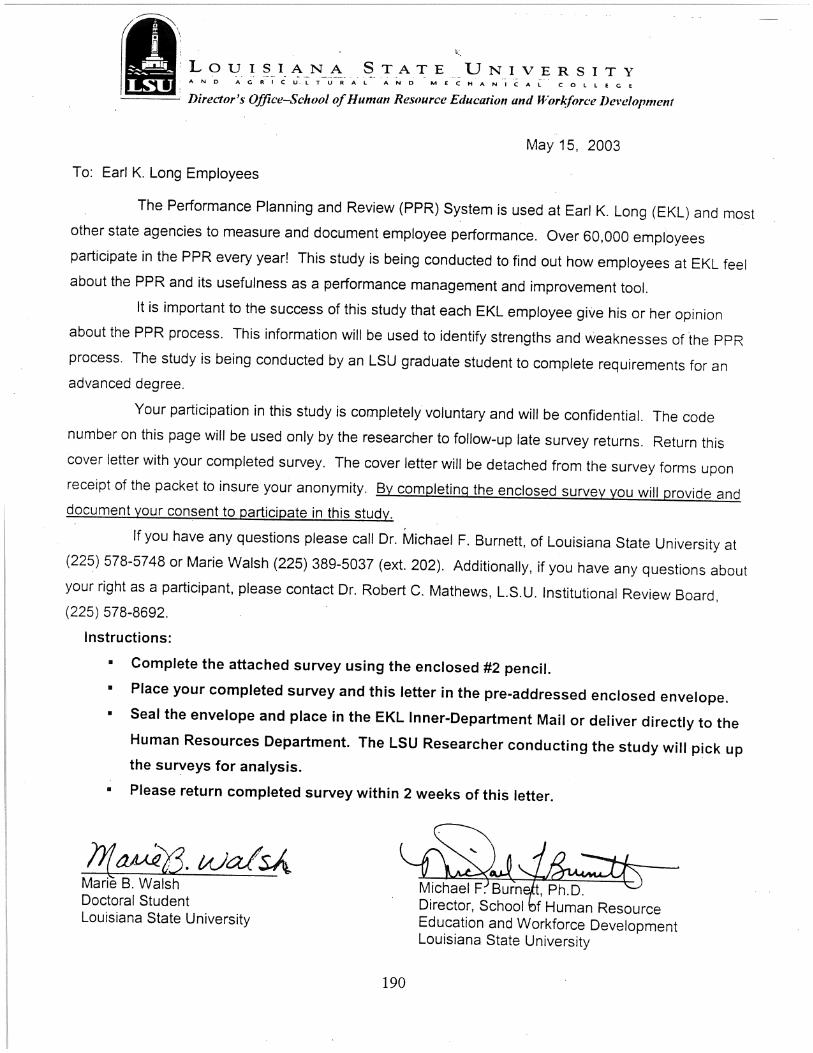
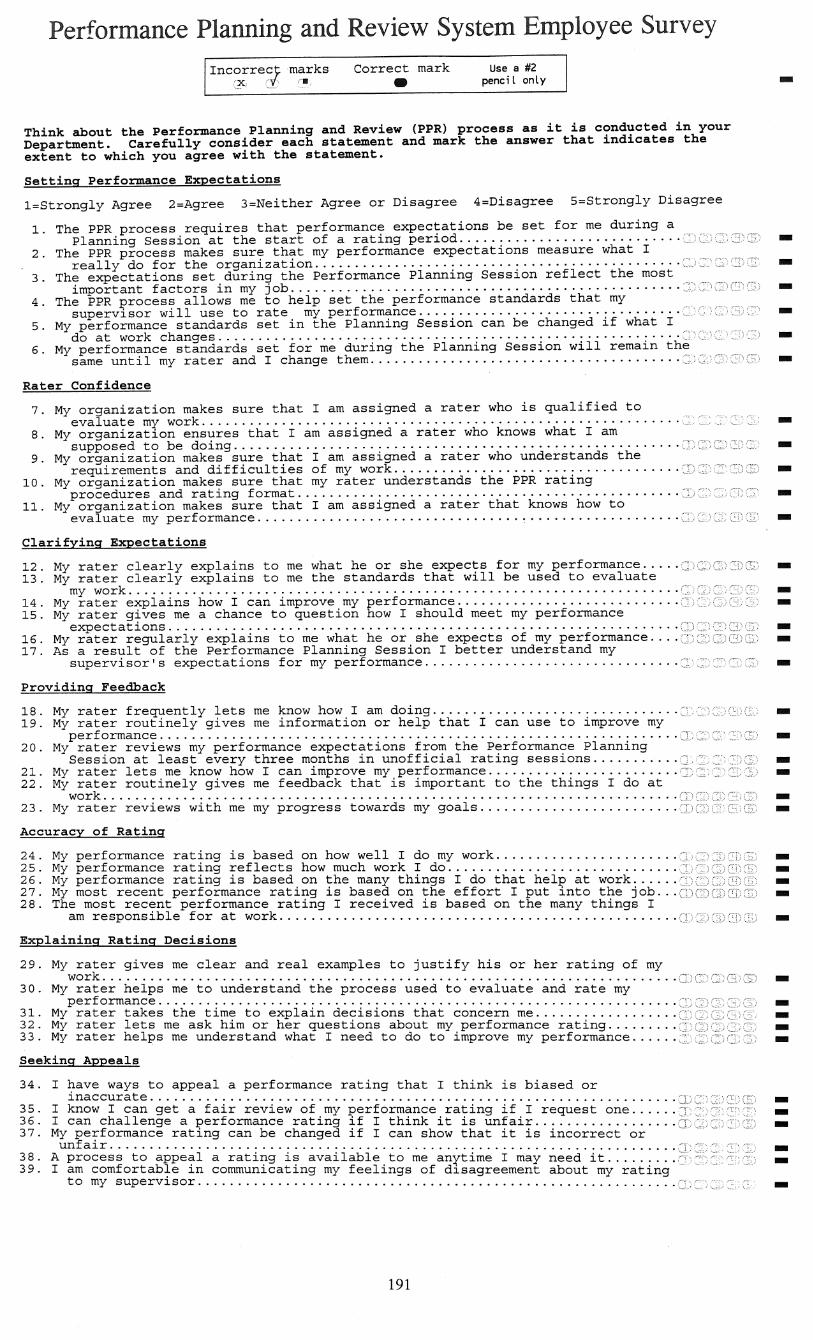
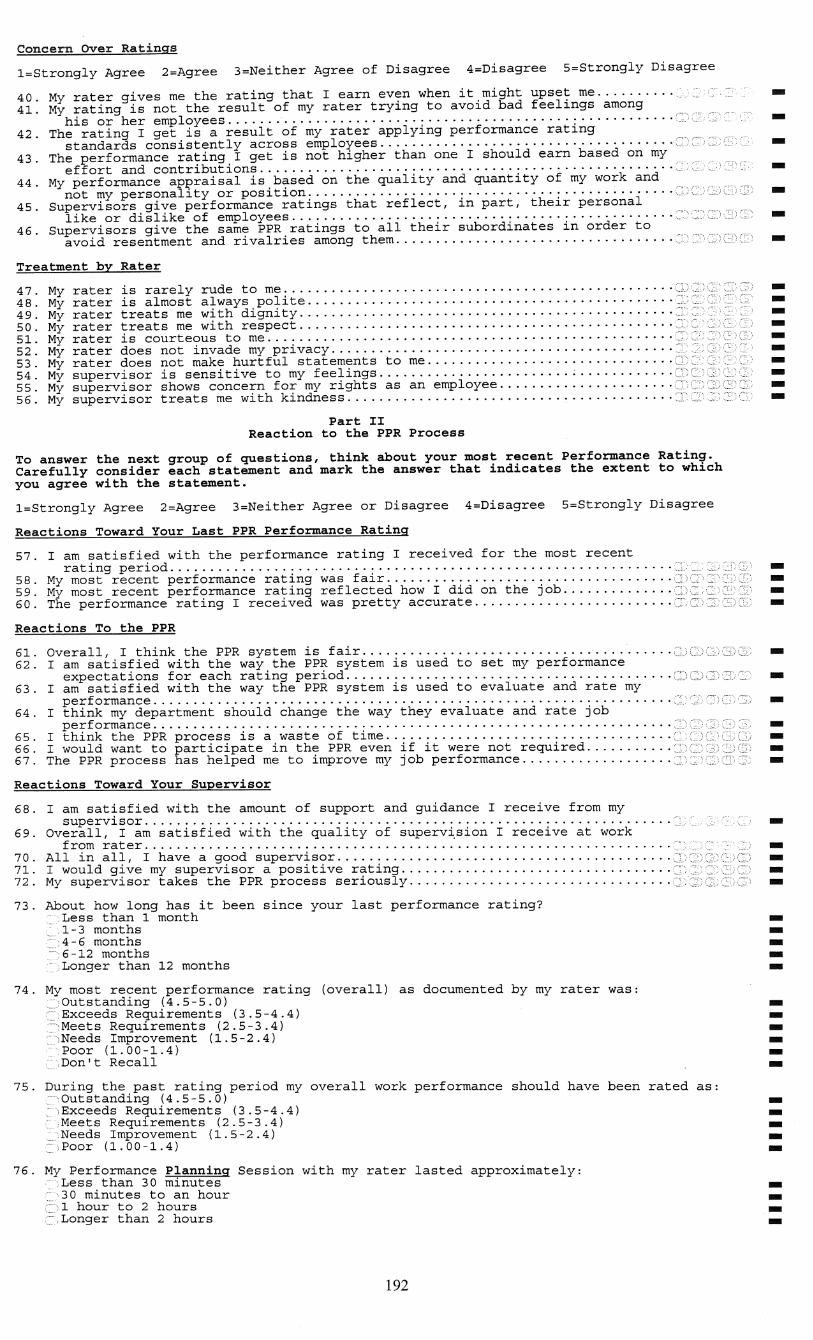

193
APPENDIX B
FOLLOW-UP POSTCARD

194
TO: All PPR Survey Participants THERE IS STILL TIME FOR YOU TO BE INCLUDED IN THE PPR SURVEY!! If you've already sent the PPR survey back, we THANK YOU. If you're still working on your survey, we encourage you to return it now. Your input is important to the success of this project and we need your survey to make sure that your opinions are included. If you have any questions please call Marie Walsh (LSU PPR Survey Coordinator) at 389-5037 (x202). Don't miss this opportunity to give us your input on the PPR program. Thank you for your help and cooperation.
195
APPENDIX C
CO-VARIANCE MATRIX FOR CONFIRMATORY FACTOR ANALYSIS
APPENDIX C
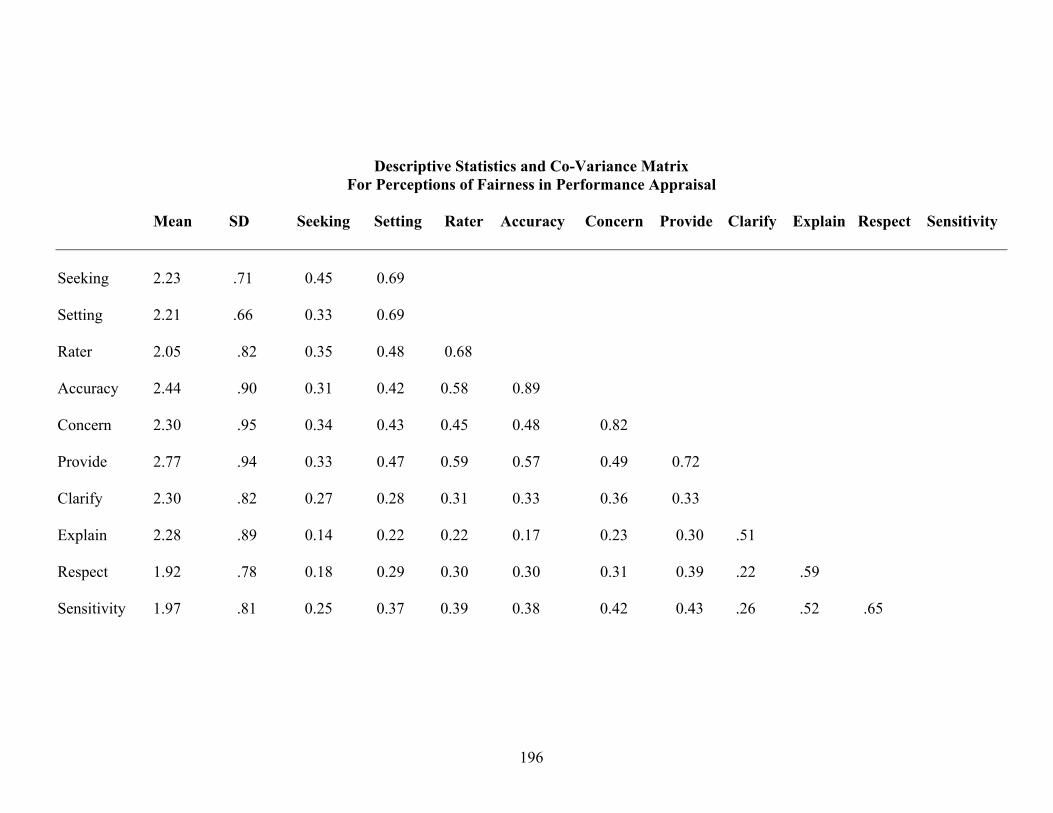
196
Descriptive Statistics and Co-Variance Matrix For Perceptions of Fairness in Performance Appraisal
Mean SD Seeking Setting Rater Accuracy Concern Provide Clarify Explain Respect Sensitivity Seeking 2.23 .71 0.45 0.69 Setting 2.21 .66 0.33 0.69 Rater 2.05 .82 0.35 0.48 0.68 Accuracy 2.44 .90 0.31 0.42 0.58 0.89 Concern 2.30 .95 0.34 0.43 0.45 0.48 0.82 Provide 2.77 .94 0.33 0.47 0.59 0.57 0.49 0.72 Clarify 2.30 .82 0.27 0.28 0.31 0.33 0.36 0.33 Explain 2.28 .89 0.14 0.22 0.22 0.17 0.23 0.30 .51 Respect 1.92 .78 0.18 0.29 0.30 0.30 0.31 0.39 .22 .59 Sensitivity 1.97 .81 0.25 0.37 0.39 0.38 0.42 0.43 .26 .52 .65
197
VITA
Marie Burns Walsh holds a bachelor of science degree in physical geography, a
master’s of engineering degree in environmental engineering, and will receive a doctor of
philosophy in human resource education from Louisiana State University at the
December, 2003 commencement. Currently employed as Assistant Director of the
Human Resources Department of the East Baton Rouge City-Parish she is responsible for
employee training and development. She has conducted research in the areas of
performance appraisal, organizational justice and organizational needs analysis. As a
human resource development professional she has implemented numerous projects and
interventions at the organizational, process and individual levels. Ms. Walsh’s prior
work experience was in the environmental engineering field where she was employed as
a consultant to industry and as a manager with the state regulatory agency.