Embed Size (px)
Citation preview

March 2014 OFFICE OF THE UNDER SECRETARY OF DEFENSE
(COMPTROLLER) / CHIEF FINANCIAL OFFICER
OPERATION AND MAINTENANCE OVERVIEW FISCAL YEAR 2015
BUDGET ESTIMATES

TABLE OF CONTENTS
TABLE OF CONTENTS
OVERVIEW Page O&M Title Summary ...............................................................1 APPROPRIATION HIGHLIGHTS Army ........................................................................................6 Navy ........................................................................................15 Marine Corps ..........................................................................27 Air Force .................................................................................32 Defense-Wide .........................................................................38 Reserve Forces ........................................................................40 Afghanistan Infrastructure Fund [NOT INCLUDED] ......................48 Cooperative Threat Reduction Program .................................49 Defense Acquisition Workforce Development Fund ..............55 Defense Health Program .........................................................56 Drug Interdiction and Counterdrug Activities ........................62 Environmental Programs ........................................................68 Overseas Contingency Operations Transfer Fund ..................77 Overseas Humanitarian, Disaster, and Civic Aid ...................78 Office of the Inspector General ...............................................81 Support of International Sporting Competitions .....................82 MAJOR ACTIVITIES Land Forces .............................................................................83 Ship Operations .......................................................................89 Air Operations .........................................................................94 Special Operations Forces......................................................108 Information Operations ..........................................................110 Depot Maintenance ................................................................111 Body Armor and Other Protective Gear ................................116 Base Operations Support........................................................117
MAJOR ACTIVITIES – continued Page Facilities Sustainment, Repair & Modernization and
Demolition Programs ........................................................124 Mobilization ...........................................................................131 Training and Education ..........................................................136 Recruiting, Advertising, and Examining ...............................145 Command, Control, and Communications (C3) ....................149 Transportation ........................................................................153 Contract Services ...................................................................157 Prisoner of War and Missing Personnel Affairs
(POW/MPA) Programs….. ...............................................166 OTHER DATA Civilian Personnel ..................................................................168 Active Force Military Personnel ............................................179 SOCOM Military Personnel ..................................................184 Selected Reserve and Guard Personnel ..................................185 Management HQ Report ........................................................188 DoD Customer Fuel Prices ....................................................190 Overseas Funding Summary ..................................................192 Foreign Currency Fluctuation Rates ......................................196 More Disciplined Use of Resources ......................................197 APPENDIX World Wide Web Address .....................................................215 M-1C Report ..........................................................................216 O-1 Report .............................................................................234 Civilian Personnel Costs (OP-8) ............................................270 Overseas Contingency Operations .........................................273
TABLE OF CONTENTS
TABLE OF CONTENTS
Preparation of this report/study cost the Department of Defense a total of approximately $46,000 for the 2014
Fiscal Year.
Generated on 2014 March 10 RefID: 4-04B95DE

OPERATION AND MAINTENANCE TITLE SUMMARY
OPERATION AND MAINTENANCE TITLE SUMMARY
O&M TOA BY SERVICE BY APPROPRIATION $ in Millions
Funding Summary FY 2013/1
Actual Price
Growth Program Growth
FY 2014/2
Enacted Price
Growth Program Growth
FY 2015/3
Estimate Army 80,143.4 1,347.2 -41,048.3 40,442.3 395.0 924.0 41,761.5
Active 64,804.6 1,158.5 -35,319.2 30,643.9 241.0 2,355.2 33,240.1
Reserve 3,022.4 46.9 -128.4 2,940.9 49.2 -499.6 2,490.6
National Guard 7,045.2 61.5 -249.2 6,857.5 104.8 -931.6 6,030.8
Afghanistan Security Forces Fund 4,946.2 74.5 -5,020.7 0.0 0.0
Afghanistan Infastructure Fund 325.0 5.8 -330.8 0.0 0.0
Navy 55,608.1 166.1 -10,888.9 44,885.4 791.0 819.6 46,496.1
Navy Active4 44,788.4 20.8 -8,965.5 35,843.7 669.4 2,803.7 39,316.9
Marine Corps Active 9,167.4 134.0 -3,917.8 5,383.6 61.5 458.4 5,903.5
Navy Reserve 1,194.1 4.2 -39.9 1,158.4 15.2 -166.5 1,007.1
Marine Corps Reserve 279.3 3.9 -27.9 255.3 4.6 8.7 268.6 Ship Modernization, Operations, and Sustainment Fund 178.9 3.2 2,062.2 2,244.4 40.3 -2,284.7 0.0 Air Force 51,932.1 774.9 -10,135.0 42,572.1 253.9 1,913.9 44,739.9
Active 42,904.1 646.8 -10,433.4 33,117.6 196.6 2,017.0 35,331.2 Reserve 2,994.1 31.3 36.8 3,062.2 19.8 -66.2 3,015.8 National Guard 6,033.9 96.9 261.6 6,392.3 37.5 -36.9 6,392.9 Defense-Wide and Other 67,250.8 1,533.5 -4,895.8 63,888.5 1,429.7 -1,912.4 63,406.0 Defense-Wide 35,973.8 597.4 -5,424.0 31,147.2 506.5 -455.6 31,198.2 Defense Acquisition Workforce Development Fund 48.6 0.8 1.6 51.0 0.9 160.9 212.9 Defense Health Program5 31,228.4 935.3 526.6 32,690.3 922.3 -1,617.7 31,994.9
Numbers may not add due to rounding 1 FY 2013 includes Overseas Contingency Operations (OCO) funding 2 FY 2014 enacted excludes $69.7 billion of OCO including $9.2 billion of base transferred to OCO 3 FY 2015 excludes OCO funding 4 FY 2015 includes $291 thousand to be transferred to MARAD upon enactment 5 FY 2013 inlcudes $585 million of unobligated balance and FY 2015 includes $161.8 thousand to be transferred to Dept of VA upon enactment
1

OPERATION AND MAINTENANCE TITLE SUMMARY
OPERATION AND MAINTENANCE TITLE SUMMARY
O&M TOA BY SERVICE BY APPROPRIATION $ in Millions
Funding Summary FY 2013/1
Actual Price
Growth Program Growth
FY 2014/2
Enacted Price
Growth Program Growth
FY 2015/3
Estimate Cooperative Threat Reduction 446.2 9.7 44.6 500.5 8.8 -144.1 365.1
Office of the Inspector General 318.9 3.4 -6.2 316.0 3.6 -7.9 311.8
Overseas Humanitarian, Disaster Assistnce and Civic Aid 108.6 3.2 -2.3 109.5 0.5 -10.0 100.0
U.S. Court of Appeals for the Armed Forces 10.5 0.1 3.0 13.6 0.2 -0.1 13.7
Support for International Sporting Competitions
0.0 0.0 10.0 10.0
Environmental Restoration, Army4 0.0 0.0 298.8 298.8 5.4 -102.6 201.6
Environmental Restoration, Navy4 0.0 0.0 316.1 316.1 5.7 -44.5 277.3
Environmental Restoration, Air Force4 0.0 0.0 439.8 439.8 7.9 -39.0 408.7 Environmental Restoration, Defense-Wide4 0.0 0.0 10.7 10.8 0.2 -2.4 8.5 Environmental Restoration, Formerly Used Defense Sites (FUDS)4 0.0 0.0 287.4 287.4 5.2 -84.3 208.4
Drug Interdiction And Counter-Drug Activities, Defense4 391.3 7.3 617.2 1,015.9 17.9 -213.0 820.7
Overseas Contingency Operations Transfer Fund (OCOTF)4 0.0 0.0 0.0 0.0 0.0 5.0 5.0
Disposal of Real Property 19.1 0.4 11.4 30.9 0.5 -25.9 5.5
Lease of Real Property 29.0 0.5 100.8 130.2 2.3 -107.9 24.6
Miscellaneous Accounts 7.2 -0.2 -7.0 0.0 0.0 0.0 0.0
Total Obligation Authority 256,268.8 3,870.9 -65,030.0 195,257.8 2,927.8 978.4 199,164.4 Numbers may not add due to rounding
1 FY 2013 includes Overseas Contingency Operations (OCO) funding 2 FY 2014 enacted excludes $69.7 billion of OCO including $9.2 billion of Base transferred to OCO 3 FY 2015 exclude OCO funding 4 Transfer account funding is executed in Service and Agency programs
2

OPERATION AND MAINTENANCE TITLE SUMMARY
OPERATION AND MAINTENANCE TITLE SUMMARY
The Department of Defense’s Operation and Maintenance (O&M) programs support the Department’s 2014 strategic guidance, recognizing the approaching end of a decade of war, and a changing technological and geopolitical landscape. The FY 2015 O&M funding supports a smaller and leaner force, that is more agile, flexible, ready, innovative and technologically advanced. The O&M programs support a force that is:
• Balanced to meet the full range of potential military missions. The smaller force will sustain its technological edge, be capable of deterring and, if necessary, defeating aggression, while improving its readiness to accomplish key missions.
• Adaptable and capable of deterring aggression and providing a stabilizing presence, especially in the highest priority areas and mission in the Asia-Pacific region and the Middle East, while still ensuring our ability to maintain our defense commitments to Europe and other allies and partners.
• Ready, rapidly deployable and expeditionary such that it can project power on arrival.
• Capable of protecting the airspace and shores of our homeland by reshaping the ability of U.S. military forces to provide support to civil authorities when needed.
The FY 2015 O&M programs reflect balanced approaches while preserving the force and capabilities that are required to meet the new strategy. This budget expands upon previous efforts and includes achieving new efficiencies, eliminating duplication, reducing management headquarters and overhead, tightening personnel costs, enhancing contract competition, and consolidating infrastructure. The budget decisions reflected in the subsequent exhibits in the O&M Overview Book are in accordance with the following major tenets within the strategic guidance.
• Rebalance force structure and investments toward the Asia-Pacific and Middle East regions while sustaining key alliances and partnerships in other regions.
• Plan and size forces to be able to defeat a major adversary in one theater while denying aggression elsewhere.
• No longer size active forces to conduct large and protracted stability operations while retaining the expertise of a decade of war.
The funding amounts reflected in this Overview are expressed in Total Obligational Authority (TOA) terms. The term “TOA” includes Budget Authority and financing adjustments (e.g., transfers from unobligated balances), which comprise the total funding available for obligation in the appropriations included in the O&M Title. The summary table at the top of this page identifies the TOA for the appropriations included in the O&M Title.
• The FY 2015 TOA request of $199.2 billion for the O&M Title increases $3.9 billion above the FY 2014 enacted baseline funding level of $195.3 billion in the FY 2014 Consolidated Appropriation Act. The increase consists of $2.9 billion in price change and $0.9 billion in program increases. The FY 2014 Consolidated Appropriation Act, transferred non-war costs of $9.2 billion from the services O&M into their Overseas Contingency Operations (OCO) accounts; this transfer is reversed in the FY
3

OPERATION AND MAINTENANCE TITLE SUMMARY
OPERATION AND MAINTENANCE TITLE SUMMARY
2015 request. The rate of real growth from FY 2014 enacted to FY 2015 when adjusted for the base to OCO adjustment of $9.2 billion is a decrease of $5.3 billion, or 2.7 percent.
The price changes from the FY 2014 baseline funding level TOA are discussed below. Subsequent exhibits in the O&M Overview Book will discuss major programmatic changes.
PRICE CHANGES Price change reflects the additional cost of executing the previous year’s program at the next year's prices. In general, price change amounts are estimated by applying price change rates to amounts budgeted for various commodity groups (i.e., civilian pay, Working Capital Fund purchases, medical supply purchases, general non-personnel purchases, etc.). The FY 2015 price change is $2.9 billion.
For FY 2015, the budgeted pay raise is 1.0 percent for General Schedule and wage board employees and is projected to be effective January 1, 2015. It also provides for foreign national employee pay raises at the rates negotiated with the host countries provided to public sector personnel.
Consistent with Office of Management and Budget (OMB) direction, the general non-personnel purchase inflation rate is 1.8 percent for FY 2015.
Working Capital Fund rates change by business activity group and vary from year to year. The following list of FY 2015 rate changes are composite rates that will vary based on the specific purchase categories. This list represents those business areas that account for the vast majority of orders from O&M customers. The FY 2015 budget submission assumes West Texas Intermediate crude oil at $89.64 per 42-gallon barrel with a standard composite selling price of $155.40 per barrel, which includes the cost of crude oil, refined products, inventory control, transportation, storage, and operating costs.
Defense Working Capital Funds Rate Change
(Percent) Army Managed Supplies, Materials, and Equipment 1.26 Navy Managed Supplies, Materials, and Equipment 1.25 Air Force Managed Supplies, Materials, and Equipment -1.52 Marine Corps Managed Supplies, Materials, and Equipment 5.35 Defense Logistics Agency (DLA) Managed Supplies, Materials, and Equipment -4.40 Army Industrial Operations 3.12 Navy Fleet Readiness Centers (Aviation) 0.14 Marine Corps Depot Maintenance 3.24 Air Force Consolidated Sustainment Activity Group (Maintenance) -2.98 Air Force Consolidated Sustainment Activity Group (Supply) -1.15 Navy Facility Engineering Command -9.69 Navy Military Sealift Command (Navy Fleet Auxiliary Force) 27.80 Navy Military Sealift Command (Special Mission Ships) -2.60
4

OPERATION AND MAINTENANCE TITLE SUMMARY
OPERATION AND MAINTENANCE TITLE SUMMARY
USTRANSCOM Channel Cargo 1.80 USTRANSCOM Channel Passenger 1.80 USTRANSCOM Flying Training (C-5 and C-17) 31.90 DLA Distribution -.052 DLA Document Services 5.65 Defense Finance and Accounting Service (DFAS) – Army -10.39 Defense Finance and Accounting Service (DFAS) – Navy 1.42 Defense Finance and Accounting Service (DFAS) – Air Force -0.12 Defense Finance and Accounting Service (DFAS) – Marine Corps 2.50 Defense Finance and Accounting Service (DFAS) – Defense Logistics Agency 13.49 Defense Finance and Accounting Service (DFAS) – Other Defense Agencies 1.76 Defense Information Systems Agency (DISA) – Computing Centers -0.74 DISA Defense Telecommunication Services – DISN 1.90 DISA Defense Telecommunication Services – Reimbursable 7.80
5

ARMY
ARMY
$ in Millions
FY 2013/1
Actual Price
Growth Program Growth
FY 2014/2 Enacted
Price Growth
Program Growth
FY 2015/3 Estimate
64,804.6 1,154.5 -35,319.2 30,643.9 241.0 2,355.3 33,240.1
Numbers may not add due to rounding
1 FY 2013 includes Overseas Contingency Operations (OCO) funding 2 FY 2014 enacted excludes $32,369 million in OCO funding including $3,144 million of base funds transferred to OCO 3 FY 2015 excludes OCO funding
The Operation and Maintenance, Army (OMA) appropriation funds the recruiting, organizing, sustaining, equipping, and training of the Army's All- Volunteer Force for the conduct of prompt and sustained land combat operations in support of Geographic Combatant Commands (GCCs). Additionally, OMA resources fund vital programs supporting Soldiers, civilians, and their families in the day-to-day operations of 74 installations worldwide. More specifically, the appropriation funds the Army's ground and air operating tempo (OPTEMPO), flying hours, fuel, supplies, and the maintenance of weapons systems and aircraft. It funds quality of life activities, specialized services for Soldiers, civilians, and their Families. It also funds educational and career development programs for Soldiers and civilians. OMA resources the Army's management structure; logistics; command, control, and communication programs; the Department of Defense's contribution to the North Atlantic Treaty Organization (NATO); and Army support responsibilities for U.S. Africa Command (AFRICOM), U.S. European Command (EUCOM), U.S. Southern Command (SOUTHCOM), and U.S. Forces Korea (USFK). OMA supports 490,000 Soldiers, which the Army has begun to organize into fewer, more capable Brigade Combat Teams (BCTs), meeting operational demands of the GCCs. Additionally, it employs 106,049 full-time civilian employees. The OMA budget increased by $2,596 million; $241 million resulting from pricing adjustments (e.g. inflation, fuel, foreign currency adjustments) and $2,355 million supporting programmatic increase. The largest contributor to this overall increase is the restoral of the $3,144 million in funding for base functions transferred to OCO in the FY 2014 Consolidated Appropriations Act. The budget submission enables the Army to be adaptable and prepared for uncertainty in the future. It allows the Army to meet known strategic requirements that support a strategy of Prevent, Shape, and, (when called upon) Win!
6

ARMY
ARMY
OVERALL ASSESSMENT: This submission reflects the Army transitioning to a smaller, more lethal fighting force that continues to contribute vital land forces trained in full spectrum operations; this transition shifts readiness focus from counterinsurgency that was critical in support of war to the capability to win decisively, if called upon to do so. We are focused on developing a leaner, smaller Army that remains the most highly-trained and professional All-Volunteer land force in the world; one that is uniquely organized with the capability and capacity to provide expeditionary, decisive land power to the Joint Force, and is ready to perform the range of military operations in support of Geographical Combatant Commanders (GCCs) to defend the Nation and its interests at home and abroad, both today and against emerging threats.
The Army remains committed to sound fiscal stewardship of resources provided by Congress and the American people. As such, this FY 2015 budget continues to realize the previously approved efficiencies and enhancements while identifying new opportunities for divestitures, consolidations, and savings. The Army continues to implement institutional reforms by streamlining its business practices and seeking opportunities to leverage technology for innovative and less costly ways of doing business. The Army begins a strategic efficiency reduction in management headquarters funding and staffing aligned to support a smaller military force. As a result this budget estimate reduces civilian authorizations in concert with troop end-strength reductions and reduces contractor funding associated with institutional reforms. The Army strategic objectives and areas that that shaped this budget submission are: • Globally Responsive and Regionally Engaged Army. - Army Contingency Force (ACF): The FY 2015 budget enables the Army to develop a contingency response force which
provides GCCs an initial response capability with the necessary readiness to achieve early objectives for most contingency plans. This force consists of a mix of Infantry, Armor, and Stryker BCTs, an aviation task force, and associated enabling units. This budget funds the highest training level for the ACF BCTs and sustains or improves the readiness in critical enabling formations.
- Support Global Operations with Ready Land Power: Operational adaptability is the ability to shape conditions and respond
effectively to a changing operational environment with appropriate, flexible and timely actions. This budget funds decisive action training at home station and the combat training centers training initiatives including the continued implementation of the Live, Virtual, and Constructive - Integrated Training Environment.
7

ARMY
ARMY
- Regionally Aligned Forces (RAF): The goal of regionally aligned forces is to provide GCCs predictable, task-organized, and responsive capabilities to achieve Global Employment of the Force end states and meet other requirements across the full range of military operations, to include joint task force-capable headquarters, crisis or contingency response, operations support, theater security cooperation, and bilateral or multilateral military exercises.
• Adaptive Army Leaders for a Complex World. Adaptive leader development is an Army top priority. The goal is to retain tactical competence while cultivating strategic perspective. The Army will grow the intellectual capacity among Soldiers and civilians to understand the complex contemporary security environment. The FY 2015 budget provides funds for professional military education and the institutional training necessary for Army leaders to effectively operate in a joint and combined environment. This budget provides funding for 8.9K officers, 7.5K Warrant; and 61K Non Commissioned Officers (NCO) to enter and or continue progressive professional military education; this includes 150 officer seats at the School of Advanced Military Studies (SAMS). Additional funding is requested for Army Civilian leader development to ensure that the cadre of civilian leaders is retained and current. High quality Soldiers and civilians are essential to build the Army for the future; the Army's ability to provide strategic land power depends on the quality of its leaders. • Ready and Modern Army. - BCT Reorganization: The budget supports continued reorganization of the Infantry, Armor and Stryker BCTs, adding a third
maneuver battalion, while reducing to 32 BCTs in FY 2015 and eliminating excess headquarters infrastructure.
- Headquarters Reduction: In 2015 the Army begins reducing the manning of the two-star and above headquarters, corresponding allocations to Combatant Commands (COCOM), and allocations to North Atlantic Treaty Organization (NATO) by 20 percent.
- Aviation Restructuring Initiative: The Aviation Restructuring Initiative (ARI) is a resource informed plan that will restructure the Army’s aviation formations across the Active, Guard, and Reserve components to achieve a leaner, more efficient and capable force that balances operational capability and flexibility across the Total Force.
- Business Transformation: The Army continues to transform its business operations to achieve efficiencies, greater effectiveness
and accuracy. The Army is working to reduce business portfolio costs by almost ten percent annually by capitalizing on
8
ARMY
ARMY
eliminating legacy systems that are replaced by fielding Enterprise Resource Planning systems. Business process reengineering and continuous process improvement efforts continue to confer significant financial and operational benefits.
- Installations and Environment: The Army's 2015 strategy for base operating services prioritizes funding for Life, Health and
Safety programs and services ensuring Soldiers are trained and equipped to meet the demands of our nation. The budget funds facility sustainment at 62 percent of the OSD Facility Sustainment Model (FSM). Net Zero, the Army’s natural resources management policy, is the foundation of the Army strategy for achieving long-term sustainability and resource security goals. Net Zero also supports compliance with a variety of Federal mandates and statutes such as those contained in Executive Order (EO) 13514, the Energy Policy Act of 2005 (EPAct05), and the Energy Independence and Security Act (EISA) of 2007. Net Zero allows the Army to continue climate change adaptation and mitigation efforts and develop a strategy for all Army installations.
• Soldiers Committed to a Professional Army. - The Army is an organization strengthened by shared professional values. Sexual harassment / assault in all its forms are abhorrent
to every one of those values. Prevention of Sexual Assault is a Secretary of the Army top priority. The FY 2015 budget increases resources for prosecutors, investigators and special victim paralegals at multiple installations around the world. Efforts are synchronized in the Army's Sexual Harassment / Assault Response and Prevention (SHARP) Program.
• Premier All Volunteer Army - Soldier and Family Programs: The Army remains committed to soldier quality of life programs to include: Suicide prevention,
Morale, Welfare and Recreation (MWR), child care, and assistance for substance abuse. The Army remains focused on improving access and predictability of services in programs that reinforce holistic fitness, mitigate stress, and build resilience. These prevention-focused initiatives include the Comprehensive Soldier and Family Fitness (CSF2), Army Substance Abuse Program (ASAP), Sexual Harassment Response and Prevention Program (SHARP), and Suicide Prevention, and Soldier and Family Assistance Centers (SFACs).
- Man the Army and enhance the All-Volunteer Force: The Army strives to retain the capabilities of a combat seasoned force
and maintain the trust of soldiers and families while responsibly reducing numbers to achieve a smaller, balanced force. The Army continues to attract high quality Soldiers and Civilians from diverse backgrounds. The FY 2015 enlisted recruiting mission is 57,000 Soldiers.
9

ARMY
ARMY
Budget Activity 1: Operating Forces $ in Millions
FY 2013/1
Actual Price
Growth Program Growth
FY 2014/2 Enacted
Price Growth
Program Growth
FY 2015/3 Estimate
44,969.9 593.3 -27,588.3 17,974.9 184.7 1,859.1 20,018.7
Numbers may not add due to rounding
1 FY 2013 includes Overseas Contingency Operations (OCO) funding 2 FY 2014 enacted excludes $25,122 million of OCO funding including $2,444 million of base funds transferred to OCO 3 FY 2015 excludes OCO funding The Operating Forces budget activity provides funding for day-to-day operations of the ground and air units, installations, and Soldiers required for the training and readiness of combat elements. This budget activity consists of three activities: Land Forces, Land Forces Readiness, and Land Forces Readiness Support. Land Forces provides for the resourcing of the ground and air operating tempo (OPTEMPO) training for all Brigade Combat Teams (BCTs), modular support brigades, echelons above brigade, theater level assets, land forces operations support, aviation assets, and special operations forces. The Land Forces Readiness activity funds training support centers, training areas, ranges and operations, battle simulation centers, and active component support to the reserve components; and the depot level maintenance for hardware, software, and equipment associated with Army weapons systems. Land Forces Readiness Support provides for the Active Army's installation services worldwide; ensuring an environment in which Soldiers, civilians and families can thrive, and provides a structure that supports an expeditionary Army with information and community services, municipal services, logistics, and security; maintains and sustains the Army's facilities, restores facilities to industry standards; and modernizes facilities to meet the full range of tasks necessary to provide relevant and ready land power for this Nation; finances the day-to-day operations of Army Management Headquarters activities as well as the three assigned GCCs’ core and direct missions. After accounting for pricing of $185 million, there was an overall increase to programs of $1,859 million, primarily due to the realignment of $2,445 million as a result of the FY 2014 Congressional realignment from base to OCO in FY 2014 Consolidated Appropriations Act. The funding increases for Land Forces is to support the Army's plan to resource an Army Contingency Force (ACF) to meet time-sensitive employment requirements, while funding remaining non-assigned AC ground units at the highest training readiness levels attainable based on available resources. The Army resources an adjusted force structure that will provide fewer, but more capable BCTs. In FY 2015, the Army supports the posture of land forces in the Asia-Pacific region by leveraging training opportunities and
10

ARMY
ARMY
exercises with allies in this region to promote and strengthen partnerships. Forward stationed forces in the Republic of Korea will remain ready, as will those dedicated to Global Response Force requirements. In accordance with the Secretary’s initiative, the Army is reducing its management headquarters at all two star commands and above, as well as the Combatant Command headquarters. In addition, the Army is pursing reductions in contract services and funds facility sustainment to 62% of the Department of Defense Facilities Sustainment Model Requirement.
11
ARMY
ARMY
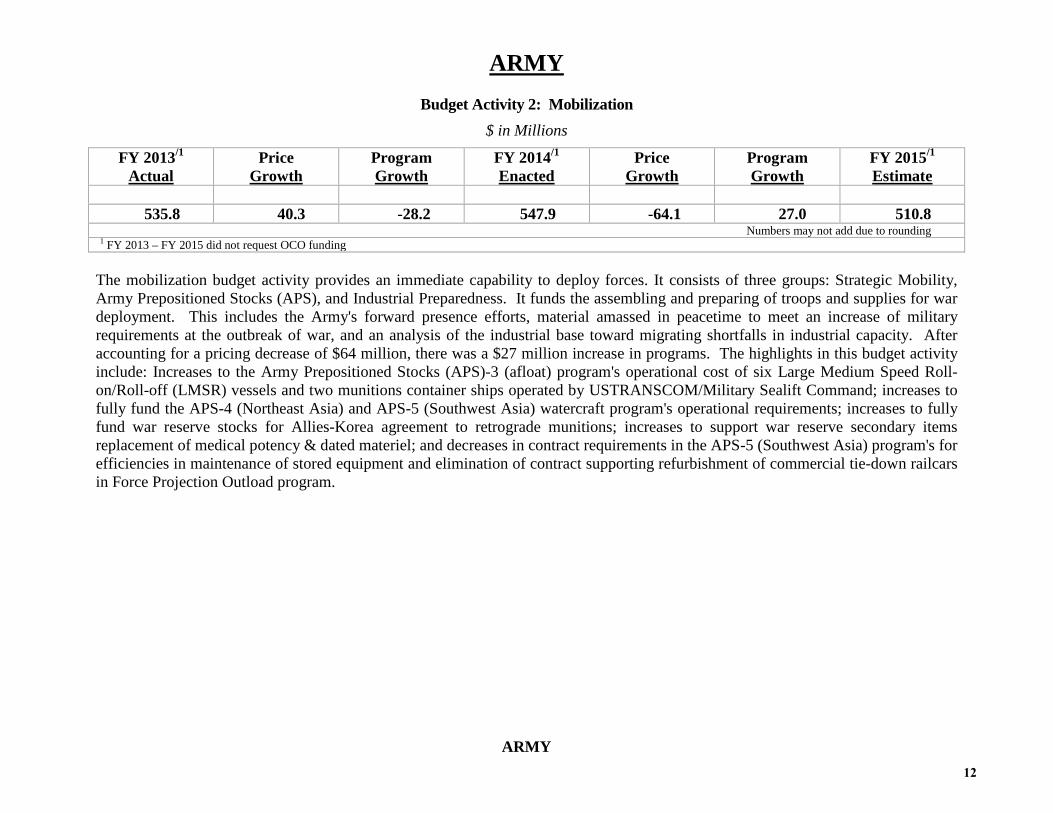
Budget Activity 2: Mobilization $ in Millions
FY 2013/1
Actual Price
Growth Program Growth
FY 2014/1 Enacted
Price Growth
Program Growth
FY 2015/1 Estimate
535.8 40.3 -28.2 547.9 -64.1 27.0 510.8
Numbers may not add due to rounding 1 FY 2013 – FY 2015 did not request OCO funding The mobilization budget activity provides an immediate capability to deploy forces. It consists of three groups: Strategic Mobility, Army Prepositioned Stocks (APS), and Industrial Preparedness. It funds the assembling and preparing of troops and supplies for war deployment. This includes the Army's forward presence efforts, material amassed in peacetime to meet an increase of military requirements at the outbreak of war, and an analysis of the industrial base toward migrating shortfalls in industrial capacity. After accounting for a pricing decrease of $64 million, there was a $27 million increase in programs. The highlights in this budget activity include: Increases to the Army Prepositioned Stocks (APS)-3 (afloat) program's operational cost of six Large Medium Speed Roll-on/Roll-off (LMSR) vessels and two munitions container ships operated by USTRANSCOM/Military Sealift Command; increases to fully fund the APS-4 (Northeast Asia) and APS-5 (Southwest Asia) watercraft program's operational requirements; increases to fully fund war reserve stocks for Allies-Korea agreement to retrograde munitions; increases to support war reserve secondary items replacement of medical potency & dated materiel; and decreases in contract requirements in the APS-5 (Southwest Asia) program's for efficiencies in maintenance of stored equipment and elimination of contract supporting refurbishment of commercial tie-down railcars in Force Projection Outload program.
12

ARMY
ARMY
Budget Activity 3: Training and Recruiting $ in Millions
FY 2013/1
Actual Price
Growth Program Growth
FY 2014/1 Enacted
Price Growth
Program Growth
FY 2015/1 Estimate
4,541.3 48.8 22.4 4,612.5 68.5 -294.1 4,386.9
Numbers may not add due to rounding 1 FY 2013 – FY 2015 did not request OCO funding The Training and Recruiting budget activity provides funds to assess and train Soldiers and civilians required to man the Army. This budget activity consists of three activity groups: Accession Training; Basic Skill and Advanced Training; and Recruiting, Other Training and Education. Accession Training produces trained Soldiers and officers to meet force structure requirements. Basic skill and advanced training produces technically competent Soldiers. Recruiting, other training and education ensures the Army's able to recruit quality Soldiers and provide continuing education for Soldiers and civilians. Overall, after accounting for pricing of $69 million, there was a decrease to programs of $294 million. This budget reflects a large decrease in contract advisory and assistance services contracts and contractors supporting specialized skill training. The Army is right sizing its flight training program to synchronize the number of direct training seats along with the associated funding. Additionally, the Army reduced enlisted training seats to reflect a reduced Total Army enlisted recruiting mission. Finally, the Army reduced its tuition assistance program through newly implemented policy changes. This budget funds Recruit Training and Initial Entry Training for both officer and enlisted Soldiers. It funds Army programs that continue to recruit and train the force - both active and reserve component - to enhance the Army's Land Force capability. The FY 2015 accession mission for the Senior Reserve Officer Training Corps remains at 5350 and includes a modest funding increase for scholarship tuition costs. The Army continues to attract and retain high quality Soldiers and civilians from diverse backgrounds. The FY 2015 Active Army enlisted recruiting mission is 57,000 Soldiers. The institutional training base directly supports the Army's readiness by graduating technically competent and trained Soldiers. It develops military and civilian leaders that can handle the challenges of a joint, interagency, intergovernmental, and multinational environment.
13

ARMY
ARMY
Budget Activity 4: Administration and Servicewide Activities $ in Millions
FY 2013/1
Actual Price
Growth Program Growth
FY 2014/2 Enacted
Price Growth
Program Growth
FY 2015/3 Estimate
14,757.5 476.1 -7,725.1 7,508.6 51.8 763.2 8,323.6
Numbers may not add due to rounding 1 FY 2013 includes Overseas Contingency Operations (OCO) funding 2 FY 2014 excludes $7,246.9 million of OCO funding including $700 million of base funds transferred to OCO 3 FY 2015 exclude OCO funding
The Administration and Servicewide Activities funds the administration, logistics, communications, and other servicewide support functions required to support Army forces worldwide. This budget activity consists of four activities: Security Programs, Logistics Operations, Servicewide Support and Support of Other Nations.
Overall, after accounting for pricing of $52 million, there was a program increase of $763 million, primarily due to the realignment of $700 million resulting from the base to OCO transfer in the FY 2014 Consolidated Appropriations Act. There are programmatic increases for personnel security investigations, logistics operations in support of equipment and secondary items, the incremental ramp up of the Armed Forces DNA Identification Laboratory (AFDIL), and the U.S. share of NATO's call for funds to include the procurement of the new Alliance Ground Surveillance (ASG) system. There are reductions in Civilian Full Time Equivalents (FTEs) and related costs, contract support, and a strategic efficiency reduction in management headquarters funding and staffing to support a smaller military force.
14

NAVY
NAVY
$ in Millions
FY 2013/1
Actual Price
Growth Program Growth
FY 2014/2
Enacted Price
Growth Program Growth
FY 2015/3,4 Estimate
44,788.4 20.8 -8,965.6 35,843.7 -669.4 2,803.7 39,316.9
1 FY 2013 includes Overseas Contingency Operations (OCO) funding Numbers may not add due to rounding 2 FY 2014 enacted excludes $8.4 billion of OCO funding including $2.6 billion of base transferred to OCO 3 FY 2015 excludes OCO funding 4 FY 2015 includes $291.1 million that will transfer to DOT/MARAD The Operation and Maintenance, Navy (OMN) appropriation finances the day-to-day costs of operating naval forces, including fuel, supplies, and ship maintenance, Navy and Marine Corps aircraft maintenance, related weapon systems maintenance, and the support establishment ashore. The primary focus of the Department of Navy (DoN) FY 2015 budget is to continue to ensure the readiness of deployed forces, providing the nation offshore options to deter and defeat aggression today and into the future. In this challenging time, this budget balances procurement with operations, having reviewed every decision and made the best possible choices. The Navy continues to scrutinize every option to provide the most affordable, versatile and effective budget. Despite drawdown, the Navy will continue to support non-traditional joint requirements around the globe, and the force will continue a renewed focus on Asia and the Pacific. The Navy will remain a global force with the ability to provide credible deterrence anywhere. Together with the Marine Corps, the Navy constitutes the nation’s forward rotational force, operating globally at sea and on land. The Navy will continue to provide a balanced blend of peacetime engagement and major combat operational capabilities. FY2015 funding supports Combatant Commander OPTEMPO requirements and sustains enduring steaming day (45/20) deployed/non-deployed and flight hour (T-2.5/T-2.0 Navy/Marine Corps) readiness requirements.
OVERALL ASSESSMENT: The FY 2015 estimate of $39,316.9 million includes a price decrease of $669.4 million. This price change primarily results from increases in general inflation changes ($220.8 million), civilian pay ($80.4 million), and transportation ($3.0 million), Working Capital Fund (WCF) rate costs ($304.4 million), and fuel ($49.9 million). This budget reflects an overall program increase of $2,803.7 million. The program increases between FY 2014 to FY 2015 by approximately 9.7 percent. Program growth is primarily a result of restoring the FY 2014 base to OCO transfer of $2.6 billion in the FY 2014 Consolidated Appropriation Act. When the base to OCO transfer is considered, the real rate of program growth is approximately 2.3 percent.
Commencing in FY 2015, the National Defense Sealift Fund is expected to be eliminated with the funds being allocated into multiple Navy accounts, including the Operation and Maintenance Account. The DoN projects the $291.1 million will be transferred to the
15

NAVY
NAVY
Department of Transportation -Maritime Administrations (MARAD) National Defense Reserve Fleet account for the Ready Reserve Force. This will allow MARAD to utilize resources of both DoD and MARAD to purchase vessels for the National Defense Reserve Fleet.
Included in this appropriation are costs for bio-fuel, supplemented with Department of Agriculture, Commodity Credit Corporation funds for costs above market price for petroleum-based fuel, in support of a sustainable commercial bio-fuels industry.
Budget Activity 1: Operating Forces $ in Millions
FY 2013/1
Actual Price
Growth Program Growth
FY 2014/2 Enacted
Price Growth
Program Growth
FY 2015/3 Estimate
36,987.0 -54.2 -8,246.9 28,685.7 484.2 2,449.2 31,619.2
Numbers may not add due to rounding 1 FY 2013 includes Overseas Contingency Operations (OCO) funding 2 FY 2014 enacted includes $8,215.6 million of OCO including $2,609 million of base transferred to OCO 3 FY 2015 excludes OCO funding
The Operating Forces budget activity funds the Navy’s air operations, ship operations, combat operations/support, and weapons support programs, including the maintenance and repair of airframes, weapons systems, and ships performed by Navy personnel and civilians, other public assets, as well as a variety of private/commercial sources. Included in this budget activity are the costs associated with operating Navy shore bases to support these missions. Also included are the funds required to maintain combat ready forces necessary to respond to national objectives in joint, naval and combined operations. It supports the forward presence and crisis response capabilities of the National Military Strategy. This budget activity supports the specific funding for 45 underway days per quarter for deployed forces and 20 days per quarter for non-deployed forces. Ship maintenance is funded to 80 percent of the requirement in this baseline budget, and Navy/Marine Corps flying hours are budgeted at a T-2.5/2.0 rating. Included in this budget activity are the costs associated with operating Navy shore bases to support these missions.
The FY 2015 budget estimate of $32,619.2 million includes a price increase of $484.2 million and program increases totaling $2,449.2 million (10.2 percent). The program growth is the result of the FY 2014 Consolidated Appropriation Act, transferring $2.6 billion of base funding from the readiness programs to the OCO. In FY 2015, funds are restored to the programs; however, this fiscally constrained environment requires the DoN, to make difficult choices between force structure and readiness. The FY 2015 Operating Forces program attempts to balance these elements and is the result of making difficult tradeoffs.
16

NAVY
NAVY
The Operating Forces funding includes force structure and efficiencies changes, of which $759.3 million results from implementation of efficiencies, including: the initial phase of strategic management headquarters reductions; simplified travel policies and procedures to reflect modern day expenditures; implementation of a DoN initiative to reduce contractual services spend by consolidating requirements, standardizing products, and/or promoting competition for contractual spend in principal areas of: knowledge based services, equipment related services, and communications related services. Other major program changes include: • Air Operations reflects an increase of $1,079.7 million, with a $45.6 million price increase and a $1,034.1 million increase in
programmatic costs. Major program changes costing more than $10 million include:
– Increase of $1.0 billion as a result of the FY 2014 congressional realignment in the FY 2014Consolidated Appropriations Act various base costs to OCO.
– Increase of $133.8 million for one-time Congressional reduction for Non-NIP funding.
– Increase of $35.5 million supports an additional 3,417 flying hours, partially offset by a decrease in contract maintenance costs for USMC AV-8B aircraft.
– Increase of $33.2 million reflects updated cost projections for nine additional aircraft and associated 8,465 flying hours supporting the continued transition of the Marine Corps medium lift helicopter platform CH-46E to the MV-22B Osprey tilt-rotor tactical aircraft. The Marine Corps MV-22B platform is capable of operating from ships or from expeditionary airfields ashore providing assault transport for troops, equipment and supplies.
– Increase of $28.0 million reflects an additional 16,532 flying hours for USN FA-18A/C/D/E/F aircraft, partially offset by a decrease in force structure (5) for FA-18C aircraft. These movements are in alignment with the Master Aviation Plan to manage strike fighter force structure as the force continues transitioning to Super Hornets and eventually the Joint Strike Fighter.
– Increase of $26.0 million represents transportation costs for ready for issue aviation parts, organic aviation support equipment and maintenance tools for Navy and Marine Corps squadrons.
– Increase of $16.6 million reflects net growth of 4,122 flying hours and growth in force structure (5) for USMC Fleet Air Support aircraft supporting various fleet support platforms including the UH-1Y and White House helicopters.
– Increase of $12.3 million reflects an additional 2,922 flying hours for USMC KC-130J aircraft due to an increase in the total number of aircrews assigned. This type/model/series is a congressionally directed program to replace the KC-130F/R.
– Increase of $10.4 million represents updated cost projections for two additional aircraft and associated flying hours (1,664) in support of the DoN’s continued transition of the EA-6B Prowler to the EA-18G Growler fulfilling the electronic warfare requirements of the new super hornets.
17

NAVY
NAVY
– Decrease of $88.6 million reflects the reversal of FY 2014 one-time increase supporting the initial lay-in of spares to establish inventory levels required to support replenishing consumables and repairables for the Navy's FA-18E/F Super Hornet series as a result of the Navy's transition from contractor to organic management of the spares inventory.
– Decrease of $62.5 million reflects FY 2014 one-time congressional increase for the Special Purpose Marine Ground Task Force – Crisis Response (Aviation) Program.
– Reduction of $62.9 million reflects the DoN initiative to reduce contractual services spend by validating derived requirements, accepting higher levels of risk in services spending, and implementing efficiencies where possible by consolidating requirements, standardizing products, and/or promoting competition for contractual spend in four principal areas: knowledge based services, research and development, equipment related services, and communications related services.
– Decrease of $41.0 million represents updated cost projections for various programs including Marine air traffic control and landing system, Fleet Area Control and Surveillance Facility, operational staff, squadron temporary additional duty and commercial air services.
– Decrease of $17.1 million associated with the continuing transition of the Navy's SH-60B, SH-60F, and HH-60H type/model/series to the MH-60R Seahawk and USN MH-60S Knighthawk with a reduction of 3,645 flight hours.
– Decrease of $12.8 million represents reduced costs for information technology related supplies and materials, communications services and equipment maintenance, software and related training for staffs and fleet squadrons.
• Ship Operations increased by a net of $592.8 million, including price increase of $166.8 million and programmatic changes of $425.9 million. Major program changes costing above $10 million include:
– Program growth of $609.8 million as a result of the FY 2014 congressional realignment in the FY 2014 Consolidated Appropriations Act, for various base to OCO costs.
– Increase of $511 million for the OCO to base transfer of ship consumables, repair parts, fuel, and administration commensurate with the increase in baseline OPTEMPO deployed and non-deployed days from 51/24 to 45/20.
– Increase of $33.5 million representing full year operating costs for Joint High Speed Vessels (JHSVs), providing intra-theater transportation of troops, military vehicles and equipment throughout fleet operating forces.
– Program decreases of $518.0 million representing the Base to OCO transfer of funds for repair parts, ship consumable supplies, administrative and fuel with a decrease in deployed and non-deployed OPTEMPO from 51/24 to 45/20 per quarter.
– Decrease of $71.5 million for the change in operating status from full operating status to reduced operating status for multiple Combat Logistics Ships (CLF).
18

NAVY
NAVY
– Decrease of $48.6 million for repair parts supporting organizational maintenance, consumable supplies, projected force protection equipment and port service requirements for port visits.
– Decrease of $48.2 million represents reduced operation cost due to deactivation of a CLF ship.
– Decrease of $23.2 million to stand down four Guided Missile Cruisers (CG) and place them in a phased modernization process.
• Ship Maintenance increased by a net of $1,190 million, including price increase of $20.4 million and programmatic increases of $1,169 million. Major program changes costing above $10 million include:
– Program growth of $1.0 billion as a result of the congressional realignment in the FY 2014 Consolidated Appropriations Act for various base costs to OCO.
– Increase of $163.8 million in Miscellaneous Restricted and Technical Availabilities due to an increase in material and contract cost for: (1) CVN other productive work (OPW), engineering support services, elevator support, catapult material, combat systems support, underwater hull cleaning and habitability; and (2) SSN OPW for shafts and touch labor.
– Increase in non-depot/intermediate maintenance due to increase in contract and material costs associated with: (1) total ship readiness assessments; (2) fleet technical assist at regional maintenance centers; (3) extended refueling overhaul support; (4) Trident Refit Facility support.
– Increase of $62 million due to increased scope and complexity for the scheduled inductions of two planned incremental availabilities.
– Increase of $36.9 million in reimbursable overhead due to increase in applied overhead and scheduled reimbursable workload at mission funded Naval shipyards.
– Decrease of $145.6 million for the stand down of four CGs and place them in a phased modernization process.
– Reduction of $75.8 million for the contractual services initiative spend by validating derived requirements, accepting higher levels of risk in services spending, and implementing efficiencies where possible by consolidating requirements, standardizing products, and/or promoting competition for contractual spend in four principal areas: knowledge based services, research and development, equipment related services, and communications related services.
• Facility Sustainment, Restoration and Modernization (FSRM) program reflects a net decrease of $194.2 million, including price growth of $25.8 million and programmatic decreases in modernization and demolition resulting in a decrease of $220 million. The Navy FSRM program is funded at 70% of the sustainment goal in FY 2015. Major program changes above $10 million include:
– Decrease of $161.5 million associated with adoption of Facilities Sustainment Model (FSM) 15.4 and reducing sustainment program to 70%.
19
NAVY
NAVY
– Decrease of $118.8 million reflects a reduction in renovating Sailor barracks with quality condition level 4, vice quality condition level 3 and level 4.
– Realigns $45.1 million to Navy Working Capital Funds (NWCF) to fund (1) Industrial Control System-Supervisory Control and Data Acquisition, Advance Metering Infrastructure, and Smart Grid program; and (2) to fund the DoN energy program in support of the utilities energy major maintenance repair program.
– Decrease of $81.5 million balances funding levels across Navy installations which reduces facility maintenance funding at United States Naval Academy, Naval War College, and Naval Postgraduate School and reverts recapitalization efforts to FY 2003 levels at public shipyards and air depots.
– Realigns $49.6 million to NWCF Military Construction, Navy (MCN) within DoN energy program for steam system decentralization at Naval Base San Diego.
– Reduction of $44.7 million reflects a pause in the FY 2015 demolition program.
• Base Support decreased by $127.7 million, including price adjustment of $3.8 million and program decreases of $123.9 million. Major program changes costing above $10 million include:
– Transfer of $16.6 million to consolidate funding for telecommunications to provide uniform payment of services by Naval Computer and Telecommunications Area Master (NCTAMS) Atlantic and Pacific on behalf of Navy and other federal customers. This realignment supports ongoing audit readiness efforts.
– Increase of $19.4 million for the one-time costs for the Buzzard's Point GSA lease in FY15 for Naval Sea Systems Command Headquarters.
– Increase of $41 million to improve output levels in facility services, operating hours in port/air operations, and improvement in facility thermostat settings in support of DON's quality of service initiative.
– Increase of $18 million for additional federal firefighters at public shipyards and installations with submarines to address safety and security issues uncovered as a result of the investigation into the USS MIAMI arson event.
– Increase of $14.8 million for the facility lease requirements for Fleet Cyber Command at Lake View Technology Park in Suffolk, Virginia.
– Realignment of $10.6 million from Operation and Maintenance, Defense-Wide account for the Transition Assistance Program and support personnel.
– Increase of $10.0 million for the expected increase in lease costs for Camp Lemonnier, Djibouti.
– Decreases of $90.0 million for multiple one-time congressional increases in FY 2014.
20

NAVY
NAVY
– Decrease of $57.5 million associated with reductions from programmatic changes and historical under-execution of multiple programs initiatives, including lower disability compensation claims and utility consumption; under-execution of collateral equipment coinciding with delays in MCN program; cost savings from transportation and facility management contracts and services; and from the consolidation of Regional Operation Centers (ROCs).
– Decrease of $57.2 million from savings associated with elimination of redundant functions between Navy Installations Command and Naval Facilities Installations Command.
– Decrease of $15.7 million for savings anticipated through manning reductions at automated base entry control points associated with Navy Physical Access Control System (NPACS) - Entry Gate Control.
– Decrease of $12.6 million associated with reductions in facility leasing, furnishings, and material requirements in the Veteran's Employment Initiative program.
• Enterprise Information Technology decreased by $172.3 million, including price growth of $17.6 million and program decrease of $189.9 million. Major program changes costing above $10 million include:
– Transfer of $25.4 million from various OMN/Reserve budget lines Enterprise Information Technology for the proper realignment of seats and services as a result of the award of the Next Generation Enterprise Network (NGEN) contract.
– Increase of $33.2 million to centrally fund CORE Oracle contract requirements.
– Decrease of $107.6 million for FY 2014 one-time congressional increase for the transfer of Other Procurement, Navy funding to OMN for NGEN.
– Decrease of $103.4 million for NGEN seat services as the Navy transitions from the Contingency of Services Contract (CoSC) to NGEN.
– Decrease of $27.1 million for Navy Enterprise Resource Planning (NERP) centralized program as the program transitions to sustainment.
– Decrease of $18.7 million for data center and application optimization to maximize cost savings and cost avoidance while increasing efficiency and standardization of Navy data center sustainment.
• Combat Operations and Support increases by $114.5 million, including price increase of $118.7 million and program decrease of $4.2 million. Major program changes above $10 million include:
– Increase of $51.6 million to support all Naval connectivity to the Global Information Grid (GIG) via Defense Information System Network (DISN) Subscription Service (DSS), access circuits, and last half mile support.
– Increase of $13.1 million for critical surface and expeditionary training wholeness requirements identified by OPNAV, Fleet, NETC,
21

NAVY
NAVY
BUPERS, NAVSEA and CYBER, NECC and Surface TYCOM(s) Surface and Expeditionary Warfare Training Committee (SEWTC).
– Increase of $11.4 million associated with administrative and maintenance support for Littoral Combat Ship (LCS) sea frames, associated mission packages and future LCS platforms.
– Increase of $10.4 million for DISA's award of a new sole-source Enhanced Mobile Satellite Services (EMSS) Airtime fixed cost contract that allows EMSS customers unlimited airtime and an unlimited number of devices. As a result of this contract award, DISA will change the EMSS cost recovery method from a rate based recovery method to fixed price.
– Decrease of $54.8 million to support costs as part of force structure reduction efforts.
– Decrease of $22.3 million in Air Mobility Command channel cargo fuel to transport personnel and equipment into and out of the 5th Fleet Area of Responsibility (AOR) and commercial transportation for US Transportation Command (TRANSCOM) surcharge.
– Decrease of $20.1 million due to inactivation of Oceanographic Survey Ship, USNS Sumner (T-AGS-61).
– Decrease of $15.3 million associated with the conversion of Coastal Riverine forces from active to reserve units.
• Weapons Support increases by $72 million, including price increase of $22.5 million and program growth of $49.9 million. Major program changes above $10 million include:
– Increase of $21.8 million to Integrated Warfare Systems (IWS) Close-In Weapon System (CIWS) for an additional six Class "A" overhauls of CIWS systems and support fleet logistic support/questions, safety, maintenance and operational technical questions via distant support, emails, hotline request and help desk requests and technical assistance ship visits.
– Increase of $12.5 million for the Tactical Tomahawk (Block IV) restoration of stockpile monitoring, maintenance, and support requirements previously deferred.
22

NAVY
NAVY
Budget Activity 2: Mobilization $ in Millions
FY 2013/1
Actual Price
Growth Program Growth
FY 2014/2 Enacted
Price Growth
Program Growth
FY 2015/3,4 Estimate
1,458.9 -25.6 -753.5 679.8 77.8 465.7 1,223.3
Numbers may not add due to rounding 1 FY 2013 includes Overseas Contingency Operations (OCO) funding 2 FY 2014 excludes $18.5 million of OCO funding. 3 FY 2015 excludes OCO funding
4FY 2015 includes $291.1 million that will transfer to DOT/MARAD The Mobilization budget activity maintains assets that will support forces that rapidly respond to contingencies throughout the world. Also funded are the maintenance, overhaul, and calibration requirements of Navy-Type Navy-Owned (NTNO) equipment installed on Coast Guard ships and aircraft. Additionally, this program funds the inactivation of ships, submarines, and aircraft and includes the maintenance of selected inactive ships and aircraft as well as material disposal costs. The program is divided into three functional areas: (1) Ship Prepositioned and Surge, (2) Activations/Inactivations, and (3) Mobilization Preparedness. Commencing in FY 2015, the National Defense Sealift Fund (NDSF) is eliminated with the funds being allocated into multiple Navy accounts, including the Operation and Maintenance Account. The Department projects the $291.1 million will be transferred to the Department of Transportation -Maritime Administrations (MARAD) National Defense Reserve Fleet account for the Ready Reserve Force. The FY 2015 estimate of $1,223.3 million includes a price change of $77.8 million and program increases totaling $465.7 million (79.9 percent). When adjusted for the transfer of $291 million that will transfer to MARAD, the program increase is $174.1 million or 37.1 percent. Major program changes above $10 million include:
– Increase of $152 million for Large Medium Roll-on/Roll-off maintenance, DoD mobilization alterations, and maintenance for Expeditionary Health Services System as a result of the elimination of the NDSF appropriation.
– Increase of $73.3 million for five submarines to undergo Reactor Compartment Disposal (RCD)/Recycling in the nuclear submarine program.
– Increase of $46 million reflects required advance planning funding for the defueling of USS GEORGE WASHINGTON (CVN 73) in FY 2017 as part of force structure reduction efforts.
23
NAVY
NAVY
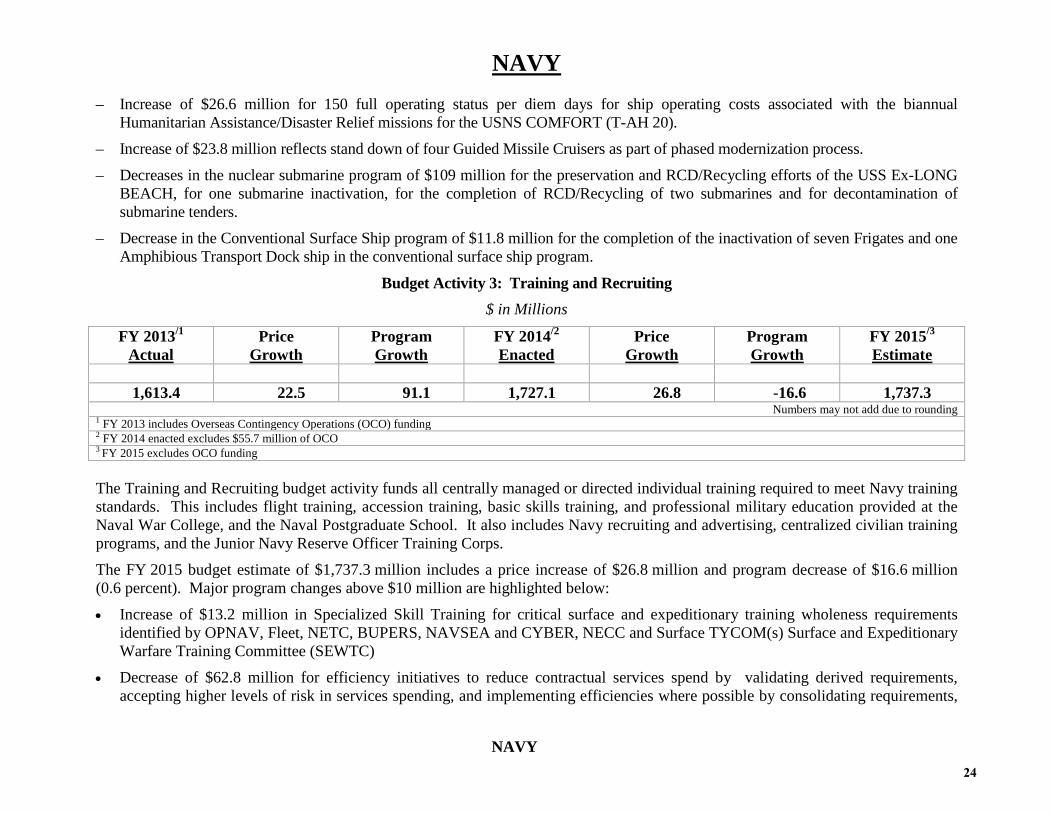
– Increase of $26.6 million for 150 full operating status per diem days for ship operating costs associated with the biannual Humanitarian Assistance/Disaster Relief missions for the USNS COMFORT (T-AH 20).
– Increase of $23.8 million reflects stand down of four Guided Missile Cruisers as part of phased modernization process.
– Decreases in the nuclear submarine program of $109 million for the preservation and RCD/Recycling efforts of the USS Ex-LONG BEACH, for one submarine inactivation, for the completion of RCD/Recycling of two submarines and for decontamination of submarine tenders.
– Decrease in the Conventional Surface Ship program of $11.8 million for the completion of the inactivation of seven Frigates and one Amphibious Transport Dock ship in the conventional surface ship program.
Budget Activity 3: Training and Recruiting $ in Millions
FY 2013/1
Actual Price
Growth Program Growth
FY 2014/2
Enacted Price
Growth Program Growth
FY 2015/3 Estimate
1,613.4 22.5 91.1 1,727.1 26.8 -16.6 1,737.3
Numbers may not add due to rounding 1 FY 2013 includes Overseas Contingency Operations (OCO) funding 2 FY 2014 enacted excludes $55.7 million of OCO 3 FY 2015 excludes OCO funding
The Training and Recruiting budget activity funds all centrally managed or directed individual training required to meet Navy training standards. This includes flight training, accession training, basic skills training, and professional military education provided at the Naval War College, and the Naval Postgraduate School. It also includes Navy recruiting and advertising, centralized civilian training programs, and the Junior Navy Reserve Officer Training Corps.
The FY 2015 budget estimate of $1,737.3 million includes a price increase of $26.8 million and program decrease of $16.6 million (0.6 percent). Major program changes above $10 million are highlighted below:
• Increase of $13.2 million in Specialized Skill Training for critical surface and expeditionary training wholeness requirements identified by OPNAV, Fleet, NETC, BUPERS, NAVSEA and CYBER, NECC and Surface TYCOM(s) Surface and Expeditionary Warfare Training Committee (SEWTC)
• Decrease of $62.8 million for efficiency initiatives to reduce contractual services spend by validating derived requirements, accepting higher levels of risk in services spending, and implementing efficiencies where possible by consolidating requirements,
24

NAVY
NAVY
standardizing products, and/or promoting competition for contractual spend in four principal areas: knowledge based services, research & development, equipment related services, and communications related services.
Decrease of $20.47 million for the Navy Tuition Assistance (TA) Program due to reduced force structure and increased use of GI Bill with an increase for higher than general inflation rate for tuition (6%) at Colleges and Universities across the county.
Budget Activity 4: Administrative and Servicewide Support $ in Millions
FY 2013/1
Actual Price
Growth Program Growth
FY 2014/2 Enacted
Price Growth
Program Growth
FY 2015/3 Estimate
4,728.4 78.9 -56.1 4,751.1 80.6 -94.7 4,737.1
Numbers may not add due to rounding 1 FY 2013 includes Overseas Contingency Operations (OCO) funding and funds budgeted in the Environmental Restoration Account (ER,N) 2 FY 2014 enacted excludes $181 million of OCO funding 3 FY 2015 exclude OCO funding The Administration and Servicewide Support budget activity funds shore based activities required for the effective operation of the DoN. The general services include administration and personnel support costs, engineering and acquisition support, security and investigative support, humanitarian and civic support, management of space and electronic warfare systems programs, and centralized transportation and communications costs.
The FY 2015 budget estimate of $4,737.1 million includes a price growth of $80.6 million and program decreases of $94.7 million (-0.3 percent). Major changes above $10 million include:
• Increase of $47.2 million to support and sustain the Congressional mandate of audit readiness including consolidating telephone resources to provide uniform payment of service for Navy and other customers.
• Increase of $11.0 million in civilian personnel for investigation requirements and support to the Naval Criminal Investigative Services (NCIS) Sexual Assault and Prevention program and Family Sexual violence programs.
• Decrease of $104.7 million for efficiency initiatives to reduce contractual services spend by validating derived requirements, accepting higher levels of risk in services spending, and implementing efficiencies where possible by consolidating requirements, standardizing products, and/or promoting competition for contractual spend in four principal areas: knowledge based services, research & development, equipment related services, and communications related services.
25

NAVY
NAVY
• Decrease of $36.4 million for centralized services; for the Navy portion of the Defense Finance and Accounting Service (DFAS) bill (-$14.8 million) and for the US Transportation Command Distribution Process Ownership bill (-$11.6 million).
• Decrease of $32.1 million in support costs as part of force structure reduction efforts.
• Decrease of $32 million for the first phase of strategic Management Headquarter reductions.
26

MARINE CORPS
MARINE CORPS
$ in Millions
FY 2013/1
Actual Price
Growth Program Growth
FY 2014/2
Enacted Price
Growth Program Growth
FY 2015/3 Estimate
9,167.4 134.0 -3,911.8 5,389.6 61.5 458.4 5,909.5 Numbers may not add due to rounding
1 FY 2013 includes Overseas Contingency Operations (OCO) funding 2 FY 2014 enacted excludes $3,369.8 million OCO funding including $0.7 million of base funds transferred to OCO 3 FY 2015 excludes OCO funding
The Operation and Maintenance, Marine Corps (O&M, MC) appropriation provides the resources for active Marine Corps Forces’ missions, functions, activities and facilities. This appropriation also finances the Operating Forces sustainment requirements, depot maintenance, base operating support costs, training and education requirements, Marine Corps’ headquarters administration and servicewide support requirements. Requirements are driven by the Marine Corps commitment to provide the best trained and equipped troops to current operations while posturing to meet the future global security environment. The Marine Corps’ FY 2015 budget reflects continued transition to the post Operation Enduring Freedom (OEF) Marine Corps, while continuing its commitment to the ongoing conflict in Afghanistan. As the nation’s Expeditionary Force in Readiness, the Marine Corps remains both engaged in Afghanistan and forward deployed across the globe. This appropriation supports the Marine Corps operations at all Marine Corps Bases (MCB), Marine Corps Air Stations (MCAS), Marine Corps Logistics Bases (MCLB), Marine Corps Recruit Depots (MCRD), the Marine Air Ground Task Force Training Center, and the Marine Corps Mountain Warfare Training Center. The principal objective of the supply system is to provide Marine activities/units with the proper material and equipment in the quantity, condition, time, and place required to ensure mission accomplishment. The Operating Forces consist of three Marine Expeditionary Forces (MEF) which consist of a Marine Division (MarDiv), Marine Air Wing (MAW), Marine Logistics Group (MLG), and a MEF Headquarters Group. The MEF can be fully deployed in support of a major regional contingency or it can be task organized to form a Marine Air Ground Task Force (MAGTF) such as a Marine Expeditionary Unit or a Special Purpose Marine Air-Ground Task Force (MAGTF).
OVERALL ASSESSMENT: The FY 2015 budget provides the best trained and equipped Marine units to Afghanistan; rebalances the Corps and posture for the
27

MARINE CORPS
MARINE CORPS
future; better educates and trains Marines to succeed in distributed operations and complex environments; and keeps faith with Marines, Sailors, and families. The FY 2015 O&M,MC budget request of $5,909.5 million reflects a net increase of $519.9 million from FY 2014. The Marine Corps’ FY 2015 O&M,MC budget request focuses on global steady state operations, forward presence, and rapid crisis response. Additionally, it continues the focus on rebalancing to the Pacific, the phased expansion and new mission of the Marine Corps Embassy Security Group (MCESG) and training across the entire range of military operations. Finally, it provides sustainment, maintenance and critical upgrades to equipment capabilities while accepting near term risk in infrastructure sustainment and equipment maintenance. The program changes by budget activity are highlighted below.
Budget Activity 1: Operating Forces $ in Millions
The Operating Forces budget activity funds active Marine Operating Forces organizational operation and maintenance requirements. This budget activity is categorized into two sub-activity groups: Expeditionary Forces and Base Operations Support. The Expeditionary Force Activity finances the operating forces sustainment training and daily operations of the MAGTF, ashore and afloat. The Expeditionary Force Activity also finances the Marine Corps’ depot maintenance, field logistics, and Maritime Prepositioning Force (MPF) programs. The Base Operation Support activity finances Marine Corps’ bases, stations and installations daily operations, which include facility sustainment, restoration and modernization, civilian labor, contracting support, garrison transportation, utilities, other critical infrastructure, land management and local security requirements. Other major programs financed within Base Operation Support Activity include child care, youth development, family service care centers, injury compensation, and installation collateral equipment. The FY 2015 budget request of $4,701.0 million for the Operating Forces reflects a program increase of $494.8 million from the FY 2014 funding level. This budget supports a planned draw-down to 175 thousand active duty force while continuing ongoing operations in Afghanistan and transitioning to support the strategic rebalance to the pacific. The Operating Forces programs most significant increases include: $700.0 million to restore the transfers to OCO in FY 2014; $369.1
FY 2013/1
Actual Price
Growth Program
Growth FY 2014/2 Enacted
Price Growth
Program Growth
FY 2015/3 Estimate
7,572.5 102.4 -3,505.2 4,169.8 36.5 494.8 4,701.0 Numbers may not add due to rounding
1 FY 2013 includes Overseas Contingency Operations (OCO) funding
2 FY 2014 enacted excludes $2,891.5 million OCO funding including $0.7 million of base funds transferred to OCO
3 FY 2015 excludes OCO funding
28

MARINE CORPS
MARINE CORPS
million to support the incremental expansion of the Special Purpose MAGTF capabilities to forward posture Marine Forces in Global Combatant Commander areas of responsibility as a quick reaction force, conduct partnering engagements, military-to-military training, theater security cooperation operations, increased utility costs resulting from the rebalancing to the Pacific, unit deployment resumption, and maintenance and improvements to information technology systems and weapons systems such as the Marine Air Command and Control System, Marine Corps Software Enterprise License Management System, and Standard Accounting and Budgeting Reporting System; $90.4 million for civilian personnel; and $13.9 million for transfers in. The Operating Forces programs most significant decreases include: $423.2 million for reduced contractor support and maintenance to the MAGTF, command, control and communications suite, and next generation enterprise network, and facilities sustainment, restoration and modernization and deferred demolition; $179.5 million for contract services reduction; $40.1 million for end strength reductions; and $29.7 million for civilian personnel.
Budget Activity 3: Training and Recruiting $ in Millions
FY 2013/1
Actual Price
Growth Program Growth
FY 2014/2 Enacted
Price Growth
Program Growth
FY 2015/3 Estimate
842.5 13.2 -132.0 723.7 13.2 -42.6 694.3 Numbers may not add due to rounding
1 FY 2013 includes Overseas Contingency Operations (OCO) funding
2 FY 2014 enacted excludes $108.3 million OCO funding
3 FY 2015 excludes OCO funding
The Training and Recruiting budget activity funds recruiting, advertising, basic and specialized training, training ranges, and educating Marines. The Marine Corps recruits and trains approximately 30,000 enlisted applicants and 2,600 officer candidates per year. This budget activity finances activities for six recruiting districts and initial training for new Marines, officer and enlisted, from basic training to military occupational specialized training. Enlisted Marines begin their training accession at one of two Marine Corps Recruit Depots, where they will transition from private citizens into Marines. Training includes indoctrination into Marine Corps ethos, physical, leadership, and basic military skills training designed to prepare new enlisted Marines for assignment to Operating Forces units, both afloat and ashore. Officer candidates begin their basic training at the Officer Candidate School (OCS) located at Quantico, Virginia. Officer acquisition includes training candidates for appointment as commissioned officers in the Marine Corps and Marine Corps Reserve. Officer candidates undergo detailed instruction in leadership, physical condition, and basic military skills prior to receiving their commissioning.
29

MARINE CORPS
MARINE CORPS
Upon completion of OCS or Recruit Training, Marines are assigned to courses of instruction to acquire the requisite skills necessary to fulfill their roles in the operating forces. Officers attend The Basic School at Training Command, Quantico, Virginia, and follow on assignment to a MOS qualifying course. Enlisted Marines undergo common skills training at the School of Infantry. Enlisted Marines that have an MOS other than infantry receive follow on orders to a MOS qualifying course. This budget activity also finances training travel costs supporting Marines attending Service and civilian schools away from their permanent duty stations; expenses incurred in developing a proficient recruiting force; advertising media and market analysis; maintenance of training support equipment, audio-visual aid, computer assisted training programs, direct administrative support for the Training and Education Command, and the Marine Corps Institute. The FY 2015 budget request of $694.3 million for Training and Recruiting reflects a net program decrease of $42.6 million from the FY 2014 funding level. The Training and Recruiting programs most significant increases include: $53.7 million for program increases supporting the implementation of live and simulated weapons training capabilities to create realistic operating environments on training ranges, advertising to support recruiting efforts to ensure a ready and capable force to meet tomorrow’s challenges, and travel costs associated with formal school attendance to ensure Marines possess the critical primary and secondary occupational skills to succeed in contingency operations; and $9.0 million for civilian personnel. The Training and Recruiting programs most significant decreases include: $51.1 million for contract services reduction; $44.1 million for program decreases reflective of incremental cost savings attributed to the termination of Joint Training Support, Combat Hunter, Sports Medicine and Injury Prevention, Marine Corps Center of Lessons Learned, and Marine Corps Civil Military Operation School, the reduction of tuition assistance benefits and revised eligibility requirements for program participation, and a reduction to the Marine Corps Civilian Leadership Development Program; and $8.9 million for end strength reductions.
Budget Activity 4: Administration and Servicewide Support $ in Millions
FY 2013/1
Actual Price
Growth Program Growth
FY 2014/2 Enacted
Price Growth
Program Growth
FY 2015/3 Estimate
752.3 18.4 -274.7 496.1 11.9 6.3 514.2
Numbers may not add due to rounding 1 FY 2013 includes Overseas Contingency Operations (OCO) funding
2 FY 2014 enacted excludes $370.1 million OCO funding
3 FY 2015 excludes OCO funding
30

MARINE CORPS
MARINE CORPS
The Administration and Servicewide Support budget activity finances the following activities: Headquarters Marine Corps staff management operations; servicewide transportation; Marine Security Guard detachments; acquisition program management; and other special support. Headquarters Marine Corps staff management costs include civilian personnel salaries, and administrative support for development of plans, policies, programs and requirements related to Marine Corps matters. Marine Security Guard operations costs include vehicle maintenance, billeting, training and administrative support for detachments located within the U.S. embassies. Service Wide Transportation (SWT) finances standard shipments for regular and emergency readiness material, including: ammunition, chemicals, medicine, subsistence, Army Post Office (APO) mail, repair parts, and high value repairable items. SWT program finances purchase of transportation services, predominately from DOD working capital fund transportation activities; Air Mobility Command (AMC), Military Sealift Command (MSC), and the Surface Deployment and Distribution Command (SDDC). In addition, SWT purchases transportation services from private sector firms which include aircraft, truck, rail, and barge. Acquisition Program Management provides funding for salaries and administration expenses for personnel involved in support of Marine Corps acquisitions. Special support costs include Defense Finance and Accounting Service (DFAS) reimbursements, Marine Corps prisoners support at the Army Disciplinary Command, Fort Leavenworth, Kansas; and the Marine Band located at the Marine Barracks, 8th and I Streets, Washington, DC. The FY 2015 budget request of $514.2 million for Administration and Servicewide Support budget activities reflects a program increase of $6.3 million from the FY 2014 funding level. The Administration and Servicewide Support programs most significant increases include: $15.5 million for the completion of the Marine Corps National Museum, development of exhibits, and production of interactive media; $13.9 million for transfers in; $12.1 million for Marine Corps Embassy Security Group; $14.6 million for civilian personnel. The Administration and Servicewide Support programs most significant decreases include: $11.3 million for contract services reduction; $10.5 million for administrative expense reductions, information technology support contract reductions, and prioritization of transportation modes to use the lowest cost modes available to meet the mission; and $8.4 million for end strength reductions.
31

AIR FORCE
AIR FORCE
$ in Millions
FY 2013/1
Actual Price
Growth Program Growth
FY 2014/2
Enacted Price
Growth Program Growth
FY 2015/3 Estimate
42,904.1 637.7 -10,424.2 33,117.6 331.6 1,882.1 35,331.2 Numbers may not add due to rounding
1 FY 2013 includes Overseas Contingency Operations (OCO) funding 2 FY 2014 enacted baseline excludes $12,746.4 million of OCO funding including $2,782.2 million of base funds transferred to OCO 3 FY 2015 exclude OCO funding
The mission of the United States Air Force is to fly, fight, and win in air, space, and cyberspace. The Operation and Maintenance (O&M) appropriation finances the capabilities to provide global vigilance, global reach, and global power to ensure that the joint force prevails in today's fight, delivering unmatched combat capability while sustaining new or expanding capabilities and force structure to meet future evolving challenges. O&M funds are used to operate, sustain, and maintain aircraft, space and related weapons systems; train and develop Airmen; operate advanced communications, command and control systems; purchase critical supplies, equipment and fuel; and operate both stateside and overseas installations. O&M resources directly support essential combat enablers such as: intelligence, weather, air traffic control, search and rescue, reconstitution, airfield, runway and base facility maintenance, and improvements to the working and living conditions for Air Force personnel. The FY 2015 budget continues to be strategy based and fiscally informed. The budget represents the Air Force’s efforts to develop and retain the capabilities the joint warfighter requires within the constraints of a fiscally constrained environment. The Air Force budget prioritizes resource allocation within a broad set of priorities: focus on restoring full-spectrum readiness; aligning key capabilities with the defense strategy; implementing management reforms and reducing overhead and operating costs; sustaining installations; and developing and caring for Airmen. The balanced approach across twelve Air Force core functions supports the joint/coalition team in today's fight, shapes the Air Force of the future and aligns with the four Department of Defense principles: maintain the most dominant military in the world, ensure forces are ready, eliminate waste and inefficiency, and do not break faith with men and women in uniform. Air Force core functions include: nuclear deterrence operations, air superiority, space superiority, cyberspace superiority, global precision attack, rapid global mobility, special operations, global integrated Intelligence, Surveillance, and Reconnaissance (ISR), command and control, personnel recovery, building partnerships, and agile combat support.
OVERALL ASSESSMENT: The Air Force's FY 2015 budget submission is built upon the foundation of the FY 2014 President's Budget submission, the Secretary’s Strategic Choice Management Review (SCMR), and the 2014 Quadrennial Defense Review (QDR). The Air Force continues its commitment to reshaping, sizing, and modernizing its force structure by making difficult choices to ensure it remains capable, effective, and ready in the future. Ultimately difficult choices resulted in a smaller, but more capable, ready and modern
32

AIR FORCE
AIR FORCE
force capable of rapid deployments, being sustained over time and that can survive against more technologically advanced adversaries. Prior attempts at reducing force structure met significant resistance from both the Congress and the Council of Governors. In response, the Air Force submitted a revised Total Force Proposal (TFP) to the original FY 2013 President's Budget submission. The FY 2013 National Defense Authorization Act accepted most of the revised proposals with two exceptions: retain an additional 32 intra-theater airlift aircraft above the Air Force revised plan and maintain the operational capability of the RQ-4 Block 30 Global Hawk unmanned aircraft system. The Air Force's FY 2015 budget takes these actions into account, but again makes difficult choices. The Air Force is reducing all elements of the force –personnel strength -active and reserve- along with the number of tactical air squadrons and divests aging aircraft (i.e. F-15C) and fleets (A-10s and U-2s). The A-10 fleet will eventually be replaced by F-35 and U-2’s will ultimately be replaced by Block 40 Global Hawks.
Within that strategic context, the Air Force's FY 2015 budget submission focus on providing unique capabilities to the joint forces, remain ready for the full-spectrum of military operations against high-end threats, trimming associated support structure along with downsized capabilities, while maximizing the contributions of the Total Force. The rebalance to the Asia-Pacific and our continued presence in the Middle East indicate the demand for Air Force capabilities will remain constant, or perhaps even rise over the next decade. The pillars of this effort include a consistent, equitable, and attainable flying hour program, prioritized full-spectrum training venues, focused weapon system sustainment, sustained Air Force installations, and continued care for Airmen and their families.
The Air Force's flying hour program maintains a consistent and attainable level of readiness. As the Air Force recovers full-spectrum readiness, adding resources for more flying hours to support training must be matched with maintenance to ensure aircraft availability. In terms of average aircraft age, Air Force "iron" is older than it's ever been; Weapon System Sustainment (WSS) enables weapon system availability and flying hours, making it a key contributor to readiness. To support training and help emulate the modern threat environments pilots may likely face, the Air Force increased funding to improve and sustain air-to-air and air-to-ground training ranges to elevate flying training effectiveness for the joint force. In an effort to improve sustainment of installations, the Air Force centralized funding for large project life-cycle facilities sustainment. This centralization establishes an enterprise approach allowing for greater asset visibility and accountability for prioritizing and funding requirements. The Air Force also funded facilities sustainment at 65 percent of the requirement. Foundational to full-spectrum readiness, the Air Force continues to support its Airmen and their families by funding core "services" programs such as dining facilities, fitness centers, libraries, recreational facilities, child and youth centers, and Airman and family readiness centers. The Air Force instituted standard levels of service and programmed funding into the baseline to relieve execution year demands. The FY 2015 budget allows the Air Force to increase training, modernize aircraft and weapons systems, and make critical repairs to its facilities – all in order to bring unit readiness and equipment closer to standard after the disruptions and shortfalls of the last few years.
33

AIR FORCE
AIR FORCE
Budget Activity 1: Operating Forces $ in Millions
FY 2013/1
Actual Price
Growth Program Growth
FY 2014/2 Estimate
Price Growth
Program Growth
FY 2015/3 Estimate
23,361.7 389.6 -4,209.5 19,541.8 166.0 1,257.2 20,965.0 Numbers may not add due to rounding
1 FY 2013 includes Overseas Contingency Operations (OCO) funding 2 FY 2014 enacted excludes $7,059.2 million of OCO funding including $1,282.2 million of base funds transferred to OCO 3 FY 2015 excludes OCO funding Operating Forces includes functions such as: Primary Combat Forces, the Air Force's front-line fighters, bombers, strike, and ISR assets (A-10, B-1, B-2, B-52, F- 15, F-16, F-22, F-35, MQ-1, and MQ-9 aircraft), representing the "tip of the global power projection spear”. Primary Combat Weapons include resources supporting the Air Force's two legs of America's nuclear triad: Intercontinental Ballistic Missiles (ICBMs) and the bomber force. Additional capabilities include electronic warfare and manned destructive suppression assets to enhance the effectiveness of other operational weapons systems. Global command, control, communication, intelligence (C3I) and early warning include resources that provide strategic offensive C3I, strategic defensive C3I and Air Force-wide communications. Air Force-Wide communications programs support development of a survivable communications capability for worldwide command and control (C2) communications during pre-attack, trans-attack and post-attack periods. The Air Force weather program supports combat and specialized operations, management, readiness and sustainment of Air Force weather and space environmental capabilities and systems. Budget Activity 01: Operating Forces - Major Program Changes: The FY 2015 Operating Forces budget request of $20,965.0 million represents program growth of $1,257.2 million and $166.0 million for pricing changes. The majority of the program increases represents a restoral of $1,282.2 million of base to OCO realignment in FY 2014. Programmatically the Air Force committed to improving the readiness of the combat air forces by increasing flying hours by $176.5 million and investing an additional $347.0 million in weapons system sustainment. To offset these readiness increases, the Air Force implemented management efficiencies in headquarters and logistics functions totaling $220.6 million; reduced resources available to sustain and modernize facilities by $266.6 million; and eliminated flying hours originally planned for retiring aircraft (to include A-10s, F15Cs, and T-38s) by $123.6 million.
34

AIR FORCE
AIR FORCE
Budget Activity 2: Mobilization $ in Millions
FY 2012/1
Actual Price
Growth Program Growth
FY 2013/2 Enacted
Price Growth
Program Growth
FY 2014/3 Estimate
7,956.4 67.9 -4,392.9 3,631.4 25.8 848.3 4,505.5 Numbers may not add due to rounding
1 FY 2012 includes Overseas Contingency Operations (OCO) funding 2 FY 2014 exclude $4,601.6 million of OCO funding including $1,000.0 million of base funds transferred to OCO
3 FY 2015 excludes OCO
Mobilization includes airlift operations, mobilization preparedness, and related base operating support and facilities sustainment. Global mobility is achieved through strategic and theater airlift in support of peacetime, contingency, and wartime operations in pursuit of national objectives. Rapid movement, establishment, and sustainment of combat forces anywhere in the world to deter and defeat aggression or to provide humanitarian/peacekeeping assistance are a major instrument of US national security policy. The President, the Secretary of Defense, the Joint Chiefs of Staff, the military Services and DoD agencies depend heavily on Air Force mobility operations for essential cargo and troop movement in support of missions worldwide. Budget Activity 02: Mobilization - Major Program Changes: The FY 2015 Mobilization budget request of $4,505.5 million represents program growth of $848.3 million and $25.8 million for pricing changes. The majority of the program increases represents a restoral of $1,000.0 million of base to OCO realignment in FY 2014. The Air Force increased readiness by committing an additional $87.9 million toward mobility air forces flying hours. To offset programmatic and realignment increases, the Air Force reduced C-17 crew ratios from 4.5 to 4.0, saving $50 million. In addition to adjusting crew ratios, the Air Force also reduced contract logistic maintenance by $108.3 million associated with retiring aircraft (including the C-130Hs).
35

AIR FORCE
AIR FORCE
Budget Activity 3: Training and Recruiting $ in Millions
FY 2013/1
Actual Price
Growth Program Growth
FY 2014/2 Enacted
Price Growth
Program Growth
FY 2015/2 Estimate
3,465.1 46.9 36.0 3,548.0 44.6 -291.6 3,301.0 Numbers may not add due to rounding
1 FY 2013 includes Overseas Contingency Operations (OCO) funding 2 FY 2014 exclude$34.9 million of OCO funding
3 FY 2015 excludes OCO funding Training and Recruiting supports three broad mission areas: accession training; basic skills and advanced training; recruiting and other training and education. Accession training produces the enlisted and officer personnel needed to meet total force requirements. Officer accessions receive formal introductory officer training through the United States Air Force Academy, Air Force Reserve Officer Training Corps, Officer Training School, and the Airmen Education and Commissioning Program. Basic skills and advanced training includes specialized skill training, flight training, professional development education and training support. Specialized skill training provides training and education essential to operate, maintain, and manage complex Air Force weapon systems and the associated support structure. Flight training programs include flight screening, undergraduate pilot training, specialized undergraduate pilot training, specialized undergraduate and advanced navigator training, and pilot instructor training. Professional development education includes professional military education programs to enhance and develop critical leadership skills of commissioned officers, civilians, and noncommissioned officers. Other training covers civilian education and training, tuition assistance for active duty personnel, and the Junior Reserve Officer Training Corps. Budget Activity 03: Training and Recruiting - Major Program Changes: The FY 2015 Training and Recruiting budget request of $3,301.0 million represents negative program growth of $291.6 million and $44.6 million for pricing changes. The majority of the program decreases reflect management efficiencies and commitment to reducing overhead. In addition to management efficiencies, the Air Force decreased the flight training program by over $100.0 million to adjust the pipeline capacity in accordance with anticipated force structure adjustments.
36

AIR FORCE
AIR FORCE
Budget Activity 4: Administration and Servicewide Activities $ in Millions
FY 2013/1
Actual Price
Growth Program Growth
FY 2014/2 Enacted
Price Growth
Program Growth
FY 2015/2 Estimate
8,121.0 133.1 -1,857.6 6,396.5 95.2 68.0 6,559.7 Numbers may not add due to rounding
1 FY 2013 includes Overseas Contingency Operations (OCO) funding 2 FY 2014 enacted excludes $1,050.8 million in OCO funding including $500.0 million of base funds transferred to OCO
3 FY 2015 excludes OCO
Administration and Servicewide funds four broad mission areas, all integral to Air Force readiness: logistics operations, servicewide support, security programs, and support to other nations. Logistics operations includes cradle-to-grave acquisition and logistics support, including readiness spares kits and pipeline supply requirements. It also includes inter- and intra-theater transport and handling of equipment and munitions. Servicewide activities cut across the entire Air Force to ensure combat capabilities through communications, personnel and policy direction, and the Civil Air Patrol. Security programs include the Air Force Office of Special Investigations and a range of classified activities. Finally, support to other nations includes Air Force participation in the North Atlantic Treaty Organization, Supreme Headquarters Allied Powers Europe, and the US Central Command's role in the cooperative defense initiatives. Budget Activity 04: Administration and Servicewide Activities - Major Program Changes: The FY 2015 Administration and Servicewide Activities budget request of $6,559.7 million represents program growth of $68.0 million and $95.2 million for pricing changes. The majority of the program increases represents a restoral of $500.0 million of base to OCO realignments in FY 2014. Programmatic increases were offset by management’s commitment to reduce over $250.8 million of overhead, civilian payroll, rents, utilities, and travel costs.
37

DEFENSE-WIDE
DEFENSE-WIDE
$ in Millions
The Operation and Maintenance, Defense-Wide funding request supports critical Department-wide functions and transformational efforts for the Secretary, Military Departments, and warfighters. The funding pays for common information services and system sustainment, contract administration and audits, family support programs, and administrative functions for the Military Departments. This funding supports the activities of the Special Operations Command (SOCOM), numerous Combat Support Agencies, policy and oversight Agencies, and three Intelligence Agencies. Defense Agency Programs FY 2015 Highlights: Highlights of Defense Agency FY 2015 funding include program changes of:
• $+366.0 million (USSOCOM): Significant changes in the USSOCOM FY 2015 base budget request include funds to restore readiness, increase in SOF education and Preservation of the Force and Families efforts, enhance SOF-unique communications programs, and increase and foster communication, cooperation and interoperability among partner nations. Decreases are reflected in USSOCOM management headquarters activities in support of the Department's management headquarters activities streamlining efforts and in flying hours.
• $-172.4 million (DSCA): The FY 2015 DSCA base budget represents a net reduction primarily due to the removal of an one-time increase in FY 2014 for building partnership capacity programs in Yemen and East Africa and the reorganization of course duration and size across various Regional Centers.
FY 2013/1 Actual
Price Growth
Program Growth
FY 2014/2 Enacted
Price Growth
Program Growth
FY 2015/3
Estimate 35,973.8 597.4 -5,424.0 31,147.2 506.5 -455.6 31,198.2
Numbers may not add due to rounding 1 FY 2013 includes Overseas Contingency Operations (OCO) funding 2 FY 2014 enacted excludes 6,226.7 million of OCO funding 3 FY 2015 excludes OCO funding
38

DEFENSE-WIDE
DEFENSE-WIDE
• $+158.1 million (DCMA): The FY 2015 DCMA budget includes additional funding to continue to support the DoD acquisition workforce and the conversion of formerly Defense Acquisition Workforce Development Fund (DAWDF) journeymen and keystone interns to Operations & Maintenance full time permanent employees. The enacted FY 2014 appropriation constrained DCMA's ability to fully achieve hiring plans and meet salary requirements without unsustainable reductions to non-labor expenses.
• $-139.3 million (DODEA): The DODEA FY 2015 base budget represents a net reduction in funding which is attributed to a combination of efficiency initiatives, one-time congressional adds in FY 2014, and select reductions to DODEA programs.
• $-137.7 million (DHRA): The DHRA FY 2015 base budget represents a net reduction in funding which is attributed to a combination of efficiency initiatives, one-time congressional adds in FY 2014, a transfer of the Transition to Veterans Office program funds to the military services, and reductions to various DHRA programs.
• $+95.8 million (CLASSIFIED): Classified details may be found in Volume III of the Operation and Maintenance, Defense-Wide justification entitled "Other Programs, Classified Justification Book."
39

RESERVE FORCES
RESERVE FORCES
Reserve Forces Operation & Maintenance Appropriations $ in Millions
FY 2013/1
Actual Price
Growth Program/2 Growth
FY 2014/2
Enacted Price
Growth Program Growth
FY 2015/3
Estimate
Army Reserve 3,022.4 46.9 -128.4 2,940.9 49.2 -499.6 2,490.6 Navy Reserve 1,194.1 4.2 -39.9 1,158.4 15.2 -166.5 1,007.1 Marine Corps Reserve 279.3 3.9 -27.9 255.3 4.6 8.7 268.6 Air Force Reserve 2,994.1 31.3 36.8 3,062.2 19.8 -66.2 3,015.8 Army National Guard 7,045.2 61.5 -249.2 6,857.5 104.8 -931.6 6,030.8 Air National Guard 6,033.9 96.9 261.6 6,392.3 37.5 -36.9 6,392.9 Total 20,569.0 244.6 -147.0 20,666.6 231.1 -1,692.1 19,205.7
Numbers may not add due to rounding 1 FY 2013 includes Overseas Contingency Operations (OCO) funding 2 FY 2014 enacted excludes $288.4 million OCO funding including $406 million of base funds transferred to OCO 3 FY 2015 excludes OCO funding
The Operation and Maintenance (O&M) appropriations enable the Reserve Components (RC) of the Army, Navy, Marine Corps, and Air Force to provide trained, ready and cost effective forces that can be employed on a regular operational basis, while ensuring depth for large scale contingencies or other unanticipated national crises, both at home and overseas. The FY 2015 budget focuses on restoring the total force readiness levels impacted by sequestration, while supporting the transition to a smaller military that is more agile and technologically superior. The Department continues to rely upon the Guard and Reserve as a vital part of the operational force and therefore a strong and properly resourced RC is essential to the DoD mission. The RC adds significant cost effective value to the all-volunteer force and must continue to serve in an operational capacity – available, trained and equipped for predictable routine deployments as well as in a strategic capacity. The FY 2015 budget supports preparation of both units and individuals to participate in missions across the full spectrum of military operation, in a cyclic or periodic manner that provides predictability for the Combatant Commands, the Services, Service Members, their Families, and civilian employers; while increasing DOD’s capacity and ability to expand and contract forces. The FY 2015 budget request of $19,205.7 million for the Reserve Forces includes price growth of $231.1 million and program decreases of $1,692.1 million.
40
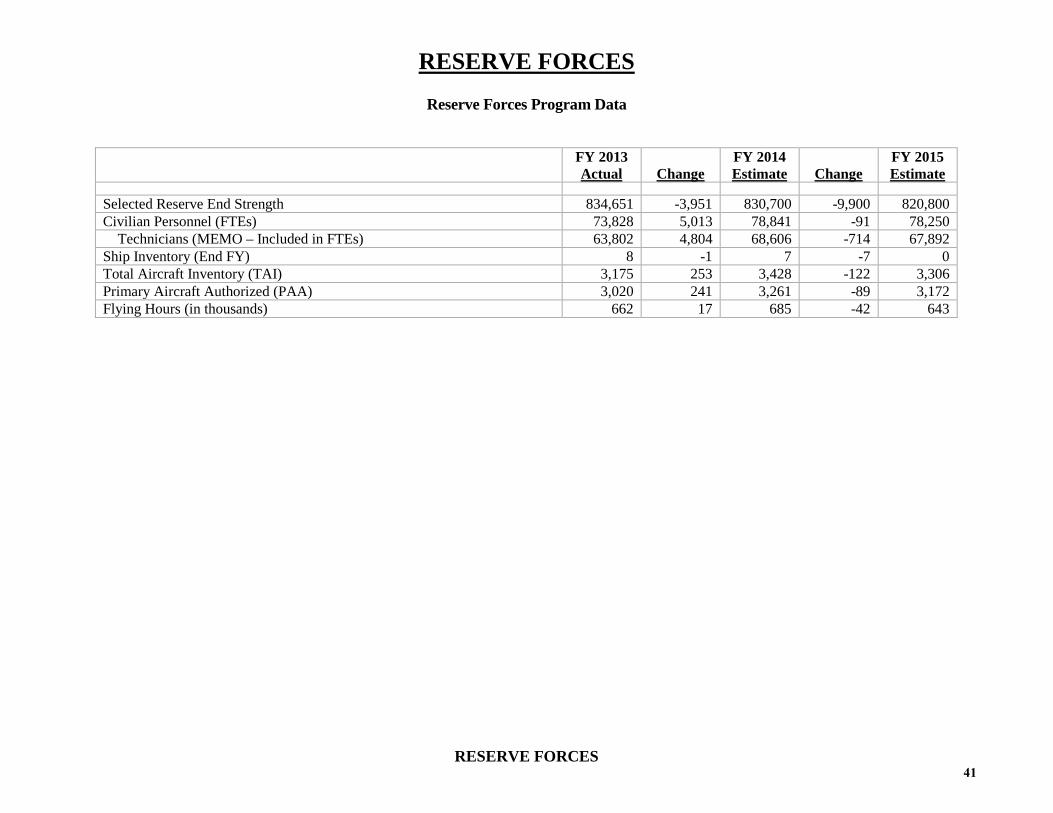
RESERVE FORCES
RESERVE FORCES
Reserve Forces Program Data
FY 2013 Actual Change
FY 2014
Estimate Change FY 2015
Estimate Selected Reserve End Strength 834,651 -3,951 830,700 -9,900 820,800 Civilian Personnel (FTEs) 73,828 5,013 78,841 -91 78,250 Technicians (MEMO – Included in FTEs) 63,802 4,804 68,606 -714 67,892 Ship Inventory (End FY) 8 -1 7 -7 0 Total Aircraft Inventory (TAI) 3,175 253 3,428 -122 3,306 Primary Aircraft Authorized (PAA) 3,020 241 3,261 -89 3,172 Flying Hours (in thousands) 662 17 685 -42 643
41
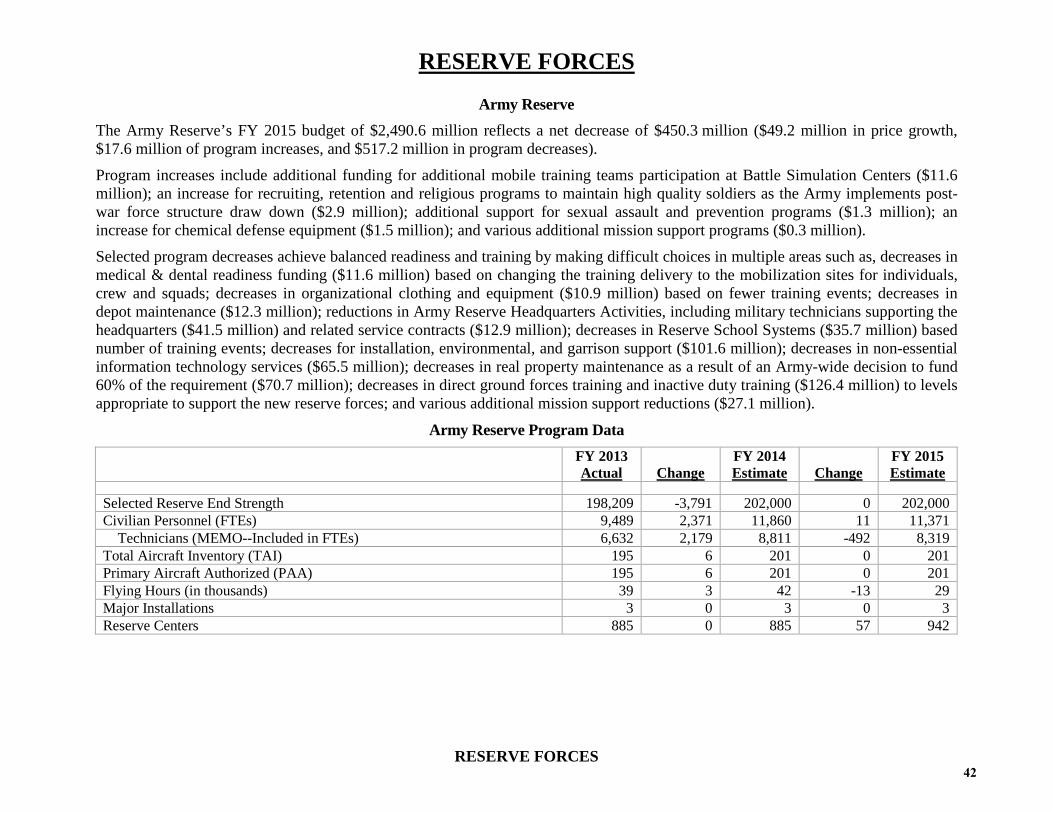
RESERVE FORCES
RESERVE FORCES
Army Reserve The Army Reserve’s FY 2015 budget of $2,490.6 million reflects a net decrease of $450.3 million ($49.2 million in price growth, $17.6 million of program increases, and $517.2 million in program decreases).
Program increases include additional funding for additional mobile training teams participation at Battle Simulation Centers ($11.6 million); an increase for recruiting, retention and religious programs to maintain high quality soldiers as the Army implements post-war force structure draw down ($2.9 million); additional support for sexual assault and prevention programs ($1.3 million); an increase for chemical defense equipment ($1.5 million); and various additional mission support programs ($0.3 million).
Selected program decreases achieve balanced readiness and training by making difficult choices in multiple areas such as, decreases in medical & dental readiness funding ($11.6 million) based on changing the training delivery to the mobilization sites for individuals, crew and squads; decreases in organizational clothing and equipment ($10.9 million) based on fewer training events; decreases in depot maintenance ($12.3 million); reductions in Army Reserve Headquarters Activities, including military technicians supporting the headquarters ($41.5 million) and related service contracts ($12.9 million); decreases in Reserve School Systems ($35.7 million) based number of training events; decreases for installation, environmental, and garrison support ($101.6 million); decreases in non-essential information technology services ($65.5 million); decreases in real property maintenance as a result of an Army-wide decision to fund 60% of the requirement ($70.7 million); decreases in direct ground forces training and inactive duty training ($126.4 million) to levels appropriate to support the new reserve forces; and various additional mission support reductions ($27.1 million).
Army Reserve Program Data
FY 2013 Actual Change
FY 2014
Estimate Change FY 2015
Estimate Selected Reserve End Strength 198,209 -3,791 202,000 0 202,000 Civilian Personnel (FTEs) 9,489 2,371 11,860 11 11,371 Technicians (MEMO--Included in FTEs) 6,632 2,179 8,811 -492 8,319 Total Aircraft Inventory (TAI) 195 6 201 0 201 Primary Aircraft Authorized (PAA) 195 6 201 0 201 Flying Hours (in thousands) 39 3 42 -13 29 Major Installations 3 0 3 0 3 Reserve Centers 885 0 885 57 942
42

RESERVE FORCES
RESERVE FORCES
Navy Reserve The Navy Reserve’s FY 2015 budget of $1,007.1 million reflects a net decrease of $151.3 million ($15.2 million in price growth, $70.7 million of program increases, $232.3 million in program decreases, and transfers in of $9.2 million and transfers out of $14.0 million).
Program increases include additional funding for operations and flight hours supporting the transition from EA-6B and KC-130T aircraft to EA-18G and KC-130J aircraft ($21.7 million); funding for new mission for High Value Unit armed escort ($3.7 million); funding to support initial EA-18G repairs and C-130 overhauls ($2.8 million); an increase for air worthiness inspection for multiple aircraft ($1.5 million); and increased air depot maintenance for initial requirements for the EA-18G and T-56 ($2.8 million).
Program decreases include changes in force structure and associated operations, such as a reduction of support to two HH-60H support squadrons ($20.1 million); decreases associated with the reduction of aircraft and flight hours for the C-9B, KC-130T and EA-6B aircraft ($24.4 million); decreases in ship maintenance ($68.5 million) and ship operations ($12.8 million) due to the decommissioning of all seven Navy Reserve FFGs by the end of FY 2015; decreases for multiple contractual efficiencies ($50.9 million), decreases for transition to a more cost effective contracts ($6.0 million) providing information technology services; decreases for the streamlining management headquarters initiative ($0.6 million); decreases in facilities sustainment funding ($27.0 million) to fund 70% of the facilities sustainment model; decreases in aircraft depot maintenance requirements due to updated requirements and unit cost mix for the C-20 overhauls and section inspections ($4.1 million); and various other programs.
Navy Reserve Program Data
FY 2013 Actual Change
FY 2014 Estimate Change
FY 2015 Estimate
Total Selected Reserve End Strength 62,444 -3,344 59,100 -1,800 57,300 Civilian Personnel (FTEs) 825 45 870 0 870 Total Aircraft Inventory (TAI)* 250 13 263 0 263 Primary Aircraft Authorized (PAA)* 250 13 263 0 263 Flying Hours (in thousands)* 92 -3 95 -1 94 Ship Inventory 8 -1 7 -7 0 Reserve Centers 132 -1 131 0 131 Major Installations 3 0 3 0 3 * Includes TAI/PAA and flying hours flown by the Marine Corp Reserve
43

RESERVE FORCES
RESERVE FORCES
Marine Corps Reserve The Marine Corps Reserve’s FY 2015 budget of $268.6 million reflects a net increase of $13.3 million ($4.6 million in price growth, and $33.3 million of program increases and $24.8 million of program decreases).
Program increases include funding for 1,000 Marine Reservists to participate in Service and Joint exercises ($32.6 million) and various other mission support items ($0.7 million). The program decreases include deferring facility maintenance ($3.8 million); reductions in multiple types of equipment maintenance due to lower usage and demand ($16.8 million); decreases for the streamlining management headquarters initiative ($1.6 million); and decreases for multiple contractual efficiencies ($2.3 million).
Marine Corps Reserve Program Data
FY 2013 Actual Change
FY 2014
Estimate Change FY 2015 Estimate
Total Selected Reserve End Strength 39,642 -42 39,600 -400 39,200 Civilian Personnel (FTEs) 269 -33 236 41 277 Divisions 1 0 1 0 1 Training Centers 189 0 189 0 189
44
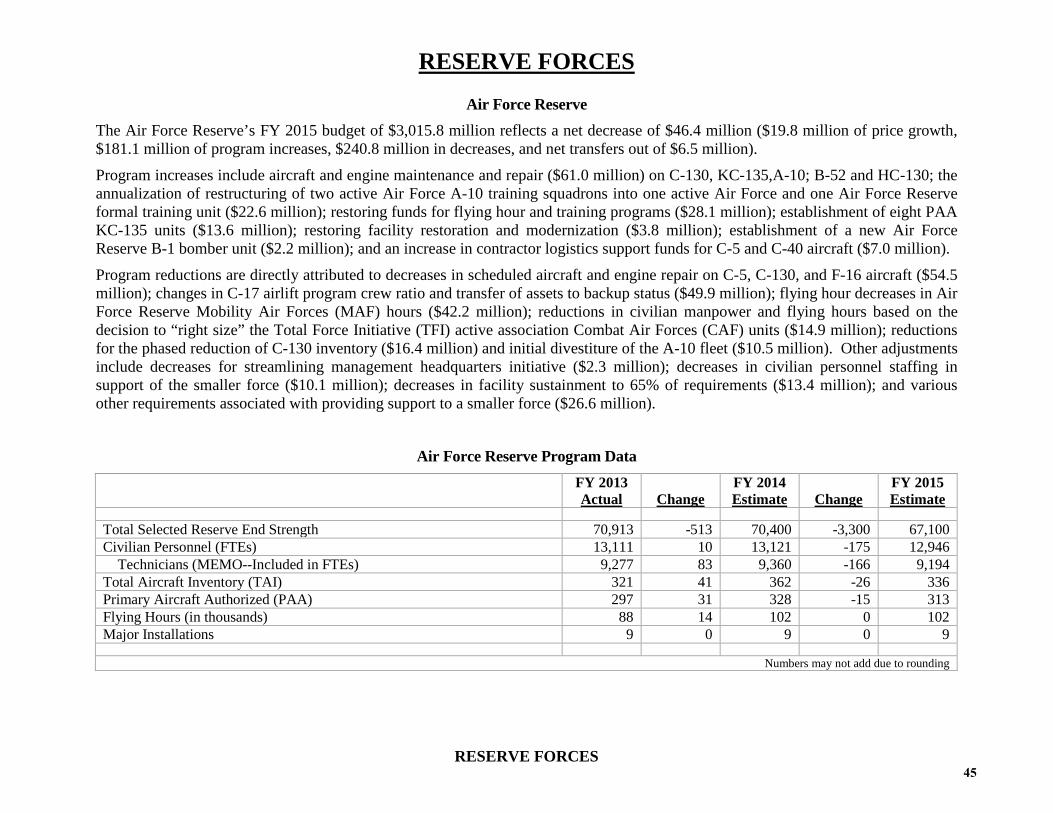
RESERVE FORCES
RESERVE FORCES
Air Force Reserve The Air Force Reserve’s FY 2015 budget of $3,015.8 million reflects a net decrease of $46.4 million ($19.8 million of price growth, $181.1 million of program increases, $240.8 million in decreases, and net transfers out of $6.5 million).
Program increases include aircraft and engine maintenance and repair ($61.0 million) on C-130, KC-135,A-10; B-52 and HC-130; the annualization of restructuring of two active Air Force A-10 training squadrons into one active Air Force and one Air Force Reserve formal training unit ($22.6 million); restoring funds for flying hour and training programs ($28.1 million); establishment of eight PAA KC-135 units ($13.6 million); restoring facility restoration and modernization ($3.8 million); establishment of a new Air Force Reserve B-1 bomber unit ($2.2 million); and an increase in contractor logistics support funds for C-5 and C-40 aircraft ($7.0 million).
Program reductions are directly attributed to decreases in scheduled aircraft and engine repair on C-5, C-130, and F-16 aircraft ($54.5 million); changes in C-17 airlift program crew ratio and transfer of assets to backup status ($49.9 million); flying hour decreases in Air Force Reserve Mobility Air Forces (MAF) hours ($42.2 million); reductions in civilian manpower and flying hours based on the decision to “right size” the Total Force Initiative (TFI) active association Combat Air Forces (CAF) units ($14.9 million); reductions for the phased reduction of C-130 inventory ($16.4 million) and initial divestiture of the A-10 fleet ($10.5 million). Other adjustments include decreases for streamlining management headquarters initiative ($2.3 million); decreases in civilian personnel staffing in support of the smaller force ($10.1 million); decreases in facility sustainment to 65% of requirements ($13.4 million); and various other requirements associated with providing support to a smaller force ($26.6 million).
Air Force Reserve Program Data
FY 2013 Actual Change
FY 2014
Estimate Change FY 2015 Estimate
Total Selected Reserve End Strength 70,913 -513 70,400 -3,300 67,100 Civilian Personnel (FTEs) 13,111 10 13,121 -175 12,946 Technicians (MEMO--Included in FTEs) 9,277 83 9,360 -166 9,194 Total Aircraft Inventory (TAI) 321 41 362 -26 336 Primary Aircraft Authorized (PAA) 297 31 328 -15 313 Flying Hours (in thousands) 88 14 102 0 102 Major Installations 9 0 9 0 9
Numbers may not add due to rounding
45

RESERVE FORCES
RESERVE FORCES
Army National Guard
The Army National Guard’s FY 2015 budget of $6,030.7 million reflects a net decrease of $826.7 million ($104.8 million of price growth, $931.6 million in program decreases, and a net of $9.0 million transferred out).
Program increases include Air OPTEMPO funding for maintenance and training ($9.1 million) of aircraft transferred from the Active components; increases enablers training delivery by updating and maintaining the equipment ($45.6 million) utilized for State Distributed Learning Programs; increases for depot maintenance for multiple items used in air defense missions ($20.2 million); installation services support realignment ($34.2 million) to properly realign resources; and additional funding for mission support, transition assistance program, recruiting, and various other programs ($33.5 million).
Program decreases include Ground Force OPTEMPO funding ($209.7 million) for individual/crew/squad proficiency training and fewer training exercises to support 22 BCTs; reduced flying hours and related support costs due to aircraft inventory changes ($12.7 million); depot maintenance decreases for modernized Aviation and Combat Vehicle end items requiring less repairs ($108.5 million); decreases in staffing and contracts for management and operational support ($87.2 million) for smaller Guard; decreases related to the restructuring of services, training and professional development at Training Support Centers and Ranges ($76.6 million); multiple installation support service reductions including staffing and contracted services ($239.5 million); decreases to support more efficient travel program ($4.2 million); reductions in recruiting to focus on maintaining and recruiting specific crucial MOS’s ($10.6 million); decreases for streamlining management headquarters initiative ($25.9 million); decreases in organizational clothing to lower force levels ($30.4 million); reduces facilities sustainment from 78% to 64% of the requirement and limits modernization to life, health and safety ($215.6 million); and for various other program decreases ($44.8 million).
Army National Guard Program Data
FY 2013 Actual Change
FY 2014
Estimate Change FY 2015
Estimate Total Selected Reserve End Strength 357,735 -3,535 354,200 -4,000 350,200 Civilian Personnel (FTEs) 26,123 3,240 29,363 -35 29,328 Technicians (MEMO – Included in FTEs) 25,325 2,885 28,210 27 28,237 Total Aircraft Inventory (TAI) 1,405 106 1,511 -22 1,489 Primary Aircraft Authorized (PAA) 1,405 106 1,511 -22 1,489 Flying Hours (in thousands) 265 -32 233 -30 203 Total Installations 3,049 0 3,049 0 3,049 Brigade Combat Teams 28 0 28 -6 22 Brigades 88 0 88 0 88
Numbers may not add due to rounding
46
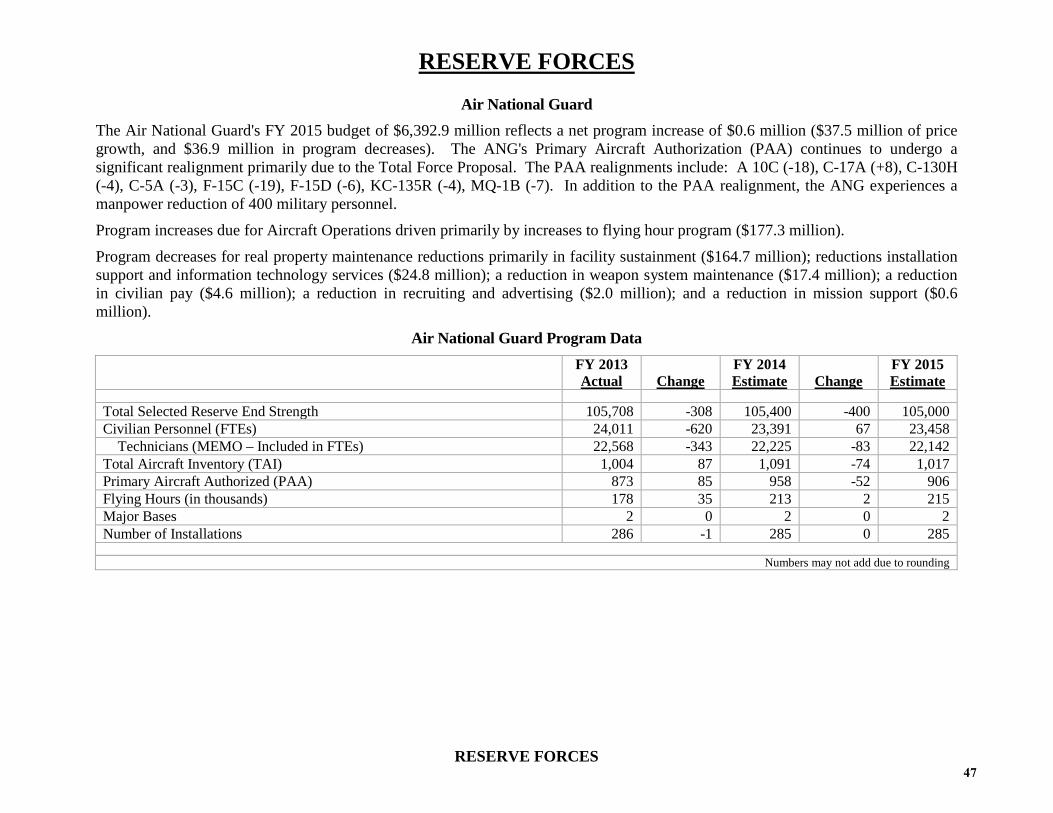
RESERVE FORCES
RESERVE FORCES
Air National Guard The Air National Guard's FY 2015 budget of $6,392.9 million reflects a net program increase of $0.6 million ($37.5 million of price growth, and $36.9 million in program decreases). The ANG's Primary Aircraft Authorization (PAA) continues to undergo a significant realignment primarily due to the Total Force Proposal. The PAA realignments include: A 10C (-18), C-17A (+8), C-130H (-4), C-5A (-3), F-15C (-19), F-15D (-6), KC-135R (-4), MQ-1B (-7). In addition to the PAA realignment, the ANG experiences a manpower reduction of 400 military personnel.
Program increases due for Aircraft Operations driven primarily by increases to flying hour program ($177.3 million).
Program decreases for real property maintenance reductions primarily in facility sustainment ($164.7 million); reductions installation support and information technology services ($24.8 million); a reduction in weapon system maintenance ($17.4 million); a reduction in civilian pay ($4.6 million); a reduction in recruiting and advertising ($2.0 million); and a reduction in mission support ($0.6 million).
Air National Guard Program Data
FY 2013 Actual Change
FY 2014
Estimate Change FY 2015
Estimate Total Selected Reserve End Strength 105,708 -308 105,400 -400 105,000 Civilian Personnel (FTEs) 24,011 -620 23,391 67 23,458 Technicians (MEMO – Included in FTEs) 22,568 -343 22,225 -83 22,142 Total Aircraft Inventory (TAI) 1,004 87 1,091 -74 1,017 Primary Aircraft Authorized (PAA) 873 85 958 -52 906 Flying Hours (in thousands) 178 35 213 2 215 Major Bases 2 0 2 0 2 Number of Installations 286 -1 285 0 285
Numbers may not add due to rounding
47

AFGHANISTAN INFASTRUCTURE FUND
AFGHANISTAN INFASTRUCTURE FUND
THIS EXHIBIT WILL BE UPDATED UPON SUBMISSION OF THE
FY 2015 OVERSEAS CONTINGENCY OPERATIONS ESTIMATE
48

COOPERATIVE THREAT REDUCTION PROGRAM
$ in Millions
The Cooperative Threat Reduction (CTR) Program’s FY 2015 budget contains $365.1 million to consolidate, secure, or eliminate weapons of mass destruction (WMD), related materials, and delivery systems and infrastructure; and to build partner capacity to prevent the proliferation of WMD materials across borders or in transit across international borders. The FY 2015 budget request reflects a decrease of $135.3 million from the FY 2014 funding level. This includes $8.7 million for price growth and a net program decrease of $144.0 million. Programs with increased funding include Global Nuclear Security ($1.0 million), Threat Reduction Engagement ($0.8 million), and Other Assessments/Administrative Support ($7.0 million). Programs with decreased funding include Cooperative Biological Engagement ($7.6 million), Strategic Offensive Arms Elimination ($4.8 million), Chemical Weapons Destruction ($68.8 million), and Proliferation Prevention ($71.7 million). The following table reflects the program structure and price and program changes from FY 2013 to FY 2015 for the major programs:
FY 2013 Actual
Price Growth
Program Growth
FY 2014 Enacted
Price Growth
Program Growth
FY 2015 Estimate
446.2 8.4 45.7 500.4 8.7 -144.0 365.1
49

COOPERATIVE THREAT REDUCTION PROGRAM
$ in Millions
Program FY 2013 Actual
Price Growth
Program Growth
FY 2014 Enacted
Price Growth
Program Growth
FY 2015 Estimate
Strategic Offensive Arms Elimination 14.8 0.3 -9.4 5.7 0.1 -4.8 1.0 Chemical Weapons Destruction 69.0 1.3 12.7 83.0 1.5 -68.8 15.7 Global Nuclear Security 39.3 0.7 -20.7 19.4 0.3 1.0 20.7 Cooperative Biological Engagement 211.0 4.0 45.0 260.0 4.4 -7.6 256.8 Proliferation Prevention 87.3 1.7 21.5 110.4 2.0 -71.7 40.7 Threat Reduction Engagement 2.8 0.1 -1.3 1.5 0.0 0.8 2.4 Other Assessments Administrative Support 22.0 0.4 -2.0 20.4 0.4 7.0 27.8 Total 446.2 8.4 45.8 500.5 8.7 -144.1 365.1
Activities for the Cooperative Threat Reduction Program for FY 2015 are as follows: Strategic Offensive Arms Elimination: • Support elimination and program activities in Ukraine; • Prepare to address WMD delivery system threats in other countries; and • Provide logistical, administrative, and advisory support. Chemical Weapons Destruction: • Assist with Libyan and Syrian chemical weapons elimination operations; • Be prepared to provide technical and procurement advice and assistance support in other regions to eliminate and improve safety
and security of chemical weapons; • Prepare to prevent proliferation of or destroy chemical weapons in other countries; and • Provide logistical, administrative, and advisory support.
50

COOPERATIVE THREAT REDUCTION PROGRAM
Global Nuclear Security: • Continue to support technical exchanges with the Russian Ministry of Defense on nuclear weapons security topics with the goal to
enhance and improve security systems, procedures, and best practices; • Continue support for Nuclear Security Centers of Excellence; • Provide equipment and training for partner countries to secure vulnerable nuclear material; • Provide equipment and training to enhance nuclear security capabilities of partner countries to perform key security functions such
as secure transportation, inventory management, and emergency response; • Support shipments of Spent Nuclear Fuel(SNF)and other nuclear material that meets the International Atomic Energy Association
(IAEA) criteria as “weapons-usable” to consolidate and facilitate the disposition of the nuclear material; and • Provide logistical, administrative, and advisory support.
Cooperative Biological Engagement: • Fund Biological Safety and Security (BS&S) enhancements as detailed below:
Former Soviet Union (FSU) • Continue BS&S upgrades to human and veterinary laboratories in Armenia and Ukraine; • Continue construction of the Central Reference Laboratory (CRL) in Kazakhstan; • Continue oversight on construction of CRL in Azerbaijan and installation of BS&S systems and equipment; • Continue the development and implementation of BS&S Standard Operating Procedures across the region; and • Continue the provision of bio-risk management training in Armenia, Azerbaijan, Kazakhstan, and Ukraine. Africa • Complete BS&S upgrades to human and veterinary laboratories in Kenya, Uganda, and Tanzania; • Initiate BS&S upgrades to human and veterinary laboratories in up to three new countries; and • Conduct bio-risk Management training in Kenya, Uganda, Tanzania, and up to three new countries.
Middle East/South Asia (MESA) • Continue laboratory upgrades in Iraq and Afghanistan; • Continue bio-risk management training in Iraq and Afghanistan; and • Continue the development and implementation of BS&S Standard Operating Procedures in Iraq and Afghanistan.
51
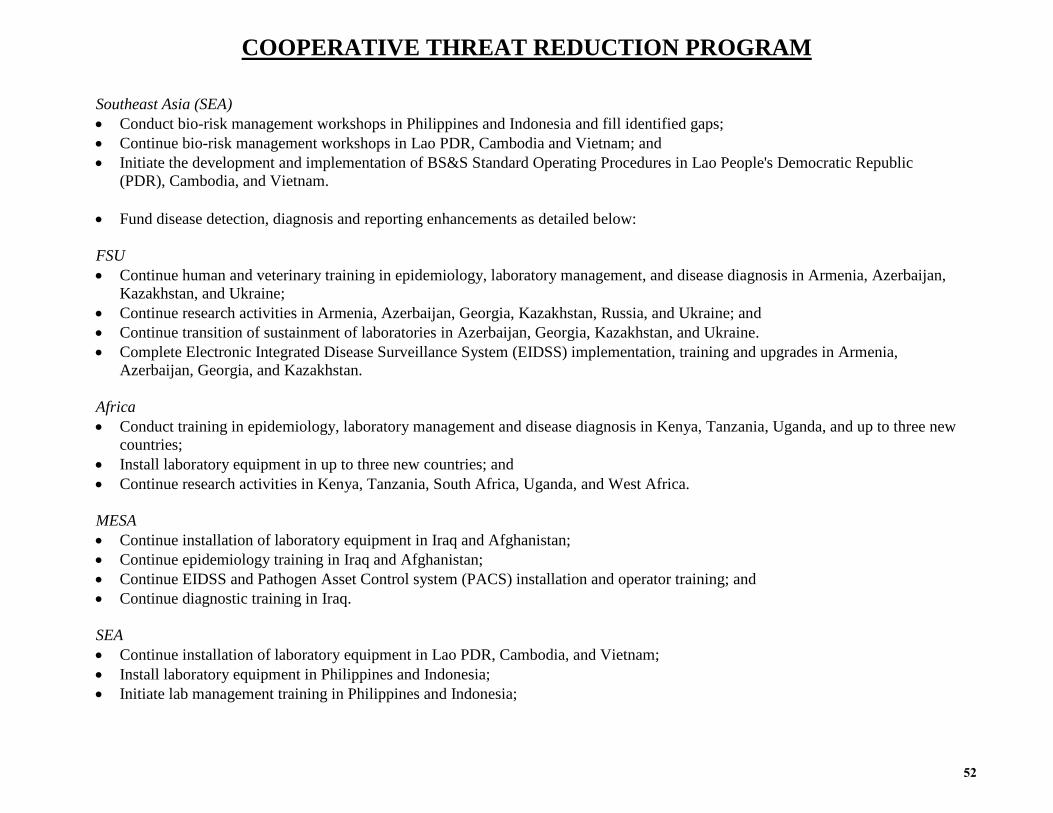
COOPERATIVE THREAT REDUCTION PROGRAM
Southeast Asia (SEA) • Conduct bio-risk management workshops in Philippines and Indonesia and fill identified gaps; • Continue bio-risk management workshops in Lao PDR, Cambodia and Vietnam; and • Initiate the development and implementation of BS&S Standard Operating Procedures in Lao People's Democratic Republic
(PDR), Cambodia, and Vietnam. • Fund disease detection, diagnosis and reporting enhancements as detailed below: FSU • Continue human and veterinary training in epidemiology, laboratory management, and disease diagnosis in Armenia, Azerbaijan,
Kazakhstan, and Ukraine; • Continue research activities in Armenia, Azerbaijan, Georgia, Kazakhstan, Russia, and Ukraine; and • Continue transition of sustainment of laboratories in Azerbaijan, Georgia, Kazakhstan, and Ukraine. • Complete Electronic Integrated Disease Surveillance System (EIDSS) implementation, training and upgrades in Armenia,
Azerbaijan, Georgia, and Kazakhstan. Africa • Conduct training in epidemiology, laboratory management and disease diagnosis in Kenya, Tanzania, Uganda, and up to three new
countries; • Install laboratory equipment in up to three new countries; and • Continue research activities in Kenya, Tanzania, South Africa, Uganda, and West Africa. MESA • Continue installation of laboratory equipment in Iraq and Afghanistan; • Continue epidemiology training in Iraq and Afghanistan; • Continue EIDSS and Pathogen Asset Control system (PACS) installation and operator training; and • Continue diagnostic training in Iraq. SEA • Continue installation of laboratory equipment in Lao PDR, Cambodia, and Vietnam; • Install laboratory equipment in Philippines and Indonesia; • Initiate lab management training in Philippines and Indonesia;
52

COOPERATIVE THREAT REDUCTION PROGRAM
• Introduce EIDSS and PACS to human and vet ministries in Philippines; • Continue laboratory management training in Cambodia and Vietnam; • Conduct laboratory management training in Lao PDR; • Complete laboratory diagnostic training/capacity building activity in Cambodia; and • Continue research activity in Thailand and Vietnam.
Proliferation Prevention: • Armenia: Complete improvements to Armenian Border Guard command and control, communications, surveillance, WMD
detection and interdiction capabilities, and sustainment along the Georgian green border; • Moldova: Continue to enhance WMD Proliferation Prevention capabilities by filling equipment and training gaps identified by
concept of operations development activities and operational exercises, and continue to enhance capabilities for safe transportation and disposition of interdicted materials;
• Philippines: Complete improvements to increase WMD and maritime security communications, surveillance, detection and interdiction capabilities, and sustainment through the implementation of the National Coast Watch System and development of a concept of operations to aid in command and control and interagency coordination;
• Vietnam: Complete improvements to enhance the maritime security and law enforcement equipment and infrastructure support capabilities;
• Southeast Asia: Continue engagements in other littoral Southeast Asia countries to enhance national maritime security and WMD detection capabilities as well as bolster regional proliferation prevention awareness and capabilities;
• Middle East: Complete engagement in the Hashemite Kingdom of Jordan along the Syrian and Iraqi green borders to enhance WMD Proliferation Prevention detection and interdiction capabilities in order to prevent the illicit flow of WMD and related components and to ensure resilience in the event of a WMD incident;
• Support WMD Proliferation Prevention projects and activities in regions and countries in accordance with authorities and determinations; and
• Provide logistical, administrative, and advisory support.
Threat Reduction Engagement: • FY 2015 funds will continue to support specific relationship-building opportunities with existing Former Soviet Union (FSU)
countries while shifting towards engagements and expansion of CTR Program areas with partners in new geographical areas including cooperation and coordination with cognizant Unified Combatant Commands (UCCs) to advance CTR Program goals.
53

COOPERATIVE THREAT REDUCTION PROGRAM
Other Assessments/Administrative Support: • FY 2015 funds will support approximately 8-12 Audits and Examinations per year, provide agency support services, contractor
administrative and advisory support, and provide U.S. Embassy support for current and emerging DTRA/CTR offices in partner countries. The FY 2015 funding increase reflects the net effect of ramping down the embassy support services in Russia, and the rapid expansion of the CTR program to new geographic areas and countries (e.g. Middle East, Africa, Southeast Asia, etc.). Embassies are requesting additional staff for emerging DTRA/CTR offices to support the administrative and technical burden of managing the in-country efforts.
54

DEFENSE ACQUISITION WORKFORCE DEVELOPMENT FUND
DEFENSE ACQUISITION WORKFORCE DEVELOPMENT FUND
$ in Millions
FY 2013 Actual
FY 2014 Enacted
FY 2015 Estimate
Appropriated or Requested 48,643 51,031 212,875 Remittance (Credit)/1 355,717 588,969 347,125 Total Credited to Account/2 404,360 640,000 560,000 Prior Year Carry Forward 561,261 428,772 512,422 Total Obligation Authority 965,621 1,068,772 1,072,422 1 Meets the 80 percent minimum baseline required for FY 2012 and FY 2013 by section 832 of Public Law 111-84, National Defense Authorization Act, 2010 and FY 2014 by section 803 of Public Law 112-239, National Defense Authorization Act, 2013. 2 Equals the sum of: (1) all budget authority granted (or requested) from the Congress in a given year, (2) amounts authorized to be credited to a specific fund, (3) budget authority transferred from another appropriation, and (4) unobligated balances of budget authority from previous years which remain available for obligation
The FY 2015 budget request of $212.9 million for the Defense Acquisition Workforce Development Fund (DAWDF) supports the strategic objectives and continuous improvement of the defense acquisition workforce. The DAWDF will fund the remaining new hires under the original initiative to rebuild workforce capacity from the 1990’s downsizing, and help create a sufficiently sized future workforce for mission critical acquisition functions. The funding levels will support acquisition workforce professionalization, training, development, qualifications, and currency. Funded initiatives support the intent of the Defense Acquisition Workforce Improvement Act (DAWIA), the purpose of the 10 U.S.C. 1705 DAWDF, fulfilling strategic workforce planning requirements of 10 U.S.C. 115b, qualification and career path requirements of 10 U.S.C. 1723, and strategic workforce objectives under the DoD Better Buying Power (BBP) initiative, to achieve greater efficiency and productivity in Defense spending. Implementation of the 34 BBP initiatives, are dependent on a qualified and professional acquisition workforce. Continuous improvement and currency of the acquisition workforce throughout the career lifecycle is critical to achieving increased buying power while modernizing and resetting our military force, improving acquisition outcomes, and for ensuring technological superiority for the future.
55

DEFENSE HEALTH PROGRAM
DEFENSE HEALTH PROGRAM
Appropriation Summary $ in Millions
The medical mission of the Department of Defense (DoD) is to enhance DOD and our Nation’s security by providing health support for the full range of military operations and sustaining the health of all those entrusted to our care. The Defense Health Program (DHP) appropriation supports health care services for 9.3 million eligible beneficiaries – Active Duty, Reserve and National Guard soldiers, sailors, airmen, marines and their family members, plus retirees and their family members, and the eligible surviving family members of deceased active duty and retired members. The Department’s managed care program, called “TRICARE,” is designed to provide military families with access to quality care that is cost-effective. The TRICARE program provides medical care through a network of 56 military inpatient facilities, 359 military medical clinics, 249 dental clinics, 254 veterinary clinics, and three regional Managed Care Support (MCS) contracts. The TRICARE program offers a triple option benefit: (1)TRICARE Prime, a Health Maintenance Organization (HMO) style benefit requiring beneficiary enrollment; (2)TRICARE Extra, a Preferred Provider Organization (PPO) style benefit; and (3)TRICARE Standard, a fee-for-service option.
FY 20131 Actuals
Price Growth
Program Growth
FY 20142 Enacted
Price Growth
Program Growth
FY 20153 Estimate
Operation & Maintenance4 29,288.4 909.6 498.2 30,696.2 882.0 -546.3 31,031.9 RDT&E 1,017.7 17.3 517.3 1,552.3 27.9 -925.6 654.6 Procurement 336.8 8.4 96.5 441.8 12.4 -145.8 308.4 Total, DHP 30,642.9 935.3 1,112.0 32,690.3 922.3 -1,617.7 31,994.9 MERHCF Receipts5 7,868.0 8,774.6 9,352.4 Total Health Care Costs 38,510.9 41,464.9 41,347.4
Numbers may not add due to rounding 1/ FY 2013 actuals include $993.898 million for Overseas Contingency Operations (OCO) funding. Excludes $585.398 million of unobligated balances. 2/ FY 2014 enacted excludes $898.701 million of OCO. 3/ FY 2015 exclude OCO. 4/ The Department of Defense projects O&M funding of $117.9 million in FY 2013, $143.1 million in FY 2014, and $146.8 million in FY 2015 should transfer to the Joint Department of Defense – Department of Veterans Affairs Medical Facility Demonstration Fund established by section 1704 of Public Law 111-84 (National Defense Authorization Act for FY 2010). Additionally, the Department projects O&M funding for $15 million in FY 2013, $15 million in FY 2014, and $15 million in FY 2015 should transfer to the DoD-VA Health Care Sharing Incentive Funding established by Title 38, Section 8111 of the United States Code (USC) and Section 721 of Public Law 107-314 (National Defense Authorization Act for 2003). 5/ Reflects DoD Medicare-Eligible Retiree Health Care Fund (MERHCF) O&M Receipts for FY 2013, FY 2014, and FY 2015.
56
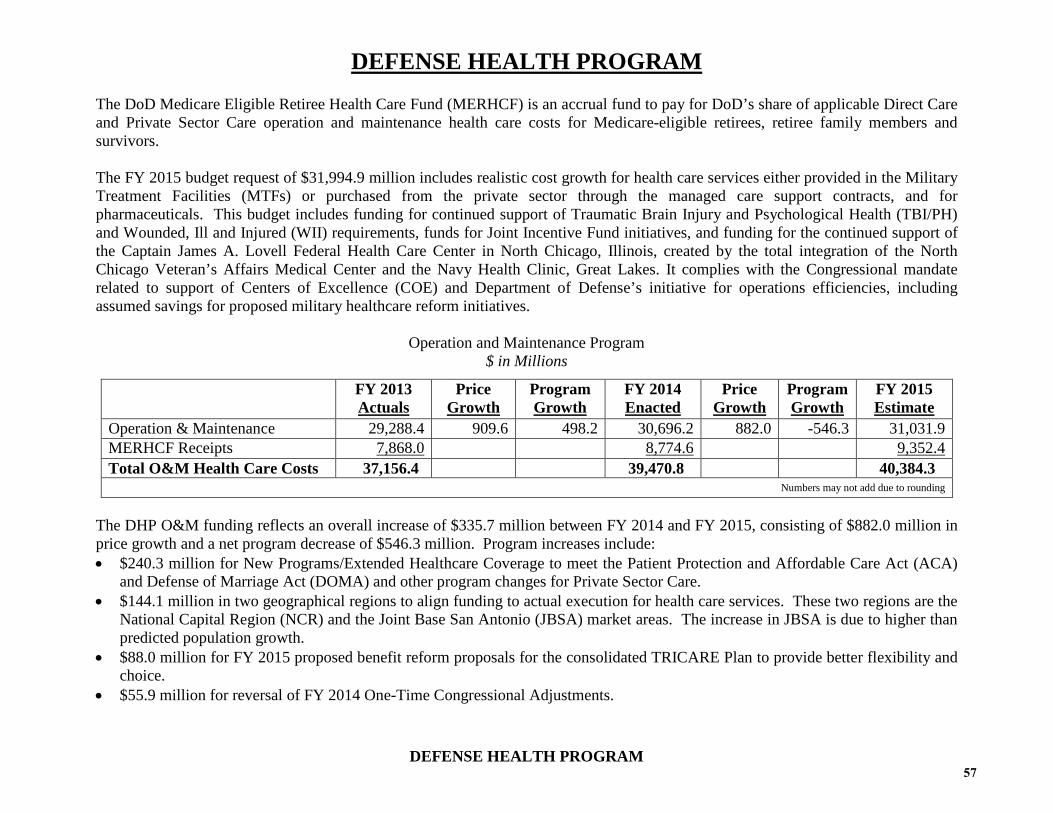
DEFENSE HEALTH PROGRAM
DEFENSE HEALTH PROGRAM
The DoD Medicare Eligible Retiree Health Care Fund (MERHCF) is an accrual fund to pay for DoD’s share of applicable Direct Care and Private Sector Care operation and maintenance health care costs for Medicare-eligible retirees, retiree family members and survivors. The FY 2015 budget request of $31,994.9 million includes realistic cost growth for health care services either provided in the Military Treatment Facilities (MTFs) or purchased from the private sector through the managed care support contracts, and for pharmaceuticals. This budget includes funding for continued support of Traumatic Brain Injury and Psychological Health (TBI/PH) and Wounded, Ill and Injured (WII) requirements, funds for Joint Incentive Fund initiatives, and funding for the continued support of the Captain James A. Lovell Federal Health Care Center in North Chicago, Illinois, created by the total integration of the North Chicago Veteran’s Affairs Medical Center and the Navy Health Clinic, Great Lakes. It complies with the Congressional mandate related to support of Centers of Excellence (COE) and Department of Defense’s initiative for operations efficiencies, including assumed savings for proposed military healthcare reform initiatives.
Operation and Maintenance Program
$ in Millions
The DHP O&M funding reflects an overall increase of $335.7 million between FY 2014 and FY 2015, consisting of $882.0 million in price growth and a net program decrease of $546.3 million. Program increases include: • $240.3 million for New Programs/Extended Healthcare Coverage to meet the Patient Protection and Affordable Care Act (ACA)
and Defense of Marriage Act (DOMA) and other program changes for Private Sector Care. • $144.1 million in two geographical regions to align funding to actual execution for health care services. These two regions are the
National Capital Region (NCR) and the Joint Base San Antonio (JBSA) market areas. The increase in JBSA is due to higher than predicted population growth.
• $88.0 million for FY 2015 proposed benefit reform proposals for the consolidated TRICARE Plan to provide better flexibility and choice.
• $55.9 million for reversal of FY 2014 One-Time Congressional Adjustments.
FY 2013 Actuals
Price Growth
Program Growth
FY 2014 Enacted
Price Growth
Program Growth
FY 2015 Estimate
Operation & Maintenance 29,288.4 909.6 498.2 30,696.2 882.0 -546.3 31,031.9 MERHCF Receipts 7,868.0 8,774.6 9,352.4 Total O&M Health Care Costs 37,156.4 39,470.8 40,384.3
Numbers may not add due to rounding
57

DEFENSE HEALTH PROGRAM
DEFENSE HEALTH PROGRAM
• $25.6 million in additional funding to address a refined information technology mission focused on data interoperability, implementation of national health data standards for the seamless integrated sharing of electronic health data between the DoD and Department of Veterans Affairs (VA) and other health partners, and the Defense Health Management System Modernization (DHMSM).
• $25.2 million for increases to support legacy IM/IT systems such as Clinical Information System (CIS) and Armed Services Blood Program Office (ASBPO); and for the Armed Forces Billing and Collection Utilization Solution (ABACUS).
• $14.9 million for transfer of the non-operational activities associated with the US Special Operations Command (USSOCOM) embedded behavioral health and warrior care program.
• $9.3 million for net changes to meet education and training programs to focus on changing industry standards, staff development, simulation, and academic enrichment.
• $8.2 million to support Department of Defense financial statement auditing efforts. • $7.5 million for base operations costs associated with the new US Army Research Institute for Chemical Defense (USAMRICD)
facility. • $7.1 million for base operations costs such as hospital/clinic laundry, utilities, and base support services. • $6.1 million for critical bio-surveillance activities at the Armed Forces Health Surveillance Center (AFHSC). • $3.5 million to support operations at six additional National Intrepid Center of Excellence (NICoE) satellite facilities under
construction. Program decreases include: • $382.3 million for initial outfitting and transition (IO&T) based upon updated military construction (MILCON) projects and
restoration and modernization (R&M) requirements. • $180.0 million for FY 2015 proposed benefit reform proposals for the pharmacy co-pays. • $177.9 million for equipment purchases to match normal life-cycle replacement rate. • $157.0 million in Shared Services Savings (these are net savings to include initial investment requirements). • $91.6 million for savings associated with the Military Health System (MHS) Modernization study. • $80.5 million decrease in Facilities Sustainment, Restoration and Modernization (FSRM) to normalize the annual investment
profile to meet a more consistent risk mitigation and acquisition management strategy. • $44.3 million for efficient spending through reduced travel and printing costs. • $35.1 million for Department directed 20% management headquarters reductions. • $23.3 million reduction of biodefense vaccines based upon projected population changes. • $6.3 million for savings associated with reshaping the MHS civilian workforce. • $3.7 million for transfer of Commercial Airline Travel Program (CATP) to the Services and for various rate changes such as
Defense Information Systems Agency (DISA), Defense Finance and Account Services (DFAS), and DHHQ Force Protection.
58

DEFENSE HEALTH PROGRAM
DEFENSE HEALTH PROGRAM
Continuing in FY 2015, the Department projects $146.8 million should transfer to the Joint Department of Defense (DoD) - Department of Veterans Affairs (VA) Medical Facility Demonstration Fund established by section 1704 of Public Law 111-84, (National Defense Authorization Act for FY 2010). Continuing in FY 2015, the Department projects $15 million should transfer to the DoD-VA Health Care Sharing Incentive Fund established by Section 8111, Title 38, of the United States Code (USC) and Section 721 of Public Law 107-314(National Defense Authorization Act for 2003).
Research, Development, Test and Evaluation (RDT&E) Program
$ in Millions
The DHP RDT&E Program reflects a net decrease of $897.7 million between FY 2014 and FY 2015. This includes price growth of $27.9 million and a net program decrease of $925.6 million. Program increases include: • $139.4 million in additional funding to address a refined information technology mission focused on data interoperability,
implementation of national health data standards for the seamless integrated sharing of electronic health data between the DoD and Department of Veterans Affairs (VA) and other health partners, and the Defense Health Management System Modernization (DHMSM).
• $5.7 million for OCONUS Laboratory Infrastructure Support sustainment costs associated with administrative and facility functions at the various Army laboratories.
• $1.2 million in various smaller enhancements/realignments (these are the net of increases and decreases). Program decreases include: • $909.4 million due to FY 2014 one-time Congressional adds to the Defense Health Program RDT&E appropriation. • $80.8 million for medical/health Research coinciding with a reduction in capability gaps in the diagnosis and treatment of brain
injury, psychological health (PH), polytrauma and blast injury, injury prevention and reduction, radiation health, and rehabilitation.
FY 2013 Price Program FY 2014 Price Program FY 2015 Actuals Growth Growth Enacted Growth Growth Estimate 1,017.7 17.3 517.3 1,552.3 27.9 -925.6 654.6
Numbers may not add due to rounding
59

DEFENSE HEALTH PROGRAM
DEFENSE HEALTH PROGRAM
• $35.5 million to IO&T requirements associated with the US Army Medical Research Institute of Infectious Disease (USAMRIID) and the US Army Medical Research Institute of Chemical Defense (USAMRICD) military construction (MILCON) projects.
• $31.1 million to central IM/IT funding associated with the planned completion and integration efforts for various DHP IM/IT platforms such as the Health Artifact and Image management solution (HAIMS) application and the Federated Registries Framework.
• $9.1 million to Air Force non-warfighter injury research funding to allow a focus on continuing the pace of progress in critical and higher priority research areas.
• $3.3 million to support the operations and maintenance at the Pacific-Based Joint Information Technology Center-Pacific (JITC-Pacific).
• $2.7 million in various smaller enhancements/realignments (these are the net of increases and decreases).
Procurement Program $ in Millions
The DHP Procurement Program has a net decrease of $133.4 million between FY 2014 and FY 2015. This consists of $12.4 million in price growth and program decrease of $145.8 million. Program increases include: • $45.7 million for various IM/IT equipment purchases, Military Treatment Facility (MTF) communications requirements - Local
Area Network (LAN), and Health Artifact and Image Management Solution (HAIMS). • $32.9 million associated with the transfer of responsibilities for the new IT initiative from the Program Executive Office Defense
Healthcare Management Systems (PEO DHMS) to the Defense Health Agency (DHA). • $9.2 million in additional funding to address a refined information technology mission focused on data interoperability,
implementation of national health data standards for the seamless integrated sharing of electronic health data between the DoD and Department of Veterans Affairs (VA) and other health partners.
• $2.1 million investment related to the consolidation of the DHA Shared Services Health Information Technology (HIT) Portfolio initiative.
Program decreases include:
FY 2013 Price Program FY 2014 Price Program FY 2015 Actuals Growth Growth Enacted Growth Growth Estimate 336.8 8.4 96.5 441.8 12.4 -145.8 308.4
Numbers may not add due to rounding
60

DEFENSE HEALTH PROGRAM
DEFENSE HEALTH PROGRAM
• $67.7 million for reduced IM/IT equipment in the areas of End User Devices (EUDs) replacement, LAN and Server Upgrades due to the cyclical nature of hardware refresh.
• $5.2 million in Health Artifact and Image Management Solution Procurement due to completion of deployment and training activities prior to FY 2015 and out funding planned for cyclical refresh.
• $3.3 million in Armed Forces Health Longitudinal Technology Application (AHLTA) associated with completion of one-time Local Cache Server refresh in FY 2014.
• $2.0 million to Joint Electronic Health Records Interoperability (JEHRI) predominately due to the planned refresh of hardware in FY 2014.
• $1.8 million associated with planned completion of additional training requirements in FY 2014 as TMIP-J program nears full deployment decision for Increment 2.
• The following reductions are related to Departmental initiatives: - $65.0 million reduction in medical equipment Replacement and Modernization (R&M). - $43.0 million reduction in non-medical programs for Initial Outfitting Equipment (IO&T). - $30.0 million reduction in medical programs for IO&T. - $16.0 million reduction in non-medical equipment R&M.
• $1.7 million in various smaller enhancements/realignments (these are the net of increases and decreases).
61

DRUG INTERDICTION AND COUNTERDRUG ACTIVITIES, DEFENSE
DRUG INTERDICTION AND COUNTERDRUG ACTIVITIES, DEFENSE
$ in Millions
Activity FY 2013 Actual/1 FY 2014 Enacted/2 FY 2015 Estimate/3 International Support 559.6 539.2 509.2 Intelligence, Technology, and Other 166.1 144.8 110.9 Domestic Support 251.4 211.3 98.9 Drug Demand Reduction 126.5 120.6 101.6 Available Balance 391.3 NA NA Total 1,494.9 1,015.9 820.7 1 FY 2013 excludes $204.9 million of FY 2012 OCO funding that was obligated in FY 2013. $391.3 million of FY 2013/2014 OCO funding remains available for obligation in FY 2014. 2 FY 2014 enacted excludes $376.3 million for OCO and $391.3 million of available FY 2013/2014 OCO funds available for obligation in FY 2014. 3 FY 2015 excludes OCO funding.
Description of Operations Financed: The Drug Interdiction and Counterdrug Activities authorities and resources provide useful and flexible ways to achieve national security goals, while maintaining a drug-free military and civilian workplace. The threat to United States national security posed by illicit drugs extends beyond traditional challenges to public health and safety. The drug trade is a powerful corrosive that weakens the rule of law in affected countries, preventing governments from effectively reducing or containing other transnational hazards, such as terrorism, insurgency, organized crime, weapons trafficking, money laundering, human trafficking, and piracy. For the Department of Defense (DoD), the connections between international narcotics trafficking and international terrorism constitute a threat to the national security interests of the United States. The global and regional terrorists who threaten United States interests finance their activities with the proceeds from narcotics trafficking. Programs funded by the DoD Drug Interdiction and Counterdrug Activities resources detect, monitor and support the interdiction, disruption or curtailment of emerging narcotics-related threats to our national security. In accordance with its statutory authorities, the DoD uses its Drug Interdiction and Counterdrug Activities resources and authorities as effectively and efficiently as possible to achieve national and Departmental counternarcotics priorities by addressing two activities known as Counternarcotics (CN) and Drug Demand Reduction (DDR):
62

DRUG INTERDICTION AND COUNTERDRUG ACTIVITIES, DEFENSE
DRUG INTERDICTION AND COUNTERDRUG ACTIVITIES, DEFENSE
• CN focuses on helping local, state, federal and foreign agencies address the threats posed by illicit drug trafficking and narco-
terrorism, by:
- Detecting and monitoring drug trafficking; - Intelligence analysis and information sharing; and - Helping countries build their capacity to control ungoverned spaces, where trafficking activities flourish.
• DDR focuses on maintaining DoD readiness by:
- Urinalysis drug testing of service members, DoD civilian personnel in testing designated positions, and applicants for military service and DoD civilian pre-employment testing; and
- Prevention, education, and outreach programs to military and civilian communities to raise awareness of the adverse consequences of illicit drug use on one’s performance, safety, health, family stability, fiscal security, and employment opportunities.
The DoD provides, through Combatant Commands, the Military Departments, and the Defense Agencies, unique military personnel, systems, and capabilities that support domestic law enforcement agencies and foreign security forces involved in counternarcotics activities, including efforts to counter activities that aid, benefit from, or are related to narcotics trafficking. This broad-scope support is provided primarily under the authorities contained in 10 U.S. Code § 124, 371-374, 379-381, 2576, 2576a, Title 32 U.S. Code, § 112, Section 1004, National Defense Authorization Act for 1991, as amended; Section 1033 of the National Defense Authorization Act for 1998, as amended, and Section 1022 for the National Defense Authorization Act for 2004, as amended. The Office of Deputy Assistant Secretary of Defense, Counternarcotics and Global Threats, by direction of the Under Secretary of Defense for Policy, is the focal point for most of DoD’s counternarcotics activities, ensuring that the DoD develops and implements a focused counternarcotics program with clear priorities and measured results. The Office of the Under Secretary of Defense, Personnel and Readiness, manages the Drug Demand Reduction Program, ensuring that the dangers of drug misuse in the DoD are understood, and that the misuse of narcotics within the Department is prevented, identified, and treated, in order to keep the fighting force at the highest possible levels of readiness. Consistent with applicable laws, authorities, regulations, and resources, the DoD will ensure that sufficient forces and resources are allocated to the counternarcotics mission to achieve high-impact results.
63

DRUG INTERDICTION AND COUNTERDRUG ACTIVITIES, DEFENSE
DRUG INTERDICTION AND COUNTERDRUG ACTIVITIES, DEFENSE
The areas that receive resources continue to be where DoD’s capabilities will provide the highest impact on the drug threat, while at the same time contributing to the overseas contingency operations and enhancing national security. The DoD efforts and priorities are evaluated continually, based upon the changing drug threat and participating nations’ needs. The FY 2015 request represents a decrease of $195.2 million from the FY 2014 enacted, or a 19% reduction. The majority of the reductions were achieved by decreases to intelligence programs, the elimination of the National Guard counternarcotics schools, reductions to foreign capacity building programs managed by the Geographic Combatant Commands, and reductions to drug testing rates and the variety of drugs screened for abuse. INTERNATIONAL SUPPORT: Situation: Financial, organizational, political, and operational linkages exist among narcotics trafficking, smuggling, insurgency, and terrorism. While the primary motivation of narcotraffickers remains greed and the accumulation of wealth, there is also a growing use of narcotics trafficking in support of terrorism and insurgent operations. Strategy: DoD has expanded its CN mission to include targeting those terrorists organizations worldwide that use the proceeds of narcotics trafficking to support terrorist activities. In order to support the overseas contingency operations, DoD will direct its resources to regions where terrorists benefit from illicit drug revenue or use drug smuggling systems. DoD CN efforts enable the United States to: • Defend the homeland in depth: CN efforts provide detection, monitoring and interdiction of threats moving toward Continual
United States
• Defeat terrorist networks: CN efforts deny terrorists a key source of financing
• Shape the choices of countries at the strategic crossroads: CN efforts strengthen alliances with partner nations by reducing transnational hazards including terrorism and crime
• Conduct irregular warfare and stabilization, security, transition and reconstruction operations: CN efforts place US forces in
partner nations, providing training, equipment and infrastructure required to build their capacity
• Conduct strategic engagement: CN efforts provide mil-to-mil and mil-to-civ engagement opportunities
64
DRUG INTERDICTION AND COUNTERDRUG ACTIVITIES, DEFENSE
DRUG INTERDICTION AND COUNTERDRUG ACTIVITIES, DEFENSE
• Enable host countries to provide good governance: CN efforts allow partner nations to gain control of their borders and ungoverned spaces
• Enable the success of integrated foreign assistance: CN efforts are a vital part of the security assistance offered to partner nations
Overall, the Department’s CN efforts contribute to homeland defense, foster cooperation with U.S. agencies and strengthen alliances with partner nations, and form relationships with new international partners otherwise reluctant to cooperate with DoD in counter-terrorism and other military activity. Continuing CN efforts are critical to meeting the Department’s responsibilities in the National Drug Control Strategy.
INTELLIGENCE AND TECHNOLOGY SUPPORT:
Situation: The very nature of smuggling requires the Department of Defense to collect intelligence from all sources in order to detect and monitor illicit drug trafficking, and to provide that information to the appropriate interdiction forces. Accordingly, the Department notified Congress, pursuant to 50 U.S.C. § 414 (a)(3)(C), that the Department of Defense intends to make funds appropriated for Drug Interdiction and Counterdrug Activities of the Department of Defense available for the all-source collection of counternarcotics intelligence. Strategy: The use of new technology continues to be instrumental in combating narcoterrorist activities. DoD will continue to test, evaluate, develop and deploy technologies that are used to collect and survey suspect narcoterrorist smuggling operations in the air, land, or sea. DoD actively pursues the merging of disparate data and sensor feeds into a common operating picture, to provide worldwide counternarcotics elements with counter-narcoterrorism intelligence and operational awareness. DOMESTIC SUPPORT: Situation: Since 1989, the Department of Defense has provided military support to domestic law enforcement agencies at the State, local and Federal levels, providing the requested operational, training and intelligence support. Strategy: DoD limits its domestic contributions to the counternarcotics efforts to those functions that are militarily unique and benefit the Department’s primary missions. Primary responsibility for military support to domestic law enforcement resides with the National Guard, thus freeing active duty and Reserve units for operations in support of the overseas contingency operations. Domestic support includes translation, intelligence, communications, aerial and ground reconnaissance, transportation, border fence and road construction, eradication (excluding contraband destruction), and training.
65

DRUG INTERDICTION AND COUNTERDRUG ACTIVITIES, DEFENSE
DRUG INTERDICTION AND COUNTERDRUG ACTIVITIES, DEFENSE
DEMAND REDUCTION: Situation: Illegal drugs are readily available to Department of Defense service and civilian members; the use is incompatible with their military mission and responsibilities in security sensitive positions. Strategy: The Department’s approach emphasizes prevention of drug use through pre-accession and random drug testing, anti-drug education and outreach programs. Emphasis is placed on deterring drug use, to include the misuse of prescription medications, through cost effective drug testing with appropriate consequences for members who are identified as drug users. The Department randomly tests all military members at a minimum rate of one test per year per member and civilian employees in testing designated positions once every two years. SUMMARY OF FY 2015 FUNDING REQUEST: International Support ($509.2 million): The FY 2015 request includes a decrease of $30 million for International Support from FY 2014. Counter-narcoterrorism programs support efforts in the U.S. Central Command, U.S. Southern Command, U.S. Pacific Command, U.S. Northern Command (Mexico), U.S. Africa Command and U.S. European Command Areas of Responsibilities (AORs) to detect, interdict, disrupt or curtail activities related to substances, material, weapons or resources used to finance, support, secure, cultivate, process or transport illegal drugs. CN funds will support operations in these AORs, including Section 1033 support; detection and monitoring platforms and assets; and AOR Command and Control support, including operations of Joint-Interagency Task Forces West and South. Intelligence and Technology Support ($110.9 million): The FY 2015 request includes a decrease of $33.9 million for Intelligence and Technology Support from FY 2014. Intelligence programs collect, process, analyze, and disseminate information required for counter-narcoterrorism operations. CN funds will provide counter-narcoterrorism intelligence support and analysis; signals intelligence (SIGINT) collection and processing; and Military Service and Special Operations command and control programs. Domestic Support ($98.9 million): The FY 2015 request includes a decrease of $112.4 million for Domestic Support from FY 2014. This funding will continue to support federal, state and local drug law enforcement agencies (DLEAs) requests for domestic operational and logistical support, and will assist the DLEAs in their efforts to reduce drug-related crime. Specifically, funds will support the portion of the National Guard State Plans that supports domestic law enforcement efforts. Funds will also provide Domestic Operational Support, such as US Northern Command (NORTHCOM) counter-narcoterrorism support to DLEAs and Title 10 National Guard translation efforts.
66

DRUG INTERDICTION AND COUNTERDRUG ACTIVITIES, DEFENSE
DRUG INTERDICTION AND COUNTERDRUG ACTIVITIES, DEFENSE
Drug Demand Reduction ($101.6M): The FY 2015 request includes a decrease of $19 million for Demand Reduction from FY 2014. This funding will support efforts to detect and deter the misuse of illicit and prescription drugs among military personnel. A total of $4.0 million is for the Military Services, National Guard, and DoD Agencies outreach, prevention and education programs, $33.3 million is for drug test collections, and $64.3 million is for drug testing laboratories and associated costs. These funds support a minimum of 100 percent random drug testing for active duty military, National Guard and Reserve personnel; drug testing for all DoD civilian employee applicants and civilians in testing designated positions once every two years; drug abuse prevention/education activities for military and civilian personnel and their dependents.
67

ENVIRONMENTAL PROGRAMS
ENVIRONMENTAL PROGRAMS
$ in Millions
FY 2013 Actual
Price Growth
Program Growth
FY 2014 Enacted
Price Growth
Program Growth
FY 2015 Estimate
Environmental Restoration 1,352.6 23.0 17.7 1,393.3 25.2 -314.0 1,104.5 Environmental Compliance 1,347.3 22.9 121.3 1,491.5 26.9 -60.7 1,457.7
Environmental Conservation 384.3 7.2 18.2 409.7 7.2 -35.9 381.0 Pollution Prevention 65.5
2.0 38.1 105.6 2.0 11.8 119.4
Environmental Technology 195.1 3.3 7.8 206.2 3.7 -38.0 171.9 Base Realignment & Closure (BRAC) 447.4 7.5 -75.6 379.3 6.7 -121.7 264.3 Total Environmental Program/1 3,792.2 65.9 127.5 3,985.6 71.7 -558.5 3,498.8
Numbers may not add due to rounding 1 Includes environmental funding for all DoD appropriations/funds, not only those funded in the Operation and Maintenance (O&M) accounts.
The Department of Defense (DoD) Environmental Programs address five overriding and interconnected goals: (1) to support the readiness of U. S. Forces by ensuring access to air, land, and water for training and operations; (2) to improve the quality of life by protecting military personnel and families from environmental, safety, and health hazards; (3) to ensure that weapons systems, logistics, installations, et. al., have better performance, lower total ownership costs, and permissible health and environmental effects; (4) to serve customers, clients, and stakeholders through public participation and advocacy; and (5) to enhance international security through military-to-military cooperation. To help achieve these goals, the Department established its environmental program around five pillars -- cleanup, compliance, conservation, pollution prevention, and environmental technology. The FY 2015 budget request of $3,498.8 million decreases by $486.8 million, which includes price growth of $71.7 million and a net program decrease of $558.5 million, (-14.0 percent). The decrease reflects reductions in every program except pollution prevention.
Environmental Restoration (ER)
The Department’s Environmental Restoration (ER) program (DERP) focuses on reducing the risks to human health and the environment at active installations and Formerly Used Defense Sites (FUDS), while ensuring that DoD environmental cleanup policy conforms to existing laws and regulations. The DoD ER appropriations provide for: the identification, investigation, and cleanup of contamination from hazardous substances and wastes, and contamination from unexploded ordnance (UXO), discarded military munitions, and munitions constituents at other than operational ranges; correction of other environmental damage; and the
68

ENVIRONMENTAL PROGRAMS
ENVIRONMENTAL PROGRAMS
demolition and removal of unsafe buildings, structures, and debris. In FY 1996, the DoD began a relative risk approach to environmental cleanup. This process enables the Department to prioritize cleanup activities at sites that pose the greatest danger to the health and safety of the environment and public in the context of regulatory agreements. The relative risk process is the key tool used by the Department in the planning, programming, and budgeting of the cleanup program as well as its execution.
In FY 2013, the DoD performed a thorough review and analysis of the existing DERP goals, and in March 2013, established updated and consolidated DERP goals. The updated goals reflect the maturation of the DERP, further enabling the DoD Components to advance sites through the final phases of cleanup to site closeout. These goals allow for increased flexibility to apply resources where most needed, and in the most cost-effective manner. They will also enable the Department to demonstrate overall program progress in a more streamlined, transparent fashion. In February 2014, the DoD established a new goal for munitions response sites (MRSs) at Formerly Used Defense Sites (FUDS). This goal requires the DoD to take significant, well planned-out and coordinated actions to reduce the risk to human health and the environment potentially posed by FUDS MRSs. The Department funds its ER program to ensure the Military Departments and Defense Agencies meet all legal agreements and ensure compliance with DoD cleanup goals. The budget also clearly identifies funding requirements for response actions to address UXO, discarded military munitions, and munitions constituents at other than operational ranges. Overall, the Department continues to make progress in moving its restoration sites through the cleanup process, and is on schedule to meet its goal of completing the vast majority of its cleanup by 2021.
Between FY 2014 and FY 2015, the Department’s Defense ER Program reflects a net decrease of $289.0 million; reflecting price growth of $25.2 million and programmatic decrease of $314.0 million (-22.5 percent). The FY 2015 program decrease of $314.0 million primarily reflects a larger decrease in the Army (-$143.2 million) and Navy (-$44.5 million) due to the adjusted execution targets and FUDS programs (-$84.2 million), reflecting the decrease from the Congressional add of $50 million in FY 2014. The decrease in the Air Force (-$39.1 million) reflects the completion of more of the investigation and analysis phases. There is also a small reduction in Defense-Wide (-$3.0 million).
The following table displays the ER Transfer appropriations.
69

ENVIRONMENTAL PROGRAMS
ENVIRONMENTAL PROGRAMS
Environmental Restoration Transfer Appropriations
$ in Millions FY 2013
Actual/1 Price
Growth Program Growth
FY 2014 Enacted/2
Price Growth
Program Growth
FY 2015 Estimate
ER, Army 289.7 4.9 44.1 338.7 6.1 -143.2 201.6 ER, Navy 287.2 4.9 24.0 316.1 5.7 -44.5 277.3 ER, Air Force 487.3 8.3 -55.8
439.8 8.0 -39.1 408.7
ER, Formerly Used Def. Sites 277.3 4.7 5.4 287.4 5.2 -84.2 208.4 ER, Defense-Wide 11.1 0.2 0.0 11.3 0.2 -3.0 8.5 Total 1,352.6 23.0 17.7 1,393.3 25.2 -314.0 1,104.5
Numbers may not add due to rounding 1 Includes the total amounts reprogrammed from the ER Transfer account for various ER activities. 2 Includes budget authority carried forward into FY 2014 for the ER, Army ($39.9 million) and ER, Defense-Wide ($0.5 million) accounts.
70

ENVIRONMENTAL PROGRAMS
ENVIRONMENTAL PROGRAMS
Environmental Compliance
The FY 2015 compliance program includes sufficient resources to enable the Department’s day-to-day operations to comply with federal, state and local government enforcement of current environmental laws and regulations. Environmental Compliance projects include projects to comply with the Clean Air Act, storm water management under the Clean Water Act, hazardous waste management, testing and remediation of underground storage tanks, and monitoring waste water treatment systems. In FY 2015, the environmental compliance program reflects a net decrease of $33.8 million. This decrease reflects a price growth of $26.9 million and a programmatic decrease of $60.7 million (-4.1 percent). The program decrease of $60.7 million consists of the following: decreases in Navy costs (-$42.4 million) caused by reductions in recurring costs, as well as, removal of a one-time FY2014 Congressional increase; Air Force costs (-$36.0 million) caused by reductions in recurring costs; and Defense-Wide (-$24.4 million) caused by the completion of 3 one-time projects to comply with the Clean Water Act; offset by increases in the Army ($7.2 million) and Marine Corps ($42.4 million) caused by a one-time project to address Safe Drinking Water Act requirements.
Environmental Conservation
The DoD is the steward of about 28 million acres of public lands. The DoD has a responsibility to protect, maintain, and enhance the natural and cultural resources found on these lands. Through the conservation program, biological and cultural resources are managed to help support the military mission. Additionally, conservation activities are required by law (e.g., Endangered Species Act, Sikes Act, and National Historic Preservation Act) and must be funded. In FY 2015, the Environmental Conservation funding reflects a net decrease of $28.7 million, due to price growth of $7.2 million and a program decrease of $35.9 million (-8.8 percent). The program decrease of $35.9 million consists of decreases in the Navy (-$14.2 million) caused by completion of various studies, Air Force (-$12.4 million) due to reductions in other recurring costs, and Defense-Wide programs (-$22.9 million) caused by a reduction to range and environmental protection initiative funding, offset by increases in Army ($13.0 million) and Marine Corps ($0.6 million).
Pollution Prevention
The Pollution Prevention (P2) program targets the reduction of hazardous material, solid waste, toxic releases, air emissions, and water pollution at the source. The funding requested for FY 2015 will support these efforts, as well as implementation of Executive Order 13514, "Federal Leadership in Environmental, Energy, and Economic Performance" and Executive Order 13423, "Strengthening Federal Environmental, Energy, and Transportation Management". In FY 2015, the Pollution Prevention program reflects a net increase of $13.8 million. This reflects a price increase of $2.0 million and a program increase of $11.8 million (11.2 percent). The program increase results from increases in the Army’s program ($10.8 million) to reduce hazardous and toxic materials in the logistics chain.
71

ENVIRONMENTAL PROGRAMS
ENVIRONMENTAL PROGRAMS
Environmental Technology Technology development is important to meet DoD-unique environmental needs with programs that yield quick results and have high payoffs, including accelerating the development and deployment of technologies that address issues such as shipboard discharges, noise and air emissions, exposure to toxic chemicals, and remediation of soil, surface, and ground water contamination from explosives. The FY 2015 request allows DoD to continue environmental research, development, test, demonstration, and validation activities to provide technologies that result in direct operational savings, mitigate future liabilities, and permit the Department to meet both its mission and environmental obligations more cost-effectively. In FY 2015, the Environmental Technology program reflects a net decrease of $34.3 million. This reflects a price increase of $3.7 million and a program decrease of $38.0 million (-18.4 percent). Environmental Technology funding remains relatively stable with program decreases of $38.0 million reflecting reductions in the Army (-$3.4 million), Navy (-$9.9 million), Air Force (-$0.5 million) and the Defense-Wide Program (-$22.0 million). Environmental RDT&E funding decreases at the Service level are due to the completion of high dollar projects, and leveraging with other federal agencies and industry. Additionally, environmental technology requirements are increasingly captured in other funding lines such as material substitution, production processes, operations & maintenance, and weapon system acquisition program elements.
Base Realignment and Closure (BRAC)
The DoD is striving to complete scheduled base closures as rapidly as possible to realize potential savings to the government and to make property available to local communities for redevelopment. To do this, the DoD must complete ER and compliance work at these bases. In FY 2015, the BRAC environmental program reflects a net decrease of $115.0 million. This reflects a price increase of $6.7 million and a program decrease of $121.7 million (-32.1 percent). The program decrease primarily reflects a reduced need for requested funds, as the consolidation of the BRAC accounts provided increased flexibility in the use of unobligated prior year balances across the BRAC cleanup inventory. There is also a reduction in requirements as cleanups are completed.
72
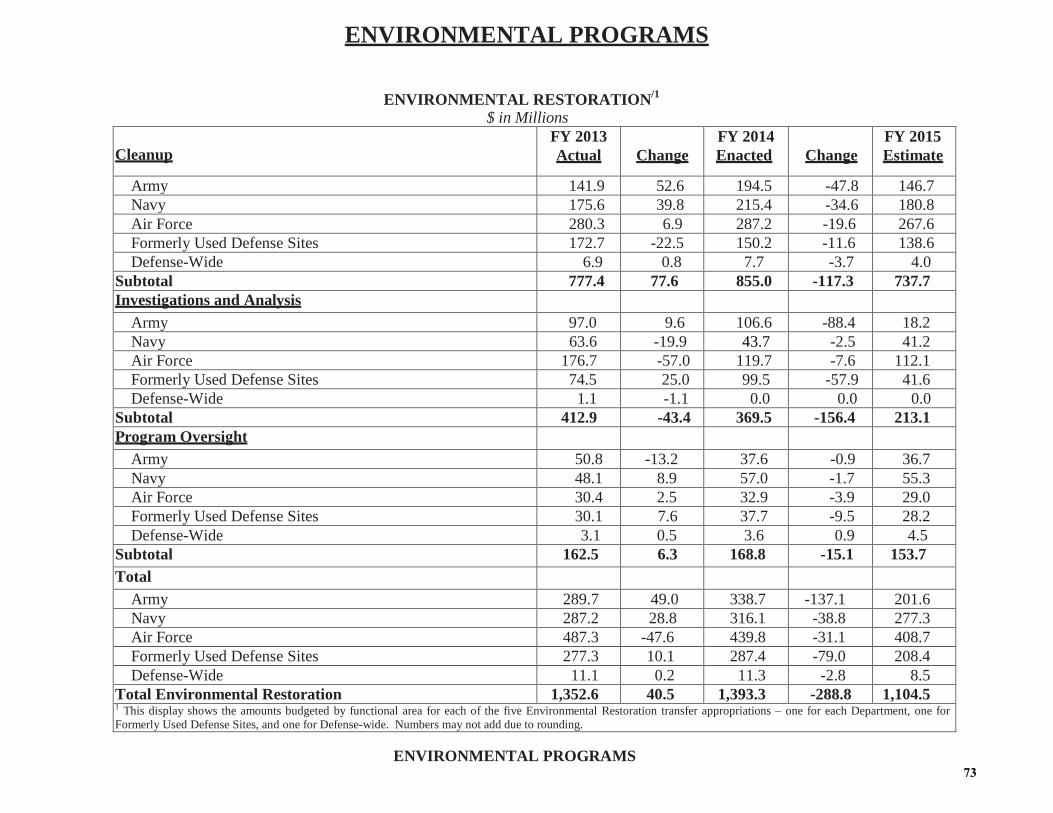
ENVIRONMENTAL PROGRAMS
ENVIRONMENTAL PROGRAMS
ENVIRONMENTAL RESTORATION/1
$ in Millions Cleanup
FY 2013 Actual
Change
FY 2014 Enacted
Change
FY 2015 Estimate
Army 141.9 52.6 194.5 -47.8 146.7 Navy 175.6 39.8 215.4 -34.6 180.8 Air Force 280.3 6.9 287.2 -19.6 267.6 Formerly Used Defense Sites 172.7 -22.5 150.2 -11.6 138.6 Defense-Wide 6.9 0.8 7.7 -3.7 4.0
Subtotal 777.4 77.6 855.0 -117.3 737.7 Investigations and Analysis
Army 97.0 9.6 106.6 -88.4 18.2 Navy 63.6 -19.9 43.7 -2.5 41.2 Air Force 176.7 -57.0 119.7 -7.6 112.1 Formerly Used Defense Sites 74.5 25.0 99.5 -57.9 41.6 Defense-Wide 1.1 -1.1 0.0 0.0 0.0
Subtotal 412.9 -43.4 369.5 -156.4 213.1 Program Oversight
Army 50.8 -13.2 37.6 -0.9 36.7 Navy 48.1 8.9 57.0 -1.7 55.3 Air Force 30.4 2.5 32.9 -3.9 29.0 Formerly Used Defense Sites 30.1 7.6 37.7 -9.5 28.2 Defense-Wide 3.1 0.5 3.6 0.9 4.5
Subtotal 162.5 6.3 168.8 -15.1 153.7 Total
Army 289.7 49.0 338.7 -137.1 201.6 Navy 287.2 28.8 316.1 -38.8 277.3 Air Force 487.3 -47.6 439.8 -31.1 408.7 Formerly Used Defense Sites 277.3 10.1 287.4 -79.0 208.4 Defense-Wide 11.1 0.2 11.3 -2.8 8.5
Total Environmental Restoration 1,352.6 40.5 1,393.3 -288.8 1,104.5 1 This display shows the amounts budgeted by functional area for each of the five Environmental Restoration transfer appropriations – one for each Department, one for Formerly Used Defense Sites, and one for Defense-wide. Numbers may not add due to rounding.
73

ENVIRONMENTAL PROGRAMS
ENVIRONMENTAL PROGRAMS $ in Millions
ENVIRONMENTAL COMPLIANCE
FY 2013 Actual
Change
FY 2014 Enacted
Change
FY 2015 Estimate
Army 389.6 3.8 393.4 14.3 407.7 Navy 358.1 61.4 419.5 -34.8 384.7 Marine Corps 113.2 1.2 114.4 37.0 151.4 Air Force 298.5 57.4 355.9 -29.6 326.3 Defense-Wide 187.9 20.4 208.3 -20.7 187.6 Total Environmental Compliance 1,347.3 144.2 1,491.5 33.8 1,457.7
ENVIRONMENTAL CONSERVATION
FY 2013 Actual
Change
FY 2014 Enacted
Change
FY 2015 Estimate
Army 182.0 -9.8 172.2 16.6 188.8 Navy 59.3 7.7 67.0 -13.3 53.7 Marine Corps 34.8 -2.7 32.1 1.0 33.1 Air Force 58.7 8.5 67.2 -11.2 56.0 Defense-Wide 49.5 21.7 71.2 -21.8 49.4 Total Environmental Conservation 384.3 25.4 409.7 -28.7 381.0
POLLUTION PREVENTION
FY 2013 Actual
Change
FY 2014 Enacted
Change
FY 2015 Estimate
Army 23.9 9.1 33.0 11.4 44.4 Navy 6.6 0.3 6.9 2.9 9.8 Marine Corps 115.8 1.5 17.8 2.5 19.8 Air Force 15.2 28.2 43.4 -2.6 40.8 Defense-Wide 4.0 1.0 5.0 -0.4 4.6 Total Pollution Prevention 65.5 40.1 105.6 13.8 119.4
Numbers may not add due to rounding
74

ENVIRONMENTAL PROGRAMS
ENVIRONMENTAL PROGRAMS $ in Millions
ENVIRONMENTAL TECHNOLOGY
FY 2013 Actual
Change
FY 2014 Enacted
Change
FY 2015 Estimate
Army RDT&E, Army 45.5 0.6 46.1 -2.6 43.5 Navy RDT&E, Navy 39.8 -1.2 38.6 -9.2 29.4 Air Force
RDT&E, Air Force 1.0 0.0 1.0 0.8 1.8 Aircraft Procurement, Air Force 1.1 2.7 3.8 -3.8 0.0
Operation and Maintenance, Air Force 7.2 -1.4 5.8 2.5 8.3 Total Air Force 9.3 1.3 10.6 -0.5 10.1 Defense-Wide Strategic Environmental R&D Program (SERDP) 58.6 3.7 62.3 -4.5 57.8 Env Security Technology Certification Program 38.0 5.0 43.0 -16.5 26.5 Defense Warfighter Protection 3.9 1.7 5.6 -1.0 4.6 Total Defense-Wide 100.5 10.4 110.9 -22.0 88.9
Summary Total
Army 45.5 0.6 46.1 -2.6 43.5 Navy 39.8 -1.2 38.6 -9.2 29.4 Air Force 9.3 1.3 10.6 -0.5 10.1 Defense-Wide 100.5 10.4 110.9 -22.0 88.9 Total Environmental Technology 195.1 11.1 206.2 -34.3 171.9
Numbers may not add due to rounding
75

ENVIRONMENTAL PROGRAMS
ENVIRONMENTAL PROGRAMS $ in Millions
BASE REALIGNMENT&CLOSURE (BRAC)
FY 2013 Actual
Change
FY 2014 Enacted
Change
FY 2015 Estimate
Prior Round BRAC Army 106.0 23.8 129.8 -75.5 54.3 Navy 159.5
-29.4 130.1 -4.9 125.2
Air Force 108.6 10.8 119.4 -34.6 84.8 Defense-Wide 0.0 0.0 0.0 0.0 0.0 Total BRAC 95 374.1 5.2 379.3 -115.0 264.3 BRAC 2005 Army 57.8 -106.0 0.0 0.0 0.0 Navy 13.2 -13.2 0.0 0.0 0.0 Air Force 2.3 -2.3 0.0 0.0 0.0 Defense-Wide 0.0 0.0 0.0 0.0 0.0 Total BRAC 2005 73.3 -73.3 0.0 0.0 0.0 BRAC Grand Total Army 163.8 -34.0 129.8 -75.5 54.3 Navy 172.7 -42.6 130.1 -4.9 125.2 Air Force 110.9 8.5 119.4 -34.6 84.8 Defense-Wide 0.0 0.0 0.0 0.0 0.0 BRAC Grand Total 447.4 -68.1 379.3 -115.0 264.3
Numbers may not add due to rounding
76

OVERSEAS CONTINGENCY OPERATIONS TRANSFER FUND
OVERSEAS CONTINGENCY OPERATIONS TRANSFER FUND
THIS EXHIBIT WILL BE UPDATED UPON SUBMISSION OF THE
FY 2015 OVERSEAS CONTINGENCY OPERATIONS ESTIMATE
77

OVERSEAS HUMANITARIAN, DISASTER ASSISTANCE, AND CIVIC AID
OVERSEAS HUMANITARIAN, DISASTER ASSISTANCE, AND CIVIC AID
$ in Millions
FY 2013 Actual
Price Growth
Program Growth
FY 2014 Enacted
Price Growth
Program Growth
FY 2015 Estimate
108.6 3.2 -2.3 109.5 0.5 -10.0 100.0 The Overseas Humanitarian, Disaster Assistance, and Civic Aid (OHDACA) program includes the following:
• Humanitarian Assistance Program;
• Humanitarian Mine Action Program; and the
• Foreign Disaster Relief Program. The OHDACA programs support U.S. military forces in meeting two key requirements. The first is to maintain a robust overseas presence aimed at shaping the international security environment in a manner that deters would-be aggressors, strengthens friends and allies, and promotes peace and stability in unstable regions. The second requirement is for U.S. forces to respond effectively when called upon to assist the victims of storms, earthquakes, and other natural or manmade disasters outside the U.S. and Territories.
The OHDACA programs meet these needs by providing the regional Combatant Commanders (COCOM) with an unobtrusive, low-cost, but highly effective vehicle to carry out their peacetime engagement missions, while providing a valuable training benefit for U.S. troops. Furthermore, OHDACA augments the COCOM capabilities to respond rapidly and effectively to humanitarian crises. In providing relief to areas of need, the U.S. military gains substantial training benefits and obtains access to regions important to U.S. interests. The OHDACA programs enhance readiness across a number of operational areas including: command, control, communication and intelligence (C3I); civil affairs; and logistical support.
The programs conducted under OHDACA are coordinated with the Department of State and approved by the Office of the Secretary of Defense to ensure U.S. Government (USG) unity of effort and compliance with national security and foreign policy interests. In the process of carrying out these activities, a small amount of funding efficiently fosters multiple USG goals.
The FY 2015 OHDACA budget request is $100.0 million. The details, by major category, are described below:
78

OVERSEAS HUMANITARIAN, DISASTER ASSISTANCE, AND CIVIC AID
OVERSEAS HUMANITARIAN, DISASTER ASSISTANCE, AND CIVIC AID
Humanitarian Assistance Program and Funding $ in Millions
FY 2013 FY 2014 FY 2015
Total Program 105.0 83.8 79.2 The Humanitarian Assistance Program supports three objectives. These objectives are designed to (1) help avert political and humanitarian crises, (2) promote democratic development and regional stability, and (3) enable countries to recover from conflicts. These funds provide for HA projects for all COCOM’s. The HA projects and activities accomplish the three objectives by: donating and transporting excess non-lethal DoD property, supporting improved military presence in friendly nations, providing positive civilian/military interaction through addressing basic needs of local nationals, and by enabling the COCOM to assist countries by improving local crises response capacity to emergencies in their region. Funds would be spent on: transportation; provision of excess property; and other targeted assistance for disaster preparedness and mitigation. The funding also provides for acquisition, provision, and distribution of relief supplies; acquisition and shipment of transportation assets to assist in distribution; refurbishment and restoration of excess Defense equipment; and inspection, packaging and intermediary warehouse storage until excess items can be delivered. Current plans call for the COCOM to conduct HA activities as part of their regional security cooperation strategy. HA projects also include those that assist Non-Government Organizations (NGO) and recipient countries in building indigenous capabilities to respond to emergencies. Building this capability reduces the potential need for United States military involvement in future crisis response.
79

OVERSEAS HUMANITARIAN, DISASTER ASSISTANCE, AND CIVIC AID
OVERSEAS HUMANITARIAN, DISASTER ASSISTANCE, AND CIVIC AID
Humanitarian Mine Action Program and Funding $ in Millions
FY 2013 FY 2014 FY 2015
Total Program 5.6 5.7 5.8 The Humanitarian Mine Action Program supports the geographical COCOM planned humanitarian demining training and education activities. The COCOM plans include: assessments of newly designated countries; ongoing worldwide training operations; incremental funding of high-priority, emerging operations; and evaluations of current programs to determine if projected “end states” have been met.
Foreign Disaster Relief $ in Millions
FY 2013 FY 2014 FY 2015
Total Program 0.6 20.0 15.0
The Foreign Disaster Relief funding is requested specifically for disasters and maintains the standard two-year appropriation life-cycle as the rest of the OHDACA appropriation. However, should a large scale disaster occur during this period, it is likely that additional funding could be required. This funding supports the capacity of the Department, through the COCOM, to respond to natural and man-made disasters and to the humanitarian aspects of security crises. The emergency response program includes logistical support, search and rescue, medical evacuation, and refugee assistance, in the form of both supplies and services.
80

OFFICE OF INSPECTOR GENERAL
OFFICE OF INSPECTOR GENERAL
DEFENSE - WIDE
$ in Millions
FY 2013/1 Actual
Price Growth
Program Growth
FY 2014/2 Enacted
Price Growth
Program Growth
FY 2015/3 Estimate
$318.9 $3.4 -$6.3 $316.0 $3.7 -$7.8 $311.8
1 FY 2013 includes Overseas Contingency Operations (OCO) funding 2 FY 2014 enacted excludes $10.8 million of OCO funding 3 FY 2015 excludes OCO funding
Description of Operations Financed: The Office of Inspector General (OIG) audits, investigates, inspects, and evaluates the programs and operations of the Department of Defense (DoD) and, as a result, recommends policies and process improvements that promote economy, efficiency, and effectiveness in DoD programs and operations. The Inspector General is the only DoD official authorized to issue opinions on the financial statements of the DoD. In FY 2013 the OIG achieved $2,768 million in savings and $2,073 million in recovery. Overall Assessment: The FY 2015 budget request of $311.8 million reflects a programmatic decrease of $7.8 million. This decrease is primarily attributed to a one-time Congressional add in the FY 2014 Consolidated Appropriations Act of approximately $3.9 million, and to reduced advisory and assistance contract costs.
81

SUPPORT FOR INTERNATIONAL SPORTING COMPETITIONS
SUPPORT FOR INTERNATIONAL SPORTING COMPETITIONS
$ in Millions
FY 2013
Price
Program FY 2014
Price
Program
FY 2015 Actual Growth Growth Enacted Growth Growth Estimate
1.7 0.0 -1.7 0.0 0.0 10.0 10.0
The Support for International Sporting Competitions (SISC), Defense appropriation is a no-year appropriation that provides for continuing Department of Defense (DoD) support to national and international sporting events that are either certified by the Attorney General or support specific organizations such as the Special Olympics, Paralympics, and the United States Olympic Committee’s (USOC) Paralympic Military Program. Funds are still available from the FY 2003 DoD Appropriations Act (P.L. 107-248). The Department is requesting $10 million additional appropriated funds for FY 2015. In FY 2013, the Department supported 18 sporting events including the Special Olympics Team USA’s participation in the 2013 Special Olympics World Winter Games in Pyeong Chang, South Korea, and 17 events sanctioned by the United States Olympic Committee (USOC) under the Paralympic Military Program. In FY 2014, the Department plans to support up to 25 sporting events, including the Team USA’s participation in the 2014 Paralympic Winter Games in Sochi, Russia, Special Olympics USA Games in New Jersey, Special Olympics World Games test event in Los Angeles and up to 22 events sanctioned by the USOC under the Paralympic Military Program. The current account balance as of December 31, 2013 in the SISC account is approximately $3.3 million, which is available until expended. These funds are available to fund safety, security and logistical requirements for certain sporting competitions. Under the authority of 10 U.S.C., section 2564, the Department has the authority to assist Federal, State or local agencies in support of civilian sporting events, if the Attorney General certifies that such assistance is necessary to meet essential security and safety needs.
82

LAND FORCES
LAND FORCES
$ in Millions
FY 2013/1
Actual Price
Growth Program Growth
FY2014/2
Enacted Price
Growth Program Growth
FY 2015/3
Estimate Army Active 6,536.4 109.9 -4,654.3 1,992.0 18.3 1,075.3 3,085.5 Army Reserve 1,216.0 12.4 75.0 1,303.4 17.3 -151.3 1,169.3 Army National Guard 1,698.5 0.0 153.2 1,851.7 24.1 -210.3 1.665.5 Marine Corps Active 2,143.4 21.4 -1,508.8 656.2 8.8 240.8 905.7 Marine Corps Reserve 94.7 1.4 -4.4 91.7 1.7 -0.3 93.1 Total 11,689.2 145.0 -5,939.3 5,894.9 70.1 954.1 6,919.1 1 FY 2013 includes Overseas Contingency Operations (OCO) funding 2 FY 2014 enacted excludes $7,798 million of OCO funding including $1,316 million of base funds transferred to OCO 3 FY 2015 exclude OCO funding
The Land Forces program describes those resources committed to the training and sustainment of the Department’s land forces. Land Forces funding resides within the Land Forces activity group for the Army’s Active, Reserve, and National Guard Components; and the Operational Forces subactivity group for both the Marine Corps’ Active and Reserve Components. The FY 2015 President’s Budget reflects a net program increase of $954.1 million from FY 2014 enacted levels; mainly attributable to the restoral of $1,316 million of base funds transferred to the OCO in the FY 2014 Consolidated Appropriations Act.
ARMY The Army’s Land Forces program provides Ground Operating Tempo (OPTEMPO) resources to train and sustain the active component combat forces readiness levels consistent with mission requirements. The budget supports the Active Component ground OPTEMPO training strategy, encompassing actual miles driven for home station training (HST) and Combat Training Center (CTC) rotations as well as virtual miles associated with using simulators, such as the Close Combat Tactical Trainer (CCTT) and the Unit Conduct of Fire Trainer (UCOFT). The resourced training miles in each FY reflect all units across the force in a phased, expeditionary cycle at various Army Force Generation (ARFORGEN) readiness levels. Expenses include fuel, supplies, repair parts, travel, and transportation associated with day-to-day unit training operations and special training activities. The FY 2015 request reflects a program increase of $1,075.3 million.
83

LAND FORCES
LAND FORCES
The Army’s primary Ground OPTEMPO metric is the Full Spectrum Training Mile (FSTM), which was introduced in FY 2012. The FSTM metric is based on a composite average of key units and vehicles that conduct decisive action (Full Spectrum Operations) training and encompasses actual miles driven for home station training (HST) and Combat Training Center (CTC) rotations as well as virtual miles driven in simulators. The composition of vehicles in the FSTM metric includes the M1 Tank, M2 Infantry Fighting Vehicle, M3 Cavalry Fighting Vehicle, Stryker Vehicles, and the Up Armored High Mobility Multipurpose Wheeled Vehicle (HMMWV). In FY 2015, the Army will maintain an Army Contingency Force Package of Brigade Combat Teams, an aviation task force, and associated enablers that will be funded to maximum readiness levels to meet time-sensitive employment requirements. The remaining units will build to progressive readiness to achieve the highest readiness levels attainable with the associated funding.
The Army’s goal is to fund 1,415 FSTM to execute the Combined Arms Training Strategy (CATS) and prepare Army forces to conduct regular and irregular warfare against both conventional and hybrid threats. The FY 2015 President’s Budget increases the Ground OPTEMPO for non-deployed units from 616 FSTM in FY 2014 to 1,072 FSTM in FY 2015. The increase is primarily associated with program growth of $405.9 million for the FY 2014 transfer of funds from base to OCO in the primary OPTEMPO line item.
ARMY RESERVE The FY 2015 request reflects a program decrease of $151.3 million. The Army Reserve’s goal is to fund 1,589 FSTM. The request decreases the Ground OPTEMPO for non-deployed units from 1,361 FSTM in FY 2014 to 949 FSTM in FY 2015. The decrease is associated with the change in training strategy to fund units not tied to the Army Contingency Force package to the Individual/Crew/Squad level.
ARMY NATIONAL GUARD The FY 2015 request reflects a program decrease of $210.3 million. The Army National Guard’s goal is to fund 1,000 FSTM. The request decreases the Ground OPTEMPO for non-deployed units from 707 FSTM in FY 2014 to 537 FSTM in FY 2015. The decrease is associated with the change in training strategy to fund units not tied to the Army Contingency Force package to the Individual/Crew/Squad level.
84

LAND FORCES
LAND FORCES
MARINE CORPS The Operating Forces are considered the core element of the Marine Corps. About 71 percent of all active duty Marines are assigned to the Operating Forces. They provide the forward presence, crisis response and fighting power available to the Combatant Commanders. The Land Forces program supports the forces that constitute the Marine Air-Ground Team and Marine Security Forces at naval installations and aboard naval vessels. It provides for their training and routine operations, maintenance and repair of organic ground equipment, routine supplies, travel, per diem and emergency leave, information technology and internet support, and replenishment and replacement of both unit and individual equipment; as well as the movement of troops to participate in exercises directed by higher authority or the Commandant of the Marine Corps.
Program funding increases by $240.8 million from FY 2014 to FY 2015. The increase is primarily driven by the realignment of $200 million from base to OCO in the FY 2014 Consolidated Appropriations Act and additional equipment maintenance requirements. This is offset by reductions in civilian personnel and operation costs associated with end strength reductions.
The FY 2015 request funds Marine Corps deployable days to the target level of 88 percent.
MARINE CORPS RESERVE The FY 2015 President’s Budget reflects a net increase of $1.4 million from FY 2014 funding levels. There are increases for Marine Reserve Forces participation in joint exercises offset by reductions in equipment maintenance.
The FY 2014 request funds Marine Corps Reserve deployable days to the target level of 88 percent.
85

LAND FORCES
LAND FORCES
ARMY ACTIVE GROUND OPTEMPO
FY 2013 FY 2014/1 FY 2015
Full Spectrum Training Miles (FSTM) FSTM Required (Live Training) 1,570 1,027 1,383
FSTM Required (Virtual Training) 38 37 32 Total FSTM Required (Live + Virtual) 1,608 1,064 1,415
FSTM Executed/Budgeted (Live Training) 715 579 1,040 FSTM Executed/Budgeted (Virtual Training) 35 37 32 Total FSTM Budgeted (Live + Virtual) 750 616 1072
Percentage of Total Requirement that is Executed/Budgeted 47% 58% 76% 1 FY 2014 total budgeted FSTM does not include miles that will be funded with OCO.
ARMY RESERVE GROUND OPTEMPO
FY 2013 FY 2014 FY 2015
Full Spectrum Training Miles (FSTM) FSTM Required (Live Training) 2,088 1,589 1,589
FSTM Executed/Budgeted (Live Training) 978 1,361 949 Percentage of Total Requirement that is Executed/Budgeted 47% 86% 60%
86

LAND FORCES
LAND FORCES
ARMY NATIONAL GUARD GROUND OPTEMPO
FY 2013 FY 2014 FY 2015
Full Spectrum Training Miles (FSTM) FSTM Required (Live Training) 1,222 968 989
FSTM Required (Virtual Training) 13 13 11 Total FSTM Required (Live + Virtual) 1,235 981 1,000
FSTM Budgeted (Live Training) 913 694 526 FSTM Budgeted (Virtual Training) 13 13 11 Total FSTM Budgeted (Live + Virtual) 926 707 537
Percentage of Total FSTM Requirement that is Budgeted 75% 72% 54%
87

LAND FORCES
LAND FORCES
MARINE CORPS ACTIVE DEPLOYABLE DAYS
FY 2013 FY 2014 FY 2015
Total Possible Deployable Days 97,455 97,090 97,090 Reported Deployable Days 85,760 85,439 85,439
Percentage Achieved/Budgeted 88% 88% 88% Performance Goal 88% 88% 88%
Equipment Maintenance & Training Funding ($ in Millions) 593.4 472.5 652.1 Cost Per Deployable Day ($ in Thousands) 9.61 7.68 10.60
MARINE CORPS RESERVE DEPLOYABLE DAYS
FY 2013 FY 2014 FY 2015
Total Possible Deployable Days 22,265 22,265 22,265 Reported Deployable Days 19,593 19,593 19,593
Percentage Achieved/Budgeted 88% 88% 88% Performance Goal 88% 88% 88%
Equipment Maintenance & Training Funding ($ in Millions) 51.9 66.1 67.0 Cost Per Deployable Day ($ in Thousands) 3.68 4.68 4.75
88

SHIP OPERATIONS
SHIP OPERATIONS
$ in Millions
FY 2013/1
Actual Price
Growth Program Growth
FY2014/2
Enacted Price
Growth Program Growth
FY 2015/3 Estimate
Active Forces 14,094.1 -230.4 -4,526.2 9,337.4 222.9 1,651.6 11,212.1 Mission and Other Ship Operations 5,289.9 -343.3 -1,674.0 3,272.6 166.9 425.9 3,865.4 Ship Operational Support and Training 708.5 6.7 -31.8 683.9 13.1 14.3 711.2 Ship Maintenance 6,938.3 89.6 -2,922.4 4,105.9 20.4 1,169.9 5,296.4 Ship Depot Operations Support 1,157.4 16.5 -101.3 1,275.1 22.5 41.5 1,339.1
Reserve Forces 116.9 -0.1 2.6 119.6 1.5 -107.7 13.3 Mission and Other Ship Operations 76.4 -0.7 0.2 75.9 0.8 -68.5 8.2 Ship Operational Support and Training 0.5 0 0.1 0.6 0 0 0.6 Ship Maintenance 40 0.7 2.3 43.1 0.7 -39.2 4.6
GRAND TOTAL 14,210.9 -230.5 -4,623.6 9,457.1 224.5 1,543.8 11,225.4
Numbers may not add due to rounding 1 FY 2013 includes Overseas Contingency Operations (OCO) funding 2 FY 2014 enacted includes $4,278.4 million of OCO including $1,609 million of base transferred to OCO 3 FY 2015 excludes OCO funding
DESCRIPTION OF OPERATIONS FINANCED The sub-activity groups within ship operations and ship maintenance fund the active and reserve operating tempo (OPTEMP), engineering and logistical support, maintenance, planning, and technical support to maintain and deploy combat ready ships. From these activities, the Navy purchases ship fuel, repair parts, utilities, consumable supplies, and maintenance from fleet intermediate maintenance facilities and public and private shipyards. Funding to charter logistics support and other ships from the Military Sealift Command (MSC), payments to the Department of Energy (DOE) for consumed nuclear fuel as well as storage and processing of expended nuclear cores are also financed within these sub-activity groups.
The FY 2015 active and reserve ship operations and maintenance budget increased by $1,768.3 million from the FY 2014 level. The increase from FY 2014 to FY 2015 is comprised of a price increase of $224.5 million and a program increase of $1,543.8 million. Program growth is primarily a result of restoring the FY 2014 base to OCO transfer of $1,609 million from the FY 2014 Consolidated Appropriation Act.
89

SHIP OPERATIONS
SHIP OPERATIONS
PROGRAM DATA The FY 2015 Navy Active forces ship operations request provides $11,212.1 million, which includes price increase of $222.9 million and a program increase of $1,651.6 million above the FY 2014 level that is comprised of the following key components:
Mission and Other Ship Operations reflect a price increase of $166.9 million and program increase of $425.9 million from FY 2014 to FY2015. The program increase is primarily due to the congressional OCO to base transfer in the FY 2014 Consolidated Appropriations Act.
Ship Maintenance has price growth of price growth of $20.4 million and a net program increase of $1,169.9 million from FY 2014 to FY 2015. Program growth in FY 2015 is largely the result of the congressional OCO to base transfer in the FY 2014 Consolidated Appropriations Act. There are also increases in Miscellaneous Restricted and Technical Availabilities due to an increase in material and contract cost for CVN and SSN maintenance, non-depot/intermediate maintenance due to contract and material costs associated with Regional Maintenance Centers; extended refueling overhaul and Trident Refit Facility support; and increases in planned incremental availabilities due to increases in the number, scope, and complexity of inductions.
Ship Depot Operations Support has a price increase of $22.5 million and net program increase of $41.5 million from FY 2014 to FY 2015. There are increases in fleet modernization program due to addition of close-in weapons system install on CVN 77; additional material procurements and installations for Patrol Coastal ships; and continued development of guided missile cruiser aluminum superstructure cracking and sensitization design products to be installed on in-service CG class ships. There is also an increase in AEGIS and Surface Ship maintenance due to increased scope and complexity of DDG-1000 and Patrol Coastal in-service fleet support, and extensive planning and design required to address weakened Patrol Craft hull structural issues in FY 2015.
The FY 2015 Operation and Maintenance, Navy Reserve ship operations and maintenance request provides $13.4 million, which includes a price increase of $1.5 million and a net program decrease of $107.7 million from the FY 2014 level.
Mission and Other Ship Operations reflect a price increase of $0.8 million and program reduction of $68.5 million. The program decrease is primarily due to decommissioning of the remaining seven reserve Frigates in FY 2015.
Ship Maintenance has price growth of $0.7 million and net program reduction of $39.2 million due to decreased ship maintenance requirements associated with a reduction of the Navy Reserve ship inventory.
90

SHIP OPERATIONS
SHIP OPERATIONS
Ship Inventory (End of Year) FY 2013
Actual Change FY2014
Estimate Change/* FY 2015 Estimate
Battle Force Ships (Active, MSC, R. Battle Force) 285 -5 280 3 283 Navy Active* 230 -4 226 9 235 MSC Charter/Support 47 0 47 1 48 Reserve Battle Force 8 -1 7 -7 0
Battle Force Ships Inventory Adjustments by Category FY 2014 Gains Losses
New Count
Change FY 2015 Aircraft Carriers 10 10 Fleet Ballistic Missile Sub 14 14 Guided Missile (SSGN) Subs 4 4 Nuclear Attack Submarines 54 1 -1 54 Surface Combatants 99 4 -10 93 Amphibious Warfare Ships 31 -1 30 Combat Logistics Ships 30 -1 29 Mine Warfare Ships* 12 -4 8 Support Ships 26 3 29 Non-Battle Ships 0 12 12 Total 280 8 -13 8 283
*New ship count rules start in FY 2015 will include eight OCONUS Mine Warfare (MCMs) ships and 10 Forward Deployed Patrol Crafts (PCs) in the Active inventory.
FY 2014 total inventory of 280+8 (activations) – 13 (in-activations) = 275, Net (-5) FY 2015 starting inventory of 275+12 (10 PCs/2 T-AHs) - 4 CONUS MCMs = 283, Net (+8)
91

SHIP OPERATIONS
SHIP OPERATIONS
FY 2013 Actuals Change
FY 2014 Estimate Change
FY 2015 Estimate
Operating Tempo (Underway Days per Quarter)/1 ACTIVE
Deployed 70 -25 45 45 Non-Deployed 24 -4 20 20
RESERVE Deployed 81 -36 45 0 45 Non-Deployed 18 2 20 -20 0
Ship Years (Less Ship Charter)
Conventional, O&M,N 165 -13.5 151 29 149 Nuclear, O&M,N 83 0 83 -1.5 81.5 Conventional, O&M,NR 9.5 -1 8.5 -6.5 2
Ship Maintenance/2 ACTIVE
Overhauls (Ship & Service Craft) 3 1 4 -1 3 Selected Restricted Availabilities 45 -38 7 7 Planned Maintenance Availabilities 14 -11 3 -1 2 Planned Incremental Availabilities 2 2 2 4 Carrier Incremental Availabilities 3 -3 0 4 4
RESERVE Selected Restricted Availabilities 2 2 0 0
1 FY 2013 and FY 2014 includes Overseas Contingency Operations (OCO) funded underway days 2 FY 2014 and FY 2015 excludes OCO funded maintenance
92

SHIP OPERATIONS
SHIP OPERATIONS
SHIP OPERATIONS Ship year data provides a more accurate indicator of the overall force level for that year. A ship year measures that portion of a fiscal year that a ship serves in the fleet. For example, a ship decommissioning on June 30th would have 0.75 ship years for that fiscal year (October through June) – whereas the end of year ship inventory would be zero.
Operating TEMPO or OPTEMPO are the days during which the ship is underway on its own power for three or more hours. If a ship is pier-side or at anchor, it is not considered an OPTEMPO day.
SHIP MAINTENANCE Ship depot level maintenance requires skills or facilities beyond the capacity or capability of organizational or intermediate level activities, public and private shipyards, naval ship repair facilities, and equipment depot maintenance facilities perform ship depot maintenance.
Ships are assigned maintenance availabilities in accordance with the class maintenance plan established for the ship class. Class maintenance plans vary but always include both shorter non-docking availabilities and longer docking availabilities. The primary categories of availabilities follow:
• Overhauls are docking availabilities, normally exceeding six months in duration to restore the ship, including all operating systems that affect safety or combat capability, to established performance standards.
• Planned Maintenance Availabilities (PMA) and Selected Restricted Availabilities (SRA) are relatively short and highly intensive availabilities averaging two to three months in duration during which both alterations and repairs are typically performed. They may be docking or non-docking.
• Planned Incremental Availabilities (PIA) / Carrier Incremental Availabilities (CIA) are availabilities specific to USS NIMITZ class Aircraft Carriers during which both alterations and repairs are typically performed. They may be docking or non-docking.
Three categories of depot level maintenance are performed outside of scheduled availabilities.
• Emergent Restricted Technical Availabilities (RA/TA) are used to repair unplanned discrepancies that must be corrected prior to the next scheduled availability.
• Other RA/TA is maintenance planned for execution between scheduled availabilities meant to maintain ships systems fully operational.
• Continuous Maintenance allows flexible execution of required Surface Ship depot level work during in port periods.
93

AIR OPERATIONS
AIR OPERATIONS
$ in Millions
Funding Summary
FY 2013/1 Actual
Price Growth
Program Growth
FY 2014/2 Enacted
Price Growth
Program Growth
FY 2015/3 Estimate
Army 1,042.2 -8.0 154.3 1,188.4 14.6 206.4 1,409.3 Army Reserve 76.8 -0.2 1.3 77.9 1.4 -6.3 73.0 Army National Guard 856.0 -5.9 56.4 906.5 11.6 2.0 920.1 Navy 9,172.3 -20.2 -1,663.7 7,488.4 89.9 833.4 8,411.7 Navy Reserve 726.8 -1.1 -52.2 673.5 7.8 -26.9 654.4 Air Force 15,952.9 296.7 -4,122.4 12,127.2 116.1 2,250.2 14,493.6 Air Force Reserve 2,328.5 22.1 164.7 2,515.3 12.6 -66.9 2,460.9 Air National Guard 4,974.8 79.3 379.3 5,433.3 22.1 159.3 5,614.7 TOTAL 35,130.3 362.5 -5,082.3 30,410.5 276.1 3,351.2 34,037.7
Numbers may not add due to rounding 1 FY 2013 includes Overseas Contingency Operations (OCO) funding 2 FY2014 enacted excludes $8,884.7 million of OCO funding including $2,845.9 million of base funds transferred to OCO 3 FY 2015 exclude OCO funding
Air operations include all programs to operate, maintain, and deploy aviation forces that support the national military strategy. Air Operations funding supports the following activities: (1) day-to-day operational activities or air operations, (2) organizational and intermediate and depot level maintenance, and (3) engineering and technical support.
The FY 2015 budget request of $34,037.7 million reflects an increase of $3,627.3 million above the FY 2014 enacted baseline amount. This includes price growth of $276.1 million and a net program increase of $3,351.2 million. Most of this increase represents a restoral of $2.845.9 million of base to OCO realignment in FY 2014.
94
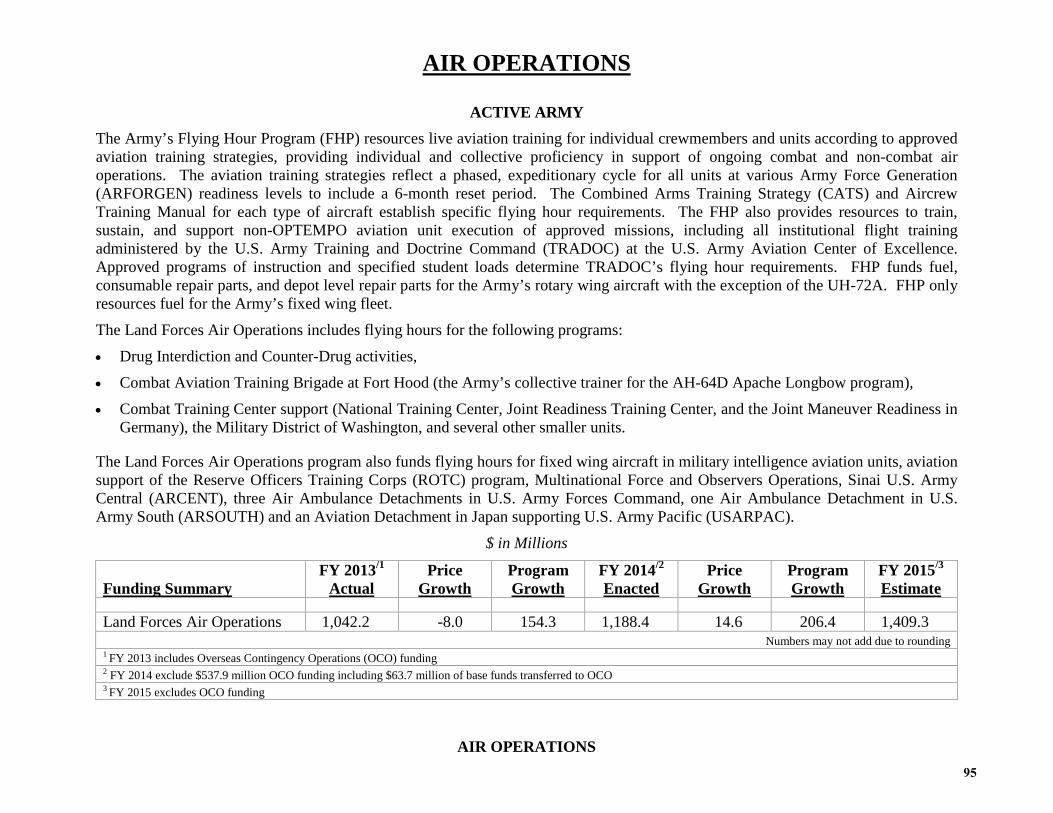
AIR OPERATIONS
AIR OPERATIONS
ACTIVE ARMY The Army’s Flying Hour Program (FHP) resources live aviation training for individual crewmembers and units according to approved aviation training strategies, providing individual and collective proficiency in support of ongoing combat and non-combat air operations. The aviation training strategies reflect a phased, expeditionary cycle for all units at various Army Force Generation (ARFORGEN) readiness levels to include a 6-month reset period. The Combined Arms Training Strategy (CATS) and Aircrew Training Manual for each type of aircraft establish specific flying hour requirements. The FHP also provides resources to train, sustain, and support non-OPTEMPO aviation unit execution of approved missions, including all institutional flight training administered by the U.S. Army Training and Doctrine Command (TRADOC) at the U.S. Army Aviation Center of Excellence. Approved programs of instruction and specified student loads determine TRADOC’s flying hour requirements. FHP funds fuel, consumable repair parts, and depot level repair parts for the Army’s rotary wing aircraft with the exception of the UH-72A. FHP only resources fuel for the Army’s fixed wing fleet.
The Land Forces Air Operations includes flying hours for the following programs:
• Drug Interdiction and Counter-Drug activities,
• Combat Aviation Training Brigade at Fort Hood (the Army’s collective trainer for the AH-64D Apache Longbow program),
• Combat Training Center support (National Training Center, Joint Readiness Training Center, and the Joint Maneuver Readiness in Germany), the Military District of Washington, and several other smaller units.
The Land Forces Air Operations program also funds flying hours for fixed wing aircraft in military intelligence aviation units, aviation support of the Reserve Officers Training Corps (ROTC) program, Multinational Force and Observers Operations, Sinai U.S. Army Central (ARCENT), three Air Ambulance Detachments in U.S. Army Forces Command, one Air Ambulance Detachment in U.S. Army South (ARSOUTH) and an Aviation Detachment in Japan supporting U.S. Army Pacific (USARPAC).
$ in Millions
Funding Summary
FY 2013/1 Actual
Price Growth
Program Growth
FY 2014/2 Enacted
Price Growth
Program Growth
FY 2015/3 Estimate
Land Forces Air Operations 1,042.2 -8.0 154.3 1,188.4 14.6 206.4 1,409.3
Numbers may not add due to rounding 1 FY 2013 includes Overseas Contingency Operations (OCO) funding 2 FY 2014 exclude $537.9 million OCO funding including $63.7 million of base funds transferred to OCO 3 FY 2015 excludes OCO funding
95

AIR OPERATIONS
AIR OPERATIONS
The FY 2015 budget request reflects a net increase of $221.0 million from FY 2014. This increase includes a price increase of $14.6 million and a program increase of $206.4 million. The FY 2015 program increase is the theater demand changes in home station training requirements for Combat Aviation Brigades (CAB) previously funded in OCO.
ARMY RESERVE The Army Reserve’s Training Operations funds aviation training and operational requirements. The program includes fuel, consumable repair parts, and depot level repair parts to maintain the fleet. The program supports both unit training and operations. The Army Reserve’s fixed wing and rotary wing units support the requirements of the warfighting Combatant Commanders. The Reserve fixed wing aircraft are an integral part of the military operational mission support airlift system.
$ in Millions
Funding Summary
FY 2013/1 Actual
Price Growth
Program Growth
FY 2014/2 Enacted
Price Growth
Program Growth
FY 2015/3 Estimate
Training Operations 76.8 -0.3 1.4 77.9 1.4 -6.3 73.0
Numbers may not add due to rounding 1 FY 2013 includes Overseas Contingency Operations (OCO) funding 2 FY 2014 enacted did not request OCO
3 FY 2015 excludes OCO funding
Program Data
FY 2013 Actual
Change
FY 2014 Enacted
Change
FY 2015 Estimate
Primary Authorized Aircraft 2,226 148 2,374 -85 2,289 Flying Hours (000) 521.4 -28.4 493.0 -11.1 481.9 Percent Executed 77% OPTEMPO (Hrs/Crew/Month) 10.4 10.0 10.1
96

AIR OPERATIONS
AIR OPERATIONS
Program Data
FY 2013 Actual
Change
FY 2014 Enacted
Change
FY 2015 Estimate
Primary Authorized Aircraft 195 6 201 0 201 Flying Hours (000) 39.00 3.0 42.0 -13.0 29.0 OPTEMPO (Hrs/Crew/Month) 21.0 -3.0 18.0 -7.0 11.0
The FY 2015 budget request reflects a net decrease of $4.9 million. This includes a price increase of $1.4 million and a program decrease of $6.3 million. The programmatic decrease is attributed to decrease fixed wing flying hours.
ARMY NATIONAL GUARD The Army National Guard Flying Hour Program provides training for fixed and rotary wing air crew members, aviation units, and supported combined arms teams to achieve and sustain designated combat readiness. Resources support the utilization, maintenance, and overhaul of aviation assets and related support equipment to sustain unit capabilities. These funds are required to maintain and train units for immediate mobilization and to provide administrative support.
$ in Millions
Funding Summary
FY 2013/1 Actual
Price Growth
Program Growth
FY 2014/2 Enacted
Price Growth
Program Growth
FY 2015/3 Estimate
Air Operation 856.0 -5.9 56.4 906.5 11.6 2.0 920.1
Numbers may not add due to rounding 1 FY 2013 includes Overseas Contingency Operations (OCO) funding 2 FY 2014 exclude $38.5 million OCO funding
3 FY 2015 excludes OCO funding
Program Data
FY 2013 Actual
Change
FY 2014 Enacted
Change
FY 2015 Estimate
Primary Authorized Aircraft 1,405 106 1,511 -22 1,489
Flying Hours (000) 260 -27 233 -29 203
OPTEMPO (Hrs/Crew/Month) 16.3 0.4 16.7 -0.4 16.3
97

AIR OPERATIONS
AIR OPERATIONS
The FY 2015 budget request reflects an increase of $13.6 million. This includes a price increase of $11.6 million and a program increase of $2.0 million. The air operations program increase of $2.0 million is due to an increase in the number of rotary wing training seat.
ACTIVE NAVY The Navy’s Air Operations program funds the active Navy and Marine Corps flying hour operating tempo, intermediate, organizational and depot level maintenance, fleet training, engineering support, and logistical support to operate, maintain, and deploy aviation forces in support of the National Military Strategy. Navy Air Operations is subdivided into the following categories.
$ in Millions
Funding Summary
FY 2013/1 Actual
Price Growth
Program Growth
FY 2014/2 Enacted
Price Growth
Program Growth
FY 2015/3 Estimate
Missions/Flight Operations 5,345.5 -35.2 -1,442.9 3,867.5 45.6 1034.1 4,947.2 Fleet Air Training 1,847.2 -3.0 -19.5 1,824.7 28.5 -205.2 1,647.9 Aviation Technical Data & Engineering Services 41.7 0.4 -3.9 38.2 0.4 -1.6 37.1 Air Operations and Safety Support 90.1 1.3 -10.1 81.2 1.1 13.8 96.1 Air Systems Support 341.2 5.9 12.2 359.3 -3.3 7.8 363.8 Aircraft Depot Maintenance 1031.3 2.0 -238.7 794.6 7.9 12.3 814.8 Aviation Logistics 325.3 6.0 37.6 369.0 7.2 -25.6 350.6 Equipment Maintenance 129.3 1.9 -2.4 128.8 2.0 -2.3 128.5 Combat/Weapons System Support 20.8 0.3 3.9 25.1 0.5 0.1 25.7 TOTAL 9,172.3 -20.2 -1,663.7 7,488.4 89.9 833.4 8,411.7
Numbers may not add due to rounding 1 FY 2013 includes Overseas Contingency Operations (OCO) funding 2 FY 2014 enacted excludes $2,164.5 million OCO funding including $1,000 million of base funds transferred to OCO 3 FY 2015 excludes OCO
98

AIR OPERATIONS
AIR OPERATIONS
Program Data
FY 2013 Actual
Change
FY 2014 Enacted
Change
FY 2015 Estimate
Primary Authorized Aircraft 3,028 472 3,500 32 3,532 Total Aircraft Inventory 3,770 237 4,007 34 4,041 Total Flying Hours (000) 1,040.3 -148.1 892.2 168.5 1,060.7 Tactical Fighter Wings 10 0 10 0 10 Average Crew Ratio 1.6 0 1.6 0 1.6 Hours Per Crew Per Month 20.7 -2.1 18.6 0.9 19.5 Average T-Rating 2.5 2.5 2.5
The FY 2015 budget request reflects an increase of $923.3 million. This includes a price increase of $89.9 million and a net program increase of $833.4 million. The vast majority of the programmatic increase is attributed to the congress transferring $1.0 billion of base funding to OCO in FY 2014.
Mission and Other Flight Operations: FY 2015 budget request reflects net program increase of $1,079.7 million. This includes a price increase of $45.6 million and program increase of $1,034.1 million. The increase is primarily attributed to base funds being transferred to OCO in FY 2014. Other programmatic increases include modernizing aircraft and the associated flying hour adjustments with replacement aircraft.
Fleet Air Training: FY 2015 budget request reflects a net decrease of $176.7 million. This includes a price increase of $28.5 million and a program decrease of $205.2 million. The decrease is primarily due to a reduction in flying hours throughout the Test Pilot Schools.
Aviation Technical Data and Engineering Services: FY 2015 budget request reflects a net program decrease of $1.2 million. This includes a price increase of $0.4 million and a programmatic decrease of $1.6 million. The decrease is due to reductions in civilian and contractor engineering technical service personnel.
Air Operations and Safety Support: FY 2015 budget request reflects a net adjustment of $14.9 million. This includes price increase of $1.1 million and program increase of $13.8 million. Program reductions result from the consolidation of contract services and increased equipment requirements for air traffic control.
Air Systems Support: FY 2015 budget request represents a $4.5 million net program increase. This includes a price decrease of $3.3 million along with a program increase of $7.8 million. Net program adjustment reflects increases in flying hours for the P-8A and EA-18G and wartime to peacetime transition for the AV-8B and EA-6B.
99

AIR OPERATIONS
AIR OPERATIONS
Aircraft Depot Maintenance: FY 2015 budget request reflects a net increase of $20.2 million. This includes a price increase of $7.9 million and a program increase of $12.3 million. The program increase accounts for an increase in engine inductions.
Aviation Logistics: FY 2015 budget reflects a net increase of 18.4 million. This includes a price increase of $7.2 million along with program reduction of $25.6 million. Programmatic increases attributed mainly to additional flight hours in the MV-22B and KC-130J weapon systems.
Equipment Maintenance: FY 2015 budget request reflects a net decrease of $0.3 million. This includes a price increase of $2.0 million and a program decrease of $2.3 million. Combat/Weapons System: FY 2015 budget request reflects a net increase of $0.6 million. This includes a price increase of $0.5 million and a program increase of $0.1 million.
NAVY RESERVE The Air Operations activity group provides funding for all aspects of Navy and Marine Corps Reserve Component air operations from flying hours to specialized training, maintenance and associated support. Programs supporting Reserve Component Air Operations include: flying hours (fuel, consumables, depot-level repairables and contract maintenance); range operations; squadron and wing travel; specialized skill training and associated administrative support; intermediate and depot level maintenance; and operational support such as command and control.
$ in Millions
Funding Summary
FY 2013/1 Actual
Price Growth
Program Growth
FY 2014/2 Enacted
Price Growth
Program Growth
FY 2015/3 Estimate
Missions/Flight Operations 598.0 -3.6 -24.5 569.8 7.0 -11.0 565.8 Intermediate Maintenance 12.9 0.2 -6.1 7.0 0.1 -1.2 5.9 Air Operations and Safety Support 1.1 0.0 -1.1 0.0 0.0 0.0 0.0 Depot Maintenance 114.9 2.3 -20.5 96.7 0.6 -14.7 82.6 TOTAL 726.8 -1.1 -52.2 673.5 7.8 -26.9 654.4
Numbers may not add due to rounding 1 FY 2013 includes Overseas Contingency Operations (OCO) funding 2 FY 2014 enacted excludes $23.4 million OCO funding 3 FY 2015 excludes OCO
100

AIR OPERATIONS
AIR OPERATIONS
Program Data
FY 2013 Actual
Change
FY 2014 Enacted
Change
FY 2015 Estimate
Primary Authorized Aircraft 250 7 257 6 263 Total Aircraft Inventory 250 7 257 6 263 Total Flying Hours (000) 92 5.7 97.4 -3.9 93.5 Tactical Support Wings 1 0 1 0 1 Hours Per Crew Per Month 12.4 0.5 12.9 -0.6 12.3 Average T-Rating Navy Reserve T-2.6 T-2.6 T-2.6 Average T-Rating U.S. Marine Corps Reserve T-2.0 T-2.0 T-2.0
The FY 2015 estimate reflects a net program decrease of $19.1 million. This includes a pricing increase of $7.8 million and a programmatic decrease of $26.9 million. The program decrease reflects a net reduction of 3,900 flight hours due to the Navy’s efficiency initiative. Depot maintenance was reduced to reflect reduced inductions in aircraft and engines.
ACTIVE AIR FORCE
The Air Force Air Operations funding provides the resources that support the Air Force combat forces. These activities provide for the operational flying requirements of bomber, fighter, mobility, and training forces stationed in the United States as well as overseas. Also included are resources supporting: land based intercontinental ballistic missiles; air launched strategic and tactical missiles; electronic warfare and defense suppression missions; combat command, control, and communications; combat aircrew training; and associated combat related base support. Financing provides for the operating tempo, organizational and depot level maintenance, training, engineering support, logistical support, and base support to operate, maintain, and deploy aviation forces in support of the national military strategy. The FY 2015 budget request reflects an increase of $2,366.3 million from the FY 2014 funding level. This includes a price increase of $116.1 million and program increase totaling $2,250.2 million, of which $1,782.2 million reflects the restoral of base to OCO realignments in FY 2014.
101

AIR OPERATIONS
AIR OPERATIONS
The Air Operations activity is subdivided into the following categories: $ in Millions
Funding Summary
FY 2013/1 Actual
Price Growth
Program Growth
FY 2014/2 Enacted
Price Growth
Program Growth
FY 2015/3 Estimate
Primary Combat Forces 4,260.6 48.2 -2,369.9 1,938.8 19.9 1,204.7 3,163.5 Combat Enhancement Forces 2,086.1 30.3 -500.2 1,616.2 18.5 67.4 1,702.1 Air Operations Training 1,135.8 24.0 70.8 1,230.6 12.1 336.5 1,579.2 Depot Maintenance 8,470.4 194.3 -1,323.0 7,341.7 65.6 641.6 8,048.9 TOTAL 15,952.9 296.7 4,122.4 12,127.2 116.1 2,250.2 14,493.6
Numbers may not add due to rounding 1 FY 2013 includes Overseas Contingency Operations (OCO) funding 2 FY 2014 enacted excludes $6,071.5 million of OCO funding including $1,782.2 million of base funds transferred to OCO 3 FY 2015 excludes OCO funding
Program Data FY 2013 Actual
Change
FY 2014 Enacted
Change
FY 2015 Estimate
Primary Aircraft Inventory Bombers 109 2 111 1 112 Fighters 1,053 12 1,065 -106 959 Training 965 78 1,043 -69 974 Airlift 281 -10 271 -12 259 Tanker 195 -2 193 -1 192 Other 511 38 549 35 584 TOTAL 3,114 118 3,232 -152 3,080
Total Aircraft Inventory Bombers 134 2 136 1 137 Fighters 1,220 23 1,243 -133 1,110 Training 1,203 61 1,264 -59 1,205 Airlift 303 -6 297 -11 286 Tanker 215 3 218 -9 209 Other 555 30 585 31 616
102

AIR OPERATIONS
AIR OPERATIONS
TOTAL 3,630 113 3,743 -180 3,563
Flying Hours (000) 773 117 890 -4 886 ICBM Inventory – Minuteman II 450 0 450 0 450 Crew Ratios (Average)
Bombers 1.34 0 1.34 -0.05 1.29 Fighters 1.25 0.04 1.29 -0.04 1.25
OPTEMPO (Hrs/Crew/Month) Bombers 20.80 -10.20 10.60 2.40 13.00 Fighters 14.80 -1.30 13.50 -0.60 12.90
Primary Combat Forces: FY 2015 budget request reflects net adjustment of $1,224.7 million. The FY 2015 budget request includes a price increase of $19.9 million and a program increase of $1,204.7 million. The program increase is primarily attributed to restoral of $1,282.0 million of base to OCO transfers during FY 2014; the remainder is driven by an investment in full-spectrum flying hours in support of the Combat Air Forces offset by savings from management efficiencies and civilian labor.
Combat Enhancement Forces: FY 2015 budget request reflects net adjustment of $85.9 million. The FY 2015 budget request includes a price increase of $18.5 million and a program increase of $67.4 million. The program change is primarily driven by an investment in full-spectrum flying hours and readiness training in support of the Combat Air Forces along with funds to support the Global Hawk Block 30. Programmatic decreases resulted from management efficiencies, civilian labor reductions, and efficiencies in logistics, communications and infrastructure.
Air Operations Training: FY 2015 budget request reflects net adjustment of $348.6 million. The FY 2015 budget request includes a price increase of $12.0 million and a program increase of $336.5 million. The program change is primarily driven by investments in test and training range operations along with enhanced Distributed Mission Operations (DMO) support, and program decreases in readiness training efforts, management support contracts, travel and weapons system sustainment.
Depot Maintenance: FY 2015 budget request reflects net adjustment of $707.2 million. The FY 2015 budget request includes a price increase of $65.6 million and a program increase of $641.5 million. The program change is primarily attributed to the restoral of $500.0 million of base into OCO transfers in FY 2014. Programmatic increase included Contractor Logistics Support (CLS) and additional Weapon System Sustainment (WSS). Programmatic offsets are anticipated in not having to maintain retired aircraft and other weapon systems.
103

AIR OPERATIONS
AIR OPERATIONS
AIR FORCE RESERVE
The Air Force Reserve Air Operations budget provides the resources to maintain and train units for immediate mobilization and to provide administrative support for the Air Reserve Personnel Center. Activities supported include aircraft depot level operations, base and aircraft maintenance, medical treatment, civilian pay, travel/transportation, and maintenance of other equipment.
$ in Millions
Funding Summary
FY 2013/1 Actual
Price Growth
Program Growth
FY 2014/2 Enacted
Price Growth
Program Growth
FY 2015/3 Estimate
Primary Combat Forces 1,774.9 6.6 22.3 1,803.8 15.0 -99.3 1,719.5 Mission/Flight Operations 124.7 1.3 84.3 210.3 2.0 -1.2 211.1 Depot Maintenance 428.9 14.1 58.2 501.2 -4.4 33.5 530.3 TOTAL 2,328.5 22.0 164.8 2,515.3 12.6 -67.0 2,460.9
Numbers may not add due to rounding 1 FY 2013 includes Overseas Contingency Operations (OCO) funding 2 FY 2014 exclude $26.6 million of OCO funding 3 FY 2015 excludes OCO funding
Program Data FY 2013 Actual
Change
FY 2014 Enacted
Change
FY 2015 Estimate
Primary Aircraft Authorized (PAA) Bombers 0 0 0 0 0 Fighters 71 1 72 0 72 Training 26 24 50 -10 40 Airlift 104 6 110 -9 101 Tanker 60 0 60 8 68 Other 36 0 36 -4 32
TOTAL 297 31 328 -15 313
104

AIR OPERATIONS
AIR OPERATIONS
Total Aircraft Inventory (TAI) Bombers 0 0 0 0 0 Fighters 79 2 81 -1 80 Training 29 29 58 -12 46 Airlift 110 11 121 -15 106 Tanker 62 0 62 8 70 Other 41 -1 40 -6 34
TOTAL 321 41 362 -26 336 Flying Hours (000) 88.4 13.8 102.2 0.0 102.2
Crew Ratio (Average per Aircraft)
Bombers 0 0 0 Fighters 1.33 1.33 1.33
OPTEMPO (Hrs/Crew/Month)
Bombers 0 0 0 Fighters 12.30 -0.30 12.00 -1.20 10.80
Primary Combat Forces (Air Operations): The FY 2015 budget request reflects a net decrease of $84.3 million. This includes a price increase of $15.0 million and a program decrease of $99.3 million. The program decrease is primarily attributed to reduced flying hours resulting from utilizing simulators to accomplish some training tasks along with the enterprise decision to “right size” the reserve associations.
Mission Support Operations: The FY 2015 budget request reflects a net increase of $0.8 million. This includes a price increase of $2.0 million and a program decrease of $1.2 million. The program decrease is primarily driven by reducing operational support to the Army’s Pope airbase operations, resizing engineering squadrons, and management efficiencies.
Depot Maintenance: The FY 2015 budget request includes a net increase of $29.1 million. This includes a price decrease of $4.4 million and a program increase of $33.5 million. The program increase is primarily due scheduled programmed depot maintenance of aircraft and engines.
105

AIR OPERATIONS
AIR OPERATIONS
AIR NATIONAL GUARD The Air National Guard Air (ANG) Operations program provides for the flying and maintenance of ANG mission related aircraft. These funds also provide for the facilities, equipment, and manpower required to train, equip, and support the ANG force structure at a combat readiness level that enables the ANG to immediately assimilate into the active Air Force and to be capable of conducting independent operations in accordance with unit wartime taskings.
$ in Millions
Funding Summary
FY 2013/1 Actual
Price Growth
Program Growth
FY 2014/2 Enacted
Price Growth
Program Growth
FY 2015/3 Estimate
Aircraft Operations 2,736.3 24.0 407.6 3,167.9 22.6 177.3 3,367.7 Mission Support Operations 678.1 11.3 21.2 710.6 8.3 -0.6 718.3 Depot Maintenance 1,560.4 44.0 -49.5 1,554.9 -8.8 -17.4 1,528.7 TOTAL 4,974.8 79.3 379.3 5,433.3 22.1 159.3 5,614.7
Numbers may not add due to rounding 1 FY 2013 includes Overseas Contingency Operations (OCO) funding 2 FY 2014 excludes $22.2 million OCO funding 3 FY 2015 excludes OCO funding
Program Data
FY 2013 Actual
Change
FY 2014 Enacted
Change
FY 2015 Estimate
Primary Authorized Aircraft Bombers -- -- Fighters 333 54 387 -33 354 Training 107 12 119 -15 104 Airlift 171 5 176 4 180 Tanker 160 10 170 0 170 Other 102 4 106 -8 98
TOTAL 873 85 958 -52 906
106

AIR OPERATIONS
AIR OPERATIONS
Total Aircraft Inventory (TAI) Bombers -- -- -- -- -- Fighters 419 40 459 -29 430 Training 132 14 146 -22 124 Airlift 176 21 197 -15 182 Tanker 168 8 176 0 176 Other 109 4 113 -8 105
TOTAL 1,004 87 1091 -74 1,017 Flying Hours (000) 118 95 213 2 215
Crew Ratio (Average per Aircraft)
Fighters 1.25 1.25 1.25
OPTEMPO (Hrs/Crew/Month) Fighters 9.64 -1.56 8.08 0.78 8.86
Primary Combat Forces Aircraft Operations: Aircraft Operations reflects a net increase of $199.9 million and includes price growth of $22.6 million and program increases of $177.3 million. The program increase is primarily driven by additional flying hours and weapons system sustainment required to maintain pilot proficiency and operational fleets.
Mission Support Operations: The FY 2015 budget reflects a net increase of $7.7 million. This includes price increases of $8.3 million and program decreases of $0.6 million. The major driver of the program decrease includes: reducing general support equipment and savings anticipated by insourcing psychological health professionals.
Depot Maintenance: The FY 2015 budget reflects a net decrease of $26.2 million, this includes price decreases of $8.8 million and program decreases of $17.4 million. The program decrease is primarily driven by funding less aircraft and engine inductions.
107

UNITED STATES SPECIAL OPERATIONS COMMAND (SOCOM)
UNITED STATES SPECIAL OPERATIONS COMMAND (SOCOM)
$ in Millions
FY 2013/1 Actual
Price Growth
Program Growth
FY 2014/2 Enacted
Price Growth
Program Growth
FY 2015/3 Estimate
O&M, Defense-Wide 7,083.3 121.6 -2,423.3 4,781.9 73.8 366.1 5,221.8
Numbers may not add due to rounding 1 FY 2013 includes Overseas Contingency Operations (OCO) funding 2 FY 2014 enacted excludes $2,219.9 million of OCO funding 3 FY 2015 excludes OCO funding
. Description of Operations Financed: The United States Special Operations Command's (USSOCOM) mission is to provide fully capable Special Operations Forces (SOF) to defend the United States and its interests, and to plan and synchronize operations against terrorist networks. To achieve this mission, SOF commanders and staff must plan and lead a full range of lethal and non-lethal special operations missions in complex and ambiguous environments. Likewise, SOF personnel serve as key members of Joint, Interagency, and International teams and must be prepared to employ all assigned authorities and apply all available elements of power to accomplish assigned missions. In this capacity, SOF personnel must maintain the highest degree of professionalism, cultural awareness, responsiveness and initiative. The FY 2015 request directly supports the guidance set forth in the Defense Strategic Guidance, as updated by the Quadrennial Defense Review, and focuses on readiness recovery and maintaining the current level of Special Operations Forces (SOF) capabilities. To support these efforts, resources were applied to ensure the command's ability to efficiently provide a ready, synchronized and agile force possessing multilateral capabilities that can identify, disrupt, and defeat a wide spectrum of threats. USSOCOM's support of the defense strategy can be described through four Lines of Effort: Succeed in Current Conflicts, Strengthen Networks of Cooperation, Keep Faith with Our Troops, and Responsive Resourcing. The Strategic Guidance also presents SOF an opportunity to rebalance the complementary nature of direct and indirect approaches, while improving readiness in areas that have been de-emphasized since September 11, 2001. The FY 2015 Budget Request provides the resources necessary to achieve the initial actions required to accomplish the Command’s SOF 2020 Vision: A globally networked force of U.S. Government agencies and departments, allies, and partners able to rapidly and persistently address regional contingencies and threats to stability.
108

UNITED STATES SPECIAL OPERATIONS COMMAND (SOCOM)
UNITED STATES SPECIAL OPERATIONS COMMAND (SOCOM)
Overall Assessment: The United States Special Operations Command's (USSOCOM) baseline Operation and Maintenance (O&M) funding increases by $439.9 million in FY 2015; of which, $73.8 million is price growth and $366.1 million is program growth. Significant changes in the FY 2015 budget request include funds to restore readiness, increase SOF education and Preservation of the Force and Families (POTFF) efforts, enhance SOF-unique communications programs, and foster communication, cooperation and interoperability among partner nations. Decreases are reflected in USSOCOM management headquarters activities in support of the Department’s management headquarters streamlining efforts and in flying hours. The FY 2015 budget request continues to support the SOF 2020 Vision through four Lines of Effort that focus on succeeding in current conflicts, strengthening networks of cooperation, keeping faith with our troops, and responsive resourcing. To support these efforts, resources were increased, realigned or applied to the following initiatives: SOF Warrior Reconditioning and Human Performance Program (WRP/HPP); Joint Human Resource (PERSTEMPO Tracking) System (JHRS); and SOF Enterprise Advanced Education Program. In addition, the budget request restores funds for readiness. Also included in the budget request are resources in support of the Command’s Preserve the Force and Families (POTFF) initiative. The POTFF is designed to mitigate and minimize the physical and emotional effects of a decade-long war in which SOF personnel experienced continuous rates of high operational tempo. This effort will employ a holistic approach that combines prevention, nutrition, physical resiliency, and rehabilitative services throughout the entire SOF readiness/deployment cycle. Together, the initiatives contained in USSOCOM's FY 2015 budget request will enable USSOCOM to achieve its core missions and provide the nation with the most capable Special Operations Force.
109

INFORMATION OPERATIONS
INFORMATION OPERATIONS
THIS EXHIBIT WILL BE UPDATED UPON SUBMISSION OF THE
FY 2015 OVERSEAS CONTINGENCY OPERATIONS ESTIMATE
110

DEPOT MAINTENANCE
DEPOT MAINTENANCE
$ in Millions
FY 2013/1
Actual Price
Growth Program Growth
FY 2014/2
Enacted Price
Growth Program Growth
FY 2015/3
Estimate Active Forces Army 1,598.1 48.7 -592.0 1,054.7 27.5 -81.0 1,001.2 Navy 10,769.8 144.2 -4,049.9 6,864.1 53.9 1,273.2 8,191.2 Marine Corps 608.2 2.4 -387.3 223.3 6.9 -1.2 229.1
Air Force/4 2,762.1 83.2 -251.3 2,594.0 -20.0 -75.3 2,498.
7 USSOCOM 504.1 9.0 61.1 574.2 10.4 23.6 608.2 Subtotal 16,242.2 287.5 -5,219.4 11,310.3 78.7 1,139.4 12,528.4 Reserve Forces Army Reserve 162.1 5.3 -98.3 69.1 2.1 -12.4 58.8 Navy Reserve 171.2 3.2 -19.8 154.6 1.6 -54.5 101.7 Marine Corps Reserves 15.2 0.3 2.1 17.6 0.6 0.2 18.4
Air Force Reserve/4 324.6 12.2 44.5 381.3 -6.6 33.2 407.9 Army National Guard 357.0 4.6 -134.7 226.9 4.4 -93.0 138.3
Air National Guard/4 807.2 29.4 -12.9 823.7 -22.0 -27.1 774.6 Subtotal 1,837.3 55.0 -219.1 1,673.2 -19.9 -153.6 1,499.7 Grand Total 18,079.6 342.5 -5,438.5 12,983.5 58.8 985.8 14,028.0 Numbers may not add due to rounding 1 FY 2013 includes Overseas Contingency Operations (OCO) funding 2 FY 2014 excludes $6,472 million of OCO funding including $1,800 million of base funds transferred to OCO. 3 FY 2015 excludes OCO funding 4 Excludes contract logistics support, sustaining engineering, and technical orders data.
111

DEPOT MAINTENANCE
DEPOT MAINTENANCE
The Depot Maintenance program funds the overhaul, repair, and maintenance of aircraft, missiles, aircraft carriers, ships, submarines, combat vehicles and other equipment. It continues to play a key role in force readiness by ensuring maintenance priorities align with military operational needs, sustaining core maintenance capabilities in organic depots, and sustaining the Defense industrial base.
The FY 2015 request reflects net program increase of $986 million. The FY 2015 base budget funds an average of 73 percent of executable requirements. This is an increase of 7 percent over FY 2014 enacted levels due to realignment of $1,800 million of base transferred to OCO in the FY 2014 Consolidated Appropriations Act. Executable requirements are funded and unfunded requirements not restricted by depot capacity. The following highlights the FY 2015 Depot Maintenance program base budget.
Department of the Army: The FY 2015 request of $1.2 billion, a net decrease of $152 million from FY 2014 enacted levels, funds 53 percent of executable base requirements. The following details the Department of the Army changes: • $15 million reduction in aircraft overhaul for MH60K, OH-58D, AH-64D, UH-60 and recapitalization of Blackhawks. • $73 million reduction in combat and tactical vehicle overhaul for carriers (Mortar & Personnel), tanks (M992A2, M88, M1129),
Armored Vehicle-Launched Bridges (AVLBs), STRYKERS, trailers, and trucks. • $12 million reduction in communications and electronics equipment overhaul for Firefinder, Trailer Mounter Support System and
support for Command, Control, Communications, Computers, Intelligence, Surveillance and Reconnaissance (C4ISR) initiatives. • $33 million reduction in other end items maintenance for water vessels, cranes, forklifts, power plants, trailers, and generator sets. • $6 million increase in missiles for Avenger, MLRS, and SRT GEM-T repair. • $22 million reduction for post-production software support for Information Assurance Vulnerability Assessments (IAVAs) and
Certification and Accreditations.
112

DEPOT MAINTENANCE
DEPOT MAINTENANCE
Department of the Navy: Navy The FY 2015 request of $8.3 billion, a net increase of $1.2 billion from FY 2014 enacted levels, funds 80 percent of executable base requirements. The following details Navy changes: • $1,000 million increase in ship maintenance for the base to OCO transfer of funds in the FY 2014 Consolidated Appropriations
Act. • $114.4 million increase in ship maintenance for Planned Incremental Availabilities (PIA) due to an increase in scope, complexity,
and materials. • $4.4 million increase in air depot maintenance reflects growth in unit cost for the F414 and F402 engines. • $20.0 million program decrease for reflects reduction in ship maintenance due to the FY 2015 decommissioning of three frigates. • $2.5 million reduction in combat operations and support for Airborne Mine Countermeasures (AMCM) and ground support
equipment rework program.
Marine Corps The FY 2015 request of $247.4 million, a net increase of $6.5 million from FY 2014 enacted levels, funds 83 percent of executable requirements. The following details Marine Corps changes: • $22 million increase in combat vehicle overhaul for multiple variants of the Amphibious Assault Vehicle (AAV) and the Light
Armored Vehicle (LAV). • $13 million increase in ordnance weapons and munitions maintenance for repairs to various infantry weapons, machine guns,
scopes, mortars, and the Howitzer. • $5 million increase in missile maintenance for repairs to night vision equipment sets, launchers, and towed weapon systems. • $5 million reduction in electronics and communications systems equipment maintenance due to fewer repair requirements for
radars, satellite radios, and maintenance shelters. • $36 million reduction in automotive equipment maintenance due to fewer repair requirements for various versions of utility trucks,
trailers, and the High Mobility Multipurpose Wheeled Vehicle (HMMWV).
113

DEPOT MAINTENANCE
DEPOT MAINTENANCE
Department of the Air Force: The FY 2015 request of $3.7 billion, a net decrease of $118 million from FY 2014 enacted levels, funds 70 percent of executable requirements. The following details the Department of the Air Force changes: • $223.7 million increase in engine maintenance for the B-52, C-130, EC-130, F-16, RQ-4, and KC-135. • $281.8 million reduction in aircraft maintenance for the F-15, B-1, B-52, F-16, KC-10 and C-130Hs because of changes in
programmed depot maintenance estimates and/or schedules. • $22.3 million decrease in missiles due to reduction in requirements for Minuteman missiles. • $144.6 million reduction in software support due to prioritization of requirement tasks and assumption of additional risk for
software upgrades in the AWACS, B-1, B-52, and F-16 weapon systems. • $29.1 million reduction in other end items supporting ranges and vehicles and support equipment programs due to a reduction in
general purpose equipment maintenance. • $67.4 million reduction in exchangeable items due to decreased requirements for exchangeable items across the sustainment
portfolio. • $3.3 million reduction in area base support for the Distributed Common Ground/Surface Systems.
U.S. Special Operations Command (USSOCOM): The FY 2015 request of $608 million, a net increase of $34 million from FY 2014 enacted levels, funds 100 percent of executable requirements. The following details SOCOM changes: • $8 million increase in aircraft requirements due to expansion of delivered Small Unmanned Aircraft Systems (SUAS). • $6 million reduction in automotive equipment maintenance requirements for Family of Special Operations Vehicles (FSOV). • $18 million increase in communications and electronics equipment requirements for additional Simulator Block Upgrades (SBUD)
and Distributed Common Ground Systems (DCGS). • $4 million increase in ordnance, weapons, and munitions to maintain inventory of Sniper weapon systems, machine guns, weapon
accessories and non-standard specialized munitions.
114

DEPOT MAINTENANCE
DEPOT MAINTENANCE
$ in Millions
FY 2013/1
Funded Executable
Requirement
Unfunded Deferred
Requirement
FY 2014/2
Funded Executable
Requirement
Unfunded Deferrent
Requirement
FY 2015/3
Funded Executable
Requirement
Unfunded Deferred
RequirementFY 2014 %
FundedFY 2015 %
Funded
Dept of the Army/4 2,117.2 828.5 1,350.7 1,565.9 1,198.4 1,536.8 46% 44%Aircraft 533.8 225.1 370.7 321.4 359.5 426.1 54% 46%Combat Vehicles / Automotive Equipment
195.7 322.0 141.7 456.4 136.4 402.6 24% 25%
Other 1,387.7 281.4 838.3 788.2 702.5 708.1 52% 50%
Dept of the Navy/4 11,564.4 0.0 7,259.6 3,808.3 8,540.1 2,172.0 66% 80%Ships 8,328.4 0.0 5,056.1 2,515.1 6,297.0 1,437.0 67% 81%Aircraft 1,851.4 0.0 1,412.7 636.4 1,406.5 553.0 69% 72%Combat Vehicles / Automotive Equipment
460.0 0.0 165.5 489.6 165.1 36.0 25% 82%
Other 924.6 0.0 625.3 167.2 671.6 146.0 79% 82%
Dept of Air Force/4 3,893.9 1,380.3 3,799.0 1,386.1 3,681.2 1,574.5 73% 70%Aircraft 2,771.4 845.4 2,379.8 735.2 2,531.9 849.6 76% 75%Other 1,122.5 534.9 1,419.2 650.9 1,149.3 724.9 69% 61%
USSOCOM 504.1 0.0 574.2 0.0 608.2 0.0 100% 100%Aircraft 240.1 0.0 314.6 0.0 328.7 0.0 100% 100%Other 264.0 0.0 259.6 0.0 279.5 0.0 100% 100%
Total 18,079.6 2,208.8 12,983.5 6,760.3 14,027.9 5,283.3 66% 73%Ship 8,328.4 0.0 5,056.1 2,515.1 6,297.0 1,437.0 67% 81%Aircraft 5,396.7 1,070.5 4,477.8 1,693.0 4,626.6 1,828.7 73% 72%Combat Vehicles / Automotive Equipment
655.8 322.0 307.2 946.0 301.4 438.6 25% 41%
Other 3,698.8 816.3 3,142.4 1,606.3 2,802.8 1,579.0 66% 64%1/ FY 2013 includes OCO funding.2/ FY 2014 excludes $6,472 million of OCO funding including $1,800 million of base funds transferred to OCO.3/ FY 2015 excludes OCO funding.4/ Includes Active, Reserve, and Guard Components as applicable.
115

BODY ARMOR AND OTHER PERSONAL PROTECTIVE GEAR
BODY ARMOR AND OTHER PERSONAL PROTECTIVE GEAR
THIS EXHIBIT WILL BE UPDATED UPON SUBMISSION OF THE
FY 2015 OVERSEAS CONTINGENCY OPERATIONS ESTIMATE
116

BASE OPERATIONS SUPPORT
BASE OPERATIONS SUPPORT
FUNDING SUMMARY $ in Millions
FY 2013/1 Actual
Price Growth
Program Growth
FY 2014/2 Enacted
Price Growth
Program Growth
FY 2015/3 Estimate
Army 8,726.7 143.3 -1,667.3 7,202.8 61.8 164.3 7,429.0 Army Reserve 573.9 9.5 -13.5 569.8 9.4 -190.2 388.9 Army National Guard 1,076.6 18.3 -94.5 1,000.4 17.7 -213.6 804.5 Navy 4,573.7 70.4 -117.8 4,526.3 -3.7 -123.9 4,398.7 Marine Corps 2,292.8 39.7 -728.7 1,603.9 -6.8 386.1 1,983.1 Navy Reserve 96.1 1.0 -4.4 92.7 1.4 12.3 106.4 Marine Corps Reserve 105.3 1.9 -3.4 103.7 1.7 -10.2 95.3 Air Force 6,569.3 100.5 -1,402.2 5,267.7 -42.6 -73.7 5,151.5 Air Force Reserve 431.7 5.8 -85.5 352.0 4.5 11.4 367.9 Air National Guard 676.7 10.8 -90.2 597.3 9.1 -24.8 581.5 Defense Health Program 847.1 13.6 -17.0 843.8 11.8 43.8 899.4
Total 25,969.9 414.8 -4,224.5 22,160.2 64.2 -18.5 22,206.2 Numbers may not add due to rounding
1 FY 2013 includes Overseas Contingency Operations (OCO) funding 2 FY 2014 enacted excludes $3,100 million of OCO including $500 million of base transferred to OCO 3 FY 2015 excludes OCO funding
ACTIVE FORCES PROGRAM DATA
FY 2013 Actual Change
FY 2014 Estimate Change
FY 2015 Estimate
Number of Active Major Installations CONUS 173 -7 166 0 166 Overseas 61 3 64 1 65
Active Forces Personnel (Thousands)/1 Military (End-Strength) 1,382.3 -37.1 1,345.3 -36.7 1,308.6 1FY 2013 and FY 2014 includes end strength funded with OCO
117

BASE OPERATIONS SUPPORT
BASE OPERATIONS SUPPORT
Base Operations Support (BOS) provides the resources to operate the bases, installations, camps, posts, and stations of the Military Services and the Defense Health Program (DHP). These resources provide personnel and infrastructure support to sustain mission capability, ensure quality-of-life, and enhance work force productivity.
Personnel support includes: food and housing services for unaccompanied and deployed forces; religious services and programs; payroll support; personnel management; morale, welfare, and recreation services to military members and their families.
Infrastructure support includes utility system operations; installation equipment maintenance; engineering services including fire protection, crash rescue, custodial, refuse collection, snow removal, and lease of real property; security protection and law enforcement; and motor pool transportation operations.
The FY 2015 budget request of $22,206.2 million reflects a net increase of $45.7 million from the FY 2014 enacted level. The FY 2014 Consolidated Appropriation Act transferred base costs of $500 million from the Marine Corps Active account to their OCO account. The FY 2015 column includes the reversal of this congressional action for the Marine Corps.
Installations: There was neither an increase nor decrease in active CONUS installations from FY 2014 to FY 2015. One additional overseas installation will be established in FY 2015 to support the national defense strategy.
Personnel: The decrease in military end-strength from FY 2014 to FY 2015 is due primarily to Army and Air Force force structure changes.
The following sections address BOS for each active Military Component and Defense Health Program.
118

BASE OPERATIONS SUPPORT
BASE OPERATIONS SUPPORT
ARMY $ in Millions
FY 2013/1 Actual
Change
FY 2014/2 Enacted
Change
FY 2015/3 Estimate
Army Active Funding 8,726.7 -1,523.9 7,202.8 226.2 7,429.0
Installations CONUS 51 -7 44 0 44 Overseas 23 3 26 0 26
Personnel (Thousands) Active Military (End-Strength) 532.0 -21.6 510.4 490.0
Numbers may not add due to rounding 1 FY 2013 includes Overseas Contingency Operations (OCO) funding including end strength funded with OCO 2 FY 2014 enacted excludes $0.7 billion of OCO 3 FY 2015 exclude OCO funding
The Army’s FY 2015 BOS request of $7,429.0 million reflects a net increase of $226.2 million from the FY 2014 enacted amount. Program increases include installation support such as utility costs ($233.1 million), conservation and environmental programs ($103.1 million), engineering services ($64.4 million), ground maintenance ($9.2 million), custodial services ($28.3 million), and emergency services ($44.7 million). Other increases include soldiers and family programs such as dining facilities operations ($177.0 million), an increase of 320 Victim Advocate positions (2 advocates per brigade level unit) ($25.3 million), and Suicide Prevention program ($2.7 million). The program increase also includes the transfer of $1.7 million from Forces Readiness Operations Support, to support physical security and security guards within three Commands, and the transfer of $1.4 million from Servicewide Communications, for enterprise service desk support.
Program decreases include reductions in installation support and related contracts for housing management and modernization, information and technology services, physical security, and other support services ($204.5 million), reductions in collateral equipment commensurate with the Military Construction program ($40.1 million), and a reduction in average annual civilian salaries ($20.6 million). The program also decreases for two transfers: (1) to Servicewide Communications ($106.1 million) in support of the consolidation and centralized management of enterprise license agreements; and (2) to Other Personnel Support, to consolidate the Sexual Harassment/Assault Response and Prevention program ($64.5 million). Other decreases account for one-time FY 2014 increases: (1) $40.8 million due to the completion of the decommissioning of the STURGIS nuclear barge; and (2) $10.0 million for environmental conservation for ranges.
119

BASE OPERATIONS SUPPORT
BASE OPERATIONS SUPPORT
NAVY $ in Millions
FY 2013/1 Actual
Change
FY 2014/2 Enacted
Change
FY 2015/3 Estimate
Navy Active Funding 4,573.7 -47.4 4,526.3 -127.7 4,398.7
Installations CONUS 51 51 51 Overseas 19 19 1 20
Personnel (Thousands) Active Military (End-Strength) 324.0 -0.1 323.9 -0.3 323.6
Numbers may not add due to rounding 1 FY 2013 includes Overseas Contingency Operations (OCO) funding 2 FY 2014 enacted excludes $110.9 million of OCO 3 FY 2015 excludes OCO funding
The Navy’s FY 2015 BOS request of $4,398.7 million reflects a net decrease of $127.7 million from the FY 2014 enacted level. The decrease is driven by internal Navy consolidation and integration efforts to minimize the organizational structure. The program also had increases for air traffic controllers and federal firefighters at public shipyards, the transfer of Navy Safe Harbor to the base operations program and the establishment of Naval Support Facility Deveselu in Romania.
120
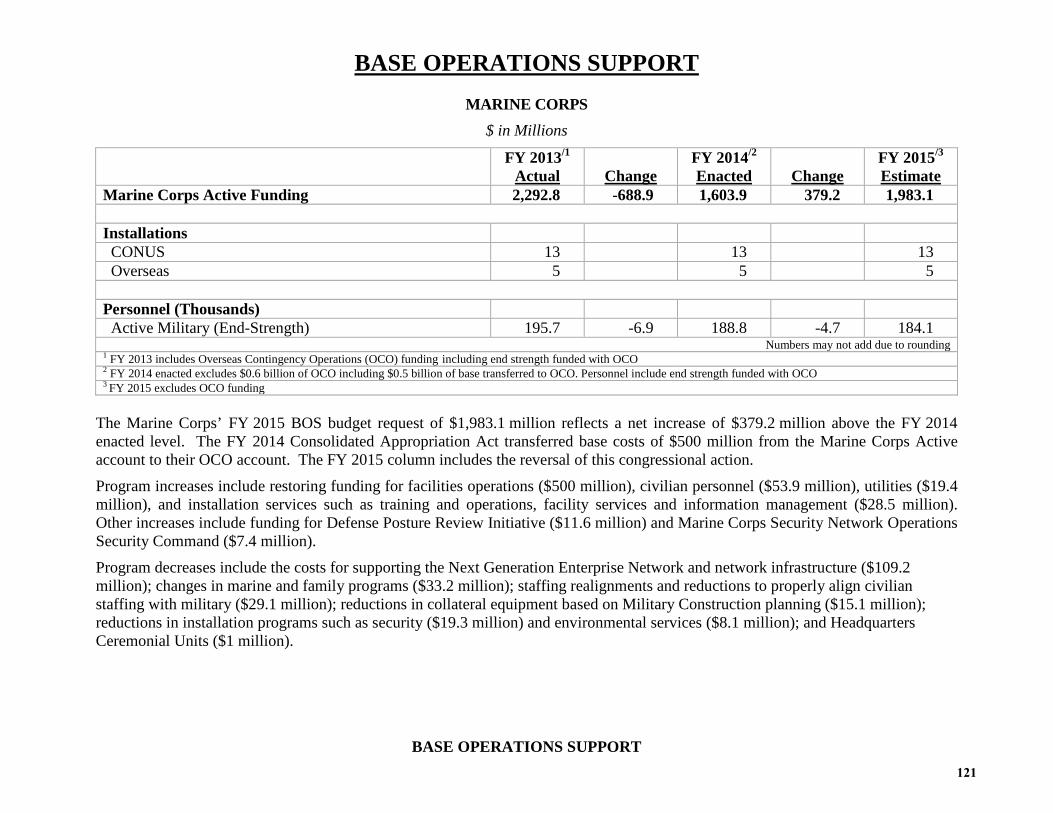
BASE OPERATIONS SUPPORT
BASE OPERATIONS SUPPORT
MARINE CORPS $ in Millions
FY 2013/1 Actual
Change
FY 2014/2 Enacted
Change
FY 2015/3 Estimate
Marine Corps Active Funding 2,292.8 -688.9 1,603.9 379.2 1,983.1
Installations CONUS 13 13 13 Overseas 5 5 5
Personnel (Thousands) Active Military (End-Strength) 195.7 -6.9 188.8 -4.7 184.1
Numbers may not add due to rounding 1 FY 2013 includes Overseas Contingency Operations (OCO) funding including end strength funded with OCO 2 FY 2014 enacted excludes $0.6 billion of OCO including $0.5 billion of base transferred to OCO. Personnel include end strength funded with OCO 3 FY 2015 excludes OCO funding
The Marine Corps’ FY 2015 BOS budget request of $1,983.1 million reflects a net increase of $379.2 million above the FY 2014 enacted level. The FY 2014 Consolidated Appropriation Act transferred base costs of $500 million from the Marine Corps Active account to their OCO account. The FY 2015 column includes the reversal of this congressional action.
Program increases include restoring funding for facilities operations ($500 million), civilian personnel ($53.9 million), utilities ($19.4 million), and installation services such as training and operations, facility services and information management ($28.5 million). Other increases include funding for Defense Posture Review Initiative ($11.6 million) and Marine Corps Security Network Operations Security Command ($7.4 million).
Program decreases include the costs for supporting the Next Generation Enterprise Network and network infrastructure ($109.2 million); changes in marine and family programs ($33.2 million); staffing realignments and reductions to properly align civilian staffing with military ($29.1 million); reductions in collateral equipment based on Military Construction planning ($15.1 million); reductions in installation programs such as security ($19.3 million) and environmental services ($8.1 million); and Headquarters Ceremonial Units ($1 million).
121

BASE OPERATIONS SUPPORT
BASE OPERATIONS SUPPORT
AIR FORCE $ in Millions
FY 2013/1 Actual
Change
FY 2014/2 Enacted
Change
FY 2015/3 Estimate
Air Force Active Funding 6,739.4 -1,471.7 5,267.7 -116.2 5,151.5
Installations CONUS 58 58 58 Overseas3 14 14 14
Personnel (Thousands) Active Military (End-Strength) 330.7 -8.5 322.2 -11.3 310.9
Numbers may not add due to rounding 1 FY 2013 includes Overseas Contingency Operations (OCO) funding 2 FY 2014 enacted excludes $1.6 billion of OCO 3 FY 2015 exclude OCO funding
The Air Force’s FY 2015 BOS request of $5,151.5 million reflects a net decrease of $116.2 million from the FY 2014 enacted level. Program changes in Base Operating Support, include increases for logistics readiness ($34.2 million); civilian personnel pay ($24.3 million); fuel rates ($7.8 million); the Oman Access Fee ($6.1 million); and Airmen support programs ($8.2 million) with offsetting decreases for the first phase of the strategic management headquarters initiative ($115 million); logistics, installations and communication infrastructure efficiencies ($75.3 million); utilities ($16.5 million); Pentagon rent ($18.3 million) and travel efficiencies ($9.7 million).
122

BASE OPERATIONS SUPPORT
BASE OPERATIONS SUPPORT
DEFENSE HEALTH PROGRAM $ in Millions
FY 2013/1 Actual
Change
FY 2014/2 Enacted
Change
FY 2015/2 Estimate
Defense Health Program Funding 847.1 -3.4 843.8 55.6 899.4
Installations CONUS 0 0 0 Overseas 0 0 0
Numbers may not add due to rounding 1 FY 2013 includes Overseas Contingency Operations (OCO) funding 2 FY 2014 and FY 2015 exclude OCO funding
The Defense Health Program’s (DHP) FY 2015 BOS request of $899.4 million reflects a net increase of $55.6 million, of which $11.8 million is price growth, from the FY 2014 enacted level. The program increase is primarily in facilities operations to support the National Capital Region (NCR) to bring their baseline to appropriate levels for the NCR regional hospital facility. Facility base operations both received funding for investments in technology products specific for buildings and equipment inventory as the Defense Health Agency Facilities (DHA) Shared Services team implements business processes improvements for facility planning to produce future savings for the DHA.
123

FACILITIES SUSTAINMENT, RESTORATION, AND MODERNIZATION (SRM) AND DEMOLITION PROGRAMS/1
FACILITIES, SUSTAINMENT, RESTORATION, AND MODERNIZATION (SRM) AND DEMOLITION PROGRAMS
$ in Millions
FY 20132
Actual Price
Growth Program Growth
FY 20143 Enacted
Price Growth
Program Growth
FY 20154 Estimate
Army 2,278.1 35.7 336.1 2,649.9 26.1 -609.6 2,066.4 Navy 1,598.4 11.7 67.6 1,677.7 25.9 -220.0 1,483.5 Marine Corps 865.2 14.0 -119.7 759.5 12.4 -198.0 573.9 Air Force 2,311.9 38.8 -131.6 2,219.1 -20.7 -111.4 2,087.0 Army Reserve 320.9 6.0 -32.8 294.1 5.2 -70.8 228.6 Navy Reserve 54.7 1.0 6.1 61.8 1.1 -14.6 48.3 Marine Corps Reserve 56.4 1.1 -25.0 32.4 0.6 -3.8 29.2 Air Force Reserve 119.6 2.2 -32.0 89.7 1.5 -5.5 85.7 Army National Guard 814.8 15.5 -137.0 693.3 12.5 -215.5 490.2 Air National Guard 296.4 5.6 -5.1 297.0 5.3 -164.7 137.6 Subtotal 8,716.4 131.6 -73.5 8,774.5 69.9 -1,613.9 7,230.5 Defense-Wide 208.2 3.5 -23.4 188.4 3.4 -3.1 188.6 Defense Health Program 1,135.9 19.3 -122.3 1,032.9 18.6 -267.2 784.3 Total 10,060.5 154.5 -219.2 9,995.8 91.9 -1,884.2 8,203.4
Numbers may not add due to rounding 1 This paper only addresses Operation and Maintenance (O&M) and Defense Health Program (DHP) FSRM 2 FY 2013 includes Overseas Contingency Operations (OCO) funding 3 FY 2014 enacted excludes $143.1 million OCO funding 4 FY 2015 excludes OCO funding
The Facilities Sustainment, Restoration and Modernization (FSRM) program provides funds to keep the Department’s inventory of facilities in good working order (i.e., day-to-day maintenance requirements). In addition, the program provides resources to restore facilities whose age is excessive or have been damaged. FSRM includes alterations of facilities to implement new or higher standards or to accommodate new functions or missions. The demolition program provides funds to demolish and dispose of obsolete and excess structures, some of which date back to World War II.
The FY 2015 budget request of $8,203 million includes price growth of $92 million and a net program decrease of $1,884 million below the FY 2014 enacted level. The FY 2015 request represents a decrease in funding of $1,792 million below the FY 2014 enacted. In aggregate, the FY 2015 request funds 67 percent of the facilities sustainment requirement, a 9 percent decrease from the 76 percent funded in FY 2014. The budget also includes $65 million for the demolition program, a decrease of $75 million from the FY 2014 enacted. The following data provides details on FSRM and the demolition program.
124

FACILITIES SUSTAINMENT, RESTORATION, AND MODERNIZATION (SRM) AND DEMOLITION PROGRAMS/1
FACILITIES, SUSTAINMENT, RESTORATION, AND MODERNIZATION (SRM) AND DEMOLITION PROGRAMS
Facilities Sustainment $ in Millions
FY 20132
Actual Price
Growth Program Growth
FY 20143 Enacted
Price Growth
Program Growth
FY 20154 Estimate
Army 1,485.0 23.3 642.9 2,151.1 21.2 -451.2 1,721.1 Navy 1,000.1 7.3 155.4 1,162.8 17.9 44.4 1,225.2 Marine Corps 585.1 9.5 22.4 617.0 10.1 -147.1 480.0 Air Force 1,508.1 25.3 78.4 1,611.8 -15.0 -59.9 1,536.8 Army Reserve 200.9 3.8 28.0 232.6 4.1 -29.6 207.2 Navy Reserve 31.3 0.6 0.6 32.5 0.6 -0.9 32.2 Marine Corps Reserve 45.6 0.9 -24.1 22.4 0.4 -4.0 18.8 Air Force Reserve 55.2 1.0 16.4 72.5 1.2 -8.8 64.9 Army National Guard 587.6 11.1 -20.9 577.8 10.4 -112.3 475.9 Air National Guard 171.9 3.3 40.1 215.2 3.9 -81.7 137.4 Total 5,670.7 86.0 939.1 6,695.9 54.8 -851.1 5,899.6
Numbers may not add due to rounding 1 This paper only addresses Operation and Maintenance (O&M) and Defense Health Program (DHP) FSRM 2 FY 2013 includes Overseas Contingency Operations (OCO) funding
3 FY 2014 enacted excludes $140.2 million OCO funding 4 FY 2015 excludes OCO funding
125

FACILITIES SUSTAINMENT, RESTORATION, AND MODERNIZATION (SRM) AND DEMOLITION PROGRAMS/1
FACILITIES, SUSTAINMENT, RESTORATION, AND MODERNIZATION (SRM) AND DEMOLITION PROGRAMS
Restoration and Modernization $ in Millions
FY 20132 Actual
Price Growth
Program Growth
FY 20143 Enacted
Price Growth
Program Growth
FY 20154 Estimate
Army 771.9 12.1 -313.2 470.8 4.4 -149.3 325.9 Navy 598.3 4.4 -131.7 471.0 7.3 -219.9 258.3 Marine Corps 276.9 4.5 -174.2 107.2 1.8 -33.2 75.7 Air Force 780.4 13.1 -206.2 587.3 -6.0 -55.3 526.0 Army Reserve 119.5 2.2 -62.8 59.0 1.0 -39.9 20.1 Navy Reserve 23.4 0.4 5.5 29.3 0.5 -13.7 16.1 Marine Corps Reserve 10.7 0.2 -0.9 10.0 0.2 0.2 10.4 Air Force Reserve 63.6 1.1 -48.1 16.6 0.3 3.8 20.7 Army National Guard 206.5 3.9 -99.7 110.7 2.0 -100.4 12.3 Air National Guard 120.7 2.3 -46.3 76.7 1.4 -78.1 0.0
Total 2,971.9 44.3 -1,077.7 1,938.5 12.8 -685.7 1,265.6 Numbers may not add due to rounding
1 This paper only addresses Operation and Maintenance (O&M) and Defense Health Program (DHP) FSRM 2 FY 2013 includes Overseas Contingency Operations (OCO) funding 3 FY 2014 enacted excludes $3.0 million OCO funding 4 FY 2015 excludes OCO funding
126

FACILITIES SUSTAINMENT, RESTORATION, AND MODERNIZATION (SRM) AND DEMOLITION PROGRAMS/1
FACILITIES, SUSTAINMENT, RESTORATION, AND MODERNIZATION (SRM) AND DEMOLITION PROGRAMS
Total SRM Program $ in Millions
FY 20132 Actual
Price Growth
Program Growth
FY 20143 Enacted
Price Growth
Program Growth
FY 20154 Estimate
Army 2,256.9 35.4 329.6 2,621.9 25.6 -600.5 2,047.0 Navy 1,598.4 11.7 23.7 1,633.8 25.2 -175.5 1,483.5 Marine Corps 861.9 14.0 -151.8 724.1 11.9 -180.3 555.7 Air Force 2,288.5 38.4 -127.8 2,199.1 -21.1 -115.2 2,062.9 Army Reserve 320.4 6.0 -34.8 291.6 5.2 -69.5 227.3 Navy Reserve 54.7 1.0 6.1 61.8 1.1 -14.6 48.3 Marine Corps Reserve 56.4 1.1 -25.0 32.4 0.6 -3.8 29.2 Air Force Reserve 118.8 2.1 -31.8 89.2 1.5 -5.0 85.7 Army National Guard 794.0 15.1 -120.6 688.5 12.4 -212.7 488.2 Air National Guard 292.6 5.6 -6.2 292.0 5.3 -159.8 137.4
Total 8,642.5 130.3 -138.5 8,634.4 67.6 -1,536.8 7,165.2 Numbers may not add due to rounding
1 This paper only addresses Operation and Maintenance (O&M) and Defense Health Program (DHP) FSRM 2 FY 2013 includes Overseas Contingency Operations (OCO) funding 3 FY 2014 enacted excludes $143.1 million OCO funding 4 FY 2015 excludes OCO funding
127

FACILITIES SUSTAINMENT, RESTORATION, AND MODERNIZATION (SRM) AND DEMOLITION PROGRAMS/1
FACILITIES, SUSTAINMENT, RESTORATION, AND MODERNIZATION (SRM) AND DEMOLITION PROGRAMS
Demolition costs $ in Millions
FY 20132 Actual
Price Growth
Program Growth
FY 20143 Enacted
Price Growth
Program Growth
FY 20154 Estimate
Army 21.2 0.4 6.5 28.0 0.5 -9.1 19.4 Navy 0.0 0.0 43.9 43.9 0.7 -44.6 0.0 Marine Corps 3.2 0.1 32.1 35.4 0.6 -17.7 18.2 Air Force 23.5 0.4 -3.8 20.0 0.3 3.9 24.2 Army Reserve 0.5 0.0 2.0 2.6 0.0 -1.3 1.3 Navy Reserve 0.0 0.0 0.0 0.0 0.0 0.0 0.0 Marine Corps Reserve 0.0 0.0 0.0 0.0 0.0 0.0 0.0 Air Force Reserve 0.8 0.0 -0.3 0.5 0.0 -0.5 0.0 Army National Guard 20.8 0.4 -16.4 4.8 0.1 -2.9 2.0 Air National Guard 3.9 0.1 1.1 5.0 0.1 -4.9 0.2
Total 73.8 1.3 65.0 140.1 2.3 -77.1 65.3 Numbers may not add due to rounding
1 This paper only addresses Operation and Maintenance (O&M) and Defense Health Program (DHP) FSRM 2 FY 2013 includes Overseas Contingency Operations (OCO) funding 3 FY 2014 did not request OCO 4 FY 2015 excludes OCO funding
128

FACILITIES SUSTAINMENT, RESTORATION, AND MODERNIZATION (SRM) AND DEMOLITION PROGRAMS/1
FACILITIES, SUSTAINMENT, RESTORATION, AND MODERNIZATION (SRM) AND DEMOLITION PROGRAMS
Army • The Army is requesting $2,066 million in FY 2015 for FSRM in its Operation and Maintenance (O&M), Army appropriation.
These funds reflect a net decrease of $584 million from the FY 2014 funding level: $26 million in price growth and $610 million in program decreases. SRM funding for FY 2015 will fund critical facility requirements and upgrade deteriorating facilities at Army installations worldwide. The FY 2015 program funds facilities sustainment at 62 percent of the requirement, a decrease from the 76 percent funded in FY 2014.
• The Army request includes $19 million for its demolition program, a decrease of $9 million below the FY 2014 enacted level. Navy • The Navy is requesting $1,484 million in FY 2015 for FSRM in its O&M, Navy appropriation. These funds reflect a net decrease
of $194 million from the FY 2014 funding level: $26 million in price growth and $220 million in program decreases. The FY 2015 program funds facilities sustainment at 70 percent of the requirement, an increase from the 63 percent funded in FY 2014.
• Due to funding constraints, the Navy has implemented a pause in its demolition program and did not request any funding in FY 2015.
Marine Corps • The Marine Corps is requesting $574 million in FY 2015 for FSRM in its O&M, Marine Corps appropriation. These funds reflect
a net decrease of $186 million from the FY 2014 funding level: $12 million in price growth and $198 million in program decreases. The FY 2015 program funds facilities sustainment at 75 percent of the requirement, a decrease from the 87 percent funded in FY 2014.
• The Marine Corps request includes $18 million for its demolition program, a decrease of $17 million from the FY 2014 enacted level in order to support short-term readiness.
Air Force • The Air Force is requesting $2,087 million in FY 2015 for FSRM in its O&M, Air Force appropriation. These funds reflect a net
decrease of $132 million from the FY 2014 funding level: $21 million in price decrease and $111 million in program decreases.
129

FACILITIES SUSTAINMENT, RESTORATION, AND MODERNIZATION (SRM) AND DEMOLITION PROGRAMS/1
FACILITIES, SUSTAINMENT, RESTORATION, AND MODERNIZATION (SRM) AND DEMOLITION PROGRAMS
The FY 2015 program funds facilities sustainment at 67 percent of the requirement, a decrease from the 75 percent funded in FY 2014.
• The Air Force request includes $24 million for its demolition program, consistent with prior year funding levels. Defense-Wide • The Defense-Wide activities are requesting $189 million in FY 2015 for FSRM in the O&M, Defense-Wide appropriation. These
funds reflect no net change from the FY 2014 funding level: $3 million in price growth and $3 million in program increases.
Defense Health Program (DHP) • The DHP is requesting $784 million in FY 2015 for FSRM in its O&M budget activity. These funds reflect a net decrease of
$249 million from the FY 2014 funding level: $19 million for price growth and $267 million in program decreases. The program funds the maintenance of military medical facilities, such as heating and air conditioning units, and plumbing and electrical systems, that are required to support active duty, military dependents, eligible retirees, and family members. The FY 2015 program achieves a 90 percent sustainment level and funds critical annual maintenance and repair activities. This is a decrease from the 100% funded sustainment in FY 2014.
Guard and Reserve Forces • The Guard and Reserve Forces are requesting $1,019 million in FY 2015, which reflects a decrease of $449 million from the
FY 2014 funding level: $26 million in price growth and $475 million in program decreases. The program supports the maintenance and restoration of real property facilities including: buildings, roads, grounds, and airfields of the Guard and Reserve. These facilities support the combat readiness for the Guard and Reserve that enables them to augment the active forces.
• The Guard and Reserve Forces request includes $4 million for their demolition programs, which is a decrease of $9 million from the FY 2014 enacted level.
130

MOBILIZATION
MOBILIZATION
$ in Millions
FY 2013/1
Actual Price
Growth Program Growth
FY 2014/2 Enacted
Price Growth
Program Growth
FY 2015/3 Estimate
Army 535.8 40.3 -28.2 547.9 -64.1 27.0 510.8 Navy4 441.8 -44.9 26.9 423.8 73.4 183.4 680.6 Marine Corps 89.1 1.5 6.9 97.4 1.6 -11.4 87.6 Air Force 4,818.2 3.1 -3,247.6 1,573.7 -1.2 536.1 2,108.6 Total 5,884.8 0.0 -3,242.0 2,642.9 9.7 735.1 3,387.7 Numbers may not add due to rounding. 1 FY 2013 includes Overseas Contingency Operations (OCO) funding 2 FY 2014 enacted excludes $3,591.1 million OCO funding including $500.0 million of base funds transferred to OCO 3 FY 2015 excludes OCO funding 4 FY 2015 the National Defense Sealift Fund (NDSF) is eliminated with the funds being allocated into multiple Navy accounts, including O&M
Mobilization provides for strategic and tactical airlift and sealift capability to deploy combat forces and materiel in contingencies. The mobilization program funds an inventory of readily available supplies and equipment, stationed both afloat and on land, to sustain the operating forces for lengths of time and levels of conflict outlined in the National Military Strategy.
The Mobilization program increases by $735.8 million from FY 2014 to FY 2015. This includes a price increase of $9.7 million and a program increase of $735.1 million. The majority of the program increase represents a restoral of $500.0 million of base to OCO realignments in the FY 2014 Consolidated Approbations Act.
131

MOBILIZATION
MOBILIZATION
$ in Millions
Afloat Prepositioned Fleet (APF) FY 2013/1
Actual Change FY 2014/2 Enacted Change
FY 2015/3 Estimate
Army APF 145.1 -35.5 180.6 7.0 187.6 Navy Maritime Prepo Ships (MPS) 358.7 -37.8 330.9 196.0 526.9 Air Force APF 4,606.3 -3,177.0 1,429.3 539.5 1,968.8 Total 5,110.1 -3,250.3 1,940.8 742.5 2,683.3
Numbers may not add due to rounding. 1 FY 2013 includes Overseas Contingency Operations (OCO) funding 2 FY 2014 includes $3,657.5 million OCO funding including $0.5 million of base funds transferred to OCO 3 FY 2015 excludes OCO funding
The Afloat Prepositioned Fleet (APF) program funds prepositioned ships, which carry equipment, supplies, and ammunition, and are available for immediate and rapid response to unforeseen contingencies throughout the world.
The Army’s strategic mobilization consists of the Army Power Projection Program (AP3), which seeks a balanced, synchronized, rapid fort-to-foxhole capability projected into areas of operations, without relying on conventional sea and aerial ports of debarkation where an adversary’s anti-access efforts can be focused. The AP3 enables the Army to rapidly deploy a lethal, expandable, and sustainable CONUS-based military force capable of achieving decisive victory anywhere in the world.
• The FY 2015 program increase of $7.0 million is attributable to increases in the number of retrograde ships. The Navy’s Sealift Program provides the worldwide capability to deploy combat forces and supporting material that may be required to meet national contingency objectives.
The program is divided into two functional areas, prepositioned assets and surge assets. Funding for all sealift surge ships was previously funded within in the National Defense Sealift Fund (NDSF) appropriation; however, this appropriation is disestablished in FY 2015. The former NDSF appropriations is being reallocated to multiple appropriations, including Operation and Maintenance, Navy; Procurement, Navy; and Ship Building and Conversion, Navy (SCN) The Operation and Maintenance, Navy account funds the daily operation of the prepositioned assets, as well as the biennial exercise costs associated with the Aviation Logistics Support Ships (T-AVB). This program also provides support for various sealift programs, including Improved Navy Lighterage Systems (INLS); lighter amphibious re-supply cargo; elevate causeway system (modular); Amphibious Bulk Liquid Transfer System (ABLTS); and Mobil Lighterage Transfer System (MLTS). In addition, the program provides for maintenance for the MPF’s on-board lighterage, and support for the Navy Expeditionary Logistics Support Group (NAVELSG) and Naval Beach Groups (BEACHGRUs).
132
MOBILIZATION
MOBILIZATION
• Major changes for the Navy’s sealift program include transferring $124.8 million from the disestablished NDSF to continue
providing ship prepositioning and surge capacity.
The Air Force Air Mobility Command (AMC) provides rapid global mobility and sustainment for America’s armed forces. These objectives lie at the heart of U.S. strategy in the modern world-wide war fighting environment. AMC also plays a crucial role in providing humanitarian support at home and abroad. Major mobility operations include airlift and refueling for all of America’s armed forces, AMC aircrew training and proficiency activities, and airlift operations.
• The majority of this increase represents a restoral of $500.0 million of base to OCO realignments in FY 2014. The remainder of the increase is attributed to additional mobility flying hours.
133

MOBILIZATION
MOBILIZATION
OTHER MOBILIZATION PROGRAMS $ in Millions
FY 2013/1
Actual Change FY 2014/2 Enacted Change
FY 2015/3 Estimate
Army 390.7 -23.4 367.3 -44.0 323.3 Strategic Mobility 384.7 -24.5 360.2 -43.4 316.8 Industrial Preparedness 6.0 1.1 7.1 -0.6 6.5
Navy 83.2 9.7 92.9 60.7 153.6 Activations/Inactivations 5.2 0.9 6.1 0.6 6.7 Expeditionary Health Services Systems 53.3 7.9 61.2 63.1 124.3 Industrial Readiness 2.0 0.4 2.4 -0.1 2.3 Coast Guard Support 22.7 0.5 23.2 -2.9 20.3
Marine Corps 89.1 8.3 97.4 -9.7 87.7 Prepositioned Equipment 89.1 8.3 97.4 -9.7 87.7
Air Force 211.9 -67.6 144.3 -4.6 139.7 Mobilization Preparedness 211.9 -67.6 144.3 -4.6 139.7
Total Other Mobilization 769.5 -24.0 701.9 2.4 704.3 Numbers may not add due to rounding.
1 FY 2013 includes Overseas Contingency Operations (OCO) funding 2 FY 2014 enacted includes $66.4 million of OCO funding 3 FY 2015 excludes OCO funding
The Army’s other mobilization programs fund manpower, material handling and other supply support equipment and facilities that are required to store and handle prepositioned stock materials. The Army Prepositioned Stocks (APS) program supports the Army’s capability to project combat ready forces from CONUS, Europe, Southwest Asia, Korea, Japan, and Hawaii to conduct operations anywhere in the world. Major FY 2015 changes include:
• Decreased funding for the Army’s strategic mobility is mainly attributed to a price decrease of $67.1 million. Programmatically, an additional $23.7 million was added to support the operational costs associated with six large medium speed roll on/roll-off and two munition container ships.
134
MOBILIZATION
MOBILIZATION
• Increased funding for the Army’s industrial preparedness is mainly related to price growth of $7.1 million; programmatically the activity was reduced by $0.6 million related to management efficiencies in travel and other operating expenses.
The Navy’s other mobilization programs include aircraft and ship activation/inactivation programs, which place aircraft and ships (both nuclear and conventional) out of active service, and prepare and maintain them for mobilization purposes or disposal through scrapping and sales. Other mobilization programs also fund the expeditionary health services systems program, which provides comprehensive medical support to U.S. and allied forces in the event of contingency operations; maintenance, overhaul, and support of Navy equipment aboard Coast Guard vessels; and an industrial readiness program. Major FY 2015 increases include:
• Transfer of $27.2 million from the disestablished NDSF to the Navy’s Expeditionary Health Service System program.
• The Navy also added $26.6 million for an additional 150 per diem days for ships operating costs associated with the biannual humanitarian assistance/disaster relief missions for the USNS COMFORT.
The Marine Corps’ Maritime Prepositioning Force (MPF) provides the essential operational elements needed to execute crisis response, global reach, and forward presence. Prepositioning key warfighting equipment and supplies has significantly reduced reliance on strategic lift while providing powerful and integrated warfighting capabilities to Combatant Commanders. Funding supports the rapid deployment of the Marine Corps and to provide for all costs associated with supplying and maintaining the Norway storage caves. This program including maintenance of the equipment in a ready-to-operate status, facility leases, contractor support, transportation of prepositioning equipment/supplies, and training/exercise associated with Marine Corps Prepositioning Program-Norway. The FY 2015 program change is mainly attributed to:
• Contractual services efficiencies (-$8.5 million).
The Air Force’s Other Mobilization program includes resources for airlift operations, mobilization preparedness, depot maintenance, facilities sustainment, restoration, and modernization (FSRM), and base support. The airlift operations program supports the day-to-day mission activities for strategic and tactical aircraft; aircrew training; headquarters operations at Air Mobility Command, its detachments and numbered Air Force headquarters; air refueling for strategic and tactical airlift; and proficiency training for mobility aircrews. It also funds operational support airlift and VIP special airlift missions for the President and Vice President of the United States, cabinet members and other high ranking officials, and special operations forces; prepositioning of war materials; storage of nuclear weapons and materials; sustainment of contingency hospitals and medical clinics; and payments to Airlift Readiness Accounts. Major FY 2015 program changes include:
• Decrease resulting from the consolidation of storage facility contract support for War Reserve Material (WRM) and Basic Expeditionary Airfield Resources (-$2.0 million).
Savings generated from reductions in knowledge based service contracts ($-3.2 million).
135

TRAINING AND EDUCATION
TRAINING AND EDUCATION
Training and Education resources finance the operation of a wide range of Service training centers and schools, Service academies, DoD and Joint-Service schools and colleges, Reserve Officer Training Corps (ROTC) units, the Senior ROTC scholarship program, the Uniformed Services University of the Health Sciences (USUHS), and the Health Professions Scholarship Program (HPSP). The FY 2015 budget request reflects a total funding decrease of $480.6 million. This is the net result of price growth totaling $164.3 million and programmatic decreases totaling $644.8 million. Overall, the program decreases are a reflection of reduced requirements as a result of force structure reductions.
Appropriation Summary $ in Millions
FY 2013/1
Actual Price
Growth Program Growth
FY 2014/2
Enacted Price
Growth Program Growth
FY 2015/3
Estimate Army 3,352.4 30.4 12.6 3,395.4 49.0 -245.0 3,199.4 Navy 2,240.3 29.8 -14.1 2,256.0 39.8 -96.6 2,199.2 Marine Corps 669.9 9.9 -109.2 570.7 10.6 -48.7 532.5 Air Force 2,612.6 32.9 93.2 2,738.7 32.8 -256.9 2,514.6 Defense Acquisition University (DAU) 131.9 1.4 17.3 150.7 2.0 -17.2 135.4 National Defense University (NDU) 77.0 0.9 9.6 87.5 1.2 -8.6 80.1 US Special Operations Command (USSOCOM) 331.9 5.4 -5.1 332.2 5.0 34.4 371.6 Defense Health Program (DHP) 655 20.9 57.3 733.1 23.9 -6.2 750.9 Total 10,071.0 131.6 61.6 10,264.3 164.3 -644.8 9,783.7
Numbers may not add due to rounding 1 FY 2013 includes Overseas Contingency Operations (OCO) funding 2 FY 2014 enacted excludes $179.6 million OCO funding 3 FY 2015 excludes OCO funding
136

TRAINING AND EDUCATION
TRAINING AND EDUCATION
$ in Millions
FY 2013/1
Actual Price
Growth Program Growth
FY 2014/2
Enacted Price
Growth Program Growth
FY 2015/3
Estimate Recruit Training Army/4 99.8 0.3 -4.6 95.5 1.4 -1.2 95.7 Navy 10.0 0.2 -0.9 9.3 0.1 -0.6 8.8 Marine Corps 17.2 0.2 0.2 17.6 0.3 0.4 18.2 Air Force 10.6 0.3 6.5 17.4 0.2 2.3 19.9 Total 137.6 1.0 1.2 139.8 2.0 0.9 142.6
Specialized Skills Training Army 871.3 9.2 111.7 992.2 13.2 -118.9 886.5 Navy 559.1 8.3 43.8 611.2 9.6 -19.3 601.5 Marine Corps 78.5 0.5 19.9 98.9 2.3 -2.7 98.5 Air Force 338.6 4.9 54.6 398.1 5.5 -47.4 356.2 DHP 133.4 1.4 0.2 134.9 1.8 9.6 146.3 USSOCOM 308.2 5.1 -5.5 307.8 4.6 21.7 334.1 Total 2289.1 29.4 224.7 2543.1 37.0 -157.0 2423.1
Officer Acquisition Army 99.9 1.1 14.9 115.9 1.5 7.4 124.8 Navy 141.6 1.6 -0.6 142.6 1.8 11.8 156.2 Marine Corps 0.9 0.0 0.1 0.9 0.0 0.0 0.9 Air Force 105.0 1.3 -9.2 97.1 1.2 -15.9 82.4 DHP 355.3 16.6 45.2 417.4 19.2 -4.2 432.3 Total 702.7 20.6 50.4 773.9 23.7 -0.9 796.6
Numbers may not add due to rounding 1 FY 2013 includes Overseas Contingency Operations (OCO) funding 2 FY 2014 enacted excludes $179.6 million OCO funding 3 FY 2015 excludes OCO funding 4 Includes Army One Station Unit Training
137

TRAINING AND EDUCATION
TRAINING AND EDUCATION
$ in Millions FY 2013/1
Actual Price
Growth Program Growth
FY 2014/2
Enacted Price
Growth Program Growth
FY 2015/3
Estimate Professional Development Army 156.1 1.8 20.6 178.5 2.6 12.2 193.3 Navy 152.1 1.7 8.9 162.7 2.2 -0.7 164.2 Marine Corps 36.5 0.5 8.8 45.8 0.7 -4.1 42.3 Air Force 190.3 2.7 55.3 248.3 3.7 -32.6 219.4 DAU 131.9 1.4 17.3 150.7 2.0 -17.2 135.4 NDU 77.0 0.9 9.6 87.5 1.2 -8.6 80.1 USSOCOM 23.7 0.3 0.4 24.4 0.4 12.7 37.5 DHP 147.9 2.4 7.5 157.8 2.5 -10.6 149.7 Total 915.5 11.7 128.4 1055.7 15.3 -48.9 1021.9 Senior ROTC Army 490.4 8.8 -57.4 441.8 7.1 7.7 456.6 Navy 132.1 2.4 4.0 138.5 2.4 7.2 148.1 Air Force 72.7 1.3 19.3 93.3 1.6 -18.8 76.1 Total 695.2 12.5 -34.1 673.6 11.1 -3.9 680.8
Flight Training Army 972.4 2.0 -23.6 950.8 14.6 -75.3 890.1 Navy 635.2 5.8 -25.5 615.5 13.6 -68.4 560.7 Air Force 689.2 4.9 97.8 791.9 5.8 -100.1 697.6 Total 2,296.8 12.7 48.7 2,358.2 34 -243.8 2,148.4
Numbers may not add due to rounding 1 FY 2013 includes Overseas Contingency Operations (OCO) funding 2 FY 2014 enacted excludes $179.6 million OCO funding 3 FY 2015 excludes OCO funding
138

TRAINING AND EDUCATION
TRAINING AND EDUCATION
$ in Millions
FY 2013/1
Actual Price
Growth Program Growth
FY 2014/2
Enacted Price
Growth Program Growth
FY 2015/3
Estimate Training Support Army 662.5 7.2 -49.0 620.7 8.6 -76.9 552.4 Navy 144.5 1.9 10.7 157.1 2.6 22.9 182.6 Marine Corps 461.1 7.4 -135.8 332.7 6.0 -8.5 330.2 Air Force 103.5 1.0 0.4 104.9 1.3 -15.2 91.0 Total 1,371.6 17.5 -173.7 1,215.4 18.5 -77.7 1,156.2
Numbers may not add due to rounding 1 FY 2013 includes Overseas Contingency Operations (OCO) funding 2 FY 2014 enacted excludes $179.6 million OCO funding 3 FY 2015 excludes OCO funding
Recruit Training: • The Army budget request of $95.7 million includes a program decrease of $1.2 million. This decrease reflects reduced support
costs for basic combat training and one-station unit training, and reduces funding for supplies and materials, communications, and equipment purchases as a result of fewer recruits.
• The Air Force budget request of $19.9 million includes a program increase of $2.3 million. This increase is primarily to allow for the issuance of steel-toed boots in basic military training offset by decreases to technical training quotas, logistics and installation efficiencies, and civilian pay.
Specialized Skill Training: • The Army budget request of $886.5 million includes a program decrease of $118.9 million. This decrease reflects reduced costs
for the average annual civilian salary, contract requirements, and 385 FTEs in the intermediate and advance level courses at the Defense Language Institute Foreign Language Center. This decrease also reduces the number of training seats for Soldier qualifications in the award of Skill Qualification Identifiers and Additional Skill Identifiers.
• The Navy budget request of $601.5 million includes a program decrease of $19.3 million. This decrease includes reduced funding for Temporary Duty Under Instruction (TEMDUINS), Enterprise Training Management System (EDTMS), and Navy nuclear
139

TRAINING AND EDUCATION
TRAINING AND EDUCATION
power training and reduced force structure changes.
• The Air Force budget request of $356.2 million includes a program decrease of $47.4 million. This decrease is primarily driven by reductions to the technical training quotas, Air Advisory Academy, civilian pay, and logistics and installations efficiencies.
• The USSOCOM budget request of $334.1 million includes a program increase of $21.7 million. This increase reflects support funding for 10 additional experts at the U.S. Army Special Warfare Center for regional expertise and cultural training; initial foreign language training, including pre-mission training and foreign language familiarization courses; increased availability of joint instructors and expendable materials for joint Medical Training Facility courses; and a realignment of the SOCOM Language Office (SOFLO) from the Management Headquarters into Specialized Skill Training. These increases are offset by decreasing civilian staffing at the U.S. Army John F. Kennedy Special Warfare Center.
Officer Acquisition: • The Army budget request of $124.8 million includes a program increase of $7.4 million. This increase of funds establishes the
Army Cyber Center of Excellence at West Point and increases 20 FTEs to support the center; increases operational support to West Point's academic laboratories; and provides funding to develop customized marketing strategies for the recruitment and retention of minority students.
• The Navy budget request of $156.2 million includes a program increase of $11.8 million. This increase funds the Advance Education Review Board (AERB) that provides additional funding for priority initiatives for Midshipmen summer training, Language, Regional, Expertise and Culture (LREC) travel, faculty and staff certification, building sustainment, classroom and lab equipment recapitalization and library procurements (on-line journals, collections) at the United States Naval Academy.
• The Air Force budget request of $82.4 million includes a program decrease of $15.9 million. This decrease reflects a reduction to Cadet education and training, and a reduction to civilian pay.
Professional Development: • The Army budget request of $193.3 million includes a program increase of $12.2 million. This increase reflects costs associated
with the Expanded Graduate School Program (EGSP) including Graduate School for Active Duty Service Obligation (GRADSO).
• The Air Force budget request of $219.4 million includes a program decrease of $32.6 million. This decrease reflects a reduction for professional military education, a reduction for civilian pay, and a reduction for Air Force Institute of Technology (AFIT).
• The Defense Acquisition University budget request of $135.4 million includes a decrease of $17.2 million. This decrease is primarily driven by reductions in curriculum development costs for the College of Contract Management; reductions to information technology network contract support and delay of information technology recapitalization; reduced travel for students, faculty and staff; reductions to grounds maintenance, janitorial services, and disabled student support; and reductions in contractor
140

TRAINING AND EDUCATION
TRAINING AND EDUCATION
curriculum maintenance for Defense Acquisition Workforce Improvement Act (DAWIA) courses.
• The Defense Health Program budget request of $149.7 million includes a program decrease of $10.6 million. These decreases are primarily reflected in travel reductions and efficiencies, and headquarters and equipment reductions. These decreases are offset by increases in University of the Health Sciences (USUHS) faculty development and curriculum reform to meet new accreditation and standards; increases for enlisted to Medical Degree Preparation Program increases; and increases for Patient Safety and Quality Academic Collaborative (PSQAC).
• The USSOCOM budget request of $37.5 million includes a program increase of $12.7 million. This increase supports: accreditation funding for Special Operation Forces (SOF) Advanced Education and Joint Special Operations University (JSOU); additional civilian staffing to provide curriculum development and research including support to the faculty, management, and administration; directed educational and academic research programs at the university level in support of USSOCOM Headquarters and its components; the Enlisted Career Education Program; the Theater Special Operations Command (TSOC) education program; expansion and enhancement of the Senior Enlisted Academy; the Joint Professional Military Education courses; and dedicated information technology services, system administration, and video teleconferencing, library subscriptions and technical support to JSOU.
Senior ROTC: • The Army budget request of $456.6 million includes a program increase of $7.7 million. This increase is reflective of the
increased costs of college tuition scholarships.
• The Navy budget request of $148.1 million includes a program increase of $7.2 million. This increase is reflective of the increased costs of college tuition along with 25 additional full scholarships and corresponding support costs.
• The Air Force budget request of $76.1 million includes a program decrease of $18.8 million. This decrease reflects a $13.1 million reduction to scholarships, and a reduction to management support contracts.
Flight Training: • The Army budget request of $890.1 million reflects a program decrease of $75.3 million. This decrease reflects reduced funding
for contract requirements, and initial and graduate level training seats. The decrease also reflects reduced costs for the flying hour program and the reduction of U.S. Army pilot training seats.
• The Navy budget request of $560.7 million reflects a program decrease of $68.4 million. This decrease reflects reduced funding for contract services, travel, civilian personnel costs (-8 Civilian FTE), projected contract maintenance, fuel and maintenance costs and associated flight hours for multitude of aircraft (T-34C, T-39G, T-39N, T-44A, T-45A, T-6A, TC-12B, and TH-57D). These decreases are offset by an increases in projected contract maintenance, fuel and maintenance costs and associated flight hours for a multitude of aircraft (T-44C, T-45C, T-6B, TH-57B,and TH-57C).
141
TRAINING AND EDUCATION
TRAINING AND EDUCATION
• The Air Force budget request of $697.6 million reflects a program decrease of $100.1 million. This decrease reflects $77.1 million reduction to the flying hour program, undergraduate flying training, civilian pay, and logistics and installations support.
Training Support: • The Army budget request of $552.4 million reflects a program decrease of $76.9 million. This decrease reflects a reduction in
contract support, 65 FTEs in Management Headquarters, consumables, equipment purchases, supplies and materials, and government purchases.
• The Navy budget request of $182.6 million reflects a program increase of $22.9 million. This increase is primarily to the surface and expeditionary training wholeness offset by decreases to maintenance requirements for Navy Training Management and Planning System (NTMPS), Integrated Learning Environment (ILE) and Navy Knowledge Online (NKO) along with reduced force structure changes.
• The Marine Corps budget request of $330.2 million reflects a program decrease of $8.5 million. This decrease reflects the termination of the joint training support, Combat Hunter, Sports Medicine and Injury Prevention, Marine Corps Center of Lessons Learned (MCCLL) and Marine Corps Civil Military Operation School (MCCMOS).
• The Air Force budget request of $91.0 million reflects a program decrease of $15.2 million. This decrease reflects a reduced reliance on service support contracts and a reduction in Management Headquarters, including the contracting insourcing initiative, civilian pay, and service support contracting efficiencies.
142

TRAINING AND EDUCATION
TRAINING AND EDUCATION
PROGRAM DATA Hours in Thousands
Flying Hours FY 2013 Actual Change
FY 2014 Enacted Change
FY 2015 Estimate
Army 236.0 10.0 246.0 -54.0 192.0 Navy 250.0 33.0 283.0 1.0 284.0 Air Force 345.0 43.7 388.7 -21.9 366.9 Total 831.0 86.7 917.7 -74.9 842.9
Numbers may not add due to rounding
WORKLOAD INDICATORS Student/Trainee Workyears
FY 2013 Actual Change
FY 2014 Estimate Change
FY 2015 Estimate
Army 74,152 -3,610 70,542 -642 69,900 Recruit Training 15,620.0 -803.0 14,817.0 -17.0 14,800.0 One Station Unit Training 8,680.0 -1,337.0 7,343.0 -43.0 7,300.0 Specialized Skill 40,045.0 -1,776.0 38,269.0 -269.0 38,000.0 Officer Acquisition 4,901.0 13.0 4,914.0 86.0 5,000.0 Flight Training 1,826.0 -130.0 1,696.0 4.0 1,700.0 Professional Development 3,080.0 423.0 3,503.0 -403.0 3,100.0 Navy 48,109 -1,343 46,766 -566 46,134 Recruit Training 7,296 -1,298 5,998 108 6,106 Specialized Skill 24,078 326 24,404 -296 24,108 Officer Acquisition 5,106 -158 4,948 -176 4,772 Senior ROTC 6,012 26 6,038 20 6,058 Flight Training 2,946 -304 2,642 -229 2,347 Professional Development 2,671 65 2,736 7 2,743
143

TRAINING AND EDUCATION
TRAINING AND EDUCATION
WORKLOAD INDICATORS (cont’d) Student/Trainee Workyears
FY 2013 Actual Change
FY 2014 Enacted Change
FY 2015 Estimate
Marine Corps 23,829 -528 23,301 -42 23,259 Recruit Training 6,358 536 6,894 -283 6,611 Specialized Skill 15,291 -687 14,604 294 14,898 Officer Acquisition 302 -67 235 -23 212 Professional Development 1,878 -310 1,568 -30 1,538 Air Force 32,749 1,410 34,159 -915 33,244 Recruit Training 5,316.0 232 5,548 0 5,548 Specialized Skill Training 16,170 831 17,001 -739 16,262 Officer Acquisition 4,493 -261 4,232 -122 4,110 Flight Training 1,736 146 1,882 94 1,976 Professional Development 5,034 462 5,496 -148 5,348 Defense Health Program 73,476 8,606 82,082 -125 81,947 Officer Acquisition 7,089 259 7,348 -159 7,179 Graduate Medical Education 1,803 5 1,808 8 1,816 Professional Development 14,959 9,026 23,985 1,617 25,602 Other Education and Training Programs 32,731 -1,600 31,131 -32 31,099 Medical Education and Training Center 16,894 916 17,810 -1,559 16,251
Numbers may not add due to rounding
144

RECRUITING, ADVERTISING, AND EXAMINING
RECRUITING, ADVERTISING, AND EXAMINING
Overall funding in recruiting, advertising, and examining provides support for recruiting commands and stations throughout the United States; local, regional, and national advertising to access and retain quality enlisted and officer personnel; and the processing of all enlisted personnel entering on active duty. Total FY 2015 funding net decreases by $13.3 million. Of this amount, there is a $26.1 million increase for price growth and a $39.4 million decrease for program changes.
$ in Millions
Funding Summary FY 2013
Actual Price
Growth Program
Growth FY 2014
Enacted Price
Growth Program Growth
FY 2015
Estimate
Army 657.9 10.1 -34.0 634.0 9.3 18.3 661.6 Navy 184.4 2.2 44.3 230.9 3.9 -4.2 230.6 Marine Corps 172.6 3.0 -22.6 153.0 2.6 6.1 161.8 Air Force 131.9 2.3 -10.3 123.9 2.1 -49.0 77.0 Defense Health Program 61.7 1.4 14.1 77.2 1.6 -1.2 77.6 Defense-Wide 23.0 0.4 0.8 24.2 0.4 -2.4 22.2 Army Reserve 40.9 0.9 -10.4 31.4 0.6 2.9 34.9 Marine Corps Reserve 8.2 0.2 0.8 9.2 0.2 -0.6 8.7 Air Force Reserve 24.7 0.4 -10.6 14.5 0.2 -0.2 14.5 Army National Guard 274.2 4.5 -21.1 257.6 4.6 -7.0 255.2 Air National Guard 39.4 0.8 -7.6 32.6 0.6 -2.1 31.1 Total 1,618.9 26.2 -56.6 1,588.5 26.1 -39.4 1,575.2
Numbers may not add due to rounding
145

RECRUITING, ADVERTISING, AND EXAMINING
RECRUITING, ADVERTISING, AND EXAMINING
The following tables provide the funding by Component for each category:
Recruiting The recruiting mission is to maintain the highest quality force possible. Recruiting funds provide support for recruiting commands and stations throughout the United States, to include civilian pay and training; recruiter training; recruiter travel and per diem; applicant meals, lodging and travel; vehicle operation and maintenance; office leases; and operating costs of the Navy’s Flight Demonstration Team (Blue Angels).
The FY 2015 recruiting program reflects a net decrease of $4 million. Of this amount, $13 million is for price growth netted against a program decrease of $17 million. The decrease reflects accession mission reductions; organizational rightsizing; business process reengineering efforts; and best business practices implementation.
$ in Millions
Recruiting Summary FY 2013
Actual Price
Growth Program
Growth FY 2014 Enacted
Price Growth
Program Growth
FY 2015 Estimate
Army 312.4 5.3 -46.9 270.8 4.2 1.1 276.1 Navy 129.1 1.9 15.5 146.5 2.3 -1.1 147.7 Marine Corps 87.9 1.0 1.0 89.9 1.9 -6.5 85.4 Air Force 47.9 0.7 6.7 55.3 0.9 -3.3 52.9 Army Reserve 37.0 0.8 -9.6 28.2 0.5 3.0 31.7 Marine Corps Reserve 5.3 0.1 0.0 5.4 0.1 0.1 5.5 Air Force Reserve 8.1 0.1 -0.9 7.3 0.1 0.7 8.1 Army National Guard 147.6 2.4 1.9 151.9 2.7 -10.2 144.4 Air National Guard 14.3 0.3 0.0 14.6 0.3 -0.8 14.1 Total 789.6 12.6 -32.3 769.9 13.0 -17.0 765.9
Numbers may not add due to rounding
146
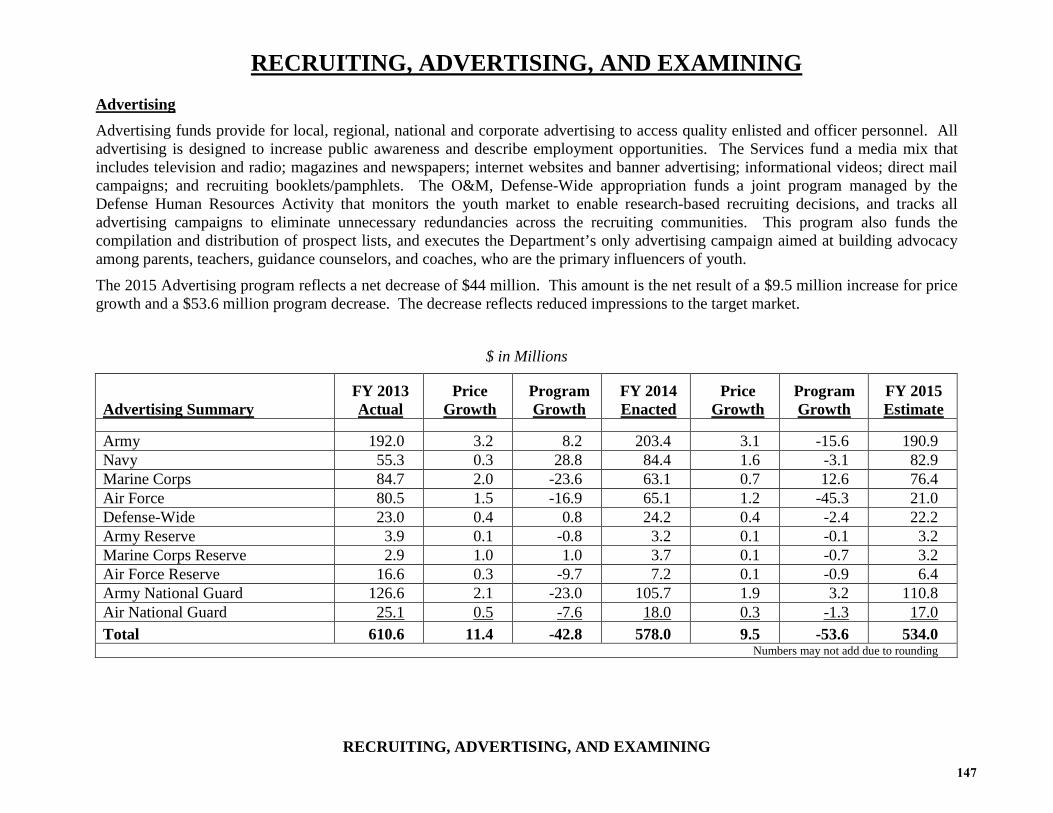
RECRUITING, ADVERTISING, AND EXAMINING
RECRUITING, ADVERTISING, AND EXAMINING
Advertising Advertising funds provide for local, regional, national and corporate advertising to access quality enlisted and officer personnel. All advertising is designed to increase public awareness and describe employment opportunities. The Services fund a media mix that includes television and radio; magazines and newspapers; internet websites and banner advertising; informational videos; direct mail campaigns; and recruiting booklets/pamphlets. The O&M, Defense-Wide appropriation funds a joint program managed by the Defense Human Resources Activity that monitors the youth market to enable research-based recruiting decisions, and tracks all advertising campaigns to eliminate unnecessary redundancies across the recruiting communities. This program also funds the compilation and distribution of prospect lists, and executes the Department’s only advertising campaign aimed at building advocacy among parents, teachers, guidance counselors, and coaches, who are the primary influencers of youth.
The 2015 Advertising program reflects a net decrease of $44 million. This amount is the net result of a $9.5 million increase for price growth and a $53.6 million program decrease. The decrease reflects reduced impressions to the target market.
$ in Millions
Advertising Summary FY 2013
Actual Price
Growth Program Growth
FY 2014
Enacted Price
Growth Program Growth
FY 2015
Estimate Army 192.0 3.2 8.2 203.4 3.1 -15.6 190.9 Navy 55.3 0.3 28.8 84.4 1.6 -3.1 82.9 Marine Corps 84.7 2.0 -23.6 63.1 0.7 12.6 76.4 Air Force 80.5 1.5 -16.9 65.1 1.2 -45.3 21.0 Defense-Wide 23.0 0.4 0.8 24.2 0.4 -2.4 22.2 Army Reserve 3.9 0.1 -0.8 3.2 0.1 -0.1 3.2 Marine Corps Reserve 2.9 1.0 1.0 3.7 0.1 -0.7 3.2 Air Force Reserve 16.6 0.3 -9.7 7.2 0.1 -0.9 6.4 Army National Guard 126.6 2.1 -23.0 105.7 1.9 3.2 110.8 Air National Guard 25.1 0.5 -7.6 18.0 0.3 -1.3 17.0 Total 610.6 11.4 -42.8 578.0 9.5 -53.6 534.0
Numbers may not add due to rounding
147

RECRUITING, ADVERTISING, AND EXAMINING
RECRUITING, ADVERTISING, AND EXAMINING
Examining Examining funds provide support for the U.S. Military Entrance Processing Command (MEPCOM), which operates 65 Military Entrance Processing Stations (MEPS) and 468 Military Examining Test Sites (METS). This joint-Service organization screens individuals for medical and moral qualifications and aptitude, and then administratively processes them into all of the Armed Services. During mobilization, the command processes persons called to active duty from the Individual Ready Reserve, as well as conscripts inducted via the Selective Service System (SSS). As the DoD Executive Agent for the MEPCOM, the Army provides funding and civilian personnel resources for operation of the MEPS and the METS, administration of the Armed Services Vocational Aptitude Battery (ASVAB) for both the production and student (high school) testing programs, and the MEPCOM’s Information Technology (IT) requirements. The Air Force provides funding for an Air Force specific strength aptitude test program. This Air Force program provides a gender neutral test to ensure personnel are capable of performing their duties, therefore reducing accidents and injuries due to overexertion and alleviating attrition in strenuous jobs.
The Defense Health Program finances the medical activities in the MEPS, primarily the examination of applicants to determine their medical qualifications for enlistment in the Armed Forces. In addition, the Defense Health Program includes funds for the DoD Medical Evaluation Review Board, which schedules and reviews physical examinations for the Service Academies and for the Reserve Officers Training Corps (ROTC) scholarship program.
The FY 2015 Examining program reflects an net increase of $34.8 million. This amount is the net result of a $3.6 million increase for price growth and a $31.2 million program increase. The increase reflects increased support to the Military Entrance Processing Command Integrated Resource System due to replacement schedule delays; replacement equipment for communications and information technology; and increased production testing and examining workload.
$ in Millions
Examining Summary FY 2013
Actual Price
Growth Program Growth
FY 2014
Enacted Price
Growth Program Growth
FY 2015
Estimate Army 153.5 1.6 4.7 159.8 2.0 32.8 194.6 Air Force 3.5 0.1 -0.1 3.5 0.0 -0.4 3.1 Defense Health Program 61.7 1.4 14.1 77.2 1.6 -1.2 77.6 Total 218.7 3.1 18.7 240.5 3.6 31.2 275.3
Numbers may not add due to rounding
148

COMMAND, CONTROL, AND COMMUNICATIONS (C3)
COMMAND, CONTROL, AND COMMUNICATIONS (C3)
$ in Millions
C3 FY 2013/1
Actual Price
Growth Program/2
Growth FY 2014/2 Enacted
Price Growth
Program Growth
FY 2015/3 Estimate
Army 3,032.8 61.8 -2,602.3 492.3 7.4 358.7 858.4 Navy 976.0 17.6 -39.5 954.1 17.2 53.0 1,024.3 Marine Corps 44.5 0.8 -5.4 39.9 0.8 18.3 59.0 Air Force 2,634.6 41.3 -764.6 1,911.3 23.8 -65.4 1,869.7 Defense-Wide 730.0 12.8 -134.6 608.2 11.4 70.8 690.4 Army Reserve 83.6 1.5 5.5 90.6 1.8 -20.8 71.6 Navy Reserve 15.6 0.3 -0.5 15.4 0.2 0.5 16.1 Marine Corps Reserve 2.3 0.0 0.3 2.6 0.0 -1.8 0.8 Air Force Reserve 97.6 1.5 -44.8 54.3 0.7 12.4 67.4 Army National Guard 259.5 5.6 -0.9 264.2 4.8 -67.2 201.8 Air National Guard 58.0 1.5 21.5 81.0 1.5 -29.1 53.4 Defense Health Program 37.1 0.0 7.3 44.4 0.0 1.4 45.8 Total 7,971.6 144.7 -3,558.0 4,558.3 69.6 330.8 4,958.7
Numbers may not add due to rounding 1 FY 2013 includes Overseas Contingency Operations (OCO) funding 2 FY 2014 enacted excludes OCO funding and $500 million of base funds transferred to OCO 3 FY 2015 excludes OCO funding
Command, control, and communications (C3) resources provide seamless base level and worldwide communication networks for voice, data, and imagery traffic of sufficient quality, reliability, and flexibility to ensure responsive support to U.S. forces. This information infrastructure contains communications networks, computers, software, databases, applications, data, security services, and other capabilities that meet the information processing and transport needs of DoD users. The C3 program specifically funds telecommunications systems, leased circuits, and other services necessary for information transfer, messaging operations, and equipment associated with sending and receiving communications transmissions. Additionally, this program funds efforts to integrate command and control systems with communications to support the information needs of field commanders. The FY 2015 budget request of $4,958.7 million includes price increases of $69.6 million and program increases of $330.8 million (7 percent) above the FY 2014 funding level.
149

COMMAND, CONTROL, AND COMMUNICATIONS (C3)
COMMAND, CONTROL, AND COMMUNICATIONS (C3)
$ in Millions
C3 FY 2013/1
Actual Price
Growth Program Growth
FY 2014/2 Enacted
Price Growth
Program Growth
FY 2015/3 Estimate
Data Communications Sustaining Base Communications 1,942.3 32.6 -542.4 1,432.5 20.3 -50.9 1,401.9
Long Haul Communications 2,610.3 51.8 -2,050.0 612.1 11.4 392.5 1,016.0 Deployable and Mobile Communications 628.2 12.8 -312.7 328.3 5.6 36.0 369.9
Sub Total (data communications) 5,180.8 97.2 -2,905.1 2,372.9 37.3 377.6 2,787.8
Command and Control (C2) National 691.3 11.3 -274.9 427.7 6.0 -28.7 405.0 Operational 669.3 11.0 -155.4 524.9 8.6 30.6 564.1 Tactical 365.2 6.6 -5.2 366.6 3.8 61.2 431.6
Sub Total C2 1,725.8 28.9 -435.5 1,319.2 18.4 63.1 1,400.7
C3-Related Navigation 112.4 1.2 12.1 125.7 1.0 -2.8 123.9 Meteorology 68.0 0.8 11.1 79.9 0.7 -7.5 73.1 Combat Identification 281.0 5.0 32.4 318.4 6.2 -17.8 306.8 Information Assurance Activities 603.6 11.6 -273.0 342.2 6.0 -81.8 266.4
Sub Total C3 related 1,065.0 18.6 -217.4 866.2 13.9 -109.9 770.2
Total 7,971.6 144.7 -3,558.0 4,558.3 69.6 330.8 4,958.7 Numbers may not add due to rounding
1 FY 2013 includes Overseas Contingency Operations (OCO) funding 2 FY 2014 enacted excludes OCO funding and $500 million of base funds transferred to OCO 3 FY 2015 excludes OCO funding
150

COMMAND, CONTROL, AND COMMUNICATIONS (C3)
COMMAND, CONTROL, AND COMMUNICATIONS (C3)
Data Communications: Communications are an integral element of C3 and include sustaining base, long haul, and all forms of deployable and mobile communications assets. Resources for sustaining base communications are almost exclusively fixed plant and installation support and provide the “backbone” and other communications infrastructure for CONUS and overseas locations. Funding for long-haul communications, largely comprised of the Defense Information Systems Network (DISN) costs, includes primarily voice and data services for all off-post connectivity, worldwide web, and other connectivity. The DISN is a combination of DoD-owned and leased telecommunications networks and subsystems comprised of equipment, services, personnel, and facilities under the management control and operational direction of the Defense Information Systems Agency (DISA). Resources for deployable and mobile communications include funding for systems and capabilities to extend communications into areas of operations, which are primarily provided through satellite systems and other wireless transmission means and constitute moveable or transportable communications. The FY 2015 budget request of $2,787.8 million reflects a program increase of $377.6 million (16 percent) above the FY 2014 funding level. The following are the most significant changes:
• The Army Active Component budget request of $670.5 million includes a program increase of 410.7 million. This increase restores the FY 2014 transfer of base funding to OCO and is partially offset by management efficiencies in contract services and headquarters support.
• The Navy Active Component budget request of $591.2 million includes a program increase of $80.6 million that supports connectivity to the Global Information Grid and the consolidation of telephony resources to improve audit readiness.
• The Marine Corps Active Component budget request of $53.8 million includes a program increase of $18.8 million for upgrades to the Land Mobile Radio System used by first responders and increased efforts to monitor and defend the Marine Corps Enterprise Network from cyber-attacks.
• The Air Force Active Component budget request of $640.9 million includes a program decrease of $61.9 million, primarily the result of efficiencies in civilian payroll, support contracts, infrastructure, and logistics support related to base communications.
• The Army National Guard request of $168.9 million includes a program decrease of $67.5 million due to reduced data migration and change management costs associated with the shift from legacy systems to the Global Combat Support System – Army.
• The Air National Guard request of $53.4 million includes a program decrease of $29.1 million as the result of management efficiencies in base communications programs.
• The Special Operations Command (SOCOM) budget request of $162.8 million includes a program increase of $21.7 million. This increase is attributed to the expansion of connectivity between deployed forces and CONUS-based Special Operations Forces commands as well as increased airtime for unmanned aerial operations.
151

COMMAND, CONTROL, AND COMMUNICATIONS (C3)
COMMAND, CONTROL, AND COMMUNICATIONS (C3)
Command and Control (C2): This category represents the facilities, systems, and manpower essential to a commander for planning, directing, coordinating, and controlling operations of assigned forces. These command and control capabilities cover the National Command Authority, through the joint operational and theater level echelon, and down to the front-line tactical elements. Additionally, this category includes funding for the Defense portion of the National Airspace System and other air traffic control activities. The FY 2015 budget request of $1,400.7 million reflects a program increase of $63.1 million (5 percent) above the FY 2014 funding level. Major changes include:
• The Navy Active Component budget request of $84.5 million reflects a program decrease of $7.9 million in contract services for tactical command & control that is commensurate with planned force structure reductions.
• The Air Force Active Component budget request of $1,002.4 million reflects a program increase of $20.2 million, primarily driven by an increase in weapons system sustainment costs for various C2 systems that is partially offset by reductions in headquarters support.
• The SOCOM budget request of $253.6 million includes a program increase of $49.9 million, primarily for the sustainment of inventory, capital equipment replacement, and licensing for the SIPR/NIPR infrastructure.
C3-Related: This category includes various programs and functions related to, and supportive of, communications, command, and control requirements and includes both communications security and computer security. Included are communication resources to support navigation, meteorological reporting, combat identification that provides positive identification of friendly forces to prevent fratricide, and information assurance to protect information systems against denial of service and unauthorized (accidental or intentional) disclosure, modification, or destruction of the information system or data. The FY 2015 budget request of $770.2 million reflects a program decrease of $109.9 million (13 percent) below the FY 2014 funding level. The significant changes include:
• The Army Active Component budget request of $128.1 million reflects a program decrease of $52.9 million, primarily due to management efficiencies in contract support for the Network Enterprise Centers.
• The Navy Active Component budget request of $348.6 million reflects a program decrease of $19.7 million in contract services for combat identification that is commensurate with planned force structure reductions.
• The Air Force Active Component budget request of $226.4 million includes a program decrease of $23.7 million, which is primarily a result of reductions in civilian pay funding in the meteorology and navigation functional areas along with other efficiencies in travel and contract services.
• The DISA budget request of $10.5 million includes a program decrease of $5.8 million that is the result of reductions in software procurement and application development requirements for the Information Systems Security Program.
152

TRANSPORTATION
TRANSPORTATION
$ in Millions
FY 2013/1
Actual Price
Growth Program Growth
FY 2014/2
Enacted Price
Growth Program Growth
FY 2015/3
Estimate Army 4,467.4 319.7 -4,359.7 427.4 9.5 105.0 541.9 Navy 330.0 16.0 -139.0 207.0 -11.0 -24.0 172.0 Marine Corps 270.6 14.4 -241.2 43.8 -3.0 -4.4 36.4 Air Force 288.7 23.7 -117.4 195.0 1.6 -6.7 189.9 Army Reserve 11.2 0.2 -0.7 10.7 0.2 -0.3 10.6 Navy Reserve 4.0 0.1 0.3 4.4 0.1 -0.4 4.1 Marine Corps Reserve 0.3 0.0 0.6 0.9 0.0 0.0 0.9 Air Force Reserve 4.7 0.1 -3.1 1.7 0.0 0.3 2.0 Army National Guard 7.4 0.1 2.4 9.9 0.2 -3.4 6.7 Air National Guard 34.4 2.1 -24.5 12.0 0.2 -1.0 11.2 DoD Dependents Education 20.2 0.7 -1.1 19.8 0.6 -0.7 19.7 Defense Logistics Agency 0.1 0.0 0.0 0.1 0.0 0.0 0.1 Defense Threat Reduction 4.4 0.1 0.5 5.0 0.0 -0.4 4.6 OSD 201.6 24.6 32.8 259.0 5.2 -16.8 247.4 Joint Staff <0.1 0.0 0.0 <0.1 0.0 0.0 <0.1 Total 5,645.0 401.8 -4,850.1 1,196.7 3.6 47.2 1,247.5
Numbers may not add due to rounding 1 FY 2013 includes Overseas Contingency Operations (OCO) funding 2 FY 2014 enacted excludes OCO funding including $200 million of base funds transferred to OCO 3 FY 2015 excludes OCO funding
The Transportation budget funds the movement of materiel between contractors’ plants, military logistics centers, and field activities throughout the world. The Components purchase transportation from Department of Defense (DoD) activities in the Defense Working Capital Funds (DWCF) and from commercial sources. Transportation consists of two types: first destination and second destination (explained subsequently). In addition to DoD military supplies and equipment, other major commodities shipped include overseas mail, subsistence items, and base exchange stock. Supplies and equipment may be shipped overland, by sea or by air.
153

TRANSPORTATION
TRANSPORTATION
In FY 2015, total DoD transportation costs are $1,247.5 million, an increase of $50.8 million above the FY 2014 funding level. This includes price increases of $3.6 million and program increases of $47.2 million (4 percent).
• The Army Active Component budget request of $541.9 million includes a program increase of $105.0 million in the second destination transportation program that partially restores the FY 2014 transfer of base funding to OCO. This increase was partially offset by a decrease in the volume of Army Post Office (APO) Mail associated with the decline in the number of military and civilian personnel and families stationed at OCONUS locations, and reductions in the requirements for port handling and traffic management.
• The Navy Active Component budget request of $172.0 million includes a program decrease of $24.0 million in second destination transportation that is commensurate with planned force structure reductions, and reflects decreased requirements for the strategic laydown and dispersal plan for service-wide transportation and logistics support and the USTRANSCOM DPO bill.
• The Marine Corps Active Component budget request of $36.4 million includes a program decrease of $4.4 million in second destination transportation that is commensurate with planned force structure reductions.
• The Air Force Active Component budget request of $189.9 million includes a program decrease of $6.7 million, which is primarily the result of management efficiencies that reduced headquarters support and the use of defense courier services, and reduced use of military airlift in favor of surface transportation.
• The Army National Guard Component budget request of $6.7 million includes a program decrease of $3.4 million associated with a reduction in the cross-leveling of equipment across National Guard units due to an increase in new procurement. This decrease in second destination transportation costs is coupled with a reduction in the amount of equipment that will be required to be shipped from Regional Sustainment Maintenance Sites.
• The Office of the Secretary of Defense budget request of $247.4 million includes a program decrease of $16.8 million is driven by a reduction in the number of forces expected to participate in Combatant Commanders Exercise Engagement and Training Transformation (CE2T2) training events and attendant programmatic reductions to the Joint Exercise Transportation Program (JETP).
154

TRANSPORTATION
TRANSPORTATION
First Destination Transportation First Destination Transportation (FDT) finances the transportation costs for delivery of items purchased directly from manufacturers. FDT costs for delivery of procurement-funded weapon systems and equipment or supplies and equipment purchased through the Defense Working Capital Fund are not included here. The following table summarizes FDT funding:
$ in Millions
FY 2013/1
Actual Price
Growth Program Growth
FY 2014/2
Enacted Price
Growth Program Growth
FY 2015/3
Estimate Major Commodity 25.8 0.8 -0.9 25.7 0.7 -1.1 25.3 Military Supplies and Equipment 25.8 0.8 -0.9 25.7 0.7 -1.1 25.3
Mode of Shipment 25.8 0.8 -0.9 25.7 0.7 -1.1 25.3
Military Commands 3.1 0.1 0.2 3.4 0.1 -0.4 3.1 Sealift 1.0 0.0 0.0 1.0 0.0 0.0 1.0 Airlift 2.1 0.1 0.2 2.4 0.1 -0.4 2.1 Commercial 22.7 0.7 -1.1 22.3 0.6 -0.7 22.2 Surface 21.4 0.7 -1.0 21.1 0.6 -0.8 20.9 Air 1.3 0.0 -0.1 1.2 0.0 0.1 1.3
Numbers may not add due to rounding 1 FY 2013 includes Overseas Contingency Operations (OCO) funding 2 FY 2014 enacted excludes OCO funding 3 FY 2015 excludes OCO funding
155

TRANSPORTATION
TRANSPORTATION
Second Destination Transportation Funding for Second Destination Transportation (SDT) finances the movement of government owned equipment and materiel among and between depots, logistics centers, and field activities including: retrograde cargo, post office mail, ammunition, support of classified and special programs, spare parts and other cargo. Equipment and materiel is shipped by either military airlift and sealift worldwide, commercial surface transportation, or commercial air carriers operating daily flights over regular routes within CONUS and Alaska. Costs include accessory transportation services such as vessel per diem and retention charges. The following table summarizes SDT funding – “other” includes storage costs, container leasing, shipping equipment (e.g., cranes), and cargo tracking systems:
$ in Millions
FY 2013/1
Actual Price
Growth Program Growth
FY 2014/2
Enacted Price
Growth Program Growth
FY 2015/3
Estimate Major Commodity 5,619.2 401.0 -4,849.2 1,171.0 2.9 48.3 1,222.2 Military Supplies and Equipment 4,504.5 326.5 -3,883.2 947.8 6.7 28.1 982.6 Mail Overseas 91.7 4.6 -48.7 47.6 -0.5 6.5 53.6 Subsistence 811.0 55.9 -823.2 43.7 -0.8 1.7 44.6 Base Exchange 212.0 14.0 -94.1 131.9 -2.5 12.0 141.4
Mode of Shipment 5,619.2 401.0 -4,849.2 1,171.0 2.9 48.3 1,222.2
Military Commands 2,381.8 195.5 -1,899.4 677.9 -7.1 -12.0 658.8 Surface 201.5 48.8 -101.4 148.9 5.8 -19.0 135.7 Sealift 988.3 77.1 -881.3 184.1 -10.6 14.8 188.3 Airlift 1,164.0 68.6 -917.7 314.9 -3.3 8.2 319.8 Other 28.0 1.0 1.0 30.0 1.0 -16.0 15.0 Commercial 3,237.4 205.5 -2,949.8 493.1 10.0 60.3 563.4 Surface 953.7 64.1 -906.1 111.7 2.2 16.7 130.6 Sealift 935.1 66.8 -890.8 111.1 2.5 27.3 140.9 Airlift 1,286.1 70.1 -1,124.4 231.8 4.4 6.9 243.1 Other 62.5 4.5 -28.5 38.5 0.9 9.4 48.8
Numbers may not add due to rounding 1 FY 2013 includes Overseas Contingency Operations (OCO) funding 2 FY 2014 enacted excludes $55.3 billion of OCO funding including $200 million of base funds transferred to OCO 3 FY 2015 excludes OCO funding
156

CONTRACT SERVICES
CONTRACT SERVICES
SUMMARY BY COMPONENT $ in Millions
COMPONENT FY 2013/1
Actuals Change FY 2014/2
Enacted Change FY 2015/3 Estimate
Army 33,466 -20,632 12,834 1,012 13,846 Navy 16,118 -4,461 11,657 -174 11,483 Air Force 16,651 -2,319 14,332 -20 14,312 Defense-Wide 16,511 -2,547 13,964 -523 13,440
Total 82,746 -
29,959 52,787 295 53,081 Source: Progam Resources Collection Process (PRCP) as of 18 February 2014 Numbers may not add due to rounding
1 FY 2013 includes Overseas Contingency Operations (OCO) funding. 2 FY 2014 excludes $23,089 million of OCO funding includes $2,320 million of base funds transferred to OCO.
3 FY 2015 excludes OCO funding.
Excludes MILCON and RDT&E
Excludes Defense Health Program (25.6) and R&D Contracts (25.5)
Excludes Other Government Purchases (25.3)
157

CONTRACT SERVICES
CONTRACT SERVICES
SUMMARY BY APPROPRIATION $ in Millions
APPROPRIATION FY 2013/1
Actuals Change FY 2014/2
Enacted Change FY 2015/3 Estimate
Family Housing 410 -17 393 -52 342 Military Personnel 35 9 44 0 44 Operation and Maintenance 75,550 -26,919 48,631 567 49,197 Procurement 6,636 -2,936 3,700 -203 3,498 Revolving Funds 114 -96 18 -18 0 Total 82,746 -29,959 52,787 295 53,081 Total Contractor Full-Time Equivalents (FTEs) 459,580 255,487 268,281 Source: Program Resources Collection Process (PRCP) as of 18 February 2014 Numbers may not add due to rounding
1 FY 2013 includes Overseas Contingency Operations (OCO) funding. 2 FY 2014 excludes $23,089 million of OCO funding including $2,320 million of base funds transferred to OCO.
3 FY 2015 excludes OCO funding.
Excludes MILCON and RDT&E
Excludes Defense Health Program (25.6) and R&D Contracts (25.5)
Excludes Other Government Purchases (25.3)
158

CONTRACT SERVICES
CONTRACT SERVICES
OPERATION AND MAINTENANCE $ in Millions
932 Mgmt and Professional Support Services 6,631 -3,865 2,765 40 2,806933 Studies, Analysis and Evaluations 625 -148 477 -22 455934 Engineering and Technical Services 3,881 -1,983 1,897 -149 1,749
Total 25.1 - Advisory and Assistance Services 11,137 -5,997 5,139 -131 5,009926 Other Overseas Purchases 141 -126 15 3 18989 Other Services 14,126 -5,412 8,714 -704 8,010991 Foreign Currency Variance -113 113 0 0 0993 Other Services-Scholarships 408 53 460 0 461
Total 25.2 - Other Services 14,562 -5,372 9,189 -700 8,489923 Facility Maintenance 11,018 -1,649 9,369 -926 8,443
Total 25.4 - Operation and Maintenance of Facilities 11,018 -1,649 9,369 -926 8,443922 Equipment Maintenance - Contract 17,582 -5,872 11,710 710 12,420927 Air Defense Contracts 617 304 921 -18 903928 Ship Maintenance by Contract 3,359 -2,735 624 361 984929 Aircraft Rework by Contract 912 -256 656 77 733930 Other Depot Maintenance (Non-Fund) 9,890 -2,103 7,787 911 8,698990 IT Contract Support Services 3,788 -1,047 2,741 269 3,010
Total 25.7 - Operation and Maintenance of Equipment 36,148 -11,709 24,439 2,309 26,748964 Subsistence Contracts 2,686 -2,192 494 15 509
Total 25.8- Subsistance and Support of Persons 2,686 -2,192 494 15 509Total 75,550 -26,919 48,631 567 49,197Total Contractor Full-Time Equivalents (FTEs) 406,327 236,768 245,708
Source: Progam Resources Collection Process (PRCP) as of 18 February 2014 Numbers may not add due to rounding
FY 2013/1
Actuals ChangeFY 2014/2
Enacted ChangeFY 2015/3
EstimateBy OP-32 Inflation Category CodeLine
3 FY 2015 excludes OCO funding.
Excludes MILCON and RDT&E
Excludes Defense Health Program (25.6) and R&D Contracts (25.5)
Excludes Other Government Purchases (25.3)
1 FY 2013 includes Overseas Contingency Operations (OCO) funding.2 FY 2014 excludes $22,866 million of OCO funding including $2,320 million of base funds transferred to OCO.
159
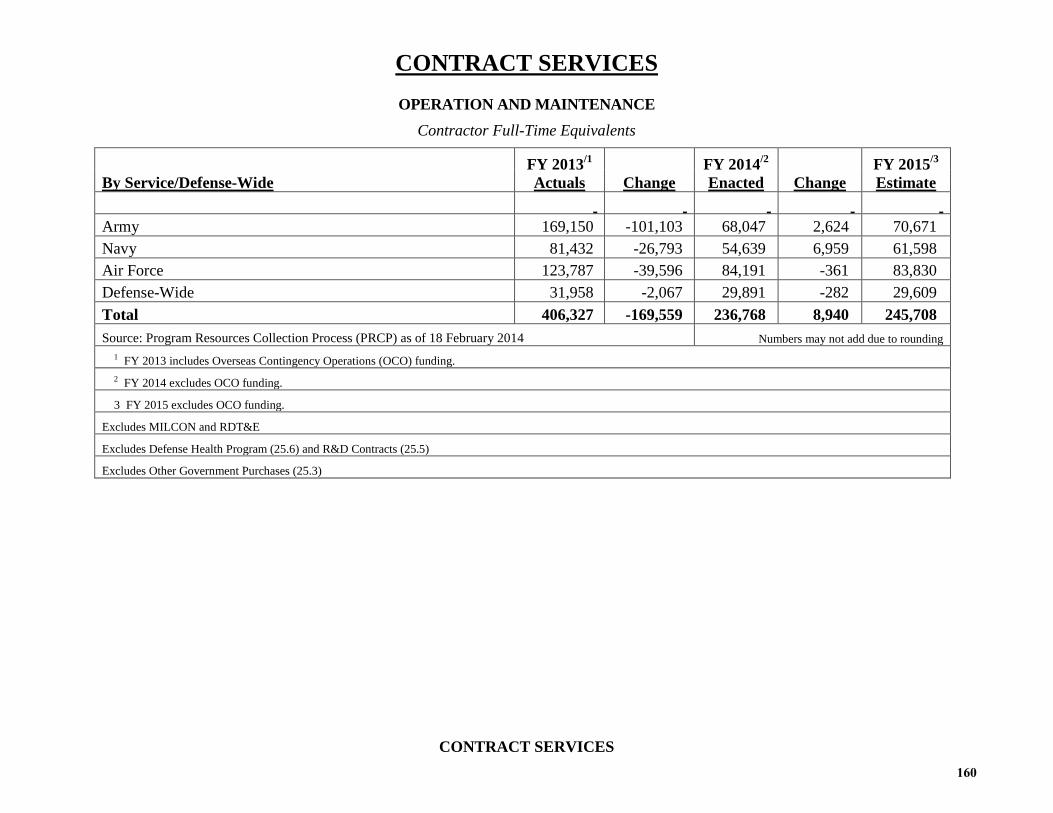
CONTRACT SERVICES
CONTRACT SERVICES
OPERATION AND MAINTENANCE Contractor Full-Time Equivalents
By Service/Defense-Wide FY 2013/1
Actuals Change FY 2014/2
Enacted Change FY 2015/3 Estimate
Army 169,150 -101,103 68,047 2,624 70,671 Navy 81,432 -26,793 54,639 6,959 61,598 Air Force 123,787 -39,596 84,191 -361 83,830 Defense-Wide 31,958 -2,067 29,891 -282 29,609 Total 406,327 -169,559 236,768 8,940 245,708 Source: Program Resources Collection Process (PRCP) as of 18 February 2014 Numbers may not add due to rounding
1 FY 2013 includes Overseas Contingency Operations (OCO) funding. 2 FY 2014 excludes OCO funding.
3 FY 2015 excludes OCO funding.
Excludes MILCON and RDT&E
Excludes Defense Health Program (25.6) and R&D Contracts (25.5)
Excludes Other Government Purchases (25.3)
160

CONTRACT SERVICES
CONTRACT SERVICES
FAMILY HOUSING $ in Millions
Line By OP-32 Inflation Category Code FY 2013/1
Actuals Change FY 2014/2
Enacted Change FY 2015/3 Estimate
932 Mgmt and Professional Support Services 1 -1 1 -1 0 933 Studies, Analysis and Evaluations 3 0 3 0 3 934 Engineering 1 -1 0 0 0
Total 25.1 - Advisory and Assistance Services 5 -2 4 -1 3 989 Other Contracts 32 -13 19 0 19
991 Foreign Currency Variance 0 0 0 0 0
Total 25.2 - Other Services 32 -13 19 0 19 923 Facility Maintenance 368 -9 359 -49 310
Total 25.4 - Operation and Maintenance of Facilities 368 -9 359 -49 310 922 Equipment Maintenance - Contract 4 7 11 -2 9 Total 25.7 - Operation and Maintenance of Equipment 4 7 11 -2 9 Total 410 -17 393 -52 342 Total Contractor Full-Time Equivalents (FTEs) 1,392 1,407 1,229
Source: Program Resources Collection Process (PRCP) as of 18 February 2014 Numbers may not add due to rounding 1 FY 2013 - FY 2015 did not request OCO funding
Excludes MILCON and RDT&E
Excludes Defense Health Program (25.6) and R&D Contracts (25.5)
Excludes Other Government Purchases (25.3)
161

CONTRACT SERVICES
CONTRACT SERVICES
PROCUREMENT $ in Millions
Line By OP-32 Inflation Category Code FY 2013/1
Actuals Change FY 2014/2
Enacted Change FY 2015/3 Estimate
932 Mgmt and Professional Support Services 2,079 -1,193 887 -7 879 933 Studies, Analysis and Evaluations 135 -95 39 3 42 934 Engineering and Technical Services 1,672 -638 1,034 103 1,137 Total 25.1 - Advisory and Assistance Services 3,887 -1,926 1,960 98 2,058
926 Other Overseas Purchases 136 631 767 -80 686 989 Other Contracts 1,708 -1,268 440 -67 373 Total 25.2 - Other Services 1,845 -638 1,207 -148 1,059 923 Facility Maintenance 475 -88 388 -221 166 Total 25.4 - Operation and Maintenance of Facilities 475 -88 388 -221 166 922 Equipment Maintenance - Contract 318 -177 141 10 151 930 Other Depot Maintenance (Non-Fund) 107 -106 1 58 59 990 IT Contract Support Services 5 -1 4 0 4 Total 25.7 - Operation and Maintenance of Equipment 430 -284 145 68 214 Total 6,636 -2,936 3,700 -203 3,498 Total Contractor Full-Time Equivalents (FTEs) 38,623 17,073 21,193 Source: Program Resources Collection Process (PRCP) as of 18 February 2014 Numbers may not add due to rounding
1 FY 2013 includes Overseas Contingency Operations (OCO) funding. 2 FY 2014 excludes $60 million of OCO funding.
3 FY 2015 excludes OCO funding.
Excludes MILCON and RDT&E
Excludes Defense Health Program (25.6) and R&D Contracts (25.5)
Excludes Other Government Purchases (25.3)
162

CONTRACT SERVICES
CONTRACT SERVICES
MILITARY PERSONNEL $ in Millions
Line By OP-32 Inflation Category Code FY 2013/1
Actuals Change FY 2014/2
Enacted Change FY 2015/3 Estimate
922 Equipment Maintenance - Contract 35 9 44 0 44 Total 25.7 - Operation and Maintenance of Equipment 35 9 44 0 44 Total 35 9 44 0 44 Total Contractor Full-Time Equivalents (FTEs) 84 125 132 Source: Program Resources Collection Process (PRCP) as of 18 February 2014 Numbers may not add due to rounding
1 FY 2013 includes Overseas Contingency Operations (OCO) funding. 2 FY 2014 excludes $164 million of OCO funding.
3 FY 2015 excludes OCO funding.
Excludes MILCON and RDT&E
Excludes Defense Health Program (25.6) and R&D Contracts (25.5)
Excludes Other Government Purchases (25.3)
163

CONTRACT SERVICES
CONTRACT SERVICES
Description of Services Financed: In accordance with the Federal Acquisition Regulation 37.101, contract services are contracts that directly engage the time and effort of a contractor whose primary purpose is to perform an identifiable task rather than to furnish an end item of supply. Contract services are a viable source of labor for commercial work that is not inherently governmental or otherwise exempted from the private sector. In accordance with 10 U.S. Code 235 (as modified by the National Defense Authorization Act for Fiscal Year 2010, Section 803), this exhibit provides a summary of services contracted within all DoD appropriations except Military Construction and Research, Development, Test and Evaluation.
Reporting Limitations: The Department of Defense will continue to work on processes and system improvements required to accurately and consistently report budget requests for contract services (to include funding and contractor FTEs). Modifications are required to the following systems and processes: budget and manpower systems, contracting procedures, the Federal Procurement Data System – Next Generation, and the Inventory of Contracts for Services.
Summary of Changes: While the Department is still decreasing its reliance on contractor support services, the net increase ($295 million) from FY 2014 enacted levels to the FY 2015 request is the result of inflation ($950 million) and an overall decrease in contract services ($656 million). Restoral of the FY 2014 Consolidated Appropriations Act transfer of base to OCO ($2,320 million) results in a program decrease of $2,976 million.
• Operation and Maintenance – 25.1 – Advisory and Assistance Services ($93 million price growth and $223 million program decrease)
– 25.2 – Other Services ($165 million price growth and $866 million program decrease)
– 25.4 – Operation and Maintenance of Facilities ($169 million price growth and $1,095 million program decrease)
– 25.7 – Operations and Maintenance of Equipment ($440 million price growth and $1,869 million program growth)
– 25.8 – Subsistence and Support of Persons ($9 million price growth and $6 million program growth)
• Advisory and Assistance ($-223 million) The decrease is the result of the Army decreases to base operations support and land forces systems readiness; Air Force decreases in combat enhancement forces and other servicewide activities; Navy decreases in base operations, other weapons system support, and classified programs; and Defense-Wide decreases in for the Office of the Secretary of Defense and classified programs.
• Other Services ($-866 million) Net decrease is a result of the Air Force decreases in airlift operations, combat enhancement forces, combatant commanders direct mission support, and other combat operations support programs; Navy decreasing ship operations, ship depot operations support, specialized skills training, and off-duty and secondary education; Army decreasing base
164

CONTRACT SERVICES
CONTRACT SERVICES
operations support, force readiness operations support, and other service-wide support; and Defense-Wide decreases are reflected in the Defense Human Resources Activity, the Office of the Secretary of Defense, Special Operations Command, and classified programs.
• Operation and Maintenance of Facilities ($-1.1 billion) The net decrease reflects all components taking additional short-term risk in facilities sustainment and deferring restoration and modernization projects.
• Operation and Maintenance of Equipment ($+1.9 billion) The net increase is primarily the result of program growth realized from the FY 2014 Congressional transfer of funding from base to OCO. The Air Force has increases in depot maintenance and logistic operations. The Army has increases in force readiness operations support, land forces depot maintenance, servicewide communications, and theater level assets. The Navy has increases in ship depot maintenance and base operation support, and the Marine Corps has increases in field logistics.
• Subsistence and Support of Person ($+6 million) Net increase is in the Army Reserves for force operations readiness support and recruiting and advertising.
165

PRISONER OF WAR AND MISSING PERSONNEL AFFAIRS (POW/MPA) PROGRAMS
PRISONER OF WAR AND MISSING PERSONNEL AFFAIRS (POW/MPA) PROGRAMS
$ in Millions
FINANCIAL SUMMARY
Requirements FY 2013 Actual
FY 2014 Enacted
FY 2015 Estimate
FY 2016 Estimate
FY 2017 Estimate
FY 2018 Estimate
FY 2019 Estimate
Defense POW/MIA Office (DPMO) 18.6 21.3 21.5 19.9 20.4 20.9 21.4 Joint POW/MIA Accounting Command (JPAC) 124.7 122.8 144.6 145.6 145.6 145.6 145.6 Armed Forces DNA Identification Laboratory (AFDIL) 11.0 11.3 20.9 20.9 20.9 20.9 20.9 Life Sciences Equipment Laboratory (LSEL) 1.0 1.0 1.1 1.2 1.2 1.2 1.2 Total 161.2 217.2 225.9 249.3 251.1 251.4 252.1
Budgets Defense POW/MIA Office (DPMO) 18.6 21.3 21.5 19.9 20.4 20.9 21.4 Joint POW/MIA Accounting Command (JPAC) 88.5 118.6 109.5 95.6 95.6 95.6 95.6 Armed Forces DNA Identification Laboratory (AFDIL) 11.0 11.3 13.7 16.5 18.3 19.7 19.7 Life Sciences Equipment Laboratory (LSEL) 0.2 0.3 0.3 0.3 0.3 0.3 0.3 Total 162.3 216.4 208.6 212.2 212.6 215.6 217.4
Percentage of Budget to Requirements Defense POW/MIA Office (DPMO) 100% 100% 100% 100% 100% 100% 100% Joint POW/MIA Accounting Command (JPAC) 71% 97% 76% 66% 66% 66% 66% Armed Forces DNA Identification Laboratory (AFDIL) 100% 100% 65% 79% 88% 94% 94% Life Sciences Equipment Laboratory (LSEL) 24% 25% 29% 29% 28% 27% 28% Total 76% 97% 77% 71% 72% 72% 72%
166
PRISONER OF WAR AND MISSING PERSONNEL AFFAIRS (POW/MPA) PROGRAMS
PRISONER OF WAR AND MISSING PERSONNEL AFFAIRS (POW/MPA) PROGRAMS
The Department of Defense supports a multifaceted effort to recover and account for missing personnel from previous and current military operations. Policy control and oversight is provided by the DPMO within the Secretary of Defense’s office. Research, field investigations, and recovery efforts are directed by the JPAC, under the Commander, Pacific Command, and funded through the Navy. Assistance in providing identification of remains is provided by the AFDIL, managed by the Army, and the LSEL, funded by the Air Force.
This exhibit is a summary of POW/MPA programs contained in the following component budgets:
• Operation and Maintenance, Defense-Wide (OMDW), Budget Activity 4, funds DPMO’s mission that includes the Vietnam War, World War II, the Korean War, and the Cold War. Specifically, funding will be used for personnel, office space, travel, computers, and technology refreshes and support.
• Operation and Maintenance, Navy (OMN), Budget Activity 1, Combatant Commander’s Direct Mission Support (includes JPAC). Specifically, funding will be used to conduct worldwide operations to investigate, recover, and identify remains.
• Operation and Maintenance, Army (OMA), Budget Activity 4, Other Personnel Support (AFDIL). Specifically, funding will be used for DNA sample testing and related personnel and equipment replacement costs.
• Operation and Maintenance, Air Force (OMAF), Budget Activity 4, Logistics Operations (includes LSEL). Specifically, funding will be used for scientific analysis of aircraft and military life support equipment in support of aircraft mishaps and National Accountability Mission operations.
This exhibit complies with Section 563 of the John Warner National Defense Authorization Act for Fiscal Year 2007, Annual Budget Display of Funds for POW/MIA Activities of the Department of Defense, as codified in Section 234 of Chapter 9 of Title 10 of the United States Code.
167

CIVILIAN PERSONNEL
CIVILIAN PERSONNEL
Full-Time Equivalent
By Department/Defense-Wide FY 2013 Actuals Change
FY 2014 Enacted Change
FY 2015 Estimate
Army /1 255,956 7,195 263,151 -5,135 258,016 Navy 207,869 4,929 212,798 2,216 215,014 Air Force 179,842 392 180,234 -3,282 176,952 Defense-Wide 129,074 5,619 134,693 -3,165 131,528 DoD Total 772,741 18,135 790,876 -9,366 781,510 By Type of Hire U.S. Direct Hire 726,029 16,304 742,333 -8,570 733,763 Foreign National Direct Hire 12,302 724 13,026 2,302 15,328 Total – Direct Hire 738,331 17,028 755,359 -6,268 749,091 Foreign National Indirect Hire 34,410 1,107 35,517 -3,098 32,419 DoD Total 772,741 18,135 790,876 -9,366 781,510 By Appropriation Categories Operation and Maintenance, Active & Defense-Wide
459,186 13,047 472,233 -2,618 469,615
Operation and Maintenance, Reserve 23,695 2,413 26,108 -623 25,485 Operation and Maintenance, National Guard 50,519 2,235 52,754 39 52,793 Research, Development, Test, and Evaluation 34,919 -1,721 33,198 -662 32,536 Military Construction 7,272 -1,633 5,639 208 5,847 Family Housing 1,183 169 1,352 -5 1,347 Defense Working Capital Funds 185,734 4,183 189,917 -4,430 185,487 Defense Health Program 5,483 446 5,929 -50 5,879 Defense Acquisition Workforce Development Fund
4,498 -1,219 3,279 -1,025 2,254
Joint Improvised Explosive Device Defeat Fund 239 215 454 -200 254 Foreign Military Assistance 13 0 13 0 13 DoD Total 772,741 18,135 790,876 -9,366 781,510 /1 Excludes Cemeterial Expenses
168

CIVILIAN PERSONNEL
CIVILIAN PERSONNEL
Full-Time Equivalent
ARMY
Direct Hires by Appropriation FY 2013 Actuals Change
FY 2014 Enacted Change
FY 2015 Estimate
Operation and Maintenance, Army U. S. Direct Hire 147,606 6,094 153,700 -2,017 151,683 Foreign National Direct Hire 6,082 505 6,587 -71 6,516 Total Direct Hire 153,688 6,599 160,287 -2,088 158,199 Operation and Maintenance, Army Reserve U. S. Direct Hire 9,490 2,391 11,881 -489 11,392 Foreign National Direct Hire 0 0 0 0 0 Total Direct Hire 9,490 2,391 11,881 -489 11,392 Operation and Maintenance, Army National Guard U. S. Direct Hire 26,508 2,855 29,363 -28 29,335 Foreign National Direct Hire 0 0 0 0 0 Total Direct Hire 26,508 2,855 29,363 -28 29,335 Research, Development, Test & Evaluation, Army U. S. Direct Hire 20,101 -2,396 17,705 -577 17,128 Foreign National Direct Hire 1 135 136 0 136 Total Direct Hire 20,102 -2,261 17,841 -577 17,264 Military Construction, Army U. S. Direct Hire 6,794 -1,665 5,129 154 5,283 Foreign National Direct Hire 255 -4 251 57 308 Total Direct Hire 7,049 -1,669 5,380 211 5,591
169
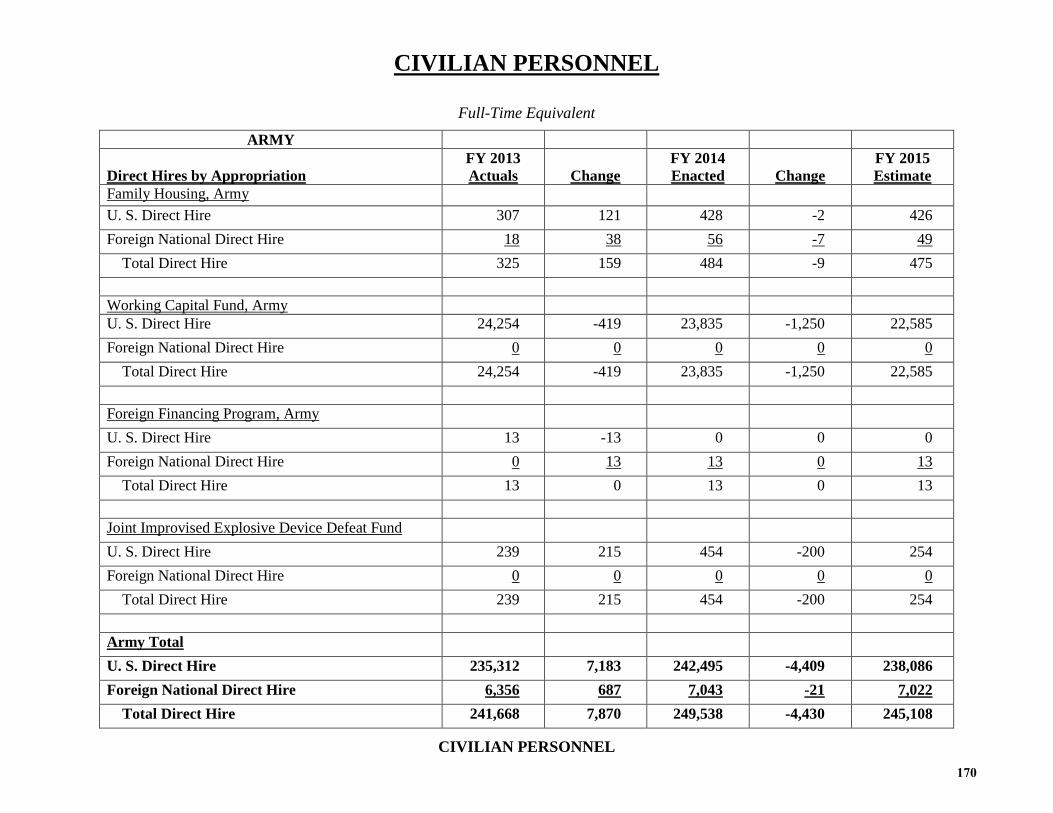
CIVILIAN PERSONNEL
CIVILIAN PERSONNEL
Full-Time Equivalent
ARMY
Direct Hires by Appropriation FY 2013 Actuals Change
FY 2014 Enacted Change
FY 2015 Estimate
Family Housing, Army U. S. Direct Hire 307 121 428 -2 426 Foreign National Direct Hire 18 38 56 -7 49 Total Direct Hire 325 159 484 -9 475 Working Capital Fund, Army U. S. Direct Hire 24,254 -419 23,835 -1,250 22,585 Foreign National Direct Hire 0 0 0 0 0 Total Direct Hire 24,254 -419 23,835 -1,250 22,585 Foreign Financing Program, Army U. S. Direct Hire 13 -13 0 0 0 Foreign National Direct Hire 0 13 13 0 13 Total Direct Hire 13 0 13 0 13 Joint Improvised Explosive Device Defeat Fund U. S. Direct Hire 239 215 454 -200 254 Foreign National Direct Hire 0 0 0 0 0 Total Direct Hire 239 215 454 -200 254 Army Total U. S. Direct Hire 235,312 7,183 242,495 -4,409 238,086 Foreign National Direct Hire 6,356 687 7,043 -21 7,022 Total Direct Hire 241,668 7,870 249,538 -4,430 245,108
170
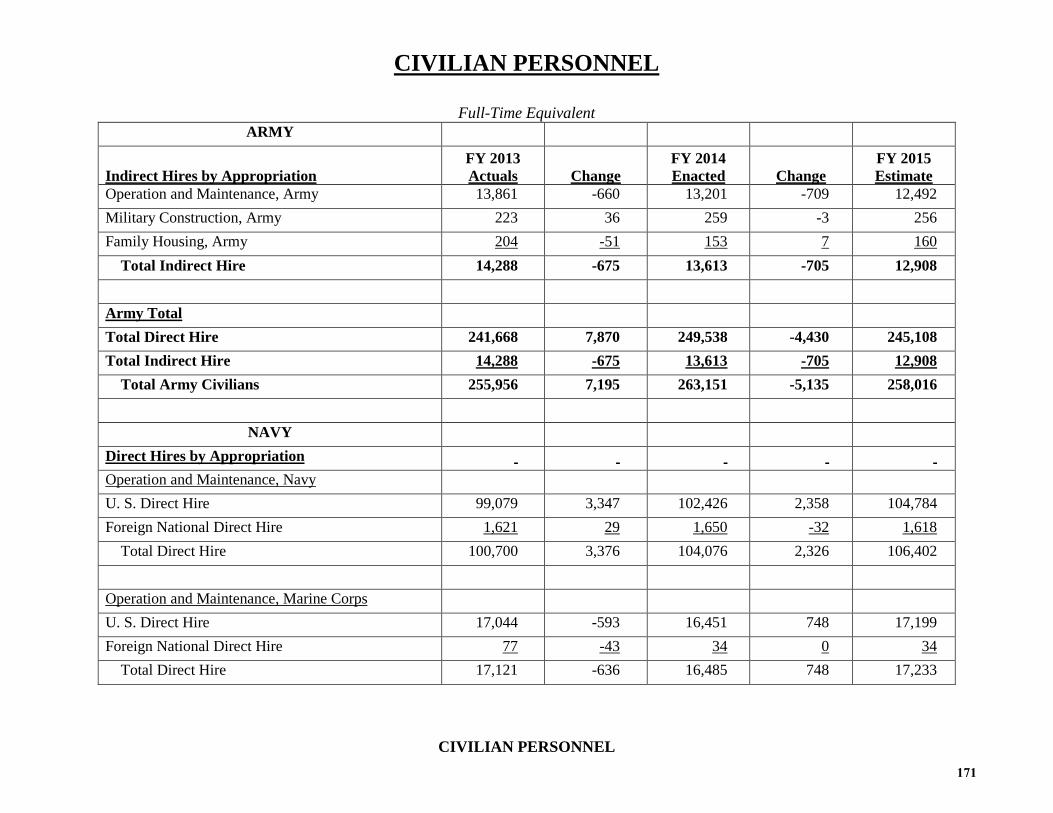
CIVILIAN PERSONNEL
CIVILIAN PERSONNEL
Full-Time Equivalent
ARMY
Indirect Hires by Appropriation FY 2013 Actuals Change
FY 2014 Enacted Change
FY 2015 Estimate
Operation and Maintenance, Army 13,861 -660 13,201 -709 12,492 Military Construction, Army 223 36 259 -3 256 Family Housing, Army 204 -51 153 7 160 Total Indirect Hire 14,288 -675 13,613 -705 12,908
Army Total Total Direct Hire 241,668 7,870 249,538 -4,430 245,108 Total Indirect Hire 14,288 -675 13,613 -705 12,908 Total Army Civilians 255,956 7,195 263,151 -5,135 258,016
NAVY
Direct Hires by Appropriation Operation and Maintenance, Navy U. S. Direct Hire 99,079 3,347 102,426 2,358 104,784 Foreign National Direct Hire 1,621 29 1,650 -32 1,618 Total Direct Hire 100,700 3,376 104,076 2,326 106,402
Operation and Maintenance, Marine Corps U. S. Direct Hire 17,044 -593 16,451 748 17,199 Foreign National Direct Hire 77 -43 34 0 34 Total Direct Hire 17,121 -636 16,485 748 17,233
171
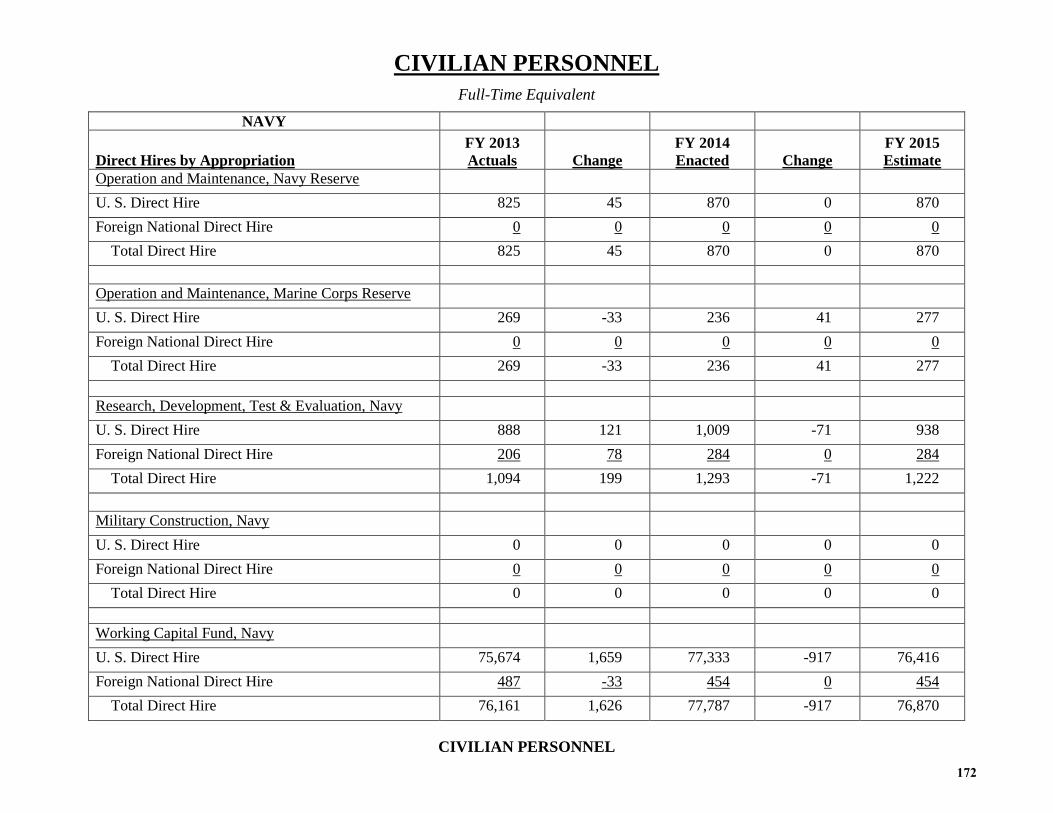
CIVILIAN PERSONNEL
CIVILIAN PERSONNEL
Full-Time Equivalent
NAVY
Direct Hires by Appropriation FY 2013 Actuals Change
FY 2014 Enacted Change
FY 2015 Estimate
Operation and Maintenance, Navy Reserve U. S. Direct Hire 825 45 870 0 870 Foreign National Direct Hire 0 0 0 0 0 Total Direct Hire 825 45 870 0 870 Operation and Maintenance, Marine Corps Reserve U. S. Direct Hire 269 -33 236 41 277 Foreign National Direct Hire 0 0 0 0 0 Total Direct Hire 269 -33 236 41 277 Research, Development, Test & Evaluation, Navy U. S. Direct Hire 888 121 1,009 -71 938 Foreign National Direct Hire 206 78 284 0 284 Total Direct Hire 1,094 199 1,293 -71 1,222 Military Construction, Navy U. S. Direct Hire 0 0 0 0 0 Foreign National Direct Hire 0 0 0 0 0 Total Direct Hire 0 0 0 0 0 Working Capital Fund, Navy U. S. Direct Hire 75,674 1,659 77,333 -917 76,416 Foreign National Direct Hire 487 -33 454 0 454 Total Direct Hire 76,161 1,626 77,787 -917 76,870
172

CIVILIAN PERSONNEL
CIVILIAN PERSONNEL
Full-Time Equivalent
NAVY
Direct Hires by Appropriation FY 2013 Actuals Change
FY 2014 Enacted Change
FY 2015 Estimate
Family Housing, Navy U. S. Direct Hire 440 50 490 -4 486 Foreign National Direct Hire 100 2 102 0 102 Total Direct Hire 540 52 592 -4 588 Foreign Military Financing, Navy U. S. Direct Hire 0 0 0 0 0 Foreign National Direct Hire 0 0 0 0 0 Total Direct Hire 0 0 0 0 0 Navy Total U. S. Direct Hire 176,906 5,222 182,128 1,366 183,494 Foreign National Direct Hire 2,414 76 2,490 -32 2,458 Total Direct Hire 179,320 5,298 184,618 1,334 185,952 Marine Corps Total U. S. Direct Hire 17,313 -626 16,687 789 17,476 Foreign National Direct Hire 77 -43 34 0 34 Total Direct Hire 17,390 -669 16,721 789 17,510 Department of Navy Total U. S. Direct Hire 194,219 4,596 198,815 2,155 200,970 Foreign National Direct Hire 2,491 33 2,524 -32 2,492 Total Direct Hire 196,710 4,629 201,339 2,123 203,462
173

CIVILIAN PERSONNEL
CIVILIAN PERSONNEL
Full-Time Equivalent
NAVY
Indirect Hires by Appropriation FY 2013 Actuals Change
FY 2014 Enacted Change
FY 2015 Estimate
Operation and Maintenance, Navy 5,178 126 5,304 52 5,356 Operation and Maintenance, Marine Corps 3,563 -98 3,465 40 3,505 Research, Development, Test & Evaluation, Navy 0 2 2 0 2 Working Capital Fund, Navy 2,304 261 2,565 0 2,565 Family Housing, Navy 114 9 123 1 124 Total Indirect Hire 11,159 300 11,459 93 11,552 Department of Navy Total Total Direct Hire 196,710 4,629 201,339 2,123 203,462 Total Indirect Hire 11,159 300 11,459 93 11,552 Total Navy Civilians 207,869 4,929 212,798 2,216 215,014 AIR FORCE Direct Hires by Appropriation Operation and Maintenance, Air Force U. S. Direct Hire 93,844 842 94,686 -1,987 92,699 Foreign National Direct Hire 2,096 -83 2,013 2,372 4,385 Total Direct Hire 95,940 759 96,699 385 97,084 Operation and Maintenance, Air Force Reserve U. S. Direct Hire 13,111 10 13,121 -175 12,946 Foreign National Direct Hire 0 0 0 0 0 Total Direct Hire 13,111 10 13,121 -175 12,946
174

CIVILIAN PERSONNEL
CIVILIAN PERSONNEL
Full-Time Equivalent
AIR FORCE
Direct Hires by Appropriation FY 2013 Actuals Change
FY 2014 Enacted Change
FY 2015 Estimate
Operation and Maintenance, Air National Guard U. S. Direct Hire 24,011 -620 23,391 67 23,458 Foreign National Direct Hire 0 0 0 0 0 Total Direct Hire 24,011 -620 23,391 67 23,458 Research, Development, Test & Evaluation, Air Force U. S. Direct Hire 10,363 69 10,432 -224 10,208 Foreign National Direct Hire 0 0 0 0 0 Total Direct Hire 10,363 69 10,432 -224 10,208 Working Capital Fund, Air Force U. S. Direct Hire 29,712 -1,136 28,576 -914 27,662 Foreign National Direct Hire 204 2 206 0 206 Total Direct Hire 29,916 -1,134 28,782 -914 27,868 Air Force Total U. S. Direct Hire 171,041 -835 170,206 -3,233 166,973 Foreign National Direct Hire 2,300 -81 2,219 2,372 4,591 Total Direct Hire 173,341 -916 172,425 -861 171,564
Indirect Hires by Appropriation Operation and Maintenance, Air Force 6,138 1,251 7,389 -2,421 4,968 Research, Development, Test & Evaluation, Air Force 2 0 2 0 2 Working Capital Fund, Air Force 361 57 418 0 418 Total Indirect Hire 6,501 1,308 7,809 -2,421 5,388
175
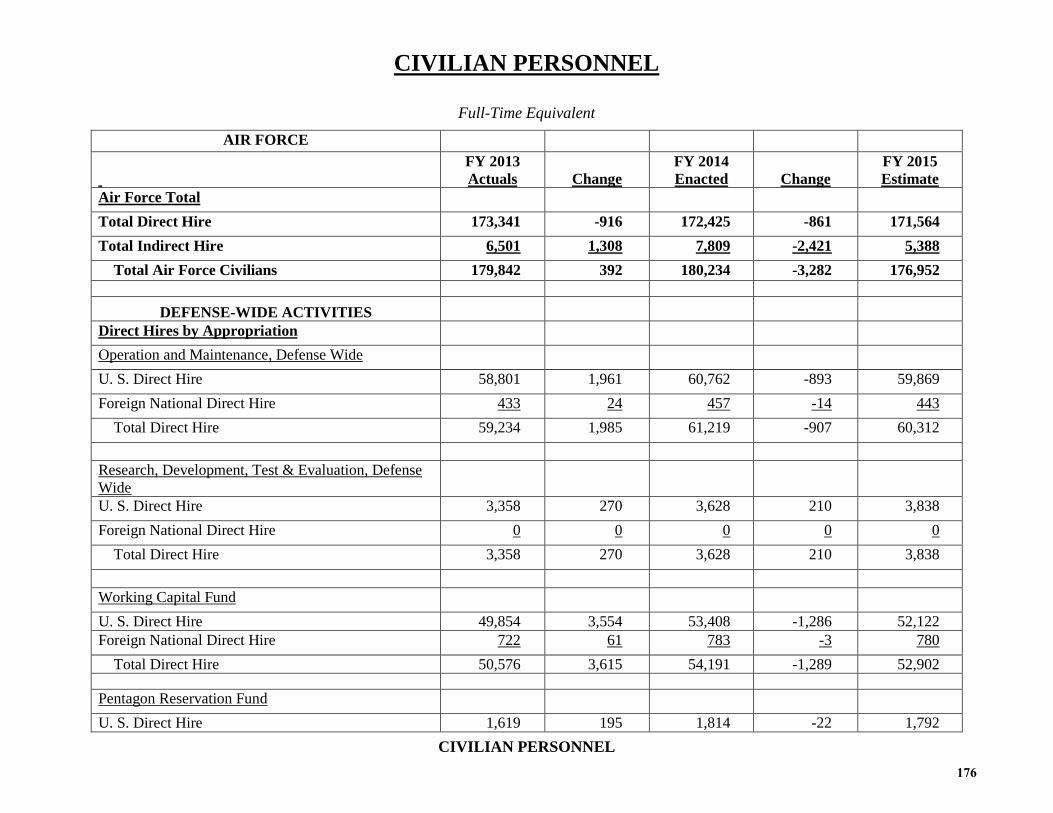
CIVILIAN PERSONNEL
CIVILIAN PERSONNEL
Full-Time Equivalent
AIR FORCE
FY 2013 Actuals Change
FY 2014 Enacted Change
FY 2015 Estimate
Air Force Total Total Direct Hire 173,341 -916 172,425 -861 171,564 Total Indirect Hire 6,501 1,308 7,809 -2,421 5,388 Total Air Force Civilians 179,842 392 180,234 -3,282 176,952
DEFENSE-WIDE ACTIVITIES Direct Hires by Appropriation Operation and Maintenance, Defense Wide U. S. Direct Hire 58,801 1,961 60,762 -893 59,869 Foreign National Direct Hire 433 24 457 -14 443 Total Direct Hire 59,234 1,985 61,219 -907 60,312 Research, Development, Test & Evaluation, Defense Wide
U. S. Direct Hire 3,358 270 3,628 210 3,838 Foreign National Direct Hire 0 0 0 0 0 Total Direct Hire 3,358 270 3,628 210 3,838
Working Capital Fund U. S. Direct Hire 49,854 3,554 53,408 -1,286 52,122 Foreign National Direct Hire 722 61 783 -3 780 Total Direct Hire 50,576 3,615 54,191 -1,289 52,902 Pentagon Reservation Fund U. S. Direct Hire 1,619 195 1,814 -22 1,792
176

CIVILIAN PERSONNEL
CIVILIAN PERSONNEL
Full-Time Equivalent
Direct Hires by Appropriation FY 2013 Actuals Change
FY 2014 Enacted Change
FY 2015 Estimate
National Defense Stockpile U. S. Direct Hire 68 20 88 -9 79
Building Maintenance Fund U. S. Direct Hire 177 52 229 5 234
Defense Health Program U. S. Direct Hire 5,478 446 5,924 -50 5,874
U. S. Court of Appeals for the Armed Forces U. S. Direct Hire 50 9 59 0 59
Office of the Inspector General U. S. Direct Hire 1,554 72 1,626 -13 1,613 Foreign National Direct Hire 0 0 0 0 0 Total Direct Hire 1,554 72 1,626 -13 1,613 Office of the Inspector General (RA) U. S. Direct Hire 0 0 0 0 0 Foreign Military Sales U. S. Direct Hire 0 0 0 0 0 Defense Acquisition Workforce Development Fund U. S. Direct Hire 4,498 -1,219 3,279 -1,025 2,254
177

CIVILIAN PERSONNEL
CIVILIAN PERSONNEL
Full-Time Equivalent
DEFENSE-WIDE ACTIVITIES
Defense-Wide Activities Total FY 2013 Actuals Change
FY 2014 Enacted Change
FY 2015 Estimate
U. S. Direct Hire 125,457 5,360 130,817 -3,083 127,734 Foreign National Direct Hire 1,155 85 1,240 -17 1,223 Total Direct Hire 126,612 5,445 132,057 -3,100 128,957
Indirect Hires by Appropriation Operation and Maintenance, Defense-Wide 294 -3 291 -5 286 Office of the Inspector General 1 0 1 0 1 Defense Health Program 5 0 5 0 5 Working Capital Fund 2,162 177 2,339 -60 2,279 Total Indirect Hire 2,462 174 2,636 -65 2,571
Defense Wide Activities Total Total Direct Hire 126,612 5,445 132,057 -3,100 128,957 Total Indirect Hire 2,462 174 2,636 -65 2,571 Total Defense-Wide Civilians 129,074 5,619 134,693 -3,165 131,528
178

ACTIVE FORCE MILITARY PERSONNEL
ACTIVE FORCE MILITARY PERSONNEL
Active Force Personnel End Strength
FY 2013/1,2 Actual Change
FY 2014/2,3 Estimate Change
FY 2015/4 Estimate
DoD Total by Type 1,382,345 -37,070 1,345,275 -36,675 1,308,600 Officer 238,152 -3,781 234,371 -8,783 225,588 Enlisted 1,131,325 -33,387 1,097,938 -27,719 1,070,219 Cadets 12,868 98 12,966 -173 12,793 DoD Total by Service 1,382,345 -37,070 1,345,275 -36,675 1,308,600 Army 532,043 -21,643 510,400 -20,400 490,000 Navy 323,951 -49 323,902 -302 323,600 Marine Corps 195,657 -6,857 188,800 -4,700 184,100 Air Force 330,694 -8,521 322,173 -11,273 310,900 1 Includes end strength funded from the Department of Defense Appropriations Act, 2013 (P.L. 113-6) 2 Reserve Component members called to active duty are excluded in the active force end strength, but are included in the average strength figures 3 FY 2014 column reflects the projected end strength levels, which includes 20,400 Army and 6,700 Marine Corps end strength funded in the FY 2014 OCO request 4 Includes 1,400 Marine Corps non-enduring end strength anticipated to be requested in the FY 2015 OCO request
179

ACTIVE FORCE MILITARY PERSONNEL
ACTIVE FORCE MILITARY PERSONNEL
End Strength
FY 2013/1,2 FY 2014/2,3 FY 2015/4 End Strength by Service Actual Change Estimate Change Estimate
Army 532,043 -21,643 510,400 -20,400 490,000
Officer 98,634 -1,826 96,808 -5,467 91,341
Enlisted 428,923 -19,843 409,080 -14,933 394,147
Cadets 4,486 26 4,512 0 4,512
Navy 323,951 -49 323,902 -302 323,600
Officer 53,580 422 54,002 -691 53,311
Enlisted 265,901 -455 265,446 562 266,008
Cadets 4,470 -16 4,454 -173 4,281
Marine Corps 195,657 -6,857 188,800 -4,700 184,100
Officer 21,132 -455 20,677 -43 20,634
Enlisted 174,525 -6,402 168,123 -4,657 163,466
Air Force 330,694 -8,521 322,173 -11,273 310,900
Officer 64,806 -1,922 62,884 -2,582 60,302
Enlisted 261,976 -6,687 255,289 -8,691 246,598
Cadets 3,912 88 4,000 0 4,000
180

ACTIVE FORCE MILITARY PERSONNEL
ACTIVE FORCE MILITARY PERSONNEL
End Strength
FY 2013/1,2 FY 2014/2,3 FY 2015/4 End Strength by Service Actual Change Estimate Change Estimate
DoD Total 1,382,345 -37,070 1,345,275 -36,675 1,308,600
Officer 238,152 -3,781 234,371 -8,783 225,588
Enlisted 1,131,325 -33,387 1,097,938 -27,719 1,070,219
Cadets 12,868 98 12,966 -173 12,793
1 Includes end strength funded from the Department of Defense Appropriations Act, 2013 (P.L. 113-6) 2 Reserve Component members called to active duty are excluded in the active force end strength, but are included in the average strength figures 3 FY 2014 column reflects the projected end strength levels, which includes 20,400 Army and 6,700 Marine Corps end strength funded in the FY 2014 OCO request 4 Includes 1,400 Marine Corps non-enduring end strength anticipated to be requested in the FY 2015 OCO request
181

ACTIVE FORCE MILITARY PERSONNEL
ACTIVE FORCE MILITARY PERSONNEL
Average Strength
FY 2013/1 FY 2014/2 FY 2015/3 Average Strength by Service Actual Change Estimate Change Estimate
Army 584,426 -35,984 548,442 -44,092 504,350
Officer 108,090 -3,753 104,337 -8,478 95,859
Enlisted 471,929 -32,175 439,754 -35,649 404,105
Cadets 4,407 -56 4,351 35 4,386
Navy 325,268 2,620 327,888 -3,856 324,032
Officer 54,715 507 55,222 -914 54,308
Enlisted 266,202 2,146 268,348 -2,903 265,445
Cadets 4,351 -33 4,318 -39 4,279
Marine Corps 195,689 -1,132 194,557 -9,046 185,511
Officer 21,840 35 21,875 -667 21,208
Enlisted 173,849 -1,167 172,682 -8,379 164,303
Air Force 343,459 -1,806 341,653 -23,082 318,571
Officer 67,112 353 67,465 -4,661 62,804
Enlisted 272,486 -2,131 270,355 -18,503 251,852
Cadets 3,861 -28 3,833 82 3,915
182

ACTIVE FORCE MILITARY PERSONNEL
ACTIVE FORCE MILITARY PERSONNEL
Average Strength
FY 2013/1 FY 2014/2 FY 2015/3 Average Strength by Service Actual Change Estimate Change Estimate
DoD Total 1,448,842 -36,302 1,412,540 -80,076 1,332,464
Officer 251,757 -2,858 248,899 -14,720 234,179
Enlisted 1,184,466 -33,327 1,151,139 -65,434 1,085,705
Cadets 12,619 -117 12,502 78 12,580
1 Includes average strength associated with reserve mobilization and active duty overstrength funded from the Department of Defense Appropriations Act, 2013 (P.L. 113-6) 2 Includes average strength for reserve mobilization and 30,755 Army and 9,787 Marine Corps active duty non-enduring strength funded in the FY 2014 OCO request 3 Includes 12,412 Army and 3,469 Marine Corps active duty non-enduring strength but excludes average strength for reserve mobilization anticipated to be requested in the FY 2015 OCO request
183

U.S. SPECIAL OPERATIONS COMMAND (USSOCOM) SUPPORT PERSONNEL
USSOCOM SUPPORT PERSONNEL
Military End Strength/Civilian FTEs
FY 2013 Actual Change
FY 2014 Estimate Change
FY 2015 Estimate
Army (Active, Reserve, Guard)/1 32,404 1,696 34,100 -15 34,085 Officer 5,977 213 6,190 34 6,224 Enlisted 26,427 1,483 27,910 -49 27,861 Navy (Active and Reserve)/1 9,472 384 9,856 -8 9,848 Officer 1,713 15 1,728 -2 1,726 Enlisted 7,759 369 8,128 -6 8,122 Marine Corps (Active and Reserve)/1 2,981 200 3,181 -192 2,989 Officer 508 8 516 -6 510 Enlisted 2,473 192 2,665 -186 2,479 Air Force (Active, Reserve, Guard)/1 15,274 407 15,681 538 16,219 Officer 3,486 108 3,594 -59 3,535 Enlisted 11,788 299 12,087 597 12,684 Total - Military (Active, Reserve, Guard) 60,131 2,687 62,818 323 63,141 Officer 11,684 344 12,028 -33 11,995 Enlisted 48,447 2,343 50,790 356 51,146 Civilian FTEs 6,195 313 6,508 40 6,548 DoD Total 66,326 3,000 69,326 363 69,689 1 Included in Active and Reserve Force Military Personnel totals
184

SELECTED RESERVE, NATIONAL GUARD, AND RESERVE SUPPORT PERSONNEL
SELECTED RESERVE, NATIONAL GUARD, AND RESERVE SUPPORT PERSONNEL
(Military End Strength/Civilian Full-Time Equivalents)
FY 2013 Actuals Change
FY 2014 Estimate Change
FY 2015 Estimate
Total Selected Reserve 834,651 -3,951 830,700 -9,900 820,800 Trained in Units 690,756 -3,674 687,082 -7,435 679,647 Individual Mobilization Augmentees (IMAs) 13,389 +2,188 15,577 +546 16,123 Training Pipeline 53,266 -3,611 49,655 -2,039 47,616 Full-time Duty 77,240 +1,146 78,386 -972 77,414
Active Military Support to Reserves 6,707 -409 6,298 -8 6,290 Civilian FTEs For Reserves/National Guard 74,214 +4,648 78,862 -584 78,278 (Technicians Included Above) 63,802 +4,804 68,606 -714 67,892 Selected Reserve By Service 834,651 -3,951 830,700 -9,900 820,800 Army Reserve 198,209 +3,791 202,000 -- 202,000 Navy Reserve 62,444 -3,344 59,100 -1,800 57,300 Marine Corps Reserve 39,642 -42 39,600 -400 39,200 Air Force Reserve 70,913 -513 70,400 -3,300 67,100 Army National Guard 357,735 -3,535 354,200 -4,000 350,200 Air National Guard 105,708 -308 105,400 -400 105,000
185

SELECTED RESERVE, NATIONAL GUARD, AND RESERVE SUPPORT PERSONNEL
SELECTED RESERVE, NATIONAL GUARD, AND RESERVE SUPPORT PERSONNEL
(Military End Strength/Civilian Full-Time Equivalents)
FY 2013 Actuals Change
FY 2014 Estimate Change
FY 2015 Estimate
Army Reserve (AR) 198,209 +3,791 202,000 -- 202,000 Trained in Units 168,984 +4,325 173,309 -961 172,348 Individual Mobilization Augmentees (IMAs) 2,797 +1,203 4,000 -- 4,000 Training Pipeline 10,056 -1,626 8,430 +961 9,391 Full-time Duty 16,372 -111 16,261 -- 16,261 Active Military Support to AR 68 -- 68 -2 66 Civilian FTE for AR 9,490 +2,391 11,881 -489 11,392 (Technicians Included Above) 6,632 +2,179 8,811 -492 8,319 Navy Reserve (NR) 62,444 -3,344 59,100 -1,800 57,300 Trained in Units 50,641 -3,456 47,185 -1,676 45,509 Individual Mobilization Augmentees (IMAs) 241 +21 262 -13 249 Training Pipeline 1,419 +75 1,494 +75 1,569 Full-time Duty 10,143 +16 10,159 -186 9,973 Active Military Support to NR 1,948 -351 1,597 -- 1,579 Civilian FTEs for NR 825 +45 870 -- 870 (Technicians Included Above) -- -- -- -- -- Marine Corps Reserve (MCR) 39,642 -42 39,600 -400 39,200 Trained in Units 30,697 +504 31,201 -488 30,713 Individual Mobilization Augmentees (IMAs) 3,115 -303 2,812 -17 2,795 Training Pipeline 3,586 -260 3,326 +105 3,431 Full-time Duty 2,244 +17 2,261 -- 2,261 Active Military Support to MCR 3,778 -- 3,778 -- 3,778 Civilian FTEs for MCR 269 -33 236 +41 277 (Technicians Included Above) -- -- -- -- --
186

SELECTED RESERVE, NATIONAL GUARD, AND RESERVE SUPPORT PERSONNEL
SELECTED RESERVE, NATIONAL GUARD, AND RESERVE SUPPORT PERSONNEL
(Military End Strength/Civilian Full-Time Equivalents)
FY 2013 Actuals Change
FY 2014 Estimate Change
FY 2015 Estimate
Air Force Reserve (AFR) 70,913 -513 70,400 -3,300 67,100 Trained in Units 57,524 -733 56,791 -3,795 52,996 Individual Mobilization Augmentees (IMAs) 7,236 +1,267 8,503 +576 9,079 Training Pipeline 3,340 -1,145 2,195 -- 2,195 Full-time Duty 2,813 +98 2,911 -81 2,830 Active Military Support for AFR 521 -58 463 -6 457 Civilian FTEs for AFR 13,111 +10 13,121 -175 12,946 (Technicians Included Above) 9,277 +83 9,360 -166 9,194 Army National Guard (ARNG) 357,735 -3,535 354,200 -4,000 350,200 Trained in Units 296,661 -4,958 291,703 -145 291,558 Individual Mobilization Augmentees (IMAs) -- -- -- -- -- Training Pipeline 29,963 +474 30,437 -3,180 27,257 Full-time Duty 31,111 +949 32,060 -675 31,385 Active Military Support to ARNG 184 -- 184 -- 184 Civilian FTEs for ARNG 26,508 +2,855 29,363 -28 29,335 (Technicians Included Above) 25,325 +2,885 28,210 +27 28,237 Air National Guard (ANG) 105,708 -308 105,400 -400 105,000 Trained in Units 86,249 +644 86,893 -370 86,523 Individual Mobilization Augmentees (IMAs) -- -- -- -- -- Training Pipeline 4,902 -1,129 3,773 -- 3,773 Full-time Duty 14,557 +177 14,734 -30 14,704 Active Military Support for ANG 208 -- 208 -- 208 Civilian FTEs for ANG 24,011 -620 23,391 +67 23,458 (Technicians Included Above) 22,568 -343 22,225 -83 22,142
187

MANAGEMENT HEADQUARTERS
MANAGEMENT HEADQUARTERS
MAJOR HEADQUARTERS BY SERVICE The Department of Defense initiated the management headquarters institutional reform during the FY 2015 President’s Budget development as part of the Department’s greater efficiency effort recognizing the need to consolidate duplicative efforts, reduce overhead, and achieve better alignment in support of a smaller force of the future.
The targeted savings goal of 20% of headquarters operating budgets will be realized by the end of the five year defense plan (FY 2019), with incremental savings being realized each year in the plan commencing with FY 2015. The headquarters review evaluated operational funding, military end strength, and civilian full time equivalents for the selected organizations consisting of the following major entitites: Commandant Commands, the Miltiary Services functional and departmental headquarters, the Office of the Secretary of Defense (OSD), the Joint Staff (TJS), and the Defense Agencies (DA).
This summary displays the intitial baseline for Operation and Maintenance (O&M) funding. The final comparison for the targeted savings is established as the end of the FY 2014 President’s Budget five year defense plan (FY 2018) with the end of the FY 2015 Presidnet’s Budget five year defense plan (FY 2019). Below are the tables dicpiting initial operating funding, military end strength, and civilian full time equivalents changes anticpated by the end of FY2015 for this effort:
MAJOR DEPARTMENT OF DEFENSE HEADQUARTERS ACTIVITIES OPERATION AND MAINTENANCE FUNDING
$ in Millions
FY 2013 Actual/1 FY 2014 Enacted Change FY 2015 Estimate
Army/2 1,732 2,143 -387 1,756
Navy/2 2,250 2,336 -326 2,010
Air Force/2 1,355 1,108 -159 949
Defense - Wide 3,394 3,195 -270 2,925
Total 8,732 8,783 -1,142 7,641 Numbers may not add due to rounding
1 FY 2013 included only for display purposes and is not part of the comparison. Review began during the FY 2015 budget development process. 2 Commantant Commanders and National Guard Bureau included with appropriate Service
188

MANAGEMENT HEADQUARTERS
MANAGEMENT HEADQUARTERS
MAJOR DEPARTMENT OF DEFENSE HEADQUARTERS ACTIVITIES OPERATION AND MAINTENANCE
Military End Strength
FY 2013 Actual/1 FY 2014 Enacted Change FY 2015 Estimate
Army/2 5,680 4,901 -30 4,871
Navy/2 4,615 4,660 308 4,592
Air Force/2 9,557 9,338 -1,455 7,883
Defense - Wide 3,653 3,705 -201 3,504 Total 23,505 22,604 -1,754 20,850
Numbers may not add due to rounding
Civilian Full-time Equivalent (FTE) FY 2013 Actual/1 FY 2014 Enacted Change FY 2015 Estimate
Army/2 10,940 12,122 -42 12,080
Navy/2 9,148 9,883 -169 9,714
Air Force/2 8,341 8,944 -1,044 7,900
Defense - Wide 7,559 7,559 -429 7,130
Total 35,988 38,508 -1,684 36,824 Numbers may not add due to rounding
1 FY 2013 included only for display purposes and is not part of the comparison. Review began during the FY 2015 budget development process. 2 Commantant Commanders and National Guard Bureau included with appropriate Service
189

DoD CUSTOMER FUEL PRICES
DoD CUSTOMER FUEL PRICES
The Department of Defense (DoD) procures an array of refined fuel products. The fuel standard selling prices identified in the following table include the cost of crude oil, refined products, inventory control, transportation, storage, and operating costs.
The DoD makes refined fuel purchases in a two-step process involving both the Defense Logistics Agency (DLA) and the individual Service or Agency customers. DLA Energy operating under the Defense Working Capital Fund (DWCF) purchases the fuel and subsequently sells it primarily to DoD customers. This allows the DoD to take advantage of large quantity purchase pricing and in most years provides the DoD customer a stabilized standard fuel price per gallon during that fiscal year.
During FY 2013, DLA Energy sold fuel at the price specified in the FY 2013 budget. However, DLA Energy paid more than expected to acquire fuel from commercial whole sellers. DLA Energy lost over $1 billion but managed operations so that the Department was able to address the loss with reprogrammings instead of disruptive price increases.
Although there was no price change, the Department experienced higher than expected fuel costs. Volatility in the crude oil market and refined product cost impacted the Department’s cash. During FY 2013 the Department lost $10.99 per barrel. The shortfall was addressed through reprogramming actions totaling $1.4 billion into the Defense Wide cash. On October 1, 2013 the Department implemented the President’s Budget 2014 price of $152.04/bbl. DoD customer appropriations are funded for this price per barrel. The FY 2015 budget submission assumes a standard composite fuel selling price of $155.40 per barrel. DoD customer appropriations are funded for this price per barrel.
The following table reflects the composite fuel price for FY 2013 and FY 2014, and the stabilized prices by fuel product DoD customers are budgeted to pay for fuel in FY 2015.
(Rates in U.S. Dollars) FY 2013 FY 2014 FY 2015 Product Type Gallon Barrel Gallon Barrel Gallon Barrel AVGAS (CONUS) – 130 $4.26 $178.92 $4.13 $173.46 $ 4.22 $177.24 AVGAS (OCONUS) – LL $16.70 $701.40 $16.21 $680.82 $16.56 $695.52 Diesel Fuel:
Distillates – F76 $3.72 $156.24 $3.61 $151.62 $3.69 $154.98 High Sulfur – DF1 $3.73 $156.66 $3.62 $152.04 $3.70 $155.40 Generic (High Sulfur) – DF2 $3.35 $140.70 $3.25 $136.50 $3.32 $139.44 Ultra Low Sulfur – DS1 $3.73 $156.66 $3.62 $152.04 $3.77 $158.34 Ultra Low Sulfur – DS2 $3.60 $151.20 $3.49 $146.58 $3.57 $149.94
190

DoD CUSTOMER FUEL PRICES
DoD CUSTOMER FUEL PRICES
(Rates in U.S. Dollars) FY 2013 FY 2014 FY 2015 Product Type Gallon Barrel Gallon Barrel Gallon Barrel
Burner Grade – FS1 $3.64 $152.88 $3.53 $148.26 $3.61 $151.62 Burner Grade – FS2 $3.20 $134.40 $3.11 $130.62 $3.18 $133.56 Biodiesel – BDI $3.60 $151.20 $3.49 $146.58 $3.57 $149.94
Jet Fuel: JP8 & JA1 $3.73 $156.66 $3.62 $152.04 $3.70 $155.40 JAA $3.71 $155.82 $3.60 $151.20 $3.68 $154.56 JP5 $3.75 $157.50 $3.64 $152.88 $3.73 $156.66 JTS $6.45 $270.90 $6.45 $270.90 $5.75 $241.50
Kerosene – KS1 $3.68 $154.56 $3.57 $149.94 $3.65 $153.30 Motor Gasoline:
Regular, Unleaded – MUR $3.64 $152.88 $3.53 $148.26 $3.61 $151.62 Midgrade, Unleaded – MUM $3.85 $161.70 $3.74 $157.08 $3.82 $160.44 Premium, Unleaded – MUP $4.31 $181.02 $4.18 $175.56 $4.27 $179.34 Gasohol – GUM $3.85 $161.70 $3.74 $157.08 $3.82 $160.44 Ethanol – E85 $3.64 $152.88 $3.53 $148.26 $3.61 $151.62
Residual: Burner Grade – FS4 $2.36 $99.12 $2.29 $96.18 $2.34 $98.28 Residual (Burner Grade) – FS6 $1.87 $78.54 $1.81 $76.02 $1.86 $78.12 Fuel Oil, Reclaimed – FOR $1.05 $44.10 $1.05 $44.10 $0.95 $39.90
Bunkers – Marine – MGO $3.80 $159.60 $3.69 $154.98 $3.77 $158.34 Bunkers – Intermediate Grade – 180,380 $2.80 $117.60 $2.72 $114.24 $2.78 $116.76 Intoplane – Jet Fuel – IA1, IAA, IAB, IP8 $4.26 $178.92 $4.13 $173.46 $4.22 $177.24 Local Purchase Jet Fuel – NA1, NAA $4.57 $191.94 $4.44 $186.48 $4.54 $190.68 Local Purchase Ground Fuel – NLS, NMU $3.92 $164.64 $3.80 $159.60 $3.88 $162.96 Composite Standard Price $3.73 $156.66 $3.62 $152.04 $3.70 $155.40
191

OVERSEAS COST SUMMARY
OVERSEAS COST SUMMARY
The Fiscal Year 2015 overseas cost summary identifies the amounts necessary for payment of all personnel, operations, maintenance, facilities, and support costs for all DoD overseas military units and the costs of supporting all dependents who accompany DoD personnel outside of the United States. The United States includes all 50 states, the District of Columbia, the Commonwealth of Puerto Rico, and the territories and possessions of the United States including Guam, U.S. Virgin Islands, and the Northern Mariana Islands.
Overseas costs are funded by the following appropriations: Military Personnel; Operation and Maintenance; Family Housing Operation and Maintenance; Family Housing Construction; and Military Construction to support all DoD activities located outside the United States that are being performed on a permanent basis at U.S. military bases and other locations (U.S. Embassy, U.S. Consulates, U.S. Mission, etc.). Overseas costs also include the cost of transporting personnel, material, and equipment to and from overseas locations. The overseas amounts do not include incremental costs associated with contingency operations.
Funding for DoD activities in the United States in support of overseas are excluded. For example, overseas amounts exclude the funding of depot maintenance performed in the United States on components/aircraft used by an overseas unit. Similarly, training that is conducted in the United States is excluded.
192

OVERSEAS COST SUMMARY
OVERSEAS COST SUMMARY
COUNTRY
Military
Personnel
Operation and
Maintenance
Family Housing,
Operations
Family Housing,
Construction
Military
Construction
Country
Total
Antigua 15.6 15.6 Australia 10.3 23.0 33.3 Bahrain 301.4 94.4 0.7 48.5 445.0 Belgium 107.1 101.6 7.6 24.9 241.2 Canada 6.4 0.1 6.5 Cuba 58.1 77.7 15.1 37.0 187.9 Diego Garcia 72.4 1.6 74.0 Djibouti 4.0 28.4 94.0 126.4 Egypt 26.9 17.7 0.6 45.2 France 4.1 0.6 Germany 3,236.4 2,399.3 351.1 224.0 6,210.8 Greece 36.0 17.9 0.6 23.7 78.2 Greenland 9.9 152.8 0.2 24.5 187.4 Honduras 12.6 8.2 20.8 Italy 821.3 616.9 92.5 77.3 1,608.0 Japan 2,987.6 1,762.7 264.5 118.8 366.3 5,499.9 Kuwait 7.6 13.6 21.2 Netherlands 46.8 35.5 4.5 86.8 Norway 1.0 0.1 1.1 Oman 1.2 16.8 0.1 18.1 Phillipines 7.0 7.0 Portugal 52.3 28.5 6.3 2.0 89.1 Qatar 9.4 1.9 0.9 12.2 Romania 11.1 8.4 153.3 172.8 Saudi Arabia 36.5 - 36.5 Singapore 17.5 31.2 5.8 54.5 South Korea 2,050.6 580.8 41.7 128.2 2,801.3 Spain 143.2 81.6 12.6 16.3 253.7 Turkey 100.3 152.8 9.1 262.2 United Arab Emirates 7.5 55.0 0.1 62.6 United Kingdom 697.2 530.8 46.0 80.7 1,354.7 Other* 257.8 353.6 3.0 614.4 Total 11,069.1 7,279.2 863.7 118.8 1,302.2 20,628.3
* Other includes countries with costs less than $5 million or unspecified overseas locations. Other inlcudes Albania, Algeria, Angola, Argentina, Bangladesh, Brazil, Burma (Republic of the Union of Myanmar), Cambodia, Cameroon, China, Croatia, Cyprus, Ecuador, Ethiopia, France, Georgia, Ghana, Guatemala, Hong Kong, Hungary, India, Indonesia, Ireland, Israel, Jordan, Kenya, Laos, Latvia, Libya, Madagascar, Mali, Mauritania, Mexico, Malaysia, Mongolia, Montenegro, Morocco, Nepal, Panama, Paraguay, Peru, Poland, Romania, Russia, Rwanda, Senegal, Sierra Leone, Slovenia, South Africa, Sri Lanka, Sweden, Syria, Tajikistan, Tanzania, Thailand, Timor-Leste, Tunisia, Uganda, Ukraine, Uzbekistan, Venezuela, Vietnam,Yemen, Zambia, Zimbabwe.
FY 2013 APPROPRIATIONS $ in Millions
193

OVERSEAS COST SUMMARY
OVERSEAS COST SUMMARY
COUNTRY
Military
Personnel
Operation and
Maintenance
Family Housing,
Operations
Family Housing,
Construction
Military
Construction
Country
Total
Antigua 15.7 15.7 Australia 5.8 22.8 28.6 Bahrain 225.1 99.4 0.9 45.4 370.8 Belgium 119.4 112.6 8.1 67.6 307.7 Canada 6.6 0.1 6.7 Cuba 48.9 86.5 15.0 150.4 Diego Garcia 55.2 55.2 Djibouti 28.9 29.0 57.9 Egypt 27.4 19.5 0.7 47.6 France 4.2 0.6 Germany 2,985.4 2,567.6 360.7 324.9 6,238.6 Greece 33.6 17.7 1.2 52.5 Greenland 10.2 158.8 0.2 43.9 213.1 Honduras 11.8 0.8 12.6 Italy 892.0 577.5 90.9 1,560.4 Japan 2,795.0 1,764.6 248.1 122.1 212.5 5,142.3 Kuwait 3.7 14.0 17.7 Kwajalein 63.0 Netherlands 46.1 37.2 4.8 88.1 Norway 1.0 0.1 1.1 Oman 1.2 16.8 18.0 Phillipines 2.0 2.0 Portugal 25.0 28.5 6.4 59.9 Qatar 11.7 1.9 1.2 14.8 Romania 0.5 3.4 50.0 53.9 Saudi Arabia 36.5 - 36.5 Singapore 17.7 32.4 5.8 55.9 South Korea 2,067.8 564.1 44.8 52.2 2,728.9
Spain 120.9 96.0 16.8 233.7 Turkey 102.4 143.0 7.0 252.4 United Arab Emirates 3.5 58.0 0.1 61.6 United Kingdom 709.1 553.3 40.0 87.4 1,389.8 Other* 251.5 364.4 3.1 619.0 Total 10,566.0 7,440.7 856.5 122.1 975.8 19,893.3
* Other includes countries with costs less than $5 million or unspecified overseas locations. Other inlcudes Albania, Algeria, Angola, Argentina, Bangladesh, Brazil, Burma (Republic of the Union of Myanmar), Cambodia, Cameroon, China, Croatia, Cyprus, Ecuador, Ethiopia, France, Georgia, Ghana, Guatemala, Hong Kong, Hungary, India, Indonesia, Ireland, Israel, Jordan, Kenya, Laos, Latvia, Libya, Madagascar, Mali, Mauritania, Mexico, Malaysia, Mongolia, Montenegro, Morocco, Nepal, Panama, Paraguay, Peru, Poland, Romania, Russia, Rwanda, Senegal, Sierra Leone, Slovenia, South Africa, Sri Lanka, Sweden, Syria, Tajikistan, Tanzania, Thailand, Timor-Leste, Tunisia, Uganda, Ukraine, Uzbekistan, Venezuela, Vietnam,Yemen, Zambia, Zimbabwe.
FY 2014 APPROPRIATIONS $ in Millions
194

OVERSEAS COST SUMMARY
OVERSEAS COST SUMMARY
COUNTRY
Military
Personnel
Operation and
Maintenance
Family Housing,
Operations
Family Housing,
Construction
Military
Construction
Country
Total
Antigua 19.0 19.0 Australia 6.1 23.2 9.6 38.9 Bahrain 230.1 100.3 0.8 27.8 359.0 Belgium 120.6 120.0 5.5 79.5 325.6 Canada 6.7 0.1 6.8 Cuba 50.0 85.4 13.6 100.1 249.1 Diego Garcia 56.3 56.3 Djibouti 29.4 9.9 39.3 Egypt 27.9 16.5 0.6 45.0 France 4.3 0.6 Germany 2,995.9 2,523.1 262.0 259.7 6,040.7 Greece 34.6 17.2 0.7 52.5 Greenland 10.4 158.0 0.2 168.6 Honduras 12.0 0.8 12.8 Italy 893.5 608.5 82.6 1,584.6 Japan 2,869.8 1,617.5 223.0 15.9 323.1 5,049.3 Kuwait 3.8 14.0 17.8 Netherlands 46.3 37.2 3.3 86.8 Norway 1.0 0.1 1.1 Oman 1.2 - 0.1 1.3 Phillipines 2.0 2.0 Portugal 25.2 22.1 6.4 53.7 Qatar 13.0 2.0 1.2 16.2 Romania 5.2 4.7 9.9 Saudi Arabia 37.2 - 37.2 Singapore 18.4 32.8 6.1 57.3 South Korea 2,017.9 564.8 33.0 57.8 2,673.5
Spain 125.5 96.2 15.6 20.2 257.5 Turkey 103.9 146.1 7.0 257.0 United Arab Emirates 3.5 2.1 0.1 5.7 United Kingdom 716.4 611.3 40.0 92.2 1,459.9 Other* 289.1 277.9 3.7 570.7 Total 10,671.5 7,186.5 706.2 73.7 922.2 19,555.2
* Other includes countries with costs less than $5 million or unspecified overseas locations. Other inlcudes Albania, Algeria, Angola, Argentina, Bangladesh, Brazil, Burma (Republic of the Union of Myanmar), Cambodia, Cameroon, China, Croatia, Cyprus, Ecuador, Ethiopia, France, Georgia, Ghana, Guatemala, Hong Kong, Hungary, India, Indonesia, Ireland, Israel, Jordan, Kenya, Laos, Latvia, Libya, Madagascar, Mali, Mauritania, Mexico, Malaysia, Mongolia, Montenegro, Morocco, Nepal, Panama, Paraguay, Peru, Poland, Romania, Russia, Rwanda, Senegal, Sierra Leone, Slovenia, South Africa, Sri Lanka, Sweden, Syria, Tajikistan, Tanzania, Thailand, Timor-Leste, Tunisia, Uganda, Ukraine, Uzbekistan, Venezuela, Vietnam,Yemen, Zambia, Zimbabwe.
FY 2015 APPROPRIATIONS $ in Millions
195

FOREIGN CURRENCY FLUCTUATION RATES
FOREIGN CURRENCY FLUCTUATION RATES
FOREIGN CURRENCY FLUCTUATIONS, DEFENSE The Foreign Currency Fluctuations, Defense (FCF,D) appropriation enables execution of budgeted programs despite adverse variations in foreign currency exchange rates. This centralized account is managed by the Under Secretary of Defense (Comptroller). Funds are transferred from this appropriation to DoD Components’ Operation and Maintenance and Military Personnel appropriations to offset net losses in purchasing power because of unfavorable fluctuations in the foreign currency exchange rates of specified currencies. If a net gain results, the asset is transferred from the gaining appropriation to the FCF,D appropriation to replenish the fund. Unobligated balances from the prior two years for Operation and Maintenance and Military Personnel appropriations can be transferred to the FCF,D to further replenish the fund. The specified currencies are shown below as well as the rates used to formulate the budget. The Department will use these rates to measure foreign currency fluctuation during execution. These rates are expressed in terms of units of foreign currency that can be purchased with one (1) U.S. dollar.
Foreign Currency Exchange Rates Units of Foreign Currency per One U.S. Dollar
Budget Rates President’s Budget Rates
Country Monetary Unit FY 2013 FY 2014 FY 2015 Denmark Krone 5.3956 5.4074 5.5515 European Community Euro 0.7241 0.7259 0.7452 Iceland Krona 106.8909 114.5787 122.9550 Japan Yen 82.4035 81.7098 103.9439 Norway Krone 5.9362 5.8662 5.9595 Singapore Dollar 1.3313 1.3155 1.2949 South Korea Won 1,095.1635 1,140.7859 1,167.5295 Turkey Lira 1.4508 1.6091 1.7464 United Kingdom Pound 0.5943 0.6177 0.6363
196

DEPARTMENT OF DEFENSE MORE DISCIPLINED USE OF RESOURCES
DEPARTMENT OF DEFENSE MORE DISCIPLINED USE OF RESOURCES
OVERVIEW
In continuation of the reform agenda advanced in the previous four budgets, the Department reviewed all budgetary areas for potential savings in its “More Disciplined Use of Resources” (MDUR) campaign. Strategies to realize savings include reductions tied to more effective use of funds (including better business practices); savings associated with new contracting efficiencies; reductions tied to the termination or restructuring of weapon system programs; reductions tied to manpower or force restructuring; savings from 20% headquarters reductions; reductions tied to restructuring or delay in Military Construction programs; and long-term savings associated with infrastructure consolidation. Congressional support and authority to conduct a base realignment and closure (BRAC) in 2017 is critical to achieving total projected savings associated with initiatives that are geared to meeting key needs with fewer personnel. Substantial savings are also tied to lower prices for private-sector care. The Department will continue to utilize a well-rehearsed governance structure to monitor implementation of these initiatives, with senior leadership focused on those initiatives with the highest program or milestone risk assessment. As a result of these efforts, the FY 2015 budget request reflects a $18 billion reduction to the FY 2015 program and a reduction of about $93 billion over the period of FY 2015 through FY 2019 (Future Years Defense Program (FYDP)) from the FY 2014 President’s Budget request.
Summary by Organization FY 2015 FY 2015 - FY 2019Department of Army 3,750 21,926 Department of Navy 5,344 22,096 Department of Air Force 2,722 12,912 Defense-Wide 6,410 36,334 Total DoD 18,225 93,268
Numbers may not add due to rounding.
$ Savings in Millions
197
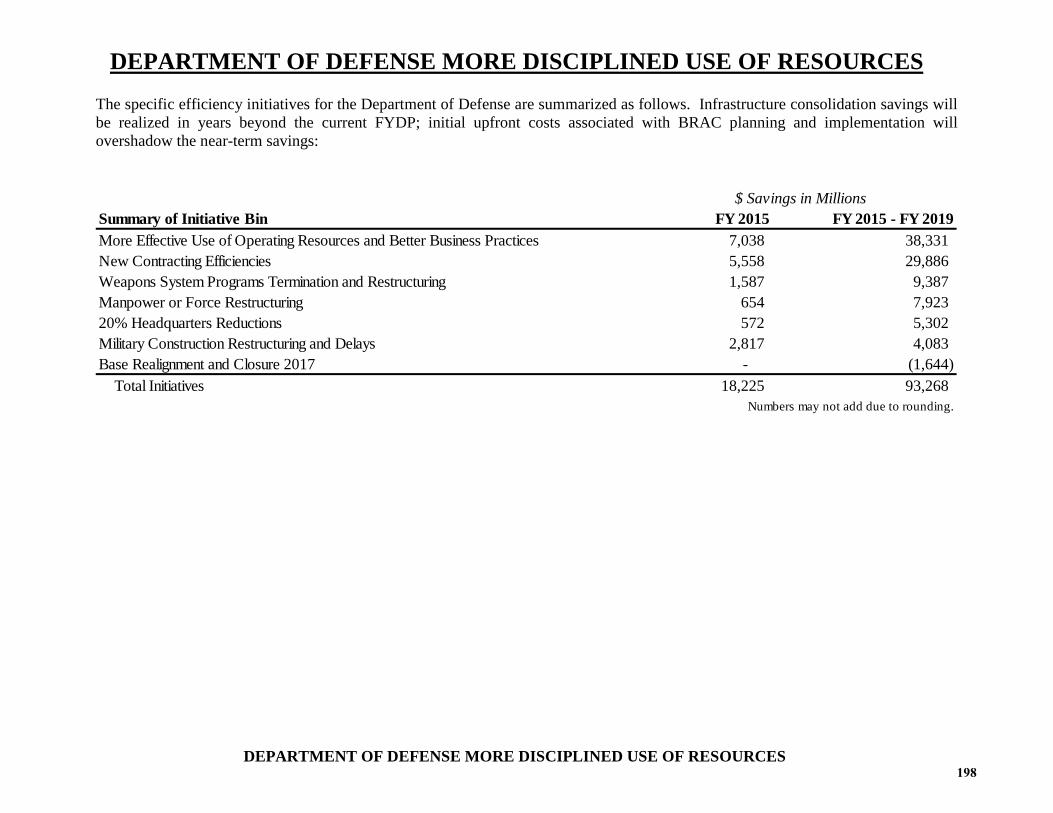
DEPARTMENT OF DEFENSE MORE DISCIPLINED USE OF RESOURCES
DEPARTMENT OF DEFENSE MORE DISCIPLINED USE OF RESOURCES
The specific efficiency initiatives for the Department of Defense are summarized as follows. Infrastructure consolidation savings will be realized in years beyond the current FYDP; initial upfront costs associated with BRAC planning and implementation will overshadow the near-term savings:
Summary of Initiative Bin FY 2015 FY 2015 - FY 2019More Effective Use of Operating Resources and Better Business Practices 7,038 38,331 New Contracting Efficiencies 5,558 29,886 Weapons System Programs Termination and Restructuring 1,587 9,387 Manpower or Force Restructuring 654 7,923 20% Headquarters Reductions 572 5,302 Military Construction Restructuring and Delays 2,817 4,083 Base Realignment and Closure 2017 - (1,644) Total Initiatives 18,225 93,268
Numbers may not add due to rounding.
$ Savings in Millions
198
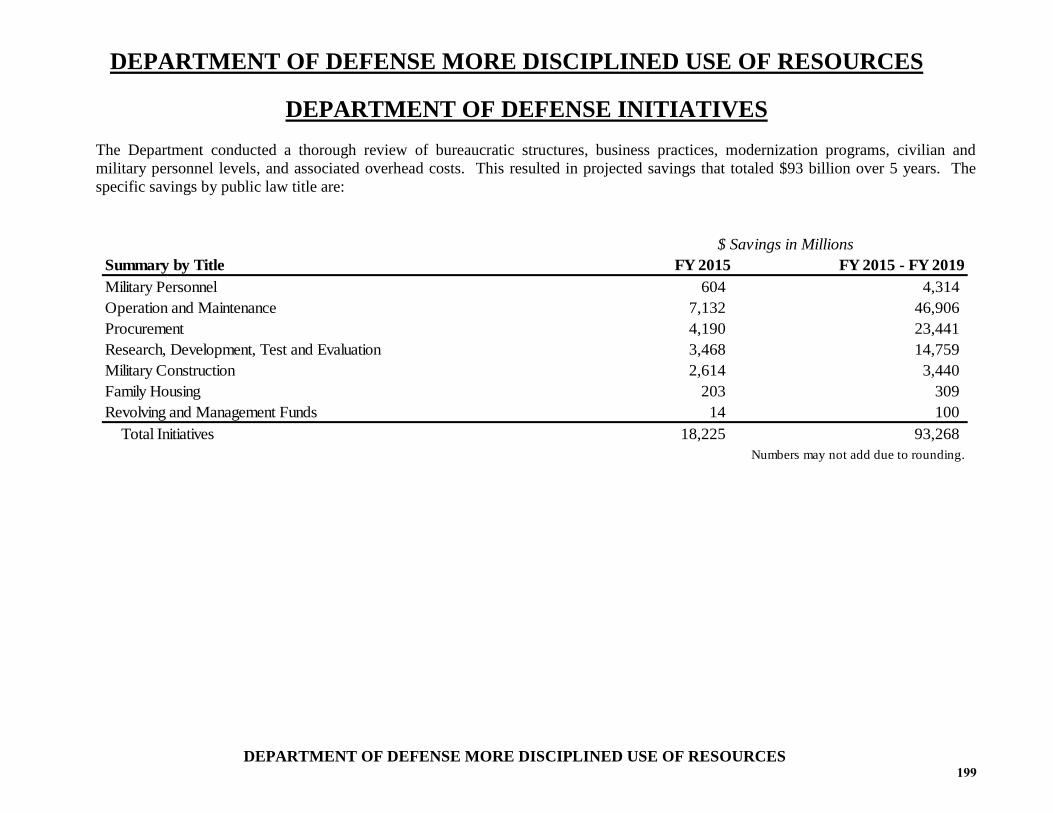
DEPARTMENT OF DEFENSE MORE DISCIPLINED USE OF RESOURCES
DEPARTMENT OF DEFENSE MORE DISCIPLINED USE OF RESOURCES
DEPARTMENT OF DEFENSE INITIATIVES The Department conducted a thorough review of bureaucratic structures, business practices, modernization programs, civilian and military personnel levels, and associated overhead costs. This resulted in projected savings that totaled $93 billion over 5 years. The specific savings by public law title are:
Summary by Title FY 2015 FY 2015 - FY 2019Military Personnel 604 4,314 Operation and Maintenance 7,132 46,906 Procurement 4,190 23,441 Research, Development, Test and Evaluation 3,468 14,759 Military Construction 2,614 3,440 Family Housing 203 309 Revolving and Management Funds 14 100 Total Initiatives 18,225 93,268
Numbers may not add due to rounding.
$ Savings in Millions
199

DEPARTMENT OF DEFENSE MORE DISCIPLINED USE OF RESOURCES
DEPARTMENT OF DEFENSE MORE DISCIPLINED USE OF RESOURCES
More Effective Use of Operating Resources and Better Business Practices (FY 2015, $-7.0 billion; FYDP, $-38.3 billion) includes cutbacks in service contracts while still meeting the most important requirements, more efficient or effective use of manpower, more efficient acquisition of goods or services and business process improvements.
• Reductions in health care cost growth as a result of decreased demand for healthcare, more rapid than expected population
declines, and cost reduction initiatives for generic drugs and pharmacy co-pays (FY 2015, $-1.9 billion; FYDP, $-10.3 billion).
• Other health care cost savings and efficiencies, including reduction in medical facility sustainment and restoration/modernization (including military construction) funding to better scope projects and savings achieved by reducing redundancy and consolidating key functional and business support areas (FY 2015, $-0.4 billion; FYDP, $-7.0 billion).
• Funding reductions across all Defense-wide agencies and field activities to promote more efficient and effective management of resources, including reducing training by promoting more web-based training solutions, reducing travel through increased use of video teleconferencing capabilities, reducing the procurement of supplies and materials, and reducing printing costs (FY 2015, $-2.8 billion; FYDP, $-15.0 billion).
• The Air Force’s reduced training and education based on force structure changes and taking risk in support areas as well as funding reductions beyond Department-wide headquarters reductions from intermediate and headquarters level (FY 2015, $-0.6 billion; FYDP, $-3.5 billion).
• Funding reductions in the Navy’s procurement and research and development programs to reflect underexecution and to promote more efficient and effective use of resources (FY 2015, $-1.3 billion; FYDP, $-2.5 billion).
New Contracting Efficiencies (FY 2015, $-5.6 billion; FYDP, $-29.9 billion) includes reductions in funding for contracts and implementation of better buying power initiatives in procurement. • Reduction in the Navy and Marine Corps funding for research and development, knowledge-based, and communication services
contracts and implementation of better buying power initiatives in procurement (FY 2015, $-3.1 billion; FYDP, $-17.8 billion).
• Savings from the Army’s reduced contract funding commensurate with reductions in force structure (FY 2015, $-1.5 billion; FYDP, $-8.4 billion).
200

DEPARTMENT OF DEFENSE MORE DISCIPLINED USE OF RESOURCES
DEPARTMENT OF DEFENSE MORE DISCIPLINED USE OF RESOURCES
• Savings from the Air Force’s reduced contract costs, largely for the Evolved Expendable Launch Vehicle Program and the KC-46 Aircrew Training System (FY 2015, $-1.0 billion; FYDP, $-3.7 billion).
Weapons System Programs Terminations and Restructuring (FY 2015, $-1.6 billion; FYDP, $-9.4 billion) include terminations where the most important capabilities can be met by other means, and restructurings or delays that still permit the DoD to meet the most important strategic needs. • The Army terminates Ground Combat Vehicles (GCV) and continues development efforts toward a future infantry fighting vehicle
(FY 2015, $-0.9 billion; FYDP, $-3.4 billion).
• The Army terminates the Warfighter Information Network – Tactical (WIN-T) Increment 3 and invests in the full requirement for the WIN-T Increment 2, which fully enables the Army’s Multi-functional Support Brigades (FY 2015, $-0.4 billion; FYDP, $-3.4 billion).
• In pursuing resiliency and affordability in Space Architectures, the Air Force divests funding for the procurement for Advanced Extremely High Frequency (AEHF) Space Vehicles (SV)-7/8. Some of the related reductions ($2.1 billion across the FYDP) are re-invested into the evolved Space Based Infrared Systems (SBIRS) and evolved strategic and tactical protected Satellite Communication (SATCOM) systems. Additionally, the Air Force defers two GPS III satellites beyond FY 2019 as Global Positioning Satellites are lasting longer than previously forecasted, with reductions of $560 million across the FYDP (FY 2015, $-0.2 billion; FYDP, $-2.7 billion).
Manpower or Force Restructuring (FY 2015, $-0.7 billion; FYDP, $-7.9 billion) includes reductions associated with civilian and military manpower while meeting critical needs. • Reduction in the Army’s civilian manpower consistent with its military end strength reduction, including managing civilian
workforce levels to retain net attrition in the prior year resulting from hiring freeze and reducing depot manpower according to reduced depot maintenance needs (FY 2015, $-0.2 billion; FYDP, $-4.9 billion).
• Reduction in the Air Force’s military manpower, including reducing C-130H excess to need aircraft to reach a C-130 aircraft inventory of 316 by FY15, changes to Mobility Air Force aerial port manpower standards, and Air Mobility Command crew ratio changes (FY 2015, $-0.4 billion; FYDP, $-3.1 billion).
201

DEPARTMENT OF DEFENSE MORE DISCIPLINED USE OF RESOURCES
DEPARTMENT OF DEFENSE MORE DISCIPLINED USE OF RESOURCES
20% Headquarters Reductions (FY 2015, $-0.6 billion; FYDP, $-5.3 billion) implements the Department's institutional reform efforts to consolidate duplicative efforts and reduce management headquarters staffs.
Military Construction Restructuring and Delays (FY 2015, $-2.8 billion; FYDP, $-4.1 billion) provides funding of the most critical facility requirements and allows for the rebalancing of resources to higher Department of Defense priorities, such as operations and readiness. The Military Construction FYDP funds the Secretary of Defense’s strategic choices/capabilities and administration priorities while considering Congressional action and fiscal constraints. The MILCON budget defers most recapitalization projects, increasing the requirement for sustainment and base operating funds, to ensure that new construction only supports enduring capabilities after infrastructure consolidations.
• The Department of Army applied a programmatic reduction to military construction programs across the FYDP in recognition of
the pending reductions in force structure, while funding the most critical needs and facility shortfalls that support operations and readiness. (FY 2015, $-0.6 billion; FYDP, $-1.3 billion).
• The Department of Navy made adjustments to multiple military construction projects, to include adjustments resulting from
changes to requirements and deferrals. For example, initial operating capability schedules for infrastructure requirements in support of major weapon systems were reevaluated and infrastructure support was aligned to just-in-time delivery where applicable (FY 2015, $-0.8 billion; FYDP, $-0.6 billion).
• The Department of Air Force adjusted new and current mission military construction projects to fund minimum essential
requirements in FY 2015. Over the FYDP, the Air Force restores some MILCON investment after taking a strategic pause in FY 2013. (FY 2015, $-0.4 billion; FYDP, $+0.6 billion).
• Defense Agency reductions primarily reflect reductions to the DoDEA military construction program. These reductions to
infrastructure investments are due to force structure changes, a slowdown in the recapitalization of DoD schools to improve execution, and increased efforts to repair instead of replace schools where more economically prudent. (FY 2015, $-0.9 billion; FYDP, $-2.9 billion). Note: Medical investments, including Medical MilCon changes, are discussed in the More Effective Use of Operating Resources section.
202

DEPARTMENT OF DEFENSE MORE DISCIPLINED USE OF RESOURCES
DEPARTMENT OF DEFENSE MORE DISCIPLINED USE OF RESOURCES
Infrastructure Consolidation (FY 2015, no impact; FYDP, $+1.6 billion) changes can only be accomplished with Base Realignment and Closure (BRAC) authority. Short-term costs are necessitated to generate long-term savings that extend beyond the current FYDP.
203

DEPARTMENT OF DEFENSE MORE DISCIPLINED USE OF RESOURCES
DEPARTMENT OF DEFENSE MORE DISCIPLINED USE OF RESOURCES
• The specific savings by Component, title and bin are: $ in Millions FY 2015 FY 2016 FY 2017 FY 2018 FY 2019 FY15-19 Department of Army Operation and Maintenance Manpower or Force Restructuring -129 -387 -767 -1,136 -1,250 -3,669 New Contracting Efficiencies -1,310 -1,334 -1,360 -1,384 -1,968 -7,356 20% Headquarters Reductions -44 -76 -115 -174 -239 -648 Total -1,483 -1,797 -2,242 -2,694 -3,457 -11,673 Procurement Manpower or Force Restructuring -7 -20 -49 -83 -93 -252 New Contracting Efficiencies -6 -5 -4 -4 -281 -300 Weapons System Programs Termination and Restructuring -1,141 -1,313 -1,397 -2,155 -374 -6,380 Total -1,154 -1,338 -1,450 -2,242 -748 -6,932 Research, Development, Test and Evaluation Manpower or Force Restructuring -73 -116 -181 -263 -303 -936 New Contracting Efficiencies -184 -188 -191 -195 -1 -759 Weapons System Programs Termination and Restructuring -212 -37 -71 -22 -8 -350 Total -469 -341 -443 -480 -312 -2,045 Military Construction Military Construction Restructuring and Delays -604 -278 50 -154 -117 -1,102 Family Housing Military Construction Restructuring and Delays -40 -104 -22 -5 -4 -174
204

DEPARTMENT OF DEFENSE MORE DISCIPLINED USE OF RESOURCES
DEPARTMENT OF DEFENSE MORE DISCIPLINED USE OF RESOURCES
$ in Millions FY 2015 FY 2016 FY 2017 FY 2018 FY 2019 FY15-19 Department of Navy Operation and Maintenance New Contracting Efficiencies -1,101 -1,153 -1,113 -1,112 -1,075 -5,554 20% Headquarters Reductions -114 -171 -236 -312 -399 -1,233 Total -1,215 -1,325 -1,349 -1,424 -1,474 -6,787 Procurement New Contracting Efficiencies -987 -1,348 -1,539 -2,056 -1,589 -7,518 More Effective Use of Operating Resources -561 -56 -123 -178 -177 -1,095 Total -1,548 -1,404 -1,662 -2,234 -1,766 -8,613 Research, Development, Test and Evaluation New Contracting Efficiencies -1,003 -1,165 -899 -876 -677 -4,621 More Effective Use of Operating Resources -759 -229 -227 -91 -89 -1,395 Total -1,762 -1,394 -1,126 -968 -766 -6,016 Military Construction Military Construction Restructuring and Delays -717 31 308 -10 -58 -446 Family Housing Military Construction Restructuring and Delays -88 -10 -12 -16 -9 -135 Revolving and Management Funds New contracting efficiencies -14 -13 -18 -19 -36 -100
205

DEPARTMENT OF DEFENSE MORE DISCIPLINED USE OF RESOURCES
DEPARTMENT OF DEFENSE MORE DISCIPLINED USE OF RESOURCES
$ in Millions FY 2015 FY 2016 FY 2017 FY 2018 FY 2019 FY15-19 Department of Air Force Military Personnel Manpower or Force Restructuring -300 -469 -480 -483 -485 -2,217 More Effective Use of Operating Resources -304 -419 -432 -477 -466 -2,097 Total -604 -889 -912 -959 -951 -4,314 Operation and Maintenance Manpower or Force Restructuring -146 -199 -186 -168 -151 -849 New contracting efficiencies -86 -51 -44 -47 -49 -277 More Effective Use of Operating Resources -266 -303 -301 -310 -240 -1,420 20% Headquarters Reductions -98 -129 -124 -101 -172 -624 Total -596 -681 -655 -625 -613 -3,170 Procurement New contracting efficiencies -742 -779 -533 -746 -380 -3,181 Weapons System Programs Termination and Restructuring -234 -448 -269 -878 -838 -2,667 Total -976 -1,227 -802 -1,624 -1,218 -5,848 Research, Development, Test and Evaluation New contracting efficiencies -125 0 0 -39 -57 -221 Weapons System Programs Termination and Restructuring 0 8 3 0 0 10 Total -125 8 3 -39 -57 -211 Military Construction Military Construction Restructuring and Delays -347 839 49 160 -72 629 Family Housing Military Construction Restructuring and Delays -75 76 0 0 0 1
206

DEPARTMENT OF DEFENSE MORE DISCIPLINED USE OF RESOURCES
DEPARTMENT OF DEFENSE MORE DISCIPLINED USE OF RESOURCES
$ in Millions FY 2015 FY 2016 FY 2017 FY 2018 FY 2019 FY15-19 Defense-Wide Operation and Maintenance More Effective Use of Operating Resources -3,524 -4,377 -4,259 -5,228 -5,090 -22,479 20% Headquarters Reductions -315 -408 -533 -695 -846 -2,798 Total -3,839 -4,786 -4,793 -5,923 -5,936 -25,276 Procurement More Effective Use of Operating Resources -512 -381 -437 -519 -199 -2,048 Research, Development, Test and Evaluation More Effective Use of Operating Resources -1,112 -1,364 -1,299 -1,359 -1,354 -6,487 Military Construction Base Realignment and Closure 2017 0 0 0 590 1,054 1,644 More Effective Use of Operating Resources 0 -11 -397 -447 -456 -1,310 Military Construction Restructuring and Delays -947 -468 -330 -542 -568 -2,856 Total -947 -479 -727 -399 30 -2,522 Grand Total -18,225 -16,857 -17,538 -21,533 -19,117 -93,268
207

DEPARTMENT OF DEFENSE MORE DISCIPLINED USE OF RESOURCES
DEPARTMENT OF DEFENSE MORE DISCIPLINED USE OF RESOURCES
• The savings by initiative within bin are: $ in Millions More Effective Use of Operating Resources FY 2015 FY 2016 FY 2017 FY 2018 FY 2019 FY15-19 Department of Navy: Funding Reduction in Aircraft Procurement, Navy to Reflect Underexecution -202 38 -11 -11 -11 -198 Funding Reduction in Other Procurement, Navy to Reflect Underexecution -359 -94 -112 -167 -166 -897 R&D Underexecution -759 -229 -227 -91 -89 -1,395 Total, Department of Navy -1,320 -285 -350 -270 -266 -2,490
Department of Air Force Reduce Training and Education -312 -354 -326 -324 -309 -1,625 Terminate Air Force Advertising -40 -41 -45 -47 -46 -219 Efficiencies Associated with Headquarters Reduction -217 -328 -362 -415 -352 -1,673 Total, Department of Air Force -570 -723 -733 -786 -707 -3,517
Defense Health Agency Defense Health Agency Shared Service -155 -306 -441 -511 -632 -2,045 Facilities Sustainment 0 0 0 -50 -70 -120 Facility Restoration & Modernization -37 -35 -69 -270 -304 -715 Initial Outfitting & Transition -14 -252 -20 -199 -367 -852 Military Construction 0 -11 -397 -447 -456 -1,310 Modernization of the MHS -92 -183 -275 -366 -366 -1,283 Efficiencies in Procurement -45 -59 -56 -60 -62 -283 Reductions in Health Care Cost Growth -1,887 -2,070 -2,052 -2,270 -2,036 -10,316 Research, Development, Test, and Evaluation (RDT&E) -73 -72 -72 -72 -71 -359 Efficiencies Associated with Headquarters Reduction 3 -1 -13 -9 -8 -28 Total, DHA -2,300 -2,988 -3,394 -4,255 -4,372 -17,309
208
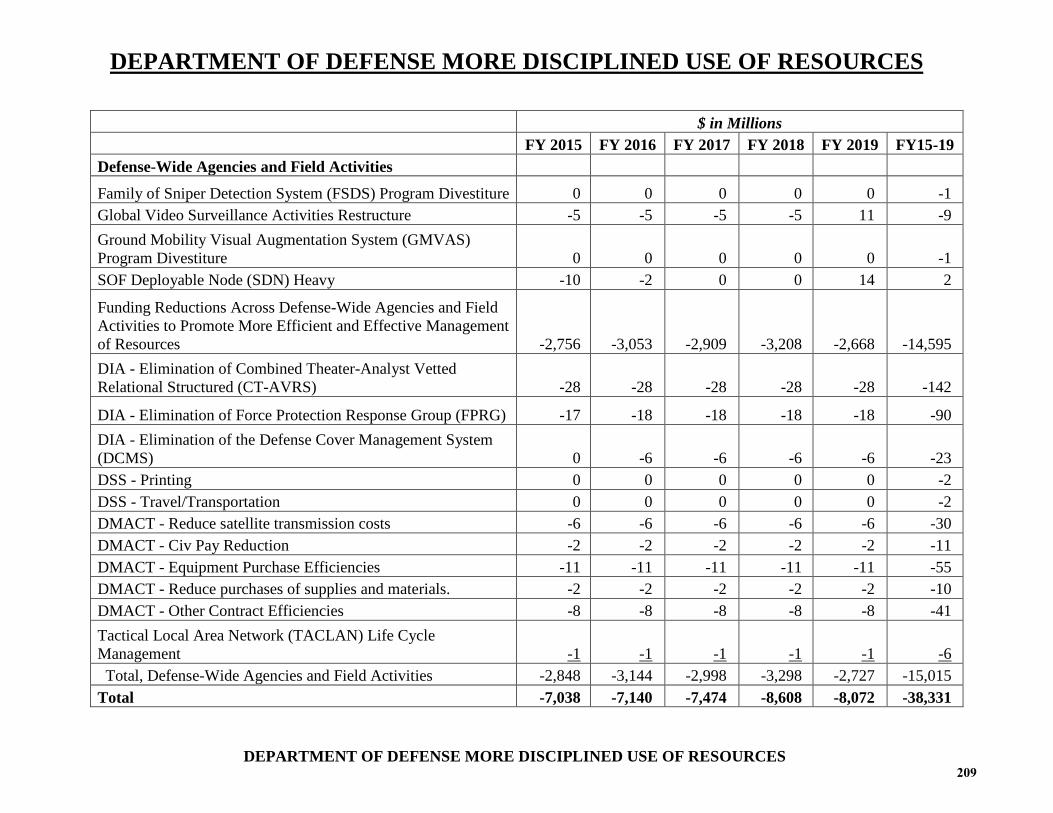
DEPARTMENT OF DEFENSE MORE DISCIPLINED USE OF RESOURCES
DEPARTMENT OF DEFENSE MORE DISCIPLINED USE OF RESOURCES
$ in Millions FY 2015 FY 2016 FY 2017 FY 2018 FY 2019 FY15-19 Defense-Wide Agencies and Field Activities
Family of Sniper Detection System (FSDS) Program Divestiture 0 0 0 0 0 -1 Global Video Surveillance Activities Restructure -5 -5 -5 -5 11 -9 Ground Mobility Visual Augmentation System (GMVAS) Program Divestiture 0 0 0 0 0 -1 SOF Deployable Node (SDN) Heavy -10 -2 0 0 14 2
Funding Reductions Across Defense-Wide Agencies and Field Activities to Promote More Efficient and Effective Management of Resources -2,756 -3,053 -2,909 -3,208 -2,668 -14,595 DIA - Elimination of Combined Theater-Analyst Vetted Relational Structured (CT-AVRS) -28 -28 -28 -28 -28 -142
DIA - Elimination of Force Protection Response Group (FPRG) -17 -18 -18 -18 -18 -90 DIA - Elimination of the Defense Cover Management System (DCMS) 0 -6 -6 -6 -6 -23 DSS - Printing 0 0 0 0 0 -2 DSS - Travel/Transportation 0 0 0 0 0 -2 DMACT - Reduce satellite transmission costs -6 -6 -6 -6 -6 -30 DMACT - Civ Pay Reduction -2 -2 -2 -2 -2 -11 DMACT - Equipment Purchase Efficiencies -11 -11 -11 -11 -11 -55 DMACT - Reduce purchases of supplies and materials. -2 -2 -2 -2 -2 -10 DMACT - Other Contract Efficiencies -8 -8 -8 -8 -8 -41 Tactical Local Area Network (TACLAN) Life Cycle Management -1 -1 -1 -1 -1 -6 Total, Defense-Wide Agencies and Field Activities -2,848 -3,144 -2,998 -3,298 -2,727 -15,015 Total -7,038 -7,140 -7,474 -8,608 -8,072 -38,331
209

DEPARTMENT OF DEFENSE MORE DISCIPLINED USE OF RESOURCES
DEPARTMENT OF DEFENSE MORE DISCIPLINED USE OF RESOURCES
$ in Millions FY 2015 FY 2016 FY 2017 FY 2018 FY 2019 FY15-19 New Contracting Efficiencies Better Buying Power in Procurement -445 -494 -532 -681 -616 -2,768 Department of Navy Contractual Services -2,536 -3,143 -3,015 -3,367 -2,743 -14,803
Evolved Expendable Launch Vehicle (EELV) Program Savings -635 -406 -217 -496 -325 -2,079 KC-46 Aircrew Training System (ATS) and Risk Adjustments -296 -323 -81 -186 -162 -1,048 More Efficient Use of Research & Development -124 -43 -22 -16 -17 -221 Reductions in Contract costs -1,500 -1,527 -1,555 -1,583 -2,250 -8,415 Space Acquisition and Investment Efficiencies -23 -100 -279 -150 0 -552 Total -5,558 -6,036 -5,701 -6,480 -6,113 -29,886 Weapons System Programs Termination and Restructuring AEHF 7/8 Termination and GPS III Reprofile -234 -440 -266 -878 -838 -2,657 Warfighter Information Network - Tactical (WIN-T) Increment 3 -449 -450 -750 -1,339 -382 -3,370 Ground Combat Vehicles -904 -900 -718 -838 0 -3,360 Total -1,587 -1,790 -1,734 -3,055 -1,220 -9,387 Manpower or Force Restructuring Civilian reductions -162 -417 -832 -1,266 -1,431 -4,108 Other Military Personnel Reductions -226 -319 -326 -332 -337 -1,539 Reduce C-130 Fleet and Adjust Associations -110 -202 -190 -166 -143 -811
Reduce C-17 Crew Ratio and Adjust AFRC C-17 MP/FH -110 -147 -150 -153 -156 -716 Efficiencies Associated with Headquarters Reduction -47 -106 -165 -216 -215 -749 Total -654 -1,191 -1,663 -2,132 -2,283 -7,923
210

DEPARTMENT OF DEFENSE MORE DISCIPLINED USE OF RESOURCES
DEPARTMENT OF DEFENSE MORE DISCIPLINED USE OF RESOURCES
$ in Millions FY 2015 FY 2016 FY 2017 FY 2018 FY 2019 FY15-19 20% Headquarters Reductions Implementation of the Department's institutional reform efforts to consolidate duplicative efforts and reduce management headquarters staffs -572 -785 -1,008 -1,282 -1,656 -5,302 Military Construction Restructuring and Delays Department of Army Adjustments -644 -382 29 -159 -120 -1,276 Department of Navy Adjustments -805 21 296 -26 -67 -581 Department of Air Force Adjustments -422 915 49 160 -72 630 Defense-wide Adjustments -947 -468 -330 -542 -568 -2,856 Total -2,817 85 43 -566 -828 -4,083 Base Realignment and Closure 2017 Base Realignment and Closure 2017 0 0 0 590 1,054 1,644 Grand Total -18,225 -16,857 -17,538 -21,533 -19,117 -93,268
211

DEPARTMENT OF DEFENSE MORE DISCIPLINED USE OF RESOURCES
DEPARTMENT OF DEFENSE MORE DISCIPLINED USE OF RESOURCES
• The savings by appropriation within title are: $ in Millions FY 2015 FY 2016 FY 2017 FY 2018 FY 2019 FY15-19 Military Personnel Military Personnel, Air Force -604 -889 -912 -959 -951 -4,314 Operation and Maintenance Defense Health Program -1,979 -2,253 -2,326 -2,636 -2,402 -11,597 Environmental Restoration Fund, Navy -1 -1 -1 -1 -1 -3 Operation and Maintenance, Air Force -566 -619 -592 -561 -547 -2,886 Operation and Maintenance, Air Force Reserve -29 -62 -63 -64 -65 -284 Operation and Maintenance, Army -1,200 -1,412 -1,791 -2,172 -2,835 -9,410 Operation and Maintenance, Army National Guard -191 -252 -308 -367 -441 -1,559 Operation and Maintenance, Army Reserve -92 -133 -143 -155 -181 -704 Operation and Maintenance, Defense-Wide -1,860 -2,533 -2,466 -3,286 -3,533 -13,678 Operation and Maintenance, Marine Corps -253 -228 -184 -167 -59 -890 Operation and Maintenance, Marine Corps Reserve -5 -2 -2 -2 -2 -14 Operation and Maintenance, Navy -906 -1,061 -1,136 -1,228 -1,383 -5,714 Operation and Maintenance, Navy Reserve -51 -33 -26 -27 -30 -167 Total -7,132 -8,589 -9,039 -10,666 -11,480 -46,906
212
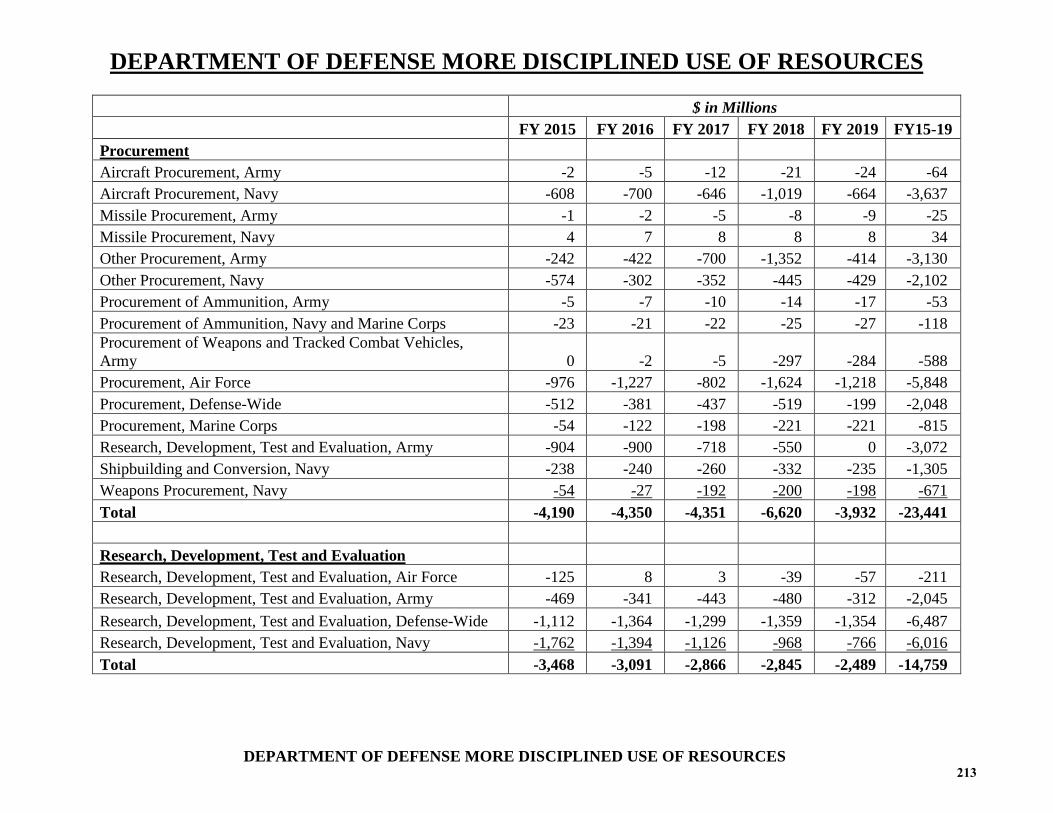
DEPARTMENT OF DEFENSE MORE DISCIPLINED USE OF RESOURCES
DEPARTMENT OF DEFENSE MORE DISCIPLINED USE OF RESOURCES
$ in Millions FY 2015 FY 2016 FY 2017 FY 2018 FY 2019 FY15-19 Procurement Aircraft Procurement, Army -2 -5 -12 -21 -24 -64 Aircraft Procurement, Navy -608 -700 -646 -1,019 -664 -3,637 Missile Procurement, Army -1 -2 -5 -8 -9 -25 Missile Procurement, Navy 4 7 8 8 8 34 Other Procurement, Army -242 -422 -700 -1,352 -414 -3,130 Other Procurement, Navy -574 -302 -352 -445 -429 -2,102 Procurement of Ammunition, Army -5 -7 -10 -14 -17 -53 Procurement of Ammunition, Navy and Marine Corps -23 -21 -22 -25 -27 -118 Procurement of Weapons and Tracked Combat Vehicles, Army 0 -2 -5 -297 -284 -588 Procurement, Air Force -976 -1,227 -802 -1,624 -1,218 -5,848 Procurement, Defense-Wide -512 -381 -437 -519 -199 -2,048 Procurement, Marine Corps -54 -122 -198 -221 -221 -815 Research, Development, Test and Evaluation, Army -904 -900 -718 -550 0 -3,072 Shipbuilding and Conversion, Navy -238 -240 -260 -332 -235 -1,305 Weapons Procurement, Navy -54 -27 -192 -200 -198 -671 Total -4,190 -4,350 -4,351 -6,620 -3,932 -23,441 Research, Development, Test and Evaluation Research, Development, Test and Evaluation, Air Force -125 8 3 -39 -57 -211 Research, Development, Test and Evaluation, Army -469 -341 -443 -480 -312 -2,045 Research, Development, Test and Evaluation, Defense-Wide -1,112 -1,364 -1,299 -1,359 -1,354 -6,487 Research, Development, Test and Evaluation, Navy -1,762 -1,394 -1,126 -968 -766 -6,016 Total -3,468 -3,091 -2,866 -2,845 -2,489 -14,759
213

DEPARTMENT OF DEFENSE MORE DISCIPLINED USE OF RESOURCES
DEPARTMENT OF DEFENSE MORE DISCIPLINED USE OF RESOURCES
$ in Millions FY 2015 FY 2016 FY 2017 FY 2018 FY 2019 FY15-19 Military Construction FY 2017 Base Realignment and Closure - Defense-Wide 0 0 0 590 1,054 1,644 Military Construction, Air Force -333 809 63 130 -47 621 Military Construction, Air Force Reserve 9 8 -4 23 -15 20 Military Construction, Air National Guard -22 23 -9 8 -10 -11 Military Construction, Army -361 -75 145 -129 -102 -522 Military Construction, Army National Guard -181 -137 -59 -23 -11 -412 Military Construction, Army Reserve -62 -67 -35 -1 -4 -169 Military Construction, Defense-Wide -947 -479 -727 -989 -1,024 -4,166 Military Construction, Navy and Marine Corps -720 34 288 6 -38 -431 Military Construction, Navy Reserve 3 -3 20 -15 -20 -15 Total -2,614 113 -319 -402 -218 -3,440 Family Housing Family Housing Construction, Air Force -75 76 0 0 0 1 Family Housing Construction, Army -40 -104 -22 -5 -4 -174 Family Housing Construction, Navy and Marine Corps -88 -10 -12 -16 -9 -135 Total -203 -39 -34 -21 -12 -309 Revolving and Management Funds National Defense Stockpile Transaction Fund -14 -13 -18 -19 -36 -100 Grand Total -18,225 -16,857 -17,538 -21,533 -19,117 -93,268
214

WORLD WIDE WEB ADDRESS
WORLD WIDE WEB ADDRESS
The Operation and Maintenance Overview is available on the
World Wide Web at:
http://comptroller.defense.gov/BudgetMaterials.aspx
215

MILITARY PERSONNEL, (M-1)
MILITARY PERSONNEL, (M-1)
Department of Defense FY 2015 President's Budget Exhibit M-1 FY 2015 President's Budget Total Obligational Authority (Dollars in Thousands) S FY 2013 FY 2014 FY 2014 FY 2014 FY 2015 e Military Personnel, Army (Base & OCO) Base Enacted OCO Enacted Total Enacted Base c ---------- ---------- ---------- ---------- ---------- - Budget Activity 01: Pay and Allowances of Officers 2010A 5 Basic Pay 7,660,215 6,767,493 801,291 7,568,784 6,715,420 U 2010A 10 Retired Pay Accrual 2,407,912 2,187,707 220,850 2,408,557 2,095,898 U 2010A 25 Basic Allowance for Housing 2,386,919 2,127,074 245,773 2,372,847 2,191,307 U 2010A 30 Basic Allowance for Subsistence 311,954 281,526 30,396 311,922 279,102 U 2010A 35 Incentive Pays 95,914 89,669 4,152 93,821 98,703 U 2010A 40 Special Pays 468,852 374,353 38,486 412,839 378,007 U 2010A 45 Allowances 272,941 225,840 16,870 242,710 212,394 U 2010A 50 Separation Pay 108,132 107,216 6,145 113,361 99,489 U 2010A 55 Social Security Tax 582,294 514,367 60,694 575,061 511,069 U Total Budget Activity 01 14,295,133 12,675,245 1,424,657 14,099,902 12,581,389 Budget Activity 02: Pay and Allowances of Enlisted 2010A 60 Basic Pay 14,966,997 12,761,757 1,584,653 14,346,410 13,019,805 U 2010A 65 Retired Pay Accrual 4,714,297 4,130,871 445,387 4,576,258 4,070,370 U 2010A 80 Basic Allowance for Housing 5,437,126 4,683,929 614,378 5,298,307 4,870,591 U 2010A 85 Incentive Pays 106,004 98,637 2,106 100,743 104,751 U 2010A 90 Special Pays 945,052 530,912 176,067 706,979 462,722 U 2010A 95 Allowances 1,079,634 921,701 101,787 1,023,488 869,004 U 2010A 100 Separation Pay 568,598 287,133 14,907 302,040 320,346 U 2010A 105 Social Security Tax 1,138,715 976,215 118,736 1,094,951 996,015 U Total Budget Activity 02 28,956,423 24,391,155 3,058,021 27,449,176 24,713,604 Budget Activity 03: Pay And Allowances Of Cadets 2010A 110 Academy Cadets 76,482 77,959 77,959 79,236 U Total Budget Activity 03 76,482 77,959 77,959 79,236 Budget Activity 04: Subsistence of Enlisted Personnel 2010A 115 Basic Allowance for Subsistence 1,589,742 1,227,052 249,365 1,476,417 1,284,843 U 2010A 120 Subsistence-In-Kind 812,317 524,946 285,380 810,326 595,165 U 2010A 121 Family Subsistence Supplemental Allowance 1,251 2,121 2,121 1,316 U Total Budget Activity 04 2,403,310 1,754,119 534,745 2,288,864 1,881,324
216

MILITARY PERSONNEL, (M-1)
MILITARY PERSONNEL, (M-1)
Department of Defense FY 2015 President's Budget Exhibit M-1 FY 2015 President's Budget Total Obligational Authority (Dollars in Thousands) S FY 2013 FY 2014 FY 2014 FY 2014 FY 2015 e Military Personnel, Army (Base & OCO) Base Enacted OCO Enacted Total Enacted Base c ---------- ---------- ---------- ---------- ---------- - Budget Activity 05: Permanent Change of Station Travel 2010A 125 Accession Travel 160,928 141,620 11,091 152,711 142,048 U 2010A 130 Training Travel 144,184 127,871 8,926 136,797 144,951 U 2010A 135 Operational Travel 409,249 477,098 101,776 578,874 412,092 U 2010A 140 Rotational Travel 776,066 627,363 50,103 677,466 758,069 U 2010A 145 Separation Travel 307,805 219,622 14,169 233,791 293,377 U 2010A 150 Travel of Organized Units 5,811 9,702 622 10,324 4,043 U 2010A 155 Non-Temporary Storage 11,137 10,283 10,283 10,997 U 2010A 160 Temporary Lodging Expense 52,619 33,658 33,658 37,301 U Total Budget Activity 05 1,867,799 1,647,217 186,687 1,833,904 1,802,878 Budget Activity 06: Other Military Personnel Costs 2010A 170 Apprehension of Military Deserters 974 960 960 1,033 U 2010A 175 Interest on Uniformed Services Savings 8,669 725 4,745 5,470 1,338 U 2010A 180 Death Gratuities 70,100 61,900 7,449 69,349 51,700 U 2010A 185 Unemployment Benefits 463,305 243,866 196,104 439,970 222,586 U 2010A 200 Adoption Expenses 595 636 636 578 U 2010A 210 Transportation Subsidy 4,884 4,326 4,326 5,070 U 2010A 212 Reserve Income Replacement Program 45 40 40 U 2010A 215 Partial Dislocation Allowance 160 326 326 164 U 2010A 216 SGLI Extra Hazard Payments 75,901 1,449 1,449 U 2010A 217 Reserve Officers Training Corps (ROTC) 102,892 117,556 117,556 101,068 U 2010A 218 Junior ROTC 51,583 42,407 42,407 52,723 U 2010A 219 Traumatic Injury Protection Coverage (T-SGLI) 38,415 35,828 35,828 U 2010A 221 Stop-Loss Retroactive Payments 1,237 U Total Budget Activity 06 818,760 472,702 245,615 718,317 436,260 Total Military Personnel, Army 48,417,907 41,018,397 5,449,725 46,468,122 41,494,691 Less Reimbursables 278,892 275,140 275,140 269,352 Total Direct - Military Personnel, Army 48,139,015 40,743,257 5,449,725 46,192,982 41,225,339 Medicare-Eligible Retiree Health Fund Contribution (MERHFC) Accounts 1004A 300 Military Personnel, Army 2,434,057 1,971,735 137,573 2,109,308 1,795,324 U Total Active Army Military Personnel Costs 50,573,072 42,714,992 5,587,298 48,302,290 43,020,663
217
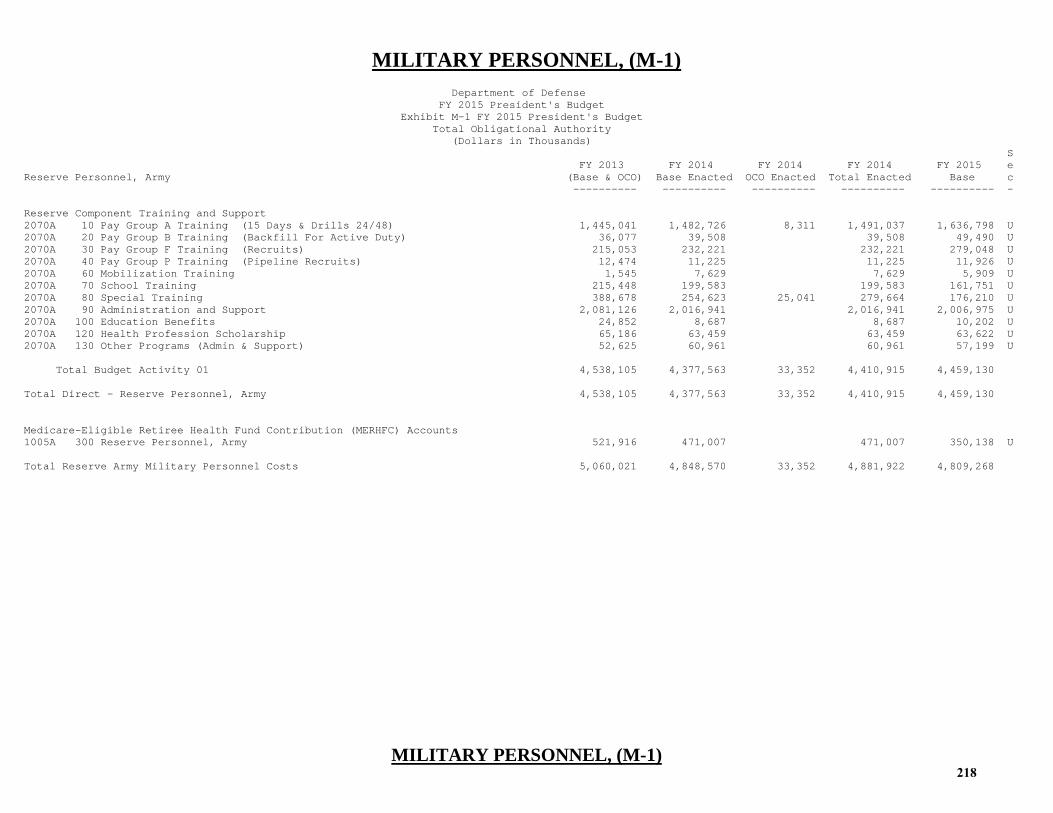
MILITARY PERSONNEL, (M-1)
MILITARY PERSONNEL, (M-1)
Department of Defense FY 2015 President's Budget Exhibit M-1 FY 2015 President's Budget Total Obligational Authority (Dollars in Thousands) S FY 2013 FY 2014 FY 2014 FY 2014 FY 2015 e Reserve Personnel, Army (Base & OCO) Base Enacted OCO Enacted Total Enacted Base c ---------- ---------- ---------- ---------- ---------- - Reserve Component Training and Support 2070A 10 Pay Group A Training (15 Days & Drills 24/48) 1,445,041 1,482,726 8,311 1,491,037 1,636,798 U 2070A 20 Pay Group B Training (Backfill For Active Duty) 36,077 39,508 39,508 49,490 U 2070A 30 Pay Group F Training (Recruits) 215,053 232,221 232,221 279,048 U 2070A 40 Pay Group P Training (Pipeline Recruits) 12,474 11,225 11,225 11,926 U 2070A 60 Mobilization Training 1,545 7,629 7,629 5,909 U 2070A 70 School Training 215,448 199,583 199,583 161,751 U 2070A 80 Special Training 388,678 254,623 25,041 279,664 176,210 U 2070A 90 Administration and Support 2,081,126 2,016,941 2,016,941 2,006,975 U 2070A 100 Education Benefits 24,852 8,687 8,687 10,202 U 2070A 120 Health Profession Scholarship 65,186 63,459 63,459 63,622 U 2070A 130 Other Programs (Admin & Support) 52,625 60,961 60,961 57,199 U Total Budget Activity 01 4,538,105 4,377,563 33,352 4,410,915 4,459,130 Total Direct - Reserve Personnel, Army 4,538,105 4,377,563 33,352 4,410,915 4,459,130 Medicare-Eligible Retiree Health Fund Contribution (MERHFC) Accounts 1005A 300 Reserve Personnel, Army 521,916 471,007 471,007 350,138 U Total Reserve Army Military Personnel Costs 5,060,021 4,848,570 33,352 4,881,922 4,809,268
218

MILITARY PERSONNEL, (M-1)
MILITARY PERSONNEL, (M-1)
Department of Defense FY 2015 President's Budget Exhibit M-1 FY 2015 President's Budget Total Obligational Authority (Dollars in Thousands) S FY 2013 FY 2014 FY 2014 FY 2014 FY 2015 e National Guard Personnel, Army (Base & OCO) Base Enacted OCO Enacted Total Enacted Base c ---------- ---------- ---------- ---------- ---------- - Reserve Component Training and Support 2060A 10 Pay Group A Training (15 Days & Drills 24/48) 2,402,897 2,354,244 37,857 2,392,101 2,616,067 U 2060A 30 Pay Group F Training (Recruits) 515,802 516,125 516,125 441,606 U 2060A 40 Pay Group P Training (Pipeline Recruits) 45,638 34,956 34,956 47,984 U 2060A 70 School Training 522,928 563,598 13,945 577,543 347,137 U 2060A 80 Special Training 1,102,126 602,842 191,000 793,842 433,207 U 2060A 90 Administration and Support 3,658,002 3,678,629 14,262 3,692,891 3,766,624 U 2060A 100 Education Benefits 80,321 26,104 26,104 30,267 U Total Budget Activity 01 8,327,714 7,776,498 257,064 8,033,562 7,682,892 Total Direct - National Guard Personnel, Army 8,327,714 7,776,498 257,064 8,033,562 7,682,892 Medicare-Eligible Retiree Health Fund Contribution (MERHFC) Accounts 1006A 300 National Guard Personnel, Army 909,473 818,575 818,575 610,778 U Total National Guard Army Military Personnel Costs 9,237,187 8,595,073 257,064 8,852,137 8,293,670 Total Direct - Army Military Appropriations 61,004,834 52,897,318 5,740,141 58,637,459 53,367,361 Total Direct - Army MERHFC Accounts 3,865,446 3,261,317 137,573 3,398,890 2,756,240 Grand Total Direct - Army Military Personnel Costs 64,870,280 56,158,635 5,877,714 62,036,349 56,123,601 UNCLASSIFIED
219

MILITARY PERSONNEL, (M-1)
MILITARY PERSONNEL, (M-1)
Department of Defense FY 2015 President's Budget Exhibit M-1 FY 2015 President's Budget Total Obligational Authority (Dollars in Thousands) S FY 2013 FY 2014 FY 2014 FY 2014 FY 2015 e Military Personnel, Navy (Base & OCO) Base Enacted OCO Enacted Total Enacted Base c ---------- ---------- ---------- ---------- ---------- - Budget Activity 01: Pay and Allowances of Officers 1453N 5 Basic Pay 3,985,682 3,934,736 99,067 4,033,803 4,017,362 U 1453N 10 Retired Pay Accrual 1,269,578 1,273,217 24,271 1,297,488 1,255,535 U 1453N 25 Basic Allowance for Housing 1,382,886 1,375,183 31,959 1,407,142 1,433,673 U 1453N 30 Basic Allowance for Subsistence 158,689 160,319 3,427 163,746 164,566 U 1453N 35 Incentive Pays 130,708 131,293 749 132,042 127,220 U 1453N 40 Special Pays 413,868 427,043 4,858 431,901 429,454 U 1453N 45 Allowances 136,398 123,341 7,458 130,799 123,982 U 1453N 50 Separation Pay 35,428 39,244 39,244 59,026 U 1453N 55 Social Security Tax 302,209 299,218 7,579 306,797 305,463 U Total Budget Activity 01 7,815,446 7,763,594 179,368 7,942,962 7,916,281 Budget Activity 02: Pay And Allowances Of Enlisted Personnel 1453N 60 Basic Pay 8,392,358 8,495,238 108,938 8,604,176 8,614,658 U 1453N 65 Retired Pay Accrual 2,687,138 2,752,197 26,690 2,778,887 2,695,729 U 1453N 80 Basic Allowance for Housing 3,666,026 3,819,940 51,780 3,871,720 3,878,513 U 1453N 85 Incentive Pays 95,692 103,672 296 103,968 104,072 U 1453N 90 Special Pays 709,092 735,480 11,931 747,411 793,222 U 1453N 95 Allowances 608,326 574,152 16,447 590,599 594,908 U 1453N 100 Separation Pay 224,282 255,663 179 255,842 223,362 U 1453N 105 Social Security Tax 638,439 649,886 8,334 658,220 659,021 U Total Budget Activity 02 17,021,353 17,386,228 224,595 17,610,823 17,563,485 Budget Activity 03: Pay And Allowances Of Cadets 1453N 110 Midshipmen 78,648 77,592 77,592 78,093 U Total Budget Activity 03 78,648 77,592 77,592 78,093 Budget Activity 04: Subsistence of Enlisted Personnel 1453N 115 Basic Allowance for Subsistence 735,292 764,626 12,359 776,985 759,490 U 1453N 120 Subsistence-In-Kind 414,310 439,545 22,956 462,501 431,060 U 1453N 121 Family Subsistence Supplemental Allowance 10 12 12 8 U Total Budget Activity 04 1,149,612 1,204,183 35,315 1,239,498 1,190,558
220

MILITARY PERSONNEL, (M-1)
MILITARY PERSONNEL, (M-1)
Department of Defense FY 2015 President's Budget Exhibit M-1 FY 2015 President's Budget Total Obligational Authority (Dollars in Thousands) S FY 2013 FY 2014 FY 2014 FY 2014 FY 2015 e Military Personnel, Navy (Base & OCO) Base Enacted OCO Enacted Total Enacted Base c ---------- ---------- ---------- ---------- ---------- - Budget Activity 05: Permanent Change of Station Travel 1453N 125 Accession Travel 111,852 92,295 3,071 95,366 86,416 U 1453N 130 Training Travel 95,210 96,869 96,869 98,547 U 1453N 135 Operational Travel 251,642 245,141 1,353 246,494 253,140 U 1453N 140 Rotational Travel 301,166 271,253 2,559 273,812 271,252 U 1453N 145 Separation Travel 139,198 121,728 4,472 126,200 133,912 U 1453N 150 Travel of Organized Units 19,180 36,790 36,790 41,469 U 1453N 155 Non-Temporary Storage 1,909 1,212 1,212 1,982 U 1453N 160 Temporary Lodging Expense 8,386 8,545 8,545 8,708 U 1453N 165 Other 3,448 3,514 3,514 3,581 U Total Budget Activity 05 931,991 877,347 11,455 888,802 899,007 Budget Activity 06: Other Military Personnel Costs 1453N 170 Apprehension of Military Deserters 90 199 199 93 U 1453N 175 Interest on Uniformed Services Savings 1,612 1,660 1,660 1,664 U 1453N 180 Death Gratuities 19,195 17,400 1,200 18,600 17,400 U 1453N 185 Unemployment Benefits 151,491 107,786 62,168 169,954 112,881 U 1453N 195 Education Benefits 23,427 18,809 18,809 20,495 U 1453N 200 Adoption Expenses 267 210 210 277 U 1453N 210 Transportation Subsidy 5,030 5,750 5,750 4,053 U 1453N 212 Reserve Income Replacement Program 34 U 1453N 215 Partial Dislocation Allowance 38 92 92 39 U 1453N 216 SGLI Extra Hazard Payments 45,898 44,243 44,243 U 1453N 217 Reserve Officers Training Corps (ROTC) 20,360 21,271 21,271 21,584 U 1453N 218 Junior ROTC 12,293 14,069 14,069 12,312 U 1453N 221 Stop-Loss Retroactive Payments 204 U 1453N 240 Cancelled Account Payment 268 U Total Budget Activity 06 280,207 187,246 107,611 294,857 190,798 Total Military Personnel, Navy 27,277,257 27,496,190 558,344 28,054,534 27,838,222 Less Reimbursables 306,255 294,219 294,219 348,782 Total Direct - Military Personnel, Navy 26,971,002 27,201,971 558,344 27,760,315 27,489,440 Medicare-Eligible Retiree Health Fund Contribution (MERHFC) Accounts 1000N 300 Navy 1,397,183 1,298,063 1,298,063 1,180,761 U Total Active Navy Military Personnel Costs 28,368,185 28,500,034 558,344 29,058,378 28,670,201
221

MILITARY PERSONNEL, (M-1)
MILITARY PERSONNEL, (M-1)
Department of Defense FY 2015 President's Budget Exhibit M-1 FY 2015 President's Budget Total Obligational Authority (Dollars in Thousands) S FY 2013 FY 2014 FY 2014 FY 2014 FY 2015 e Military Personnel, Marine Corps (Base & OCO) Base Enacted OCO Enacted Total Enacted Base c ---------- ---------- ---------- ---------- ---------- - Budget Activity 01: Pay and Allowances of Officers 1105N 5 Basic Pay 1,588,421 1,449,754 102,065 1,551,819 1,489,996 U 1105N 10 Retired Pay Accrual 501,729 467,608 29,103 496,711 464,468 U 1105N 25 Basic Allowance for Housing 499,985 479,514 27,608 507,122 492,488 U 1105N 30 Basic Allowance for Subsistence 63,675 61,565 4,473 66,038 63,449 U 1105N 35 Incentive Pays 42,563 40,634 40,634 38,223 U 1105N 40 Special Pays 19,102 12,746 4,120 16,866 5,927 U 1105N 45 Allowances 50,707 42,592 4,155 46,747 32,083 U 1105N 50 Separation Pay 36,961 20,548 43,118 63,666 13,593 U 1105N 55 Social Security Tax 119,790 109,873 7,800 117,673 113,239 U Total Budget Activity 01 2,922,933 2,684,834 222,442 2,907,276 2,713,466 Budget Activity 02: Pay And Allowances Of Enlisted Personnel 1105N 60 Basic Pay 5,004,895 4,695,569 224,767 4,920,336 4,825,078 U 1105N 65 Retired Pay Accrual 1,603,170 1,516,099 68,666 1,584,765 1,502,784 U 1105N 80 Basic Allowance for Housing 1,644,338 1,651,362 26,078 1,677,440 1,669,844 U 1105N 85 Incentive Pays 10,210 9,832 9,832 9,946 U 1105N 90 Special Pays 182,762 125,862 25,141 151,003 111,002 U 1105N 95 Allowances 354,787 326,415 16,905 343,320 289,269 U 1105N 100 Separation Pay 175,555 97,465 78,956 176,421 84,343 U 1105N 105 Social Security Tax 380,737 358,227 17,195 375,422 368,511 U Total Budget Activity 02 9,356,454 8,780,831 457,708 9,238,539 8,860,777 Budget Activity 04: Subsistence of Enlisted Personnel 1105N 115 Basic Allowance for Subsistence 460,479 438,034 24,965 462,999 442,559 U 1105N 120 Subsistence-In-Kind 339,867 296,986 296,986 353,006 U 1105N 121 Family Subsistence Supplemental Allowance 10 10 10 U Total Budget Activity 04 800,346 735,030 24,965 759,995 795,575 Budget Activity 05: Permanent Change of Station Travel 1105N 125 Accession Travel 67,952 45,933 45,933 49,622 U 1105N 130 Training Travel 17,235 23,061 23,061 27,481 U 1105N 135 Operational Travel 177,180 182,934 182,934 168,432 U 1105N 140 Rotational Travel 138,450 95,128 1 95,129 99,931 U 1105N 145 Separation Travel 91,461 93,399 4,371 97,770 82,065 U 1105N 150 Travel of Organized Units 784 784 785 U 1105N 155 Non-Temporary Storage 9,311 6,888 6,888 5,064 U 1105N 160 Temporary Lodging Expense 14,918 14,918 11,841 U 1105N 165 Other 2,665 3,312 3,312 3,056 U Total Budget Activity 05 504,254 466,357 4,372 470,729 448,277
222

MILITARY PERSONNEL, (M-1)
MILITARY PERSONNEL, (M-1)
Department of Defense FY 2015 President's Budget Exhibit M-1 FY 2015 President's Budget Total Obligational Authority 11 Mar 2014 (Dollars in Thousands) S FY 2013 FY 2014 FY 2014 FY 2014 FY 2015 e Military Personnel, Marine Corps (Base & OCO) Base Enacted OCO Enacted Total Enacted Base c ---------- ---------- ---------- ---------- ---------- - Budget Activity 06: Other Military Personnel Costs 1105N 170 Apprehension of Military Deserters 591 751 751 614 U 1105N 175 Interest on Uniformed Services Savings 738 20 930 950 19 U 1105N 180 Death Gratuities 12,302 10,100 7,000 17,100 11,400 U 1105N 185 Unemployment Benefits 133,452 91,264 37,733 128,997 101,839 U 1105N 195 Education Benefits 3,253 2,375 2,375 7,000 U 1105N 200 Adoption Expenses 84 72 72 84 U 1105N 210 Transportation Subsidy 1,833 3,085 3,085 1,527 U 1105N 215 Partial Dislocation Allowance 65 102 102 67 U 1105N 216 SGLI Extra Hazard Payments 25,324 22,772 22,772 U 1105N 218 Junior ROTC 8,314 5,035 5,035 3,910 U 1105N 221 Stop-Loss Retroactive Payments 2 U Total Budget Activity 06 185,958 112,804 68,435 181,239 126,460 Total Military Personnel, Marine Corps 13,769,945 12,779,856 777,922 13,557,778 12,944,555 Less Reimbursables 29,985 24,351 24,351 25,452 Total Direct - Military Personnel, Marine Corps 13,739,960 12,755,505 777,922 13,533,427 12,919,103 Medicare-Eligible Retiree Health Fund Contribution (MERHFC) Accounts 1001N 300 Marine Corps 875,814 739,326 39,735 779,061 672,699 U Total Active Marine Corps Military Personnel Costs 14,615,774 13,494,831 817,657 14,312,488 13,591,802 UNCLASSIFIED
223

MILITARY PERSONNEL, (M-1)
MILITARY PERSONNEL, (M-1)
Department of Defense FY 2015 President's Budget Exhibit M-1 FY 2015 President's Budget Total Obligational Authority 11 Mar 2014 (Dollars in Thousands) S FY 2013 FY 2014 FY 2014 FY 2014 FY 2015 e Reserve Personnel, Navy (Base & OCO) Base Enacted OCO Enacted Total Enacted Base c ---------- ---------- ---------- ---------- ---------- - Reserve Component Training and Support 1405N 10 Pay Group A Training (15 Days & Drills 24/48) 622,704 596,049 596,049 585,488 U 1405N 20 Pay Group B Training (Backfill For Active Duty) 6,444 9,489 9,489 7,286 U 1405N 30 Pay Group F Training (Recruits) 56,525 50,501 50,501 57,875 U 1405N 60 Mobilization Training 8,276 8,986 8,986 8,670 U 1405N 70 School Training 53,794 50,726 1,753 52,479 51,089 U 1405N 80 Special Training 141,402 92,470 18,100 110,570 106,571 U 1405N 90 Administration and Support 973,182 983,454 385 983,839 988,427 U 1405N 100 Education Benefits 1,033 104 104 109 U 1405N 120 Health Profession Scholarship 49,909 52,187 52,187 57,519 U Total Budget Activity 01 1,913,269 1,843,966 20,238 1,864,204 1,863,034 Total Direct - Reserve Personnel, Navy 1,913,269 1,843,966 20,238 1,864,204 1,863,034 Medicare-Eligible Retiree Health Fund Contribution (MERHFC) Accounts 1002N 300 Reserve Personnel, Navy 169,342 147,812 147,812 110,569 U Total Reserve Navy Military Personnel Costs 2,082,611 1,991,778 20,238 2,012,016 1,973,603
224

MILITARY PERSONNEL, (M-1)
MILITARY PERSONNEL, (M-1)
Department of Defense FY 2015 President's Budget Exhibit M-1 FY 2015 President's Budget Total Obligational Authority (Dollars in Thousands) S FY 2013 FY 2014 FY 2014 FY 2014 FY 2015 e Reserve Personnel, Marine Corps (Base & OCO) Base Enacted OCO Enacted Total Enacted Base c ---------- ---------- ---------- ---------- ---------- - Reserve Component Training and Support 1108N 10 Pay Group A Training (15 Days & Drills 24/48) 236,462 233,722 233,722 237,581 U 1108N 20 Pay Group B Training (Backfill For Active Duty) 36,378 30,555 30,555 33,463 U 1108N 30 Pay Group F Training (Recruits) 120,871 124,698 124,698 116,200 U 1108N 60 Mobilization Training 2,308 2,677 2,677 2,579 U 1108N 70 School Training 23,111 19,448 3,213 22,661 24,195 U 1108N 80 Special Training 51,073 18,968 11,679 30,647 15,726 U 1108N 90 Administration and Support 220,553 216,453 242 216,695 234,244 U 1108N 95 Platoon Leader Class 6,167 7,770 7,770 6,124 U 1108N 100 Education Benefits 5,450 818 818 642 U Total Budget Activity 01 702,373 655,109 15,134 670,243 670,754 Total Direct - Reserve Personnel, Marine Corps 702,373 655,109 15,134 670,243 670,754 Medicare-Eligible Retiree Health Fund Contribution (MERHFC) Accounts 1003N 300 Reserve Personnel, Marine Corps 98,428 89,108 89,108 65,170 U Total Reserve Marine Corps Military Personnel Costs 800,801 744,217 15,134 759,351 735,924 Total Direct - Navy Military Appropriations 28,884,271 29,045,937 578,582 29,624,519 29,352,474 Total Direct - Navy MERHFC Accounts 1,566,525 1,445,875 1,445,875 1,291,330 Grand Total Direct - Navy Military Personnel Costs 30,450,796 30,491,812 578,582 31,070,394 30,643,804 Total Direct - Marine Corps Military Appropriations 14,442,333 13,410,614 793,056 14,203,670 13,589,857 Total Direct - Marine Corps MERHFC Accounts 974,242 828,434 39,735 868,169 737,869 Grand Total Direct - Marine Corps Military Personnel Costs 15,416,575 14,239,048 832,791 15,071,839 14,327,726 Total Direct - DoN Military Appropriations 43,326,604 42,456,551 1,371,638 43,828,189 42,942,331 Total Direct - DoN MERHFC Accounts 2,540,767 2,274,309 39,735 2,314,044 2,029,199 Grand Total Direct - DoN Military Personnel Costs 45,867,371 44,730,860 1,411,373 46,142,233 44,971,530
225

MILITARY PERSONNEL, (M-1)
MILITARY PERSONNEL, (M-1)
Department of Defense FY 2015 President's Budget Exhibit M-1 FY 2015 President's Budget Total Obligational Authority (Dollars in Thousands) S FY 2013 FY 2014 FY 2014 FY 2014 FY 2015 e Military Personnel, Air Force (Base & OCO) Base Enacted OCO Enacted Total Enacted Base c ---------- ---------- ---------- ---------- ---------- - Budget Activity 01: Pay and Allowances of Officers 3500F 5 Basic Pay 4,905,856 4,806,704 131,007 4,937,711 4,668,266 U 3500F 10 Retired Pay Accrual 1,561,402 1,575,177 32,097 1,607,274 1,450,107 U 3500F 25 Basic Allowance for Housing 1,446,018 1,378,651 39,926 1,418,577 1,387,295 U 3500F 30 Basic Allowance for Subsistence 194,935 197,950 4,696 202,646 190,311 U 3500F 35 Incentive Pays 217,851 206,177 206,177 212,376 U 3500F 40 Special Pays 322,056 301,534 7,394 308,928 296,799 U 3500F 45 Allowances 135,573 134,661 8,449 143,110 125,724 U 3500F 50 Separation Pay 56,615 258,533 258,533 283,092 U 3500F 55 Social Security Tax 373,118 372,960 10,022 382,982 355,558 U Total Budget Activity 01 9,213,424 9,232,347 233,591 9,465,938 8,969,528 Budget Activity 02: Pay and Allowances of Enlisted 3500F 60 Basic Pay 8,985,771 8,705,105 229,591 8,934,696 8,406,084 U 3500F 65 Retired Pay Accrual 2,869,598 2,831,706 56,250 2,887,956 2,619,233 U 3500F 80 Basic Allowance for Housing 3,472,092 3,573,883 95,564 3,669,447 3,386,412 U 3500F 85 Incentive Pays 40,167 42,599 42,599 42,395 U 3500F 90 Special Pays 394,191 289,121 29,262 318,383 268,538 U 3500F 95 Allowances 593,136 590,403 25,480 615,883 564,364 U 3500F 100 Separation Pay 151,965 464,815 464,815 874,187 U 3500F 105 Social Security Tax 687,411 670,467 17,564 688,031 643,063 U Total Budget Activity 02 17,194,331 17,168,099 453,711 17,621,810 16,804,276 Budget Activity 03: Pay And Allowances Of Cadets 3500F 110 Academy Cadets 67,505 69,612 69,612 70,159 U Total Budget Activity 03 67,505 69,612 69,612 70,159 Budget Activity 04: Subsistence of Enlisted Personnel 3500F 115 Basic Allowance for Subsistence 1,001,966 977,880 24,177 1,002,057 963,765 U 3500F 120 Subsistence-In-Kind 222,666 133,439 72,502 205,941 137,346 U 3500F 121 Family Subsistence Supplemental Allowance 3 33 33 3 U Total Budget Activity 04 1,224,635 1,111,352 96,679 1,208,031 1,101,114
226

MILITARY PERSONNEL, (M-1)
MILITARY PERSONNEL, (M-1)
Department of Defense FY 2015 President's Budget Exhibit M-1 FY 2015 President's Budget Total Obligational Authority (Dollars in Thousands) S FY 2013 FY 2014 FY 2014 FY 2014 FY 2015 e Military Personnel, Air Force (Base & OCO) Base Enacted OCO Enacted Total Enacted Base c ---------- ---------- ---------- ---------- ---------- - Budget Activity 05: Permanent Change of Station Travel 3500F 125 Accession Travel 89,060 86,485 86,485 87,932 U 3500F 130 Training Travel 67,853 70,127 70,127 92,459 U 3500F 135 Operational Travel 293,240 294,574 4,003 298,577 286,473 U 3500F 140 Rotational Travel 504,349 461,684 461,684 485,297 U 3500F 145 Separation Travel 164,407 198,183 198,183 181,583 U 3500F 150 Travel of Organized Units 8,375 16,123 16,123 6,556 U 3500F 155 Non-Temporary Storage 21,281 23,132 23,132 22,369 U 3500F 160 Temporary Lodging Expense 30,631 30,183 30,183 30,261 U Total Budget Activity 05 1,179,196 1,180,491 4,003 1,184,494 1,192,930 Budget Activity 06: Other Military Personnel Costs 3500F 170 Apprehension of Military Deserters 103 124 124 107 U 3500F 175 Interest on Uniformed Services Savings 2,977 3,440 3,440 3,073 U 3500F 180 Death Gratuities 17,700 16,500 600 17,100 16,500 U 3500F 185 Unemployment Benefits 80,886 51,562 28,841 80,403 48,842 U 3500F 195 Education Benefits 210 209 209 189 U 3500F 200 Adoption Expenses 546 628 628 546 U 3500F 210 Transportation Subsidy 3,338 5,900 5,900 2,018 U 3500F 215 Partial Dislocation Allowance 1,788 1,930 1,930 1,883 U 3500F 216 SGLI Extra Hazard Payments 50,073 15,437 15,437 U 3500F 217 Reserve Officers Training Corps (ROTC) 33,841 29,849 29,849 27,669 U 3500F 218 Junior ROTC 15,138 16,373 16,373 15,796 U Total Budget Activity 06 206,600 126,515 44,878 171,393 116,623 Total Military Personnel, Air Force 29,085,691 28,888,416 832,862 29,721,278 28,254,630 Less Reimbursables 417,114 426,711 426,711 438,704 Total Direct - Military Personnel, Air Force 28,668,577 28,461,705 832,862 29,294,567 27,815,926 Medicare-Eligible Retiree Health Fund Contribution (MERHFC) Accounts 1007F 300 Air Force 1,441,808 1,316,910 1,316,910 1,146,110 U Total Active Air Force Military Personnel Costs 30,110,385 29,778,615 832,862 30,611,477 28,962,036
227

MILITARY PERSONNEL, (M-1)
MILITARY PERSONNEL, (M-1)
Department of Defense FY 2015 President's Budget Exhibit M-1 FY 2015 President's Budget Total Obligational Authority 11 Mar 2014 (Dollars in Thousands) S FY 2013 FY 2014 FY 2014 FY 2014 FY 2015 e Reserve Personnel, Air Force (Base & OCO) Base Enacted OCO Enacted Total Enacted Base c ---------- ---------- ---------- ---------- ---------- - Reserve Component Training and Support 3700F 10 Pay Group A Training (15 Days & Drills 24/48) 659,234 663,178 663,178 657,163 U 3700F 20 Pay Group B Training (Backfill For Active Duty) 95,979 99,167 99,167 113,876 U 3700F 30 Pay Group F Training (Recruits) 70,427 72,653 72,653 71,429 U 3700F 40 Pay Group P Training (Pipeline Recruits) 2,799 754 754 1,681 U 3700F 60 Mobilization Training 202 564 564 401 U 3700F 70 School Training 151,524 148,113 148,113 125,804 U 3700F 80 Special Training 295,169 292,840 20,432 313,272 229,201 U 3700F 90 Administration and Support 384,064 372,250 372,250 398,346 U 3700F 100 Education Benefits 20,559 13,507 13,507 13,785 U 3700F 120 Health Profession Scholarship 54,866 55,220 55,220 58,794 U 3700F 130 Other Programs (Admin & Support) 2,898 4,913 4,913 5,038 U Total Budget Activity 01 1,737,721 1,723,159 20,432 1,743,591 1,675,518 Total Direct - Reserve Personnel, Air Force 1,737,721 1,723,159 20,432 1,743,591 1,675,518 Medicare-Eligible Retiree Health Fund Contribution (MERHFC) Accounts 1008F 300 Reserve Personnel, Air Force 173,927 156,087 156,087 112,551 U Total Reserve Air Force Military Personnel Costs 1,911,648 1,879,246 20,432 1,899,678 1,788,069
228

MILITARY PERSONNEL, (M-1)
MILITARY PERSONNEL, (M-1)
Department of Defense FY 2015 President's Budget Exhibit M-1 FY 2015 President's Budget Total Obligational Authority (Dollars in Thousands) S FY 2013 FY 2014 FY 2014 FY 2014 FY 2015 e National Guard Personnel, Air Force (Base & OCO) Base Enacted OCO Enacted Total Enacted Base c ---------- ---------- ---------- ---------- ---------- - Reserve Component Training and Support 3850F 10 Pay Group A Training (15 Days & Drills 24/48) 946,891 913,573 913,573 913,691 U 3850F 30 Pay Group F Training (Recruits) 110,075 109,468 109,468 122,678 U 3850F 40 Pay Group P Training (Pipeline Recruits) 9,116 5,006 5,006 5,384 U 3850F 70 School Training 238,127 250,327 250,327 243,888 U 3850F 80 Special Training 208,944 165,588 6,919 172,507 168,222 U 3850F 90 Administration and Support 1,656,612 1,653,023 1,653,023 1,684,800 U 3850F 100 Education Benefits 34,636 17,436 17,436 17,794 U Total Budget Activity 01 3,204,401 3,114,421 6,919 3,121,340 3,156,457 Total Direct - National Guard Personnel, Air Force 3,204,401 3,114,421 6,919 3,121,340 3,156,457 Medicare-Eligible Retiree Health Fund Contribution (MERHFC) Accounts 1009F 300 National Guard Personnel, Air Force 274,958 249,750 249,750 191,992 U Total National Guard Air Force Military Personnel Costs 3,479,359 3,364,171 6,919 3,371,090 3,348,449 Total Direct - Air Force Military Appropriations 33,610,699 33,299,285 860,213 34,159,498 32,647,901 Total Direct - Air Force MERHFC Accounts 1,890,693 1,722,747 1,722,747 1,450,653 Grand Total Direct - Air Force Military Personnel Costs 35,501,392 35,022,032 860,213 35,882,245 34,098,554
229

MILITARY PERSONNEL, (M-1)
MILITARY PERSONNEL, (M-1)
Department of Defense FY 2015 President's Budget Exhibit M-1 FY 2015 President's Budget Total Obligational Authority (Dollars in Thousands) S FY 2013 FY 2014 FY 2014 FY 2014 FY 2015 e Military Personnel, Grand Total (Base & OCO) Base Enacted OCO Enacted Total Enacted Base c ---------- ---------- ---------- ---------- ---------- - Budget Activity 01: Pay and Allowances of Officers 5 Basic Pay 18,140,174 16,958,687 1,133,430 18,092,117 16,891,044 10 Retired Pay Accrual 5,740,621 5,503,709 306,321 5,810,030 5,266,008 25 Basic Allowance for Housing 5,715,808 5,360,422 345,266 5,705,688 5,504,763 30 Basic Allowance for Subsistence 729,253 701,360 42,992 744,352 697,428 35 Incentive Pays 487,036 467,773 4,901 472,674 476,522 40 Special Pays 1,223,878 1,115,676 54,858 1,170,534 1,110,187 45 Allowances 595,619 526,434 36,932 563,366 494,183 50 Separation Pay 237,136 425,541 49,263 474,804 455,200 55 Social Security Tax 1,377,411 1,296,418 86,095 1,382,513 1,285,329 Total Budget Activity 01 34,246,936 32,356,020 2,060,058 34,416,078 32,180,664 Budget Activity 02: Pay and Allowances of Enlisted 60 Basic Pay 37,350,021 34,657,669 2,147,949 36,805,618 34,865,625 65 Retired Pay Accrual 11,874,203 11,230,873 596,993 11,827,866 10,888,116 80 Basic Allowance for Housing 14,219,582 13,729,114 787,800 14,516,914 13,805,360 85 Incentive Pays 252,073 254,740 2,402 257,142 261,164 90 Special Pays 2,231,097 1,681,375 242,401 1,923,776 1,635,484 95 Allowances 2,635,883 2,412,671 160,619 2,573,290 2,317,545 100 Separation Pay 1,120,400 1,105,076 94,042 1,199,118 1,502,238 105 Social Security Tax 2,845,302 2,654,795 161,829 2,816,624 2,666,610 Total Budget Activity 02 72,528,561 67,726,313 4,194,035 71,920,348 67,942,142 Budget Activity 03: Pay And Allowances Of Cadets 110 Academy Cadets 222,635 225,163 225,163 227,488 Total Budget Activity 03 222,635 225,163 225,163 227,488 Budget Activity 04: Subsistence of Enlisted Personnel 115 Basic Allowance for Subsistence 3,787,479 3,407,592 310,866 3,718,458 3,450,657 120 Subsistence-In-Kind 1,789,160 1,394,916 380,838 1,775,754 1,516,577 121 Family Subsistence Supplemental Allowance 1,264 2,176 2,176 1,337 Total Budget Activity 04 5,577,903 4,804,684 691,704 5,496,388 4,968,571
230

MILITARY PERSONNEL, (M-1)
MILITARY PERSONNEL, (M-1)
Department of Defense FY 2015 President's Budget Exhibit M-1 FY 2015 President's Budget Total Obligational Authority (Dollars in Thousands) S FY 2013 FY 2014 FY 2014 FY 2014 FY 2015 e Military Personnel, Grand Total (Base & OCO) Base Enacted OCO Enacted Total Enacted Base c ---------- ---------- ---------- ---------- ---------- - Budget Activity 05: Permanent Change of Station Travel 125 Accession Travel 429,792 366,333 14,162 380,495 366,018 130 Training Travel 324,482 317,928 8,926 326,854 363,438 135 Operational Travel 1,131,311 1,199,747 107,132 1,306,879 1,120,137 140 Rotational Travel 1,720,031 1,455,428 52,663 1,508,091 1,614,549 145 Separation Travel 702,871 632,932 23,012 655,944 690,937 150 Travel of Organized Units 33,366 63,399 622 64,021 52,853 155 Non-Temporary Storage 43,638 41,515 41,515 40,412 160 Temporary Lodging Expense 91,636 87,304 87,304 88,111 165 Other 6,113 6,826 6,826 6,637 Total Budget Activity 05 4,483,240 4,171,412 206,517 4,377,929 4,343,092 Budget Activity 06: Other Military Personnel Costs 170 Apprehension of Military Deserters 1,758 2,034 2,034 1,847 175 Interest on Uniformed Services Savings 13,996 5,845 5,675 11,520 6,094 180 Death Gratuities 119,297 105,900 16,249 122,149 97,000 185 Unemployment Benefits 829,134 494,478 324,846 819,324 486,148 195 Education Benefits 26,890 21,393 21,393 27,684 200 Adoption Expenses 1,492 1,546 1,546 1,485 210 Transportation Subsidy 15,085 19,061 19,061 12,668 212 Reserve Income Replacement Program 79 40 40 215 Partial Dislocation Allowance 2,051 2,450 2,450 2,153 216 SGLI Extra Hazard Payments 197,196 83,901 83,901 217 Reserve Officers Training Corps (ROTC) 157,093 168,676 168,676 150,321 218 Junior ROTC 87,328 77,884 77,884 84,741 219 Traumatic Injury Protection Coverage (T-SGLI) 38,415 35,828 35,828 221 Stop-Loss Retroactive Payments 1,443 240 Cancelled Account Payment 268 Total Budget Activity 06 1,491,525 899,267 466,539 1,365,806 870,141 Total Military Personnel - Active 118,550,800 110,182,859 7,618,853 117,801,712 110,532,098 Less Reimbursables 1,032,246 1,020,421 1,020,421 1,082,290 Total Direct - Active 117,518,554 109,162,438 7,618,853 116,781,291 109,449,808 300 Medicare-Eligible Retiree Health Fund Contribution 6,148,862 5,326,034 177,308 5,503,342 4,794,894 Grand Total Direct - Active Personnel Costs 123,667,416 114,488,472 7,796,161 122,284,633 114,244,702
231

MILITARY PERSONNEL, (M-1)
MILITARY PERSONNEL, (M-1)
Department of Defense FY 2015 President's Budget Exhibit M-1 FY 2015 President's Budget Total Obligational Authority (Dollars in Thousands) S FY 2013 FY 2014 FY 2014 FY 2014 FY 2015 e Reserve Personnel, Grand Total (Base & OCO) Base Enacted OCO Enacted Total Enacted Base c ---------- ---------- ---------- ---------- ---------- - 10 Pay Group A Training (15 Days & Drills 24/48) 2,963,441 2,975,675 8,311 2,983,986 3,117,030 20 Pay Group B Training (Backfill For Active Duty) 174,878 178,719 178,719 204,115 30 Pay Group F Training (Recruits) 462,876 480,073 480,073 524,552 40 Pay Group P Training (Pipeline Recruits) 15,273 11,979 11,979 13,607 60 Mobilization Training 12,331 19,856 19,856 17,559 70 School Training 443,877 417,870 4,966 422,836 362,839 80 Special Training 876,322 658,901 75,252 734,153 527,708 90 Administration and Support 3,658,925 3,589,098 627 3,589,725 3,627,992 95 Platoon Leader Class 6,167 7,770 7,770 6,124 100 Education Benefits 51,894 23,116 23,116 24,738 120 Health Profession Scholarship 169,961 170,866 170,866 179,935 130 Other Programs (Admin & Support) 55,523 65,874 65,874 62,237 Total Budget Activity 01 8,891,468 8,599,797 89,156 8,688,953 8,668,436 Total Direct - Reserve 8,891,468 8,599,797 89,156 8,688,953 8,668,436 300 Medicare-Eligible Retiree Health Fund Contribution 963,613 864,014 864,014 638,428 Grand Total Direct - Reserve Personnel Costs 9,855,081 9,463,811 89,156 9,552,967 9,306,864
232

MILITARY PERSONNEL, (M-1)
MILITARY PERSONNEL, (M-1)
Department of Defense FY 2015 President's Budget Exhibit M-1 FY 2015 President's Budget Total Obligational Authority (Dollars in Thousands) S FY 2013 FY 2014 FY 2014 FY 2014 FY 2015 e National Guard Personnel, Grand Total (Base & OCO) Base Enacted OCO Enacted Total Enacted Base c ---------- ---------- ---------- ---------- ---------- - 10 Pay Group A Training (15 Days & Drills 24/48) 3,349,788 3,267,817 37,857 3,305,674 3,529,758 30 Pay Group F Training (Recruits) 625,877 625,593 625,593 564,284 40 Pay Group P Training (Pipeline Recruits) 54,754 39,962 39,962 53,368 70 School Training 761,055 813,925 13,945 827,870 591,025 80 Special Training 1,311,070 768,430 197,919 966,349 601,429 90 Administration and Support 5,314,614 5,331,652 14,262 5,345,914 5,451,424 100 Education Benefits 114,957 43,540 43,540 48,061 Total Budget Activity 01 11,532,115 10,890,919 263,983 11,154,902 10,839,349 Total Direct - National Guard 11,532,115 10,890,919 263,983 11,154,902 10,839,349 300 Medicare-Eligible Retiree Health Fund Contribution 1,184,431 1,068,325 1,068,325 802,770 Grand Total Direct - National Guard Personnel Costs 12,716,546 11,959,244 263,983 12,223,227 11,642,119 Grand Total Direct - Military Personnel 146,239,043 135,911,527 8,149,300 144,060,827 135,193,685
233

OPERATION AND MAINTENANCE, (O-1)
OPERATION AND MAINTENANCE (O-1)
Department of Defense FY 2015 President's Budget Exhibit O-1 FY 2015 President's Budget (RF Excluded) Total Obligational Authority (Dollars in Thousands) FY 2013 FY 2014 FY 2014 FY 2014 FY 2015 Appropriation Summary (Base & OCO) Base Enacted OCO Enacted Total Enacted Base --------------------- ------------- ------------- ------------- ------------- ------------- Department of the Army Operation & Maintenance, Army 64,804,594 30,643,894 32,369,249 63,013,143 33,240,148 Operation & Maintenance, Army Res 3,022,423 2,940,936 34,674 2,975,610 2,490,569 Operation & Maintenance, ARNG 7,045,166 6,857,530 130,471 6,988,001 6,030,773 Afghanistan Security Forces Fund 4,946,192 4,726,720 4,726,720 Afghanistan Infrastructure Fund 325,000 199,000 199,000 Restoration of the Rocky Mountain Arsenal 3,107 Total Department of the Army 80,146,482 40,442,360 37,460,114 77,902,474 41,761,490 Department of the Navy Operation & Maintenance, Navy 44,788,446 35,843,728 8,470,808 44,314,536 39,316,857 Operation & Maintenance, Marine Corps 9,167,402 5,389,568 3,369,815 8,759,383 5,909,487 Operation & Maintenance, Navy Res 1,194,098 1,158,382 55,700 1,214,082 1,007,100 Operation & Maintenance, MC Reserve 279,345 255,317 12,534 267,851 268,582 Ship Modernization, Operations & Sustainment Fund 178,956 2,244,400 2,244,400 Total Department of the Navy 55,608,247 44,891,395 11,908,857 56,800,252 46,502,026 Department of the Air Force Operation & Maintenance, Air Force 42,904,140 33,117,642 12,746,424 45,864,066 35,331,193 Operation & Maintenance, AF Reserve 2,994,080 3,062,207 32,849 3,095,056 3,015,842 Operation & Maintenance, ANG 6,033,862 6,392,304 22,200 6,414,504 6,392,859 Total Department of the Air Force 51,932,082 42,572,153 12,801,473 55,373,626 44,739,894 Defense-Wide Operation and Maintenance, Defense-Wide 35,973,785 31,147,247 6,226,678 37,373,925 31,198,232 Office of the Inspector General 318,871 316,000 10,766 326,766 311,830 US Court of Appeals for Armed Forces, Def 10,528 13,606 13,606 13,723 Defense Health Program 31,228,372 32,690,271 898,701 33,588,972 31,994,918 Overseas Humanitarian, Disaster, and Civic Aid 108,615 109,500 109,500 100,000 Cooperative Threat Reduction Account 446,235 500,455 500,455 365,108 Contributions to the Cooperative Threat Reduction Program 313 DoD Acquisition Workforce Development Fund 48,643 51,031 51,031 212,875 Total Defense-Wide 68,135,362 64,828,110 7,136,145 71,964,255 64,196,686
234

OPERATION AND MAINTENANCE, (O-1)
OPERATION AND MAINTENANCE (O-1)
Department of Defense FY 2015 President's Budget Exhibit O-1 FY 2015 President's Budget (RF Excluded) Total Obligational Authority (Dollars in Thousands) FY 2013 FY 2014 FY 2014 FY 2014 FY 2015 Appropriation Summary (Base & OCO) Base Enacted OCO Enacted Total Enacted Base --------------------- ------------- ------------- ------------- ------------- ------------- Transfer Accounts Drug Interdiction & Ctr-Drug Activities, Def 391,332 1,015,885 376,305 1,392,190 820,687 Environmental Restoration, Army 298,815 298,815 201,560 Environmental Restoration, Navy 316,103 316,103 277,294 Environmental Restoration, Air Force 439,820 439,820 408,716 Environmental Restoration, Defense 10,757 10,757 8,547 Environmental Restoration Formerly Used Sites 287,443 287,443 208,353 Overseas Contingency Operations Transfer Fund 5,000 Total Transfer Accounts 391,332 2,368,823 376,305 2,745,128 1,930,157 Miscellaneous Accounts Support for International Sporting Competitions , Defense 1,691 10,000 Emergency Response Fund, Defense 5,490 Total Miscellaneous Accounts 7,181 10,000 Indefinite Accounts Disposal of DoD Real Property 19,116 30,878 30,878 5,546 Lease of DoD Real Property 28,958 130,276 130,276 24,629 Total Indefinite Accounts 48,074 161,154 161,154 30,175 Total Operation and Maintenance Title plus Indefinite Accounts 256,268,760 195,263,995 69,682,894 264,946,889 199,170,428 Total Operation and Maintenance Title 256,220,686 195,102,841 69,682,894 264,785,735 199,140,253
235

OPERATION AND MAINTENANCE, (O-1)
OPERATION AND MAINTENANCE (O-1)
Department of Defense FY 2015 President's Budget Exhibit O-1 FY 2015 President's Budget (RF Excluded) Total Obligational Authority (Dollars in Thousands) S FY 2013 FY 2014 FY 2014 FY 2014 FY 2015 e 2020A Operation & Maintenance, Army (Base & OCO) Base Enacted OCO Enacted Total Enacted Base c ---------- ---------- ---------- ---------- ---------- - TOTAL, BA 01: Operating Forces 44,969,934 17,974,947 25,122,361 43,097,308 20,018,734 TOTAL, BA 02: Mobilization 535,784 547,896 547,896 510,848 TOTAL, BA 03: Training and Recruiting 4,541,327 4,612,476 4,612,476 4,386,933 TOTAL, BA 04: Admin & Srvwide Activities 14,757,549 7,508,575 7,246,888 14,755,463 8,323,633 Total Operation & Maintenance, Army 64,804,594 30,643,894 32,369,249 63,013,143 33,240,148 Details: Budget Activity 01: Operating Forces Land Forces 2020A 010 111 Maneuver Units 846,963 460,935 623,449 1,084,384 969,281 U 2020A 020 112 Modular Support Brigades 69,049 69,381 10,624 80,005 61,990 U 2020A 030 113 Echelons Above Brigade 540,077 605,373 62,173 667,546 450,987 U 2020A 040 114 Theater Level Assets 3,628,323 392,425 4,412,215 4,804,640 545,773 U 2020A 050 115 Land Forces Operations Support 1,451,973 463,846 1,450,567 1,914,413 1,057,453 U 2020A 060 116 Aviation Assets 1,042,153 1,188,419 537,945 1,726,364 1,409,347 U Total Land Forces 7,578,538 3,180,379 7,096,973 10,277,352 4,494,831 Land Forces Readiness 2020A 070 121 Force Readiness Operations Support 5,061,036 2,426,188 2,282,755 4,708,943 3,592,334 U 2020A 080 122 Land Forces Systems Readiness 734,355 430,711 675,000 1,105,711 411,388 U 2020A 090 123 Land Forces Depot Maintenance 1,598,057 1,054,682 601,563 1,656,245 1,001,232 U Total Land Forces Readiness 7,393,448 3,911,581 3,559,318 7,470,899 5,004,954 Land Forces Readiness Support 2020A 100 131 Base Operations Support 8,726,710 7,202,768 706,214 7,908,982 7,428,972 U 2020A 110 132 Facilities Sustainment, Restoration & Modernization 2,278,104 2,649,915 2,649,915 2,066,434 U 2020A 120 133 Management and Operational Headquarters 401,891 424,624 424,624 411,863 U 2020A 130 134 Combatant Commanders Core Operations 160,823 178,284 178,284 179,399 U 2020A 140 135 Additional Activities 15,978,737 11,489,498 11,489,498 U 2020A 150 136 Commander’s Emergency Response Program 43,465 30,000 30,000 U 2020A 160 137 RESET 2,024,164 2,240,358 2,240,358 U 2020A 170 138 Combatant Commands Direct Mission Support 384,054 427,396 427,396 432,281 U Total Land Forces Readiness Support 29,997,948 10,882,987 14,466,070 25,349,057 10,518,949 Total, BA 01: Operating Forces 44,969,934 17,974,947 25,122,361 43,097,308 20,018,734 Budget Activity 02: Mobilization Mobility Operations 2020A 180 211 Strategic Mobility 384,714 360,240 360,240 316,776 U 2020A 190 212 Army Prepositioned Stocks 145,108 180,555 180,555 187,609 U
236

OPERATION AND MAINTENANCE, (O-1)
OPERATION AND MAINTENANCE (O-1)
Department of Defense FY 2015 President's Budget Exhibit O-1 FY 2015 President's Budget (RF Excluded) Total Obligational Authority (Dollars in Thousands) S FY 2013 FY 2014 FY 2014 FY 2014 FY 2015 e 2020A Operation & Maintenance, Army (Base & OCO) Base Enacted OCO Enacted Total Enacted Base c ---------- ---------- ---------- ---------- ---------- - 2020A 200 213 Industrial Preparedness 5,962 7,101 7,101 6,463 U Total Mobility Operations 535,784 547,896 547,896 510,848 Total, BA 02: Mobilization 535,784 547,896 547,896 510,848 Budget Activity 03: Training and Recruiting Accession Training 2020A 210 311 Officer Acquisition 99,927 115,880 115,880 124,766 U 2020A 220 312 Recruit Training 57,753 52,093 52,093 51,968 U 2020A 230 313 One Station Unit Training 42,060 43,397 43,397 43,735 U 2020A 240 314 Senior Reserve Officers Training Corps 490,440 441,759 441,759 456,563 U Total Accession Training 690,180 653,129 653,129 677,032 Basic Skill and Advanced Training 2020A 250 321 Specialized Skill Training 871,329 992,236 992,236 886,529 U 2020A 260 322 Flight Training 972,365 950,828 950,828 890,070 U 2020A 270 323 Professional Development Education 156,073 178,533 178,533 193,291 U 2020A 280 324 Training Support 662,464 620,738 620,738 552,359 U Total Basic Skill and Advanced Training 2,662,231 2,742,335 2,742,335 2,522,249 Recruiting, and Other Training & Education 2020A 290 331 Recruiting and Advertising 504,396 474,223 474,223 466,927 U 2020A 300 332 Examining 153,482 159,755 159,755 194,588 U 2020A 310 333 Off-Duty and Voluntary Education 229,641 251,523 251,523 205,782 U 2020A 320 334 Civilian Education and Training 136,812 151,061 151,061 150,571 U 2020A 330 335 Junior Reserve Officer Training Corps 164,585 180,450 180,450 169,784 U Total Recruiting, and Other Training & Education 1,188,916 1,217,012 1,217,012 1,187,652 Total, BA 03: Training and Recruiting 4,541,327 4,612,476 4,612,476 4,386,933 Budget Activity 04: Admin & Srvwide Activities Logistics Operations 2020A 350 421 Servicewide Transportation 4,467,406 427,320 4,801,356 5,228,676 541,877 U 2020A 360 422 Central Supply Activities 753,694 729,754 729,754 722,291 U 2020A 370 423 Logistic Support Activities 639,881 617,345 617,345 602,034 U 2020A 380 424 Ammunition Management 447,146 428,859 17,418 446,277 422,277 U Total Logistics Operations 6,308,127 2,203,278 4,818,774 7,022,052 2,288,479 Servicewide Support 2020A 390 431 Administration 521,960 430,544 430,544 405,442 U 2020A 400 432 Servicewide Communications 1,690,044 990,104 610,000 1,600,104 1,624,742 U 2020A 410 433 Manpower Management 284,608 312,936 312,936 289,771 U
237

OPERATION AND MAINTENANCE, (O-1)
OPERATION AND MAINTENANCE (O-1)
Department of Defense FY 2015 President's Budget Exhibit O-1 FY 2015 President's Budget (RF Excluded) Total Obligational Authority (Dollars in Thousands) S FY 2013 FY 2014 FY 2014 FY 2014 FY 2015 e 2020A Operation & Maintenance, Army (Base & OCO) Base Enacted OCO Enacted Total Enacted Base c ---------- ---------- ---------- ---------- ---------- - 2020A 420 434 Other Personnel Support 298,358 225,614 54,820 280,434 390,924 U 2020A 430 435 Other Service Support 1,109,015 1,195,207 54,000 1,249,207 1,118,540 U 2020A 440 436 Army Claims Activities 207,860 242,146 242,146 241,234 U 2020A 450 437 Real Estate Management 195,930 232,624 306,300 538,924 243,509 U 2020A 460 438 Financial Management and Audit Readiness 193,665 221,632 221,632 200,615 U Total Servicewide Support 4,501,440 3,850,807 1,025,120 4,875,927 4,514,777 Support of Other Nations 2020A 470 441 International Military Headquarters 434,784 447,697 447,697 462,591 U 2020A 480 442 Misc. Support of Other Nations 19,668 26,147 26,147 27,375 U Total Support of Other Nations 454,452 473,844 473,844 489,966 Closed Account Adjustments 2020A 490 451 Closed Account Adjustments 20,748 U 2020A 500 471 Foreign Currency Fluctuation -53,807 U 2020A 510 493 Defense Environmental Restoration Account (DERA) 565,563 U Total Closed Account Adjustments 532,504 Judgment Fund 2020A 520 461 Judgment Fund 1,384 U Total Judgment Fund 1,384 2020A 999 Classified Programs 2,959,642 980,646 1,402,994 2,383,640 1,030,411 U Total, BA 04: Admin & Srvwide Activities 14,757,549 7,508,575 7,246,888 14,755,463 8,323,633 Total Operation & Maintenance, Army 64,804,594 30,643,894 32,369,249 63,013,143 33,240,148
238

OPERATION AND MAINTENANCE, (O-1)
OPERATION AND MAINTENANCE (O-1)
Department of Defense FY 2015 President's Budget Exhibit O-1 FY 2015 President's Budget (RF Excluded) Total Obligational Authority (Dollars in Thousands) S FY 2013 FY 2014 FY 2014 FY 2014 FY 2015 e 2080A Operation & Maintenance, Army Res (Base & OCO) Base Enacted OCO Enacted Total Enacted Base c ---------- ---------- ---------- ---------- ---------- - TOTAL, BA 01: Operating Forces 2,918,404 2,849,789 34,674 2,884,463 2,390,899 TOTAL, BA 04: Admin & Srvwd Activities 104,019 91,147 91,147 99,670 Total Operation & Maintenance, Army Res 3,022,423 2,940,936 34,674 2,975,610 2,490,569 Details: Budget Activity 01: Operating Forces Land Forces 2080A 010 111 Maneuver Units 1,299 1,621 1,621 U 2080A 020 112 Modular Support Brigades 14,467 17,530 17,530 15,200 U 2080A 030 113 Echelons Above Brigade 523,995 607,335 5,401 612,736 502,664 U 2080A 040 114 Theater Level Assets 90,731 107,999 107,999 107,489 U 2080A 050 115 Land Forces Operations Support 585,461 568,882 1,801 570,683 543,989 U 2080A 060 116 Aviation Assets 76,781 77,866 77,866 72,963 U Total Land Forces 1,292,734 1,381,233 7,202 1,388,435 1,242,305 Land Forces Readiness 2080A 070 121 Force Readiness Operations Support 432,545 409,419 608 410,027 360,082 U 2080A 080 122 Land Forces Systems Readiness 83,218 74,237 74,237 72,491 U 2080A 090 123 Land Forces Depot Maintenance 162,073 69,101 69,101 58,873 U Total Land Forces Readiness 677,836 552,757 608 553,365 491,446 Land Forces Readiness Support 2080A 100 131 Base Operations Support 573,867 569,801 26,864 596,665 388,961 U 2080A 110 132 Facilities Sustainment, Restoration & Modernization 320,908 294,145 294,145 228,597 U 2080A 120 133 Management and Operational Headquarters 53,059 51,853 51,853 39,590 U Total Land Forces Readiness Support 947,834 915,799 26,864 942,663 657,148 Total, BA 01: Operating Forces 2,918,404 2,849,789 34,674 2,884,463 2,390,899 Budget Activity 04: Admin & Srvwd Activities Logistics Operations 2080A 130 421 Servicewide Transportation 11,192 10,735 10,735 10,608 U Total Logistics Operations 11,192 10,735 10,735 10,608 Servicewide Support 2080A 140 431 Administration 26,032 23,246 23,246 18,587 U 2080A 150 432 Servicewide Communications 4,238 10,261 10,261 6,681 U 2080A 160 433 Manpower Management 16,140 10,219 10,219 9,192 U
239

OPERATION AND MAINTENANCE, (O-1)
OPERATION AND MAINTENANCE (O-1)
Department of Defense FY 2015 President's Budget Exhibit O-1 FY 2015 President's Budget (RF Excluded) Total Obligational Authority (Dollars in Thousands) S FY 2013 FY 2014 FY 2014 FY 2014 FY 2015 e 2080A Operation & Maintenance, Army Res (Base & OCO) Base Enacted OCO Enacted Total Enacted Base c ---------- ---------- ---------- ---------- ---------- - 2080A 170 434 Recruiting and Advertising 46,417 36,686 36,686 54,602 U Total Servicewide Support 92,827 80,412 80,412 89,062 Total, BA 04: Admin & Srvwd Activities 104,019 91,147 91,147 99,670 Total Operation & Maintenance, Army Res 3,022,423 2,940,936 34,674 2,975,610 2,490,569
240

OPERATION AND MAINTENANCE, (O-1)
OPERATION AND MAINTENANCE (O-1)
Department of Defense FY 2015 President's Budget Exhibit O-1 FY 2015 President's Budget (RF Excluded) Total Obligational Authority (Dollars in Thousands) S FY 2013 FY 2014 FY 2014 FY 2014 FY 2015 e 2065A Operation & Maintenance, ARNG (Base & OCO) Base Enacted OCO Enacted Total Enacted Base c ---------- ---------- ---------- ---------- ---------- - TOTAL, BA 01: Operating Forces 6,636,432 6,471,796 129,848 6,601,644 5,641,302 TOTAL, BA 04: Admin & Srvwd Activities 408,734 385,734 623 386,357 389,471 Total Operation & Maintenance, ARNG 7,045,166 6,857,530 130,471 6,988,001 6,030,773 Details: Budget Activity 01: Operating Forces Land Forces 2065A 010 111 Maneuver Units 610,207 781,306 13,312 794,618 660,648 U 2065A 020 112 Modular Support Brigades 148,007 174,382 631 175,013 165,942 U 2065A 030 113 Echelons Above Brigade 772,456 759,916 14,106 774,022 733,800 U 2065A 040 114 Theater Level Assets 129,808 97,267 608 97,875 83,084 U 2065A 050 115 Land Forces Operations Support 37,976 38,779 38,779 22,005 U 2065A 060 116 Aviation Assets 856,015 906,536 38,548 945,084 920,085 U Total Land Forces 2,554,469 2,758,186 67,205 2,825,391 2,585,564 Land Forces Readiness 2065A 070 121 Force Readiness Operations Support 707,170 758,930 21,526 780,456 680,887 U 2065A 080 122 Land Forces Systems Readiness 52,882 61,383 61,383 69,726 U 2065A 090 123 Land Forces Depot Maintenance 357,030 226,919 226,919 138,263 U Total Land Forces Readiness 1,117,082 1,047,232 21,526 1,068,758 888,876 Land Forces Readiness Support 2065A 100 131 Base Operations Support 1,076,568 1,000,362 33,592 1,033,954 804,517 U 2065A 110 132 Facilities Sustainment, Restoration & Modernization 814,799 693,262 693,262 490,205 U 2065A 120 133 Management and Operational Headquarters 1,073,514 972,754 7,525 980,279 872,140 U Total Land Forces Readiness Support 2,964,881 2,666,378 41,117 2,707,495 2,166,862 Total, BA 01: Operating Forces 6,636,432 6,471,796 129,848 6,601,644 5,641,302 Budget Activity 04: Admin & Srvwd Activities Logistics Operations 2065A 130 421 Servicewide Transportation 7,446 9,899 9,899 6,690 U Total Logistics Operations 7,446 9,899 9,899 6,690 Servicewide Support 2065A 140 437 Real Estate Management 1,491 1,551 1,551 1,765 U Total Servicewide Support 1,491 1,551 1,551 1,765 Servicewide Support 2065A 150 431 Administration 69,507 69,232 69,232 63,075 U
241

OPERATION AND MAINTENANCE, (O-1)
OPERATION AND MAINTENANCE (O-1)
Department of Defense FY 2015 President's Budget Exhibit O-1 FY 2015 President's Budget (RF Excluded) Total Obligational Authority (Dollars in Thousands) S FY 2013 FY 2014 FY 2014 FY 2014 FY 2015 e 2065A Operation & Maintenance, ARNG (Base & OCO) Base Enacted OCO Enacted Total Enacted Base c ---------- ---------- ---------- ---------- ---------- - 2065A 160 432 Servicewide Communications 50,086 40,838 623 41,461 37,372 U 2065A 170 433 Manpower Management 6,043 6,615 6,615 6,484 U 2065A 180 434 Other Personnel Support 274,161 257,599 257,599 274,085 U Total Servicewide Support 399,797 374,284 623 374,907 381,016 Total, BA 04: Admin & Srvwd Activities 408,734 385,734 623 386,357 389,471 Total Operation & Maintenance, ARNG 7,045,166 6,857,530 130,471 6,988,001 6,030,773
242

OPERATION AND MAINTENANCE, (O-1)
OPERATION AND MAINTENANCE (O-1)
Department of Defense FY 2015 President's Budget Exhibit O-1 FY 2015 President's Budget (RF Excluded) Total Obligational Authority (Dollars in Thousands) S FY 2013 FY 2014 FY 2014 FY 2014 FY 2015 e 2091A Afghanistan Security Forces Fund (Base & OCO) Base Enacted OCO Enacted Total Enacted Base c ---------- ---------- ---------- ---------- ---------- - TOTAL, BA 01: Ministry of Defense 3,049,565 3,629,660 3,629,660 TOTAL, BA 02: Ministry of Interior 1,842,975 1,087,335 1,087,335 TOTAL, BA 04: Detainee Ops 53,652 9,725 9,725 Total Afghanistan Security Forces Fund 4,946,192 4,726,720 4,726,720 Details: Budget Activity 01: Ministry of Defense Closed Account Adjustments 2091A 010 100 Afghanistan Security Forces Fund 3,049,565 3,629,660 3,629,660 U Total Closed Account Adjustments 3,049,565 3,629,660 3,629,660 Total, BA 01: Ministry of Defense 3,049,565 3,629,660 3,629,660 Budget Activity 02: Ministry of Interior Closed Account Adjustments 2091A 020 200 Ministry Of Interior 1,842,975 1,087,335 1,087,335 U Total Closed Account Adjustments 1,842,975 1,087,335 1,087,335 Total, BA 02: Ministry of Interior 1,842,975 1,087,335 1,087,335 Budget Activity 04: Detainee Ops Closed Account Adjustments 2091A 030 400 Iraq Training Facility 53,652 9,725 9,725 U Total Closed Account Adjustments 53,652 9,725 9,725 Total, BA 04: Detainee Ops 53,652 9,725 9,725 Total Afghanistan Security Forces Fund 4,946,192 4,726,720 4,726,720
243

OPERATION AND MAINTENANCE, (O-1)
OPERATION AND MAINTENANCE (O-1)
Department of Defense FY 2015 President's Budget Exhibit O-1 FY 2015 President's Budget (RF Excluded) Total Obligational Authority (Dollars in Thousands) S FY 2013 FY 2014 FY 2014 FY 2014 FY 2015 e 2096A Afghanistan Infrastructure Fund (Base & OCO) Base Enacted OCO Enacted Total Enacted Base c ---------- ---------- ---------- ---------- ---------- - TOTAL, BA 01: Afghanistan Infrastructure Fund 325,000 199,000 199,000 Total Afghanistan Infrastructure Fund 325,000 199,000 199,000 Details: Budget Activity 01: Afghanistan Infrastructure Fund Closed Account Adjustments 2096A 010 011 Power 199,000 199,000 U 2096A 020 110 Power 325,000 U Total Closed Account Adjustments 325,000 199,000 199,000 Total, BA 01: Afghanistan Infrastructure Fund 325,000 199,000 199,000 Total Afghanistan Infrastructure Fund 325,000 199,000 199,000
244

OPERATION AND MAINTENANCE, (O-1)
OPERATION AND MAINTENANCE (O-1)
Department of Defense FY 2015 President's Budget Exhibit O-1 FY 2015 President's Budget (RF Excluded) Total Obligational Authority (Dollars in Thousands) S FY 2013 FY 2014 FY 2014 FY 2014 FY 2015 e 5098A Restoration of the Rocky Mountain Arsenal (Base & OCO) Base Enacted OCO Enacted Total Enacted Base c ---------- ---------- ---------- ---------- ---------- - TOTAL, BA 01: RESTORATION OF ROCKY MOUNTAIN ARSENAL 3,107 Total Restoration of the Rocky Mountain Arsenal 3,107 Details: Budget Activity 01: RESTORATION OF ROCKY MOUNTAIN ARSENAL Restoration of the Rocky Mountain Arsenal 5098A 010 580 Restoration of the Rocky Mountain Arsenal 3,107 U Total Restoration of the Rocky Mountain Arsenal 3,107 Total, BA 01: RESTORATION OF ROCKY MOUNTAIN ARSENAL 3,107 Total Restoration of the Rocky Mountain Arsenal 3,107
245

OPERATION AND MAINTENANCE, (O-1)
OPERATION AND MAINTENANCE (O-1)
Department of Defense FY 2015 President's Budget Exhibit O-1 FY 2015 President's Budget (RF Excluded) Total Obligational Authority (Dollars in Thousands) S FY 2013 FY 2014 FY 2014 FY 2014 FY 2015 e 1804N Operation & Maintenance, Navy (Base & OCO) Base Enacted OCO Enacted Total Enacted Base c ---------- ---------- ---------- ---------- ---------- - TOTAL, BA 01: Operating Forces 36,987,044 28,685,744 8,215,652 36,901,396 31,619,155 TOTAL, BA 02: Mobilization 1,458,955 679,781 18,460 698,241 1,223,342 TOTAL, BA 03: Training and Recruiting 1,613,420 1,727,062 55,669 1,782,731 1,737,254 TOTAL, BA 04: Admin & Srvwd Activities 4,729,027 4,751,141 181,027 4,932,168 4,737,106 Total Operation & Maintenance, Navy 44,788,446 35,843,728 8,470,808 44,314,536 39,316,857 Details: Budget Activity 01: Operating Forces Air Operations 1804N 010 1A1A Mission and Other Flight Operations 5,344,864 3,867,460 1,845,169 5,712,629 4,947,202 U 1804N 020 1A2A Fleet Air Training 1,847,179 1,824,704 1,824,704 1,647,943 U 1804N 030 1A3A Aviation Technical Data & Engineering Services 41,678 38,225 600 38,825 37,050 U 1804N 040 1A4A Air Operations and Safety Support 90,065 81,238 17,489 98,727 96,139 U 1804N 050 1A4N Air Systems Support 341,200 359,276 78,491 437,767 363,763 U 1804N 060 1A5A Aircraft Depot Maintenance 1,031,281 794,581 162,420 957,001 814,770 U 1804N 070 1A6A Aircraft Depot Operations Support 38,491 35,445 2,700 38,145 36,494 U 1804N 080 1A9A Aviation Logistics 325,333 369,012 50,130 419,142 350,641 U Total Air Operations 9,060,091 7,369,941 2,156,999 9,526,940 8,294,002 Ship Operations 1804N 090 1B1B Mission and Other Ship Operations 5,289,875 3,272,601 1,559,387 4,831,988 3,865,379 U 1804N 100 1B2B Ship Operations Support & Training 708,492 683,853 20,226 704,079 711,243 U 1804N 110 1B4B Ship Depot Maintenance 6,938,324 4,105,960 2,679,660 6,785,620 5,296,408 U 1804N 120 1B5B Ship Depot Operations Support 1,157,393 1,275,054 1,275,054 1,339,077 U Total Ship Operations 14,094,084 9,337,468 4,259,273 13,596,741 11,212,107 Combat Operations/Support 1804N 130 1C1C Combat Communications 709,650 644,096 37,760 681,856 708,634 U 1804N 140 1C2C Electronic Warfare 64,084 88,409 88,409 91,599 U 1804N 150 1C3C Space Systems and Surveillance 219,150 168,625 168,625 207,038 U 1804N 160 1C4C Warfare Tactics 467,614 424,146 25,351 449,497 432,715 U 1804N 170 1C5C Operational Meteorology and Oceanography 351,524 320,556 20,045 340,601 338,116 U 1804N 180 1C6C Combat Support Forces 2,101,091 906,231 1,212,296 2,118,527 892,316 U 1804N 190 1C7C Equipment Maintenance 129,285 128,764 10,203 138,967 128,486 U 1804N 200 1C8C Depot Operations Support 3,251 2,344 2,344 2,472 U 1804N 210 1CCH Combatant Commanders Core Operations 104,515 95,226 95,226 101,200 U 1804N 220 1CCM Combatant Commanders Direct Mission Support 174,519 198,613 198,613 188,920 U Total Combat Operations/Support 4,324,683 2,977,010 1,305,655 4,282,665 3,091,496 Weapons Support 1804N 230 1D1D Cruise Missile 89,606 85,358 85,358 109,911 U
246

OPERATION AND MAINTENANCE, (O-1)
OPERATION AND MAINTENANCE (O-1)
Department of Defense FY 2015 President's Budget Exhibit O-1 FY 2015 President's Budget (RF Excluded) Total Obligational Authority (Dollars in Thousands) S FY 2013 FY 2014 FY 2014 FY 2014 FY 2015 e 1804N Operation & Maintenance, Navy (Base & OCO) Base Enacted OCO Enacted Total Enacted Base c ---------- ---------- ---------- ---------- ---------- - 1804N 240 1D2D Fleet Ballistic Missile 1,109,152 1,181,578 1,181,578 1,172,823 U 1804N 250 1D3D In-Service Weapons Systems Support 125,942 97,233 127,972 225,205 104,139 U 1804N 260 1D4D Weapons Maintenance 753,326 475,134 241,427 716,561 490,911 U 1804N 270 1D7D Other Weapon Systems Support 281,819 290,967 290,967 324,861 U Total Weapons Support 2,359,845 2,130,270 369,399 2,499,669 2,202,645 Working Capital Fund Support 1804N 280 1Z1Z NWCF Support -442,000 -442,000 U Total Working Capital Fund Support -442,000 -442,000 Base Support 1804N 290 BSIT Enterprise Information 976,243 1,109,081 1,109,081 936,743 U 1804N 300 BSM1 Sustainment, Restoration and Modernization 1,598,393 1,677,653 13,386 1,691,039 1,483,495 U 1804N 310 BSS1 Base Operating Support 4,573,705 4,526,321 110,940 4,637,261 4,398,667 U Total Base Support 7,148,341 7,313,055 124,326 7,437,381 6,818,905 Total, BA 01: Operating Forces 36,987,044 28,685,744 8,215,652 36,901,396 31,619,155 Budget Activity 02: Mobilization Ready Reserve and Prepositioning Force 1804N 320 2A1F Ship Prepositioning and Surge 358,681 330,898 330,898 526,926 U 1804N 330 2A2F Ready Reserve Force 291,195 U Total Ready Reserve and Prepositioning Force 358,681 330,898 330,898 818,121 Activations/Inactivations 1804N 340 2B1G Aircraft Activations/Inactivations 5,219 6,117 6,117 6,704 U 1804N 350 2B2G Ship Activations/Inactivations 1,017,119 255,936 255,936 251,538 U Total Activations/Inactivations 1,022,338 262,053 262,053 258,242 Mobilization Preparation 1804N 360 2C1H Expeditionary Health Services Systems 53,271 61,201 18,460 79,661 124,323 U 1804N 370 2C2H Industrial Readiness 1,952 2,410 2,410 2,323 U 1804N 380 2C3H Coast Guard Support 22,713 23,219 23,219 20,333 U Total Mobilization Preparation 77,936 86,830 18,460 105,290 146,979 Total, BA 02: Mobilization 1,458,955 679,781 18,460 698,241 1,223,342 Budget Activity 03: Training and Recruiting Accession Training 1804N 390 3A1J Officer Acquisition 141,632 142,625 142,625 156,214 U 1804N 400 3A2J Recruit Training 10,036 9,311 9,311 8,863 U
247

OPERATION AND MAINTENANCE, (O-1)
OPERATION AND MAINTENANCE (O-1)
Department of Defense FY 2015 President's Budget Exhibit O-1 FY 2015 President's Budget (RF Excluded) Total Obligational Authority (Dollars in Thousands) S FY 2013 FY 2014 FY 2014 FY 2014 FY 2015 e 1804N Operation & Maintenance, Navy (Base & OCO) Base Enacted OCO Enacted Total Enacted Base c ---------- ---------- ---------- ---------- ---------- - 1804N 410 3A3J Reserve Officers Training Corps 132,102 138,504 138,504 148,150 U Total Accession Training 283,770 290,440 290,440 313,227 Basic Skill and Advanced Training 1804N 420 3B1K Specialized Skill Training 600,681 611,249 50,269 661,518 601,501 U 1804N 430 3B2K Flight Training 7,149 9,194 9,194 8,239 U 1804N 440 3B3K Professional Development Education 152,156 162,706 162,706 164,214 U 1804N 450 3B4K Training Support 144,525 157,145 5,400 162,545 182,619 U Total Basic Skill and Advanced Training 904,511 940,294 55,669 995,963 956,573 Recruiting and Other Training & Education 1804N 460 3C1L Recruiting and Advertising 184,450 230,954 230,954 230,589 U 1804N 470 3C3L Off-Duty and Voluntary Education 130,406 139,524 139,524 115,595 U 1804N 480 3C4L Civilian Education and Training 59,463 74,647 74,647 79,606 U 1804N 490 3C5L Junior ROTC 50,820 51,203 51,203 41,664 U Total Recruiting and Other Training & Education 425,139 496,328 496,328 467,454 Total, BA 03: Training and Recruiting 1,613,420 1,727,062 55,669 1,782,731 1,737,254 Budget Activity 04: Admin & Srvwd Activities Servicewide Support 1804N 500 4A1M Administration 740,507 858,103 2,418 860,521 858,871 U 1804N 510 4A2M External Relations 11,669 12,611 516 13,127 12,807 U 1804N 520 4A3M Civilian Manpower and Personnel Management 116,964 113,062 113,062 119,863 U 1804N 530 4A4M Military Manpower and Personnel Management 198,389 363,552 5,107 368,659 356,113 U 1804N 540 4A5M Other Personnel Support 246,672 264,740 1,411 266,151 255,605 U 1804N 550 4A6M Servicewide Communications 310,804 305,563 2,545 308,108 339,802 U 1804N 560 4A8M Medical Activities 22,473 U Total Servicewide Support 1,647,478 1,917,631 11,997 1,929,628 1,943,061 Logistics Operations and Technical Support 1804N 570 4B1N Servicewide Transportation 330,677 207,128 153,427 360,555 172,203 U 1804N 580 4B2E Environmental Programs 287,239 U 1804N 590 4B2N Planning, Engineering and Design 266,656 275,986 275,986 283,621 U 1804N 600 4B3N Acquisition and Program Management 1,013,081 1,122,422 8,570 1,130,992 1,111,464 U 1804N 610 4B5N Hull, Mechanical and Electrical Support 50,742 48,952 48,952 43,232 U 1804N 620 4B6N Combat/Weapons Systems 20,813 25,090 25,090 25,689 U 1804N 630 4B7N Space and Electronic Warfare Systems 56,927 70,833 70,833 73,159 U Total Logistics Operations and Technical Support 2,026,135 1,750,411 161,997 1,912,408 1,709,368 Investigations and Security Programs 1804N 640 4C1P Naval Investigative Service 533,932 534,581 1,425 536,006 548,640 U Total Investigations and Security Programs 533,932 534,581 1,425 536,006 548,640
248

OPERATION AND MAINTENANCE, (O-1)
OPERATION AND MAINTENANCE (O-1)
Department of Defense FY 2015 President's Budget Exhibit O-1 FY 2015 President's Budget (RF Excluded) Total Obligational Authority (Dollars in Thousands) S FY 2013 FY 2014 FY 2014 FY 2014 FY 2015 e 1804N Operation & Maintenance, Navy (Base & OCO) Base Enacted OCO Enacted Total Enacted Base c ---------- ---------- ---------- ---------- ---------- - Support of Other Nations 1804N 700 4D1Q International Headquarters and Agencies 4,521 4,907 4,907 4,713 U Total Support of Other Nations 4,521 4,907 4,907 4,713 Cancelled Accounts 1804N 710 4EMM Cancelled Account Adjustments 3,309 U 1804N 720 4EPJ Judgement Fund 577 U Total Cancelled Accounts 3,886 1804N 999 Classified Programs 513,075 543,611 5,608 549,219 531,324 U Total, BA 04: Admin & Srvwd Activities 4,729,027 4,751,141 181,027 4,932,168 4,737,106 Total Operation & Maintenance, Navy 44,788,446 35,843,728 8,470,808 44,314,536 39,316,857
249

OPERATION AND MAINTENANCE, (O-1)
OPERATION AND MAINTENANCE (O-1)
Department of Defense FY 2015 President's Budget Exhibit O-1 FY 2015 President's Budget (RF Excluded) Total Obligational Authority (Dollars in Thousands) S FY 2013 FY 2014 FY 2014 FY 2014 FY 2015 e 1106N Operation & Maintenance, Marine Corps (Base & OCO) Base Enacted OCO Enacted Total Enacted Base c ---------- ---------- ---------- ---------- ---------- - TOTAL, BA 01: Operating Forces 7,572,533 4,169,802 2,891,490 7,061,292 4,701,049 TOTAL, BA 03: Training and Recruiting 842,521 723,693 108,270 831,963 694,250 TOTAL, BA 04: Admin & Srvwd Activities 752,348 496,073 370,055 866,128 514,188 Total Operation & Maintenance, Marine Corps 9,167,402 5,389,568 3,369,815 8,759,383 5,909,487 Details: Budget Activity 01: Operating Forces Expeditionary Forces 1106N 010 1A1A Operational Forces 2,143,655 656,219 1,192,190 1,848,409 905,744 U 1106N 020 1A2A Field Logistics 1,573,652 829,411 559,574 1,388,985 921,543 U 1106N 030 1A3A Depot Maintenance 608,170 223,337 570,000 793,337 229,058 U Total Expeditionary Forces 4,325,477 1,708,967 2,321,764 4,030,731 2,056,345 USMC Prepositioning 1106N 040 1B1B Maritime Prepositioning 89,069 97,446 97,446 87,660 U Total USMC Prepositioning 89,069 97,446 97,446 87,660 Base Support 1106N 050 BSM1 Sustainment, Restoration & Modernization 865,170 759,500 759,500 573,926 U 1106N 060 BSS1 Base Operating Support 2,292,817 1,603,889 569,726 2,173,615 1,983,118 U Total Base Support 3,157,987 2,363,389 569,726 2,933,115 2,557,044 Total, BA 01: Operating Forces 7,572,533 4,169,802 2,891,490 7,061,292 4,701,049 Budget Activity 03: Training and Recruiting Accession Training 1106N 070 3A1C Recruit Training 17,154 17,564 17,564 18,227 U 1106N 080 3A2C Officer Acquisition 860 920 920 948 U Total Accession Training 18,014 18,484 18,484 19,175 Basic Skill and Advanced Training 1106N 090 3B1D Specialized Skill Training 78,462 98,867 98,867 98,448 U 1106N 100 3B3D Professional Development Education 36,490 45,750 45,750 42,305 U 1106N 110 3B4D Training Support 461,123 332,649 108,270 440,919 330,156 U Total Basic Skill and Advanced Training 576,075 477,266 108,270 585,536 470,909 Recruiting and Other Training & Education 1106N 120 3C1F Recruiting and Advertising 172,583 153,036 153,036 161,752 U 1106N 130 3C2F Off-Duty and Voluntary Education 55,994 51,914 51,914 19,137 U
250

OPERATION AND MAINTENANCE, (O-1)
OPERATION AND MAINTENANCE (O-1)
Department of Defense FY 2015 President's Budget Exhibit O-1 FY 2015 President's Budget (RF Excluded) Total Obligational Authority (Dollars in Thousands) S FY 2013 FY 2014 FY 2014 FY 2014 FY 2015 e 1106N Operation & Maintenance, Marine Corps (Base & OCO) Base Enacted OCO Enacted Total Enacted Base c ---------- ---------- ---------- ---------- ---------- - 1106N 140 3C3F Junior ROTC 19,855 22,993 22,993 23,277 U Total Recruiting and Other Training & Education 248,432 227,943 227,943 204,166 Total, BA 03: Training and Recruiting 842,521 723,693 108,270 831,963 694,250 Budget Activity 04: Admin & Srvwd Activities Servicewide Support 1106N 150 4A3G Servicewide Transportation 270,582 43,816 365,555 409,371 36,359 U 1106N 160 4A4G Administration 322,487 3,675 326,162 362,608 U 1106N 180 4B3N Acquisition and Program Management 81,339 83,605 83,605 70,515 U Total Servicewide Support 351,921 449,908 369,230 819,138 469,482 1106N 999 Classified Programs 400,427 46,165 825 46,990 44,706 U Total, BA 04: Admin & Srvwd Activities 752,348 496,073 370,055 866,128 514,188 Total Operation & Maintenance, Marine Corps 9,167,402 5,389,568 3,369,815 8,759,383 5,909,487
251

OPERATION AND MAINTENANCE, (O-1)
OPERATION AND MAINTENANCE (O-1)
Department of Defense FY 2015 President's Budget Exhibit O-1 FY 2015 President's Budget (RF Excluded) Total Obligational Authority (Dollars in Thousands) S FY 2013 FY 2014 FY 2014 FY 2014 FY 2015 e 1806N Operation & Maintenance, Navy Res (Base & OCO) Base Enacted OCO Enacted Total Enacted Base c ---------- ---------- ---------- ---------- ---------- - TOTAL, BA 01: Operating Forces 1,173,600 1,136,970 55,700 1,192,670 986,029 TOTAL, BA 04: Admin & Srvwd Activities 20,498 21,412 21,412 21,071 Total Operation & Maintenance, Navy Res 1,194,098 1,158,382 55,700 1,214,082 1,007,100 Details: Budget Activity 01: Operating Forces Air Operations 1806N 010 1A1A Mission and Other Flight Operations 597,963 569,845 17,196 587,041 565,842 U 1806N 020 1A3A Intermediate Maintenance 12,899 7,008 200 7,208 5,948 U 1806N 030 1A4A Air Operations and Safety Support 1,070 U 1806N 040 1A5A Aircraft Depot Maintenance 114,902 96,657 6,000 102,657 82,636 U 1806N 050 1A6A Aircraft Depot Operations Support 334 305 305 353 U 1806N 060 1A9A Aviation Logistics 3,927 3,927 7,007 U Total Air Operations 727,168 677,742 23,396 701,138 661,786 Ship Operations 1806N 070 1B1B Mission and Other Ship Operations 76,355 75,933 12,304 88,237 8,190 U 1806N 080 1B2B Ship Operations Support & Training 524 588 588 556 U 1806N 090 1B4B Ship Depot Maintenance 40,025 43,062 6,790 49,852 4,571 U Total Ship Operations 116,904 119,583 19,094 138,677 13,317 Combat Operations/Support 1806N 100 1C1C Combat Communications 15,233 14,877 14,877 14,472 U 1806N 110 1C6C Combat Support Forces 119,366 112,057 13,210 125,267 119,056 U Total Combat Operations/Support 134,599 126,934 13,210 140,144 133,528 Weapons Support 1806N 120 1D4D Weapons Maintenance 1,967 1,967 1,967 1,852 U Total Weapons Support 1,967 1,967 1,967 1,852 Base Support 1806N 130 BSIT Enterprise Information 44,987 39,356 39,356 25,354 U 1806N 140 BSMR Sustainment, Restoration and Modernization 54,696 61,784 61,784 48,271 U 1806N 150 BSSR Base Operating Support 93,279 109,604 109,604 101,921 U Total Base Support 192,962 210,744 210,744 175,546 Total, BA 01: Operating Forces 1,173,600 1,136,970 55,700 1,192,670 986,029
252

OPERATION AND MAINTENANCE, (O-1)
OPERATION AND MAINTENANCE (O-1)
Department of Defense FY 2015 President's Budget Exhibit O-1 FY 2015 President's Budget (RF Excluded) Total Obligational Authority (Dollars in Thousands) S FY 2013 FY 2014 FY 2014 FY 2014 FY 2015 e 1806N Operation & Maintenance, Navy Res (Base & OCO) Base Enacted OCO Enacted Total Enacted Base c ---------- ---------- ---------- ---------- ---------- - Budget Activity 04: Admin & Srvwd Activities Servicewide Support 1806N 160 4A1M Administration 1,276 1,605 1,605 1,520 U 1806N 170 4A4M Military Manpower and Personnel Management 13,840 14,193 14,193 12,998 U 1806N 180 4A6M Servicewide Communications 2,384 2,485 2,485 3,395 U Total Servicewide Support 17,500 18,283 18,283 17,913 Logistics Operations and Technical Support 1806N 190 4B3N Acquisition and Program Management 2,954 3,129 3,129 3,158 U Total Logistics Operations and Technical Support 2,954 3,129 3,129 3,158 Cancelled Accounts 1806N 200 4EMM Cancelled Account Adjustments 44 U Total Cancelled Accounts 44 Total, BA 04: Admin & Srvwd Activities 20,498 21,412 21,412 21,071 Total Operation & Maintenance, Navy Res 1,194,098 1,158,382 55,700 1,214,082 1,007,100 Department of Defense FY 2015 President's Budget
253
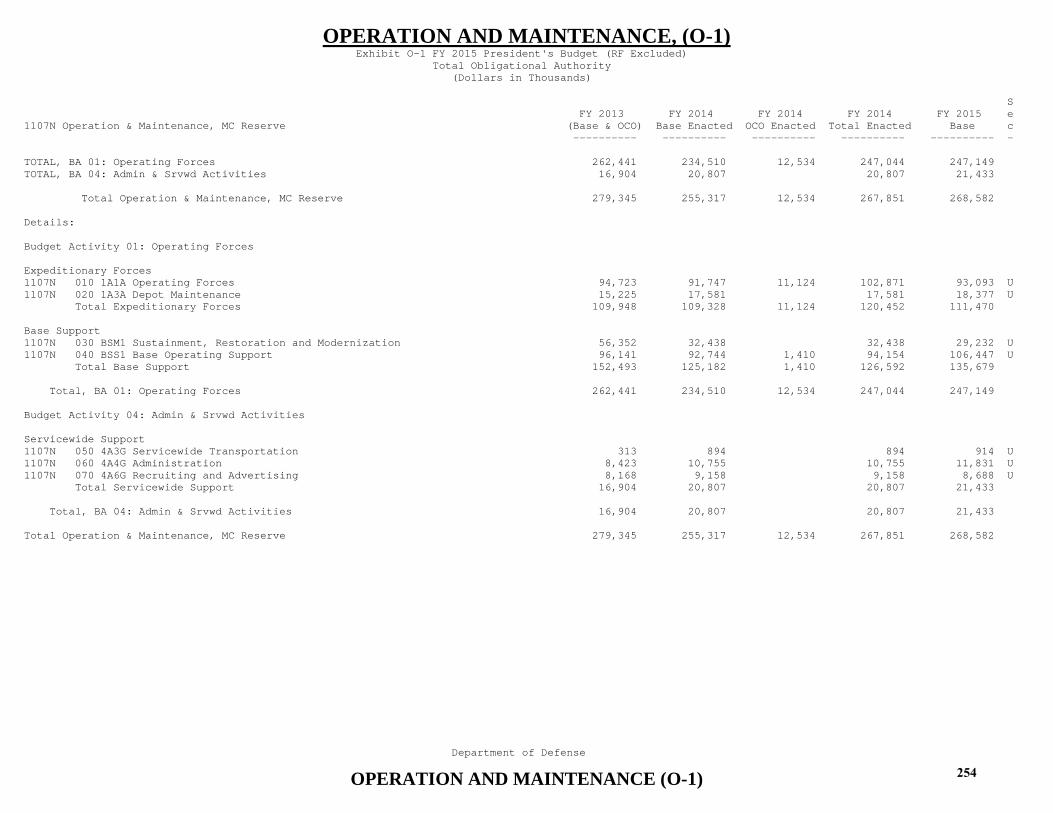
OPERATION AND MAINTENANCE, (O-1)
OPERATION AND MAINTENANCE (O-1)
Exhibit O-1 FY 2015 President's Budget (RF Excluded) Total Obligational Authority (Dollars in Thousands) S FY 2013 FY 2014 FY 2014 FY 2014 FY 2015 e 1107N Operation & Maintenance, MC Reserve (Base & OCO) Base Enacted OCO Enacted Total Enacted Base c ---------- ---------- ---------- ---------- ---------- - TOTAL, BA 01: Operating Forces 262,441 234,510 12,534 247,044 247,149 TOTAL, BA 04: Admin & Srvwd Activities 16,904 20,807 20,807 21,433 Total Operation & Maintenance, MC Reserve 279,345 255,317 12,534 267,851 268,582 Details: Budget Activity 01: Operating Forces Expeditionary Forces 1107N 010 1A1A Operating Forces 94,723 91,747 11,124 102,871 93,093 U 1107N 020 1A3A Depot Maintenance 15,225 17,581 17,581 18,377 U Total Expeditionary Forces 109,948 109,328 11,124 120,452 111,470 Base Support 1107N 030 BSM1 Sustainment, Restoration and Modernization 56,352 32,438 32,438 29,232 U 1107N 040 BSS1 Base Operating Support 96,141 92,744 1,410 94,154 106,447 U Total Base Support 152,493 125,182 1,410 126,592 135,679 Total, BA 01: Operating Forces 262,441 234,510 12,534 247,044 247,149 Budget Activity 04: Admin & Srvwd Activities Servicewide Support 1107N 050 4A3G Servicewide Transportation 313 894 894 914 U 1107N 060 4A4G Administration 8,423 10,755 10,755 11,831 U 1107N 070 4A6G Recruiting and Advertising 8,168 9,158 9,158 8,688 U Total Servicewide Support 16,904 20,807 20,807 21,433 Total, BA 04: Admin & Srvwd Activities 16,904 20,807 20,807 21,433 Total Operation & Maintenance, MC Reserve 279,345 255,317 12,534 267,851 268,582 Department of Defense
254

OPERATION AND MAINTENANCE, (O-1)
OPERATION AND MAINTENANCE (O-1)
FY 2015 President's Budget Exhibit O-1 FY 2015 President's Budget (RF Excluded) Total Obligational Authority (Dollars in Thousands) S FY 2013 FY 2014 FY 2014 FY 2014 FY 2015 e 0513N Ship Modernization, Operations & Sustainment Fund (Base & OCO) Base Enacted OCO Enacted Total Enacted Base c ---------- ---------- ---------- ---------- ---------- - TOTAL, BA 01: Operating Forces 178,956 2,244,400 2,244,400 Total Ship Modernization, Operations & Sustainment Fund 178,956 2,244,400 2,244,400 Details: Budget Activity 01: Operating Forces Servicewide Support 0513N 010 041 Ship Modernization, Operations & Sustainment Fund 178,956 2,244,400 2,244,400 U Total Servicewide Support 178,956 2,244,400 2,244,400 Total, BA 01: Operating Forces 178,956 2,244,400 2,244,400 Total Ship Modernization, Operations & Sustainment Fund 178,956 2,244,400 2,244,400 Department of Defense
255

OPERATION AND MAINTENANCE, (O-1)
OPERATION AND MAINTENANCE (O-1)
FY 2015 President's Budget Exhibit O-1 FY 2015 President's Budget (RF Excluded) Total Obligational Authority (Dollars in Thousands) S FY 2013 FY 2014 FY 2014 FY 2014 FY 2015 e 3400F Operation & Maintenance, Air Force (Base & OCO) Base Enacted OCO Enacted Total Enacted Base c ---------- ---------- ---------- ---------- ---------- - TOTAL, BA 01: Operating Forces 23,361,673 19,541,752 7,059,151 26,600,903 20,965,005 TOTAL, BA 02: Mobilization 7,956,440 3,631,358 4,601,634 8,232,992 4,505,541 TOTAL, BA 03: Training and Recruiting 3,465,051 3,548,036 34,889 3,582,925 3,300,974 TOTAL, BA 04: Admin & Srvwd Activities 8,120,976 6,396,496 1,050,750 7,447,246 6,559,673 Total Operation & Maintenance, Air Force 42,904,140 33,117,642 12,746,424 45,864,066 35,331,193 Details: Budget Activity 01: Operating Forces Air Operations 3400F 010 011A Primary Combat Forces 4,260,604 1,938,831 2,994,593 4,933,424 3,163,457 U 3400F 020 011C Combat Enhancement Forces 2,086,077 1,616,181 802,104 2,418,285 1,694,339 U 3400F 030 011D Air Operations Training (OJT, Maintain Skills) 1,135,790 1,230,571 14,118 1,244,689 1,579,178 U 3400F 040 011M Depot Maintenance 6,033,687 5,909,500 1,373,480 7,282,980 6,119,522 U 3400F 050 011R Facilities Sustainment, Restoration & Modernization 1,296,367 1,593,362 122,712 1,716,074 1,453,589 U 3400F 060 011Z Base Support 4,170,436 2,669,057 1,520,333 4,189,390 2,599,419 U Total Air Operations 18,982,961 14,957,502 6,827,340 21,784,842 16,609,504 Combat Related Operations 3400F 070 012A Global C3I and Early Warning 1,114,887 868,503 31,582 900,085 908,790 U 3400F 080 012C Other Combat Ops Spt Programs 932,859 904,974 140,524 1,045,498 856,306 U 3400F 090 012F Tactical Intel and Other Special Activities 556,888 720,349 720,349 800,689 U Total Combat Related Operations 2,604,634 2,493,826 172,106 2,665,932 2,565,785 Space Operations 3400F 100 013A Launch Facilities 243,729 285,929 857 286,786 282,710 U 3400F 110 013C Space Control Systems 388,288 427,042 8,353 435,395 397,818 U Total Space Operations 632,017 712,971 9,210 722,181 680,528 COCOM 3400F 120 015A Combatant Commanders Direct Mission Support 913,233 1,145,623 50,495 1,196,118 871,840 U 3400F 130 015B Combatant Commanders Core Operations 228,828 231,830 231,830 237,348 U Total COCOM 1,142,061 1,377,453 50,495 1,427,948 1,109,188 Total, BA 01: Operating Forces 23,361,673 19,541,752 7,059,151 26,600,903 20,965,005 Budget Activity 02: Mobilization Mobility Operations 3400F 140 021A Airlift Operations 4,606,277 1,592,902 3,591,133 5,184,035 1,968,810 U 3400F 150 021D Mobilization Preparedness 211,883 144,336 47,897 192,233 139,743 U 3400F 160 021M Depot Maintenance 2,098,857 1,072,008 887,179 1,959,187 1,534,560 U Department of Defense
256

OPERATION AND MAINTENANCE, (O-1)
OPERATION AND MAINTENANCE (O-1)
FY 2015 President's Budget Exhibit O-1 FY 2015 President's Budget (RF Excluded) Total Obligational Authority (Dollars in Thousands) S FY 2013 FY 2014 FY 2014 FY 2014 FY 2015 e 3400F Operation & Maintenance, Air Force (Base & OCO) Base Enacted OCO Enacted Total Enacted Base c ---------- ---------- ---------- ---------- ---------- - 3400F 170 021R Facilities Sustainment, Restoration & Modernization 408,191 144,212 7,043 151,255 173,627 U 3400F 180 021Z Base Support 631,232 677,900 68,382 746,282 688,801 U Total Mobility Operations 7,956,440 3,631,358 4,601,634 8,232,992 4,505,541 Total, BA 02: Mobilization 7,956,440 3,631,358 4,601,634 8,232,992 4,505,541 Budget Activity 03: Training and Recruiting Accession Training 3400F 190 031A Officer Acquisition 104,999 97,094 100 97,194 82,396 U 3400F 200 031B Recruit Training 10,598 17,431 478 17,909 19,852 U 3400F 210 031D Reserve Officers Training Corps (ROTC) 72,699 93,313 93,313 76,134 U 3400F 220 031R Facilities Sustainment, Restoration & Modernization 309,461 217,011 217,011 212,226 U 3400F 230 031Z Base Support 793,271 770,691 19,256 789,947 759,809 U Total Accession Training 1,291,028 1,195,540 19,834 1,215,374 1,150,417 Basic Skill and Advanced Training 3400F 240 032A Specialized Skill Training 338,552 398,140 12,845 410,985 356,157 U 3400F 250 032B Flight Training 689,164 791,946 731 792,677 697,594 U 3400F 260 032C Professional Development Education 190,291 248,328 607 248,935 219,441 U 3400F 270 032D Training Support 103,542 104,859 720 105,579 91,001 U 3400F 280 032M Depot Maintenance 299,928 319,331 319,331 316,688 U Total Basic Skill and Advanced Training 1,621,477 1,862,604 14,903 1,877,507 1,680,881 Recruiting, and Other Training & Education 3400F 290 033A Recruiting and Advertising 128,383 120,372 120,372 73,920 U 3400F 300 033B Examining 3,515 3,535 3,535 3,121 U 3400F 310 033C Off-Duty and Voluntary Education 214,563 134,014 152 134,166 181,718 U 3400F 320 033D Civilian Education and Training 146,921 165,800 165,800 147,667 U 3400F 330 033E Junior ROTC 59,164 66,171 66,171 63,250 U Total Recruiting, and Other Training & Education 552,546 489,892 152 490,044 469,676 Total, BA 03: Training and Recruiting 3,465,051 3,548,036 34,889 3,582,925 3,300,974 Budget Activity 04: Admin & Srvwd Activities Logistics Operations 3400F 340 041A Logistics Operations 1,173,328 566,482 586,273 1,152,755 1,003,513 U 3400F 350 041B Technical Support Activities 788,362 918,080 2,511 920,591 843,449 U 3400F 360 041M Depot Maintenance 37,463 60,507 60,507 78,126 U 3400F 370 041R Facilities Sustainment, Restoration & Modernization 297,916 264,563 264,563 247,677 U 3400F 380 041Z Base Support 1,144,417 1,150,037 19,887 1,169,924 1,103,442 U Total Logistics Operations 3,441,486 2,959,669 608,671 3,568,340 3,276,207 Department of Defense FY 2015 President's Budget
257

OPERATION AND MAINTENANCE, (O-1)
OPERATION AND MAINTENANCE (O-1)
Exhibit O-1 FY 2015 President's Budget (RF Excluded) Total Obligational Authority (Dollars in Thousands) S FY 2013 FY 2014 FY 2014 FY 2014 FY 2015 e 3400F Operation & Maintenance, Air Force (Base & OCO) Base Enacted OCO Enacted Total Enacted Base c ---------- ---------- ---------- ---------- ---------- - Servicewide Activities 3400F 390 042A Administration 733,700 582,313 3,493 585,806 597,234 U 3400F 400 042B Servicewide Communications 737,180 568,337 152,086 720,423 506,840 U 3400F 410 042G Other Servicewide Activities 1,993,364 970,039 269,825 1,239,864 892,256 U 3400F 420 042I Civil Air Patrol 28,404 28,400 28,400 24,981 U 3400F 430 042N Judgement Fund Reimbursement 516 U Total Servicewide Activities 3,493,164 2,149,089 425,404 2,574,493 2,021,311 Support to Other Nations 3400F 450 044A International Support 54,283 88,176 117 88,293 92,419 U Total Support to Other Nations 54,283 88,176 117 88,293 92,419 3400F 999 Classified Programs 1,132,043 1,199,562 16,558 1,216,120 1,169,736 U Total, BA 04: Admin & Srvwd Activities 8,120,976 6,396,496 1,050,750 7,447,246 6,559,673 Total Operation & Maintenance, Air Force 42,904,140 33,117,642 12,746,424 45,864,066 35,331,193 Department of Defense
258

OPERATION AND MAINTENANCE, (O-1)
OPERATION AND MAINTENANCE (O-1)
FY 2015 President's Budget Exhibit O-1 FY 2015 President's Budget (RF Excluded) Total Obligational Authority (Dollars in Thousands) S FY 2013 FY 2014 FY 2014 FY 2014 FY 2015 e 3740F Operation & Maintenance, AF Reserve (Base & OCO) Base Enacted OCO Enacted Total Enacted Base c ---------- ---------- ---------- ---------- ---------- - TOTAL, BA 01: Operating Forces 2,879,844 2,957,005 32,849 2,989,854 2,914,538 TOTAL, BA 04: Administration And Servicewide Activities 114,236 105,202 105,202 101,304 Total Operation & Maintenance, AF Reserve 2,994,080 3,062,207 32,849 3,095,056 3,015,842 Details: Budget Activity 01: Operating Forces Air Operations 3740F 010 011A Primary Combat Forces 1,774,920 1,803,766 1,803,766 1,719,467 U 3740F 020 011G Mission Support Operations 124,691 210,316 210,316 211,132 U 3740F 030 011M Depot Maintenance 428,874 501,182 26,599 527,781 530,301 U 3740F 040 011R Facilities Sustainment, Restoration & Modernization 119,570 89,704 89,704 85,672 U 3740F 050 011Z Base Support 431,789 352,037 6,250 358,287 367,966 U Total Air Operations 2,879,844 2,957,005 32,849 2,989,854 2,914,538 Total, BA 01: Operating Forces 2,879,844 2,957,005 32,849 2,989,854 2,914,538 Budget Activity 04: Administration And Servicewide Activities Servicewide Activities 3740F 060 042A Administration 67,258 62,059 62,059 59,899 U 3740F 070 042J Recruiting and Advertising 24,691 14,591 14,591 14,509 U 3740F 080 042K Military Manpower and Pers Mgmt (ARPC) 14,015 21,115 21,115 20,345 U 3740F 090 042L Other Pers Support (Disability Comp) 7,566 6,618 6,618 6,551 U 3740F 100 042M Audiovisual 706 819 819 U Total Servicewide Activities 114,236 105,202 105,202 101,304 Total, BA 04: Administration And Servicewide Activities 114,236 105,202 105,202 101,304 Total Operation & Maintenance, AF Reserve 2,994,080 3,062,207 32,849 3,095,056 3,015,842 Department of Defense
259

OPERATION AND MAINTENANCE, (O-1)
OPERATION AND MAINTENANCE (O-1)
FY 2015 President's Budget Exhibit O-1 FY 2015 President's Budget (RF Excluded) Total Obligational Authority (Dollars in Thousands) S FY 2013 FY 2014 FY 2014 FY 2014 FY 2015 e 3840F Operation & Maintenance, ANG (Base & OCO) Base Enacted OCO Enacted Total Enacted Base c ---------- ---------- ---------- ---------- ---------- - TOTAL, BA 01: Operating Forces 5,947,924 6,327,602 22,200 6,349,802 6,333,859 TOTAL, BA 04: Administration And Service-Wide Activities 85,938 64,702 64,702 59,000 Total Operation & Maintenance, ANG 6,033,862 6,392,304 22,200 6,414,504 6,392,859 Details: Budget Activity 01: Operating Forces Air Operations 3840F 010 011F Aircraft Operations 2,736,261 3,167,877 3,167,877 3,367,729 U 3840F 020 011G Mission Support Operations 678,113 710,599 22,200 732,799 718,295 U 3840F 030 011M Depot Maintenance 1,560,385 1,554,870 1,554,870 1,528,695 U 3840F 040 011R Facilities Sustainment, Restoration & Modernization 296,434 296,953 296,953 137,604 U 3840F 050 011Z Base Support 676,731 597,303 597,303 581,536 U Total Air Operations 5,947,924 6,327,602 22,200 6,349,802 6,333,859 Total, BA 01: Operating Forces 5,947,924 6,327,602 22,200 6,349,802 6,333,859 Budget Activity 04: Administration And Service-Wide Activities Servicewide Activities 3840F 060 042A Administration 46,502 32,117 32,117 27,812 U 3840F 070 042J Recruiting and Advertising 39,436 32,585 32,585 31,188 U Total Servicewide Activities 85,938 64,702 64,702 59,000 Total, BA 04: Administration And Service-Wide Activities 85,938 64,702 64,702 59,000 Total Operation & Maintenance, ANG 6,033,862 6,392,304 22,200 6,414,504 6,392,859 Department of Defense
260
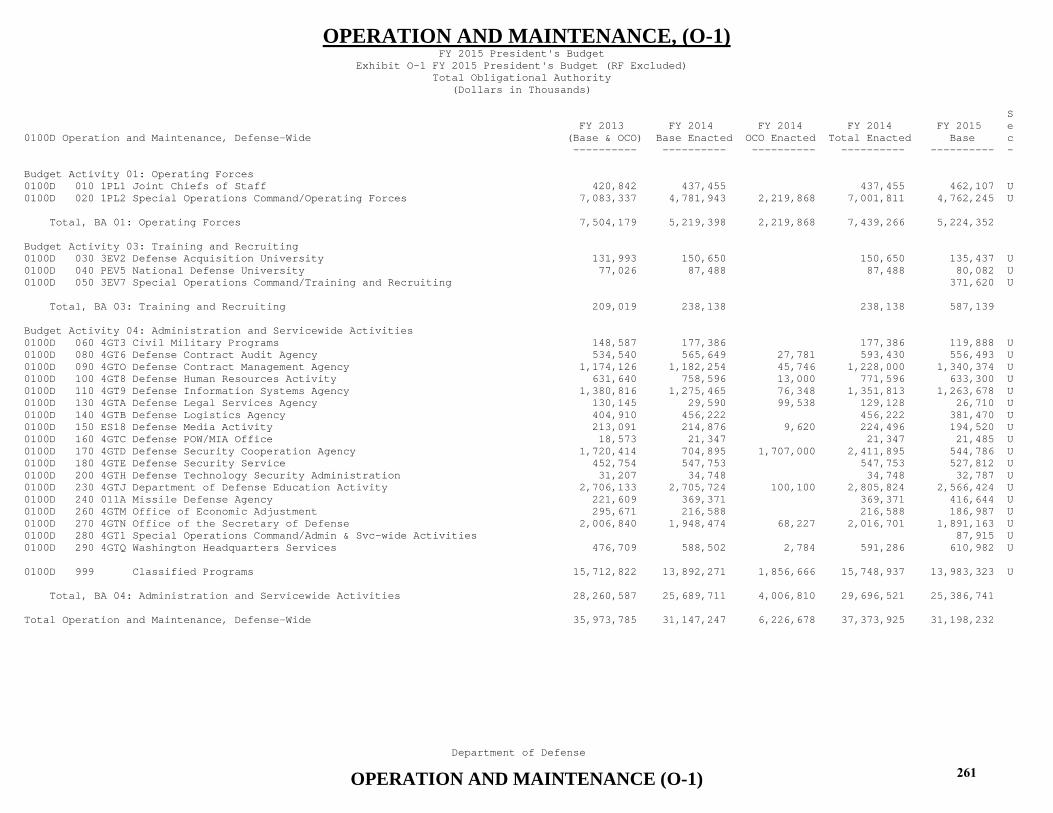
OPERATION AND MAINTENANCE, (O-1)
OPERATION AND MAINTENANCE (O-1)
FY 2015 President's Budget Exhibit O-1 FY 2015 President's Budget (RF Excluded) Total Obligational Authority (Dollars in Thousands) S FY 2013 FY 2014 FY 2014 FY 2014 FY 2015 e 0100D Operation and Maintenance, Defense-Wide (Base & OCO) Base Enacted OCO Enacted Total Enacted Base c ---------- ---------- ---------- ---------- ---------- - Budget Activity 01: Operating Forces 0100D 010 1PL1 Joint Chiefs of Staff 420,842 437,455 437,455 462,107 U 0100D 020 1PL2 Special Operations Command/Operating Forces 7,083,337 4,781,943 2,219,868 7,001,811 4,762,245 U Total, BA 01: Operating Forces 7,504,179 5,219,398 2,219,868 7,439,266 5,224,352 Budget Activity 03: Training and Recruiting 0100D 030 3EV2 Defense Acquisition University 131,993 150,650 150,650 135,437 U 0100D 040 PEV5 National Defense University 77,026 87,488 87,488 80,082 U 0100D 050 3EV7 Special Operations Command/Training and Recruiting 371,620 U Total, BA 03: Training and Recruiting 209,019 238,138 238,138 587,139 Budget Activity 04: Administration and Servicewide Activities 0100D 060 4GT3 Civil Military Programs 148,587 177,386 177,386 119,888 U 0100D 080 4GT6 Defense Contract Audit Agency 534,540 565,649 27,781 593,430 556,493 U 0100D 090 4GTO Defense Contract Management Agency 1,174,126 1,182,254 45,746 1,228,000 1,340,374 U 0100D 100 4GT8 Defense Human Resources Activity 631,640 758,596 13,000 771,596 633,300 U 0100D 110 4GT9 Defense Information Systems Agency 1,380,816 1,275,465 76,348 1,351,813 1,263,678 U 0100D 130 4GTA Defense Legal Services Agency 130,145 29,590 99,538 129,128 26,710 U 0100D 140 4GTB Defense Logistics Agency 404,910 456,222 456,222 381,470 U 0100D 150 ES18 Defense Media Activity 213,091 214,876 9,620 224,496 194,520 U 0100D 160 4GTC Defense POW/MIA Office 18,573 21,347 21,347 21,485 U 0100D 170 4GTD Defense Security Cooperation Agency 1,720,414 704,895 1,707,000 2,411,895 544,786 U 0100D 180 4GTE Defense Security Service 452,754 547,753 547,753 527,812 U 0100D 200 4GTH Defense Technology Security Administration 31,207 34,748 34,748 32,787 U 0100D 230 4GTJ Department of Defense Education Activity 2,706,133 2,705,724 100,100 2,805,824 2,566,424 U 0100D 240 011A Missile Defense Agency 221,609 369,371 369,371 416,644 U 0100D 260 4GTM Office of Economic Adjustment 295,671 216,588 216,588 186,987 U 0100D 270 4GTN Office of the Secretary of Defense 2,006,840 1,948,474 68,227 2,016,701 1,891,163 U 0100D 280 4GT1 Special Operations Command/Admin & Svc-wide Activities 87,915 U 0100D 290 4GTQ Washington Headquarters Services 476,709 588,502 2,784 591,286 610,982 U 0100D 999 Classified Programs 15,712,822 13,892,271 1,856,666 15,748,937 13,983,323 U Total, BA 04: Administration and Servicewide Activities 28,260,587 25,689,711 4,006,810 29,696,521 25,386,741 Total Operation and Maintenance, Defense-Wide 35,973,785 31,147,247 6,226,678 37,373,925 31,198,232 Department of Defense
261

OPERATION AND MAINTENANCE, (O-1)
OPERATION AND MAINTENANCE (O-1)
FY 2015 President's Budget Exhibit O-1 FY 2015 President's Budget (RF Excluded) Total Obligational Authority (Dollars in Thousands) S FY 2013 FY 2014 FY 2014 FY 2014 FY 2015 e 0107D Office of the Inspector General (Base & OCO) Base Enacted OCO Enacted Total Enacted Base c ---------- ---------- ---------- ---------- ---------- - Budget Activity 01: Operation And Maintenance 0107D 010 4GTV Office of the Inspector General 316,175 315,000 10,766 325,766 310,830 U Total, BA 01: Operation And Maintenance 316,175 315,000 10,766 325,766 310,830 Budget Activity 03: Procurement 0107D 020 4GTV Office of the Inspector General 2,696 1,000 1,000 1,000 U Total, BA 03: Procurement 2,696 1,000 1,000 1,000 Total Office of the Inspector General 318,871 316,000 10,766 326,766 311,830 Department of Defense
262

OPERATION AND MAINTENANCE, (O-1)
OPERATION AND MAINTENANCE (O-1)
FY 2015 President's Budget Exhibit O-1 FY 2015 President's Budget (RF Excluded) Total Obligational Authority (Dollars in Thousands) S FY 2013 FY 2014 FY 2014 FY 2014 FY 2015 e 0104D US Court of Appeals for Armed Forces, Def (Base & OCO) Base Enacted OCO Enacted Total Enacted Base c ---------- ---------- ---------- ---------- ---------- - Budget Activity 04: Administration And Associated Activities 0104D 010 4GTT Us Court of Appeals for the Armed Forces, Defense 10,528 13,606 13,606 13,723 U Total, BA 04: Administration And Associated Activities 10,528 13,606 13,606 13,723 Total US Court of Appeals for Armed Forces, Def 10,528 13,606 13,606 13,723 Department of Defense
263
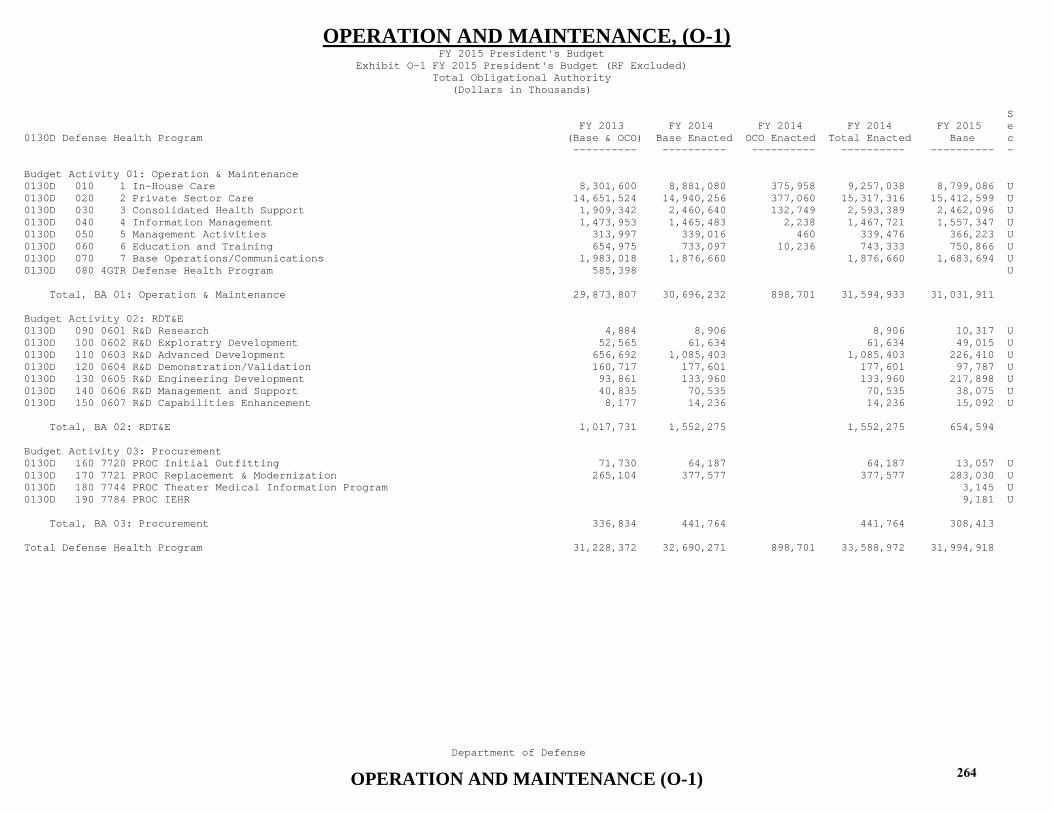
OPERATION AND MAINTENANCE, (O-1)
OPERATION AND MAINTENANCE (O-1)
FY 2015 President's Budget Exhibit O-1 FY 2015 President's Budget (RF Excluded) Total Obligational Authority (Dollars in Thousands) S FY 2013 FY 2014 FY 2014 FY 2014 FY 2015 e 0130D Defense Health Program (Base & OCO) Base Enacted OCO Enacted Total Enacted Base c ---------- ---------- ---------- ---------- ---------- - Budget Activity 01: Operation & Maintenance 0130D 010 1 In-House Care 8,301,600 8,881,080 375,958 9,257,038 8,799,086 U 0130D 020 2 Private Sector Care 14,651,524 14,940,256 377,060 15,317,316 15,412,599 U 0130D 030 3 Consolidated Health Support 1,909,342 2,460,640 132,749 2,593,389 2,462,096 U 0130D 040 4 Information Management 1,473,953 1,465,483 2,238 1,467,721 1,557,347 U 0130D 050 5 Management Activities 313,997 339,016 460 339,476 366,223 U 0130D 060 6 Education and Training 654,975 733,097 10,236 743,333 750,866 U 0130D 070 7 Base Operations/Communications 1,983,018 1,876,660 1,876,660 1,683,694 U 0130D 080 4GTR Defense Health Program 585,398 U Total, BA 01: Operation & Maintenance 29,873,807 30,696,232 898,701 31,594,933 31,031,911 Budget Activity 02: RDT&E 0130D 090 0601 R&D Research 4,884 8,906 8,906 10,317 U 0130D 100 0602 R&D Exploratry Development 52,565 61,634 61,634 49,015 U 0130D 110 0603 R&D Advanced Development 656,692 1,085,403 1,085,403 226,410 U 0130D 120 0604 R&D Demonstration/Validation 160,717 177,601 177,601 97,787 U 0130D 130 0605 R&D Engineering Development 93,861 133,960 133,960 217,898 U 0130D 140 0606 R&D Management and Support 40,835 70,535 70,535 38,075 U 0130D 150 0607 R&D Capabilities Enhancement 8,177 14,236 14,236 15,092 U Total, BA 02: RDT&E 1,017,731 1,552,275 1,552,275 654,594 Budget Activity 03: Procurement 0130D 160 7720 PROC Initial Outfitting 71,730 64,187 64,187 13,057 U 0130D 170 7721 PROC Replacement & Modernization 265,104 377,577 377,577 283,030 U 0130D 180 7744 PROC Theater Medical Information Program 3,145 U 0130D 190 7784 PROC IEHR 9,181 U Total, BA 03: Procurement 336,834 441,764 441,764 308,413 Total Defense Health Program 31,228,372 32,690,271 898,701 33,588,972 31,994,918 Department of Defense
264

OPERATION AND MAINTENANCE, (O-1)
OPERATION AND MAINTENANCE (O-1)
FY 2015 President's Budget Exhibit O-1 FY 2015 President's Budget (RF Excluded) Total Obligational Authority (Dollars in Thousands) S FY 2013 FY 2014 FY 2014 FY 2014 FY 2015 e 0819D Overseas Humanitarian, Disaster, and Civic Aid (Base & OCO) Base Enacted OCO Enacted Total Enacted Base c ---------- ---------- ---------- ---------- ---------- - Budget Activity 01: Humanitarian Assistance 0819D 010 4GTD Overseas Humanitarian, Disaster and Civic Aid 108,615 109,500 109,500 100,000 U Total, BA 01: Humanitarian Assistance 108,615 109,500 109,500 100,000 Total Overseas Humanitarian, Disaster, and Civic Aid 108,615 109,500 109,500 100,000 Department of Defense
265

OPERATION AND MAINTENANCE, (O-1)
OPERATION AND MAINTENANCE (O-1)
FY 2015 President's Budget Exhibit O-1 FY 2015 President's Budget (RF Excluded) Total Obligational Authority (Dollars in Thousands) S FY 2013 FY 2014 FY 2014 FY 2014 FY 2015 e 0134D Cooperative Threat Reduction Account (Base & OCO) Base Enacted OCO Enacted Total Enacted Base c ---------- ---------- ---------- ---------- ---------- - Budget Activity 01: Fsu Threat Reduction 0134D 010 1PL3 Former Soviet Union (FSU) Threat Reduction 446,235 500,455 500,455 365,108 U Total, BA 01: Fsu Threat Reduction 446,235 500,455 500,455 365,108 Total Cooperative Threat Reduction Account 446,235 500,455 500,455 365,108 Department of Defense
266

OPERATION AND MAINTENANCE, (O-1)
OPERATION AND MAINTENANCE (O-1)
FY 2015 President's Budget Exhibit O-1 FY 2015 President's Budget (RF Excluded) Total Obligational Authority (Dollars in Thousands) S FY 2013 FY 2014 FY 2014 FY 2014 FY 2015 e 5751D Contributions to the Cooperative Threat Reduction Program (Base & OCO) Base Enacted OCO Enacted Total Enacted Base c ---------- ---------- ---------- ---------- ---------- - Budget Activity 01: FSU Threat Reduction 5751D 010 1PL3 Contributions to the CTR Program 313 U Total, BA 01: FSU Threat Reduction 313 Total Contributions to the Cooperative Threat Reduction Program 313 Department of Defense
267

OPERATION AND MAINTENANCE, (O-1)
OPERATION AND MAINTENANCE (O-1)
FY 2015 President's Budget Exhibit O-1 FY 2015 President's Budget (RF Excluded) Total Obligational Authority (Dollars in Thousands) S FY 2013 FY 2014 FY 2014 FY 2014 FY 2015 e 0111D DoD Acquisition Workforce Development Fund (Base & OCO) Base Enacted OCO Enacted Total Enacted Base c ---------- ---------- ---------- ---------- ---------- - Budget Activity 01: Acquisition Workforce Development 0111D 010 012 Acq Workforce Dev Fd 48,643 51,031 51,031 212,875 U Total, BA 01: Acquisition Workforce Development 48,643 51,031 51,031 212,875 Total DoD Acquisition Workforce Development Fund 48,643 51,031 51,031 212,875 Department of Defense FY 2015 President's Budget
268

OPERATION AND MAINTENANCE, (O-1)
OPERATION AND MAINTENANCE (O-1)
Exhibit O-1 FY 2015 President's Budget (RF Excluded) Total Obligational Authority (Dollars in Thousands) S FY 2013 FY 2014 FY 2014 FY 2014 FY 2015 e (Base & OCO) Base Enacted OCO Enacted Total Enacted Base c ---------- ---------- ---------- ---------- ---------- - Transfer Accounts 0105D 010 Drug Interdiction and Counter-Drug Activities, Defense 391,332 895,305 376,305 1,271,610 719,096 U 0105D 020 Drug Demand Reduction Program 120,580 120,580 101,591 U 0810A 030 Environmental Restoration, Army 298,815 298,815 201,560 U 0810N 040 Environmental Restoration, Navy 316,103 316,103 277,294 U 0810F 050 Environmental Restoration, Air Force 439,820 439,820 408,716 U 0810D 060 Environmental Restoration, Defense 10,757 10,757 8,547 U 0811D 070 Environmental Restoration Formerly Used Sites 287,443 287,443 208,353 U 0118D 080 Overseas Contingency Operations Transfer Fund 5,000 U Total Transfer Accounts 391,332 2,368,823 376,305 2,745,128 1,930,157 Miscellaneous Accounts 0838D 090 Support of International Sporting Competitions, Defense 1,691 10,000 U 0833D 100 Emergency Response Fund, Defense 3,098 U 0833D 110 Emergency Response Fund, Defense 2,220 U 0833D 120 Emergency Response Fund, Defense 17 U 0833D 130 Emergency Response Fund, Defense 155 U Total Miscellaneous Accounts 7,181 10,000 Indefinite Accounts 5188D 140 Disposal of DoD Real Property 664 9,052 9,052 476 U 5188D 150 Disposal of DoD Real Property 11,213 2,930 2,930 1,600 U 5188D 160 Disposal of DoD Real Property 7,239 18,896 18,896 3,470 U 5189D 170 Lease of DoD Real Property 3,865 43,930 43,930 5,543 U 5189D 180 Lease of DoD Real Property 19,751 28,300 28,300 10,600 U 5189D 190 Lease of DoD Real Property 5,342 58,046 58,046 8,486 U Total Indefinite Accounts 48,074 161,154 161,154 30,175
269

TOTAL CIVILIAN PERSONNEL COSTS
FY 2015 PRESIDENT'S BUDGET
Exhibit OP-8, Part 1, Total Civilian Personnel Costs
e + f + g d + h i + j d/c i/c k/c h/d j/d
a b c d e f g h i j k l m n o p
Begin End Basic Overtime Holiday Other Total Comp Benefits Comp Basic Total Comp % BC % BC
Strength Strength FTEs Comp Pay Pay O.C.11 Variables O.C.11 O.C.12/13 & Benefits Comp Comp & Benefits Variables Benefits
Direct Funded Personnel (includes OC 13) 468,251 450,210 448,447 32,412,727 670,639 64,304 698,306 1,433,249 33,845,976 11,216,384 45,062,360 $72,278 $75,474 $100,485 4.4% 34.6%
D1. US Direct Hire (USDH) 442,833 424,802 422,808 31,396,643 664,530 63,452 677,302 1,405,284 32,801,927 10,961,077 43,763,004 $74,257 $77,581 $103,506 4.5% 34.9%
D1a. Senior Executive Schedule 1,456 1,403 1,399 220,480 0 226 10,577 10,803 231,283 61,249 292,532 $157,598 $165,320 $209,101 4.9% 27.8%
D1b. General Schedule 355,374 345,253 345,147 26,713,655 505,319 58,228 575,235 1,138,782 27,852,437 9,078,869 36,931,306 $77,398 $80,697 $107,002 4.3% 34.0%
D1c. Special Schedule 4,517 4,419 3,678 307,482 412 23 7,239 7,674 315,156 101,591 416,747 $83,600 $85,687 $113,308 2.5% 33.0%
D1d. Wage System 74,545 66,952 66,122 3,705,333 158,786 4,473 56,904 220,163 3,925,496 1,385,783 5,311,279 $56,038 $59,367 $80,325 5.9% 37.4%
D1e. Highly Qualified Experts 17 1 0 137 0 0 0 - 137 32 169 - - - 0.0% 23.4%
D1f. Other 6,924 6,774 6,462 449,556 13 502 27,347 27,862 477,418 333,553 810,971 $69,569 $73,881 $125,498 6.2% 74.2%
D2. Direct Hire Program Foreign Nationals (DHFN) 8,620 8,443 8,578 175,480 3,208 852 21,004 25,064 200,544 68,746 269,290 $20,457 $23,379 $31,393 14.3% 39.2%
D3. Total Direct Hire 451,453 433,245 431,386 31,572,123 667,738 64,304 698,306 1,430,348 33,002,471 11,029,823 44,032,294 $73,188 $76,503 $102,072 4.5% 34.9%
D4. Indirect Hire Foreign Nationals (IHFN) 16,798 16,965 17,061 840,604 2,901 0 0 2,901 843,505 3,673 847,178 $49,270 $49,441 $49,656 0.3% 0.4%
Subtotal - Direct Funded (excludes OC 13) 468,251 450,210 448,447 32,412,727 670,639 64,304 698,306 1,433,249 33,845,976 11,033,496 44,879,472 $72,278 $75,474 $100,078 4.4% 34.0%
D5. Other Object Class 13 Benefits 182,888 182,888
D5a. USDH - Benefits for Former Employees 123,775 123,775
D5b. DHFN - Benefits for Former Employees 15,289 15,289
D5c. Voluntary Separation Incentive Pay (VSIP) 41,349 41,349
D5d. Foreign National Separation Liability Accrual 2,475 2,475
Reimbursable Funded Personnel (includes OC 13) 336,125 280,706 324,294 23,267,682 848,755 55,470 478,596 1,382,821 24,650,503 6,299,164 30,949,667 $71,749 $76,013 $95,437 5.9% 27.1%
R1. US Direct Hire (USDH) 313,074 260,996 303,221 22,739,481 846,703 54,847 458,855 1,360,405 24,099,886 6,221,727 30,321,613 $74,993 $79,480 $99,998 6.0% 27.4%
R1a. Senior Executive Schedule 169 173 167 26,832 0 21 1,650 1,671 28,503 6,219 34,722 $160,671 $170,677 $207,916 6.2% 23.2%
R1b. General Schedule 245,690 198,650 237,484 19,620,672 390,840 32,112 359,555 782,507 20,403,179 4,812,341 25,215,520 $82,619 $85,914 $106,178 4.0% 24.5%
R1c. Special Schedule 6,426 6,434 8,760 354,682 176,611 1,058 46,388 224,057 578,739 129,415 708,154 $40,489 $66,066 $80,839 63.2% 36.5%
R1d. Wage System 60,677 55,636 56,714 2,737,872 279,250 21,625 51,214 352,089 3,089,961 1,252,754 4,342,715 $48,275 $54,483 $76,572 12.9% 45.8%
R1e. Highly Qualified Experts 4 7 3 449 0 0 0 - 449 68 517 $149,667 $149,667 $172,333 0.0% 15.1%
R1f. Other 108 96 93 (1,026) 2 31 48 81 (945) 20,930 19,985 ($11,032) ($10,161) $214,892 -7.9% -2040.0%
R2. Direct Hire Program Foreign Nationals (DHFN) 3,824 3,367 3,724 143,756 1,459 471 19,488 21,418 165,174 23,227 188,401 $38,603 $44,354 $50,591 14.9% 16.2%
R3. Total Direct Hire 316,898 264,363 306,945 22,883,237 848,162 55,318 478,343 1,381,823 24,265,060 6,244,954 30,510,014 $74,552 $79,053 $99,399 6.0% 27.3%
R4. Indirect Hire Foreign Nationals (IHFN) 19,227 16,343 17,349 384,445 593 152 253 998 385,443 15,842 401,285 $22,159 $22,217 $23,130 0.3% 4.1%
Subtotal - Reimbursable Funded (excludes OC 336,125 280,706 324,294 23,267,682 848,755 55,470 478,596 1,382,821 24,650,503 6,260,796 30,911,299 $71,749 $76,013 $95,319 5.9% 26.9%
R5. Other Object Class 13 Benefits 38,368 38,368
R5a. USDH - Benefits for Former Employees 6,740 6,740
R5b. DHFN - Benefits for Former Employees 0 -
R5c. Voluntary Separation Incentive Pay (VSIP) 30,090 30,090
R5d. Foreign National Separation Liability Accrual 1,538 1,538
Total Personnel (includes OC 13) 804,376 730,916 772,741 55,680,409 1,519,394 119,774 1,176,902 2,816,070 58,496,479 17,515,548 76,012,027 $72,056 $75,700 $98,367 5.1% 31.5%
T1. US Direct Hire (USDH) 755,907 685,798 726,029 54,136,124 1,511,233 118,299 1,136,157 2,765,689 56,901,813 17,182,804 74,084,617 $74,565 $78,374 $102,041 5.1% 31.7%
T1a. Senior Executive Schedule 1,625 1,576 1,566 247,312 0 247 12,227 12,474 259,786 67,468 327,254 $157,926 $165,891 $208,974 5.0% 27.3%
T1b. General Schedule 601,064 543,903 582,631 46,334,327 896,159 90,340 934,790 1,921,289 48,255,616 13,891,210 62,146,826 $79,526 $82,824 $106,666 4.1% 30.0%
T1c. Special Schedule 10,943 10,853 12,438 662,164 177,023 1,081 53,627 231,731 893,895 231,006 1,124,901 $53,237 $71,868 $90,441 35.0% 34.9%
T1d. Wage System 135,222 122,588 122,836 6,443,205 438,036 26,098 108,118 572,252 7,015,457 2,638,537 9,653,994 $52,454 $57,112 $78,593 8.9% 41.0%
T1e. Highly Qualified Experts 21 8 3 586 0 0 0 0 586 100 686 $195,333 $195,333 $228,667 0.0% 17.1%
T1f. Other 7,032 6,870 6,555 448,530 15 533 27,395 27,943 476,473 354,483 830,956 $68,426 $72,688 $126,767 6.2% 79.0%
T2. Direct Hire Program Foreign Nationals (DHFN) 12,444 11,810 12,302 319,236 4,667 1,323 40,492 46,482 365,718 91,973 457,691 $25,950 $29,728 $37,205 14.6% 28.8%
T3. Total Direct Hire 768,351 697,608 738,331 54,455,360 1,515,900 119,622 1,176,649 2,812,171 57,267,531 17,274,777 74,542,308 $73,755 $77,563 $100,961 5.2% 31.7%
T4. Indirect Hire Foreign Nationals (IHFN) 36,025 33,308 34,410 1,225,049 3,494 152 253 3,899 1,228,948 19,515 1,248,463 $35,602 $35,715 $36,282 0.3% 1.6%
Subtotal - Total Funded (excludes OC 13) 804,376 730,916 772,741 55,680,409 1,519,394 119,774 1,176,902 2,816,070 58,496,479 17,294,292 75,790,771 $72,056 $75,700 $98,080 5.1% 31.1%
T5. Other Object Class 13 Benefits 221,256 221,256
T5a. USDH - Benefits for Former Employees 130,515 130,515
T5b. DHFN - Benefits for Former Employees 15,289 15,289
T5c. Voluntary Separation Incentive Pay (VSIP) 71,439 71,439
T5d. Foreign National Separation Liability Accrual 4,013 4,013
(FY 2013)
Rates
($ in Thousands)
TOTAL CIVILIAN PERSONNEL COSTS
270

TOTAL CIVILIAN PERSONNEL COSTS
FY 2015 PRESIDENT'S BUDGET
Exhibit OP-8, Part 1, Total Civilian Personnel Costs
e + f + g d + h i + j d/c i/c k/c h/d j/d
a b c d e f g h i j k l m n o p
Begin End Basic Overtime Holiday Other Total Comp Benefits Comp Basic Total Comp % BC % BC
Strength Strength FTEs Comp Pay Pay O.C.11 Variables O.C.11 O.C.12/13 & Benefits Comp Comp & Benefits Variables Benefits
Direct Funded Personnel (includes OC 13) 446,124 473,554 460,491 33,039,756 501,508 75,258 659,281 1,236,047 34,275,803 11,370,912 45,646,715 $71,749 $74,433 $99,126 3.7% 34.4%
D1. US Direct Hire (USDH) 420,707 447,198 433,948 31,999,717 499,703 74,467 630,915 1,205,085 33,204,802 11,206,381 44,411,183 $73,741 $76,518 $102,342 3.8% 35.0%
D1a. Senior Executive Schedule 1,403 1,574 1,575 266,745 0 320 13,410 13,730 280,475 70,508 350,983 $169,362 $178,079 $222,846 5.1% 26.4%
D1b. General Schedule 341,836 365,430 354,907 27,210,838 370,617 69,426 518,950 958,993 28,169,831 9,299,341 37,469,172 $76,670 $79,372 $105,575 3.5% 34.2%
D1c. Special Schedule 4,402 4,733 3,983 342,550 470 23 9,148 9,641 352,191 104,733 456,924 $86,003 $88,424 $114,719 2.8% 30.6%
D1d. Wage System 66,499 68,749 67,044 3,725,377 128,616 4,215 68,337 201,168 3,926,545 1,398,591 5,325,136 $55,566 $58,567 $79,427 5.4% 37.5%
D1e. Highly Qualified Experts 1 18 20 3,072 0 0 97 97 3,169 765 3,934 $153,600 $158,450 $196,700 3.2% 24.9%
D1f. Other 6,566 6,694 6,419 451,135 0 483 20,973 21,456 472,591 332,443 805,034 $70,281 $73,624 $125,414 4.8% 73.7%
D2. Direct Hire Program Foreign Nationals (DHFN) 8,457 9,214 8,916 205,380 1,805 791 28,353 30,949 236,329 63,450 299,779 $23,035 $26,506 $33,623 15.1% 30.9%
D3. Total Direct Hire 429,164 456,412 442,864 32,205,097 501,508 75,258 659,268 1,236,034 33,441,131 11,269,831 44,710,962 $72,720 $75,511 $100,959 3.8% 35.0%
D4. Indirect Hire Foreign Nationals (IHFN) 16,960 17,142 17,627 834,659 0 0 13 13 834,672 4,720 839,392 $47,351 $47,352 $47,620 0.0% 0.6%
Subtotal - Direct Funded (excludes OC 13) 446,124 473,554 460,491 33,039,756 501,508 75,258 659,281 1,236,047 34,275,803 11,274,551 45,550,354 $71,749 $74,433 $98,917 3.7% 34.1%
D5. Other Object Class 13 Benefits 96,361 96,361
D5a. USDH - Benefits for Former Employees 62,082 62,082
D5b. DHFN - Benefits for Former Employees 0 -
D5c. Voluntary Separation Incentive Pay (VSIP) 31,209 31,209
D5d. Foreign National Separation Liability Accrual 3,070 3,070
Reimbursable Funded Personnel (includes OC 13) 280,338 331,053 330,385 23,236,360 824,026 66,976 664,568 1,555,570 24,791,930 7,249,699 32,041,629 $70,331 $75,040 $96,983 6.7% 31.2%
R1. US Direct Hire (USDH) 260,685 308,886 308,398 22,632,442 822,802 66,558 646,456 1,535,816 24,168,258 7,142,073 31,310,331 $73,387 $78,367 $101,526 6.8% 31.6%
R1a. Senior Executive Schedule 175 174 174 30,114 0 18 2,037 2,055 32,169 6,843 39,012 $173,069 $184,879 $224,207 6.8% 22.7%
R1b. General Schedule 199,420 241,651 239,352 19,192,010 388,165 42,097 464,229 894,491 20,086,501 5,851,398 25,937,899 $80,183 $83,920 $108,367 4.7% 30.5%
R1c. Special Schedule 6,434 6,248 8,683 346,670 171,277 1,398 43,702 216,377 563,047 128,298 691,345 $39,925 $64,845 $79,621 62.4% 37.0%
R1d. Wage System 54,565 60,731 60,121 3,054,827 263,358 23,040 82,899 369,297 3,424,124 1,130,794 4,554,918 $50,811 $56,954 $75,763 12.1% 37.0%
R1e. Highly Qualified Experts 3 3 3 514 0 0 18 18 532 87 619 $171,333 $177,333 $206,333 3.5% 16.9%
R1f. Other 88 79 65 8,307 2 5 53,571 53,578 61,885 24,653 86,538 $127,800 $952,077 $1,331,354 645.0% 296.8%
R2. Direct Hire Program Foreign Nationals (DHFN) 3,361 4,127 4,097 129,960 1,169 418 15,396 16,983 146,943 35,067 182,010 $31,721 $35,866 $44,425 13.1% 27.0%
R3. Total Direct Hire 264,046 313,013 312,495 22,762,402 823,971 66,976 661,852 1,552,799 24,315,201 7,177,140 31,492,341 $72,841 $77,810 $100,777 6.8% 31.5%
R4. Indirect Hire Foreign Nationals (IHFN) 16,292 18,040 17,890 473,958 55 0 2,716 2,771 476,729 14,524 491,253 $26,493 $26,648 $27,460 0.6% 3.1%
Subtotal - Reimbursable Funded (excludes OC 280,338 331,053 330,385 23,236,360 824,026 66,976 664,568 1,555,570 24,791,930 7,191,664 31,983,594 $70,331 $75,040 $96,807 6.7% 31.0%
R5. Other Object Class 13 Benefits 58,035 58,035
R5a. USDH - Benefits for Former Employees 17,868 17,868
R5b. DHFN - Benefits for Former Employees 0 -
R5c. Voluntary Separation Incentive Pay (VSIP) 39,459 39,459
R5d. Foreign National Separation Liability Accrual 708 708
Total Personnel (includes OC 13) 726,462 804,607 790,876 56,276,116 1,325,534 142,234 1,323,849 2,791,617 59,067,733 18,620,611 77,688,344 $71,157 $74,686 $98,231 5.0% 33.1%
T1. US Direct Hire (USDH) 681,392 756,084 742,346 54,632,159 1,322,505 141,025 1,277,371 2,740,901 57,373,060 18,348,454 75,721,514 $73,594 $77,286 $102,003 5.0% 33.6%
T1a. Senior Executive Schedule 1,578 1,748 1,749 296,859 0 338 15,447 15,785 312,644 77,351 389,995 $169,731 $178,756 $222,982 5.3% 26.1%
T1b. General Schedule 541,256 607,081 594,259 46,402,848 758,782 111,523 983,179 1,853,484 48,256,332 15,150,739 63,407,071 $78,085 $81,204 $106,699 4.0% 32.7%
T1c. Special Schedule 10,836 10,981 12,666 689,220 171,747 1,421 52,850 226,018 915,238 233,031 1,148,269 $54,415 $72,259 $90,658 32.8% 33.8%
T1d. Wage System 121,064 129,480 127,165 6,780,204 391,974 27,255 151,236 570,465 7,350,669 2,529,385 9,880,054 $53,318 $57,804 $77,695 8.4% 37.3%
T1e. Highly Qualified Experts 4 21 23 3,586 0 0 115 115 3,701 852 4,553 $155,913 $160,913 $197,957 3.2% 23.8%
T1f. Other 6,654 6,773 6,484 459,442 2 488 74,544 75,034 534,476 357,096 891,572 $70,858 $82,430 $137,503 16.3% 77.7%
T2. Direct Hire Program Foreign Nationals (DHFN) 11,818 13,341 13,013 335,340 2,974 1,209 43,749 47,932 383,272 98,517 481,789 $25,770 $29,453 $37,024 14.3% 29.4%
T3. Total Direct Hire 693,210 769,425 755,359 54,967,499 1,325,479 142,234 1,321,120 2,788,833 57,756,332 18,446,971 76,203,303 $72,770 $76,462 $100,884 5.1% 33.6%
T4. Indirect Hire Foreign Nationals (IHFN) 33,252 35,182 35,517 1,308,617 55 0 2,729 2,784 1,311,401 19,244 1,330,645 $36,845 $36,923 $37,465 0.2% 1.5%
Subtotal - Total Funded (excludes OC 13) 726,462 804,607 790,876 56,276,116 1,325,534 142,234 1,323,849 2,791,617 59,067,733 18,466,215 77,533,948 $71,157 $74,686 $98,036 5.0% 32.8%
T5. Other Object Class 13 Benefits 154,396 154,396
T5a. USDH - Benefits for Former Employees 79,950 79,950
T5b. DHFN - Benefits for Former Employees 0 0
T5c. Voluntary Separation Incentive Pay (VSIP) 70,668 70,668
T5d. Foreign National Separation Liability Accrual 3,778 3,778
Rates
(FY 2014)
($ in Thousands)
TOTAL CIVILIAN PERSONNEL COSTS
271
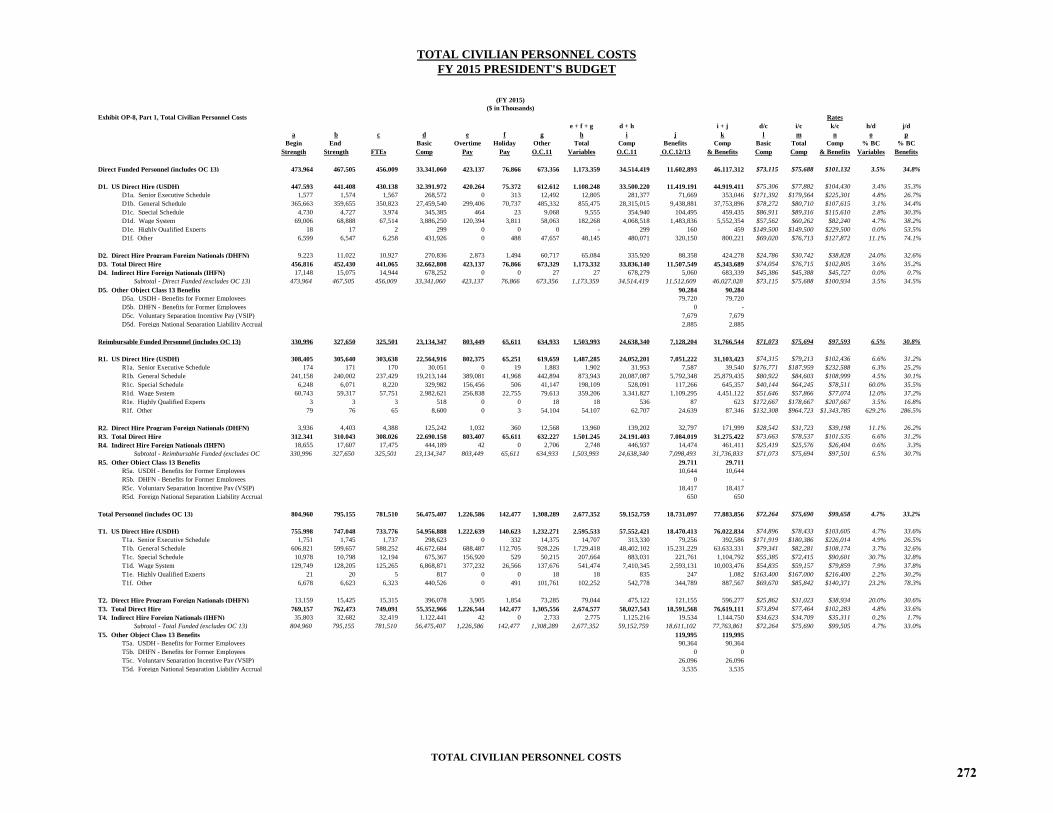
TOTAL CIVILIAN PERSONNEL COSTS
FY 2015 PRESIDENT'S BUDGET
Exhibit OP-8, Part 1, Total Civilian Personnel Costs
e + f + g d + h i + j d/c i/c k/c h/d j/d
a b c d e f g h i j k l m n o p
Begin End Basic Overtime Holiday Other Total Comp Benefits Comp Basic Total Comp % BC % BC
Strength Strength FTEs Comp Pay Pay O.C.11 Variables O.C.11 O.C.12/13 & Benefits Comp Comp & Benefits Variables Benefits
Direct Funded Personnel (includes OC 13) 473,964 467,505 456,009 33,341,060 423,137 76,866 673,356 1,173,359 34,514,419 11,602,893 46,117,312 $73,115 $75,688 $101,132 3.5% 34.8%
D1. US Direct Hire (USDH) 447,593 441,408 430,138 32,391,972 420,264 75,372 612,612 1,108,248 33,500,220 11,419,191 44,919,411 $75,306 $77,882 $104,430 3.4% 35.3%
D1a. Senior Executive Schedule 1,577 1,574 1,567 268,572 0 313 12,492 12,805 281,377 71,669 353,046 $171,392 $179,564 $225,301 4.8% 26.7%
D1b. General Schedule 365,663 359,655 350,823 27,459,540 299,406 70,737 485,332 855,475 28,315,015 9,438,881 37,753,896 $78,272 $80,710 $107,615 3.1% 34.4%
D1c. Special Schedule 4,730 4,727 3,974 345,385 464 23 9,068 9,555 354,940 104,495 459,435 $86,911 $89,316 $115,610 2.8% 30.3%
D1d. Wage System 69,006 68,888 67,514 3,886,250 120,394 3,811 58,063 182,268 4,068,518 1,483,836 5,552,354 $57,562 $60,262 $82,240 4.7% 38.2%
D1e. Highly Qualified Experts 18 17 2 299 0 0 0 - 299 160 459 $149,500 $149,500 $229,500 0.0% 53.5%
D1f. Other 6,599 6,547 6,258 431,926 0 488 47,657 48,145 480,071 320,150 800,221 $69,020 $76,713 $127,872 11.1% 74.1%
D2. Direct Hire Program Foreign Nationals (DHFN) 9,223 11,022 10,927 270,836 2,873 1,494 60,717 65,084 335,920 88,358 424,278 $24,786 $30,742 $38,828 24.0% 32.6%
D3. Total Direct Hire 456,816 452,430 441,065 32,662,808 423,137 76,866 673,329 1,173,332 33,836,140 11,507,549 45,343,689 $74,054 $76,715 $102,805 3.6% 35.2%
D4. Indirect Hire Foreign Nationals (IHFN) 17,148 15,075 14,944 678,252 0 0 27 27 678,279 5,060 683,339 $45,386 $45,388 $45,727 0.0% 0.7%
Subtotal - Direct Funded (excludes OC 13) 473,964 467,505 456,009 33,341,060 423,137 76,866 673,356 1,173,359 34,514,419 11,512,609 46,027,028 $73,115 $75,688 $100,934 3.5% 34.5%
D5. Other Object Class 13 Benefits 90,284 90,284
D5a. USDH - Benefits for Former Employees 79,720 79,720
D5b. DHFN - Benefits for Former Employees 0 -
D5c. Voluntary Separation Incentive Pay (VSIP) 7,679 7,679
D5d. Foreign National Separation Liability Accrual 2,885 2,885
Reimbursable Funded Personnel (includes OC 13) 330,996 327,650 325,501 23,134,347 803,449 65,611 634,933 1,503,993 24,638,340 7,128,204 31,766,544 $71,073 $75,694 $97,593 6.5% 30.8%
R1. US Direct Hire (USDH) 308,405 305,640 303,638 22,564,916 802,375 65,251 619,659 1,487,285 24,052,201 7,051,222 31,103,423 $74,315 $79,213 $102,436 6.6% 31.2%
R1a. Senior Executive Schedule 174 171 170 30,051 0 19 1,883 1,902 31,953 7,587 39,540 $176,771 $187,959 $232,588 6.3% 25.2%
R1b. General Schedule 241,158 240,002 237,429 19,213,144 389,081 41,968 442,894 873,943 20,087,087 5,792,348 25,879,435 $80,922 $84,603 $108,999 4.5% 30.1%
R1c. Special Schedule 6,248 6,071 8,220 329,982 156,456 506 41,147 198,109 528,091 117,266 645,357 $40,144 $64,245 $78,511 60.0% 35.5%
R1d. Wage System 60,743 59,317 57,751 2,982,621 256,838 22,755 79,613 359,206 3,341,827 1,109,295 4,451,122 $51,646 $57,866 $77,074 12.0% 37.2%
R1e. Highly Qualified Experts 3 3 3 518 0 0 18 18 536 87 623 $172,667 $178,667 $207,667 3.5% 16.8%
R1f. Other 79 76 65 8,600 0 3 54,104 54,107 62,707 24,639 87,346 $132,308 $964,723 $1,343,785 629.2% 286.5%
R2. Direct Hire Program Foreign Nationals (DHFN) 3,936 4,403 4,388 125,242 1,032 360 12,568 13,960 139,202 32,797 171,999 $28,542 $31,723 $39,198 11.1% 26.2%
R3. Total Direct Hire 312,341 310,043 308,026 22,690,158 803,407 65,611 632,227 1,501,245 24,191,403 7,084,019 31,275,422 $73,663 $78,537 $101,535 6.6% 31.2%
R4. Indirect Hire Foreign Nationals (IHFN) 18,655 17,607 17,475 444,189 42 0 2,706 2,748 446,937 14,474 461,411 $25,419 $25,576 $26,404 0.6% 3.3%
Subtotal - Reimbursable Funded (excludes OC 330,996 327,650 325,501 23,134,347 803,449 65,611 634,933 1,503,993 24,638,340 7,098,493 31,736,833 $71,073 $75,694 $97,501 6.5% 30.7%
R5. Other Object Class 13 Benefits 29,711 29,711
R5a. USDH - Benefits for Former Employees 10,644 10,644
R5b. DHFN - Benefits for Former Employees 0 -
R5c. Voluntary Separation Incentive Pay (VSIP) 18,417 18,417
R5d. Foreign National Separation Liability Accrual 650 650
Total Personnel (includes OC 13) 804,960 795,155 781,510 56,475,407 1,226,586 142,477 1,308,289 2,677,352 59,152,759 18,731,097 77,883,856 $72,264 $75,690 $99,658 4.7% 33.2%
T1. US Direct Hire (USDH) 755,998 747,048 733,776 54,956,888 1,222,639 140,623 1,232,271 2,595,533 57,552,421 18,470,413 76,022,834 $74,896 $78,433 $103,605 4.7% 33.6%
T1a. Senior Executive Schedule 1,751 1,745 1,737 298,623 0 332 14,375 14,707 313,330 79,256 392,586 $171,919 $180,386 $226,014 4.9% 26.5%
T1b. General Schedule 606,821 599,657 588,252 46,672,684 688,487 112,705 928,226 1,729,418 48,402,102 15,231,229 63,633,331 $79,341 $82,281 $108,174 3.7% 32.6%
T1c. Special Schedule 10,978 10,798 12,194 675,367 156,920 529 50,215 207,664 883,031 221,761 1,104,792 $55,385 $72,415 $90,601 30.7% 32.8%
T1d. Wage System 129,749 128,205 125,265 6,868,871 377,232 26,566 137,676 541,474 7,410,345 2,593,131 10,003,476 $54,835 $59,157 $79,859 7.9% 37.8%
T1e. Highly Qualified Experts 21 20 5 817 0 0 18 18 835 247 1,082 $163,400 $167,000 $216,400 2.2% 30.2%
T1f. Other 6,678 6,623 6,323 440,526 0 491 101,761 102,252 542,778 344,789 887,567 $69,670 $85,842 $140,371 23.2% 78.3%
T2. Direct Hire Program Foreign Nationals (DHFN) 13,159 15,425 15,315 396,078 3,905 1,854 73,285 79,044 475,122 121,155 596,277 $25,862 $31,023 $38,934 20.0% 30.6%
T3. Total Direct Hire 769,157 762,473 749,091 55,352,966 1,226,544 142,477 1,305,556 2,674,577 58,027,543 18,591,568 76,619,111 $73,894 $77,464 $102,283 4.8% 33.6%
T4. Indirect Hire Foreign Nationals (IHFN) 35,803 32,682 32,419 1,122,441 42 0 2,733 2,775 1,125,216 19,534 1,144,750 $34,623 $34,709 $35,311 0.2% 1.7%
Subtotal - Total Funded (excludes OC 13) 804,960 795,155 781,510 56,475,407 1,226,586 142,477 1,308,289 2,677,352 59,152,759 18,611,102 77,763,861 $72,264 $75,690 $99,505 4.7% 33.0%
T5. Other Object Class 13 Benefits 119,995 119,995
T5a. USDH - Benefits for Former Employees 90,364 90,364
T5b. DHFN - Benefits for Former Employees 0 0
T5c. Voluntary Separation Incentive Pay (VSIP) 26,096 26,096
T5d. Foreign National Separation Liability Accrual 3,535 3,535
(FY 2015)
Rates
($ in Thousands)
TOTAL CIVILIAN PERSONNEL COSTS
272

OVERSEAS CONTINGENCY OPERATIONS
OVERSEAS CONTINGENCY OPERATIONS
THIS EXHIBIT WILL BE UPDATED UPON SUBMISSION OF THE
FY 2015 OVERSEAS CONTINGENCY OPERATIONS ESTIMATE
273