Embed Size (px)
Citation preview
RESEARCH Open Access
PEPCK-M recoups tumor cell anabolicpotential in a PKC-ζ-dependent mannerPetra Hyroššová1, Marc Aragó1, Juan Moreno-Felici1, Xiarong Fu2, Andrés Mendez-Lucas1, Pablo M. García-Rovés1,Shawn Burgess2, Agnès Figueras3, Francesc Viñals3 and Jose C. Perales1,3*
Abstract
Background: Mitochondrial phosphoenolpyruvate carboxykinase (PEPCK-M; PCK2) is expressed in all cancer typesexamined and in neuroprogenitor cells. The gene is upregulated by amino acid limitation and ER-stress in an ATF4-dependent manner, and its activity modulates the PEP/Ca2+ signaling axis, providing clear arguments for afunctional relationship with metabolic adaptations for cell survival. Despite its potential relevance to cancermetabolism, the mechanisms responsible for its pro-survival activity have not been completely elucidated.
Methods: [U-13C]glutamine and [U-13C]glucose labeling of glycolytic and TCA cycle intermediates and theiranabolic end-products was evaluated quantitatively using LC/MS and GC/MS in conditions of abundant glucoseand glucose limitation in loss-of-function (shRNA) and gain-of-function (lentiviral constitutive overexpression) HeLacervix carcinoma cell models. Cell viability was assessed in conjunction with various glucose concentrations and inxenografts in vivo.
Results: PEPCK-M levels linearly correlated with [U-13C]glutamine label abundance in most glycolytic and TCA cycleintermediate pools under nutritional stress. In particular, serine, glycine, and proline metabolism, and the anabolicpotential of the cell, were sensitive to PEPCK-M activity. Therefore, cell viability defects could be rescued bysupplementing with an excess of those amino acids. PEPCK-M silenced or inhibited cells in the presence ofabundant glucose showed limited growth secondary to TCA cycle blockade and increased ROS.In limiting glucose conditions, downregulation of PKC-ζ tumor suppressor has been shown to enhance survival.Consistently, HeLa cells also sustained a survival advantage when PKC-ζ tumor suppressor was downregulated usingshRNA, but this advantage was abolished in the absence of PEPCK-M, as its inhibition restores cell growth tocontrol levels. The relationship between these two pathways is also highlighted by the anti-correlation observedbetween PEPCK-M and PKC-ζ protein levels in all clones tested, suggesting co-regulation in the absence of glucose.Finally, PEPCK-M loss negatively impacted on anchorage-independent colony formation and xenograft growthin vivo.
Conclusions: All in all, our data suggest that PEPCK-M might participate in the mechanisms to regulate proteostasisin the anabolic and stalling phases of tumor growth. We provide molecular clues into the clinical relevance ofPEPCK-M as a mechanism of evasion of cancer cells in conditions of nutrient stress.
(Continued on next page)
© The Author(s). 2021 Open Access This article is licensed under a Creative Commons Attribution 4.0 International License,which permits use, sharing, adaptation, distribution and reproduction in any medium or format, as long as you giveappropriate credit to the original author(s) and the source, provide a link to the Creative Commons licence, and indicate ifchanges were made. The images or other third party material in this article are included in the article's Creative Commonslicence, unless indicated otherwise in a credit line to the material. If material is not included in the article's Creative Commonslicence and your intended use is not permitted by statutory regulation or exceeds the permitted use, you will need to obtainpermission directly from the copyright holder. To view a copy of this licence, visit http://creativecommons.org/licenses/by/4.0/.The Creative Commons Public Domain Dedication waiver (http://creativecommons.org/publicdomain/zero/1.0/) applies to thedata made available in this article, unless otherwise stated in a credit line to the data.
* Correspondence: [email protected] of Physiological Sciences, School of Medicine, University ofBarcelona, Feixa Llarga s/n, 08907 L’Hospitalet del Llobregat, Spain3IDIBELL, Gran Via de l’Hospitalet 199, 08908 L’Hospitalet de Llobregat, SpainFull list of author information is available at the end of the article
Hyroššová et al. Cancer & Metabolism (2021) 9:1 https://doi.org/10.1186/s40170-020-00236-3
(Continued from previous page)
Keywords: PEPCK, PEPCK-M, PCK2, Phosphoenolpyruvate carboxykinase, Cancer metabolism, PEP,Phosphoenolpyruvate, ER stress, Amino acid deprivation, PKC-ζ, ATF4, Activating transcription factor 4, AAR, Aminoacid response, GCN2, TCA cycle, Cataplerosis, Serine/glycine metabolism, Proline metabolism, PYCR, PRODH/POX
BackgroundPhosphoenolpyruvate carboxykinase (PEPCK) (GTP; EC4.1.1.32) catalyzes the GTP-dependent conversion of oxa-loacetate (OAA) to phosphoenolpyruvate (PEP) from twoenzymatically indistinct isozymes localized to the cytosol(PEPCK-C) or the mitochondria (PEPCK-M) [1, 2] andencoded by different nuclear genes (PCK1 and PCK2, re-spectively) [3]. Interestingly, both isozymes are differen-tially expressed and regulated. Whereas PEPCK-C isrestricted to gluconeogenic and glyceroneogenic tissues(liver, small intestine, kidney cortex, and adipose tissue)and responds to insulin, glucagon, and dexamethasone,PEPCK-M is only stimulated by ER-stress effectors and itis widely expressed (i.e., T and B cells, pancreatic β cells,liver, neurons, and undifferentiated tissues such as embry-onic stem cells and tumors). PEPCK-M effects on hepaticgluconeogenesis have been recently demonstrated [4], butits role remains elusive in non-gluconeogenic tissues suchas tumor cells.We identified PCK2 as a target gene for ATF4, the
master regulator of ER and amino acid stress path-ways. PEPCK-M was upregulated by effectors of thispathway by recruiting ATF4 to a consensus AAREsite located at the PEPCK-M proximal promoter [5].In these conditions, PEPCK-M activity is necessary totip the balance towards cell survival. The importanceof chronic ER stress in proper adaptive responses incancer cells in vivo as part of their metabolic repro-gramming hallmark for tumor progression bearsweight to the significance of this pathway in tumorsurvival and progression.Consistent with this view, we and others have demon-
strated the relevance of PEPCK-M in cell growth andchemoresistance in several cancer cell models in vitroand in vivo [6–9]. However, the way PEPCK-M fluxesinteract with tumor cell metabolism to promote survivalare yet to be identified, and is the focus of the presentwork. On this, we have recently shown that PEPCK-Mactivity, and glucose availability, modulates cytosolic cal-cium signaling by upkeeping the pool of PEP, an inhibi-tor of SERCA, even in the presence of glucose in twomodels of colon carcinoma, HCT116 and SW480 [6].Calcium then signals downstream effectors such asNFAT and c-Myc with implications on tumor cell biol-ogy. Thus, this regulatory axis is not only dependent onglucose availability but also on general nutritional statusas PEPCK-M can flux carbons from several sources intothe glycolytic pool.
We describe here the role of PEPCK-M in the preser-vation of the capacity for growth and survival in the can-cer cell by ensuring the biosynthesis of amino acids suchas proline, serine, and glycine. This pathway is importantto offset glucose carbons with carbons from othersources such as glutamine or lactate, maintaining theTCA cycle, and in doing so, affect the general anabolicpotential of the cell and its health status. Consistently,potentiation of resistance to glucose deprivation by theloss of PKC-ζ, a tumor suppressor [10], requiredPEPCK-M activity demonstrating that this enzymeserves an adaptative role in cancer metabolism, with sig-nificance in tumor growth, and further validates its po-tential as a therapeutic target.
MethodsCell cultureCervix (HeLa), and colon (HCT116 and SW480) carcinomacell lines, and mouse Kras-V12 carcinogenic NIH-3T3(NIH-3T3Kras) (a gift from Dr. Capella, IDIBELL, Spain)were cultured in DMEM supplemented with 10% FBS, 100units/ml penicillin, 10 g/ml streptomycin, and 2mML-glu-tamine (all from Biological Industries, Israel) and incubatedin a humidified atmosphere of 5% CO2 at 37 °C.For experiments, unless stated otherwise, cells were
grown in DMEM media with different glucose concen-trations: 25 mM glucose (high glucose), 1 mM glucose(glucose exhaustion), and 0 mM glucose (glucosedeprivation). Media were supplemented with 10% FBS,100 units/ml penicillin, 10 g/ml streptomycin, and 2mMor 4mM (glucose deprivation) L-glutamine.
RNA extraction and quantitative RT-PCRTotal RNA was extracted with the TRIsureTM RNA iso-lation system (Bioline, Memphis, TN, USA) and tran-scribed with High Capacity cDNA Reverse TranscriptionKit (Applied Biosystems, Foster City, CA, USA). QRT-PCR was performed using the TaqMan gene expressionassay and 7900HT Real-Time RT-PCR system (AppliedBiosystems, Carlsbad, CA, USA). Data were analyzed bythe ΔΔCt method to normalize with TBP and GUSBexpression.
Western blotCells were homogenized in RIPA buffer supplementedwith protease and phosphatase inhibitors and centri-fuged at 15,000 g for 15 min at 4 °C. Protein concentra-tion was determined using the BCA protein assay kit
Hyroššová et al. Cancer & Metabolism (2021) 9:1 Page 2 of 15
(Thermo Scientific, Rockford, IL, USA), and equalamounts of protein (20–30 μg) were subjected to 8–12%SDS-PAGE and transferred to an Immobilon membrane(Millipore, Bedford, CA, USA). Blots were treated withprimary antibodies, followed by the corresponding second-ary antibody with horseradish peroxidase activity. Blotswere developed using Pierce ECL reagent (Thermo FisherScientific, Waltham, MA, USA) in a Fujifilm LAS 3000 In-telligent Dark Box IV imaging system (Tokyo, Japan).The following primary antibodies were used: anti-
PEPCK-M (ab70359, Abcam, Cambridge, UK), anti-PEPCK-C (generous gift of Dr. Daryl K. Granner, Van-derbilt University, Nashville, TN, USA), anti-SOD2(ab13534, Abcam), anti-p53 (ab26, Abcam), anti-p21(sc397, Santa Cruz Biotechnology, Dallas, TX, USA),anti-gamma tubulin (T6557, Sigma-Aldrich, St. Louis,MO, USA), and anti-PKC-ζ (9372S, Cell Signaling Tech-nology, Danver, MA, USA).
TransductionProtocols were performed as recommended by themanufacturer. For PCK2 knockdown, HeLa cells wereinfected with GIPZ Lentiviral TurboGFP shRNAs (Dhar-maco, Lafayette, CO, USA; clone IDs: V3LMM_427490and V3LHS_328126) and denominated sh1-PCK2 andsh2-PCK2, respectively. GIPZ non-targeting lentiviralTurboGFP shRNA (Dharmacon; clone ID RHS-4348)was used to produce negative control cells denominatedshCtrl. After transduction, cells were selected with 1 μg/mlpuromycin for 1week. For overexpression of PCK2, HeLacells were infected with a PCK2 Human ORFeome lentiviralparticles (GeneCopoeia, Rockville, MD, USA; clone ID: LP-OL06695-LX304-0200-S) and denominated L-PCK2. Cellswere selected with 2 μg/ml blasticidin for 1week.For PKC-ζ knockdown, HeLa and SW480 cells were
infected with GIPZ Lentiviral TurboGFP shRNAs (Dhar-macon; clone IDs: V3LHS_635000, V3LHS_372773,V3LHS_641464) and denominated shPKCζ #37, shPKCζ#63, and shPKCζ #64, respectively. The negative control,shPKCζ #Ctrl, was produced by infecting HeLa cells withGIPZ non-targeting lentiviral TurboGFP shRNA (Dhar-macon; clone ID: RHS-4348). After transduction, cellswere selected with 1 μg/ml puromycin for 1 week.
Establishment of PCK2 knockout SW480 cell line withCRISPR/Cas 9 systemTo generate a pool of SW480 cells lacking PCK2 (PCK2CRISPR/Cas9 KO), guide RNAs (gRNA) designed to tar-get PCK2 were synthesized, and annealed and clonedinto the pSpCas9(BB)-2A-puro vector (Adgene, Water-town, MA, USA) as described previously [11], using anonline gRNA design tool (CHOPCHOP; https://chop-chop.cbu.uib.no). After 24 h post-transfection, puro-mycin was added for 24 h at 2 μg/ml for selection and
subsequently single cells were selected in 96-well plates.The selected cells were tested for gene deletion by endo-nuclease assay and checked for protein knockdown byWestern blot.
PEPCK-M enzymatic activityCell extracts from confluent 150 cm2 tissue culturedishes were washed twice in PBS, trypsinized, and cen-trifuged at 150 g for 3 min at 4 °C. Cells were resus-pended in 200 μl of ice-cold homogenization buffer (100mM HEPES-NaOH pH 7.2, 0.1% triton™ X-100, 2.5 mMDTT) and lysed by performing 2 freeze/thaw cycles. Ho-mogenates were cleared by centrifugation at 100000 gfor 1 h at 4 °C. PEPCK-M activity was measured in thedirection of phosphoenolpyruvate formation. Briefly, thereaction consisted of 100 mM of HEPES-NaOH (pH 7.2),3 mM malic acid, 3 mM NAD, 2 mM MgCl2, 0.2 mMMnCl2, 37 mM DTT, 6 U/ml MDH, and the reactionwas started by the addition of 0.2 mM of GTP. Theamount of produced NADH is proportional to PEPCKactivity. Reads were measured at 340 nm at 37 °C in atotal volume of 1 ml using a DU® 800 spectrophotometer(Beckman Coulter, Brea, CA, USA).
ImmunohistochemistryTissue microarray panel (BCN962, Biomax, Rockville,MD, USA) containing multiple organ carcinoma and ad-jacent normal tissue was deparaffinized and rehydratedaccording to standard procedures. Antigen retrieval wasperformed by heating the slide in 10mM sodium citratebuffer (pH 6) in a pressure cooker. The highest pressurewas maintained for 3 min, and samples were let to cooldown for 20min. Endogenous peroxidase activity wasinactivated by incubating samples in 6% H2O2 for 15min.Samples were blocked with 20% goat serum in PBS
and then incubated ON with primary antibody againstPEPCK-M (ab70359, Abcam) and peroxidase-based sec-ondary anti-goat antibody. Antigen-antibody complexeswere detected with a DAB peroxidase substrate kit(Dako Agilent, Santa Clara, CA, USA) according to themanufacturer’s protocol. Samples were counterstainedwith hematoxylin, dehydrated, and mounted with DPX.Fluorescent preparations were visualized, and imageswere captured with Nikon Eclipse 800 light microscope(Nikon, Tokyo, Japan).
MTT assayTo assess cell viability, 0.5 mg/ml of MTT (M2128,Sigma-Aldrich, St. Louis, MO, USA) diluted in DMEMwithout phenol red was added to each well, and plateswere incubated at 37 °C, 5% CO2 for 2 h. The formazanproduct was dissolved in isopropanol, and the absorb-ance of samples was measured using a microplate reader
Hyroššová et al. Cancer & Metabolism (2021) 9:1 Page 3 of 15
at a wavelength of 570 nm with background subtractionat 650 nm.
Soft agar colony formation assayAnchorage-independent growth was determined by plat-ing 5000 cells in 1 ml of 0.35% agarose in 6 well plates.0.7% agarose was mixed in a 1:1 ratio with DMEMmedia, supplemented with 10% FCS, 2 mM glutamine,and 1mM or 25mM glucose, respectively. A layer con-taining cells was overlaid on 0.5% agar in mQ water.Cells were fed with corresponding DMEM media andrefed every 3–4 days. After 2 weeks, colonies werestained with MTT and counted.
MitoSOX stainingMitoSOX™ Red mitochondrial superoxide indicator(M36008, ThermoFisher Scientific, Waltham, MA, USA)was used to measure the production of superoxide inmitochondria. Cells were treated with 5 μM MitoSOX™Red in HBSS/Ca/Mg for 15 min at 37 °C and 5% CO2
protected from light. Cells were washed with HBSS/Ca/Mg. Subsequently, cells were trypsinized, resuspended incorresponding DMEM media without phenol red, andanalyzed by flow cytometry with Gallios™ flow cytometer(Beckman Coulter).
MetabolomicsCells were plated in 6-well plates at 0.25 × 10⁶ cells/welland grown overnight in a growth medium. Next day,cells were washed with PBS and pre-treated withmedium lacking glucose for 3 h and glucose-deprivedmedium supplemented with dialyzed FCS (dFCS) and 2mM uniformly labeled [U-13C]glutamine was added for4 h. In the case of high-glucose media (25 mM glucose),cells were pretreated with fresh complete DMEM mediafor 3 h and subsequently treated with DMEM mediasupplemented with dFCS and 2mM [U-13C]glutaminefor 4 h. At the end of cultivation, cells were washedtwice with cold PBS, snap-frozen with liquid nitrogen,and harvested using an aqueous solution of MeOH(MeOH (80%)/H2O (20%)). The concentration of metab-olites was analyzed by using mass spectrometer API3200 triple quadrupole LC-MS/MS. Enrichment studieswere analyzed by using GC/MS spectrometry (GC/MSAgilent 5975C). Proline enrichment and concentrationof TCA cycle intermediates were analyzed in cells har-vested in 1.8 ml of cold methanol/chloroform (2:1, v:v)and analyzed by using GC/MS spectrometry.
Glucose assayGlucose concentration in media was determined by col-orimetry assay using a glucose oxidase and peroxidasemethod as recommended by manufacturer PGO (P7119,
Sigma-Aldrich, Darmstadt, Germany). Absorbance wasmeasured at 450 nm after 30 min of incubation at 37 °C.
Xenograft models5 × 106 of SW480 WT or SW480 PCK2 CRISPR/Cas9KO was injected in both flanks of female 5–6-week-oldBALB/c nude mice (at least n = 3 per group). Similarly,1 × 106 of HeLa shCtrl, sh1-PCK2, or sh2-PCK2 wasinjected in two mammary fat pads of female 5–6-week-old BALB/c nude mice (at least n = 8 per group). Tumorvolume was measured by calipering in two dimensionsand calculated as [(short length × 2) × long length)]/2.After 15 days (SW480) or 23 days (HeLa), mice were eu-thanized by cervical dislocation, and the tumors col-lected for further analysis. All the animal studies wereapproved by the local committee for animal care (IDI-BELL, DAAM 5766).
Statistical analysisResults are expressed as mean ± SEM. Statistical analysiswas performed by one-way or two-way Anova (Sidakpost hoc test) or unpaired two-tailed Student’s t test,using GraphPad Prism® software. Significance levels areone symbol = p < 0.05, two symbols = p < 0.01, andthree symbols = p < 0.001.
ResultsThe expression of PEPCK-M in healthy organisms ismainly confined to the kidney, liver, pancreas, and smallintestine. Yet, ONCOMINE dataset mining (Supplemen-tary Table 1) demonstrates increased PCK2 mRNAlevels upon malignant transformation in tissues wherePEPCK-M is not originally expressed (Fig. 1a). Tumorsoriginating from tissues where PEPCK-M is highlyexpressed in humans, such as the liver, pancreas, kidney,and gastrointestinal tract showed reduced expression. Incontrast, PCK1 (PEPCK-C) expression was low in all typesof tumors regardless of its levels in healthy tissue (Fig. 1a).Immunohistochemical analysis of tissue microarrays
with multiple normal and cancer tissue samples con-firmed that the PEPCK-M signal was highly associatedwith malignancy, for example, in the prostate, lung,breast, testis, and cervix carcinomas (Fig. 1b). Thehealthy tissue from these organs (the glands of the pros-tate and uterus, and cells of seminiferous tubules) wasminimally stained with PEPCK-M antibody. Finally,PEPCK-M mRNA levels were significantly elevated inclinical samples from cervical squamous cell carcinomapatients as compared to normal tissue (Fig. 1c; P =1.66E-5), from either the metastatic or the non-metastatic dataset [12]. This points to a preferential roleof the mitochondrial isoform of PEPCK in these cancers.A gene ontology enrichment analysis of co-expressed
genes in all available datasets of cervical cancer (Fig. 1d;
Hyroššová et al. Cancer & Metabolism (2021) 9:1 Page 4 of 15
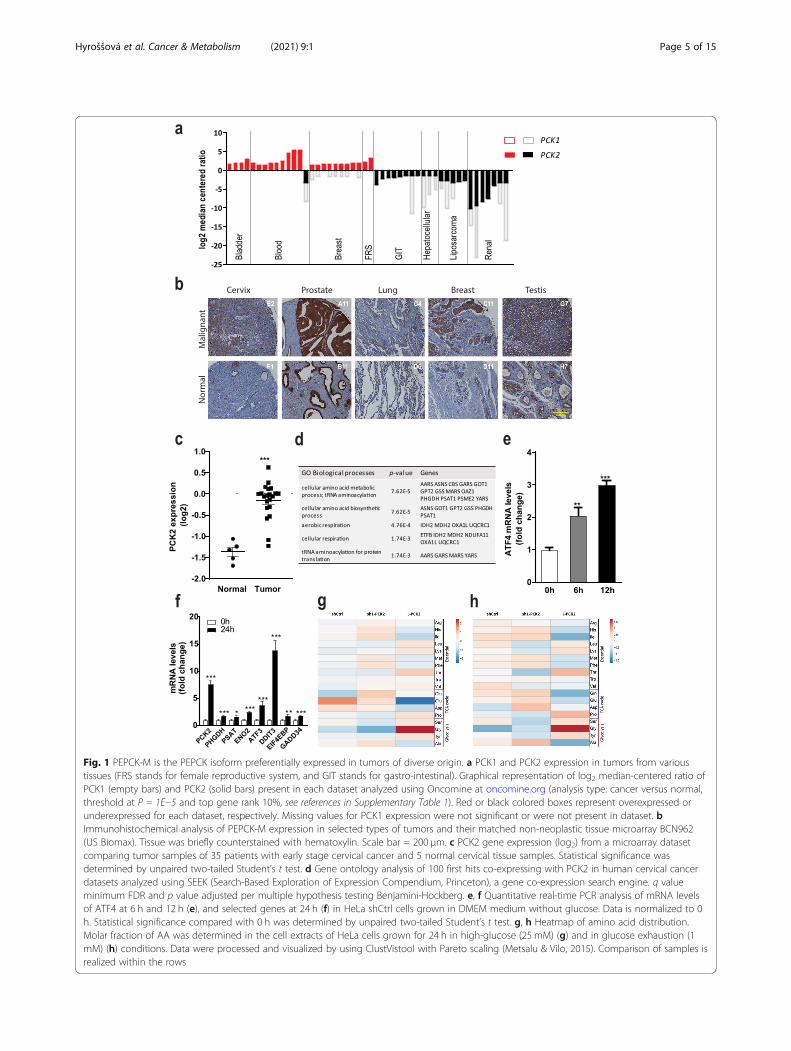
Fig. 1 PEPCK-M is the PEPCK isoform preferentially expressed in tumors of diverse origin. a PCK1 and PCK2 expression in tumors from varioustissues (FRS stands for female reproductive system, and GIT stands for gastro-intestinal). Graphical representation of log2 median-centered ratio ofPCK1 (empty bars) and PCK2 (solid bars) present in each dataset analyzed using Oncomine at oncomine.org (analysis type: cancer versus normal,threshold at P = 1E−5 and top gene rank 10%, see references in Supplementary Table 1). Red or black colored boxes represent overexpressed orunderexpressed for each dataset, respectively. Missing values for PCK1 expression were not significant or were not present in dataset. bImmunohistochemical analysis of PEPCK-M expression in selected types of tumors and their matched non-neoplastic tissue microarray BCN962(US Biomax). Tissue was briefly counterstained with hematoxylin. Scale bar = 200 μm. c PCK2 gene expression (log2) from a microarray datasetcomparing tumor samples of 35 patients with early stage cervical cancer and 5 normal cervical tissue samples. Statistical significance wasdetermined by unpaired two-tailed Student’s t test. d Gene ontology analysis of 100 first hits co-expressing with PCK2 in human cervical cancerdatasets analyzed using SEEK (Search-Based Exploration of Expression Compendium, Princeton), a gene co-expression search engine. q valueminimum FDR and p value adjusted per multiple hypothesis testing Benjamini-Hockberg. e, f Quantitative real-time PCR analysis of mRNA levelsof ATF4 at 6 h and 12 h (e), and selected genes at 24 h (f) in HeLa shCtrl cells grown in DMEM medium without glucose. Data is normalized to 0h. Statistical significance compared with 0 h was determined by unpaired two-tailed Student’s t test. g, h Heatmap of amino acid distribution.Molar fraction of AA was determined in the cell extracts of HeLa cells grown for 24 h in high-glucose (25 mM) (g) and in glucose exhaustion (1mM) (h) conditions. Data were processed and visualized by using ClustVistool with Pareto scaling (Metsalu & Vilo, 2015). Comparison of samples isrealized within the rows
Hyroššová et al. Cancer & Metabolism (2021) 9:1 Page 5 of 15
SEEK at seek.princeton.edu) was then devised to exposePCK2 co-expressed pathways. Interestingly, gluconeo-genesis was not enriched, and members of this pathwayPCK1, FBP1, or G6PC1 are not co-expressors in thisanalysis. The hits on the enrichment table suggest a co-ordinated response with genes of anabolic potential, es-pecially those related to amino acid metabolism andbiosynthetic processes. Consistently, these genes are reg-ulated by the integrated stress response (ISR) throughATF4 in a similar fashion to PCK2 [5], including ASNS,GPT2, SHMT1, PHGDH, or PSAT1. Induction of ER-stress in cervical carcinoma cells (HeLa) by glucosedeprivation showed early upregulation of ATF4 (Fig. 1e)and other target genes of this stress response pathwaysuch as DDIT3, GADD34, ATF3, and EIF4EBP1 at 24 h.As expected, PCK2 was also upregulated together withother genes, such as ENO2, PHGDH, or PSAT1 (Fig. 1f).All in all, this is suggesting a role for PEPCK-M withinthe general TCA cycle and amino acid biosynthesisnodes.Thus, we examined the relative concentration
(molar fraction) of amino acids in cell extracts ofloss-of-function and gain-of-function HeLa squamouscell cervical carcinoma cells using mass spectroscopy(Fig. 1g, h). Amino acids with a relevant role in regu-lating the anabolic potential of the tumor, such asserine, glycine, proline, or threonine, showed in-creased molar fractions with increasing PEPCK-M ex-pression with excess glucose in the media (Fig. 1g)and in a more physiological glucose exhaustion condi-tion (Fig. 1h; 24 h after media refresh with 1 mM glu-cose which is depleted within the initial 12 h; seeSupplementary Figure 2). Therefore, we focused ourattention on understanding the contribution ofPEPCK-M to the pathways involved in the synthesisand degradation of serine, glycine, and proline.
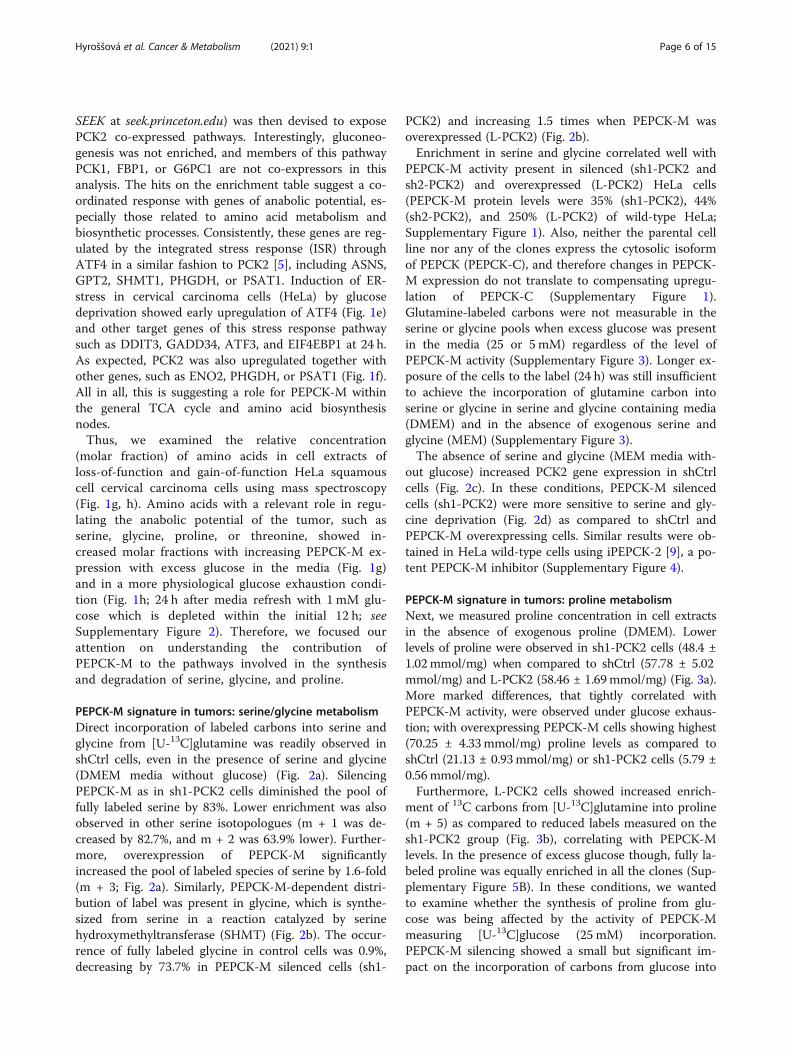
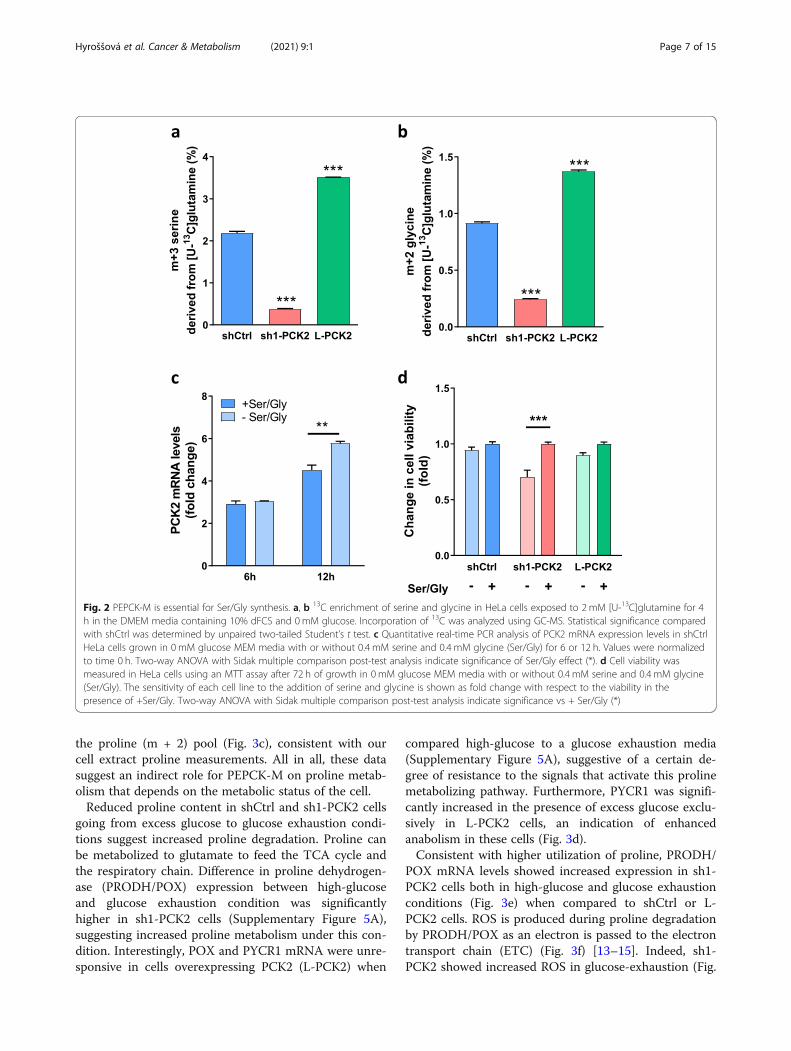
PEPCK-M signature in tumors: serine/glycine metabolismDirect incorporation of labeled carbons into serine andglycine from [U-13C]glutamine was readily observed inshCtrl cells, even in the presence of serine and glycine(DMEM media without glucose) (Fig. 2a). SilencingPEPCK-M as in sh1-PCK2 cells diminished the pool offully labeled serine by 83%. Lower enrichment was alsoobserved in other serine isotopologues (m + 1 was de-creased by 82.7%, and m + 2 was 63.9% lower). Further-more, overexpression of PEPCK-M significantlyincreased the pool of labeled species of serine by 1.6-fold(m + 3; Fig. 2a). Similarly, PEPCK-M-dependent distri-bution of label was present in glycine, which is synthe-sized from serine in a reaction catalyzed by serinehydroxymethyltransferase (SHMT) (Fig. 2b). The occur-rence of fully labeled glycine in control cells was 0.9%,decreasing by 73.7% in PEPCK-M silenced cells (sh1-
PCK2) and increasing 1.5 times when PEPCK-M wasoverexpressed (L-PCK2) (Fig. 2b).Enrichment in serine and glycine correlated well with
PEPCK-M activity present in silenced (sh1-PCK2 andsh2-PCK2) and overexpressed (L-PCK2) HeLa cells(PEPCK-M protein levels were 35% (sh1-PCK2), 44%(sh2-PCK2), and 250% (L-PCK2) of wild-type HeLa;Supplementary Figure 1). Also, neither the parental cellline nor any of the clones express the cytosolic isoformof PEPCK (PEPCK-C), and therefore changes in PEPCK-M expression do not translate to compensating upregu-lation of PEPCK-C (Supplementary Figure 1).Glutamine-labeled carbons were not measurable in theserine or glycine pools when excess glucose was presentin the media (25 or 5 mM) regardless of the level ofPEPCK-M activity (Supplementary Figure 3). Longer ex-posure of the cells to the label (24 h) was still insufficientto achieve the incorporation of glutamine carbon intoserine or glycine in serine and glycine containing media(DMEM) and in the absence of exogenous serine andglycine (MEM) (Supplementary Figure 3).The absence of serine and glycine (MEM media with-
out glucose) increased PCK2 gene expression in shCtrlcells (Fig. 2c). In these conditions, PEPCK-M silencedcells (sh1-PCK2) were more sensitive to serine and gly-cine deprivation (Fig. 2d) as compared to shCtrl andPEPCK-M overexpressing cells. Similar results were ob-tained in HeLa wild-type cells using iPEPCK-2 [9], a po-tent PEPCK-M inhibitor (Supplementary Figure 4).
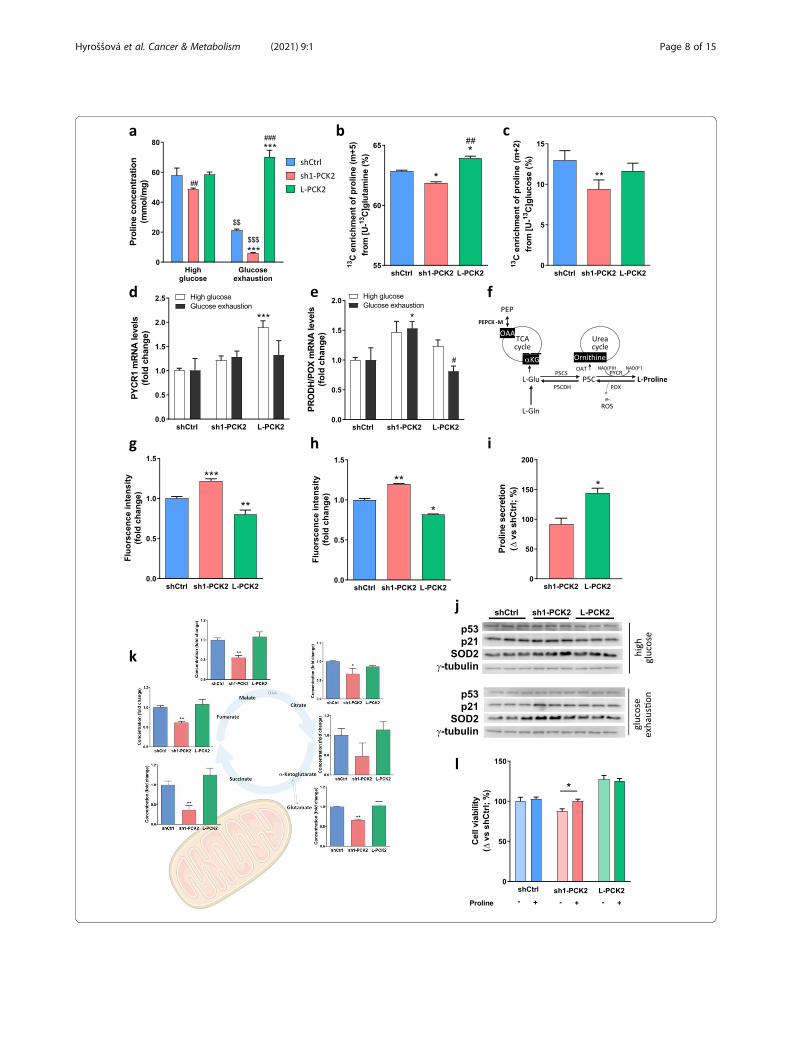
PEPCK-M signature in tumors: proline metabolismNext, we measured proline concentration in cell extractsin the absence of exogenous proline (DMEM). Lowerlevels of proline were observed in sh1-PCK2 cells (48.4 ±1.02mmol/mg) when compared to shCtrl (57.78 ± 5.02mmol/mg) and L-PCK2 (58.46 ± 1.69mmol/mg) (Fig. 3a).More marked differences, that tightly correlated withPEPCK-M activity, were observed under glucose exhaus-tion; with overexpressing PEPCK-M cells showing highest(70.25 ± 4.33mmol/mg) proline levels as compared toshCtrl (21.13 ± 0.93mmol/mg) or sh1-PCK2 cells (5.79 ±0.56mmol/mg).Furthermore, L-PCK2 cells showed increased enrich-
ment of 13C carbons from [U-13C]glutamine into proline(m + 5) as compared to reduced labels measured on thesh1-PCK2 group (Fig. 3b), correlating with PEPCK-Mlevels. In the presence of excess glucose though, fully la-beled proline was equally enriched in all the clones (Sup-plementary Figure 5B). In these conditions, we wantedto examine whether the synthesis of proline from glu-cose was being affected by the activity of PEPCK-Mmeasuring [U-13C]glucose (25 mM) incorporation.PEPCK-M silencing showed a small but significant im-pact on the incorporation of carbons from glucose into
Hyroššová et al. Cancer & Metabolism (2021) 9:1 Page 6 of 15
the proline (m + 2) pool (Fig. 3c), consistent with ourcell extract proline measurements. All in all, these datasuggest an indirect role for PEPCK-M on proline metab-olism that depends on the metabolic status of the cell.Reduced proline content in shCtrl and sh1-PCK2 cells
going from excess glucose to glucose exhaustion condi-tions suggest increased proline degradation. Proline canbe metabolized to glutamate to feed the TCA cycle andthe respiratory chain. Difference in proline dehydrogen-ase (PRODH/POX) expression between high-glucoseand glucose exhaustion condition was significantlyhigher in sh1-PCK2 cells (Supplementary Figure 5A),suggesting increased proline metabolism under this con-dition. Interestingly, POX and PYCR1 mRNA were unre-sponsive in cells overexpressing PCK2 (L-PCK2) when
compared high-glucose to a glucose exhaustion media(Supplementary Figure 5A), suggestive of a certain de-gree of resistance to the signals that activate this prolinemetabolizing pathway. Furthermore, PYCR1 was signifi-cantly increased in the presence of excess glucose exclu-sively in L-PCK2 cells, an indication of enhancedanabolism in these cells (Fig. 3d).Consistent with higher utilization of proline, PRODH/
POX mRNA levels showed increased expression in sh1-PCK2 cells both in high-glucose and glucose exhaustionconditions (Fig. 3e) when compared to shCtrl or L-PCK2 cells. ROS is produced during proline degradationby PRODH/POX as an electron is passed to the electrontransport chain (ETC) (Fig. 3f) [13–15]. Indeed, sh1-PCK2 showed increased ROS in glucose-exhaustion (Fig.
Fig. 2 PEPCK-M is essential for Ser/Gly synthesis. a, b 13C enrichment of serine and glycine in HeLa cells exposed to 2 mM [U-13C]glutamine for 4h in the DMEM media containing 10% dFCS and 0mM glucose. Incorporation of 13C was analyzed using GC-MS. Statistical significance comparedwith shCtrl was determined by unpaired two-tailed Student’s t test. c Quantitative real-time PCR analysis of PCK2 mRNA expression levels in shCtrlHeLa cells grown in 0 mM glucose MEM media with or without 0.4 mM serine and 0.4 mM glycine (Ser/Gly) for 6 or 12 h. Values were normalizedto time 0 h. Two-way ANOVA with Sidak multiple comparison post-test analysis indicate significance of Ser/Gly effect (*). d Cell viability wasmeasured in HeLa cells using an MTT assay after 72 h of growth in 0 mM glucose MEM media with or without 0.4 mM serine and 0.4 mM glycine(Ser/Gly). The sensitivity of each cell line to the addition of serine and glycine is shown as fold change with respect to the viability in thepresence of +Ser/Gly. Two-way ANOVA with Sidak multiple comparison post-test analysis indicate significance vs + Ser/Gly (*)
Hyroššová et al. Cancer & Metabolism (2021) 9:1 Page 7 of 15
Hyroššová et al. Cancer & Metabolism (2021) 9:1 Page 8 of 15
3g) and glucose-abundant (Fig. 3h) conditions, as quanti-fied using a mitochondrial ROS indicator (MitoSOX).Interestingly, the L-PCK2 clone demonstrated reducedROS production in glucose exhaustion conditions be-yond shCtrl, in parallel with higher net secretion of pro-line into the media (Fig. 3i), further indicating a linkbetween proline metabolism and ROS homeostasis thatis closely associated to PEPCK-M activity in the tumorcell. In effect, silencing PEPCK-M concurred with en-hanced ROS-mediated signaling as evidenced by increasedSOD2 and TP53/P21 proteins in sh1-PCK2, both in thepresence of abundant glucose in the media (Fig. 3j; toppanel) and in glucose exhaustion conditions (Fig. 3j; bot-tom panel). Also, alterations coincided with a systematicblock on the TCA cycle as the pool of most intermediateswas significantly lower in sh1-PCK2 cells (Fig. 3k).As PEPCK-M silencing (sh1-PCK2) alters proline me-
tabolism and ROS homeostasis, we aimed to assesswhether these stimuli reduced cell viability. Indeed, via-bility was reduced in PCK2-silenced cells and restored atleast in part by proline supplementation in the media(Fig. 3l). This was also observed in a different model,HCT116 colon carcinoma, after inhibition of PEPCK-Musing iPEPCK-2 (Supplementary Figure 5C).
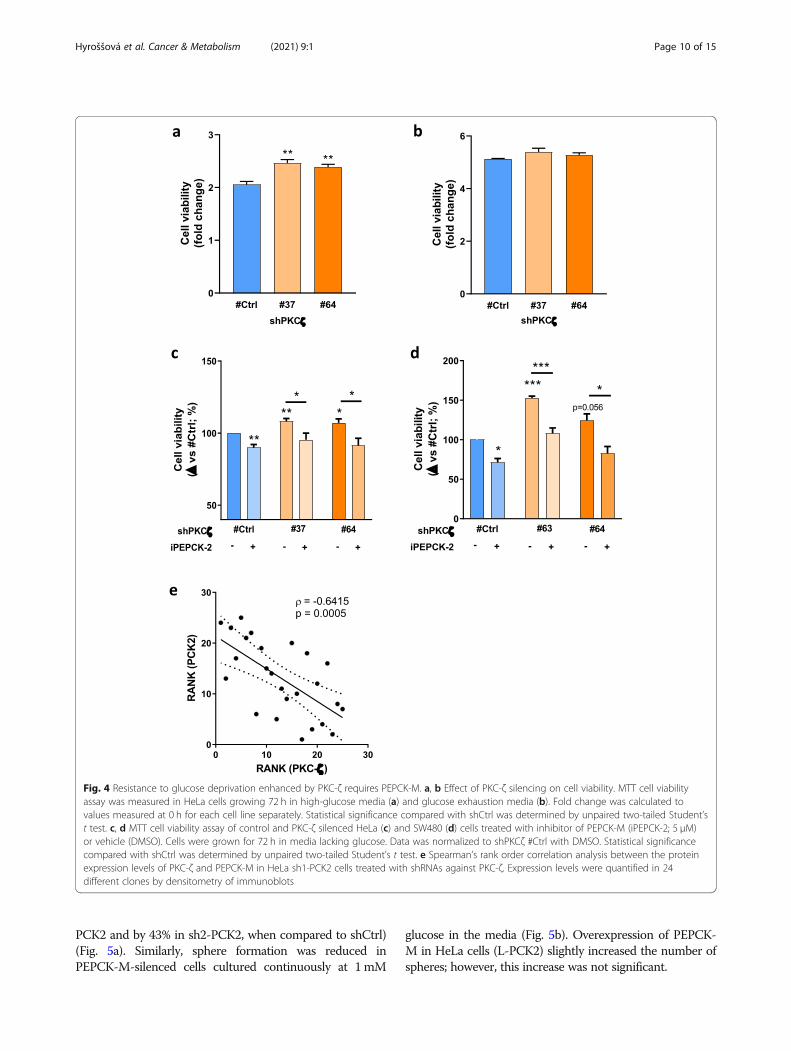
PKC-ζ downregulation growth advantage requires PEPCK-M activitySeveral tumor survival pathways are involved in the re-cruitment of alternative metabolic pathways, including thedownregulation of the PKC-ζ tumor suppressor [10], thattriggers the utilization of glutamine carbon when glucoseis limiting to cope with amino acid synthesis for survival
and growth. We confirmed that cell survival is boostedafter PKC-ζ downregulation in cervix (HeLa) carcinomacells in glucose exhaustion conditions (Fig. 4a), but not inconditions of excess glucose (Fig. 4b), using two independ-ent clones of HeLa cells constitutively expressing shRNAagainst PKC-ζ. We then examined whether the advantageobserved in cell growth upon PKC-ζ downregulation re-quired the PEPCK-M axis, as it is the only pathway thatconnects TCA carbons with routes of amino acid synthe-sis, as presented above. Treatment with iPEPCK-2 toblock PEPCK-M activity blunted the growth advantageprovided by the downregulation of PKC-ζ (Fig. 4c). Thisobservation was confirmed in a different model, SW480colon carcinoma, where downregulation of PKC-ζ pro-vided a survival advantage in the absence of glucose thatwas again lessened when PEPCK-M was inhibited usingiPEPCK-2 (Fig. 4d). Further, we observed strong anti-correlation fit between PKC-ζ and PEPCK-M (Fig. 4e) inHeLa sh1-PCK2 cells treated with shRNAs against PKC-ζ,altogether suggesting cross-regulation of both pathways inconditions of glucose limitation.
The implication of PEPCK-M in tumor growth in patho-physiological modelsThe ability to form spheres in an anchorage-independentmanner (in semisolid media without attachment) is an indi-cator of tumorigenic and metastatic potential [16, 17], as itmimics diminished nutrient availability and increasedmicroenvironment stress in the tumor. HeLa cells grown insoft agar were able to form spheres after four weeks of in-cubation (Fig. 5a; shCtrl), and sphere formation was re-duced severely in PEPCK-M silenced cells (by 70% in sh1-
Fig. 3 PEPCK-M influences proline metabolism. a Concentration of proline in HeLa cells grown for 24 h in high-glucose (25 mM) and glucoseexhaustion (1 mM) conditions. Amount of proline was normalized to mg of protein. Concentration was analyzed by LC-MS. Two-way ANOVA withSidak multiple comparison post-test analysis indicate significance versus shCtrl within media treatment (*), significance between sh1-PCK2 and L-PCK2 within media treatments (#), and significance of media treatment effect ($). b Full 13C enrichment of proline in HeLa cells exposed to 2 mM[U-13C]glutamine for 4 h in the DMEM media containing 10% dFCS and 0mM glucose. Full incorporation of 13C was analyzed using GC-MS (+4carbon in GC-MS analysis corresponding to m + 5 on LCMS). One-way ANOVA with Sidak multiple comparison post-test analysis indicatesignificance versus shCtrl (*), and significance between sh1-PCK2 and L-PCK2 (#). c 13C enrichment of proline in HeLa cells was exposed to 25 mM[U-13C]glucose for 4 h in the DMEM media containing 10% dFCS. Incorporation of 13C was determined by the +2 carbon on GC-MS andcorresponded to m + 2 on LCMS. One-way ANOVA with Sidak multiple comparison post-test analysis indicate significance versus shCtrl (*), andsignificance between sh1-PCK2 and L-PCK2 (#). d, e Quantitative real-time PCR analysis of PYCR1 (d) and PRODH/POX (e) mRNA expression levelsin HeLa cells grown for 24 h in high-glucose (25 mM) and glucose exhaustion (1 mM) conditions. Values were normalized to shCtrl for eachcondition. One-way ANOVA with Sidak multiple comparison post-test analysis indicate significance versus shCtrl (*), and significance betweensh1-PCK2 and L-PCK2 (#). f Proline metabolism pathway and its implications for ROS formation. g, h Production of mitochondrial superoxide inHeLa cells treated for 3 h in glucose exhaustion (1 mM) (g) and high-glucose (25 mM) (h) conditions. Superoxide was quantified using MitoSOXfluorescent marker, and mean intensity was measured by flow cytometry. Statistical significance compared with shCtrl was determined byunpaired two-tailed Student’s t test. i Secretion of proline in high-glucose DMEM media (not containing proline) by HeLa cells after 24 h.Concentration of proline was normalized to protein and plotted as % of shCtrl secretion. Concentration was analyzed by LC-MS. Statisticalsignificance between sh1-PCK2 and L-PCK2 was determined by using unpaired two-tailed Student’s t test. j Western blot analysis of p53, p21, andSOD2 in HeLa cells grown for 24 h in high-glucose (25 mM) and glucose exhaustion (1 mM) conditions. Gamma tubulin was used as loadingcontrol. k Concentration of TCA cycle intermediates in HeLa cells grown 24 h in high-glucose media (25 mM). Concentration of metabolites wasnormalized to protein, and fold change was calculated to shCtrl cells. Concentration was analyzed by GC-MS. One-way ANOVA with Sidakmultiple comparison post-test analysis indicate significance versus shCtrl. l Cell viability was measured in HeLa cells using an MTT assay after 48 hgrowth in DMEM media lacking glucose with or without supplementation with proline (5 mM). Data are normalized to shCtrl cells grown in theabsence of proline. Statistical significance was determined by using unpaired two-tailed Student’s t test
Hyroššová et al. Cancer & Metabolism (2021) 9:1 Page 9 of 15
PCK2 and by 43% in sh2-PCK2, when compared to shCtrl)(Fig. 5a). Similarly, sphere formation was reduced inPEPCK-M-silenced cells cultured continuously at 1mM
glucose in the media (Fig. 5b). Overexpression of PEPCK-M in HeLa cells (L-PCK2) slightly increased the number ofspheres; however, this increase was not significant.
Fig. 4 Resistance to glucose deprivation enhanced by PKC-ζ requires PEPCK-M. a, b Effect of PKC-ζ silencing on cell viability. MTT cell viabilityassay was measured in HeLa cells growing 72 h in high-glucose media (a) and glucose exhaustion media (b). Fold change was calculated tovalues measured at 0 h for each cell line separately. Statistical significance compared with shCtrl was determined by unpaired two-tailed Student’st test. c, d MTT cell viability assay of control and PKC-ζ silenced HeLa (c) and SW480 (d) cells treated with inhibitor of PEPCK-M (iPEPCK-2; 5 μM)or vehicle (DMSO). Cells were grown for 72 h in media lacking glucose. Data was normalized to shPKCζ #Ctrl with DMSO. Statistical significancecompared with shCtrl was determined by unpaired two-tailed Student’s t test. e Spearman’s rank order correlation analysis between the proteinexpression levels of PKC-ζ and PEPCK-M in HeLa sh1-PCK2 cells treated with shRNAs against PKC-ζ. Expression levels were quantified in 24different clones by densitometry of immunoblots
Hyroššová et al. Cancer & Metabolism (2021) 9:1 Page 10 of 15
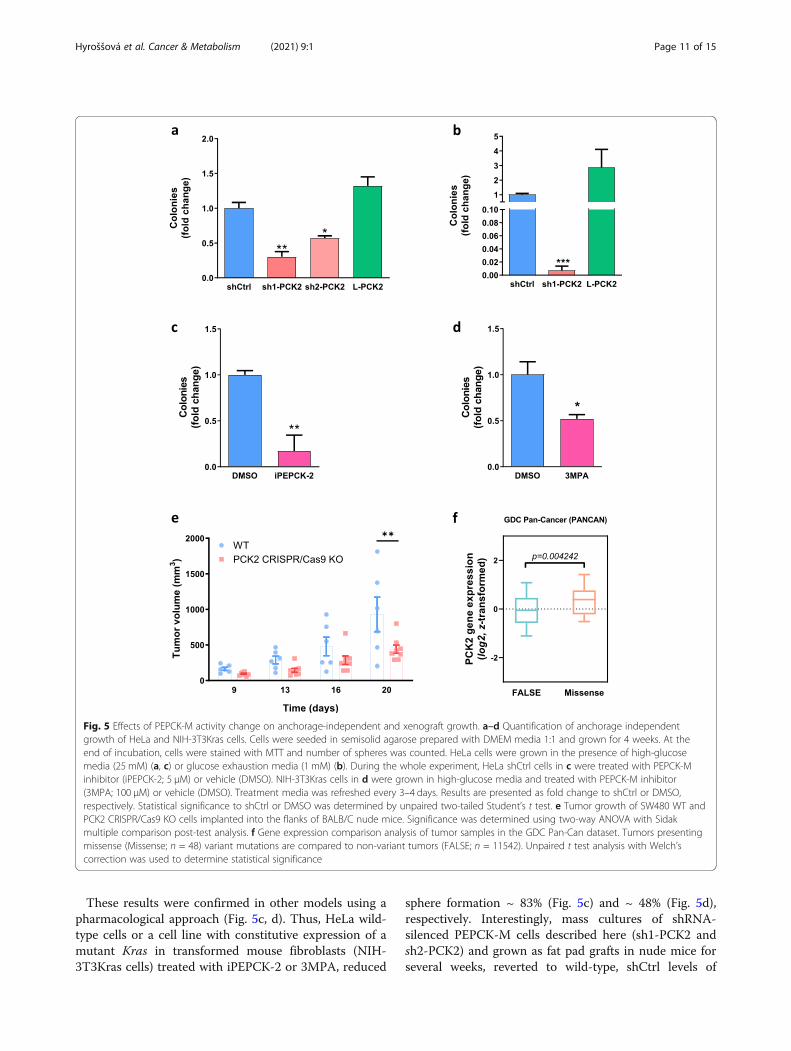
These results were confirmed in other models using apharmacological approach (Fig. 5c, d). Thus, HeLa wild-type cells or a cell line with constitutive expression of amutant Kras in transformed mouse fibroblasts (NIH-3T3Kras cells) treated with iPEPCK-2 or 3MPA, reduced
sphere formation ~ 83% (Fig. 5c) and ~ 48% (Fig. 5d),respectively. Interestingly, mass cultures of shRNA-silenced PEPCK-M cells described here (sh1-PCK2 andsh2-PCK2) and grown as fat pad grafts in nude mice forseveral weeks, reverted to wild-type, shCtrl levels of
Fig. 5 Effects of PEPCK-M activity change on anchorage-independent and xenograft growth. a–d Quantification of anchorage independentgrowth of HeLa and NIH-3T3Kras cells. Cells were seeded in semisolid agarose prepared with DMEM media 1:1 and grown for 4 weeks. At theend of incubation, cells were stained with MTT and number of spheres was counted. HeLa cells were grown in the presence of high-glucosemedia (25 mM) (a, c) or glucose exhaustion media (1 mM) (b). During the whole experiment, HeLa shCtrl cells in c were treated with PEPCK-Minhibitor (iPEPCK-2; 5 μM) or vehicle (DMSO). NIH-3T3Kras cells in d were grown in high-glucose media and treated with PEPCK-M inhibitor(3MPA; 100 μM) or vehicle (DMSO). Treatment media was refreshed every 3–4 days. Results are presented as fold change to shCtrl or DMSO,respectively. Statistical significance to shCtrl or DMSO was determined by unpaired two-tailed Student’s t test. e Tumor growth of SW480 WT andPCK2 CRISPR/Cas9 KO cells implanted into the flanks of BALB/C nude mice. Significance was determined using two-way ANOVA with Sidakmultiple comparison post-test analysis. f Gene expression comparison analysis of tumor samples in the GDC Pan-Can dataset. Tumors presentingmissense (Missense; n = 48) variant mutations are compared to non-variant tumors (FALSE; n = 11542). Unpaired t test analysis with Welch’scorrection was used to determine statistical significance
Hyroššová et al. Cancer & Metabolism (2021) 9:1 Page 11 of 15
PEPCK-M expression suggesting significant selectivepressure in the tumor to favor cells with higher levels ofPEPCK-M (Supplementary Figure 6). Therefore, we de-signed null mutants (PCK2 CRISPR/Cas9 KO) to furtherinvestigate the capacity of PEPCK-M to sustain tumorgrowth in vivo in a xenograft model. A colon carcinomamodel, SW480 was selected instead of HeLa because itcarries only one copy of chromosome 14 where thePCK2 gene is located, as compared to the multiple cop-ies found in the HeLa genome, simplifying CRISPR/Cas9use. These models have been previously characterizedand show similar effects on cellular viability as the HeLamodel of PEPCK-M knockdown presented here [9]. BothPCK2 CRISPR/Cas9 KO and wild-type (WT) cells werethen injected into the flanks of immunocompromisedNOD/SCID mice and allow to grow in the absence ofexternal nutritional stress (chow). Tumor growth wasblunted in PCK2 CRISPR/Cas9 KO cells as compared toWT (Fig. 5e).
DiscussionMetabolic reprogramming is a hallmark of cancer thathelps tumors cope with anabolism and energy demandsfor growth and invasion [18]. In this article, we proposePEPCK-M as a key player in this hallmark when glucoselevels drop and tumors must shift to use other sub-strates, such as glutamine. An expression signature formitochondrial PEPCK (PEPCK-M) is present in mostcancer cells examined. On the contrary, most tumorsanalyzed showed very low or no expression of PEPCK-C,the cytosolic form of this enzyme. Interestingly, the tu-mors originating from tissues that originally expresscytosolic and mitochondrial isoforms, such as the kidneyand liver, maintain expression of both upon malignancy.However, PEPCK-C expression levels dropped in thesetumors, as reported elsewhere in hepatocellular carcin-oma and colon cancer [19, 20]. PEPCK-M expression,on the other hand, did not decrease as much in the tu-mors originating from the liver. These data point to adeleterious impact of gluconeogenic pathways in cancerprogression reinforced by similar behavior for glucose-6phosphatase and fructose bisphospatase-1 in human ma-lignancies of gluconeogenic tissues [20, 21]. PEPCK-Cmight participate in specific phases of the tumor pro-gression in adaptative responses that are key to cancerdevelopment as it is suggested by its participation insome metabolic adaptations in hepatocarcinoma [22]and melanoma [23].A clue on the mechanism for the integrative role of
PEPCK-M in cancer metabolism arises from its transcrip-tion regulation by ATF4 under nutrient stress [24, 25]. Inthese conditions, we demonstrate the functional relevanceof the pathway to feed 13C-labeled carbons from glutam-ine into phosphoenolpyruvate (PEP), serine, and glycine,
demonstrating that cataplerosis of TCA cycle 4-carbon in-termediates towards PEP, serine, and glycine was specific-ally dependent on PEPCK-M flux. Even thoughenrichment was seemingly low, labeling incubation wasvery short by design as we aimed to avoid saturation ofthe labeling pattern in various TCA cycle intermediates toproperly assess cataplerosis. It is also important to men-tion that labeling studies were performed in the presenceof exogenous serine and glycine. This may lead to anunderestimation of isotope labeling due to equilibrationwith unlabeled exogenous sources as pointed out byDeNicola et al. [26]. The nearly linear relationship withPEPCK-M protein in silenced (sh1-PCK2; ~ 35%), wild-type (shCtrl; 100%), and overexpressed (L-PCK2; ~250%)clones suggests a good control of the flux rates towardsthis pathway exerted by PEPCK-M, unlike the low controlcoefficient shown for PEPCK-C in liver gluconeogenesis[27]. These data are consistent with the observation fromVincent et al. that carbons originating from glutamine fluxfed into serine under glucose deprivation via PEPCK-M[28] in A549 NSCLC cells, known to withstand glucosedeprivation and even proliferate in the presence of glu-tamine. In contrast, HeLa cells did not cope well with thesevere stress-induced by total glucose depletion as theystop to grow and total cell number was decreased overtime, although PEPCK-M overexpression did enhancesomewhat the ability of these cells to survive in theseconditions.PEPCK-M overexpressing cells showed an anabolic
phenotype, with higher serine consumption from themedia (data not shown), and a higher molar fraction ofamino acids synthesized from either PEP (tyrosine), 3PG(serine and glycine), or intermediaries of the TCA cycle(aspartate and proline). Besides, proline secretion wassignificantly increased in HeLa cells with overexpressedPEPCK-M which correlated with higher expression ofPYCR enzyme that converts pyrroline-5-carboxylate toproline, in both glucose concentrations tested. Indeed,lower proline concentration in PEPCK-M silenced cells,together with higher expression of POX, an enzyme in-volved in the catabolism of proline, points to increasedproline turnover or consumption in PEPCK-M limitingconditions, and supports a role for PEPCK-M in the bio-synthesis of proline, albeit indirectly.The importance of proline for cancer growth might also
involve the NADPH/NADP+ equilibrium and the gener-ation of ROS consequence of proline cycling [29, 30]. Ourdata is consistent with this view, and with previous obser-vations that increased proline metabolism correlated withhigher ROS production at the PRODH/POX node, and ablockade in TCA cycle flux [15], a general mechanism tocope with hypoxic stress [31]. These events identify ametabolic disturbance that bear on the health status of thecells with reduced PEPCK-M activity (i.e., sh1-PCK2),
Hyroššová et al. Cancer & Metabolism (2021) 9:1 Page 12 of 15
albeit with minimal effects on cell viability and apoptosisin the absence of nutrient stress [5, 6, 9].Based on the results shown, and previous data on neur-
onal progenitors suggesting a role for PEPCK-M in ECM[32], we believe that this pathway might be relevant to theproteostatic phenotype. In this regard, its role in the con-trol of the anabolic potential of the cell is very consistentwith the observation that PEPCK-M loss has a greater im-pact on 3D culture homeostasis (i.e., anchorage-independent colony formation) than what might be in-ferred from cell culture silencing studies [6, 7, 9]. More-over, the synthesis of proline is activated by c-Myc [14],and PEPCK-M might influence this pathway through itsregulation of calcium fluxes by modulating PEP levels andSERCA activity in cancer cells [6, 33], that in turn triggersthe CAMKIIγ-dependent phosphorylation andstabilization of c-Myc. Interestingly, PEPCK-M can impacton metabolism by regulating the PEP levels even in thepresence of excess glucose in HCT116 cells [6]. However,in the present study using HeLa cells, we have not beenable to measure specific flux of carbons from glutamineinto serine and glycine in these conditions, even with ex-tended incubation times. An indirect contribution ofPEPCK-M to the glycolytic flux cannot reconcile thesedata since glycolytic flux measured in HCT116 andSW480 cells with [5-3H]-glucose showed no changes afterPEPCK-M inhibition [6]. A similar conundrum was identi-fied by Maddocks et al. who detected the formation of un-labeled serine in HCT116 cells grown in the presence offully labeled glucose and the absence of exogenous serineand glycine [34], pointing to the implication of a differentpathway towards serine synthesis, which might involvePEPCK-M. This idea is also supported by thephenomenon occurring in adipocytes, where glyceroneo-genesis is the main source of triglycerides even in thepresence of glucose [35].In addition to c-Myc, other central regulators of metabol-
ism in the tumor have recently surfaced that might directlyimpact on the PEPCK-M pathway. One such example isPKC-ζ, a member of the atypical PKC family whose losshas been shown to enhance glutamine utilization and serineand glycine synthesis in conditions of glucose deprivation[10]. The role of PKC-ζ in glucose limiting conditions wascorroborated in our lab both in the HeLa and the SW480cell models using shRNA. In these models, PEPCK-M wasnecessary to support the successful metabolic reprogram-ming of PKC-ζ loss. Furthermore, regulatory anti-correlation between PEPCK-M and PKC-ζ levels were ob-served in several independent clones tested where PKC-ζexpression was silenced using various sequences of shRNA,pointing towards the interaction of both pathways in re-sponse to nutrient stress. The relevance of these findingsfor tumor biology is highlighted by an initial analysis of theexpression of PCK2 in tumors from the GDC Pan-Can
dataset showing increased expression of the gene in tumorspresenting missense variant mutations as compared tonon-variant samples (Fig. 5f). This data, together with theabundant information on the importance of PKC-ζ sup-pression in tumor growth in vivo [36, 37], support a rele-vant link between these two pathways in connection withtumor viability and growth.
ConclusionsAll in all, our work described mechanisms for metabolicflexibility in cancer cells that are dependent on PEPCK-M activity. PEPCK-M-driven cataplerosis, in sync withPKC-ζ suppression, adds a dynamic provision of sub-strates to cancer cells for keeping-up with stress andpromote anabolism.The mechanism for the supportive role of PEPCK-M
in cancer cells opens a therapeutic window and en-hances our understanding of cancer metabolism. Finally,these studies support this enzyme as a target in thispathology and will serve as a set point for continuingour development of new therapeutic strategies involvingrelated pathways.
Supplementary InformationThe online version contains supplementary material available at https://doi.org/10.1186/s40170-020-00236-3.
Additional file 1: Supplementary Table 1. Oncomine datasetsreference list. Log2 median centered ratio of PCK1 and PCK2 in differentcancers analyzed with Oncomine (https://www.oncomine.org; Rhodeset al., 2004). Analysis type: Cancer versus Normal, threshold at p=1E-5 andtop gene rank 10%. Missing values for PCK1 expression were notsignificant or were not analyzed in given dataset. Reference to originalstudy is listed.
Additional file 2: Supplementary Figure 1. HeLa model with stablesilencing and overexpression of PEPCK-M. Silencing and overexpressionwere obtained using lentiviral vectors containing inserts of shRNA againstPCK2 or inserts of PCK2 cDNA, respectively. (A) Western blot analysis ofmitochondrial and cytosolic PEPCK expression levels in HeLa cells with al-tered PEPCK-M expression levels: overexpressed (L-PCK2), basal (shCtrland WT) and knocked down PEPCK-M (sh1-PCK2 and sh2-PCK2). As apositive control of PEPCK-C expression, extracts from mouse liver and Faohepatoma cells were used. (B) Western blot quantification of PEPCK-Mprotein abundance in HeLa modified lines. PEPCK-M expression was nor-malized by gamma tubulin. Results are represented as fold change toHeLa WT. One-way Anova with Sidak multiple comparison post-test ana-lysis indicate significance versus WT. (C) PEPCK-M enzymatic activity inHeLa shCtrl, sh1-PCK2, sh2-PCK2 and L-PCK2 cells grown in basal condi-tions was measured by production of NADH. One-way Anova with Sidakmultiple comparison post-test analysis indicate significance versus shCtrl.Supplementary Figure 2. Time course of glucose depletion under glu-cose exhaustion conditions. HeLa shCtrl cells were washed 3 times withPBS and treated with DMEM medium containing 1 mM glucose. Concen-tration of glucose in medium was measured every 3 h, up to 24 h. Sup-plementary Figure 3. 13C enrichment of serine and glycine in HeLacells. (A) Cells were exposed to 2 mM [U-13C]glutamine for 4 h in theDMEM media containing 10% dFCS and 25 mM glucose. Incorporation of13C into proline was analyzed using GC-MS. (B) HeLa shCtrl cells were ex-posed to 2 mM [U-13C]glutamine for 4 h in the DMEM media containing10% dFCS and 25 mM glucose or media lacking serine and glycine (MEM)containing 10% dFCS and 5 mM glucose. Incorporation of 13C was ana-lyzed using GC-MS. Negative values were set as 0. Supplementary
Hyroššová et al. Cancer & Metabolism (2021) 9:1 Page 13 of 15
Figure 4. PEPCK-M inhibition with iPEPCK-2 effects on viability aredependent on Ser/Gly. MTT cell viability assay of HeLa shCtrl cells after72 h of growth in 0 mM glucose MEM media with or without 0.4 mMserine and 0.4 mM glycine (Ser/Gly). Cells were treated with PEPCK-M in-hibitor iPEPCK-2 (5 μM). Fold change was calculated to minus Ser/Glycondition. Significance was determined using two-way Anova with Sidakmultiple comparison post-test analysis. Supplementary Figure 5. Glu-cose content and PEPCK-M activity modulates Proline metabolism. (A)Quantitative real time PCR analysis of PYCR1 and PRODH/POX mRNA ex-pression levels in HeLa cells grown in glucose exhaustion (1 mM) condi-tions for 24 h. Values were normalized to high glucose (25 mM) conditionwhich is represented by dotted line. Statistical significance to shCtrl wasdetermined by using unpaired two-tailed Student's t-test. (B) 13C enrich-ment of proline in HeLa cells were exposed to 2 mM [U-13C]glutamine for4 h in the DMEM media containing 10% dFCS and 25 mM glucose. In-corporation of 13C was analyzed using GC-MS. One-way Anova with Sidakmultiple comparison post-test analysis did not show significant differ-ences. (C) Proline effects (5 mM) on viability after iPEPCK-2 treatment(4.3 μM) on HCT116 colon carcinoma cells grown in DMEM media lackingglucose for 48 h. Cell viability was measured using an MTT assay Statisticalsignificance was determined by using unpaired two-tailed Student's t-test. Supplementary Figure 6. Loss of PEPCK-M silencing in xenograftsfrom HeLa cell clones. (A) Tumor growth of HeLa cells implanted intomammary fat pad of BALB/C nude mice. One-way Anova with Sidak mul-tiple comparison post-test analysis did not show significant differences.(B) Western blot analysis of PEPCK-M in tumors from A. Gamma tubulinwas used as loading control.
AcknowledgementsWe acknowledge the skillful technical support by the Scientific and TechnicalServices at the University of Barcelona, Bellvitge Campus, and to the“Consorci de Serveis Universitaris de Catalunya” (CSUC) for computationalfacilities. We are indebted with Dr. Gabriel Pons for his help with the CRISPR/Cas9 cell line development.
Authors’ contributionsPH: performed the experiments, collected and analyze the data, and wrotethe manuscript. MA: performed the experiments, collected and analyze thedata, and discussed the preliminary draft and provided feedback on generaland specific details of the manuscript. JMF: performed the experiments, andcollected and analyze the data. XF: performed the experiments, andcollected and analyze the data. AML: performed the experiments, collectedand analyze data, and discussed the preliminary draft and provided feedbackon general and specific details of the manuscript. PMGR: discussed thepreliminary draft and provided feedback on general and specific details ofthe manuscript. SB: discussed the preliminary draft and provided feedbackon general and specific details of the manuscript. AF: performed theexperiments, collected and analyze data, and discussed the preliminary draftand provided feedback on general and specific details of the manuscript. FV:analyzed the data and discussed the preliminary draft and providedfeedback on general and specific details of the manuscript. JCP: analyzed thedata, discussed the preliminary draft and provided feedback on general andspecific details of the manuscript, conceived of the work, and wrote themanuscript. The authors read and approved the final manuscript.
FundingThis work was supported by grants from the Spanish “Ministerio de Ciencia eInnovación” (PID2019-106640RB-I00) to JCP, Generalitat de Catalunya(2017SGR106, 2017SGR204, and 2017SGR1746), the European Union(European Regional Development Fund, FEDER), and the Robert A. WelchFoundation (I-1804) to SCB. We are indebted to the “Ministerio deEducación” FPU and the “Ministerio de Economia y Competitividad” (MINECO) FPI for the financial support for PH and JMF, respectively, and to theGeneralitat de Catalunya FI program for partial financial support for MA.
Availability of data and materialsNo datasets were generated in the course of the work presented here;therefore, data archival does not apply for this study. All data is availablefrom the authors and will be archived for a certain amount of time subjectto regulations by the institution (University of Barcelona).
Ethics approval and consent to participateAll animals were treated according to protocols approved by theDepartment of the Environment and Housing (DMAH, Generalitat deCatalunya, Spain) in an SPF housing facility located at the IDIBELL/BellvitgeCampus of the University of Barcelona with free access to food and waterunder a physiological light/dark cycle. No breeding was necessary for theexperimental procedures described, and all animals were provided bycommercial vendors prior to utilization. A 1-week adaptation period wasallowed before handling for experimental procedures. The research was con-ducted in compliance with the Spanish legislation on the “Protection of Ani-mals Used for Experimental and Other Scientific Purposes” and inaccordance with the EU Directive 2010/63/EU on this subject. Besides, thestudy complies with the ARRIVE guidelines developed by the NC 3Rs andthe efforts to reduce the number of subjects used.
Consent for publicationN/A.
Competing interestsWe declare no conflict of interest, financial, or otherwise, in relation to thework described here.
Author details1Department of Physiological Sciences, School of Medicine, University ofBarcelona, Feixa Llarga s/n, 08907 L’Hospitalet del Llobregat, Spain. 2Centerfor Human Nutrition and Department of Pharmacology, University of Texas,Dallas 75390, USA. 3IDIBELL, Gran Via de l’Hospitalet 199, 08908 L’Hospitaletde Llobregat, Spain.
Received: 17 July 2020 Accepted: 3 December 2020
References1. Chang HC, Lane MD. The enzymatic carboxylation of phosphoenolpyruvate.
II. Purification and properties of liver mitochondrial phosphoenolpyruvatecarboxykinase. J Biol Chem. 1966;241:2413–20.
2. Nordlie RC, Lardy HA. Mammalian liver phosphoneolpyruvate carboxykinaseactivities. J Biol Chem. 1963;238:2259–63 Available from: http://www.ncbi.nlm.nih.gov/pubmed/13938894.
3. Hanson RW, Garber AJ. Phosphoenolpyruvate carboxykinase. I. Its role ingluconeogenesis. Am J Clin Nutr. 1972;25:1010–21.
4. Méndez-Lucas A, Duarte JAG, Sunny NE, Satapati S, He T, Fu X, et al. PEPCK-M expression in mouse liver potentiates, not replaces, PEPCK-C mediatedgluconeogenesis. J Hepatol. 2013;59:105–13.
5. Méndez-Lucas A, Hyroššová P, Novellasdemunt L, Viñals F, Perales JC.Mitochondrial phosphoenolpyruvate carboxykinase (PEPCK-M) is a pro-survival, endoplasmic reticulum (ER) stress response gene involved in tumorcell adaptation to nutrient availability. J Biol Chem. 2014;289:22090–102.
6. Moreno-felici J, Hyroššová P, Aragó M, Rodríguez-arévalo S, Garcia-RovésPM, Perales JC. Phosphoenol pyruvate from glycolysis and PEPCK regulatecancer cell fate by altering cytosolic Ca2+. Cells. 2020;9:1–16.
7. Leithner K, Hrzenjak A, Trötzmüller M, Moustafa T, Köfeler HC, Wohlkoenig C,et al. PCK2 activation mediates an adaptive response to glucose depletionin lung cancer. Oncogene. 2015;34:1044–50.
8. Park J-W, Kim SC, Kim WK, Hong JP, Kim K-H, Yeo HY, et al. Expression ofphosphoenolpyruvate carboxykinase linked to chemoradiation susceptibilityof human colon cancer cells. BMC Cancer. 2014;14:1–24.
9. Aragó M, Moreno-Felici J, Abás S, Rodríguez-Arévalo S, Hyroššová P,Figueras A, et al. Pharmacology and preclinical validation of a novelanticancer compound targeting PEPCK-M. Biomed Pharmacother. 2020;121:109601 Available from: https://www.sciencedirect.com/science/article/pii/S0753332219352230.
10. Ma L, Tao Y, Duran A, Llado V, Galvez A, Barger JF, et al. Control of nutrientstress-induced metabolic reprogramming by PKCζ in tumorigenesis. Cell.2013;152:599–611.
11. Ran FA, Hsu PD, Wright J, Agarwala V, Scott DA, Zhang F. Genomeengineering using the CRISPR-Cas9 system. Nat Protoc. 2013;8:2281–308Nature Publishing Group.
12. Biewenga P, Buist MR, Moerland PD, van Themaat EVL, van Kampen AHC,ten Kate FJW, et al. Gene expression in early stage cervical cancer. Gynecol
Hyroššová et al. Cancer & Metabolism (2021) 9:1 Page 14 of 15
Oncol. 2008;108:520–6 Academic Press Inc.; Available from: http://www.ncbi.nlm.nih.gov/pubmed/18191186.
13. Elia I, Broekaert D, Christen S, Boon R, Radaelli E, Orth MF, et al. Prolinemetabolism supports metastasis formation and could be inhibited toselectively target metastasizing cancer cells. Nat Commun. 2017;8:15267Nature Publishing Group.
14. Liu W, Le A, Hancock C, Lane AN, Dang CV, Fan TW-M, et al.Reprogramming of proline and glutamine metabolism contributes to theproliferative and metabolic responses regulated by oncogenic transcriptionfactor c-MYC. Proc Natl Acad Sci. 2012;109:8983–8.
15. Liu Y, Borchert GL, Donald SP, Diwan BA, Anver M, Phang JM. Prolineoxidase functions as a mitochondrial tumor suppressor in human cancers.Cancer Res. 2009;69:6414–22 Available from: http://www.ncbi.nlm.nih.gov/pubmed/19654292.
16. Ke N, Albers A, Claassen G, Yu DH, Chatterton JE, Hu X, et al. One-week 96-well soft agar growth assay for cancer target validation. Biotechniques.2004;36:826–33.
17. Mori S, Chang JT, Andrechek ER, Matsumura N, Baba T, Yao G, et al.Anchorage-independent cell growth signature identifies tumors withmetastatic potential. Oncogene. 2009;28:2796–805 Nature Publishing Group.
18. Pavlova NN, Thompson CB. The emerging hallmarks of cancer metabolism.Cell Metab. 2016;23:27–47 Elsevier.
19. Khan M, Biswas D, Ghosh M, Mandloi S, Chakrabarti S, Chakrabarti P.mTORC2 controls cancer cell survival by modulating gluconeogenesis. CellDeath Discov. 2015;1:15016 Nature Publishing Group.
20. Ma R, Zhang W, Tang K, Zhang H, Zhang Y, Li D, et al. Switch of glycolysisto gluconeogenesis by dexamethasone for treatment of hepatocarcinoma.Nat Commun. 2013;4:2508 Nature Publishing Group.
21. Wang B, Hsu SH, Frankel W, Ghoshal K, Jacob ST. Stat3-mediated activationof microRNA-23a suppresses gluconeogenesis in hepatocellular carcinomaby down-regulating glucose-6-phosphatase and peroxisome proliferator-activated receptor gamma, coactivator 1 alpha. Hepatology. 2012;56:186–97.
22. Xu D, Wang Z, Xia Y, Shao F, Xia W, Wei Y, et al. The gluconeogenic enzymePCK1 phosphorylates INSIG1/2 for lipogenesis. Nat Res. 2020;580:530–5.
23. Li Y, Luo S, Ma R, Liu J, Xu P, Zhang H, et al. Upregulation of cytosolicphosphoenolpyruvate carboxykinase is a critical metabolic event inmelanoma cells that repopulate tumors. Cancer Res. 2015;75:1191–6.
24. Ye J, Kumanova M, Hart LS, Sloane K, Zhang H, De Panis DN, et al. TheGCN2-ATF4 pathway is critical for tumour cell survival and proliferation inresponse to nutrient deprivation. EMBO J. 2010;29:2082–96.
25. Ding B, Parmigiani A, Divakaruni AS, Archer K, Murphy AN, Budanov AV.Sestrin2 is induced by glucose starvation via the unfolded protein responseand protects cells from non-canonical necroptotic cell death. Sci Rep. 2016;6:22538 Nature Publishing Group.
26. DeNicola GM, Chen P-H, Mullarky E, Sudderth JA, Hu Z, Wu D, et al. NRF2regulates serine biosynthesis in non–small cell lung cancer. Nat Genet. 2015;47:1475–84.
27. Burgess SC, He TT, Yan Z, Lindner J, Sherry AD, Malloy CR, et al. Cytosolicphosphoenolpyruvate carboxykinase does not solely control the rate ofhepatic gluconeogenesis in the intact mouse liver. Cell Metab. 2007;5:313–20.
28. Vincent EE, Sergushichev A, Griss T, Gingras MC, Samborska B, Ntimbane T,et al. Mitochondrial phosphoenolpyruvate carboxykinase regulatesmetabolic adaptation and enables glucose-independent tumor growth. MolCell. 2015;60:195–207 Elsevier Inc.
29. Liu W, Hancock CN, Fischer JW, Harman M, Phang JM. Proline biosynthesisaugments tumor cell growth and aerobic glycolysis: involvement ofpyridine nucleotides. Sci Rep. 2015;5:1–13 Nature Publishing Group.
30. Kardos GR, Wastyk HC, Robertson GP. Disruption of proline synthesis inmelanoma inhibits protein production mediated by the GCN2 pathway. MolCancer Res. 2015;13:1408–20.
31. Liu W, Glunde K, Bhujwalla ZM, Raman V, Sharma A, Phang JM. Prolineoxidase promotes tumor cell survival in hypoxic tumor microenvironments.Cancer Res. 2012;72:3677–86 NIH Public Access.
32. Álvarez Z, Hyroššová P, Perales JC, Alcántara S. Neuronal progenitormaintenance requires lactate metabolism and PEPCK-M-directedcataplerosis. Cereb Cortex. 2014;26:1–13.
33. Ho P-C, Bihuniak JD, Macintyre AN, Staron M, Liu X, Amezquita R, et al.Phosphoenolpyruvate is a metabolic checkpoint of anti-tumor T cellresponses. Cell. 2015;162:1217–28.
34. Maddocks ODK, Berkers CR, Mason SM, Zheng L, Blyth K, Gottlieb E, et al.Serine starvation induces stress and p53-dependent metabolic remodellingin cancer cells. Nature. 2013;493:542–6.
35. Nye CK, Hanson RW, Kalhan SC. Glyceroneogenesis is the dominant pathway fortriglyceride glycerol synthesis in vivo in the rat. J Biol Chem. 2008;283:27565–74.
36. Mustafi R, Cerda S, Chumsangsri A, Fichera A, Bissonnette M. Protein Kinase-zeta inhibits collagen I-dependent and anchorage-independent growth andenhances apoptosis of human Caco-2 cells. Mol Cancer Res. 2006;4:683–94.
37. Nazarenko I, Jenny M, Keil J, Gieseler C, Weisshaupt K, Sehouli J, et al.Atypical protein kinase C zeta exhibits a proapoptotic function in ovariancancer. Mol Cancer Res. 2010;8:919–34.
Publisher’s NoteSpringer Nature remains neutral with regard to jurisdictional claims inpublished maps and institutional affiliations.
Hyroššová et al. Cancer & Metabolism (2021) 9:1 Page 15 of 15