Embed Size (px)
Citation preview
People’s experiences of hospital careInsights from five years of patient feedback
Healthcare in Focus
BUREAU OF HEALTH INFORMATION 1 Reserve Road St Leonards NSW 2065 Australia Telephone: +61 2 9464 4444 bhi.nsw.gov.au
© Copyright Bureau of Health Information 2020 This work is copyrighted. It may be reproduced in whole or in part for study or training purposes subject to the inclusion of an acknowledgement of the source. It may not be reproduced for commercial usage or sale. Reproduction for purposes other than those indicated above requires written permission from the Bureau of Health Information.
State Health Publication Number: (BHI) 200203 ISSN: 1838-6989 (print); 2204-9363 (online)
Suggested citation: Bureau of Health Information. Healthcare in Focus – People’s experiences of hospital care: Insights from five years of patient feedback. Sydney (NSW); BHI; 2020.
Please note there is the potential for minor revisions of data in this report. Please check the online version at bhi.nsw.gov.au for any amendments or errata.
Published July 2020
The conclusions in this report are those of BHI and no official endorsement by the NSW Minister for Health, the NSW Ministry of Health or any other NSW public health organisation is intended or should be inferred.
Healthcare in Focus – People’s experiences of hospital care: Insights from five years of patient feedback bhi.nsw.gov.au
Table of contents
Foreword 1
Overview of key findings 3
Setting the scene 5
Patient experience 5
Context 7
About this report 9
How to interpret the graphs in the report 11
Patients’ experiences in emergency departments 13
Key findings at NSW level 14
Overall experiences of care 15
Experiences with health professionals 17
Clear explanations of test results 19
Involvement in decisions 21
Pain management 23
Finding the emergency department 25
Communication when leaving the hospital 27
Patients’ experiences of waiting times 29
Admitted patients’ experiences of care 31
Key findings at NSW level 32
Overall ratings of care 33
Experiences with nurses 35
Communication with doctors 37
Involvement in decisions 39
Pain management 41
Cleanliness of wards 43
Communication when leaving hospital 45
Delays leaving hospital 47
Patient experience in focus 49
Appendices 57
References 59
Acknowledgements 60

Foreword
1 Healthcare in Focus – People’s experiences of hospital care: Insights from five years of patient feedback bhi.nsw.gov.au

2Healthcare in Focus – People’s experiences of hospital care: Insights from five years of patient feedback bhi.nsw.gov.au
Listening to what patients have to say about their experiences of care is a cornerstone of high-quality healthcare.
The Bureau of Health Information (BHI)’s very first report, published in May 2010, focused on patients’ experiences of care in NSW public hospitals. It was a very deliberate decision for our first report to be about what matters most to patients.
I said at the time of its release that “to the people of NSW, excellence in healthcare is more than professional competency and appropriate use of technology – it is about doctors and nurses working together to create a caring culture”.
Ten years later, it is now widely recognised that patients’ experiences of care are important determinants of the outcomes of that care. Exceptional patient-centered care is where world-class clinical care and world-class customer service meet.
For this Healthcare in Focus report, BHI was privileged to listen to more than 200,000 patients from every walk of life and every part of the State. They told us about their experiences of care in emergency departments and as admitted patients in our public hospitals.
Patient surveys provide a unique perspective on the healthcare system that can only come from asking people about their personal experiences. When thousands of patients tell you about their personal experiences you can identify and report on the strengths and weaknesses of the NSW healthcare system overall, as well as across local health districts and hospitals.
In this report, we have looked at trends in people’s experiences of care over time. This longer-term view, along with the large number of survey participants who are representative of the wider NSW population, allowed us to identify areas where there have been sustained and meaningful changes in patient experience.
The report identifies areas of patient experience with significant improvements or declines over five years, and areas where ratings of care have been consistently high or low during that time.
While it is vital from a transparency and accountability perspective that we report these results to the NSW public, it is also very important that they are used by those responsible for managing and delivering healthcare services to help inform efforts to improve care for patients.
Ten years on from BHI’s first patient experience report, this report coincides with NSW Health’s restated commitment to ensure patients, families and carers have the best possible experiences when they interact with the NSW healthcare system, and the acknowledgement that their experiences are as important as their clinical outcomes.
Examples of some of the ongoing work in this area are included in this report, based on interviews with healthcare professionals across NSW to learn how they gather patient feedback, the ways in which they respond to what they learn, and the outcomes they have seen.
We hope this report will now be counted among those valuable resources helping to drive improvement efforts at both a statewide and local level, and that these efforts include consumers themselves. The principle of ‘nothing about me, without me’ remains an essential part of delivering truly patient-centered care.
For our part, BHI will continue to listen to patients and work with those striving to improve patient experiences of care to develop the NSW Patient Survey Program in ways that ensure patients’ voices continue to be heard and to drive positive change in healthcare experiences and outcomes.
Dr Diane Watson Chief Executive
Foreword
3 Healthcare in Focus – People’s experiences of hospital care: Insights from five years of patient feedback bhi.nsw.gov.au
Each year between 2014 and 2019, people made more than 2.5 million visits to emergency departments (EDs) in NSW and more than 1.9 million were admitted to public hospitals.
Through the NSW Patient Survey Program, the Bureau of Health Information (BHI) heard from more than 200,000 of these patients about their experiences. Collectively, their feedback provides a unique perspective on the healthcare system and allows us to identify and report on where the system is performing well and where services could be improved.
Trends in patients’ experiences over a five-year period have been analysed to identify areas of significant improvement or decline at NSW, local health district (LHD) and hospital level (after accounting for patients’ characteristics, including age, sex, language spoken at home and education), and where results are consistently high or low. Statistical testing, based on all five years, has been used to identify whether change was significant.
Due to the large number of patients who provided feedback and because those who participated in these surveys were representative of the wider NSW population, even small changes in results for measures over time can represent meaningful changes in patients’ experiences of care.
Results for selected measures are presented in this report, and key findings for these measures at NSW level are summarised on page 4. Results for a wider range of measures are provided in accompanying supplementary data tables.
Summary of results
It is notable that health professionals continued to be very highly rated for their kindness both by patients in EDs and by admitted patients. In EDs, there has been a significant improvement in the extent to which patients feel involved in decisions about their care and treatment, and the extent to which ED staff took patients’ family and home situation into account in discharge planning.
Of the 31 questions analysed for the Emergency Department Patient Survey, three improved significantly.
There were significant declines in four areas of patient experience, including pain management and how many patients reported spending less than four hours in the ED.
For admitted patients, more than half of the questions analysed (29 out of 51) from the Adult Admitted Patient Survey showed significant improvements.
These significant improvements included areas such as patients’ overall ratings of care; interactions with health professionals; privacy; respect shown for cultural or religious beliefs; food, and the cleanliness of wards and rooms.
The only area where there was a significant decline for admitted patients was in relation to delayed discharges.
Overview of key findings
Overview of key findings
This report presents information on the experiences of care for more than
200,000 people who attended NSW emergency departments (EDs) or who
were admitted to NSW public hospitals over a five-year period. It provides
insights on how patients’ experiences have changed over time.

4Healthcare in Focus – People’s experiences of hospital care: Insights from five years of patient feedback bhi.nsw.gov.au
Overview of key findings
Notes: Results are identified as having significantly improved or declined over the five year period, after accounting for differences in age, sex, language spoken at home and education. Statistical testing, based on all five years, has been used to identify whether change was significant. For more information on methodology, see the technical supplement to this Healthcare in Focus report.
*Measures included in this report. For all results, see the supplementary data tables for this report at bhi.nsw.gov.au.
Emergency department, 2014–15 to 2018–19
'Very good' overall ratings of ED care
Health professionals 'always' kind and caring
Health professionals 'completely' explained test, x-ray or scan results
Patients ‘definitely' involved in decisions about care and treatment
Health professionals 'definitely' did everything to help manage pain
Signposting to ED was 'definitely' easy to follow
Given ‘completely’ enough information to manage care at home
Spent less than four hours in ED
See page 14 for more detail.
Admitted patients, 2014 to 2018
'Very good' overall ratings of hospital care
Nurses 'always' kind and caring
Doctors 'always' answered questions in an understandable way
Patients 'definitely' involved in decisions about care and treatment
Hospital staff 'definitely' did everything to help manage pain
Wards or rooms were 'very clean'
Given ‘completely’ enough information to manage care at home
Discharge not delayed
See page 32 for more detail.
Key findings at NSW level over time*
Improved significantly Relatively stable Declined significantly

5 Healthcare in Focus – People’s experiences of hospital care: Insights from five years of patient feedback bhi.nsw.gov.au
Patient experience is a key dimension of high quality healthcare.1,2 It sits alongside the experiences of staff and the effectiveness and efficiency of clinical care as part of what is known as the quadruple aim of healthcare. Improving patients’ experiences is a strategic priority for NSW Health.3
What is patient experience?
Patient experience has been defined as “the sum of all interactions, shaped by an organisation’s culture that influence patient and carer perceptions across the continuum of care”.4 In simpler terms, it is about what a patient experiences during the course of their care and how they feel about it. Those experiences are not only important in their own right; there is a growing body of evidence on the positive associations between patients’ experiences and health outcomes, clinical effectiveness, and patient safety.
Measuring patient experience through the NSW Patient Survey Program
Patients are uniquely positioned to provide insightful feedback about their care.5,6,7,8 There are a range of ways in which patients in NSW do so – from complaints and compliments to local real-time feedback and responding to surveys distributed through the NSW Patient Survey Program.
The program, which is managed by BHI on behalf of NSW Health, gives thousands of patients the opportunity to provide feedback about their experiences in the public healthcare system using evidence-based, validated instruments. It is distinct from, but complementary to, other sources of patient feedback, providing:
• systematic collection from large samples of patients that are representative of local patient populations
• statistically-valid comparisons and trends at statewide, local health district (LHD) and hospital level
• reflections on whole episodes of care, from pre- to post-discharge experiences and outcomes, which are collected after the experience of care in question, and therefore independent from it
• results that are weighted to be representative of each participating hospital and the characteristics of their patients
• results that are publicly reported.
BHI analyses and reports on the results of every survey, publishing useful information for consumer, healthcare and policy audiences. Survey results enable consumers to learn what others have said about their experiences with local health services, and how well those services are doing. Clinicians, managers and other staff are able to see how they compare with other services, assess the impact of their own improvement efforts over time, and to inform future priorities.
The program is also a key statewide source of patient-reported measures (PRMs) for the health system, where results inform key performance indicators (KPIs) for each LHD and specialty health network. The KPIs are monitored by the NSW Ministry of Health under each LHD’s service agreement. The KPIs were introduced towards the end of the period covered by this report, and are therefore not reported against here.
The program includes a range of surveys that focus on different care settings and patient groups. This report focuses on the two largest and longest running surveys in the NSW Patient Survey Program: the Emergency Department Patient Survey and Adult Admitted Patient Survey.
Setting the scene
Setting the scene
Patient experience
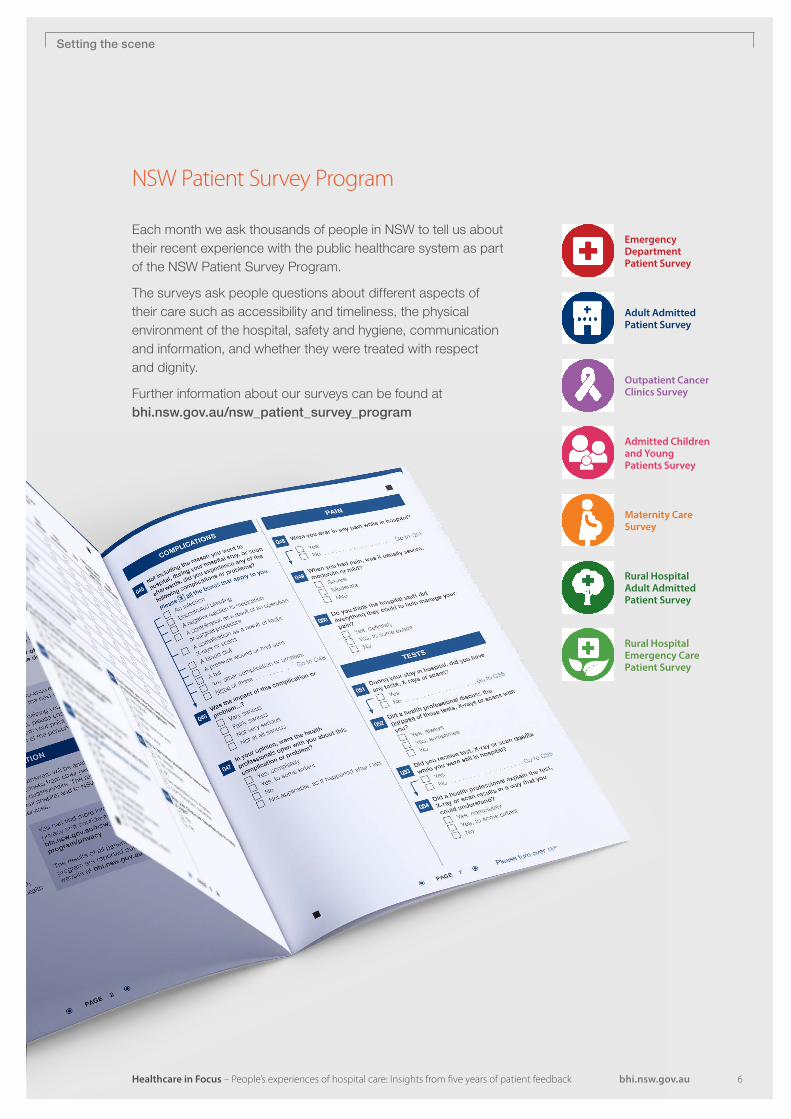
Adult Admitted Patient Survey
Outpatient Cancer Clinics Survey
Emergency Department Patient Survey
Admitted Children and Young Patients Survey
Maternity Care Survey
Rural Hospital Emergency Care Patient Survey
Rural Hospital Adult Admitted Patient Survey
Each month we ask thousands of people in NSW to tell us about their recent experience with the public healthcare system as part of the NSW Patient Survey Program.
The surveys ask people questions about different aspects of their care such as accessibility and timeliness, the physical environment of the hospital, safety and hygiene, communication and information, and whether they were treated with respect and dignity.
Further information about our surveys can be found at bhi.nsw.gov.au/nsw_patient_survey_program
NSW Patient Survey Program
Healthcare in Focus – People’s experiences of hospital care: Insights from five years of patient feedback 6bhi.nsw.gov.au
Setting the scene
7 Healthcare in Focus – People’s experiences of hospital care: Insights from five years of patient feedback bhi.nsw.gov.au
The survey results outlined in this report reflect the broader context in which care was delivered to patients in NSW public hospitals. While the results at a local level will have been shaped by local action and specific local factors, the five years covered by this report also saw a number of systemic shifts.
Increasing policy focus on patient experience
Improving patient experience has been an increasingly prominent focus of policy and practice across NSW Health over the period covered by this report, embedded as a strategic priority for the system and, in more recent years, KPIs for local health districts (LHDs) and specialty health networks. Patient experience is now a core dimension of system performance.
There are many examples of sustained local initiatives to enhance patient experiences right across the NSW public health system, and some of those are featured in this report (pages 49–56). These examples illustrate how health professionals and health system managers are listening to, engaging with and responding to feedback from their patients. They show how efforts to improve patients’ experiences are multi-faceted, from a focus on workplace culture to new models of care and simple changes to the ways caregivers communicate with patients.
In 2020, NSW Health will issue Elevating the human experience: our guide to action for patient, family, carer and caregiver experience, which will outline what the NSW health system can do together, in partnership with patients, families and carers, to consistently create positive, personalised experiences.
Increasing activity in NSW public hospitals
NSW currently has more than 8 million residents, with annual population growth estimated at 6%.9 There were more than 3 million ED attendances and almost 2 million admitted patient episodes in NSW public hospitals in 2019, an increase of 18% and 5%, respectively, since 2015.10,11
This growth in activity is the backdrop to services’ efforts to improve patient experiences. It is important to note, however, there is limited evidence that high levels of activity in EDs and hospitals necessarily cause patient experiences to decline.
Growing consumer expectations
The focus on patient experience is one part of a wider shift in consumer expectations in relation to public services. These are reflected in the NSW Government’s Customer Service Commitments that public services will:
• Be easy to engage
• Act with empathy
• Respect my time
• Explain what to expect
• Resolve the situation
• Engage the community.12
In the healthcare context, patient experience is a function of both customer service and clinical excellence.
Setting the scene
Context
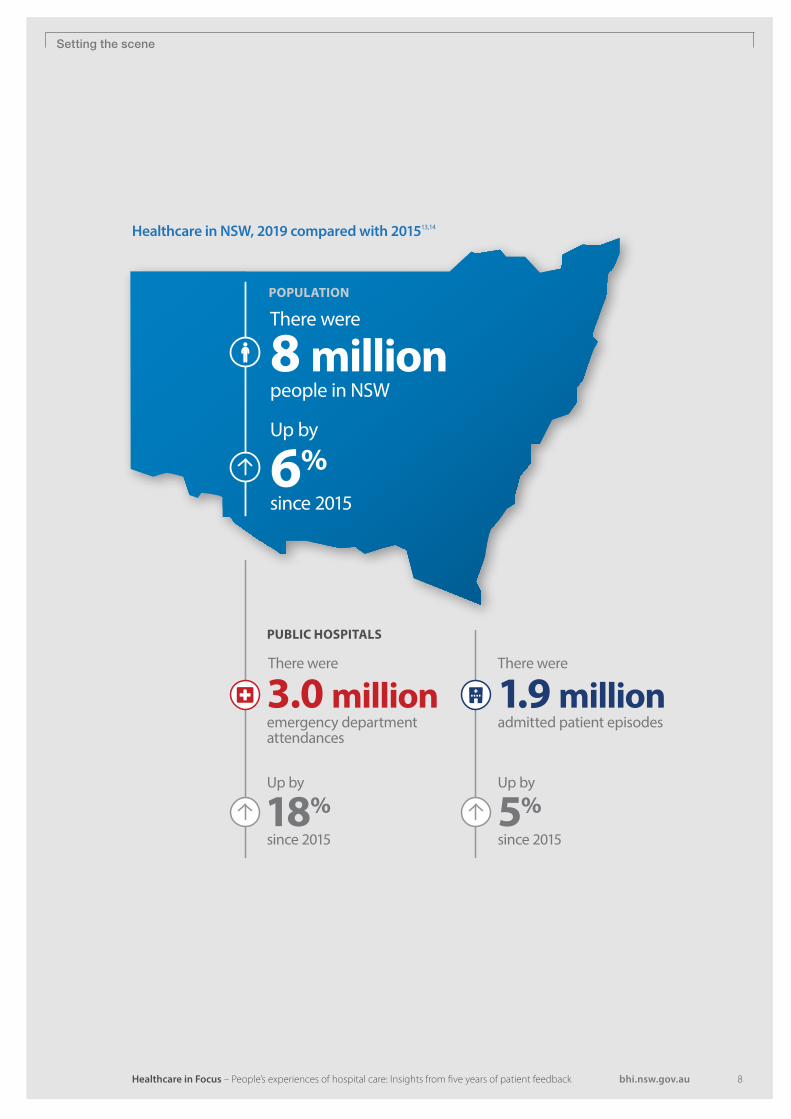
POPULATION
There were
Up by
since 20156%
people in NSW8 million
PUBLIC HOSPITALS
There were There were
Up by
since 201518%
emergency department attendances
3.0 million
Up by
since 20155%
admitted patient episodes1.9 million
8Healthcare in Focus – People’s experiences of hospital care: Insights from five years of patient feedback bhi.nsw.gov.au
Healthcare in NSW, 2019 compared with 201513,14
Setting the scene

9 Healthcare in Focus – People’s experiences of hospital care: Insights from five years of patient feedback bhi.nsw.gov.au
This 10th annual Healthcare in Focus report provides insights into patient experiences in NSW public hospitals over time, as measured through the NSW Patient Survey Program. The report draws on feedback about experiences of care provided by more than 200,000 patients over a five-year period.
One of BHI’s functions is to provide an annual report to the NSW Minister for Health and Medical Research, and NSW Parliament about the performance of the NSW public health system. This report fulfils that responsibility.
The report provides an overview of NSW public health system performance by focusing on the patient voice. Its aim is to provide transparency for the community and information that helps health system managers reflect on achievements to date, and identify further opportunities to improve patient experience across NSW.
The surveys, measures and hospitals included in this report
This report focuses on the experiences of care of patients who visited EDs and adults who were admitted to public hospitals, drawing on results from the two largest and longest running surveys in the NSW Patient Survey Program: the Emergency Department Patient Survey and Adult Admitted Patient Survey.
Each survey includes a large number of questions that invite patients’ reflections on their experiences and outcomes for the entirety of their episode of care. For the purposes of this report, a number of questions have been selected that are illustrative of important aspects of patient experience and of patterns of change across NSW over five years.
For each measure, the report presents trend results over five years at NSW level, highlighting notable trends at local health district (LHD) level. These results are aggregated based on the more than 80 NSW public hospitals for which the surveys are run.
In addition, the report presents trends for each measure for two hospital peer groups: principal referral and specialist hospitals, and major hospitals. For EDs, this is based on analysis of results for 17 principal referral and specialist hospitals, and 20 major hospitals. For adult admitted patient results, this is based on analysis of results for 16 principal referral and specialist hospitals, and 20 major hospitals. Although Broken Hill Hospital is not classed as a major hospital, it is also included as it had sufficient responses to enable trend analysis.
Individual LHDs and hospitals are highlighted in this report only where:
• results have significantly improved or declined (after taking into account differences in patients’ characteristics in terms of age, sex, language spoken at home and education)
• results have remained consistently higher than the 90th percentile, or lower than the 10th percentile, for all LHDs/peer group hospitals over the five years.
The results for all LHDs and hospitals included in the analysis are presented in the supplementary data tables issued for this report. These results also include additional measures not featured in this report. Results for individual, smaller hospitals are not included as the lower numbers of responses at these facilities do not allow robust conclusions to be made about trends in patient experience in line with this report’s methodology.
Setting the scene
About this report
10Healthcare in Focus – People’s experiences of hospital care: Insights from five years of patient feedback bhi.nsw.gov.au
Structure of the report
The remainder of this report is structured as follows:
Patients’ experiences in emergency departments
• Focuses on the experiences of care of more than 94,000 patients who visited EDs between 2014–15 and 2018–19.
• The chapter highlights where there were significant improvements or declines in experiences for selected measures, and where experiences were consistently higher than the 90th percentile or consistently lower than the 10th percentile for all LHDs/peer group hospitals over the five years.
• NSW-level analysis includes all respondents; LHD-level analysis includes 15 LHDs; and hospital-level analysis includes 17 principal referral and specialist hospitals, and 20 major hospitals.
Admitted patients’ experiences of care
• Focuses on the experiences of care of more than 122,000 patients who were admitted to hospital between 2014 and 2018.
• The chapter highlights where there were significant improvements or declines in experiences for selected measures, and where experiences were consistently higher than the 90th percentile or consistently lower than the 10th percentile for all LHDs/peer group hospitals over the five years.
• NSW-level analysis includes 14 LHDs; hospital-level analysis includes 16 principal referral and specialist hospitals, and 20 major hospitals.
See Appendix 1 for a complete list of LHDs and hospitals included in each group.
Patient experience in focus
This section profiles some of the ways in which healthcare professionals in LHDs across NSW are gathering patient feedback, how they have responded to what they learn, and the outcomes they have seen from those initiatives.
To develop these pieces, BHI analysed the results for this report to identify LHDs with notable improvements in patients’ ratings of care. From these analyses, selected LHDs were interviewed about patient experience improvement initiatives in their area.
Additional materials
• Supplementary data tables for this report include results for all questions at NSW, LHD and hospital level, for the five years covered by this report.
• The technical supplement for this this report provides further detail on data sources and analytic methods.
• These materials, along with the main report, are published on the BHI website at bhi.nsw.gov.au/BHI_reports/healthcare_in_focus
Setting the scene
11 Healthcare in Focus – People’s experiences of hospital care: Insights from five years of patient feedback bhi.nsw.gov.au
Setting the scene
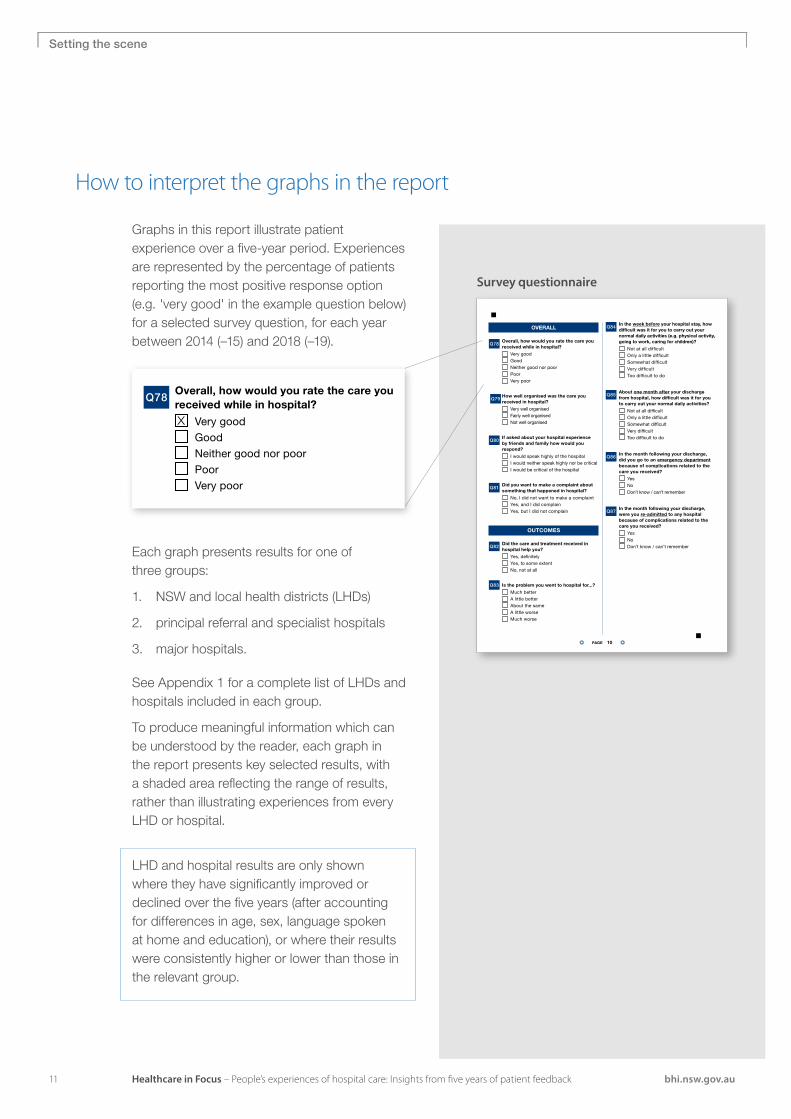
Graphs in this report illustrate patient experience over a five-year period. Experiences are represented by the percentage of patients reporting the most positive response option (e.g. 'very good' in the example question below) for a selected survey question, for each year between 2014 (–15) and 2018 (–19).
How to interpret the graphs in the report
Survey questionnaire
Each graph presents results for one of three groups:
1. NSW and local health districts (LHDs)
2. principal referral and specialist hospitals
3. major hospitals.
See Appendix 1 for a complete list of LHDs and hospitals included in each group.
To produce meaningful information which can be understood by the reader, each graph in the report presents key selected results, with a shaded area reflecting the range of results, rather than illustrating experiences from every LHD or hospital.
Black PMS 241Black PMS 241
PAGE 10
Q84 In the week before your hospital stay, how difficult was it for you to carry out your normal daily activities (e.g. physical activity, going to work, caring for children)?
Not at all difficult Only a little difficult Somewhat difficult Very difficult Too difficult to do
Q85 About one month after your discharge from hospital, how difficult was it for you to carry out your normal daily activities?
Not at all difficult Only a little difficult Somewhat difficult Very difficult Too difficult to do
Q86 In the month following your discharge, did you go to an emergency department because of complications related to the care you received?
Yes No Don’t know / can’t remember
Q87 In the month following your discharge, were you re-admitted to any hospital because of complications related to the care you received?
Yes No Don’t know / can’t remember
OVERALL
Q78 Overall, how would you rate the care you received while in hospital?
Very good Good Neither good nor poor Poor Very poor
Q79
How well organised was the care you received in hospital?
Very well organised Fairly well organised Not well organised
Q80 If asked about your hospital experience by friends and family how would you respond?
I would speak highly of the hospital I would neither speak highly nor be critical I would be critical of the hospital
Q81 Did you want to make a complaint about something that happened in hospital?
No, I did not want to make a complaint Yes, and I did complain Yes, but I did not complain
OUTCOMES
Q82 Did the care and treatment received in hospital help you?
Yes, definitely Yes, to some extent No, not at all
Q83 Is the problem you went to hospital for...?
Much better A little better About the same A little worse Much worse
LHD and hospital results are only shown where they have significantly improved or declined over the five years (after accounting for differences in age, sex, language spoken at home and education), or where their results were consistently higher or lower than those in the relevant group.
Black PMS 241Black PMS 241
PAGE 10
Q84 In the week before your hospital stay, how difficult was it for you to carry out your normal daily activities (e.g. physical activity, going to work, caring for children)?
Not at all difficult Only a little difficult Somewhat difficult Very difficult Too difficult to do
Q85 About one month after your discharge from hospital, how difficult was it for you to carry out your normal daily activities?
Not at all difficult Only a little difficult Somewhat difficult Very difficult Too difficult to do
Q86 In the month following your discharge, did you go to an emergency department because of complications related to the care you received?
Yes No Don’t know / can’t remember
Q87 In the month following your discharge, were you re-admitted to any hospital because of complications related to the care you received?
Yes No Don’t know / can’t remember
OVERALL
Q78 Overall, how would you rate the care you received while in hospital?
Very good Good Neither good nor poor Poor Very poor
Q79
How well organised was the care you received in hospital?
Very well organised Fairly well organised Not well organised
Q80 If asked about your hospital experience by friends and family how would you respond?
I would speak highly of the hospital I would neither speak highly nor be critical I would be critical of the hospital
Q81 Did you want to make a complaint about something that happened in hospital?
No, I did not want to make a complaint Yes, and I did complain Yes, but I did not complain
OUTCOMES
Q82 Did the care and treatment received in hospital help you?
Yes, definitely Yes, to some extent No, not at all
Q83 Is the problem you went to hospital for...?
Much better A little better About the same A little worse Much worse
X

12Healthcare in Focus – People’s experiences of hospital care: Insights from five years of patient feedback bhi.nsw.gov.au
0
40
50
60
70
80
90
100
2014 2015 2016 2017 2018
% o
f pat
ient
s
0
40
50
60
70
80
90
100
2014 2015 2016 2017 2018
% o
f pat
ient
s
Setting the scene
What we started with…
What you see in the report…
Reference line represents the results for all patients in the relevant group of LHDs/hospitals:
NSW
Principal referral and specialist hospitals
Major hospitals
Consistently higher
Results for this LHD/hospital were consistently higher than those in the relevant group across the five years.
Improved significantly
Results for this LHD/hospital improved significantly over the five years.
Consistently lower
Results for this LHD/hospital were consistently lower than those in the relevant group across the five years.
Declined significantly
Results for this LHD/hospital declined significantly over the five years.
Reference line: NSW
Principal referral and specialist hospitals
Major hospitals
Each grey line represents the results for an LHD/hospital in the relevant group.
Shaded area represents the range of results for all LHDs/hospitals in the relevant group.
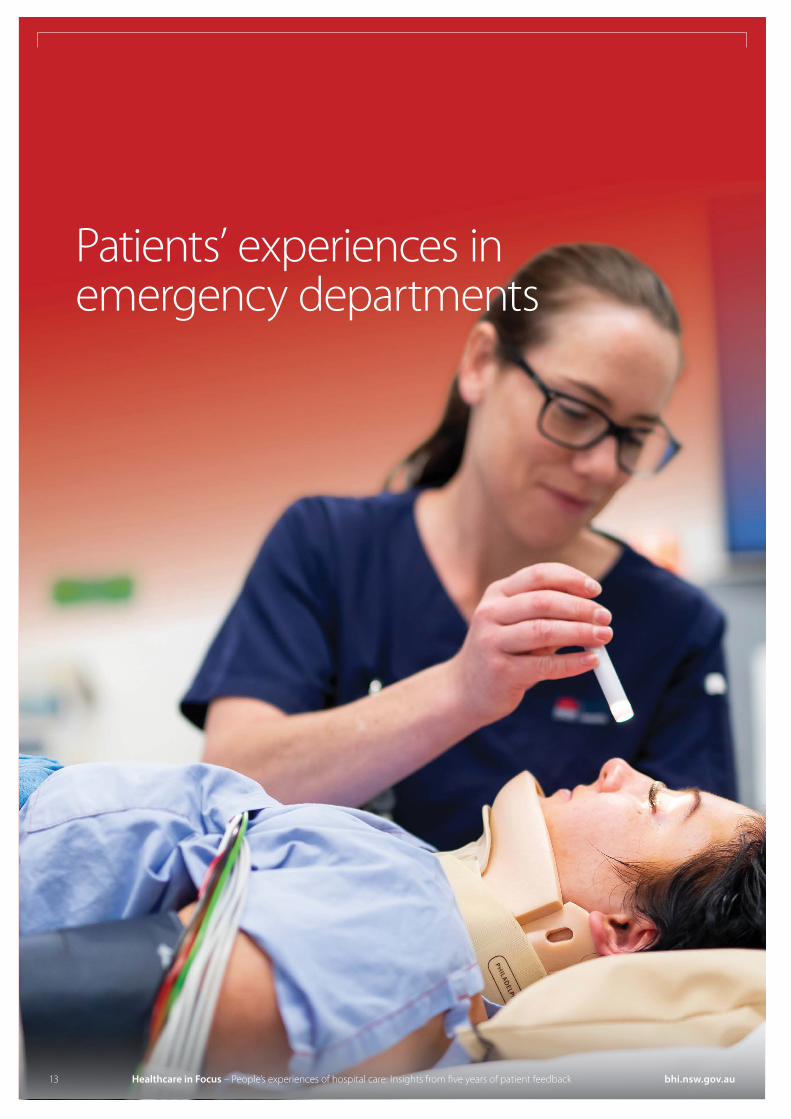
Patients’ experiences in emergency departments
13 Healthcare in Focus – People’s experiences of hospital care: Insights from five years of patient feedback bhi.nsw.gov.au
14Healthcare in Focus – People’s experiences of hospital care: Insights from five years of patient feedback bhi.nsw.gov.au
Patients’ experiences in emergency departments
Key findings at NSW level
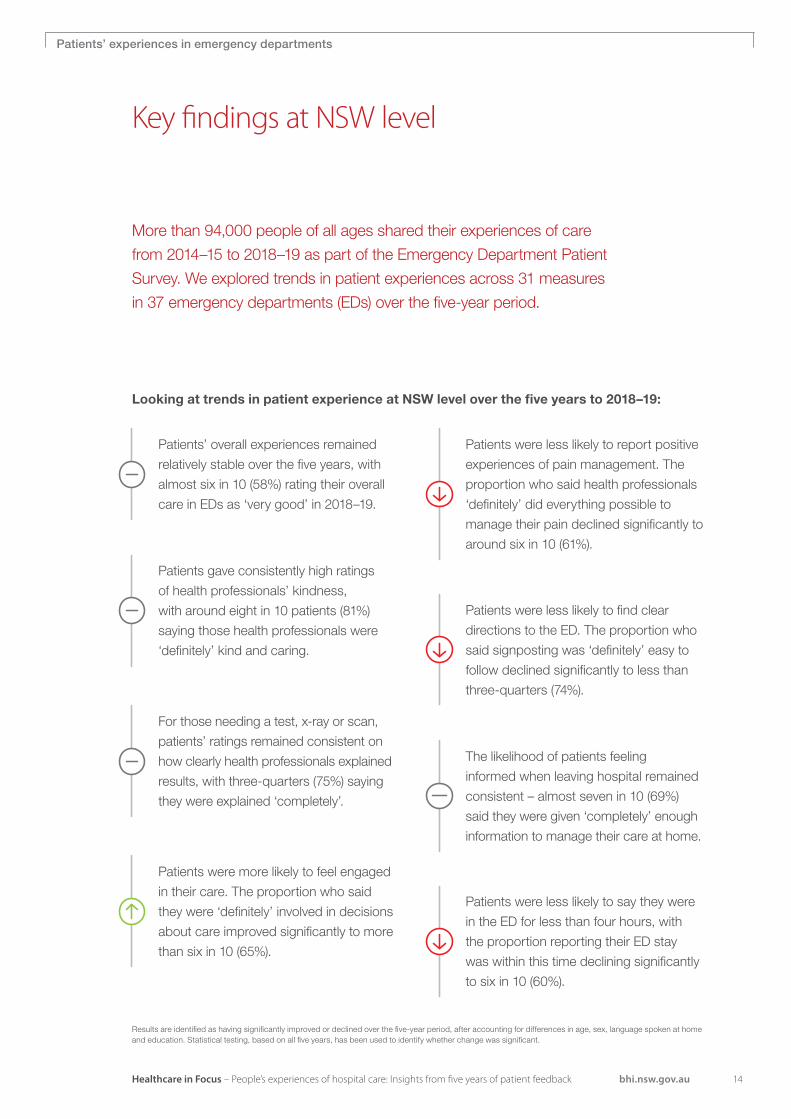
Looking at trends in patient experience at NSW level over the five years to 2018–19:
More than 94,000 people of all ages shared their experiences of care
from 2014–15 to 2018–19 as part of the Emergency Department Patient
Survey. We explored trends in patient experiences across 31 measures
in 37 emergency departments (EDs) over the five-year period.
Patients gave consistently high ratings
of health professionals’ kindness,
with around eight in 10 patients (81%)
saying those health professionals were
‘definitely’ kind and caring.
For those needing a test, x-ray or scan,
patients’ ratings remained consistent on
how clearly health professionals explained
results, with three-quarters (75%) saying
they were explained ‘completely’.
The likelihood of patients feeling
informed when leaving hospital remained
consistent – almost seven in 10 (69%)
said they were given ‘completely’ enough
information to manage their care at home.
Patients were more likely to feel engaged
in their care. The proportion who said
they were ‘definitely’ involved in decisions
about care improved significantly to more
than six in 10 (65%).
Patients’ overall experiences remained
relatively stable over the five years, with
almost six in 10 (58%) rating their overall
care in EDs as ‘very good’ in 2018–19.
Results are identified as having significantly improved or declined over the five-year period, after accounting for differences in age, sex, language spoken at home and education. Statistical testing, based on all five years, has been used to identify whether change was significant.
Patients were less likely to report positive
experiences of pain management. The
proportion who said health professionals
‘definitely’ did everything possible to
manage their pain declined significantly to
around six in 10 (61%).
Patients were less likely to find clear
directions to the ED. The proportion who
said signposting was ‘definitely’ easy to
follow declined significantly to less than
three-quarters (74%).
Patients were less likely to say they were
in the ED for less than four hours, with
the proportion reporting their ED stay
was within this time declining significantly
to six in 10 (60%).

15 Healthcare in Focus – People’s experiences of hospital care: Insights from five years of patient feedback bhi.nsw.gov.au
Patients’ experiences in emergency departments Overall care
Figure 1 Percentage of emergency department patients who rated overall care as ‘very good’, NSW and local health districts, 2014–15 to 2018–19
Range of results
NSW
Improved significantly
Declined significantly
Consistently higher
Consistently lower
ED visits can be a stressful time for patients and families, where extra support can be valuable to help ensure the best possible experiences of care and outcomes.
More than 94,000 patients of all ages in NSW shared their experiences of care in the Emergency Department Patient Survey between 2014–15 and 2018–19. The percentage of patients who rated overall care in the ED as ‘very good’ was 58% in 2018–19, which remained relatively stable over the five years. At local health district (LHD) level, patients’ ratings of care for this measure improved significantly over the five years in Southern NSW (57% to 65%) and Illawarra Shoalhaven (56% to 62%). In South Western Sydney and Western Sydney, patients’ ratings of care were consistently below 52% for all five years (Figure 1).
Among principal referral and specialist hospital EDs, there were no notable improvements or declines in
the percentage of patients who rated their overall care as ‘very good’. However, for Bankstown-Lidcombe, overall ratings were consistently below 48% for all five years (Figure 2).
There were two major hospital EDs where overall experiences of care improved significantly, and three where they declined significantly between 2014–15 and 2018–19. The percentage of patients rating their overall care as ‘very good’ improved significantly in Lismore (56% to 70%) and Shoalhaven (52% to 58%). It declined significantly in Dubbo (58% to 53%), Maitland (55% to 54%) and Manning (65% to 53%) (Figure 3).
Patients’ views of coordination between health professionals are strongly linked to their overall ratings of care. When asked how well health professionals worked together, the percentage of patients who answered ‘very good’ in 2018–19 was 55%, which remained relatively stable over the five years.
Patients’ ratings of emergency department care remained stable
Overall experiences of care

16
Patients’ experiences in emergency departments
Healthcare in Focus – People’s experiences of hospital care: Insights from five years of patient feedback bhi.nsw.gov.au
Overall care
Figure 2 Percentage of emergency department patients who rated overall care as ‘very good’, principal referral and specialist hospitals, 2014–15 to 2018–19
Figure 3 Percentage of emergency department patients who rated overall care as ‘very good’, major hospitals, 2014–15 to 2018–19
Range of results
Principal referral and specialist hospitals
Improved significantly
Declined significantly
Range of results
Major hospitals
Improved significantly
Declined significantly
Consistently higher
Consistently lower
Consistently higher
Consistently lower
Results are identified as having significantly improved or declined over the five-year period, after accounting for differences in age, sex, language spoken at home and education. Statistical testing, based on all five years, has been used to identify whether change was significant. Due to the large volume of data available and the resulting power to detect significance, in some cases seemingly small numerical differences over time do constitute significant change. LHD and hospital results are only shown where they have significantly improved or declined over the five years, or where their results were consistently higher or lower than those in the relevant group.
Source: NSW Patient Survey Program. Emergency Department Patient Surveys 2014–15 to 2018–19.
17 Healthcare in Focus – People’s experiences of hospital care: Insights from five years of patient feedback bhi.nsw.gov.au
Patients’ experiences in emergency departments Health professionals
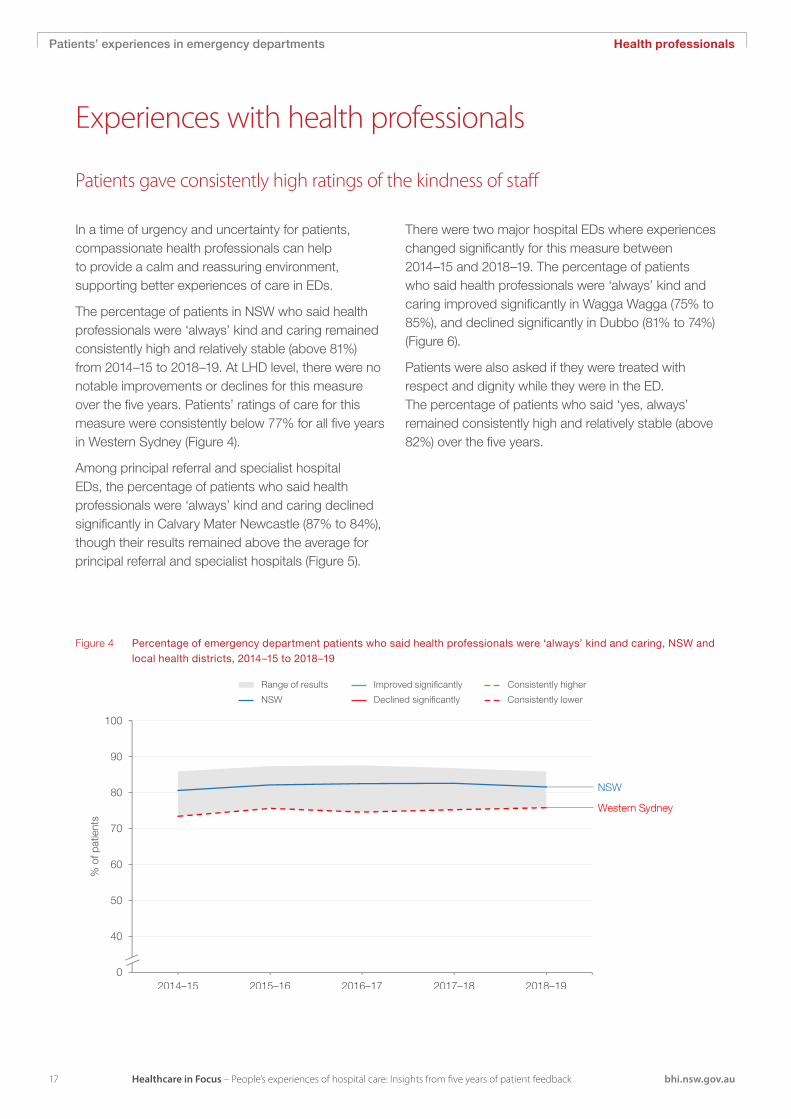
Figure 4 Percentage of emergency department patients who said health professionals were ‘always’ kind and caring, NSW and local health districts, 2014–15 to 2018–19
Range of results
NSW
Improved significantly
Declined significantly
Consistently higher
Consistently lower
In a time of urgency and uncertainty for patients, compassionate health professionals can help to provide a calm and reassuring environment, supporting better experiences of care in EDs.
The percentage of patients in NSW who said health professionals were ‘always’ kind and caring remained consistently high and relatively stable (above 81%) from 2014–15 to 2018–19. At LHD level, there were no notable improvements or declines for this measure over the five years. Patients’ ratings of care for this measure were consistently below 77% for all five years in Western Sydney (Figure 4).
Among principal referral and specialist hospital EDs, the percentage of patients who said health professionals were ‘always’ kind and caring declined significantly in Calvary Mater Newcastle (87% to 84%), though their results remained above the average for principal referral and specialist hospitals (Figure 5).
There were two major hospital EDs where experiences changed significantly for this measure between 2014–15 and 2018–19. The percentage of patients who said health professionals were ‘always’ kind and caring improved significantly in Wagga Wagga (75% to 85%), and declined significantly in Dubbo (81% to 74%) (Figure 6).
Patients were also asked if they were treated with respect and dignity while they were in the ED. The percentage of patients who said ‘yes, always’ remained consistently high and relatively stable (above 82%) over the five years.
Patients gave consistently high ratings of the kindness of staff
Experiences with health professionals

18
Patients’ experiences in emergency departments
Healthcare in Focus – People’s experiences of hospital care: Insights from five years of patient feedback bhi.nsw.gov.au
Health professionals
Figure 5 Percentage of emergency department patients who said health professionals were ‘always’ kind and caring, principal referral and specialist hospitals, 2014–15 to 2018–19
Figure 6 Percentage of emergency department patients who said health professionals were ‘always’ kind and caring, major hospitals, 2014–15 to 2018–19
Range of results
Principal referral and specialist hospitals
Improved significantly
Declined significantly
Range of results
Major hospitals
Improved significantly
Declined significantly
Consistently higher
Consistently lower
Consistently higher
Consistently lower
Results are identified as having significantly improved or declined over the five-year period, after accounting for differences in age, sex, language spoken at home and education. Statistical testing, based on all five years, has been used to identify whether change was significant. Due to the large volume of data available and the resulting power to detect significance, in some cases seemingly small numerical differences over time do constitute significant change. LHD and hospital results are only shown where they have significantly improved or declined over the five years, or where their results were consistently higher or lower than those in the relevant group.
Source: NSW Patient Survey Program. Emergency Department Patient Surveys 2014–15 to 2018–19.
19 Healthcare in Focus – People’s experiences of hospital care: Insights from five years of patient feedback bhi.nsw.gov.au
Patients’ experiences in emergency departments Communication
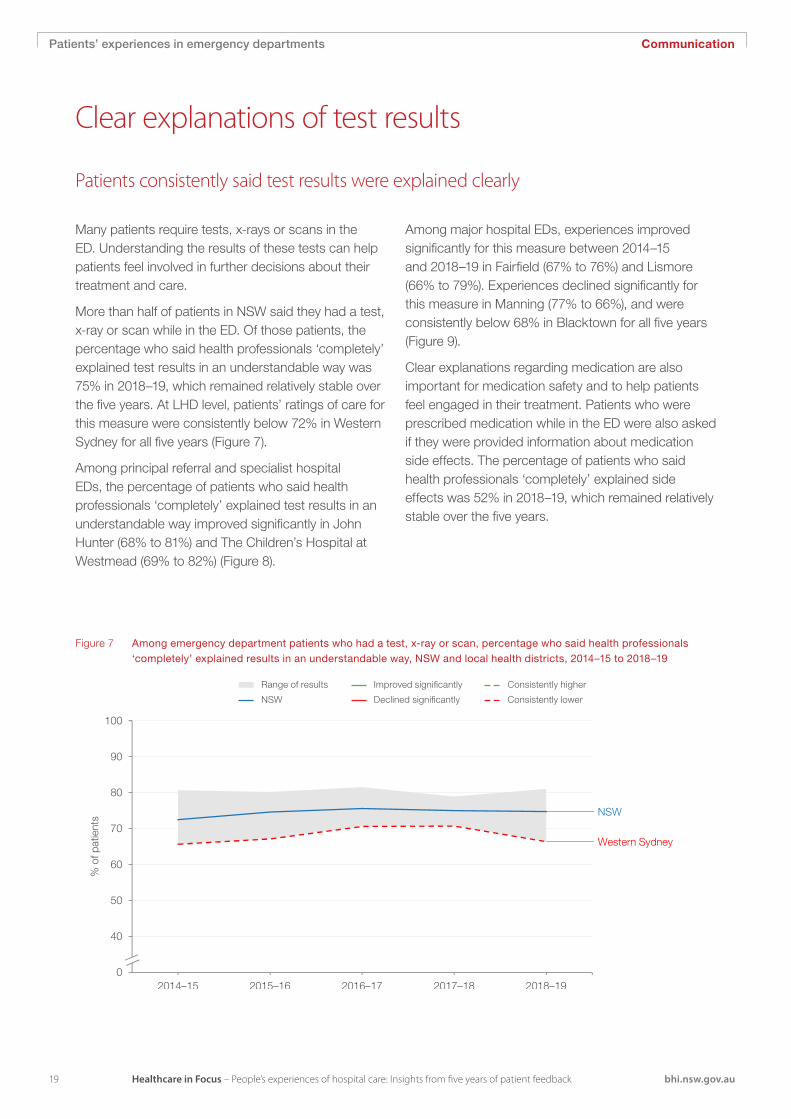
Figure 7 Among emergency department patients who had a test, x-ray or scan, percentage who said health professionals ‘completely’ explained results in an understandable way, NSW and local health districts, 2014–15 to 2018–19
Range of results
NSW
Improved significantly
Declined significantly
Consistently higher
Consistently lower
Many patients require tests, x-rays or scans in the ED. Understanding the results of these tests can help patients feel involved in further decisions about their treatment and care.
More than half of patients in NSW said they had a test, x-ray or scan while in the ED. Of those patients, the percentage who said health professionals ‘completely’ explained test results in an understandable way was 75% in 2018–19, which remained relatively stable over the five years. At LHD level, patients’ ratings of care for this measure were consistently below 72% in Western Sydney for all five years (Figure 7).
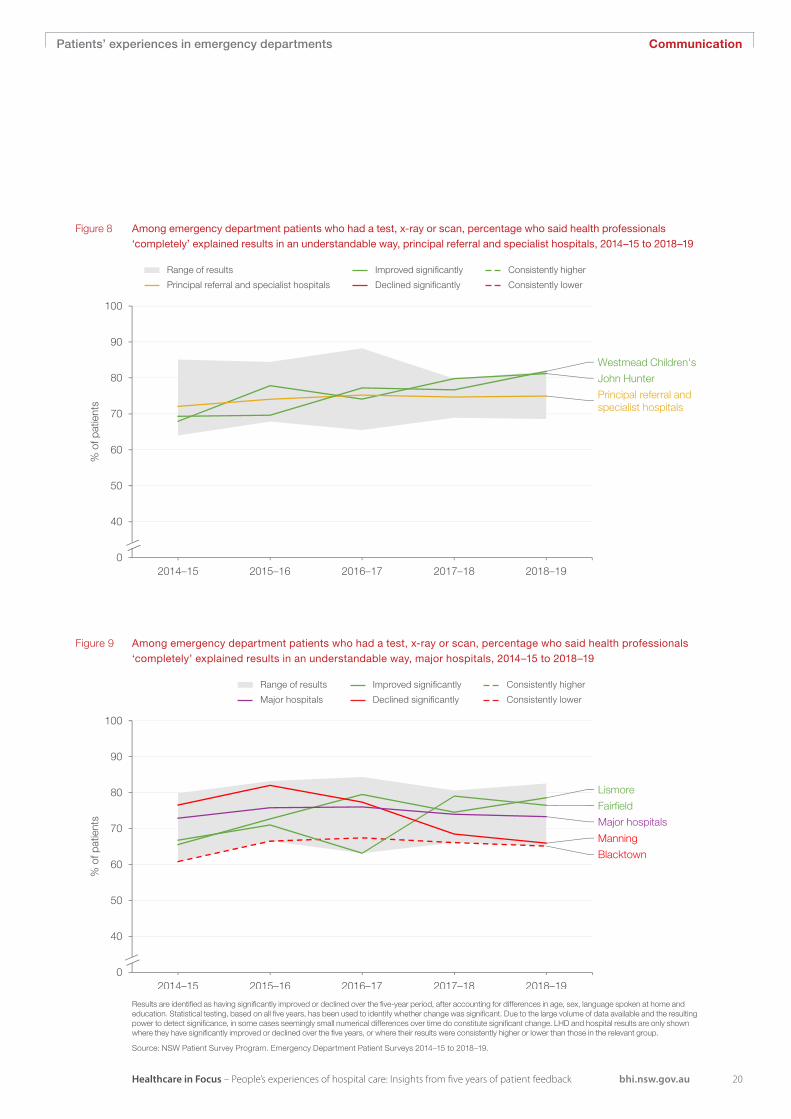
Among principal referral and specialist hospital EDs, the percentage of patients who said health professionals ‘completely’ explained test results in an understandable way improved significantly in John Hunter (68% to 81%) and The Children’s Hospital at Westmead (69% to 82%) (Figure 8).
Among major hospital EDs, experiences improved significantly for this measure between 2014–15 and 2018–19 in Fairfield (67% to 76%) and Lismore (66% to 79%). Experiences declined significantly for this measure in Manning (77% to 66%), and were consistently below 68% in Blacktown for all five years (Figure 9).
Clear explanations regarding medication are also important for medication safety and to help patients feel engaged in their treatment. Patients who were prescribed medication while in the ED were also asked if they were provided information about medication side effects. The percentage of patients who said health professionals ‘completely’ explained side effects was 52% in 2018–19, which remained relatively stable over the five years.
Patients consistently said test results were explained clearly
Clear explanations of test results
20
Patients’ experiences in emergency departments
Healthcare in Focus – People’s experiences of hospital care: Insights from five years of patient feedback bhi.nsw.gov.au
Communication
Figure 8 Among emergency department patients who had a test, x-ray or scan, percentage who said health professionals ‘completely’ explained results in an understandable way, principal referral and specialist hospitals, 2014–15 to 2018–19
Figure 9 Among emergency department patients who had a test, x-ray or scan, percentage who said health professionals ‘completely’ explained results in an understandable way, major hospitals, 2014–15 to 2018–19
Range of results
Principal referral and specialist hospitals
Improved significantly
Declined significantly
Range of results
Major hospitals
Improved significantly
Declined significantly
Consistently higher
Consistently lower
Consistently higher
Consistently lower
Results are identified as having significantly improved or declined over the five-year period, after accounting for differences in age, sex, language spoken at home and education. Statistical testing, based on all five years, has been used to identify whether change was significant. Due to the large volume of data available and the resulting power to detect significance, in some cases seemingly small numerical differences over time do constitute significant change. LHD and hospital results are only shown where they have significantly improved or declined over the five years, or where their results were consistently higher or lower than those in the relevant group.
Source: NSW Patient Survey Program. Emergency Department Patient Surveys 2014–15 to 2018–19.
21 Healthcare in Focus – People’s experiences of hospital care: Insights from five years of patient feedback bhi.nsw.gov.au
Patients’ experiences in emergency departments Engagement
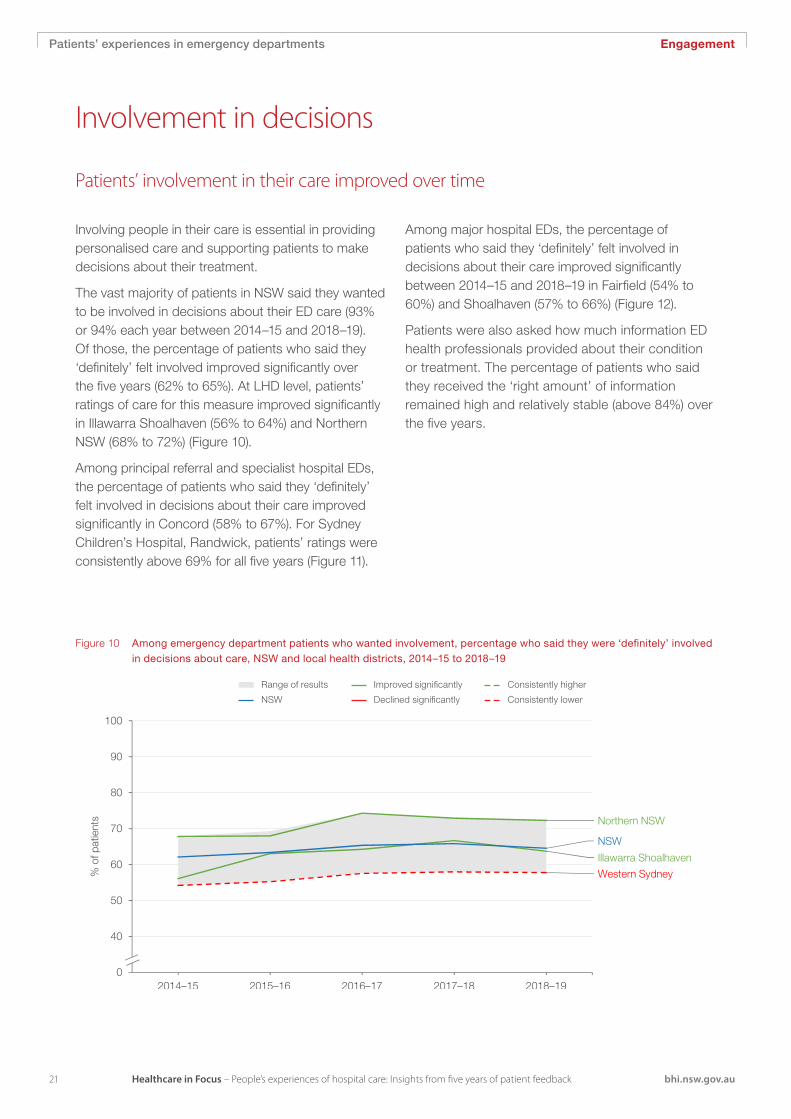
Figure 10 Among emergency department patients who wanted involvement, percentage who said they were ‘definitely’ involved in decisions about care, NSW and local health districts, 2014–15 to 2018–19
Range of results
NSW
Improved significantly
Declined significantly
Consistently higher
Consistently lower
Involving people in their care is essential in providing personalised care and supporting patients to make decisions about their treatment.
The vast majority of patients in NSW said they wanted to be involved in decisions about their ED care (93% or 94% each year between 2014–15 and 2018–19). Of those, the percentage of patients who said they ‘definitely’ felt involved improved significantly over the five years (62% to 65%). At LHD level, patients’ ratings of care for this measure improved significantly in Illawarra Shoalhaven (56% to 64%) and Northern NSW (68% to 72%) (Figure 10).
Among principal referral and specialist hospital EDs, the percentage of patients who said they ‘definitely’ felt involved in decisions about their care improved significantly in Concord (58% to 67%). For Sydney Children’s Hospital, Randwick, patients’ ratings were consistently above 69% for all five years (Figure 11).
Among major hospital EDs, the percentage of patients who said they ‘definitely’ felt involved in decisions about their care improved significantly between 2014–15 and 2018–19 in Fairfield (54% to 60%) and Shoalhaven (57% to 66%) (Figure 12).
Patients were also asked how much information ED health professionals provided about their condition or treatment. The percentage of patients who said they received the ‘right amount’ of information remained high and relatively stable (above 84%) over the five years.
Patients’ involvement in their care improved over time
Involvement in decisions

22
Patients’ experiences in emergency departments
Healthcare in Focus – People’s experiences of hospital care: Insights from five years of patient feedback bhi.nsw.gov.au
Engagement
Figure 11 Among emergency department patients who wanted involvement, percentage who said they were ‘definitely’ involved in decisions about care, principal referral and specialist hospitals, 2014–15 to 2018–19
Figure 12 Among emergency department patients who wanted involvement, percentage who said they were ‘definitely’ involved in decisions about care, major hospitals, 2014–15 to 2018–19
Range of results
Principal referral and specialist hospitals
Improved significantly
Declined significantly
Range of results
Major hospitals
Improved significantly
Declined significantly
Consistently higher
Consistently lower
Consistently higher
Consistently lower
Results are identified as having significantly improved or declined over the five-year period, after accounting for differences in age, sex, language spoken at home and education. Statistical testing, based on all five years, has been used to identify whether change was significant. Due to the large volume of data available and the resulting power to detect significance, in some cases seemingly small numerical differences over time do constitute significant change. LHD and hospital results are only shown where they have significantly improved or declined over the five years, or where their results were consistently higher or lower than those in the relevant group.
Source: NSW Patient Survey Program. Emergency Department Patient Surveys 2014–15 to 2018–19.
23 Healthcare in Focus – People’s experiences of hospital care: Insights from five years of patient feedback bhi.nsw.gov.au
Patients’ experiences in emergency departments Pain management
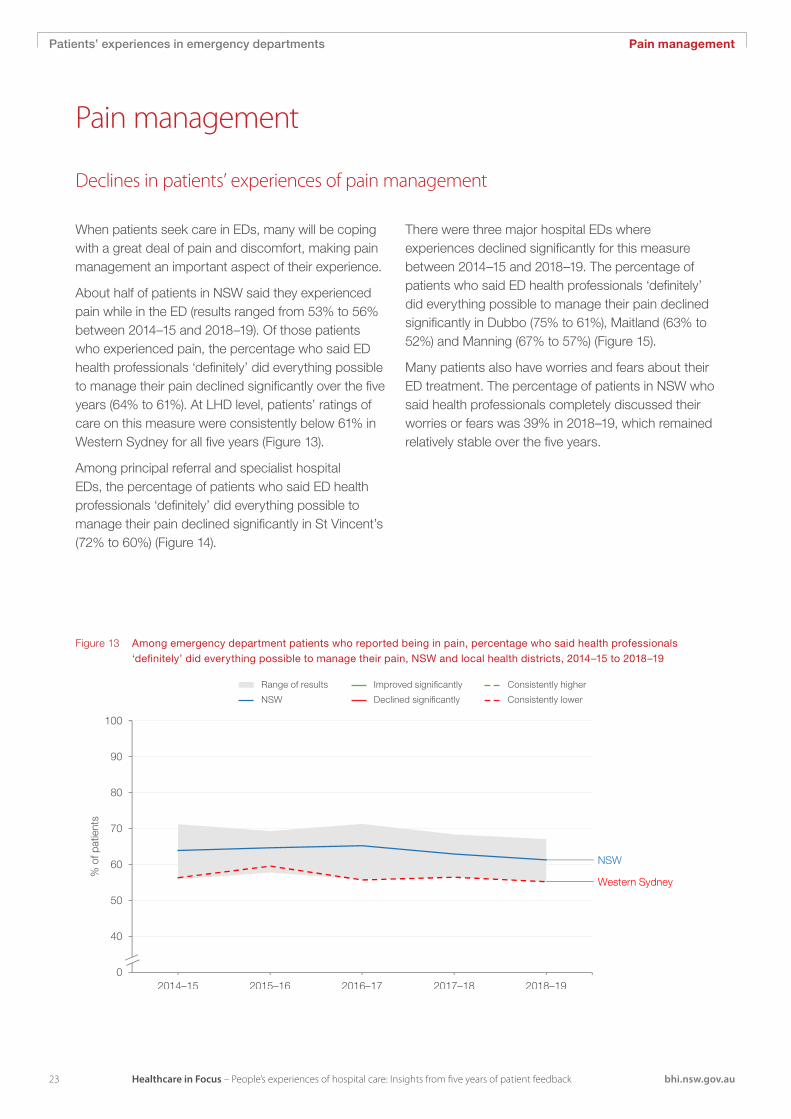
Figure 13 Among emergency department patients who reported being in pain, percentage who said health professionals ‘definitely’ did everything possible to manage their pain, NSW and local health districts, 2014–15 to 2018–19
Range of results
NSW
Improved significantly
Declined significantly
Consistently higher
Consistently lower
When patients seek care in EDs, many will be coping with a great deal of pain and discomfort, making pain management an important aspect of their experience.
About half of patients in NSW said they experienced pain while in the ED (results ranged from 53% to 56% between 2014–15 and 2018–19). Of those patients who experienced pain, the percentage who said ED health professionals ‘definitely’ did everything possible to manage their pain declined significantly over the five years (64% to 61%). At LHD level, patients’ ratings of care on this measure were consistently below 61% in Western Sydney for all five years (Figure 13).
Among principal referral and specialist hospital EDs, the percentage of patients who said ED health professionals ‘definitely’ did everything possible to manage their pain declined significantly in St Vincent’s (72% to 60%) (Figure 14).
There were three major hospital EDs where experiences declined significantly for this measure between 2014–15 and 2018–19. The percentage of patients who said ED health professionals ‘definitely’ did everything possible to manage their pain declined significantly in Dubbo (75% to 61%), Maitland (63% to 52%) and Manning (67% to 57%) (Figure 15).
Many patients also have worries and fears about their ED treatment. The percentage of patients in NSW who said health professionals completely discussed their worries or fears was 39% in 2018–19, which remained relatively stable over the five years.
Declines in patients’ experiences of pain management
Pain management

24
Patients’ experiences in emergency departments
Healthcare in Focus – People’s experiences of hospital care: Insights from five years of patient feedback bhi.nsw.gov.au
Pain management
Figure 14 Among emergency department patients who reported being in pain, percentage of patients who said health professionals ‘definitely’ did everything possible to manage their pain, principal referral and specialist hospitals, 2014–15 to 2018–19
Figure 15 Among emergency department patients who reported being in pain, percentage of who said health professionals ‘definitely’ did everything possible to manage their pain, major hospitals, 2014–15 to 2018–19
Range of results
Principal referral and specialist hospitals
Improved significantly
Declined significantly
Range of results
Major hospitals
Improved significantly
Declined significantly
Consistently higher
Consistently lower
Consistently higher
Consistently lower
Results are identified as having significantly improved or declined over the five-year period, after accounting for differences in age, sex, language spoken at home and education. Statistical testing, based on all five years, has been used to identify whether change was significant. Due to the large volume of data available and the resulting power to detect significance, in some cases seemingly small numerical differences over time do constitute significant change. LHD and hospital results are only shown where they have significantly improved or declined over the five years, or where their results were consistently higher or lower than those in the relevant group.
Source: NSW Patient Survey Program. Emergency Department Patient Surveys 2014–15 to 2018–19.

25 Healthcare in Focus – People’s experiences of hospital care: Insights from five years of patient feedback bhi.nsw.gov.au
Patients’ experiences in emergency departments Facilities
Figure 16 Of emergency department patients who did not arrive by ambulance, percentage of patients who said signposting was ‘definitely’ easy to follow, NSW and local health districts, 2014–15 to 2018–19
Range of results
NSW
Improved significantly
Declined significantly
Consistently higher
Consistently lower
Patients and their families or carers are often experiencing stress on the way to the ED, which may increase if they have difficulty with directions. This can also affect their overall experiences; in 2018–19, patients who said ED signposting was ‘definitely’ easy to follow were more likely to rate their overall care as ‘very good’ compared with those who did not easily find their way.
The majority of patients in NSW travelled to ED by private vehicle, public transport or means other than ambulance (results ranged from 76% to 81% between 2014–15 and 2018–19). Of those who did not arrive by ambulance, the percentage of patients who said signposting to the ED was ‘definitely’ easy to follow declined significantly over the five years (76% to 74%). At LHD level, patients’ ratings of care on this measure declined significantly over the five years in Central Coast (80% to 67%), Mid North Coast (83% to 73%) and Sydney Children’s Hospitals Network (75% to 60%) (Figure 16).
Among principal referral and specialist hospital EDs, the percentage of patients who said signposting was ‘definitely’ easy to follow improved significantly in Wollongong (56% to 71%) and St George (68% to 81%). There were significant declines in Calvary Mater Newcastle (81% to 75%), The Children’s Hospital at Westmead (80% to 70%), Gosford (77% to 51%) and Sydney Children’s Hospital, Randwick (69% to 43%). In Sydney and Sydney Eye, ratings for this measure were consistently below 54% for all five years (Figure 17).
Among major hospitals, the percentage of patients who said signposting was ‘definitely’ easy to follow improved significantly in Tamworth (63% to 75%) and Lismore (73% to 78%). However, there were seven major hospital EDs where results for this measure declined significantly (Figure 18).
Fewer patients found signposting easy to follow
Finding the emergency department

26
Patients’ experiences in emergency departments
Healthcare in Focus – People’s experiences of hospital care: Insights from five years of patient feedback bhi.nsw.gov.au
Facilities
Figure 17 Of emergency department patients who did not arrive by ambulance, percentage of patients who said signposting was ‘definitely’ easy to follow, principal referral and specialist hospitals, 2014–15 to 2018–19
Figure 18 Of emergency department patients who did not arrive by ambulance, percentage of patients who said signposting was ‘definitely’ easy to follow, major hospitals, 2014–15 to 2018–19
Range of results
Major hospitals
Improved significantly
Declined significantly
Consistently higher
Consistently lower
Range of results
Principal referral and specialist hospitals
Improved significantly
Declined significantly
Consistently higher
Consistently lower
Results are identified as having significantly improved or declined over the five-year period, after accounting for differences in age, sex, language spoken at home and education. Statistical testing, based on all five years, has been used to identify whether change was significant. Due to the large volume of data available and the resulting power to detect significance, in some cases seemingly small numerical differences over time do constitute significant change. LHD and hospital results are only shown where they have significantly improved or declined over the five years, or where their results were consistently higher or lower than those in the relevant group.
Source: NSW Patient Survey Program. Emergency Department Patient Surveys 2014–15 to 2018–19.

27 Healthcare in Focus – People’s experiences of hospital care: Insights from five years of patient feedback bhi.nsw.gov.au
Patients’ experiences in emergency departments Engagement
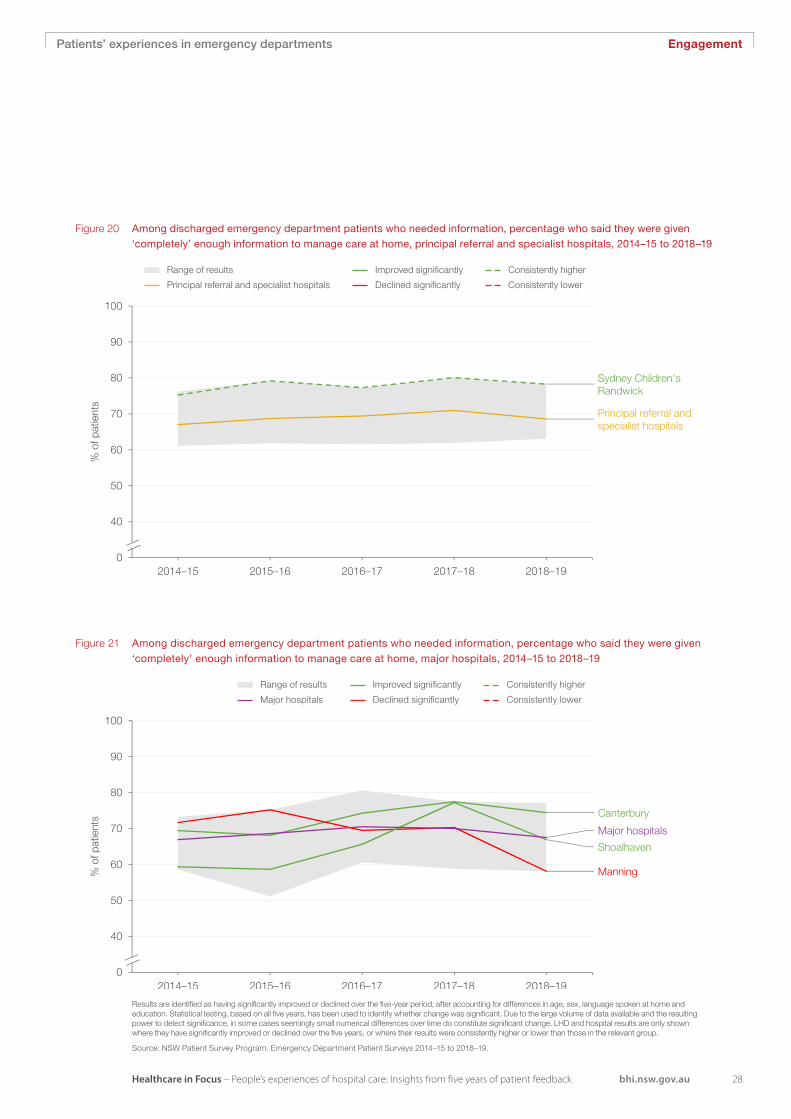
Figure 19 Among discharged emergency department patients who needed information, percentage who said they were given ‘completely’ enough information to manage care at home, NSW and local health districts, 2014–15 to 2018–19
Range of results
NSW
Improved significantly
Declined significantly
Consistently higher
Consistently lower
Patients and carers should feel confident when they leave the ED that they know about any requirements for post-discharge care, or who to contact if they have any questions.
Almost all patients in NSW who were discharged from ED (and not admitted to hospital) said they needed information to manage their care at home (93% or higher each year between 2014–15 and 2018–19). Of those patients who needed information, the percentage who said they were given ‘completely’ enough information to manage their care at home was 69% in 2018–19, which remained relatively stable over the five years. At LHD level, there were no notable improvements or declines for this measure over the five years. However, experiences were consistently below 69% in Western Sydney for all five years (Figure 19).
Among principal referral and specialist hospital EDs, there were no notable improvements or declines in the percentage of patients who said they were given
‘completely’ enough information to manage their care at home. However, in Sydney Children’s Hospital, Randwick, patients’ ratings were consistently above 74% for all five years (Figure 20).
There were two major hospital EDs where experiences improved, and two where they declined, significantly for this measure between 2014–15 and 2018–19. The percentage of patients who said they were given ‘completely’ enough information to manage their care at home improved significantly in Canterbury (69% to 74%) and Shoalhaven (59% to 67%). Experiences declined significantly for this measure in Manning (72% to 58%) (Figure 21).
Patients were also asked whether staff told them, when they left hospital, who to contact if they were worried about their condition and treatment. The percentage of patients who said they knew who to contact remained high and relatively stable over the five years (82% to 83%).
ED patients felt consistently well informed to manage their care at home
Communication when leaving the hospital
28
Patients’ experiences in emergency departments
Healthcare in Focus – People’s experiences of hospital care: Insights from five years of patient feedback bhi.nsw.gov.au
Engagement
Figure 20 Among discharged emergency department patients who needed information, percentage who said they were given ‘completely’ enough information to manage care at home, principal referral and specialist hospitals, 2014–15 to 2018–19
Figure 21 Among discharged emergency department patients who needed information, percentage who said they were given ‘completely’ enough information to manage care at home, major hospitals, 2014–15 to 2018–19
Range of results
Principal referral and specialist hospitals
Improved significantly
Declined significantly
Range of results
Major hospitals
Improved significantly
Declined significantly
Consistently higher
Consistently lower
Consistently higher
Consistently lower
Results are identified as having significantly improved or declined over the five-year period, after accounting for differences in age, sex, language spoken at home and education. Statistical testing, based on all five years, has been used to identify whether change was significant. Due to the large volume of data available and the resulting power to detect significance, in some cases seemingly small numerical differences over time do constitute significant change. LHD and hospital results are only shown where they have significantly improved or declined over the five years, or where their results were consistently higher or lower than those in the relevant group.
Source: NSW Patient Survey Program. Emergency Department Patient Surveys 2014–15 to 2018–19.
29 Healthcare in Focus – People’s experiences of hospital care: Insights from five years of patient feedback bhi.nsw.gov.au
Patients’ experiences in emergency departments Waiting
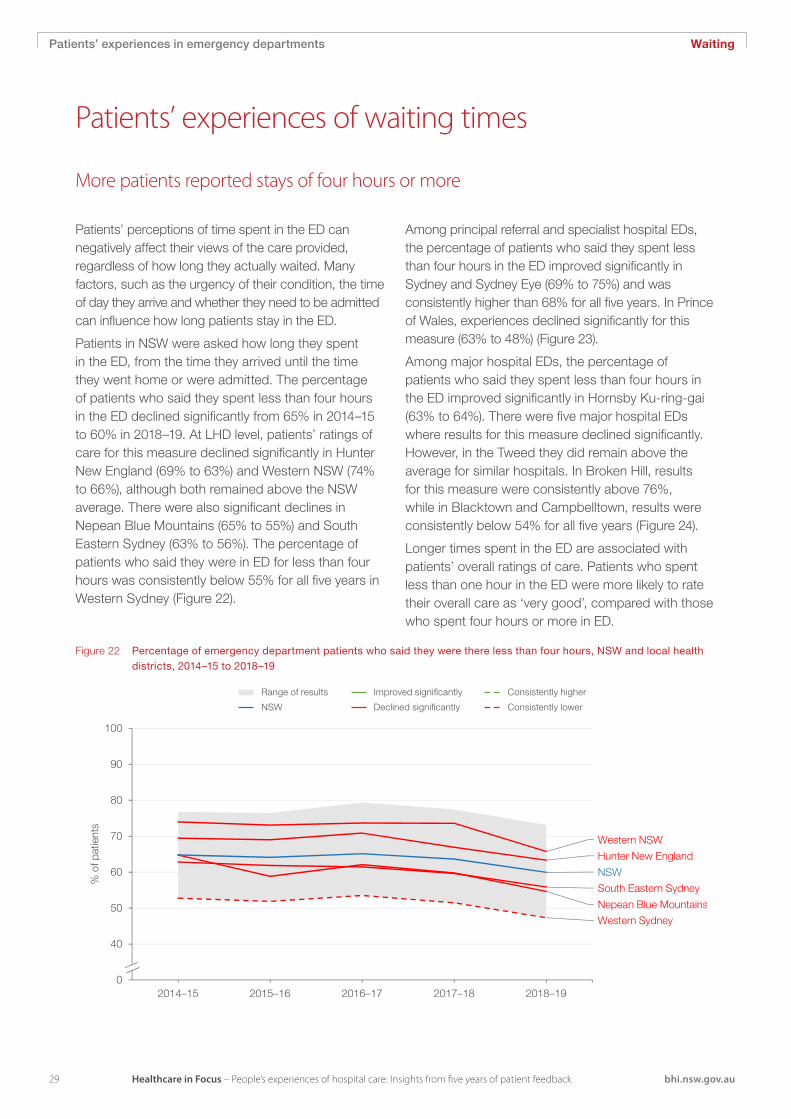
Figure 22 Percentage of emergency department patients who said they were there less than four hours, NSW and local health districts, 2014–15 to 2018–19
Range of results
NSW
Improved significantly
Declined significantly
Consistently higher
Consistently lower
Patients’ perceptions of time spent in the ED can negatively affect their views of the care provided, regardless of how long they actually waited. Many factors, such as the urgency of their condition, the time of day they arrive and whether they need to be admitted can influence how long patients stay in the ED.
Patients in NSW were asked how long they spent in the ED, from the time they arrived until the time they went home or were admitted. The percentage of patients who said they spent less than four hours in the ED declined significantly from 65% in 2014–15 to 60% in 2018–19. At LHD level, patients’ ratings of care for this measure declined significantly in Hunter New England (69% to 63%) and Western NSW (74% to 66%), although both remained above the NSW average. There were also significant declines in Nepean Blue Mountains (65% to 55%) and South Eastern Sydney (63% to 56%). The percentage of patients who said they were in ED for less than four hours was consistently below 55% for all five years in Western Sydney (Figure 22).
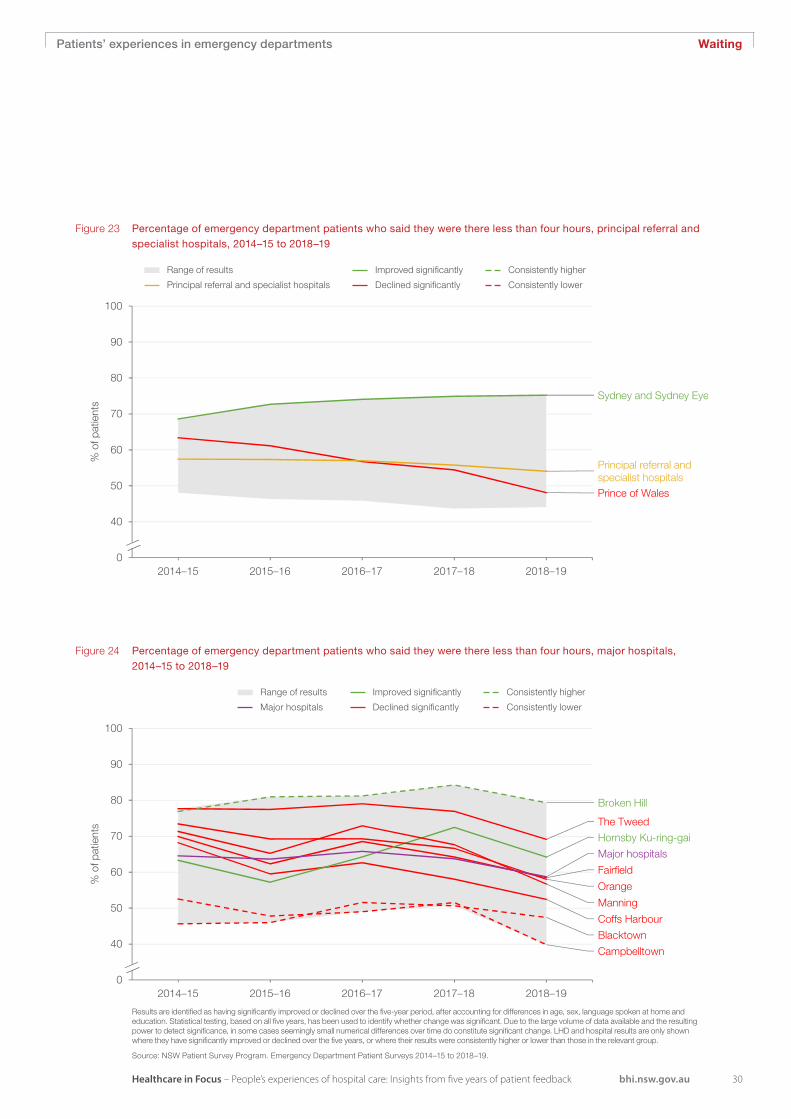
Among principal referral and specialist hospital EDs, the percentage of patients who said they spent less than four hours in the ED improved significantly in Sydney and Sydney Eye (69% to 75%) and was consistently higher than 68% for all five years. In Prince of Wales, experiences declined significantly for this measure (63% to 48%) (Figure 23).
Among major hospital EDs, the percentage of patients who said they spent less than four hours in the ED improved significantly in Hornsby Ku-ring-gai (63% to 64%). There were five major hospital EDs where results for this measure declined significantly. However, in the Tweed they did remain above the average for similar hospitals. In Broken Hill, results for this measure were consistently above 76%, while in Blacktown and Campbelltown, results were consistently below 54% for all five years (Figure 24).
Longer times spent in the ED are associated with patients’ overall ratings of care. Patients who spent less than one hour in the ED were more likely to rate their overall care as ‘very good’, compared with those who spent four hours or more in ED.
More patients reported stays of four hours or more
Patients’ experiences of waiting times
30
Patients’ experiences in emergency departments
Healthcare in Focus – People’s experiences of hospital care: Insights from five years of patient feedback bhi.nsw.gov.au
Waiting
Figure 23 Percentage of emergency department patients who said they were there less than four hours, principal referral and specialist hospitals, 2014–15 to 2018–19
Figure 24 Percentage of emergency department patients who said they were there less than four hours, major hospitals, 2014–15 to 2018–19
Range of results
Principal referral and specialist hospitals
Improved significantly
Declined significantly
Range of results
Major hospitals
Improved significantly
Declined significantly
Consistently higher
Consistently lower
Consistently higher
Consistently lower
Results are identified as having significantly improved or declined over the five-year period, after accounting for differences in age, sex, language spoken at home and education. Statistical testing, based on all five years, has been used to identify whether change was significant. Due to the large volume of data available and the resulting power to detect significance, in some cases seemingly small numerical differences over time do constitute significant change. LHD and hospital results are only shown where they have significantly improved or declined over the five years, or where their results were consistently higher or lower than those in the relevant group.
Source: NSW Patient Survey Program. Emergency Department Patient Surveys 2014–15 to 2018–19.
Admitted patients’ experiences of care
31 Healthcare in Focus – People’s experiences of hospital care: Insights from five years of patient feedback bhi.nsw.gov.au

32Healthcare in Focus – People’s experiences of hospital care: Insights from five years of patient feedback bhi.nsw.gov.au
Key findings at NSW level
More than 122,000 adults shared their experiences of care from
2014 to 2018 as part of the Adult Admitted Patient Survey. We
explored trends in patient experiences in 36 public hospitals across
51 measures over the five-year period.
Admitted patients’ experiences of care
Results are identified as having significantly improved or declined over the five-year period from 2014 to 2018, after accounting for differences in age, sex, language spoken at home and education. Statistical testing, based on all five years, has been used to identify whether change was significant.
Looking at trends in patient experience at NSW level over the five years to 2018:
Patients became more positive about
their experiences with nurses. The
proportion who said nurses were ‘always’
kind and caring improved significantly to
more than eight in 10 (86%).
Patients with important questions for
their doctor were more positive about
communication. The proportion of patients
reporting they were ‘always’ answered
in an understandable way improved
significantly to almost eight in 10 (78%).
Patients’ experiences of communication
when leaving hospital remained consistent,
with the proportion saying they were
given ‘completely’ enough information
to manage their care at home relatively
stable at around seven in 10 (73%).
The likelihood of patients feeling involved
in decisions about their care remained
consistent – six in 10 (60%) said they
‘definitely’ felt involved.
Patients were increasingly positive about
their overall experience over the five years,
with more than two-thirds (67%) rating
their overall care as ‘very good’ in 2018.
The likelihood of patients who
experienced pain in hospital reporting it
was managed well remained consistent,
with three-quarters (75%) saying staff
‘definitely’ did everything possible.
Patients said hospitals in NSW were
cleaner – the proportion who said their
ward or room was ‘very clean’ improved
significantly to around seven in 10 (71%).
Patients were more likely to wait when
leaving hospital. The proportion of
patients who reported having no delay in
departure declined significantly to fewer
than eight in 10 (78%).
33 Healthcare in Focus – People’s experiences of hospital care: Insights from five years of patient feedback bhi.nsw.gov.au
Admitted patients’ experiences of care Overall care
Positive patient experiences reflect care that is patient-centred and focused on the person, not only their condition or illness.
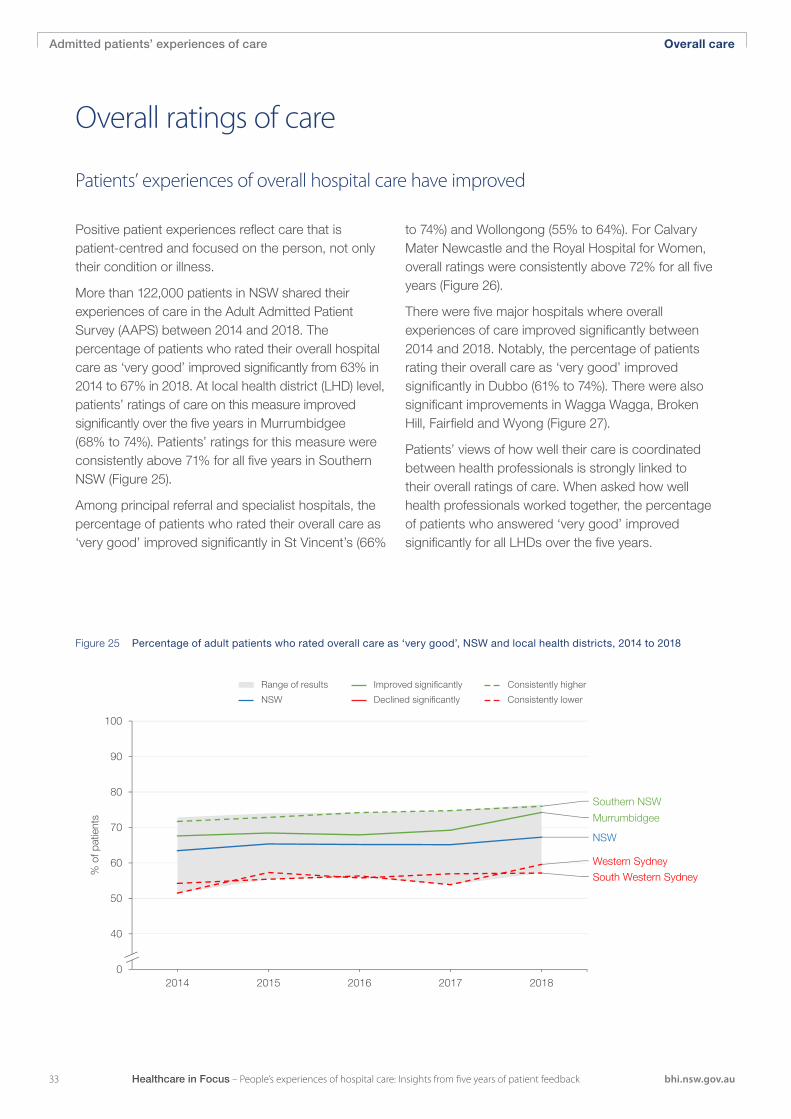
More than 122,000 patients in NSW shared their experiences of care in the Adult Admitted Patient Survey (AAPS) between 2014 and 2018. The percentage of patients who rated their overall hospital care as ‘very good’ improved significantly from 63% in 2014 to 67% in 2018. At local health district (LHD) level, patients’ ratings of care on this measure improved significantly over the five years in Murrumbidgee (68% to 74%). Patients’ ratings for this measure were consistently above 71% for all five years in Southern NSW (Figure 25).
Among principal referral and specialist hospitals, the percentage of patients who rated their overall care as ‘very good’ improved significantly in St Vincent’s (66%
to 74%) and Wollongong (55% to 64%). For Calvary Mater Newcastle and the Royal Hospital for Women, overall ratings were consistently above 72% for all five years (Figure 26).
There were five major hospitals where overall experiences of care improved significantly between 2014 and 2018. Notably, the percentage of patients rating their overall care as ‘very good’ improved significantly in Dubbo (61% to 74%). There were also significant improvements in Wagga Wagga, Broken Hill, Fairfield and Wyong (Figure 27).
Patients’ views of how well their care is coordinated between health professionals is strongly linked to their overall ratings of care. When asked how well health professionals worked together, the percentage of patients who answered ‘very good’ improved significantly for all LHDs over the five years.
Patients’ experiences of overall hospital care have improved
Overall ratings of care
Figure 25 Percentage of adult patients who rated overall care as ‘very good’, NSW and local health districts, 2014 to 2018
Murrumbidgee
NSW
South Western Sydney
Southern NSW
Western Sydney
0
40
50
60
70
80
90
100
2014 2015 2016 2017 2018
% o
f pat
ient
s
Range of results
NSW
Improved significantly
Declined significantly
Consistently higher
Consistently lower

34
Admitted patients’ experiences of care
Healthcare in Focus – People’s experiences of hospital care: Insights from five years of patient feedback bhi.nsw.gov.au
Overall care
Figure 26 Percentage of adult patients who rated overall care as ‘very good’, principal referral and specialist hospitals, 2014 to 2018
Figure 27 Percentage of adult patients who rated overall care as ‘very good’, major hospitals, 2014 to 2018
Results are identified as having significantly improved or declined over the five-year period, after accounting for differences in age, sex, language spoken at home and education. Statistical testing, based on all five years, has been used to identify whether change was significant. Due to the large volume of data available and the resulting power to detect significance, in some cases seemingly small numerical differences over time do constitute significant change. LHD and hospital results are only shown where they have significantly improved or declined over the five years, or where their results were consistently higher or lower than those in the relevant group.
Source: NSW Patient Survey Program. Adult Admitted Patient Surveys 2014 to 2018.
Range of results
Principal referral and specialist hospitals
Improved significantly
Declined significantly
Range of results
Major hospitals
Improved significantly
Declined significantly
Consistently higher
Consistently lower
Consistently higher
Consistently lower
35 Healthcare in Focus – People’s experiences of hospital care: Insights from five years of patient feedback bhi.nsw.gov.au
Admitted patients’ experiences of care Health professionals
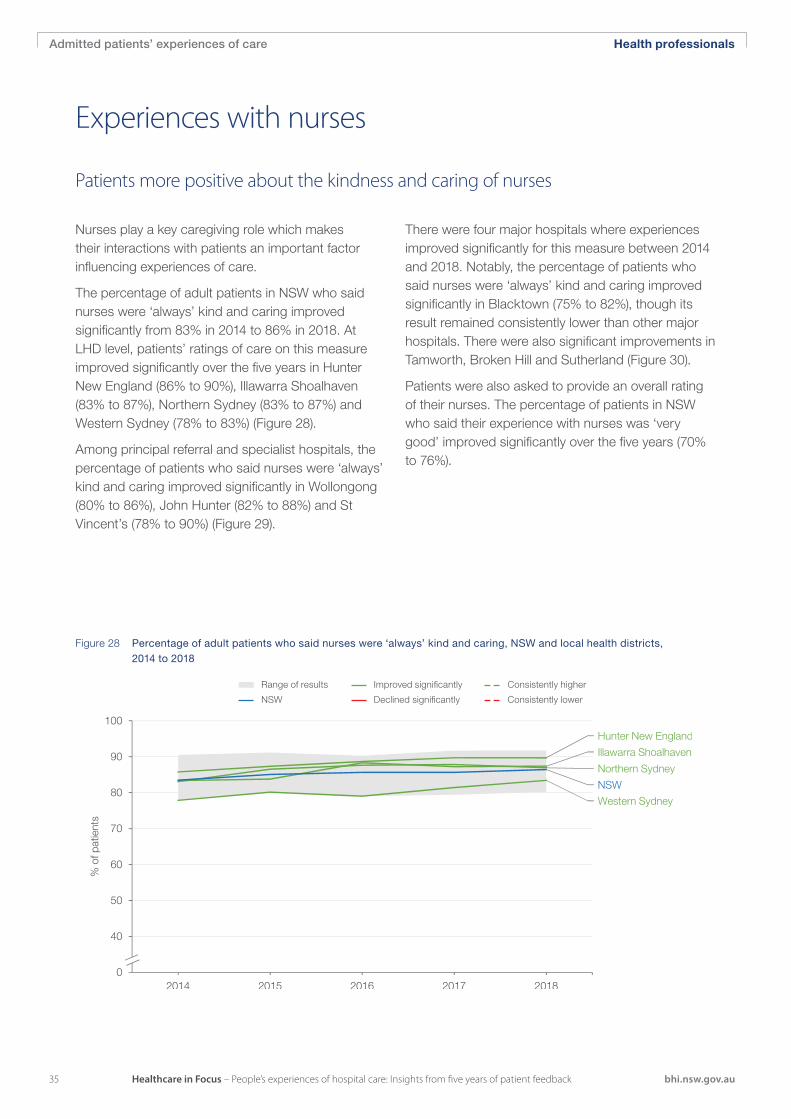
Nurses play a key caregiving role which makes their interactions with patients an important factor influencing experiences of care.
The percentage of adult patients in NSW who said nurses were ‘always’ kind and caring improved significantly from 83% in 2014 to 86% in 2018. At LHD level, patients’ ratings of care on this measure improved significantly over the five years in Hunter New England (86% to 90%), Illawarra Shoalhaven (83% to 87%), Northern Sydney (83% to 87%) and Western Sydney (78% to 83%) (Figure 28).
Among principal referral and specialist hospitals, the percentage of patients who said nurses were ‘always’ kind and caring improved significantly in Wollongong (80% to 86%), John Hunter (82% to 88%) and St Vincent’s (78% to 90%) (Figure 29).
There were four major hospitals where experiences improved significantly for this measure between 2014 and 2018. Notably, the percentage of patients who said nurses were ‘always’ kind and caring improved significantly in Blacktown (75% to 82%), though its result remained consistently lower than other major hospitals. There were also significant improvements in Tamworth, Broken Hill and Sutherland (Figure 30).
Patients were also asked to provide an overall rating of their nurses. The percentage of patients in NSW who said their experience with nurses was ‘very good’ improved significantly over the five years (70% to 76%).
Patients more positive about the kindness and caring of nurses
Experiences with nurses
Figure 28 Percentage of adult patients who said nurses were ‘always’ kind and caring, NSW and local health districts, 2014 to 2018
Range of results
NSW
Improved significantly
Declined significantly
Consistently higher
Consistently lower

36
Admitted patients’ experiences of care
Healthcare in Focus – People’s experiences of hospital care: Insights from five years of patient feedback bhi.nsw.gov.au
Health professionals
Figure 29 Percentage of adult patients who said nurses were ‘always’ kind and caring, principal referral and specialist hospitals, 2014 to 2018
Figure 30 Percentage of adult patients who said nurses were ‘always’ kind and caring, major hospitals, 2014 to 2018
Range of results
Principal referral and specialist hospitals
Improved significantly
Declined significantly
Range of results
Major hospitals
Improved significantly
Declined significantly
Consistently higher
Consistently lower
Consistently higher
Consistently lower
Results are identified as having significantly improved or declined over the five-year period, after accounting for differences in age, sex, language spoken at home and education. Statistical testing, based on all five years, has been used to identify whether change was significant. Due to the large volume of data available and the resulting power to detect significance, in some cases seemingly small numerical differences over time do constitute significant change. LHD and hospital results are only shown where they have significantly improved or declined over the five years, or where their results were consistently higher or lower than those in the relevant group.
Source: NSW Patient Survey Program. Adult Admitted Patient Surveys 2014 to 2018.
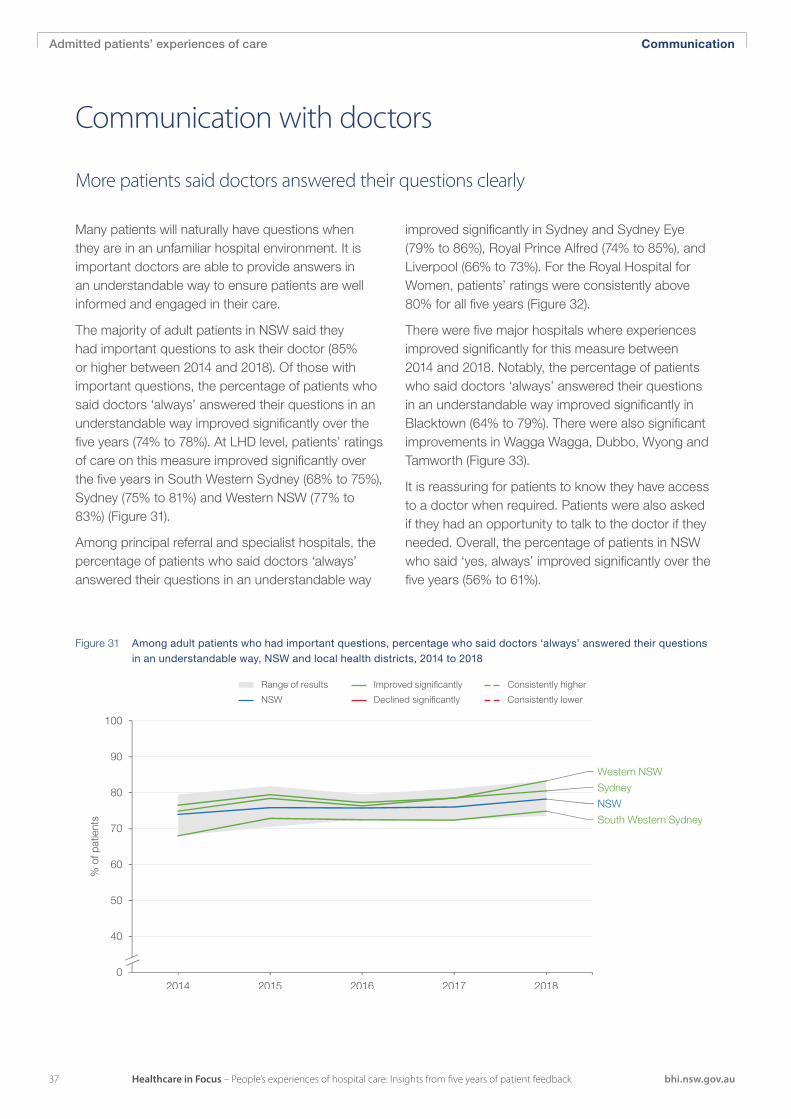
37 Healthcare in Focus – People’s experiences of hospital care: Insights from five years of patient feedback bhi.nsw.gov.au
Admitted patients’ experiences of care Communication
Many patients will naturally have questions when they are in an unfamiliar hospital environment. It is important doctors are able to provide answers in an understandable way to ensure patients are well informed and engaged in their care.
The majority of adult patients in NSW said they had important questions to ask their doctor (85% or higher between 2014 and 2018). Of those with important questions, the percentage of patients who said doctors ‘always’ answered their questions in an understandable way improved significantly over the five years (74% to 78%). At LHD level, patients’ ratings of care on this measure improved significantly over the five years in South Western Sydney (68% to 75%), Sydney (75% to 81%) and Western NSW (77% to 83%) (Figure 31).
Among principal referral and specialist hospitals, the percentage of patients who said doctors ‘always’ answered their questions in an understandable way
improved significantly in Sydney and Sydney Eye (79% to 86%), Royal Prince Alfred (74% to 85%), and Liverpool (66% to 73%). For the Royal Hospital for Women, patients’ ratings were consistently above 80% for all five years (Figure 32).
There were five major hospitals where experiences improved significantly for this measure between 2014 and 2018. Notably, the percentage of patients who said doctors ‘always’ answered their questions in an understandable way improved significantly in Blacktown (64% to 79%). There were also significant improvements in Wagga Wagga, Dubbo, Wyong and Tamworth (Figure 33).
It is reassuring for patients to know they have access to a doctor when required. Patients were also asked if they had an opportunity to talk to the doctor if they needed. Overall, the percentage of patients in NSW who said ‘yes, always’ improved significantly over the five years (56% to 61%).
More patients said doctors answered their questions clearly
Communication with doctors
Figure 31 Among adult patients who had important questions, percentage who said doctors ‘always’ answered their questions in an understandable way, NSW and local health districts, 2014 to 2018
Range of results
NSW
Improved significantly
Declined significantly
Consistently higher
Consistently lower
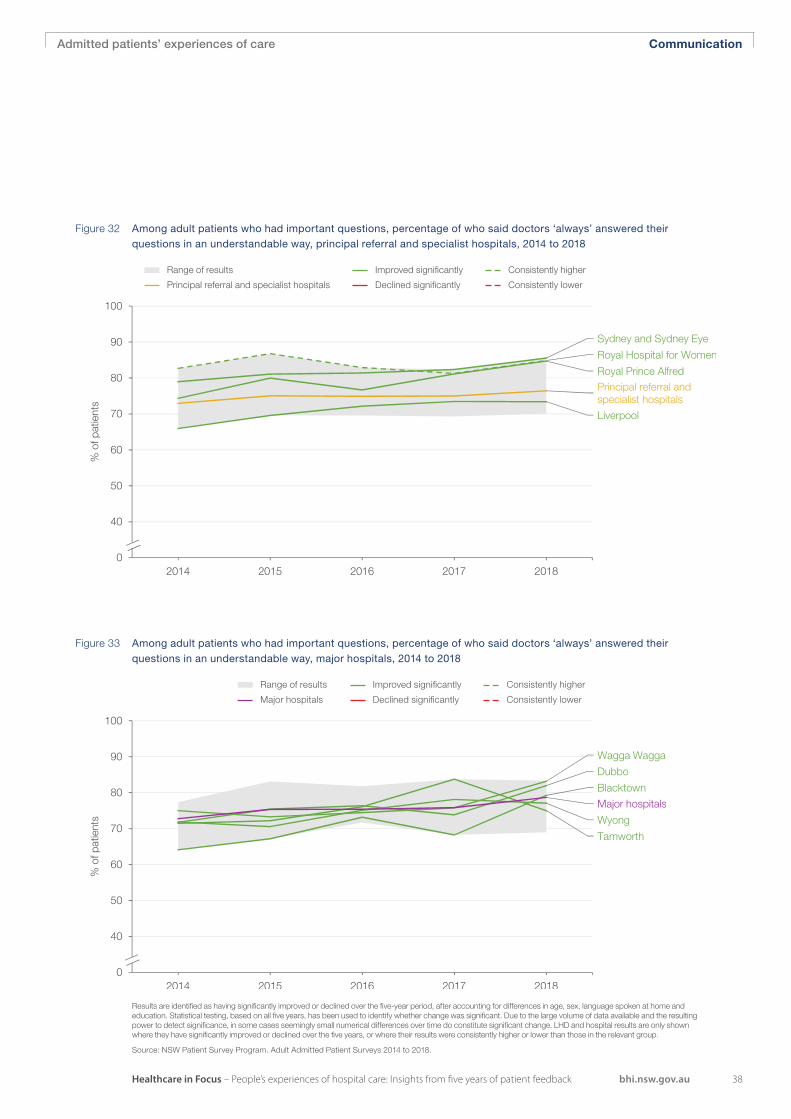
38
Admitted patients’ experiences of care
Healthcare in Focus – People’s experiences of hospital care: Insights from five years of patient feedback bhi.nsw.gov.au
Communication
Figure 32 Among adult patients who had important questions, percentage of who said doctors ‘always’ answered their questions in an understandable way, principal referral and specialist hospitals, 2014 to 2018
Figure 33 Among adult patients who had important questions, percentage of who said doctors ‘always’ answered their questions in an understandable way, major hospitals, 2014 to 2018
Range of results
Principal referral and specialist hospitals
Improved significantly
Declined significantly
Range of results
Major hospitals
Improved significantly
Declined significantly
Consistently higher
Consistently lower
Consistently higher
Consistently lower
Results are identified as having significantly improved or declined over the five-year period, after accounting for differences in age, sex, language spoken at home and education. Statistical testing, based on all five years, has been used to identify whether change was significant. Due to the large volume of data available and the resulting power to detect significance, in some cases seemingly small numerical differences over time do constitute significant change. LHD and hospital results are only shown where they have significantly improved or declined over the five years, or where their results were consistently higher or lower than those in the relevant group.
Source: NSW Patient Survey Program. Adult Admitted Patient Surveys 2014 to 2018.

39 Healthcare in Focus – People’s experiences of hospital care: Insights from five years of patient feedback bhi.nsw.gov.au
Admitted patients’ experiences of care Engagement
When patients and their carers feel engaged and involved in their care, it improves communication, understanding of their condition and their ability to actively manage health problems outside the hospital.
The vast majority of adult patients in NSW said they wanted, and were well enough, to be involved in decisions about their care (91% each year between 2014 and 2018). Of those who wanted to be involved in decisions about their care, the percentage of patients who said they ‘definitely’ felt involved was 60% in 2018, which remained relatively stable over the five years. At LHD level, there were no notable improvements or declines on this measure (Figure 34).
Among principal referral and specialist hospitals, there were no notable improvements or declines in the percentage of patients who said they ‘definitely’ felt involved in decisions about their care. However, for the Royal Hospital for Women, patients’ ratings were consistently above 67% for all five years (Figure 35).
There were four major hospitals where experiences improved significantly for this measure between 2014 and 2018. Notably, the percentage of patients who said they ‘definitely’ felt involved in decisions about their care improved significantly in Dubbo (59% to 73%). There were also significant improvements in Wagga Wagga, Wyong and Auburn (Figure 36).
Patients were also asked how much information was provided about their condition or treatment. The percentage of patients who said they received the ‘right amount’ of information was 86% in 2018, which remained relatively stable over the five years.
Patients’ involvement in their care relatively stable over time
Involvement in decisions
Figure 34 Among adults patients who wanted involvement, percentage who said they were ‘definitely’ involved in decisions about care, NSW and local health districts, 2014 to 2018
Range of results
NSW
Improved significantly
Declined significantly
Consistently higher
Consistently lower
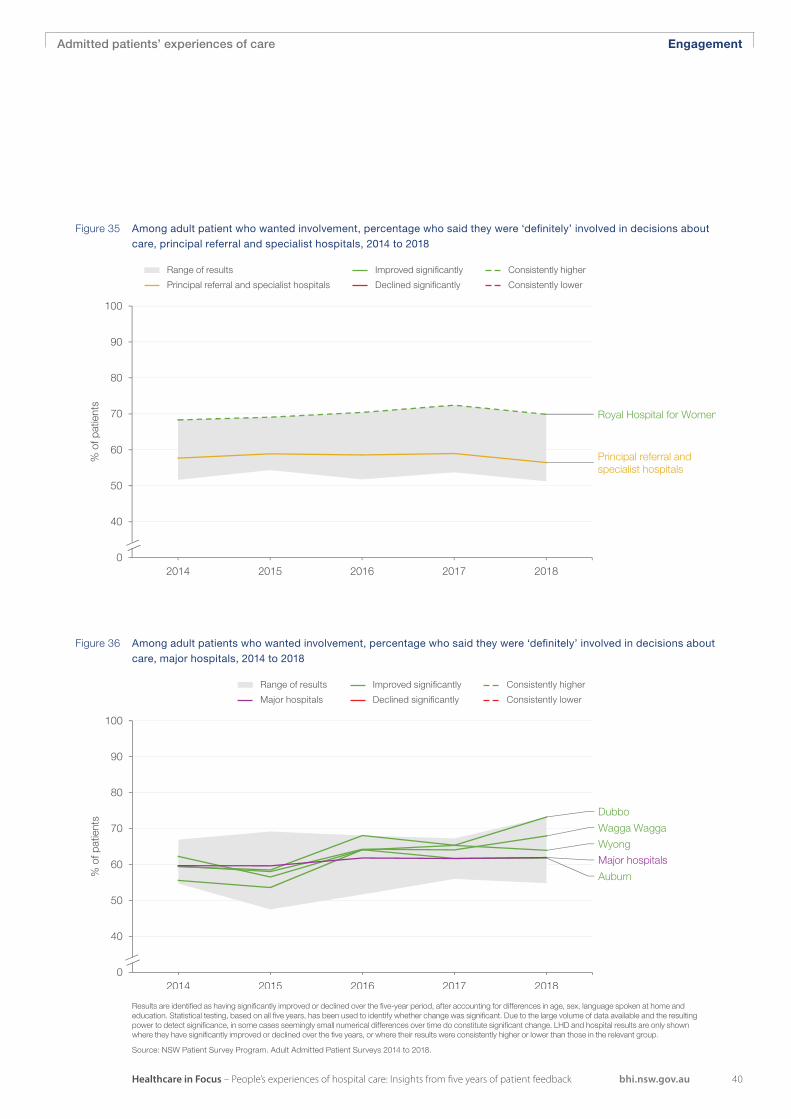
40
Admitted patients’ experiences of care
Healthcare in Focus – People’s experiences of hospital care: Insights from five years of patient feedback bhi.nsw.gov.au
Engagement
Figure 35 Among adult patient who wanted involvement, percentage who said they were ‘definitely’ involved in decisions about care, principal referral and specialist hospitals, 2014 to 2018
Figure 36 Among adult patients who wanted involvement, percentage who said they were ‘definitely’ involved in decisions about care, major hospitals, 2014 to 2018
Range of results
Principal referral and specialist hospitals
Improved significantly
Declined significantly
Range of results
Major hospitals
Improved significantly
Declined significantly
Consistently higher
Consistently lower
Consistently higher
Consistently lower
Results are identified as having significantly improved or declined over the five-year period, after accounting for differences in age, sex, language spoken at home and education. Statistical testing, based on all five years, has been used to identify whether change was significant. Due to the large volume of data available and the resulting power to detect significance, in some cases seemingly small numerical differences over time do constitute significant change. LHD and hospital results are only shown where they have significantly improved or declined over the five years, or where their results were consistently higher or lower than those in the relevant group.
Source: NSW Patient Survey Program. Adult Admitted Patient Surveys 2014 to 2018.

41 Healthcare in Focus – People’s experiences of hospital care: Insights from five years of patient feedback bhi.nsw.gov.au
Admitted patients’ experiences of care Pain management
When patients are asked about what experiences matter to them, pain management is a key source of concern. It is an important part of their physical and emotional comfort when in hospital.
About half of adult patients in NSW said they experienced pain while in hospital (results ranged from 48% to 51% between 2014 and 2018). Of those who experienced pain, the percentage of patients who said staff ‘definitely’ did everything possible to manage their pain was 75% in 2018, which remained relatively stable over the five years. At LHD level, patients’ ratings of care on this measure declined significantly over the five years in Central Coast (81% to 71%) (Figure 37).
Among principal referral and specialist hospitals, the percentage of patients who said staff ‘definitely’ did everything possible to manage their pain improved significantly in Liverpool (66% to 79%) and St
Vincent’s (73% to 83%), and declined significantly in Gosford (81% to 70%). For the Royal Hospital for Women, patients’ ratings were consistently above 80% for all five years (Figure 38).
There were two major hospitals where experiences declined significantly for this measure between 2014 and 2018. The percentage of patients who said staff ‘definitely’ did everything possible to manage their pain declined significantly in Coffs Harbour (84% to 76%) and Campbelltown (79% to 70%) (Figure 39).
Knowing care is close at hand can also deliver peace of mind for patients. Those who said they experienced pain while in hospital were also asked if a call button was placed within easy reach. The percentage of patients who said one was placed within easy reach was 84% in 2018, which remained relatively stable over the five years.
Patients’ experiences of pain management remained stable over time
Pain management
Figure 37 Among adult patients who reported pain in hospital, percentage who said staff ‘definitely’ did everything possible to manage their pain, NSW and local health districts, 2014 to 2018
Range of results
NSW
Improved significantly
Declined significantly
Consistently higher
Consistently lower

42
Admitted patients’ experiences of care
Healthcare in Focus – People’s experiences of hospital care: Insights from five years of patient feedback bhi.nsw.gov.au
Pain management
Figure 38 Among adult patients who reported pain in hospital, percentage of patients who said staff ‘definitely’ did everything possible to manage their pain, principal referral and specialist hospitals, 2014 to 2018
Figure 39 Among adult patients who reported pain in hospital, percentage of who said staff ‘definitely’ did everything possible to manage their pain, major hospitals, 2014 to 2018
Range of results
Principal referral and specialist hospitals
Improved significantly
Declined significantly
Range of results
Major hospitals
Improved significantly
Declined significantly
Consistently higher
Consistently lower
Consistently higher
Consistently lower
Results are identified as having significantly improved or declined over the five-year period, after accounting for differences in age, sex, language spoken at home and education. Statistical testing, based on all five years, has been used to identify whether change was significant. Due to the large volume of data available and the resulting power to detect significance, in some cases seemingly small numerical differences over time do constitute significant change. LHD and hospital results are only shown where they have significantly improved or declined over the five years, or where their results were consistently higher or lower than those in the relevant group.
Source: NSW Patient Survey Program. Adult Admitted Patient Surveys 2014 to 2018.

43 Healthcare in Focus – People’s experiences of hospital care: Insights from five years of patient feedback bhi.nsw.gov.au
Admitted patients’ experiences of care Facilities
Keeping hospital facilities clean ensures patients and carers have more comfortable experiences, and reduces the risk of the spread of infection.
The percentage of adult patients in NSW who said the wards or rooms they stayed in were ‘very clean’ improved significantly from 65% in 2014 to 71% in 2018. Patients’ ratings of care for this measure improved significantly over the five years in seven LHDs. Notably, there was a significant improvement in Murrumbidgee (61% to 80%) (Figure 40).
Among principal referral and specialist hospitals, the percentage of patients who said the wards or rooms they stayed in were ‘very clean’ improved significantly in Wollongong (62% to 71%), St George (53% to 65%) and Westmead (51% to 63%). In Calvary Mater Newcastle, patients’ ratings were consistently above 78% for all five years (Figure 41).
There were 10 major hospitals where experiences improved significantly for this measure between 2014 and 2018. Notably, the percentage of patients who said the wards or rooms they stayed in were ‘very clean’ improved by 15 percentage points or more in five hospitals: Wagga Wagga (53% to 84%), Hornsby Ku-ring-gai (55% to 75%), Dubbo (63% to 79%), Lismore (69% to 85%) and Blacktown (49% to 65%). (Figure 42).
Patients were also asked about the cleanliness of hospital bathrooms. Between 2014 and 2018, the percentage of patients who said the bathrooms were ‘very clean’ improved significantly over the five years (56% to 63%).
Substantial improvements in patients’ views of cleanliness
Cleanliness of wards
Figure 40 Percentage of adult patients who said wards and rooms were ‘very clean’, NSW and local health districts, 2014 to 2018
Range of results
NSW
Improved significantly
Declined significantly
Consistently higher
Consistently lower
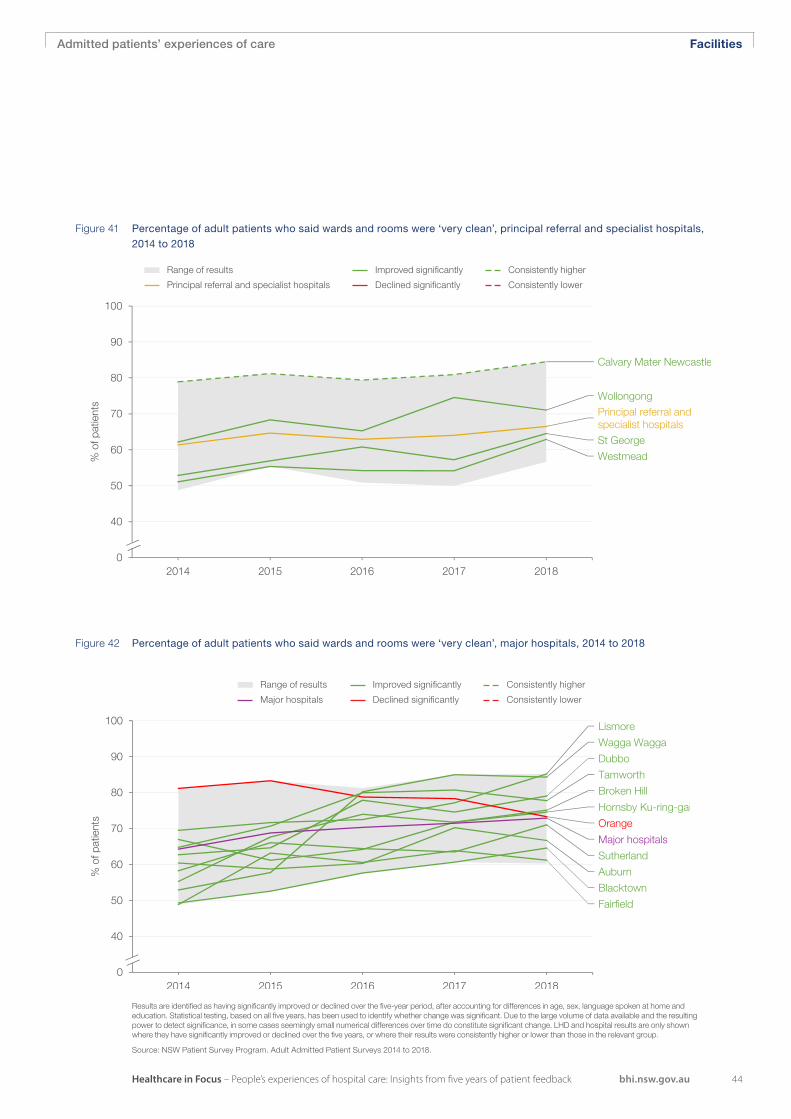
44
Admitted patients’ experiences of care
Healthcare in Focus – People’s experiences of hospital care: Insights from five years of patient feedback bhi.nsw.gov.au
Facilities
Figure 41 Percentage of adult patients who said wards and rooms were ‘very clean’, principal referral and specialist hospitals, 2014 to 2018
Figure 42 Percentage of adult patients who said wards and rooms were ‘very clean’, major hospitals, 2014 to 2018
Range of results
Principal referral and specialist hospitals
Improved significantly
Declined significantly
Range of results
Major hospitals
Improved significantly
Declined significantly
Consistently higher
Consistently lower
Consistently higher
Consistently lower
Results are identified as having significantly improved or declined over the five-year period, after accounting for differences in age, sex, language spoken at home and education. Statistical testing, based on all five years, has been used to identify whether change was significant. Due to the large volume of data available and the resulting power to detect significance, in some cases seemingly small numerical differences over time do constitute significant change. LHD and hospital results are only shown where they have significantly improved or declined over the five years, or where their results were consistently higher or lower than those in the relevant group.
Source: NSW Patient Survey Program. Adult Admitted Patient Surveys 2014 to 2018.

45 Healthcare in Focus – People’s experiences of hospital care: Insights from five years of patient feedback bhi.nsw.gov.au
Admitted patients’ experiences of care Communication
Communication with patients preparing to leave hospital is essential to ensure continuity of care. When patients are not engaged and clear on their next steps at discharge, they have a greater chance of readmission in the following months.
Almost all adult patients in NSW said they needed information to manage their care at home (91% or higher each year between 2014 and 2018). Of those who needed information, the percentage of patients who said they were given ‘completely’ enough information to manage their care at home was 73% in 2018, which remained relatively stable over the five years. At LHD level, there were no notable improvements or declines for this measure over the five years. However, experiences in Nepean Blue Mountains were consistently below 71% for all five years (Figure 43).
Among principal referral and specialist hospitals, there were no notable improvements or declines in the percentage of patients who said they were given ‘completely’ enough information to manage their care at home. However, in Sydney and Sydney Eye, patients’ ratings were consistently above 81% for all five years (Figure 44).
Among major hospitals, the percentage of patients who said they were given ‘completely’ enough information to manage their care at home improved significantly between 2014 and 2018 in Dubbo (70% to 77%), Wyong (73% to 78%) and Blacktown (65% to 72%) (Figure 45).
Patients were also asked whether staff told them, when they left hospital, who to contact if they were worried about their condition. The percentage of patients who said they were provided with a contact improved significantly over the five years (86% to 87%).
Patients’ preparedness to manage care at home relatively stable over time
Communication when leaving hospital
Figure 43 Among adult patients who needed information, percentage who said they were given ‘completely’ enough information to manage care at home, NSW and local health districts, 2014 to 2018
Range of results
NSW
Improved significantly
Declined significantly
Consistently higher
Consistently lower
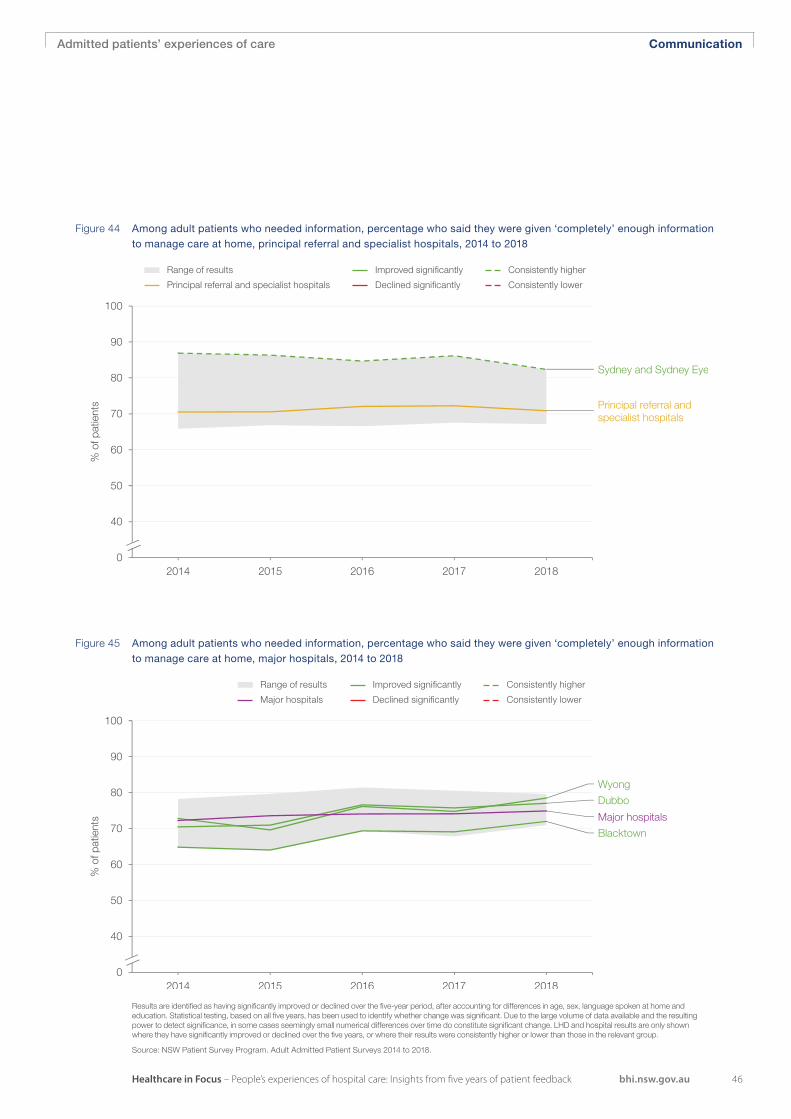
46
Admitted patients’ experiences of care
Healthcare in Focus – People’s experiences of hospital care: Insights from five years of patient feedback bhi.nsw.gov.au
Communication
Figure 44 Among adult patients who needed information, percentage who said they were given ‘completely’ enough information to manage care at home, principal referral and specialist hospitals, 2014 to 2018
Figure 45 Among adult patients who needed information, percentage who said they were given ‘completely’ enough information to manage care at home, major hospitals, 2014 to 2018
Range of results
Principal referral and specialist hospitals
Improved significantly
Declined significantly
Range of results
Major hospitals
Improved significantly
Declined significantly
Consistently higher
Consistently lower
Consistently higher
Consistently lower
Results are identified as having significantly improved or declined over the five-year period, after accounting for differences in age, sex, language spoken at home and education. Statistical testing, based on all five years, has been used to identify whether change was significant. Due to the large volume of data available and the resulting power to detect significance, in some cases seemingly small numerical differences over time do constitute significant change. LHD and hospital results are only shown where they have significantly improved or declined over the five years, or where their results were consistently higher or lower than those in the relevant group.
Source: NSW Patient Survey Program. Adult Admitted Patient Surveys 2014 to 2018.

47 Healthcare in Focus – People’s experiences of hospital care: Insights from five years of patient feedback bhi.nsw.gov.au
Admitted patients’ experiences of care Waiting
When patients are delayed leaving hospital, it may be because they are waiting for healthcare professionals to prepare for their departure, or for space in a suitable care setting to become available.
The percentage of adult patients in NSW who said they had no delay in departure on the day they left the hospital declined significantly from 80% in 2014 to 78% in 2018. At LHD level, there were no notable improvements or declines for this measure over the five years. In Southern NSW, the percentage of patients who did not experience delays was consistently above 84% for all five years (Figure 46).
Among principal referral and specialist hospitals, the percentage of patients who did not experience delays in departure on the day they left the hospital declined significantly in John Hunter (80% to 70%) (Figure 47).
There were two major hospitals where experiences declined significantly for this measure between 2014 and 2018. The percentage of patients who experienced no delay declined significantly in Coffs Harbour (83% to 76%) and Sutherland (78% to 75%) (Figure 48).
Patients were also asked about other services they might need after they left hospital. Of those who needed other services, the percentage of patients who said the hospital made ‘completely’ adequate arrangements was 70% in 2018, which remained relatively stable over the five years.
More patients reported having to wait when leaving hospital
Delays leaving hospital
Figure 46 Percentage of adult patients who said they had no delay leaving the hospital, NSW and local health districts, 2014 to 2018
Range of results
NSW
Improved significantly
Declined significantly
Consistently higher
Consistently lower

48
Admitted patients’ experiences of care
Healthcare in Focus – People’s experiences of hospital care: Insights from five years of patient feedback bhi.nsw.gov.au
Waiting
Figure 47 Percentage of adult patients who said they had no delay leaving the hospital, principal referral and specialist hospitals, 2014 to 2018
Figure 48 Percentage of adult patients who said they had no delay leaving the hospital, major hospitals, 2014 to 2018
Range of results
Principal referral and specialist hospitals
Improved significantly
Declined significantly
Range of results
Major hospitals
Improved significantly
Declined significantly
Consistently higher
Consistently lower
Consistently higher
Consistently lower
Results are identified as having significantly improved or declined over the five-year period, after accounting for differences in age, sex, language spoken at home and education. Statistical testing, based on all five years, has been used to identify whether change was significant. Due to the large volume of data available and the resulting power to detect significance, in some cases seemingly small numerical differences over time do constitute significant change. LHD and hospital results are only shown where they have significantly improved or declined over the five years, or where their results were consistently higher or lower than those in the relevant group.
Source: NSW Patient Survey Program. Adult Admitted Patient Surveys 2014 to 2018.
49 Healthcare in Focus – People’s experiences of hospital care: Insights from five years of patient feedback bhi.nsw.gov.au
Patient experience in focus
Patient experience in focus
BHI has spoken with healthcare professionals in local health districts (LHDs) across NSW to learn how they gather patient feedback, the ways in which they respond to what they learn, and the outcomes they have seen.
Results from BHI’s NSW Patient Survey Program are an important avenue for patients to tell health professionals about the care they received in hospital, and they are just one of many. For example, LHDs variously operate their own point-of-care surveys, monitor complaints
and compliments, and engage with consumer representatives, among other channels.
Hospitals and LHDs have numerous initiatives in operation at any one time that seek to contribute to positive patient outcomes, and often similar initiatives are in place across LHDs due to collaboration and coordination across the healthcare system. These Patient experience in focus pieces provide some examples of health professionals’ work to deliver positive experiences of care for patients.
Health professionals across NSW work every day to deliver positive
experiences of care for their patients. Listening to patients and carefully
considering the feedback they offer about their care is fundamental to
these efforts.
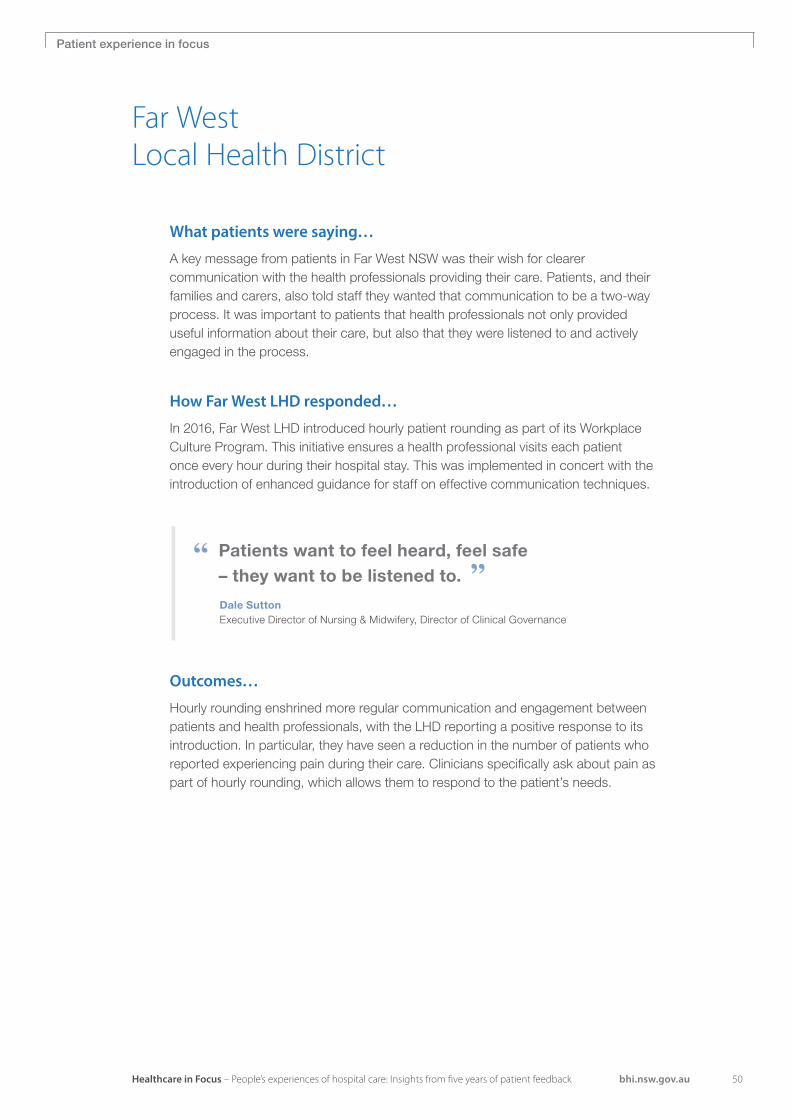
50Healthcare in Focus – People’s experiences of hospital care: Insights from five years of patient feedback bhi.nsw.gov.au
Patient experience in focus
Far West Local Health District
What patients were saying…
A key message from patients in Far West NSW was their wish for clearer communication with the health professionals providing their care. Patients, and their families and carers, also told staff they wanted that communication to be a two-way process. It was important to patients that health professionals not only provided useful information about their care, but also that they were listened to and actively engaged in the process.
How Far West LHD responded…
In 2016, Far West LHD introduced hourly patient rounding as part of its Workplace Culture Program. This initiative ensures a health professional visits each patient once every hour during their hospital stay. This was implemented in concert with the introduction of enhanced guidance for staff on effective communication techniques.
Patients want to feel heard, feel safe – they want to be listened to.
Dale SuttonExecutive Director of Nursing & Midwifery, Director of Clinical Governance
Outcomes…
Hourly rounding enshrined more regular communication and engagement between patients and health professionals, with the LHD reporting a positive response to its introduction. In particular, they have seen a reduction in the number of patients who reported experiencing pain during their care. Clinicians specifically ask about pain as part of hourly rounding, which allows them to respond to the patient’s needs.
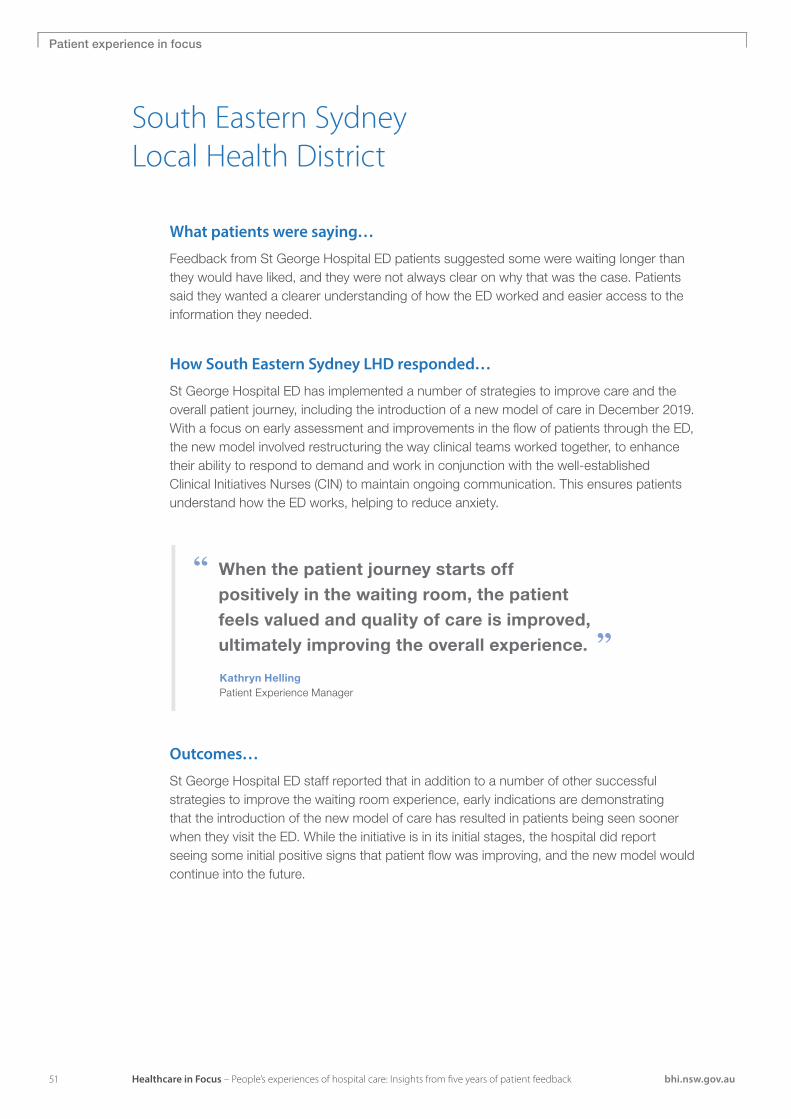
51 Healthcare in Focus – People’s experiences of hospital care: Insights from five years of patient feedback bhi.nsw.gov.au
Patient experience in focus
What patients were saying…
Feedback from St George Hospital ED patients suggested some were waiting longer than they would have liked, and they were not always clear on why that was the case. Patients said they wanted a clearer understanding of how the ED worked and easier access to the information they needed.
How South Eastern Sydney LHD responded…
St George Hospital ED has implemented a number of strategies to improve care and the overall patient journey, including the introduction of a new model of care in December 2019. With a focus on early assessment and improvements in the flow of patients through the ED, the new model involved restructuring the way clinical teams worked together, to enhance their ability to respond to demand and work in conjunction with the well-established Clinical Initiatives Nurses (CIN) to maintain ongoing communication. This ensures patients understand how the ED works, helping to reduce anxiety.
Outcomes…
St George Hospital ED staff reported that in addition to a number of other successful strategies to improve the waiting room experience, early indications are demonstrating that the introduction of the new model of care has resulted in patients being seen sooner when they visit the ED. While the initiative is in its initial stages, the hospital did report seeing some initial positive signs that patient flow was improving, and the new model would continue into the future.
When the patient journey starts off positively in the waiting room, the patient feels valued and quality of care is improved, ultimately improving the overall experience.
Kathryn HellingPatient Experience Manager
South Eastern Sydney Local Health District

52Healthcare in Focus – People’s experiences of hospital care: Insights from five years of patient feedback bhi.nsw.gov.au
Patient experience in focus
Western NSW Local Health District
What patients were saying…
Western NSW LHD examined the results of patient surveys and found respondents were sending a message about their engagement with staff during care. Feedback indicated that enhanced engagement could help ensure patients had a better understanding of their care, and improve patient safety, communication and the overall care experience.
How Western NSW LHD responded…
Among a range of initiatives implemented to address patient feedback and improve patient experience, in 2018 Western NSW LHD introduced a new approach to the way clinical handovers are performed by staff. Previously, this handover between staff occurred in an office, away from the patient. Staff now conduct the handover at the patient’s bedside, but this process involves more than just a change of location. Bedside clinical handover now includes the patient, and carer where appropriate, in the handover conversation.
Outcomes…
Western NSW LHD reported that the measures introduced have been effective in enhancing communication, reducing complaints and increasing patient engagement in their own healthcare – improving patient safety, experience and outcomes. Bedside clinical handover in particular has also enhanced staff understanding of what matters to patients, and improved collaboration among staff across all disciplines. In real-time point-of-care surveys administered by the LHD, 81% of patients rated their overall care as ‘excellent’ in May 2020, an increase of 11% since January 2018. Additionally, 82% of patients said health professionals ‘always’ explained things in a way they could understand in May 2020, an increase of 3% since August 2018.
We are elevating the importance of patient experience by engaging patients as partners in their own care, and supporting staff to understand the impact great experiences have on health outcomes.
Beth MaslingManager of Patient Experience
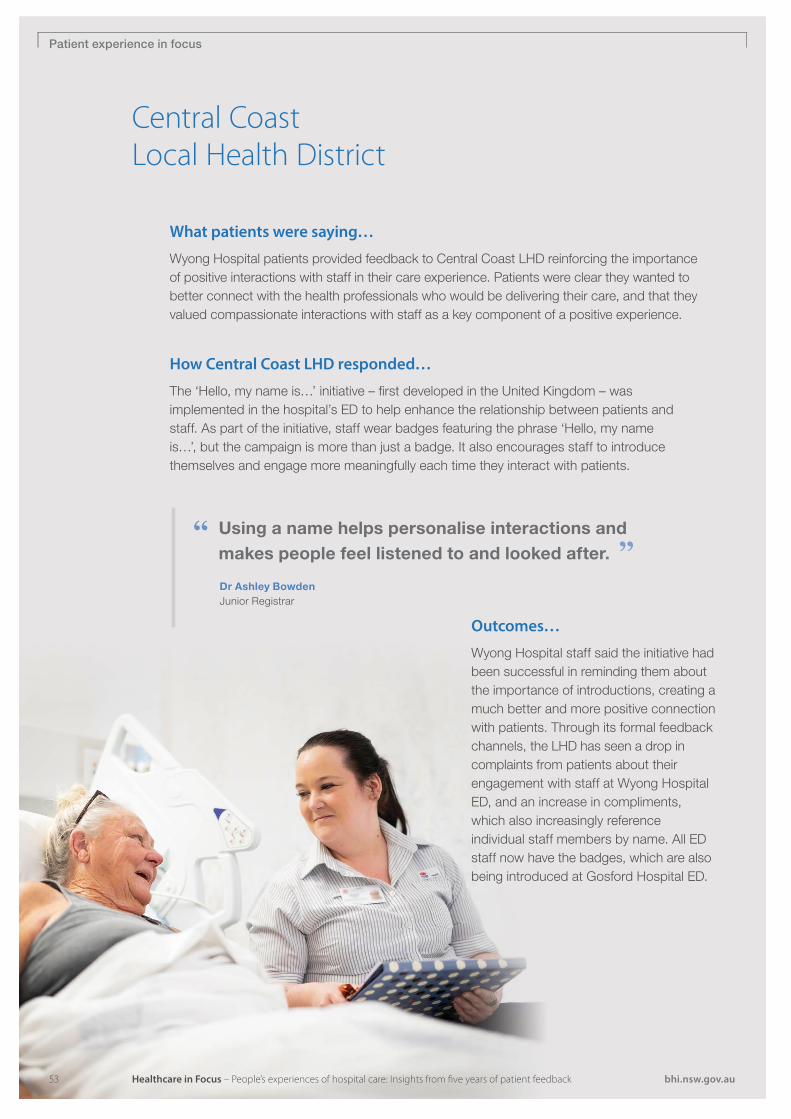
53 Healthcare in Focus – People’s experiences of hospital care: Insights from five years of patient feedback bhi.nsw.gov.au
Patient experience in focus
Central Coast Local Health District
What patients were saying…
Wyong Hospital patients provided feedback to Central Coast LHD reinforcing the importance of positive interactions with staff in their care experience. Patients were clear they wanted to better connect with the health professionals who would be delivering their care, and that they valued compassionate interactions with staff as a key component of a positive experience.
How Central Coast LHD responded…
The ‘Hello, my name is…’ initiative – first developed in the United Kingdom – was implemented in the hospital’s ED to help enhance the relationship between patients and staff. As part of the initiative, staff wear badges featuring the phrase ‘Hello, my name is…’, but the campaign is more than just a badge. It also encourages staff to introduce themselves and engage more meaningfully each time they interact with patients.
Outcomes…
Wyong Hospital staff said the initiative had been successful in reminding them about the importance of introductions, creating a much better and more positive connection with patients. Through its formal feedback channels, the LHD has seen a drop in complaints from patients about their engagement with staff at Wyong Hospital ED, and an increase in compliments, which also increasingly reference individual staff members by name. All ED staff now have the badges, which are also being introduced at Gosford Hospital ED.
Using a name helps personalise interactions and makes people feel listened to and looked after.
Dr Ashley BowdenJunior Registrar
54Healthcare in Focus – People’s experiences of hospital care: Insights from five years of patient feedback bhi.nsw.gov.au
Patient experience in focus
South Western Sydney Local Health District
What patients were saying…
South Western Sydney LHD heard from patients that there was room for improvement in the cleanliness of some hospital rooms and toilets. Having identified this broadly in BHI patient survey results, the LHD then used its own My Experience Matters patient survey results to determine which hospitals, and which facilities within those hospitals, had been flagged by patients. It was clear that the cleanliness of facilities was one important aspect in delivering a positive overall patient experience.
How South Western Sydney LHD responded…
From early 2019, the LHD began providing the patient feedback information to the relevant general service managers, allowing them to take the necessary action to ensure cleaning processes could be enhanced. Some key actions included amending cleaning staff rostering schedules to allow appropriate coverage, and ensuring those staff had the necessary equipment to do their jobs effectively.
Outcomes…
The cleaning initiative was focused on responding at the unit level and two of the success stories reported by the LHD were at Liverpool Hospital. In their My Experience Matters patient survey results, positive cleanliness ratings for the Cardiac Catheterisation Laboratory bathrooms consistently improved during 2019, rising to the 95% mark. Also during 2019, positive ratings of cleanliness for the bathrooms in the hospital’s children’s ward improved by 15% in a one-month period following the introduction of a rotating cleaning roster and enhanced inspections.
There was a big improvement since the last time I was here five years ago. Cleanliness and caring attitudes have all changed for the better.
Liverpool cardiology patientMy Experience Matters survey
55 Healthcare in Focus – People’s experiences of hospital care: Insights from five years of patient feedback bhi.nsw.gov.au
Patient experience in focus
Northern NSW Local Health District
What patients were saying…
Patients receiving care at Lismore Base Hospital said they considered it important for staff to provide clear information and guidance about what to expect from their experience while they were in the hospital’s ED waiting area. Patients said they wanted to know where they should wait, to be walked through the care process and, if they needed to wait a little longer than anticipated, why that was the case.
How Northern NSW LHD responded…
The Patient Experience Officer (PEO) role was introduced at Lismore Base Hospital in November 2018 after Northern NSW LHD nominated the facility for involvement in the NSW Health pilot program initiative. PEOs receive best-practice customer service training with Service NSW and provide a dedicated resource for patients to ask questions, and discuss any specific needs or concerns. Patients are also provided access to a mobile phone charging station, water dispenser and free wi-fi, along with a GoShare webpage link that explains the care process, from ED to admission, in several languages.
Outcomes…
Northern NSW LHD said lasting benefits had been observed at Lismore with the PEO role now expanded to cover a 16 hours a day, seven days a week roster. The LHD’s reporting on the 12-month periods before and after the introduction of the role shows there has been a reduction in the number of written and verbal complaints by patients regarding the ED. The role has also been well received by clinical staff. A staff survey showed that when the PEO was on duty, patients were more content and relaxed in the waiting room.
The introduction of the Patient Experience Officer has allowed patients to have access to information more easily, which in turn improves their entire care experience.
Wayne JonesChief Executive
56Healthcare in Focus – People’s experiences of hospital care: Insights from five years of patient feedback bhi.nsw.gov.au
Patient experience in focus
Western Sydney Local Health District
What patients were saying…
Western Sydney LHD heard from patients at Blacktown Hospital that there was a need for an enhanced focus on their experiences when leaving hospital. Patients were telling staff that they needed more information when being discharged and that the availability of staff at this time was an important part of their care journey.
How Western Sydney LHD responded…
In 2016, the Navigator Access initiative was introduced at Blacktown Hospital to help improve the discharge experience. It was part of a hospital-wide program to improve access to care and patient flow, ensuring patients are provided the care they need, when they need it. The initiative involved the introduction of a new full-time position at the hospital which was created to ensure patients are discharged from the hospital in a safe and timely manner. It also continues to help ensure patients’ needs are identified when they are leaving the hospital, and they have the information they need.
Outcomes…
Western Sydney LHD reported that the changes introduced at Blacktown Hospital had produced positive outcomes for patients, resulting in the additional position being retained and continued since 2016. The hospital’s positive My Experience Matters patient survey ratings for communication and information provided at discharge had reached 91% in mid-2019 – exceeding the benchmark for those measures.
These changes were implemented to ensure the right patient is provided care in the right place at the right time.
Wendy CainPatient and Carer Experience Manager

57 Healthcare in Focus – People’s experiences of hospital care: Insights from five years of patient feedback bhi.nsw.gov.au
Appendices
The complete list of hospitals and LHDs included in the report is provided in Table 1.
More information on results for smaller hospitals (peer group C) for both the Emergency Department and Adult Admitted patient surveys is available on BHI’s interactive data portal, Healthcare Observer.
Table 1 Local health districts, speciality health networks and hospitals included in report
Local health districts and specialty health networks
Principal referral and specialist hospitals (A):
Major hospitals (B) and Broken Hill* (C)
Central Coast Gosford (A1) Wyong (B)
Far West† Broken Hill (C)
Hunter New England Calvary Mater Newcastle (A3)
John Hunter (A1)
Maitland (B)
Manning (B)
Tamworth (B)
Illawarra Shoalhaven Wollongong (A1) Shoalhaven (B)
Mid North Coast Coffs Harbour (B)
Port Macquarie (B)
Murrumbidgee Wagga Wagga (B)
Nepean Blue Mountains Nepean (A1)
Northern NSW Lismore (B)
The Tweed (B)
Northern Sydney Royal North Shore (A1) Hornsby Ku-ring-gai (B)
St Vincent’s Health Network† St Vincent’s (A1)
South Eastern Sydney Prince of Wales (A1)
Royal Hospital for Women (A3)‡
St George (A1)
Sydney and Sydney Eye (A3)
Sutherland (B)
South Western Sydney Bankstown-Lidcombe (A1)
Liverpool (A1)
Campbelltown (B)
Fairfield (B)
Southern NSW§
Sydney Concord (A1)
Royal Prince Alfred (A1)
Canterbury (B)
Sydney Children’s Hospitals Network
Sydney Children’s Randwick (A2)||
Westmead Children’s (A2)||
Western NSW Dubbo (B)
Orange (B)
Western Sydney Westmead (A1) Auburn (B)
Blacktown (B)
* Although Broken Hill is a peer group C hospital, it is in the peer group B cohort for this report as it had sufficient responses to enable trend analysis.† Not included in LHD-level analysis due to having only one facility included in these surveys. That facility is included in hospital-level analysis.‡ Included in the admitted patients chapter only.§ Included in LHD-level analysis. No facilities of sufficient size for hospital-level analysis.|| Included in the emergency department chapter only.
For more details on inclusion rules, see page 4 of the technical supplement to this report.
Appendices
Appendix 1: Hospitals included in this report
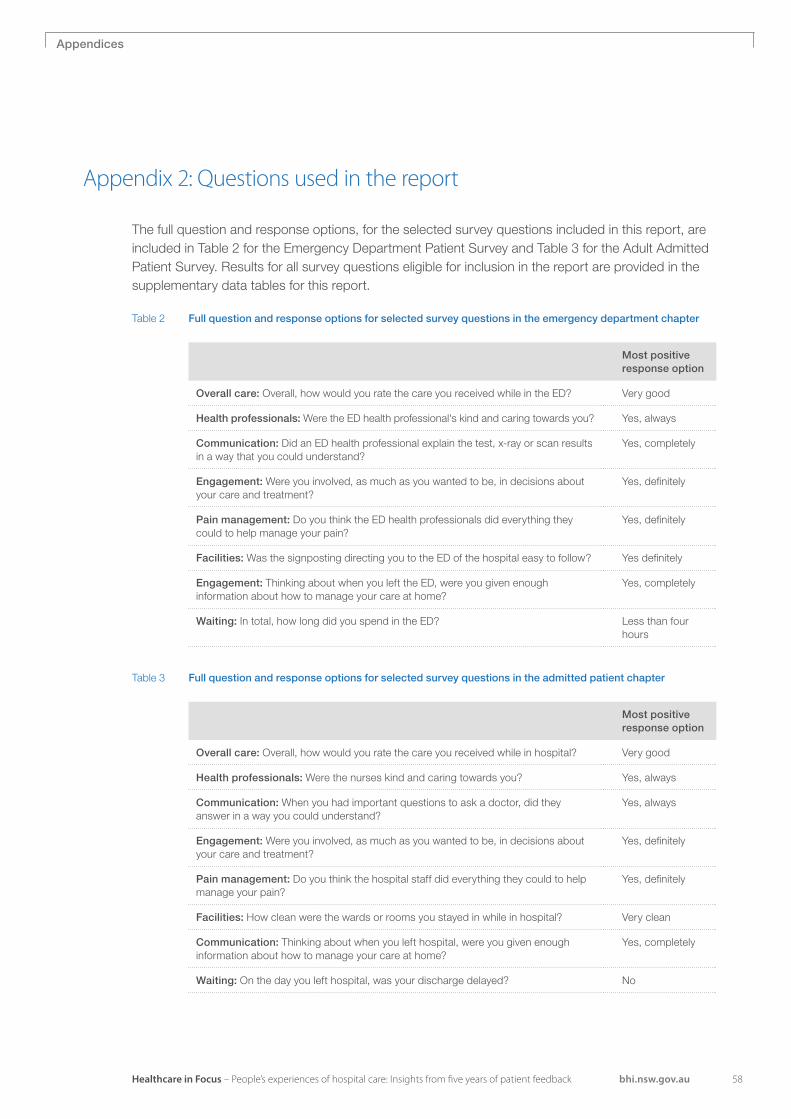
58Healthcare in Focus – People’s experiences of hospital care: Insights from five years of patient feedback bhi.nsw.gov.au
Appendices
The full question and response options, for the selected survey questions included in this report, are included in Table 2 for the Emergency Department Patient Survey and Table 3 for the Adult Admitted Patient Survey. Results for all survey questions eligible for inclusion in the report are provided in the supplementary data tables for this report.
Table 2 Full question and response options for selected survey questions in the emergency department chapter
Most positive response option
Overall care: Overall, how would you rate the care you received while in the ED? Very good
Health professionals: Were the ED health professional's kind and caring towards you? Yes, always
Communication: Did an ED health professional explain the test, x-ray or scan results in a way that you could understand?
Yes, completely
Engagement: Were you involved, as much as you wanted to be, in decisions about your care and treatment?
Yes, definitely
Pain management: Do you think the ED health professionals did everything they could to help manage your pain?
Yes, definitely
Facilities: Was the signposting directing you to the ED of the hospital easy to follow? Yes definitely
Engagement: Thinking about when you left the ED, were you given enough information about how to manage your care at home?
Yes, completely
Waiting: In total, how long did you spend in the ED? Less than four hours
Table 3 Full question and response options for selected survey questions in the admitted patient chapter
Most positive response option
Overall care: Overall, how would you rate the care you received while in hospital? Very good
Health professionals: Were the nurses kind and caring towards you? Yes, always
Communication: When you had important questions to ask a doctor, did they answer in a way you could understand?
Yes, always
Engagement: Were you involved, as much as you wanted to be, in decisions about your care and treatment?
Yes, definitely
Pain management: Do you think the hospital staff did everything they could to help manage your pain?
Yes, definitely
Facilities: How clean were the wards or rooms you stayed in while in hospital? Very clean
Communication: Thinking about when you left hospital, were you given enough information about how to manage your care at home?
Yes, completely
Waiting: On the day you left hospital, was your discharge delayed? No
Appendix 2: Questions used in the report

59 Healthcare in Focus – People’s experiences of hospital care: Insights from five years of patient feedback bhi.nsw.gov.au
1. Ahmed F, Burt J, Roland M. Measuring patient experience: concepts and methods. Patient 2014
2. Manary MP, Boulding W, Staelin R et al. The patient experience and health outcomes. N Engl J Med 2013;368:201–3
3. Bodenheimer T and Sinsky C. From Triple to Quadruple Aim: Care of the Patient Requires Care of the Provider. Annals of Family Medicine, 2014.
4. The Beryl Institute Website, Defining Patient Experience. http://www.theberylinstitute.org/?page=DefiningPatientExp. Accessed April 15, 2020.
5. Fujisawa, R. and Klazinga, N.S. Measuring patient experiences (PREMS). OECD, 2018
6. Guastello S, Jay K Improving the patient experience through a comprehensive performance framework to evaluate excellence in person-centred care BMJ Open Quality 2019.
7. Kemp KA, Quan H, Santana MJ. Lack of patient involvement in care decisions and not receiving written discharge instructions are associated with unplanned readmissions up to one year. Patient Experience Journal. 2017.
8. Kings Fund ‘What matters to Patients’? Developing the evidence base for measuring and improving patient experience. 2011.
9. ABS. https://www.abs.gov.au/AUSSTATS/[email protected]/mf/3101.0 Accessed 15 April 2020
10. Bureau of Health Information. Healthcare in Focus 2017. Sydney (NSW); BHI; 2018.
11. Bureau of Health Information. Healthcare Quarterly, Trend report, Emergency department, ambulance, admitted patients and elective surgery, October to December 2019. Sydney (NSW); BHI; 2020.
12. NSW Government, Customer Service NSW (2019). Beyond digital – Our commitments. https://www.digital.nsw.gov.au/beyond-digital/our-commitments
13. BHI analysis of Hospital Performance Dataset, NSW Ministry of Health Secure Analytics for Population Health Research and Intelligence, data accessed 10 March 2020 (most recent year for private hospitalisations was 2017–18)
14. Bureau of Health Information. Healthcare Quarterly, Activity and performance, Emergency department, ambulance, admitted patients, seclusion and restraint, and elective surgery, October to December 2019. Sydney (NSW); BHI; 2019.
References
References
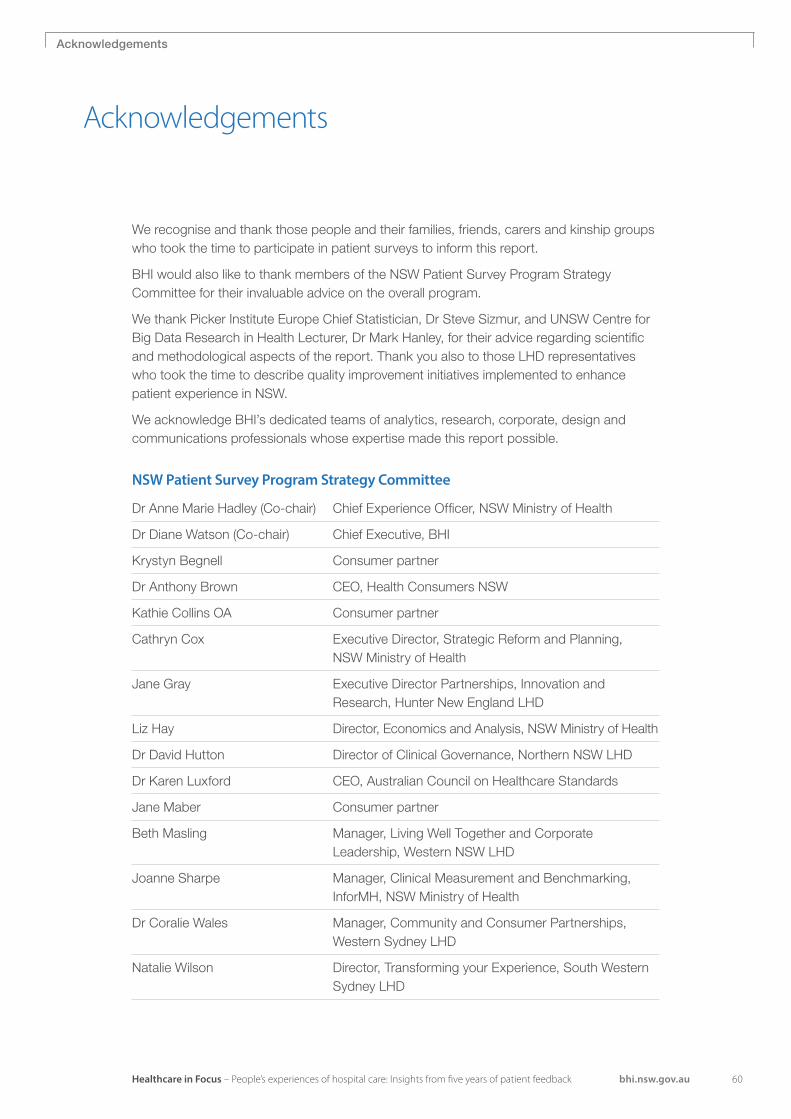
60Healthcare in Focus – People’s experiences of hospital care: Insights from five years of patient feedback bhi.nsw.gov.au
We recognise and thank those people and their families, friends, carers and kinship groups who took the time to participate in patient surveys to inform this report.
BHI would also like to thank members of the NSW Patient Survey Program Strategy Committee for their invaluable advice on the overall program.
We thank Picker Institute Europe Chief Statistician, Dr Steve Sizmur, and UNSW Centre for Big Data Research in Health Lecturer, Dr Mark Hanley, for their advice regarding scientific and methodological aspects of the report. Thank you also to those LHD representatives who took the time to describe quality improvement initiatives implemented to enhance patient experience in NSW.
We acknowledge BHI’s dedicated teams of analytics, research, corporate, design and communications professionals whose expertise made this report possible.
NSW Patient Survey Program Strategy Committee
Dr Anne Marie Hadley (Co-chair) Chief Experience Officer, NSW Ministry of Health
Dr Diane Watson (Co-chair) Chief Executive, BHI
Krystyn Begnell Consumer partner
Dr Anthony Brown CEO, Health Consumers NSW
Kathie Collins OA Consumer partner
Cathryn Cox Executive Director, Strategic Reform and Planning, NSW Ministry of Health
Jane Gray Executive Director Partnerships, Innovation and Research, Hunter New England LHD
Liz Hay Director, Economics and Analysis, NSW Ministry of Health
Dr David Hutton Director of Clinical Governance, Northern NSW LHD
Dr Karen Luxford CEO, Australian Council on Healthcare Standards
Jane Maber Consumer partner
Beth Masling Manager, Living Well Together and Corporate Leadership, Western NSW LHD
Joanne Sharpe Manager, Clinical Measurement and Benchmarking, InforMH, NSW Ministry of Health
Dr Coralie Wales Manager, Community and Consumer Partnerships, Western Sydney LHD
Natalie Wilson Director, Transforming your Experience, South Western Sydney LHD
Acknowledgements
Acknowledgements
About the Bureau of Health Information
The Bureau of Health Information (BHI) is a board-governed organisation that provides independent information about the performance of the NSW healthcare system.
BHI was established in 2009 and supports the accountability of the healthcare system by providing regular and detailed information to the community, government and healthcare professionals. This in turn supports quality improvement by highlighting how well the healthcare system is functioning and where there are opportunities to improve.
BHI manages the NSW Patient Survey Program, gathering information from patients about their experiences and outcomes of care in public hospitals and other healthcare facilities.
BHI publishes a range of reports and information products, including interactive tools, that provide objective, accurate and meaningful information about how the health system is performing.
BHI’s work relies on the efforts of a wide range of healthcare, data and policy experts. All of our assessment efforts leverage the work of hospital coders, analysts, technicians and healthcare providers who gather, codify and supply data. Our public reporting of performance information is enabled and enhanced by the infrastructure, expertise and stewardship provided by colleagues from NSW Health and its pillar organisations.
bhi.nsw.gov.au