Embed Size (px)
Citation preview

U.S. Edition
2021 Workforce Trends Report Series
Findings and insights from the 2021 Benefits Strategy & Benchmarking Survey
PEOPLE & ORGANIZATIONAL WELLBEING STRATEGY

THIS REPORT IS JUST THE BEGINNING.
Access the complete 2021 Workforce Trends Report Series and confidently plan for your future success.
The Workforce Trends Report Series covers all aspects of employee and organizational wellbeing:• National benchmarking data from thousands of employers
• Up-to-date information and strategies for responding to current workforce challenges
• Insight into how other employers are responding to changing workforce needs
• Comprehensive views of the modern drivers of employee and organizational wellbeing
PEOPLE & ORGANIZATIONAL WELLBEING STRATEGY
Overview of current employer trends in total
rewards and operational priorities
PHYSICAL & EMOTIONAL WELLBEING
Insights into healthcare, people management
and competing for talent in an evolving market
CAREER WELLBEING
National review of salary strategies,
changing economic trends and
compensation practices
FINANCIAL WELLBEING
Strategies to help employees mitigate
financial stress and manage funds
ORGANIZATIONAL WELLBEING
Emerging HR tech, communications and
workforce management strategies
STATE OF THE SECTOR
See how the global pandemic continues to affect the way organizations approach internal communication and
employee experience. Informed by hundreds of responses from global communication and HR leaders, the State
of the Sector 2021 explores the key challenges and trends facing employers.
BEST-IN-CLASS BENCHMARKING ANALYSIS
Research into top-performing organizations in
cost control and workforce management
GET THE DATA YOU NEED TO CONFIDENTLY PLAN FOR YOUR FUTURE SUCCESS.Access the complete 2021 Workforce Trends Report series
for $650. Order now to see how you can sustainably balance
employee needs and expectations with your business goals.
PREVIEW REPORT DATA
ajg.com/2021-WFTRSeries

TABLE OF CONTENTS
The intent of this document is to provide general information regarding your potential interests and concerns related to employee compensation and benefits. It does not necessarily fully address all of your specific issues. It should not be construed as, and is not intended to provide, legal advice. Questions about specific issues should be addressed by your general counsel or an attorney who specializes in this practice area.
4 INTRODUCTION
8 PEOPLE & ORGANIZATIONAL WELLBEING STRATEGY
29 ENDNOTES
30 CONTRIBUTORS
31 ABOUT GALLAGHER
INTRODUCTION As the economy and labor market begin to rebound, the major changes to the way business was done in 2020 are defining the way forward in 2021. This period of great disruption has sparked a future of greater innovation that will indelibly remake organizational structures, workplace policies and total rewards.

5GALLAGHER AJG.COM
With expectations for growth and increasing competition for
talent, leaders have laser-focused their attention on compensation
approaches and retention strategies. Flexible workforce policies
and practices will remain essential, including a strong focus on
emotional wellbeing, because resiliency will continue to rely on
agility in adapting to change.
Constant change in society and its inevitable uncertainties create
challenges in the workplace, which make employee wellbeing an
employer’s greatest asset. This measure of whole health — physical,
emotional, career and financial — and the status of organizational
health are inseparable.
That’s why wellbeing is at the center of Gallagher Better Works℠,
our comprehensive approach to benefits, compensation,
retirement and employee communication that aligns your
people strategy with your overall business goals. It focuses on
the full spectrum of organizational wellbeing — taking a strategic
approach to investing in employee wellbeing at the right cost
structures to support diverse workforce needs.
To help you make the best decisions for the overall health and
wellbeing of your employees and organization, the pages that
follow set the stage for our Workforce Trends Report Series.
Here, we start where HR compensation and benefits planning
starts, with your people and organizational strategy, total rewards,
and healthcare cost considerations. The remaining installments
will focus specifically on one aspect of wellbeing, including
physical and emotional, career, financial and organizational.
Data and insights highlighted in the report series are compiled
from a variety of Gallagher benchmarking surveys, conducted
each year to capture current and emerging trends. In this
report, they’re based on an analysis of our Benefits Strategy &
Benchmarking Survey results, gathered from December 2020
to March 2021. A total of 3,996 organizations across the United
States participated.
Findings are broken out by region, organization size and
ownership structure for peer comparison. Each section features
core data highlights, contains tables with detailed results and
wraps up with key takeaways. From broad insights to specific
findings, you’ll gain a practical perspective on trends and best
practices to help you face your future with confidence.
To discuss your organization's people strategy, contact your local
Gallagher representative or one of the advisors listed in the back
of the report.

6 U.S. EDITION2021 WORKFORCE TRENDS REPORT SERIES | PEOPLE & ORGANIZATIONAL WELLBEING STRATEGY
GEOGRAPHY
WORKFORCE SIZE — FULL-TIME EQUIVALENTS (FTEs)
BENEFITS STRATEGY & BENCHMARKING SURVEY PARTICIPANT PROFILE
OWNERSHIP STRUCTURE
Southeast
South Central
West
Northeast
North Central15%
29%20%
19%
15%
For profit
Nonprofit
Small employer — under 100 FTEs
Lower midsize employer — 100 to 499 FTEs
Upper midsize employer — 500 to 999 FTEs
Large employer — 1,000 or more FTEs
31%
40%
12%
17%
62%
38%
7GALLAGHER AJG.COM
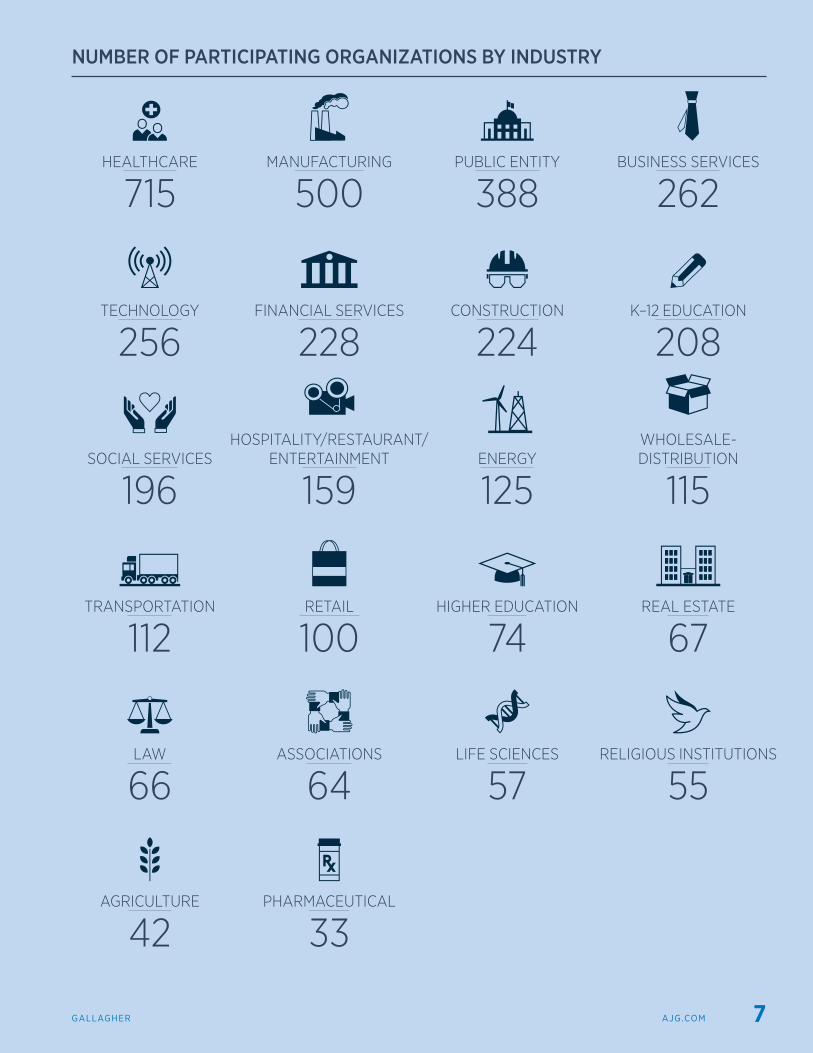
NUMBER OF PARTICIPATING ORGANIZATIONS BY INDUSTRY
PUBLIC ENTITY
388MANUFACTURING
500
K–12 EDUCATION
208
HIGHER EDUCATION
74
FINANCIAL SERVICES
228TECHNOLOGY
256CONSTRUCTION
224
RELIGIOUS INSTITUTIONS
55
ENERGY
125
TRANSPORTATION
112
LIFE SCIENCES
57LAW
66
REAL ESTATE
67
PHARMACEUTICAL
33AGRICULTURE
42
HEALTHCARE
715
SOCIAL SERVICES
196
BUSINESS SERVICES
262
WHOLESALE-DISTRIBUTION
115
RETAIL
100
ASSOCIATIONS
64
HOSPITALITY/RESTAURANT/ ENTERTAINMENT
159
PEOPLE & ORGANIZATIONAL WELLBEING STRATEGY Revenue disruption led to reduced compensation on a fairly broad scale in 2020, through measures such as cutting pay, and freezing or deferring wage increases and retiree contributions. For employers in most industries, a new challenge looms as the strengthening labor market increases pressure on compensation levels. They’re now tasked with optimizing employee relations in a competitive wage environment while managing their benefits spend.
9GALLAGHER AJG.COM
To help retain core talent, many employers are considering
formalized pay increases or delivery systems. Others are focused
on stability as they transition from survival mode — like those in
the retail and airline industries — so employee health and safety
remain top priorities. Although these employers are minimizing
unnecessary change, they’re also exploring sustainable reward
models, including variable compensation.
Transparent visibility into job openings and a vast amount of
readily available information on an organization's pay equity,
diversity and workplace culture makes it easier for employees to
evaluate options. Even geographic boundaries for employees have
diminished as virtual work has grown more prevalent, driving a
stronger focus on retention.
Workplace mobility gives employees in many industries more
power to dictate their locations and schedules. In response,
employers are looking to grant maximum flexibility while also
meeting compliance standards and keeping diligent records.
When employers consider the holistic value of their total rewards,
and make an effort to match these elements more closely to
workforce needs and interests, they can mitigate the potential
for turnover. Also important is recognizing and acting on cultural
opportunities for improving employee wellbeing.
Success in a new era of virtual and flexible work environments
will depend on the outcomes of investments and other decisions
driven by workforce preferences. In particular, keeping dispersed
employees interconnected, engaged in shared team goals and
working toward a common mission is likely to require some
time and tinkering — along with flexible thinking. Other core
considerations should include cultural impact, engagement,
inclusivity, communications transparency and change
management strategies. The right approach is one that’s just as
effective for the workforce as it is for the organization.
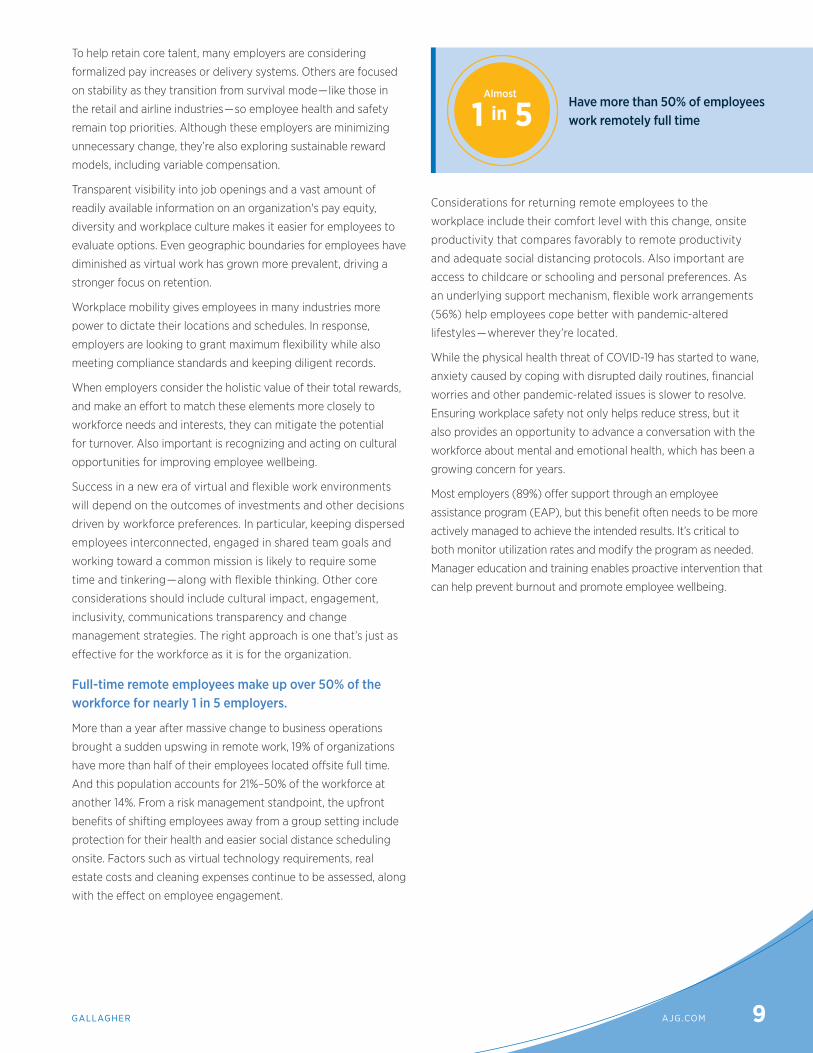
Full-time remote employees make up over 50% of the workforce for nearly 1 in 5 employers.
More than a year after massive change to business operations
brought a sudden upswing in remote work, 19% of organizations
have more than half of their employees located offsite full time.
And this population accounts for 21%–50% of the workforce at
another 14%. From a risk management standpoint, the upfront
benefits of shifting employees away from a group setting include
protection for their health and easier social distance scheduling
onsite. Factors such as virtual technology requirements, real
estate costs and cleaning expenses continue to be assessed, along
with the effect on employee engagement.
Considerations for returning remote employees to the
workplace include their comfort level with this change, onsite
productivity that compares favorably to remote productivity
and adequate social distancing protocols. Also important are
access to childcare or schooling and personal preferences. As
an underlying support mechanism, flexible work arrangements
(56%) help employees cope better with pandemic-altered
lifestyles — wherever they’re located.
While the physical health threat of COVID-19 has started to wane,
anxiety caused by coping with disrupted daily routines, financial
worries and other pandemic-related issues is slower to resolve.
Ensuring workplace safety not only helps reduce stress, but it
also provides an opportunity to advance a conversation with the
workforce about mental and emotional health, which has been a
growing concern for years.
Most employers (89%) offer support through an employee
assistance program (EAP), but this benefit often needs to be more
actively managed to achieve the intended results. It’s critical to
both monitor utilization rates and modify the program as needed.
Manager education and training enables proactive intervention that
can help prevent burnout and promote employee wellbeing.
Have more than 50% of employees work remotely full time1 in 5
Almost
10 U.S. EDITION2021 WORKFORCE TRENDS REPORT SERIES | PEOPLE & ORGANIZATIONAL WELLBEING STRATEGY
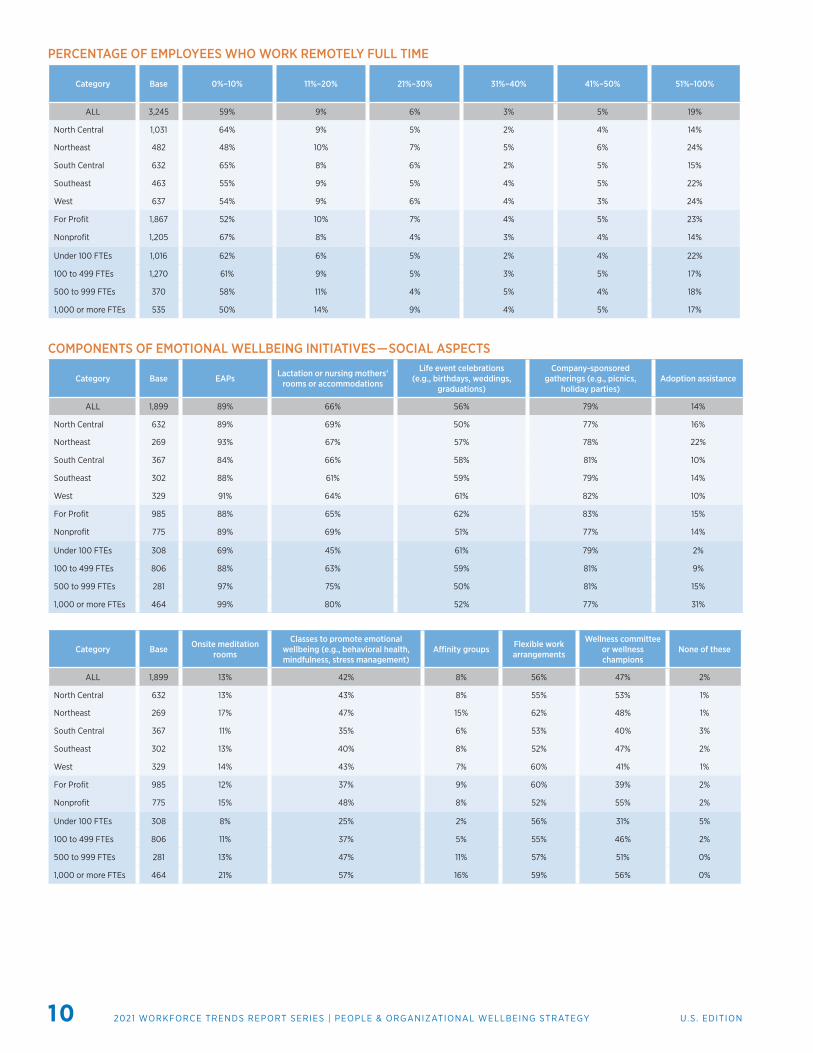
PERCENTAGE OF EMPLOYEES WHO WORK REMOTELY FULL TIME
Category Base 0%–10% 11%–20% 21%–30% 31%–40% 41%–50% 51%–100%
ALL 3,245 59% 9% 6% 3% 5% 19%
North Central 1,031 64% 9% 5% 2% 4% 14%
Northeast 482 48% 10% 7% 5% 6% 24%
South Central 632 65% 8% 6% 2% 5% 15%
Southeast 463 55% 9% 5% 4% 5% 22%
West 637 54% 9% 6% 4% 3% 24%
For Profit 1,867 52% 10% 7% 4% 5% 23%
Nonprofit 1,205 67% 8% 4% 3% 4% 14%
Under 100 FTEs 1,016 62% 6% 5% 2% 4% 22%
100 to 499 FTEs 1,270 61% 9% 5% 3% 5% 17%
500 to 999 FTEs 370 58% 11% 4% 5% 4% 18%
1,000 or more FTEs 535 50% 14% 9% 4% 5% 17%
COMPONENTS OF EMOTIONAL WELLBEING INITIATIVES — SOCIAL ASPECTS
Category Base EAPs Lactation or nursing mothers’ rooms or accommodations
Life event celebrations (e.g., birthdays, weddings,
graduations)
Company-sponsored gatherings (e.g., picnics,
holiday parties) Adoption assistance
ALL 1,899 89% 66% 56% 79% 14%
North Central 632 89% 69% 50% 77% 16%
Northeast 269 93% 67% 57% 78% 22%
South Central 367 84% 66% 58% 81% 10%
Southeast 302 88% 61% 59% 79% 14%
West 329 91% 64% 61% 82% 10%
For Profit 985 88% 65% 62% 83% 15%
Nonprofit 775 89% 69% 51% 77% 14%
Under 100 FTEs 308 69% 45% 61% 79% 2%
100 to 499 FTEs 806 88% 63% 59% 81% 9%
500 to 999 FTEs 281 97% 75% 50% 81% 15%
1,000 or more FTEs 464 99% 80% 52% 77% 31%
Category Base Onsite meditation rooms
Classes to promote emotional wellbeing (e.g., behavioral health, mindfulness, stress management)
Affinity groups Flexible work arrangements
Wellness committee or wellness champions
None of these
ALL 1,899 13% 42% 8% 56% 47% 2%
North Central 632 13% 43% 8% 55% 53% 1%
Northeast 269 17% 47% 15% 62% 48% 1%
South Central 367 11% 35% 6% 53% 40% 3%
Southeast 302 13% 40% 8% 52% 47% 2%
West 329 14% 43% 7% 60% 41% 1%
For Profit 985 12% 37% 9% 60% 39% 2%
Nonprofit 775 15% 48% 8% 52% 55% 2%
Under 100 FTEs 308 8% 25% 2% 56% 31% 5%
100 to 499 FTEs 806 11% 37% 5% 55% 46% 2%
500 to 999 FTEs 281 13% 47% 11% 57% 51% 0%
1,000 or more FTEs 464 21% 57% 16% 59% 56% 0%

11GALLAGHER AJG.COM
AREAS EXPECTED TO GROW BY 2022
EXPECTED CHANGE IN REVENUES BY 2022
Category Base Decrease substantially Decrease a little Stay about the same Increase a little Increase substantially
ALL 3,571 1% 8% 28% 47% 15%
North Central 1,102 1% 10% 31% 46% 12%
Northeast 525 2% 7% 30% 45% 15%
South Central 691 1% 7% 29% 48% 14%
Southeast 515 1% 7% 23% 49% 20%
West 738 2% 9% 25% 46% 18%
For Profit 2,062 1% 5% 18% 53% 23%
Nonprofit 1,304 2% 13% 41% 38% 5%
Under 100 FTEs 1,100 1% 9% 30% 42% 17%
100 to 499 FTEs 1,394 1% 8% 27% 50% 14%
500 to 999 FTEs 414 2% 7% 28% 47% 16%
1,000 or more FTEs 598 1% 9% 27% 47% 16%
EXPECTED CHANGE IN WORKFORCE HEADCOUNT BY 2022
Category Base Decrease substantially Decrease a little Stay about the same Increase a little Increase substantially
ALL 3,582 1% 7% 37% 45% 11%
North Central 1,110 0% 7% 42% 43% 8%
Northeast 526 1% 7% 37% 39% 16%
South Central 693 0% 6% 37% 47% 10%
Southeast 515 0% 6% 31% 48% 14%
West 738 1% 5% 33% 47% 13%
For Profit 2,068 1% 5% 27% 51% 17%
Nonprofit 1,309 0% 9% 50% 36% 4%
Under 100 FTEs 1,105 1% 4% 42% 44% 9%
100 to 499 FTEs 1,398 0% 7% 36% 46% 11%
500 to 999 FTEs 416 1% 8% 31% 44% 16%
1,000 or more FTEs 598 1% 9% 33% 44% 13%
Signs of economic recovery are prompting optimistic forecasts for revenue and headcount increases.
With pandemic and economic developments suggesting a
brighter year ahead, most employers anticipate higher revenue
and headcount. Nine in 10 organizations expect increased (62%)
or stable (28%) revenue growth through 2021, while headcount is
expected to rise for 56% and to fall for just 8%.
Factors improving forecasts include a federal economic stimulus
package, declining unemployment numbers, job creation and labor
force expansion momentum. As employers focus on restoring or
increasing pre-pandemic staff levels, it’s important they don’t lose
sight of the need for dedicated employee retention efforts.
Revenue Headcount
62% 56%

12 U.S. EDITION2021 WORKFORCE TRENDS REPORT SERIES | PEOPLE & ORGANIZATIONAL WELLBEING STRATEGY
Nearly 4 in 10 employers experienced turnover of 15% or more in 2020.
While some talent loss is normal and even necessary, an excess
drives up the already substantial costs of labor acquisition and
training — and can negatively affect the customer experience.
In addition, replacing talent is likely to come at a higher
compensation cost due to increased competition.
Solid evidence of this trend has already emerged within
technology and other knowledge-worker industries. Due to
changes in remote work policies, a Northeast or West Coast
presence is no longer an employment prerequisite. And higher
wages offered to pools of new talent in the Midwest and the South
are driving up compensation levels throughout the marketplace.
Overall, 2020 turnover was above thresholds set by employers.
That’s logical in a year that started with near-record low
unemployment (3.5%) before hitting a near-record high in April
(14.8%), and ending at 6.7% in December.¹ While 42% of employers
targeted a level of 5% or less, just 29% achieved that outcome.
Actual turnover also defied early expectations, with 13% instead of
4% of employers experiencing a rate of 30% or more. An additional
26% had turnover of 15%–29%, including 12% in the 15%–19% range,
9% in the 20%–24% range and 5% in the 25%–29% range.
Congressional Budget Office projections suggest that “as the
economy expands, many people [will] rejoin the civilian labor force
who had left it during the pandemic, restoring it to its pre-pandemic
size in 2022.”² As job opportunities become more abundant,
employers will intensify their focus on managing turnover.
Another consequence of pandemic pressures for some
organizations is earlier retirement of key leaders. Even with
a succession plan in place, it’s important to reevaluate the
characteristics and competencies that leaders need to drive both
post-pandemic and longer-term success. Part of this exercise
for board and C-suite decision-makers is taking a fresh look at
leadership profiles and making any modifications based on the
qualifications they deem critical.
ACTUAL TURNOVER RATE FOR FTEs IN 2020
Category Base Less than 3% 3%–5% 6%–9% 10%–14% 15%–19% 20%–24% 25%–29% 30% or more
ALL 3,197 17% 12% 14% 18% 12% 9% 5% 13%
North Central 1,007 16% 14% 16% 18% 11% 9% 5% 11%
Northeast 458 21% 14% 14% 19% 12% 6% 4% 11%
South Central 609 16% 10% 14% 19% 13% 9% 6% 14%
Southeast 461 15% 10% 12% 21% 13% 10% 6% 12%
West 662 17% 13% 13% 14% 12% 9% 6% 15%
For Profit 1,873 16% 12% 13% 17% 11% 8% 6% 16%
Nonprofit 1,190 17% 12% 15% 19% 13% 10% 5% 9%
Under 100 FTEs 1,066 35% 16% 13% 12% 7% 5% 4% 8%
100 to 499 FTEs 1,289 9% 12% 15% 18% 14% 10% 6% 15%
500 to 999 FTEs 360 4% 13% 14% 24% 14% 12% 6% 14%
1,000 or more FTEs 469 6% 8% 13% 24% 16% 11% 4% 18%
TURNOVER RATE OF 15% OR MORE IN 2020
Actual Targeted
39% 23%
13GALLAGHER AJG.COM
RANK ATTRACTING AND RETAINING A COMPETITIVE WORKFORCE NO. 1
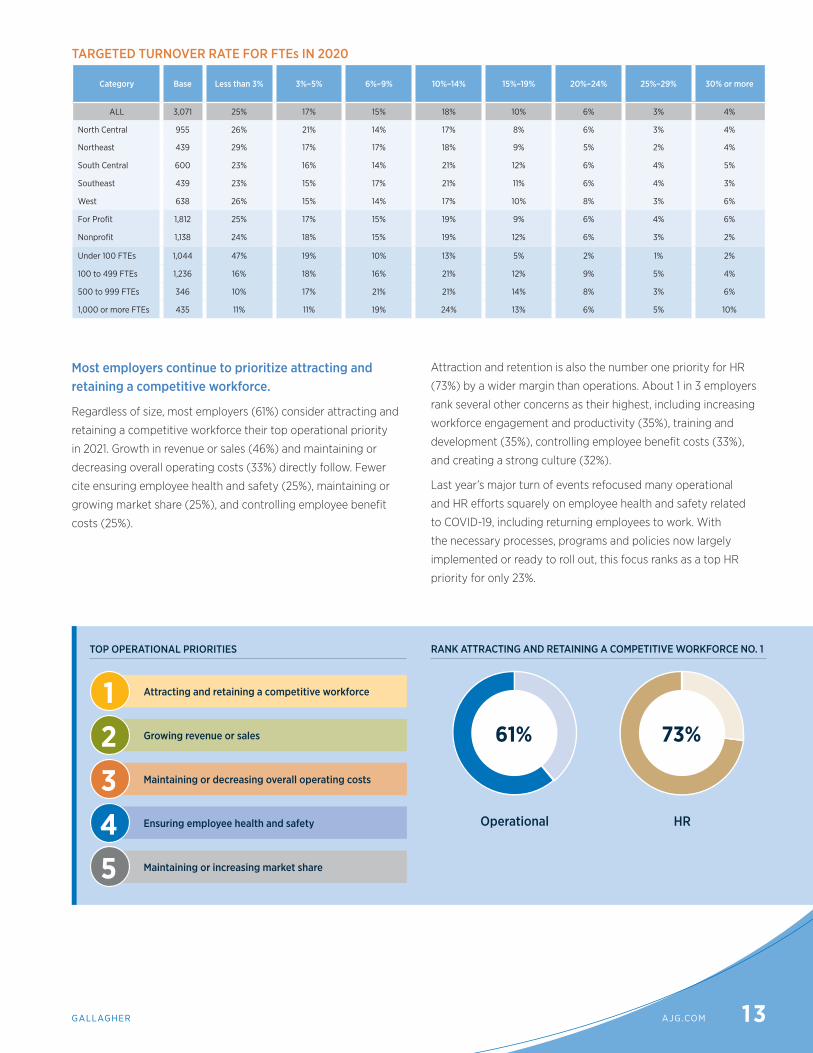
TARGETED TURNOVER RATE FOR FTEs IN 2020
Category Base Less than 3% 3%–5% 6%–9% 10%–14% 15%–19% 20%–24% 25%–29% 30% or more
ALL 3,071 25% 17% 15% 18% 10% 6% 3% 4%
North Central 955 26% 21% 14% 17% 8% 6% 3% 4%
Northeast 439 29% 17% 17% 18% 9% 5% 2% 4%
South Central 600 23% 16% 14% 21% 12% 6% 4% 5%
Southeast 439 23% 15% 17% 21% 11% 6% 4% 3%
West 638 26% 15% 14% 17% 10% 8% 3% 6%
For Profit 1,812 25% 17% 15% 19% 9% 6% 4% 6%
Nonprofit 1,138 24% 18% 15% 19% 12% 6% 3% 2%
Under 100 FTEs 1,044 47% 19% 10% 13% 5% 2% 1% 2%
100 to 499 FTEs 1,236 16% 18% 16% 21% 12% 9% 5% 4%
500 to 999 FTEs 346 10% 17% 21% 21% 14% 8% 3% 6%
1,000 or more FTEs 435 11% 11% 19% 24% 13% 6% 5% 10%
Most employers continue to prioritize attracting and retaining a competitive workforce.
Regardless of size, most employers (61%) consider attracting and
retaining a competitive workforce their top operational priority
in 2021. Growth in revenue or sales (46%) and maintaining or
decreasing overall operating costs (33%) directly follow. Fewer
cite ensuring employee health and safety (25%), maintaining or
growing market share (25%), and controlling employee benefit
costs (25%).
Attraction and retention is also the number one priority for HR
(73%) by a wider margin than operations. About 1 in 3 employers
rank several other concerns as their highest, including increasing
workforce engagement and productivity (35%), training and
development (35%), controlling employee benefit costs (33%),
and creating a strong culture (32%).
Last year’s major turn of events refocused many operational
and HR efforts squarely on employee health and safety related
to COVID-19, including returning employees to work. With
the necessary processes, programs and policies now largely
implemented or ready to roll out, this focus ranks as a top HR
priority for only 23%.
TOP OPERATIONAL PRIORITIES
Operational HR
Attracting and retaining a competitive workforce
Growing revenue or sales
Maintaining or decreasing overall operating costs
Ensuring employee health and safety
Maintaining or increasing market share
12345
61% 73%
14 U.S. EDITION2021 WORKFORCE TRENDS REPORT SERIES | PEOPLE & ORGANIZATIONAL WELLBEING STRATEGY
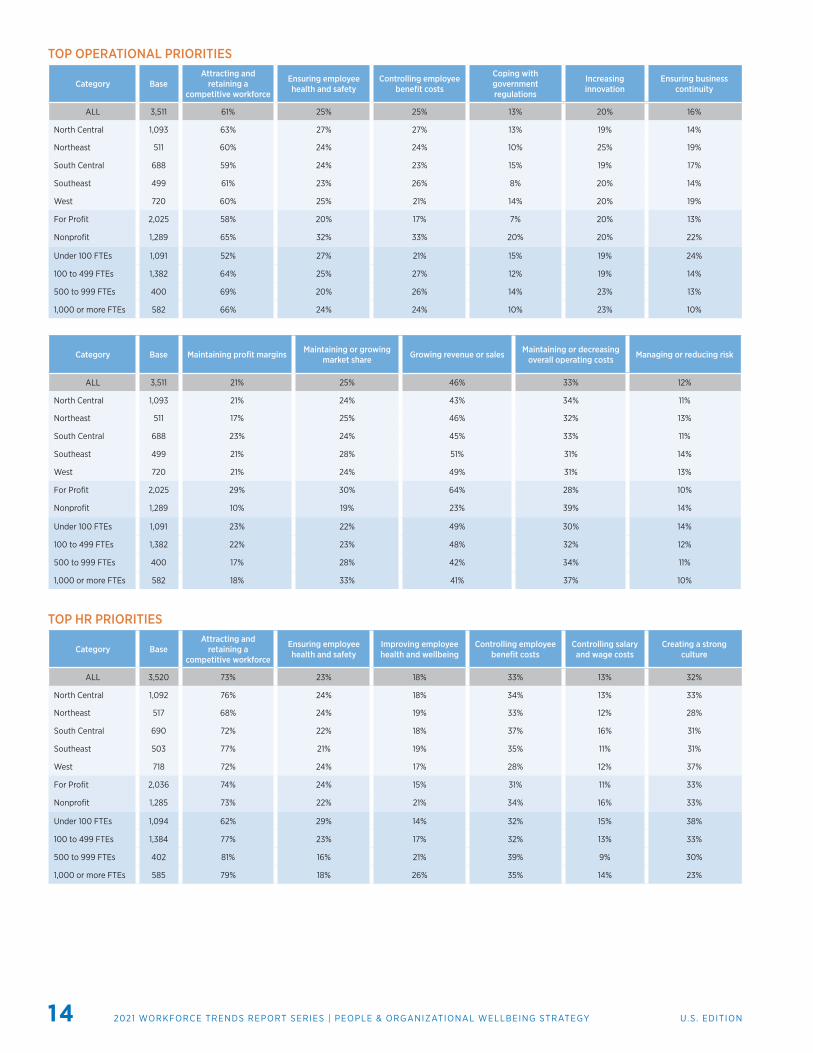
TOP OPERATIONAL PRIORITIES
Category BaseAttracting and
retaining a competitive workforce
Ensuring employee health and safety
Controlling employee benefit costs
Coping with government regulations
Increasing innovation
Ensuring business continuity
ALL 3,511 61% 25% 25% 13% 20% 16%
North Central 1,093 63% 27% 27% 13% 19% 14%
Northeast 511 60% 24% 24% 10% 25% 19%
South Central 688 59% 24% 23% 15% 19% 17%
Southeast 499 61% 23% 26% 8% 20% 14%
West 720 60% 25% 21% 14% 20% 19%
For Profit 2,025 58% 20% 17% 7% 20% 13%
Nonprofit 1,289 65% 32% 33% 20% 20% 22%
Under 100 FTEs 1,091 52% 27% 21% 15% 19% 24%
100 to 499 FTEs 1,382 64% 25% 27% 12% 19% 14%
500 to 999 FTEs 400 69% 20% 26% 14% 23% 13%
1,000 or more FTEs 582 66% 24% 24% 10% 23% 10%
Category Base Maintaining profit margins Maintaining or growing market share Growing revenue or sales Maintaining or decreasing
overall operating costs Managing or reducing risk
ALL 3,511 21% 25% 46% 33% 12%
North Central 1,093 21% 24% 43% 34% 11%
Northeast 511 17% 25% 46% 32% 13%
South Central 688 23% 24% 45% 33% 11%
Southeast 499 21% 28% 51% 31% 14%
West 720 21% 24% 49% 31% 13%
For Profit 2,025 29% 30% 64% 28% 10%
Nonprofit 1,289 10% 19% 23% 39% 14%
Under 100 FTEs 1,091 23% 22% 49% 30% 14%
100 to 499 FTEs 1,382 22% 23% 48% 32% 12%
500 to 999 FTEs 400 17% 28% 42% 34% 11%
1,000 or more FTEs 582 18% 33% 41% 37% 10%
TOP HR PRIORITIES
Category BaseAttracting and
retaining a competitive workforce
Ensuring employee health and safety
Improving employee health and wellbeing
Controlling employee benefit costs
Controlling salary and wage costs
Creating a strong culture
ALL 3,520 73% 23% 18% 33% 13% 32%
North Central 1,092 76% 24% 18% 34% 13% 33%
Northeast 517 68% 24% 19% 33% 12% 28%
South Central 690 72% 22% 18% 37% 16% 31%
Southeast 503 77% 21% 19% 35% 11% 31%
West 718 72% 24% 17% 28% 12% 37%
For Profit 2,036 74% 24% 15% 31% 11% 33%
Nonprofit 1,285 73% 22% 21% 34% 16% 33%
Under 100 FTEs 1,094 62% 29% 14% 32% 15% 38%
100 to 499 FTEs 1,384 77% 23% 17% 32% 13% 33%
500 to 999 FTEs 402 81% 16% 21% 39% 9% 30%
1,000 or more FTEs 585 79% 18% 26% 35% 14% 23%

15GALLAGHER AJG.COM
TOTAL REWARDSEnhanced compensation and medical benefits are the most common total rewards boosters.
No matter how their relationship to organizational success is
perceived, compensation and benefits should form a solid core of
dependable resources for achieving recruitment, engagement and
retention goals. While 1 in 4 employers see them as a necessary
operating cost (25%), almost half (47%) consider them useful
tools for attracting and retaining talent. The rest (28%) value these
total rewards as strategic investments in maximizing workforce
performance to achieve operational outcomes. Increasingly, an
optimized return requires more than just competitive pay and
healthcare benefits.
Expecting and preparing to compete in a relatively tight labor
market, many employers advanced their efforts to enhance
total rewards in 2020 — before the pandemic altered plans or
put progress on hold. As prospects for an economic recovery
strengthen, they’re gearing up again to retain and attract key
talent. However, growing competition is increasing attention on
compensation, with 72% of employers enhancing base salary and
39% enhancing variable pay or bonus programs.
Medical is the top benefits category for enhancement, targeted
by over half of employers (55%). About 4 in 10 upgraded leave
policies (43%), voluntary or supplemental benefits (41%), and
retirement options (38%). And at least 3 in 10 enhanced wellbeing
initiatives (33%), dental benefits (31%) or life insurance (30%).
TOP HR PRIORITIES (CONT.)
Category BaseIncreasing workforce
engagement and productivity
Keeping remote employees connected
Increasing workforce inclusion and diversity
Training and developing employees
Complying with state and federal employee
regulations
ALL 3,520 35% 7% 17% 35% 11%
North Central 1,092 35% 6% 17% 33% 9%
Northeast 517 37% 11% 24% 33% 10%
South Central 690 35% 6% 10% 37% 13%
Southeast 503 35% 7% 20% 34% 10%
West 718 35% 8% 15% 38% 12%
For Profit 2,036 37% 8% 15% 39% 10%
Nonprofit 1,285 33% 7% 20% 29% 11%
Under 100 FTEs 1,094 36% 11% 11% 37% 13%
100 to 499 FTEs 1,384 35% 6% 16% 38% 9%
500 to 999 FTEs 402 34% 6% 19% 32% 10%
1,000 or more FTEs 585 36% 5% 27% 24% 11%
ORGANIZATION’S PERSPECTIVE ON COMPENSATION AND BENEFITS
Category Base Necessary operational costs Tools to attract and retain talent Investments in maximizing workforce performance to achieve operational outcomes
ALL 3,528 25% 47% 28%
North Central 1,112 23% 49% 28%
Northeast 504 26% 48% 26%
South Central 680 27% 44% 29%
Southeast 511 21% 50% 28%
West 721 27% 43% 30%
For Profit 2,042 23% 46% 31%
Nonprofit 1,289 27% 48% 25%
Under 100 FTEs 1,087 29% 40% 31%
100 to 499 FTEs 1,387 26% 47% 28%
500 to 999 FTEs 402 23% 51% 26%
1,000 or more FTEs 594 18% 56% 26%

16 U.S. EDITION2021 WORKFORCE TRENDS REPORT SERIES | PEOPLE & ORGANIZATIONAL WELLBEING STRATEGY
COMPENSATION AND BENEFITS PLANNING HORIZON
TOTAL REWARDS ASPECTS ENHANCED TO MEET RECRUITMENT AND RETENTION OBJECTIVES
Category Base Base salary Variable compensation or bonus programs Medical benefits Pharmacy benefits Dental benefits
ALL 2,900 72% 39% 55% 23% 31%
North Central 939 72% 37% 53% 20% 28%
Northeast 425 69% 39% 52% 27% 34%
South Central 551 72% 40% 57% 23% 31%
Southeast 421 70% 42% 54% 21% 29%
West 564 74% 39% 58% 24% 36%
For Profit 1,663 69% 50% 54% 21% 31%
Nonprofit 1,092 76% 26% 55% 24% 32%
Under 100 FTEs 908 74% 38% 64% 22% 40%
100 to 499 FTEs 1,151 73% 38% 53% 21% 30%
500 to 999 FTEs 326 70% 37% 47% 23% 23%
1,000 or more FTEs 464 64% 45% 47% 28% 26%
Category Base Wellbeing initiatives Voluntary or supplemental benefits Life insurance Leave policies Retirement options
ALL 2,900 33% 41% 30% 43% 38%
North Central 939 35% 40% 30% 43% 38%
Northeast 425 35% 39% 29% 43% 39%
South Central 551 30% 40% 29% 42% 37%
Southeast 421 36% 45% 31% 46% 36%
West 564 32% 42% 32% 41% 39%
For Profit 1,663 31% 42% 30% 44% 36%
Nonprofit 1,092 35% 40% 30% 42% 41%
Under 100 FTEs 908 21% 35% 37% 43% 44%
100 to 499 FTEs 1,151 34% 41% 30% 42% 36%
500 to 999 FTEs 326 43% 45% 24% 43% 33%
1,000 or more FTEs 464 50% 48% 23% 45% 34%
Longer-term compensation and benefits planning can bring cost efficiencies and other advantages.
Compensation and benefits planning spans a range of time
periods, from once a year, to cycles of 1–2 years, to strategies
that cover three or more years. Longer-term strategies prepare
employers to address employees’ needs more proactively — in
keeping with human capital, cost-control and risk management
objectives.
While the most common approach to planning is still annual
for compensation (64%) and benefits (61%), reliance on a
broader perspective did not decline during the pandemic due to
uncertainty. The use of either a 1–2 year cycle or a comprehensive
multi-year strategy remain relatively flat — for both compensation
(21% and 15%, respectively) and benefits (22% and 17%,
respectively).
COMPENSATION
1 year 64%
1–2 years 21%
3+ years 15%
BENEFITS
1 year 61%
1–2 years 22%
3+ years 17%

17GALLAGHER AJG.COM
HEALTHCARE COSTSAnnual benefits spending remains stable compared to 2020.
The remarkable stability seen in benefits design and strategies
compared to last year suggests employers are looking to regain
their equilibrium in 2021 — in a different environment. With cost
pressures down in 2020 due to lower healthcare utilization and
spending, a correction extending into 2022 is anticipated. Most
employers have stayed the course with their healthcare plans, so
evolving circumstances may require a cost model recalibration.
While it’s too early to know the extent of the financial impact,
there’s still time to monitor the situation and prepare to adjust
as needed.
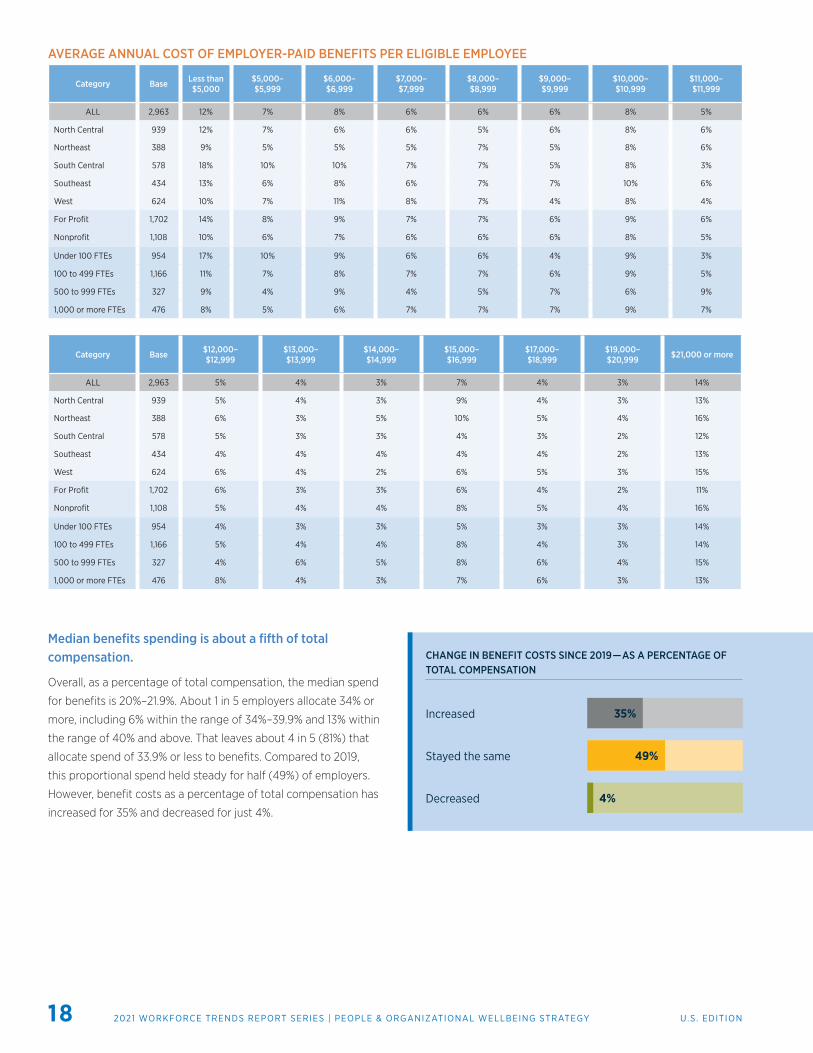
Looking at average annual dollars spent on benefits per
eligible employee in 2021, the midpoint remains at $10,000–
$10,999 — about half spent more and about half spent less. Each
year since 2017, low-end spending of less than $6,000 (19%) has
decreased. But high-end spending of $19,000 or more (17%) also
trended downward this year, declining by 2 points over 2020.
APPROACH TO COMPENSATION PLANNING
Category Base Manage from year to year Plan in cycles of 1–2 years Have a multi-year strategy
ALL 3,533 64% 21% 15%
North Central 1,115 63% 20% 17%
Northeast 509 59% 22% 19%
South Central 685 70% 19% 11%
Southeast 515 61% 24% 15%
West 709 64% 22% 15%
For Profit 2,031 69% 19% 12%
Nonprofit 1,302 58% 23% 19%
Under 100 FTEs 1,090 73% 18% 10%
100 to 499 FTEs 1,398 66% 21% 13%
500 to 999 FTEs 407 57% 22% 22%
1,000 or more FTEs 580 47% 26% 27%
APPROACH TO EMPLOYEE BENEFITS PLANNING
Category Base Manage from year to year Plan in cycles of 1–2 years Have a multi-year strategy
ALL 3,615 61% 22% 17%
North Central 1,131 60% 23% 17%
Northeast 527 57% 20% 22%
South Central 698 66% 20% 13%
Southeast 525 55% 24% 21%
West 734 64% 22% 14%
For Profit 2,085 62% 21% 17%
Nonprofit 1,320 61% 23% 16%
Under 100 FTEs 1,103 76% 16% 8%
100 to 499 FTEs 1,417 63% 23% 14%
500 to 999 FTEs 414 50% 25% 24%
1,000 or more FTEs 612 37% 28% 36%
18 U.S. EDITION2021 WORKFORCE TRENDS REPORT SERIES | PEOPLE & ORGANIZATIONAL WELLBEING STRATEGY
AVERAGE ANNUAL COST OF EMPLOYER-PAID BENEFITS PER ELIGIBLE EMPLOYEE
Category Base Less than $5,000
$5,000–$5,999
$6,000–$6,999
$7,000–$7,999
$8,000–$8,999
$9,000–$9,999
$10,000–$10,999
$11,000–$11,999
ALL 2,963 12% 7% 8% 6% 6% 6% 8% 5%
North Central 939 12% 7% 6% 6% 5% 6% 8% 6%
Northeast 388 9% 5% 5% 5% 7% 5% 8% 6%
South Central 578 18% 10% 10% 7% 7% 5% 8% 3%
Southeast 434 13% 6% 8% 6% 7% 7% 10% 6%
West 624 10% 7% 11% 8% 7% 4% 8% 4%
For Profit 1,702 14% 8% 9% 7% 7% 6% 9% 6%
Nonprofit 1,108 10% 6% 7% 6% 6% 6% 8% 5%
Under 100 FTEs 954 17% 10% 9% 6% 6% 4% 9% 3%
100 to 499 FTEs 1,166 11% 7% 8% 7% 7% 6% 9% 5%
500 to 999 FTEs 327 9% 4% 9% 4% 5% 7% 6% 9%
1,000 or more FTEs 476 8% 5% 6% 7% 7% 7% 9% 7%
Category Base $12,000– $12,999
$13,000– $13,999
$14,000– $14,999
$15,000– $16,999
$17,000– $18,999
$19,000– $20,999 $21,000 or more
ALL 2,963 5% 4% 3% 7% 4% 3% 14%
North Central 939 5% 4% 3% 9% 4% 3% 13%
Northeast 388 6% 3% 5% 10% 5% 4% 16%
South Central 578 5% 3% 3% 4% 3% 2% 12%
Southeast 434 4% 4% 4% 4% 4% 2% 13%
West 624 6% 4% 2% 6% 5% 3% 15%
For Profit 1,702 6% 3% 3% 6% 4% 2% 11%
Nonprofit 1,108 5% 4% 4% 8% 5% 4% 16%
Under 100 FTEs 954 4% 3% 3% 5% 3% 3% 14%
100 to 499 FTEs 1,166 5% 4% 4% 8% 4% 3% 14%
500 to 999 FTEs 327 4% 6% 5% 8% 6% 4% 15%
1,000 or more FTEs 476 8% 4% 3% 7% 6% 3% 13%
Median benefits spending is about a fifth of total compensation.
Overall, as a percentage of total compensation, the median spend
for benefits is 20%–21.9%. About 1 in 5 employers allocate 34% or
more, including 6% within the range of 34%–39.9% and 13% within
the range of 40% and above. That leaves about 4 in 5 (81%) that
allocate spend of 33.9% or less to benefits. Compared to 2019,
this proportional spend held steady for half (49%) of employers.
However, benefit costs as a percentage of total compensation has
increased for 35% and decreased for just 4%.
CHANGE IN BENEFIT COSTS SINCE 2019 — AS A PERCENTAGE OF TOTAL COMPENSATION
Increased
Stayed the same
Decreased
35%
49%
4%
19GALLAGHER AJG.COM
TOTAL COST OF EMPLOYER-PAID BENEFITS AS A PERCENTAGE OF TOTAL COMPENSATION AND BENEFITS
Category Base Less than 5% 5%–9.9% 10%–11.9% 12%–13.9% 14%–15.9% 16%–17.9% 18%–19.9% 20%–21.9% 22%–23.9%
ALL 2,355 7% 11% 9% 6% 7% 6% 4% 8% 4%
North Central 782 5% 11% 7% 6% 5% 6% 4% 9% 4%
Northeast 299 5% 10% 12% 5% 7% 6% 5% 7% 4%
South Central 455 11% 14% 12% 5% 8% 6% 3% 7% 4%
Southeast 345 7% 10% 6% 7% 8% 4% 3% 7% 6%
West 474 6% 10% 8% 5% 9% 4% 5% 9% 4%
For Profit 1,323 9% 16% 11% 6% 8% 5% 3% 9% 3%
Nonprofit 921 4% 6% 6% 5% 6% 6% 5% 8% 6%
Under 100 FTEs 804 11% 14% 10% 6% 8% 6% 3% 8% 3%
100 to 499 FTEs 923 5% 11% 8% 7% 7% 6% 4% 9% 4%
500 to 999 FTEs 241 6% 10% 8% 5% 7% 3% 3% 7% 6%
1,000 or more FTEs 356 3% 6% 8% 4% 5% 4% 4% 7% 7%
Category Base 24%–25.9% 26%–27.9% 28%–29.9% 30%–31.9% 32%–33.9% 34%–35.9% 36%–37.9% 38%–39.9% 40% or more
ALL 2,355 7% 3% 3% 5% 3% 3% 1% 2% 13%
North Central 782 8% 3% 3% 5% 4% 3% 2% 1% 12%
Northeast 299 8% 4% 1% 4% 1% 2% 1% 2% 15%
South Central 455 6% 3% 1% 2% 2% 2% 1% 2% 11%
Southeast 345 6% 3% 5% 9% 4% 4% 1% 1% 10%
West 474 6% 2% 3% 4% 2% 3% 1% 2% 15%
For Profit 1,323 5% 2% 2% 5% 2% 2% 1% 1% 11%
Nonprofit 921 9% 3% 4% 5% 3% 4% 2% 2% 14%
Under 100 FTEs 804 5% 1% 2% 2% 1% 2% 1% 2% 14%
100 to 499 FTEs 923 6% 3% 2% 6% 3% 3% 2% 1% 13%
500 to 999 FTEs 241 7% 5% 1% 7% 5% 6% 1% 0% 12%
1,000 or more FTEs 356 12% 4% 4% 7% 4% 4% 3% 2% 10%
CHANGE IN THE TOTAL COST OF EMPLOYER-PAID BENEFITS SINCE 2019 AS A PERCENTAGE OF TOTAL COMPENSATION AND BENEFITS
Category Base Decreased Stayed about the same Increased Don’t know
ALL 3,265 4% 49% 35% 11%
North Central 1,041 4% 53% 33% 10%
Northeast 453 5% 50% 30% 15%
South Central 628 6% 47% 36% 11%
Southeast 473 4% 49% 35% 12%
West 670 3% 46% 42% 9%
For Profit 1,870 4% 48% 36% 12%
Nonprofit 1,224 4% 52% 35% 9%
Under 100 FTEs 1,023 4% 47% 40% 9%
100 to 499 FTEs 1,291 4% 49% 36% 11%
500 to 999 FTEs 364 5% 51% 32% 12%
1,000 or more FTEs 543 5% 53% 28% 13%

20 U.S. EDITION2021 WORKFORCE TRENDS REPORT SERIES | PEOPLE & ORGANIZATIONAL WELLBEING STRATEGY
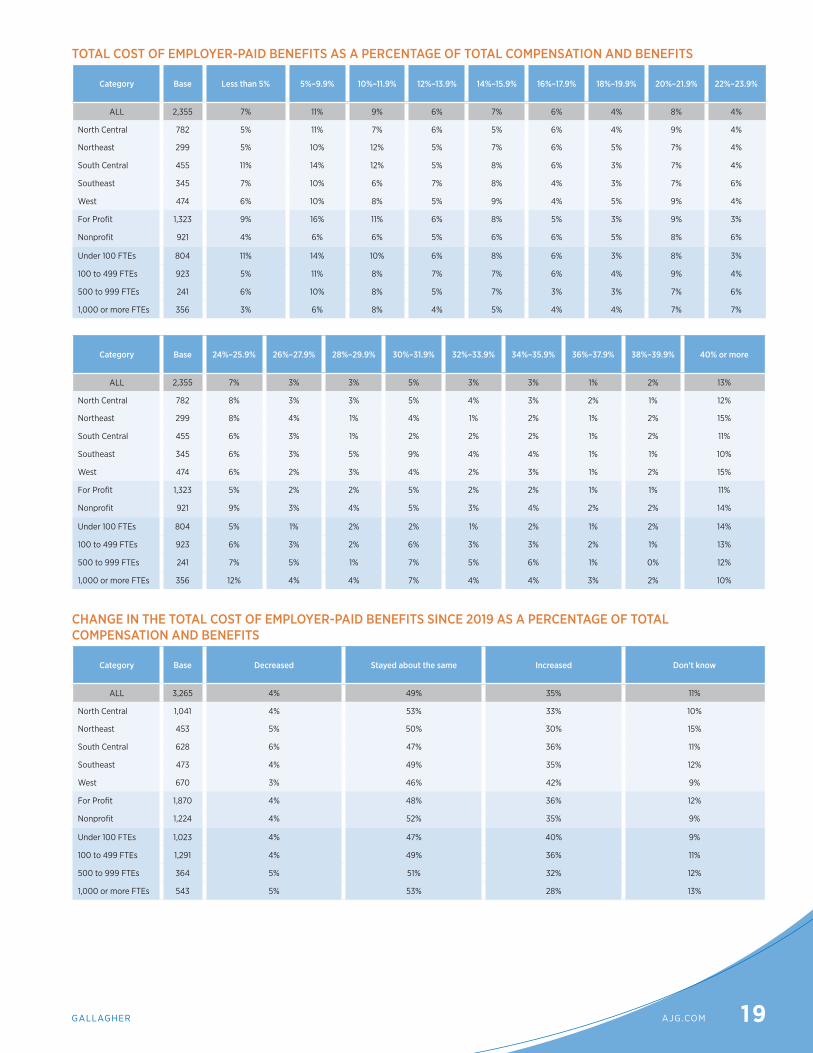
Median compensation and benefits spending is about a third of operating revenue.
Compensation and benefit costs are less than 35% of total
operating revenue for more than half (56%) of employers, and
35%–49.9% of revenue for 15%. Scaling up from there, 22% invest
half to 74.9% of their total operating revenues for this purpose,
and 6% allocate three-quarters or more.
TOTAL COST OF COMPENSATION AND BENEFITS AS A PERCENTAGE OF TOTAL OPERATING REVENUE
Category Base Less than 5% 5%–9.9% 10%–14.9% 15%–19.9% 20%–24.9% 25%–29.9% 30%–34.9% 35%–39.9% 40%–44.9%
ALL 2,332 7% 9% 8% 7% 8% 9% 8% 6% 5%
North Central 761 5% 9% 7% 7% 9% 7% 7% 7% 5%
Northeast 298 5% 8% 8% 6% 8% 10% 10% 6% 5%
South Central 461 10% 9% 9% 7% 9% 8% 9% 5% 4%
Southeast 331 9% 9% 10% 6% 8% 9% 8% 5% 7%
West 481 7% 9% 8% 6% 8% 11% 9% 6% 6%
For Profit 1,301 9% 10% 10% 8% 9% 11% 10% 6% 5%
Nonprofit 923 4% 7% 5% 4% 8% 7% 6% 5% 6%
Under 100 FTEs 812 10% 12% 9% 5% 9% 7% 7% 4% 6%
100 to 499 FTEs 918 6% 7% 8% 7% 8% 10% 8% 6% 5%
500 to 999 FTEs 242 5% 6% 7% 7% 6% 8% 8% 11% 5%
1,000 or more FTEs 335 4% 8% 7% 7% 9% 11% 12% 8% 5%
Category Base 45%–49.9% 50%–54.9% 55%–59.9% 60%–64.9% 65%–69.9% 70%–74.9% 75%–79.9% 80% or more
ALL 2,332 4% 6% 4% 5% 4% 3% 3% 3%
North Central 761 5% 6% 6% 5% 5% 3% 4% 4%
Northeast 298 5% 6% 3% 3% 4% 5% 4% 3%
South Central 461 3% 7% 4% 7% 3% 2% 1% 3%
Southeast 331 4% 7% 3% 5% 2% 4% 2% 3%
West 481 3% 6% 4% 5% 4% 2% 4% 3%
For Profit 1,301 4% 5% 2% 3% 2% 2% 1% 2%
Nonprofit 923 4% 9% 7% 7% 6% 4% 6% 5%
Under 100 FTEs 812 3% 6% 4% 4% 5% 3% 2% 2%
100 to 499 FTEs 918 3% 7% 5% 6% 4% 3% 4% 4%
500 to 999 FTEs 242 7% 7% 4% 5% 2% 5% 4% 4%
1,000 or more FTEs 335 5% 5% 4% 4% 2% 2% 2% 4%
2021 MEDIAN COMPENSATION AND BENEFITS COSTS
20%–21.9%Benefits as a percentage of
total compensation
$10,000–$10,999Annual dollars spent on paid benefits per eligible employee
30%–34.9%Compensation and benefits as a percentage of total operating
revenue
21GALLAGHER AJG.COM
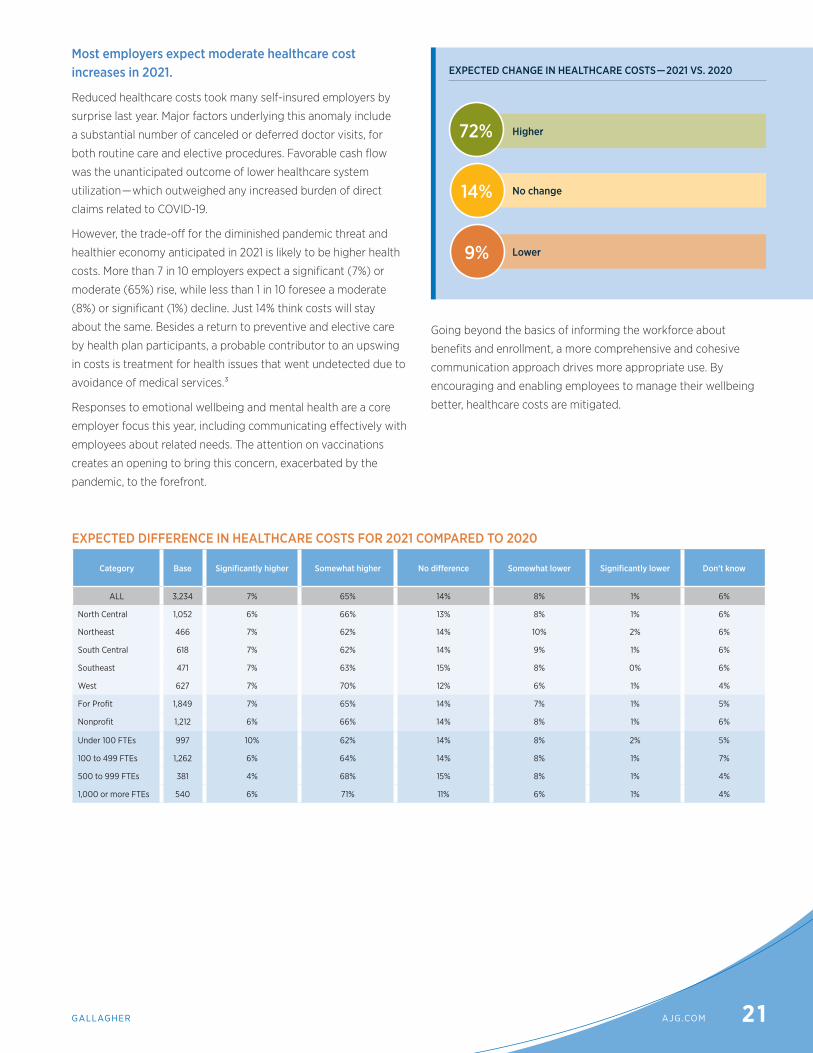
Most employers expect moderate healthcare cost increases in 2021.
Reduced healthcare costs took many self-insured employers by
surprise last year. Major factors underlying this anomaly include
a substantial number of canceled or deferred doctor visits, for
both routine care and elective procedures. Favorable cash flow
was the unanticipated outcome of lower healthcare system
utilization — which outweighed any increased burden of direct
claims related to COVID-19.
However, the trade-off for the diminished pandemic threat and
healthier economy anticipated in 2021 is likely to be higher health
costs. More than 7 in 10 employers expect a significant (7%) or
moderate (65%) rise, while less than 1 in 10 foresee a moderate
(8%) or significant (1%) decline. Just 14% think costs will stay
about the same. Besides a return to preventive and elective care
by health plan participants, a probable contributor to an upswing
in costs is treatment for health issues that went undetected due to
avoidance of medical services.³
Responses to emotional wellbeing and mental health are a core
employer focus this year, including communicating effectively with
employees about related needs. The attention on vaccinations
creates an opening to bring this concern, exacerbated by the
pandemic, to the forefront.
Going beyond the basics of informing the workforce about
benefits and enrollment, a more comprehensive and cohesive
communication approach drives more appropriate use. By
encouraging and enabling employees to manage their wellbeing
better, healthcare costs are mitigated.
EXPECTED DIFFERENCE IN HEALTHCARE COSTS FOR 2021 COMPARED TO 2020
Category Base Significantly higher Somewhat higher No difference Somewhat lower Significantly lower Don’t know
ALL 3,234 7% 65% 14% 8% 1% 6%
North Central 1,052 6% 66% 13% 8% 1% 6%
Northeast 466 7% 62% 14% 10% 2% 6%
South Central 618 7% 62% 14% 9% 1% 6%
Southeast 471 7% 63% 15% 8% 0% 6%
West 627 7% 70% 12% 6% 1% 4%
For Profit 1,849 7% 65% 14% 7% 1% 5%
Nonprofit 1,212 6% 66% 14% 8% 1% 6%
Under 100 FTEs 997 10% 62% 14% 8% 2% 5%
100 to 499 FTEs 1,262 6% 64% 14% 8% 1% 7%
500 to 999 FTEs 381 4% 68% 15% 8% 1% 4%
1,000 or more FTEs 540 6% 71% 11% 6% 1% 4%
EXPECTED CHANGE IN HEALTHCARE COSTS — 2021 VS. 2020
Higher
No change
Lower
72%
14%
9%
22 U.S. EDITION2021 WORKFORCE TRENDS REPORT SERIES | PEOPLE & ORGANIZATIONAL WELLBEING STRATEGY
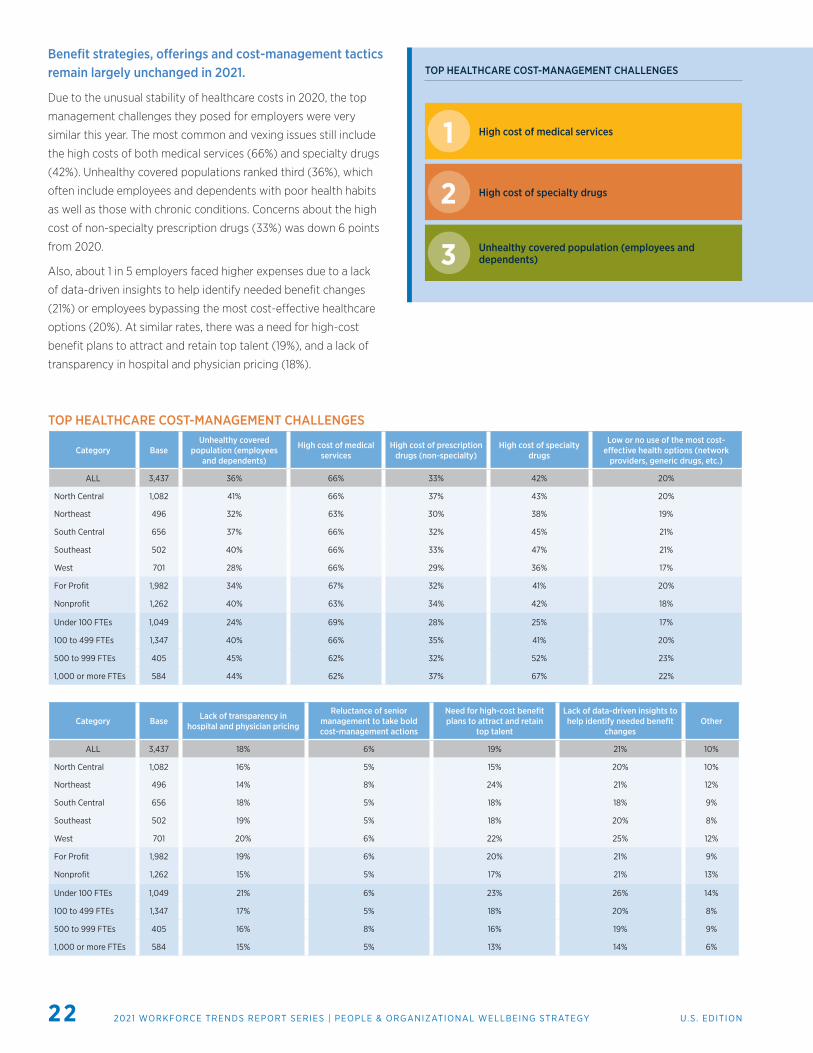
TOP HEALTHCARE COST-MANAGEMENT CHALLENGESBenefit strategies, offerings and cost-management tactics remain largely unchanged in 2021.
Due to the unusual stability of healthcare costs in 2020, the top
management challenges they posed for employers were very
similar this year. The most common and vexing issues still include
the high costs of both medical services (66%) and specialty drugs
(42%). Unhealthy covered populations ranked third (36%), which
often include employees and dependents with poor health habits
as well as those with chronic conditions. Concerns about the high
cost of non-specialty prescription drugs (33%) was down 6 points
from 2020.
Also, about 1 in 5 employers faced higher expenses due to a lack
of data-driven insights to help identify needed benefit changes
(21%) or employees bypassing the most cost-effective healthcare
options (20%). At similar rates, there was a need for high-cost
benefit plans to attract and retain top talent (19%), and a lack of
transparency in hospital and physician pricing (18%).
High cost of medical services
High cost of specialty drugs
Unhealthy covered population (employees and dependents)
1
2
3
TOP HEALTHCARE COST-MANAGEMENT CHALLENGES
Category BaseUnhealthy covered
population (employees and dependents)
High cost of medical services
High cost of prescription drugs (non-specialty)
High cost of specialty drugs
Low or no use of the most cost-effective health options (network
providers, generic drugs, etc.)
ALL 3,437 36% 66% 33% 42% 20%
North Central 1,082 41% 66% 37% 43% 20%
Northeast 496 32% 63% 30% 38% 19%
South Central 656 37% 66% 32% 45% 21%
Southeast 502 40% 66% 33% 47% 21%
West 701 28% 66% 29% 36% 17%
For Profit 1,982 34% 67% 32% 41% 20%
Nonprofit 1,262 40% 63% 34% 42% 18%
Under 100 FTEs 1,049 24% 69% 28% 25% 17%
100 to 499 FTEs 1,347 40% 66% 35% 41% 20%
500 to 999 FTEs 405 45% 62% 32% 52% 23%
1,000 or more FTEs 584 44% 62% 37% 67% 22%
Category Base Lack of transparency in hospital and physician pricing
Reluctance of senior management to take bold cost-management actions
Need for high-cost benefit plans to attract and retain
top talent
Lack of data-driven insights to help identify needed benefit
changes Other
ALL 3,437 18% 6% 19% 21% 10%
North Central 1,082 16% 5% 15% 20% 10%
Northeast 496 14% 8% 24% 21% 12%
South Central 656 18% 5% 18% 18% 9%
Southeast 502 19% 5% 18% 20% 8%
West 701 20% 6% 22% 25% 12%
For Profit 1,982 19% 6% 20% 21% 9%
Nonprofit 1,262 15% 5% 17% 21% 13%
Under 100 FTEs 1,049 21% 6% 23% 26% 14%
100 to 499 FTEs 1,347 17% 5% 18% 20% 8%
500 to 999 FTEs 405 16% 8% 16% 19% 9%
1,000 or more FTEs 584 15% 5% 13% 14% 6%
23GALLAGHER AJG.COM
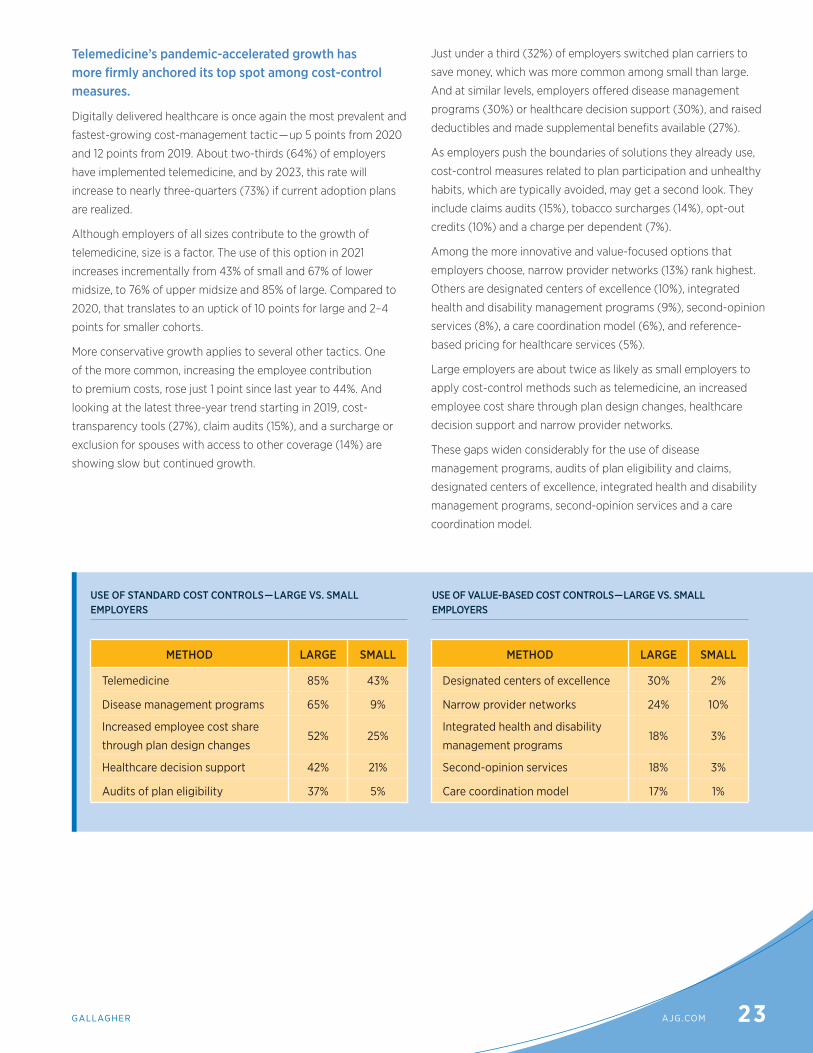
Telemedicine’s pandemic-accelerated growth has more firmly anchored its top spot among cost-control measures.
Digitally delivered healthcare is once again the most prevalent and
fastest-growing cost-management tactic — up 5 points from 2020
and 12 points from 2019. About two-thirds (64%) of employers
have implemented telemedicine, and by 2023, this rate will
increase to nearly three-quarters (73%) if current adoption plans
are realized.
Although employers of all sizes contribute to the growth of
telemedicine, size is a factor. The use of this option in 2021
increases incrementally from 43% of small and 67% of lower
midsize, to 76% of upper midsize and 85% of large. Compared to
2020, that translates to an uptick of 10 points for large and 2–4
points for smaller cohorts.
More conservative growth applies to several other tactics. One
of the more common, increasing the employee contribution
to premium costs, rose just 1 point since last year to 44%. And
looking at the latest three-year trend starting in 2019, cost-
transparency tools (27%), claim audits (15%), and a surcharge or
exclusion for spouses with access to other coverage (14%) are
showing slow but continued growth.
Just under a third (32%) of employers switched plan carriers to
save money, which was more common among small than large.
And at similar levels, employers offered disease management
programs (30%) or healthcare decision support (30%), and raised
deductibles and made supplemental benefits available (27%).
As employers push the boundaries of solutions they already use,
cost-control measures related to plan participation and unhealthy
habits, which are typically avoided, may get a second look. They
include claims audits (15%), tobacco surcharges (14%), opt-out
credits (10%) and a charge per dependent (7%).
Among the more innovative and value-focused options that
employers choose, narrow provider networks (13%) rank highest.
Others are designated centers of excellence (10%), integrated
health and disability management programs (9%), second-opinion
services (8%), a care coordination model (6%), and reference-
based pricing for healthcare services (5%).
Large employers are about twice as likely as small employers to
apply cost-control methods such as telemedicine, an increased
employee cost share through plan design changes, healthcare
decision support and narrow provider networks.
These gaps widen considerably for the use of disease
management programs, audits of plan eligibility and claims,
designated centers of excellence, integrated health and disability
management programs, second-opinion services and a care
coordination model.
USE OF VALUE-BASED COST CONTROLS — LARGE VS. SMALL EMPLOYERS
USE OF STANDARD COST CONTROLS — LARGE VS. SMALL EMPLOYERS
METHOD LARGE SMALL
Telemedicine 85% 43%
Disease management programs 65% 9%
Increased employee cost share
through plan design changes52% 25%
Healthcare decision support 42% 21%
Audits of plan eligibility 37% 5%
METHOD LARGE SMALL
Designated centers of excellence 30% 2%
Narrow provider networks 24% 10%
Integrated health and disability
management programs18% 3%
Second-opinion services 18% 3%
Care coordination model 17% 1%

24 U.S. EDITION2021 WORKFORCE TRENDS REPORT SERIES | PEOPLE & ORGANIZATIONAL WELLBEING STRATEGY
HEALTHCARE COST-CONTROL TACTICS USED IN 2021
Category BaseIncrease the employee
contribution to the premium cost
Increase the employee cost share through plan design
changes
Change plan carriers
Use narrow provider networks
Use reference-based pricing for healthcare
services
Increase deductibles and offer
supplemental benefits
ALL 3,380 44% 36% 32% 13% 5% 27%
North Central 1,077 49% 38% 30% 15% 5% 26%
Northeast 483 45% 40% 31% 8% 4% 31%
South Central 633 41% 31% 33% 13% 7% 25%
Southeast 500 41% 38% 31% 8% 4% 26%
West 687 38% 32% 37% 17% 3% 28%
For Profit 1,946 44% 37% 38% 11% 4% 27%
Nonprofit 1,235 44% 34% 25% 18% 6% 27%
Under 100 FTEs 988 33% 25% 40% 10% 3% 28%
100 to 499 FTEs 1,341 45% 35% 33% 11% 5% 26%
500 to 999 FTEs 402 47% 40% 25% 13% 5% 27%
1,000 or more FTEs 587 54% 52% 24% 24% 7% 27%
Category Base Offer telemedicine
Provide employees with healthcare decision support
Designate centers of excellence (expert facilities or providers specializing in
complex care)
Provide employees with cost-transparency tools
Provide wellbeing incentives
ALL 3,380 64% 30% 10% 27% 43%
North Central 1,077 64% 29% 10% 29% 46%
Northeast 483 62% 30% 10% 27% 44%
South Central 633 61% 33% 11% 26% 41%
Southeast 500 73% 31% 12% 29% 48%
West 687 61% 27% 7% 24% 37%
For Profit 1,946 67% 31% 10% 28% 40%
Nonprofit 1,235 59% 28% 8% 25% 47%
Under 100 FTEs 988 43% 21% 2% 18% 26%
100 to 499 FTEs 1,341 67% 28% 5% 27% 43%
500 to 999 FTEs 402 76% 39% 14% 34% 55%
1,000 or more FTEs 587 85% 42% 30% 37% 63%
Category Base Offer disease management programs
Integrate health and disability management programs
Actively deploy a care coordination or navigation model
Perform eligibility audits
Perform claims audits
ALL 3,380 30% 9% 6% 16% 15%
North Central 1,077 31% 9% 6% 18% 14%
Northeast 483 31% 9% 4% 16% 16%
South Central 633 28% 9% 7% 15% 17%
Southeast 500 39% 9% 6% 18% 18%
West 687 23% 8% 3% 14% 11%
For Profit 1,946 27% 9% 5% 15% 15%
Nonprofit 1,235 33% 9% 7% 18% 15%
Under 100 FTEs 988 9% 3% 1% 5% 3%
100 to 499 FTEs 1,341 27% 8% 4% 11% 14%
500 to 999 FTEs 402 40% 15% 6% 29% 21%
1,000 or more FTEs 587 65% 18% 17% 37% 35%

25GALLAGHER AJG.COM
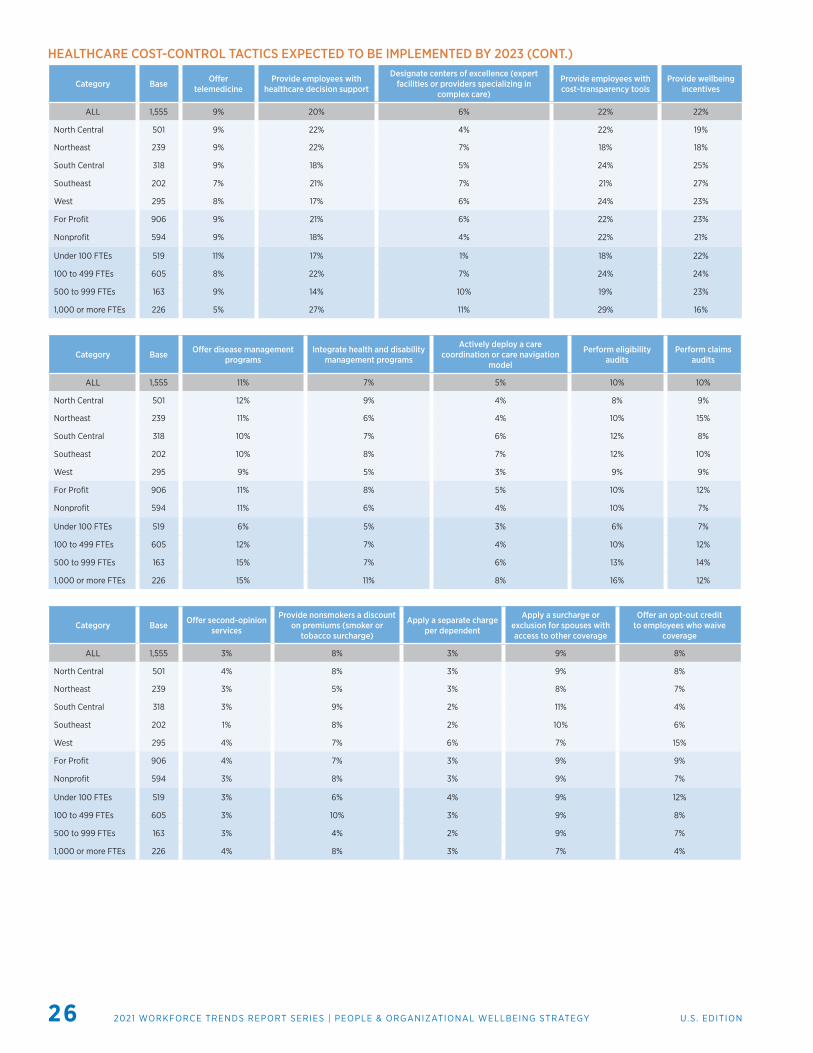
USE OF COST-MANAGEMENT TACTICS — PROJECTED INCREASE OF 20% OR MORE BY 2023
HEALTHCARE COST-CONTROL TACTICS EXPECTED TO BE IMPLEMENTED BY 2023
Category BaseIncrease the employee
contribution to the premium cost
Increase the employee cost share through plan design
changes
Change plan carriers
Use narrow provider networks
Use reference-based pricing for healthcare
services
Increase deductibles and offer
supplemental benefits
ALL 1,555 19% 24% 15% 6% 7% 16%
North Central 501 18% 26% 14% 5% 7% 17%
Northeast 239 18% 23% 18% 6% 11% 17%
South Central 318 21% 25% 14% 4% 5% 16%
Southeast 202 20% 19% 15% 5% 7% 15%
West 295 22% 22% 13% 9% 7% 14%
For Profit 906 19% 23% 15% 5% 7% 17%
Nonprofit 594 21% 24% 14% 6% 8% 15%
Under 100 FTEs 519 19% 24% 16% 5% 6% 14%
100 to 499 FTEs 605 19% 24% 16% 5% 8% 15%
500 to 999 FTEs 163 27% 26% 10% 6% 7% 21%
1,000 or more FTEs 226 15% 19% 12% 9% 11% 19%
Adoption of cost-management tactics is expected to pick up over the next two years.
By 2023, the use of several popular cost-management tactics is
expected to rise by 20% or more, including cost sharing through
plan design changes (24%), wellbeing incentives (22%), cost-
transparency tools (22%) and healthcare decision support (20%).
Nearly as many employers, 19%, plan to increase employee
contributions to the cost of premiums, while 16% plan to increase
deductibles and offer employee-paid supplemental benefits. At
declining rates, forecasts also include changing plan carriers (15%),
adding disease management programs (11%), and performing
eligibility (10%) and claims audits (10%). Planned adoption of
other cost-control tactics stands at 9% or less.
Cost sharing through plan design changes
Wellbeing incentives
Healthcare decision support
Cost-transparency tools
24%
22%
22%
20%
HEALTHCARE COST-CONTROL TACTICS USED IN 2021 (CONT.)
Category Base Offer second-opinion services
Provide nonsmokers a discount on premiums (smoker or
tobacco surcharge)
Apply a separate charge per dependent
Apply a surcharge or exclusion for spouses with access to other coverage
Offer an opt-out credit to employees who waive
coverage
ALL 3,380 8% 14% 7% 14% 10%
North Central 1,077 7% 16% 7% 22% 12%
Northeast 483 9% 11% 4% 13% 15%
South Central 633 9% 14% 7% 12% 4%
Southeast 500 7% 19% 7% 15% 8%
West 687 7% 7% 9% 5% 12%
For Profit 1,946 8% 16% 7% 15% 8%
Nonprofit 1,235 7% 10% 7% 14% 13%
Under 100 FTEs 988 3% 4% 12% 6% 10%
100 to 499 FTEs 1,341 6% 13% 5% 12% 12%
500 to 999 FTEs 402 8% 17% 5% 19% 12%
1,000 or more FTEs 587 18% 30% 3% 29% 7%
26 U.S. EDITION2021 WORKFORCE TRENDS REPORT SERIES | PEOPLE & ORGANIZATIONAL WELLBEING STRATEGY
HEALTHCARE COST-CONTROL TACTICS EXPECTED TO BE IMPLEMENTED BY 2023 (CONT.)
Category Base Offer telemedicine
Provide employees with healthcare decision support
Designate centers of excellence (expert facilities or providers specializing in
complex care)
Provide employees with cost-transparency tools
Provide wellbeing incentives
ALL 1,555 9% 20% 6% 22% 22%
North Central 501 9% 22% 4% 22% 19%
Northeast 239 9% 22% 7% 18% 18%
South Central 318 9% 18% 5% 24% 25%
Southeast 202 7% 21% 7% 21% 27%
West 295 8% 17% 6% 24% 23%
For Profit 906 9% 21% 6% 22% 23%
Nonprofit 594 9% 18% 4% 22% 21%
Under 100 FTEs 519 11% 17% 1% 18% 22%
100 to 499 FTEs 605 8% 22% 7% 24% 24%
500 to 999 FTEs 163 9% 14% 10% 19% 23%
1,000 or more FTEs 226 5% 27% 11% 29% 16%
Category Base Offer disease management programs
Integrate health and disability management programs
Actively deploy a care coordination or care navigation
model
Perform eligibility audits
Perform claims audits
ALL 1,555 11% 7% 5% 10% 10%
North Central 501 12% 9% 4% 8% 9%
Northeast 239 11% 6% 4% 10% 15%
South Central 318 10% 7% 6% 12% 8%
Southeast 202 10% 8% 7% 12% 10%
West 295 9% 5% 3% 9% 9%
For Profit 906 11% 8% 5% 10% 12%
Nonprofit 594 11% 6% 4% 10% 7%
Under 100 FTEs 519 6% 5% 3% 6% 7%
100 to 499 FTEs 605 12% 7% 4% 10% 12%
500 to 999 FTEs 163 15% 7% 6% 13% 14%
1,000 or more FTEs 226 15% 11% 8% 16% 12%
Category Base Offer second-opinion services
Provide nonsmokers a discount on premiums (smoker or
tobacco surcharge)
Apply a separate charge per dependent
Apply a surcharge or exclusion for spouses with access to other coverage
Offer an opt-out credit to employees who waive
coverage
ALL 1,555 3% 8% 3% 9% 8%
North Central 501 4% 8% 3% 9% 8%
Northeast 239 3% 5% 3% 8% 7%
South Central 318 3% 9% 2% 11% 4%
Southeast 202 1% 8% 2% 10% 6%
West 295 4% 7% 6% 7% 15%
For Profit 906 4% 7% 3% 9% 9%
Nonprofit 594 3% 8% 3% 9% 7%
Under 100 FTEs 519 3% 6% 4% 9% 12%
100 to 499 FTEs 605 3% 10% 3% 9% 8%
500 to 999 FTEs 163 3% 4% 2% 9% 7%
1,000 or more FTEs 226 4% 8% 3% 7% 4%

27GALLAGHER AJG.COM
Few employers lower health plan costs by applying surcharges for tobacco use or spousal coverage.
Surcharges directly and cost-efficiently lower spending, yet just
10% of employers offer an opt-out credit for employees who
waive healthcare coverage. At the somewhat higher rate of 14%,
they either apply a surcharge for spouses with access to other
coverage or exclude them. Among this group, 38% charge $100 or
more per month to include spouses on the plan. Four in 10 (40%)
exclude spouses altogether, up from 35% in 2020. This practice is
more common among small (56%) than large employers (33%).
Separately, 14% of employers require a monthly surcharge
for tobacco users. The most common amounts are $50–$99
(34%) or $25–$49 (26%). At the lowest and highest ends of
the spectrum, 23% charged less than $25 per month, while 17%
charged $100 or more.
MONTHLY SURCHARGE FOR SPOUSES WITH ACCESS TO OTHER COVERAGE
Category Base Less than $25 $25–$49 $50–$99 $100 or more Don’t offer coverage
ALL 474 3% 4% 15% 38% 40%
North Central 229 2% 3% 12% 33% 50%
Northeast 64 3% 8% 22% 48% 19%
South Central 74 4% 3% 12% 43% 38%
Southeast 74 4% 4% 22% 38% 32%
West 33 3% 9% 21% 36% 30%
For Profit 286 3% 5% 16% 40% 36%
Nonprofit 169 2% 3% 12% 36% 47%
Under 100 FTEs 62 6% 5% 5% 27% 56%
100 to 499 FTEs 161 2% 6% 19% 31% 42%
500 to 999 FTEs 73 3% 5% 11% 40% 41%
1,000 or more FTEs 168 1% 2% 15% 48% 33%
MONTHLY SURCHARGE FOR TOBACCO USERS
Category Base Less than $25 $25–$49 $50–$99 $100 or more
ALL 441 23% 26% 34% 17%
North Central 169 25% 27% 30% 18%
Northeast 50 24% 30% 34% 12%
South Central 85 16% 28% 33% 22%
Southeast 94 20% 19% 44% 17%
West 43 30% 30% 33% 7%
For Profit 298 23% 26% 36% 15%
Nonprofit 123 20% 28% 29% 23%
Under 100 FTEs 36 33% 39% 19% 8%
100 to 499 FTEs 159 25% 28% 28% 20%
500 to 999 FTEs 63 25% 27% 35% 13%
1,000 or more FTEs 172 19% 22% 42% 17%
28 U.S. EDITION2021 WORKFORCE TRENDS REPORT SERIES | PEOPLE & ORGANIZATIONAL WELLBEING STRATEGY
KEY TAKEAWAYSVirtual permanence — the transition to virtual workplaces as part of a standard operational structure — is creating broad access to non-local talent pools. As the economic recovery takes hold, organizations also see these fading geographic boundaries as new opportunities for engaging clients and increasing revenues. This reconfiguration also encompasses workforce strategies, which now include a focus on retaining and attracting key talent with the competencies required to lead in this new environment.
A hiatus in the growth of healthcare costs has required fewer adjustments to benefits strategy, design and selection for 2021. And even if costs go up as expected when the utilization of provider services normalizes, many employers are well positioned to keep them in check.
The past three years have been marked by increases in telemedicine adoption; higher employee contributions to health plan premium costs; and greater use of cost-transparency tools, claims audits, and a surcharge or exclusion for spouses with access to other coverage. By 2023, more than 20% of employers plan to fortify their cost-management efforts and outcomes through plan design changes and the addition of wellbeing incentives, cost-transparency tools and healthcare decision support.
The pressure to endure long-term unpredictability and to manage not-so-new everyday stresses has increased burnout and decreased emotional wellbeing among employees. With remote work now commonplace for many businesses, managers who schedule check-ins and maintain regular contact with their team members will be more attuned to the need for additional support. Keeping everyone aware of resources like EAPs, mental health self-assessment tools, coaching and counseling programs, or other available options is key to connecting them to better health and wellbeing.
For many employee roles, allowing flexibility in how and when work gets done, as well as where, is essential to both productivity and profitability. Long before the pandemic, accelerating advances in communication technology not only laid the groundwork for this shift, but also made it inevitable. Success in a society that’s constantly connected insists on negotiable work arrangements and hours, wherever practical.
Evaluating the specific needs of employee groups allows employers to more effectively identify and develop supportive workplace policies that discourage turnover. Caregiver burdens and high attrition among female employees with school-age children are two high-priority retention risks. Diversity will continue to set the course for organizational success, making it critical to address the stressors underlying an exodus of women from the workforce — through policies such as paid and unpaid leave policies, job sharing or reduced hours.
Tasked with keeping a competitive workforce during an unparalleled rise in labor market mobility, sustainability requires a firm foundation for pay equity and employee performance. Policy adjustments, targeted training and individualized support resources are also needed to help people adapt to a flexible environment.
This eventful decade that’s barely even started has already brought a much deeper understanding about the meaning of resilience in the near and distant future. For retaining and attracting new talent, proactively managing constant change is about keeping pace with the present — by evolving the employee value proposition through an integrated approach to total rewards, workplace culture and employee wellbeing.
29GALLAGHER AJG.COM
ENDNOTES
PEOPLE & ORGANIZATIONAL STRATEGY¹U.S. Bureau of Labor Statistics, “Graphics for Economic News Releases: Civilian unemployment rate,” accessed March 2021
²Congressional Budget Office, “An Overview of the Economic Outlook: 2021 to 2031,” February 2021
³Gallagher, “The impact of COVID-19: Self-funded employers should experience a reduction in healthcare costs — Yes, a reduction,” May 2020

30 U.S. EDITION2021 WORKFORCE TRENDS REPORT SERIES | PEOPLE & ORGANIZATIONAL WELLBEING STRATEGY
CONTRIBUTORS
PEOPLE & ORGANIZATIONAL WELLBEING STRATEGY
Scott Hamilton [email protected]
Joe Milano [email protected]
PRODUCTION
Stacy [email protected]
Cindy [email protected]
RESEARCH & REPORTING
Stephanie [email protected]
Sarah Daley [email protected]
SURVEY DEVELOPMENT
Michelle [email protected]
Thomas [email protected]
PREVIEW REPORT DATA
ajg.com/2021-WFTRSeries
LIKE THE DATA IN THIS REPORT?
Get the full employee and organizational wellbeing story with the complete 2021 Workforce Trends Report Series. Access all the data and insights in the complete 2021 series for
only $650.
This series includes employer insights and analysis from
Gallagher's biggest benefits and workforce strategy surveys.
31GALLAGHER AJG.COM
ABOUT GALLAGHER
The pursuit of “better” is ongoing. And the process involved requires recognizing and acting on unforeseen risks, while keeping a mindset that turns the toughest challenges into opportunities.
People are an organization’s greatest asset in any challenge. And the connection between employee wellbeing and organizational wellbeing
has never been more apparent — or more important.
Employees have multifaceted needs that extend beyond their work commitments. That’s why their wellbeing is at the center of Gallagher
Better Works℠, a comprehensive approach that engages them in their work and drives your organization’s success. By strategically investing
in benefits, compensation, retirement and employee communication, you’re able to support the health, financial security and career growth
of your people at the right cost structures.
From evaluating the demographics of your workforce to surveying and analyzing competitor trends, Gallagher helps you gather new insights
and apply best practices that promote productivity and growth. A data-driven focus allows you to continually improve and make changes for
better outcomes.
As you develop new business operating models, support employees working remotely, and ensure equity and inclusion within a diverse
workplace culture, your people can perform at a higher level. When this happens, you optimize your annual talent investment and mitigate
organizational risk to maximize your profitability.
A strategy rooted in the wellbeing of your people is one that allows organizational wellbeing to thrive — even in times of uncertainty.
Arthur J. Gallagher & Co. (NYSE: AJG), an international insurance brokerage and risk management services firm, is headquartered in
Rolling Meadows, Illinois; has operations in 56 countries; and offers client-service capabilities in more than 150 countries around the
world through a network of correspondent brokers and consultants.
TERMS OF USE
The intent of this Survey is to provide you with general information regarding current practice within the employee benefits environment. The data does not constitute recommendations or other advice regarding employee benefit programs, and the user is in no way obligated to accept or implement any information for use within their organization(s). The decision to utilize any information provided rests solely with the user, and application of the data contained does not guarantee compliance with applicable laws or regulations regarding employee benefits. Information provided by the Survey, even if generally applicable, cannot possibly take into account all of the various factors that may affect a specific individual or situation. Additionally, practices described within the Survey should not be construed as, nor are they intended to provide, legal advice.
The Web Site and the Content do not constitute accounting, consulting, investment, insurance, legal, tax or any other type of professional advice, and should be used only in conjunction with the services of a Gallagher consultant and any other appropriate professional advisors who have full knowledge of the user’s situation.
Gallagher does not represent or warrant that the Content will be correct, accurate, timely or otherwise reliable. Gallagher may make changes to the Content at any time. Gallagher assumes no responsibility of any kind, oral or written, express or implied, including but not limited to fitness for a particular purpose, accuracy, omissions and completeness of information. Gallagher shall in no event whatsoever be liable to licensee or any other party for any indirect, special, consequential, incidental, or similar damages, including damages for lost data or economic loss, even if Gallagher has been notified of the possibility of such loss. For the purposes of this section the term “Gallagher” shall be construed so as to include Gallagher Surveys as a marketing division and/or Gallagher Benefit Services, Inc. and its affiliates.
Consulting and insurance brokerage services to be provided by Gallagher Benefit Services, Inc. and/or its affiliate Gallagher Benefit Services (Canada) Group Inc. Gallagher Benefit Services, Inc., a non-investment firm and subsidiary of Arthur J. Gallagher & Co., is a licensed insurance agency that does business in California as “Gallagher Benefit Services of California Insurance Services” and in Massachusetts as “Gallagher Benefit Insurance Services.” Certain appropriately licensed individuals of Arthur J. Gallagher & Co. subsidiaries or affiliates offer securities through Kestra Investment Services, LLC (Kestra IS), member FINRA/SIPC and or investment advisory services through Kestra Advisory Services, LLC (Kestra AS), an affiliate of Kestra IS. Neither Kestra IS nor Kestra AS is affiliated with Arthur J. Gallagher & Co., or Gallagher Benefit Services, Inc. Neither Kestra AS, Kestra IS, Arthur J. Gallagher & Co., nor their affiliates provide accounting, legal, or tax advice. GBS/Kestra-CD(3582630)(exp052022).
Investor disclosures https://bit.ly/KF-Disclosures
For institutional use only. Not for public distribution. All rights reserved. No part of this book, including the text, data, graphics, interior design and cover design may be reproduced or transmitted in any form, without explicit consent from Arthur J. Gallagher & Co.
“World’s Most Ethical Companies” and “Ethisphere” names and marks are registered trademarks of Ethisphere LLC.
© 2021 Arthur J. Gallagher & Co. | 40116
ajg.com The Gallagher Way. Since 1927.