Embed Size (px)
Citation preview

Pension Reform in Latin America
Experience & Lessons (*)
Guillermo Arthur E.FIAP President September, 2005
* Presented at the 2005 Pension Seminar 2005 – Netherland Antilles, September 1, 2005
Contents
I. Reforms in Latin America
II. Why were the reforms necessary?
III. Characteristics of the reforms
IV. Findings
V. Lessons from the experience
Latin America
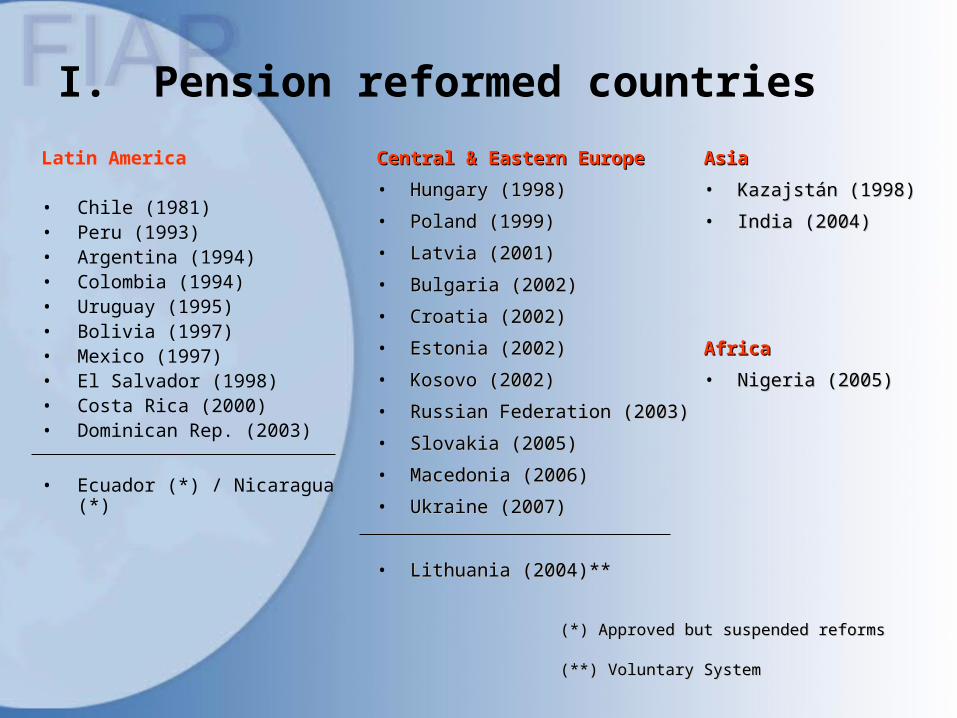
• Chile (1981)• Peru (1993)• Argentina (1994)• Colombia (1994)• Uruguay (1995)• Bolivia (1997)• Mexico (1997)• El Salvador (1998)• Costa Rica (2000)• Dominican Rep. (2003)
• Ecuador (*) / Nicaragua (*)
Central & Eastern EuropeCentral & Eastern Europe
• Hungary (1998)Hungary (1998)
• Poland (1999)Poland (1999)
• Latvia (2001)Latvia (2001)
• Bulgaria (2002)Bulgaria (2002)
• Croatia (2002)Croatia (2002)
• Estonia (2002)Estonia (2002)
• Kosovo (2002)Kosovo (2002)
• Russian Federation (2003)Russian Federation (2003)
• Slovakia (2005)Slovakia (2005)
• Macedonia (2006)Macedonia (2006)
• Ukraine (2007)Ukraine (2007)
• Lithuania (2004)** Lithuania (2004)**
AsiaAsia
• Kazajstán (1998)Kazajstán (1998)
• India (2004)India (2004)
AfricaAfrica
• Nigeria (2005)Nigeria (2005)
I. Pension reformed countries
(*) Approved but suspended reforms(*) Approved but suspended reforms
(**) Voluntary System(**) Voluntary System
II. Why were the reforms necessary?
The financial situation of the traditional systems deteriorated mainly because of the
impact of three (3) phenomena:
Population aging Inefficient public management of pension funds
Sharp salary & employment cycles as a result of successive economic crises
continues...continues...
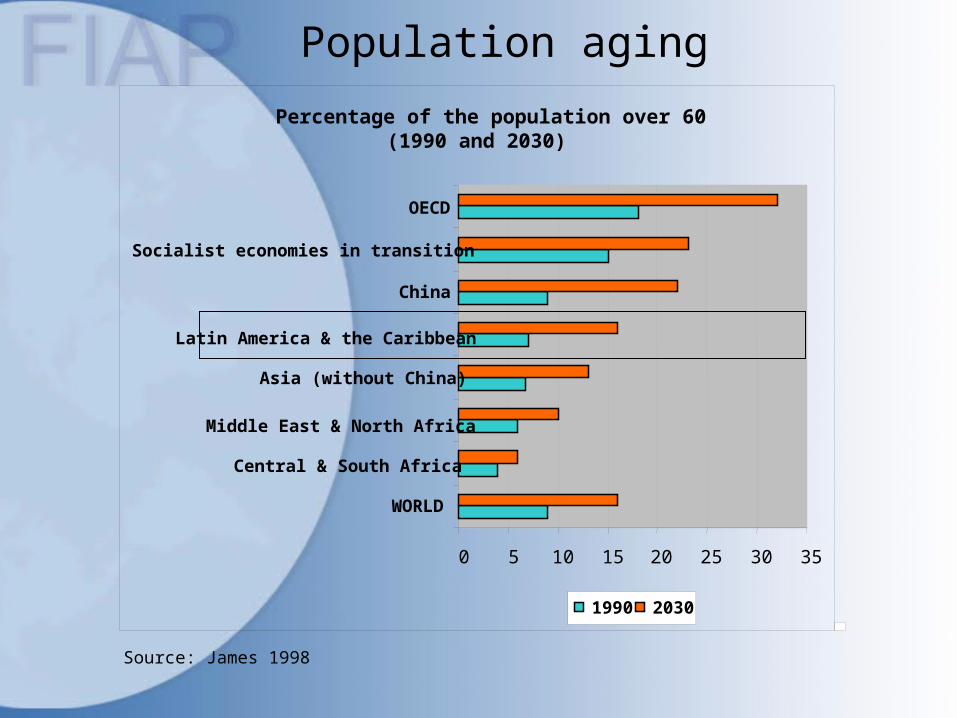
Population aging
Percentage of the population over 60 (1990 and 2030)
0 5 10 15 20 25 30 35
WORLD
Central & South Africa
Middle East & North Africa
Asia (without China)
Latin America & the Caribbean
China
Socialist economies in transition
OECD
1990 2030
Source: James 1998
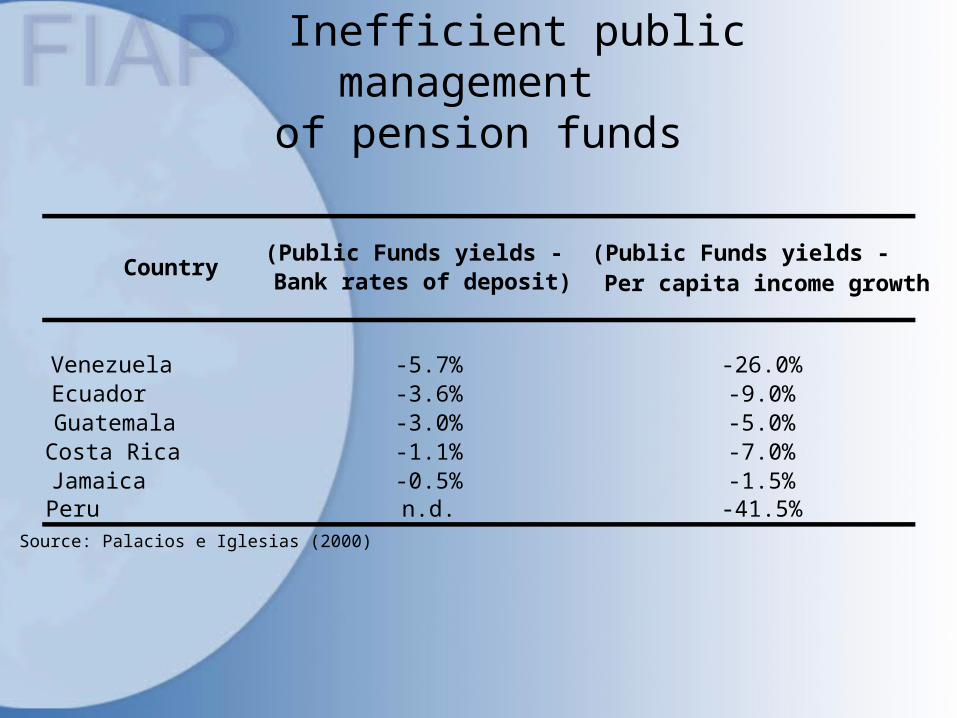
Inefficient public management of pension funds
Venezuela -5.7% -26.0%Ecuador -3.6% -9.0%Guatemala -3.0% -5.0%Costa Rica -1.1% -7.0%Jamaica -0.5% -1.5%Peru n.d. -41.5%Source: Palacios e Iglesias (2000)
Country(Public Funds yields -Bank rates of deposit)
(Public Funds yields - Per capita income growth
II. Why were the reforms necessary?
As a consequence of the deterioration of the traditional financial systems, one observed:
Increased public spending for pensions Increased social security debt High level of membership contribution rates
continues...continues...
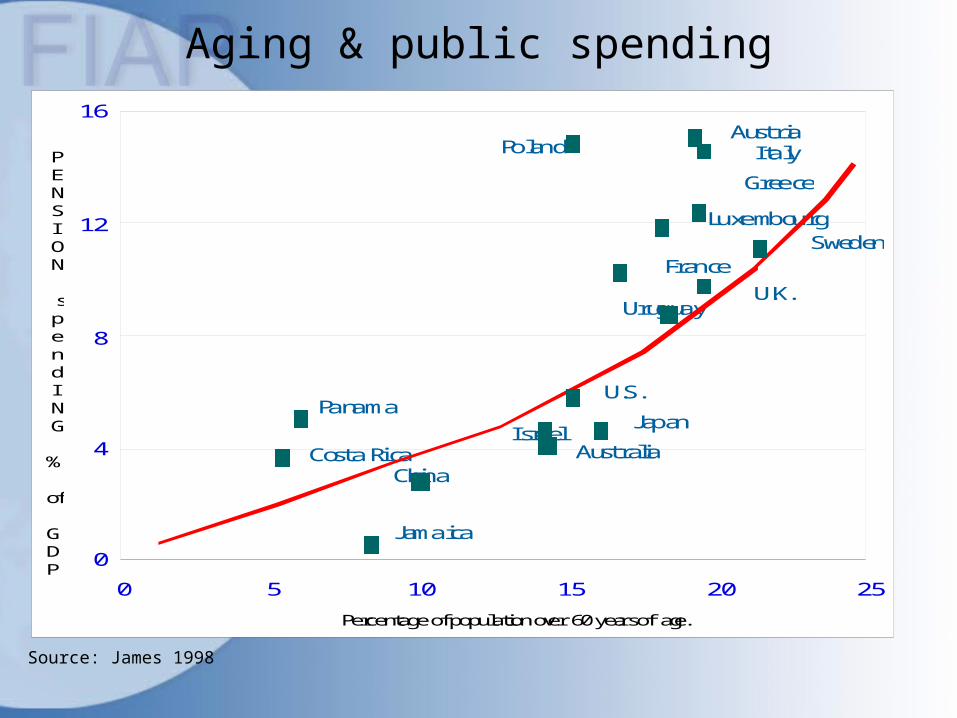
Aging & public spending
Panama
Costa Rica China
Jamaica
Israel Australia
Japan
U.S.
Uruguay U.K.
France Sweden
Luxembourg
Greece
Italy Austria
Poland
0 5 10 15 20 25
Percentage of population over 60 years of age.
0
4
8
12
16
P E N S I O N s p e n d I N G % of GD P
Source: James 1998
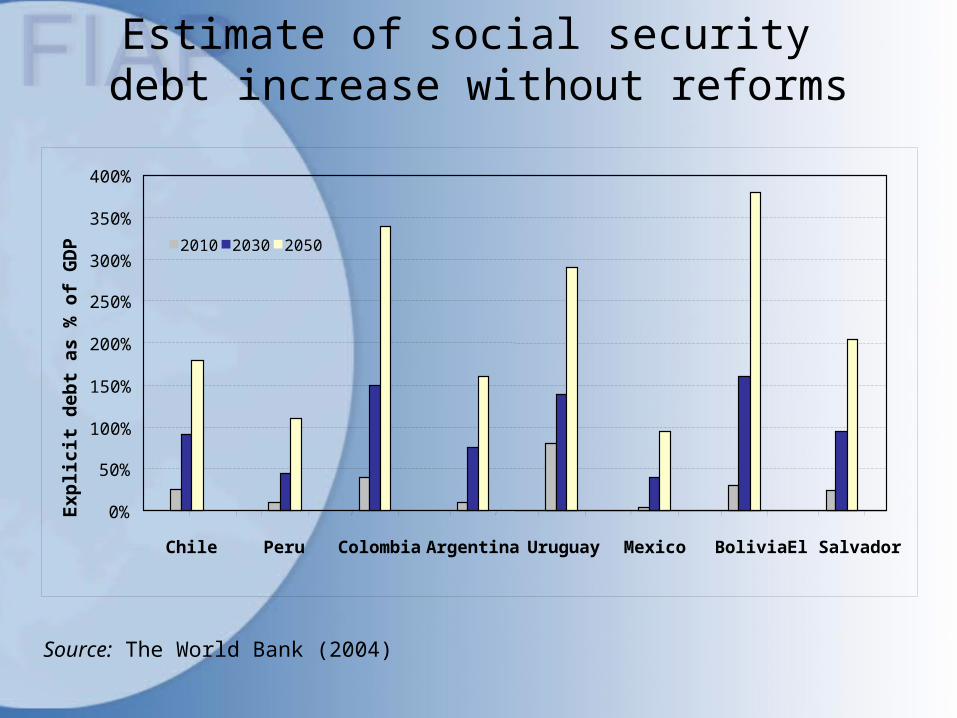
Estimate of social security debt increase without reforms
0%
50%
100%
150%
200%
250%
300%
350%
400%
Chile Peru Colombia Argentina Uruguay Mexico Bolivia El Salvador
Exp
lici
t d
ebt
as %
of
GD
P
2010 2030 2050
Source: The World Bank (2004)
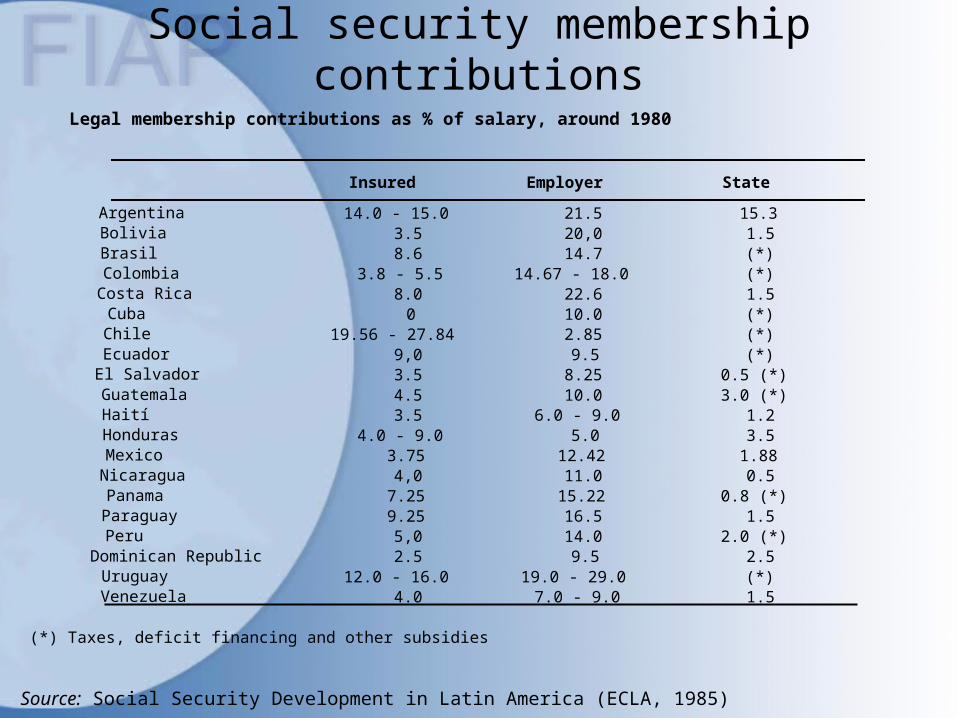
Social security membership contributions
Insured Employer State
Argentina 14.0 - 15.0 21.5 15.3Bolivia 3.5 20,0 1.5Brasil 8.6 14.7 (*)Colombia 3.8 - 5.5 14.67 - 18.0 (*)Costa Rica 8.0 22.6 1.5Cuba 0 10.0 (*)Chile 19.56 - 27.84 2.85 (*)Ecuador 9,0 9.5 (*)El Salvador 3.5 8.25 0.5 (*)Guatemala 4.5 10.0 3.0 (*)Haití 3.5 6.0 - 9.0 1.2Honduras 4.0 - 9.0 5.0 3.5Mexico 3.75 12.42 1.88Nicaragua 4,0 11.0 0.5Panama 7.25 15.22 0.8 (*)Paraguay 9.25 16.5 1.5Peru 5,0 14.0 2.0 (*)Dominican Republic 2.5 9.5 2.5Uruguay 12.0 - 16.0 19.0 - 29.0 (*)Venezuela 4.0 7.0 - 9.0 1.5
(*) Taxes, deficit financing and other subsidies
Legal membership contributions as % of salary, around 1980
Source: Social Security Development in Latin America (ECLA, 1985)
II. Why were the reforms necessary?
• Additionally, the traditional systems proved to be “soft” when confronted with sector interest group pressures. All of this translated into:
Program fragmentation
Inequity (discrimination) between worker groups
Negative impact over income distribution
continues...continues...

II Why were the reforms necessary?
• Consequently, the objectives of the reforms were:
To stop the growth of social security deficit & pension debt.
To improve pensions (without increasing contributions or minimizing whatever increase might be necessary).
To eliminate the inequities of the social security systems.
To shield social security systems from “political risks”.
To minimize the economic distortions generated by the operation of a mandatory pension system.
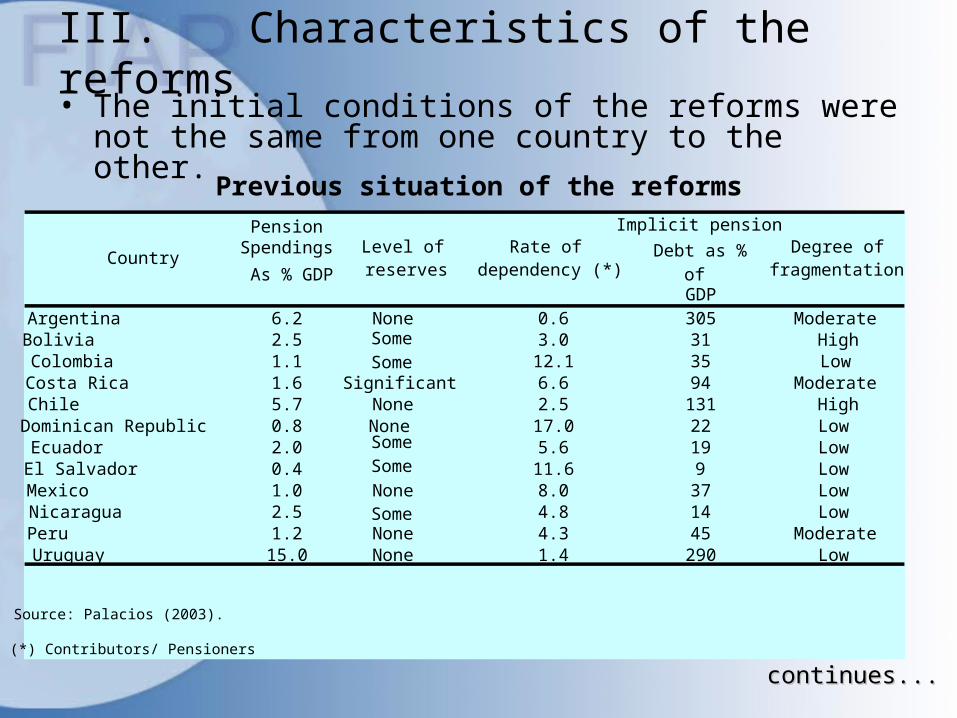
III. Characteristics of the reforms• The initial conditions of the reforms were not the
same from one country to the other.
Pension Spendings
Implicit pension
Debt as %As % GDP of
GDPArgentina 6.2 None 0.6 305 ModerateBolivia 2.5 Some 3.0 31 HighColombia 1.1 Some 12.1 35 LowCosta Rica 1.6 Significant 6.6 94 ModerateChile 5.7 None 2.5 131 HighDominican Republic 0.8 None 17.0 22 LowEcuador 2.0 Some 5.6 19 LowEl Salvador 0.4 Some 11.6 9 LowMexico 1.0 None 8.0 37 LowNicaragua 2.5 Some 4.8 14 LowPeru 1.2 None 4.3 45 ModerateUruguay 15.0 None 1.4 290 Low
(*) Contributors/ Pensioners
Source: Palacios (2003).
CountryLevel of reserves
Rate of dependency (*)
Degree of fragmentation
continues...continues...
Previous situation of the reforms
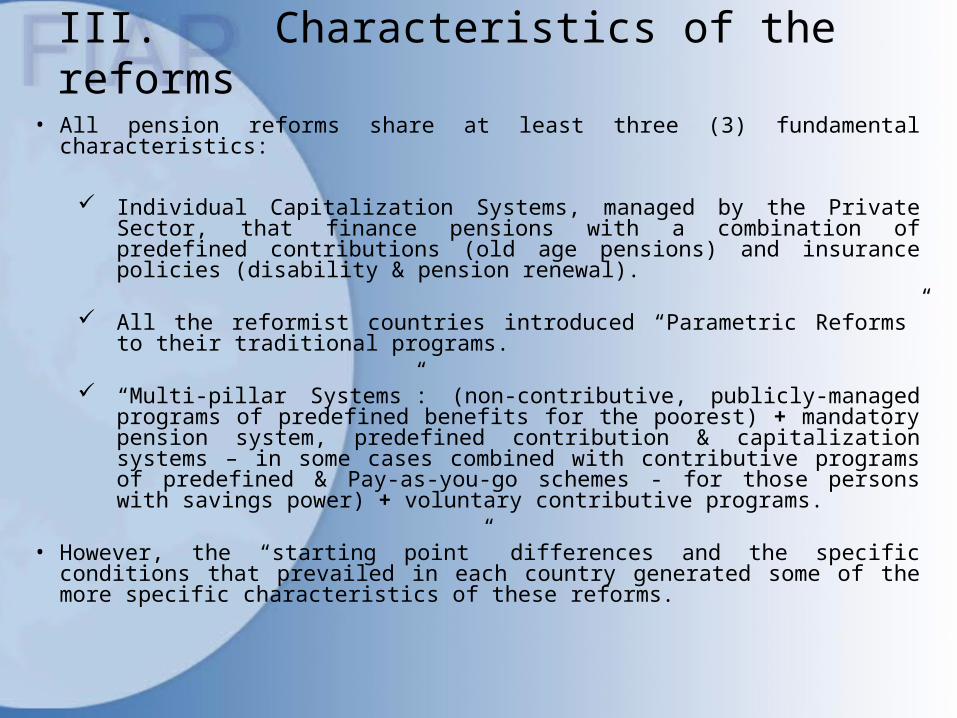
III. Characteristics of the reforms
• All pension reforms share at least three (3) fundamental characteristics:
Individual Capitalization Systems, managed by the Private Sector, that finance pensions with a combination of predefined contributions (old age pensions) and insurance policies (disability & pension renewal).
All the reformist countries introduced “Parametric Reforms” to their traditional programs.
“Multi-pillar Systems”: (non-contributive, publicly-managed programs of predefined benefits for the poorest) + mandatory pension system, predefined contribution & capitalization systems – in some cases combined with contributive programs of predefined & Pay-as-you-go schemes - for those persons with savings power) + voluntary contributive programs.
• However, the “starting point” differences and the specific conditions that prevailed in each country generated some of the more specific characteristics of these reforms.

Social Security Organizations
• Old System First Pillar
Non-contributive & public
Second PillarContributive, public & pay-as-you-go. Predefined benefits.
Third PillarContributive. Capitalization. (Incipient development)
• New System First Pillar
Non-contributive & public
Second Pillar
Alt. 1Alt. 1Private and of Private and of CapitalizationCapitalization ++Public and Pay-Public and Pay-
as-you-goas-you-go.(Predefined (Predefined benefits)benefits)
Alt. 2Alt. 2Private and of Private and of CapitalizationCapitalization(Predefined (Predefined benefits)benefits)
Third Pillar Contributive and voluntary.
Private and of Capitalization (Personal & Occupational)
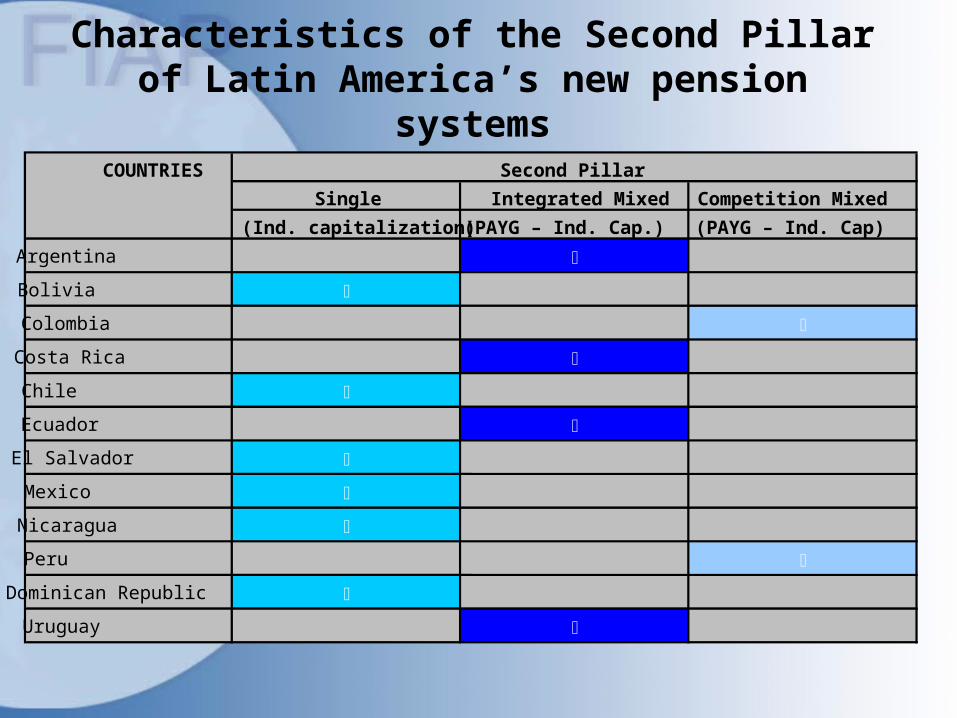
Characteristics of the Second Pillar of Latin America’s new pension systems
COUNTRIES
Single Integrated Mixed Competition Mixed
(Ind. capitalization) (PAYG – Ind. Cap.) (PAYG – Ind. Cap)
Argentina
Bolivia
Colombia
Costa Rica
Chile
Ecuador
El Salvador
Mexico
Nicaragua
Peru
Dominican Republic
Uruguay
Second Pillar
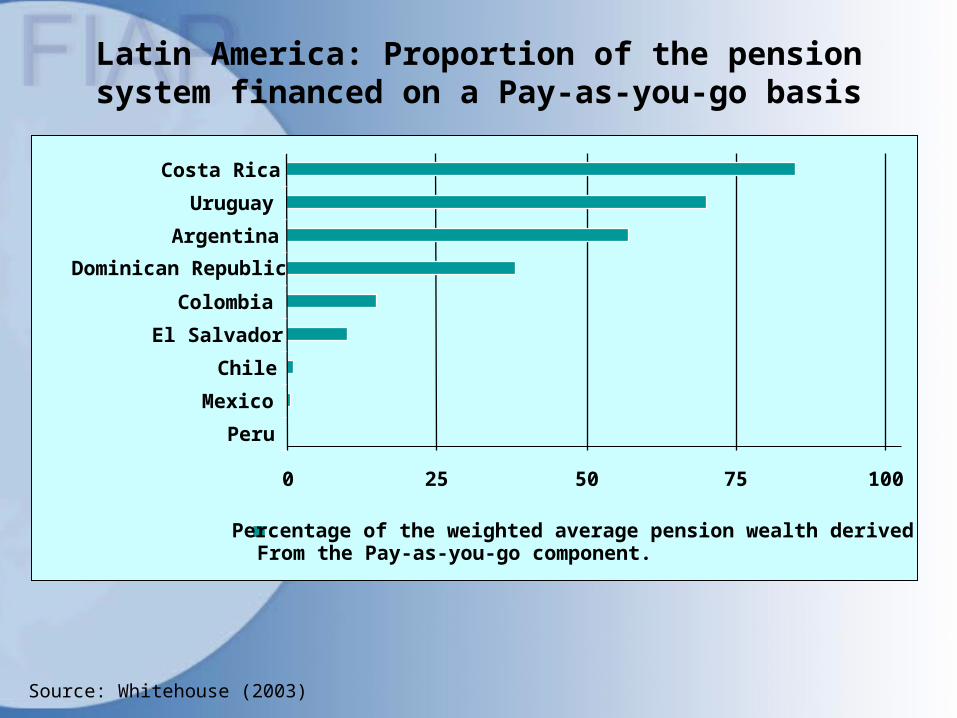
Latin America: Proportion of the pension system financed on a Pay-as-you-go basis
Source: Whitehouse (2003)
0 25 50 75 100
Peru
Mexico
Chile
El Salvador
Colombia
Dominican Republic
Argentina
Uruguay
Costa Rica
Percentage of the weighted average pension wealth derivedFrom the Pay-as-you-go component.

IV. Findings
• Pensions must be evaluated over a long period of time. Consequently, one cannot yet arrive at final conclusions.
• Nevertheless, there are three (3) very significant findings:
1. The Fund’s rates of return exceed the rate of growth of real salaries and per capita incomes.
continues...continues...
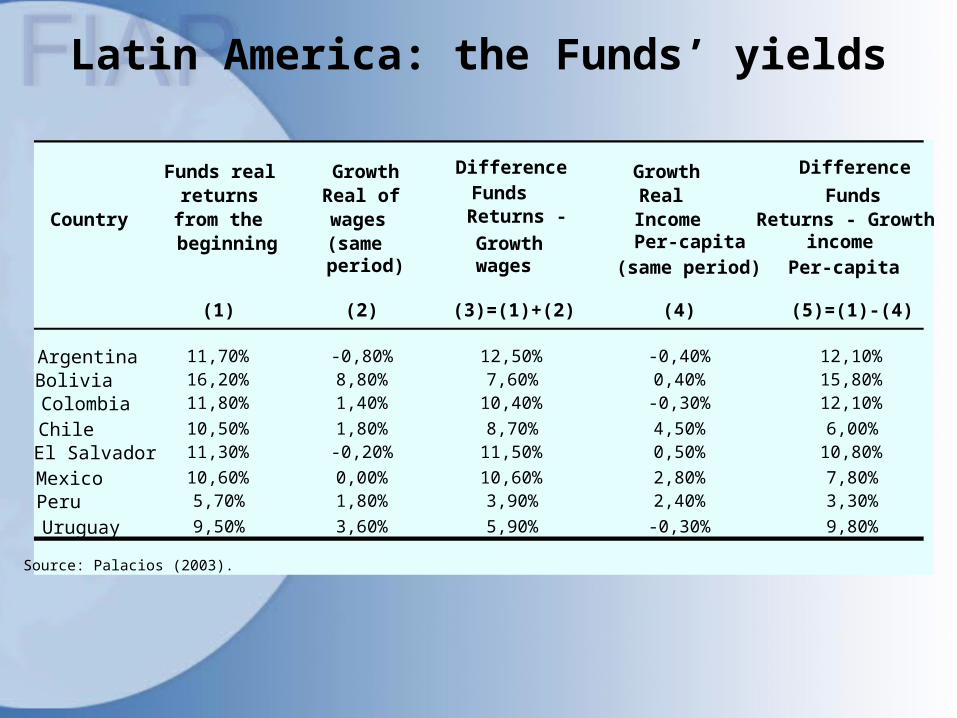
Latin America: the Funds’ yields
Country
Funds real returns
from the beginning
GrowthReal of wages (sameperiod)
Difference Funds Returns -
Growthwages
Growth RealIncomePer-capita
(same period)
Difference
FundsReturns - Growth
income Per-capita
(1) (2) (3)=(1)+(2) (4) (5)=(1)-(4)
Argentina 11,70% -0,80% 12,50% -0,40% 12,10%Bolivia 16,20% 8,80% 7,60% 0,40% 15,80%Colombia 11,80% 1,40% 10,40% -0,30% 12,10%
Chile 10,50% 1,80% 8,70% 4,50% 6,00%El Salvador 11,30% -0,20% 11,50% 0,50% 10,80%
Mexico 10,60% 0,00% 10,60% 2,80% 7,80%Peru 5,70% 1,80% 3,90% 2,40% 3,30%
Uruguay 9,50% 3,60% 5,90% -0,30% 9,80%
Source: Palacios (2003).

IV. Findings
2. The economic impact of the reforms has been very positive. Particularly, the accumulation of pension funds (and of the reserves of life insurance companies) has directly affected:
Savings The development of capital markets The labor market
As a result of these effects, the reforms have contributed to economic growth.
continues...continues...

Chile: economic effects of the reformEffectsEffects SavingsSavings Labor marketLabor market CapitalCapital
marketsmarketsdevelopmedevelopme
ntnt
TotalTotaleffeceffec
tt
IinvestmenIinvestmentsts
EconomicEconomicgrowthgrowth
Chile: (Growth Chile: (Growth Average 1980-Average 1980-2001: 4,6%)2001: 4,6%)
+0,03% +0,03% (Min)(Min)
+0,32% +0,32% (Max)(Max)
EmploymeEmploymentnt
FormalizationFormalization
FactorFactorproductivityproductivity
EconomicEconomicgrowthgrowth
+0,05% +0,05% (Min)(Min)
+0,15% +0,15% (Max)(Max)
FactorFactorproductivityproductivity
EconomicEconomicgrowthgrowth
+0,13% +0,13% (Min)(Min)
+0,27% +0,27% (Max)(Max)
+0,21% +0,21% (Min)(Min)
+0,74% +0,74% (Max)(Max)
Source: Corbo; Schmidt-Hebbel (2003)Source: Corbo; Schmidt-Hebbel (2003)
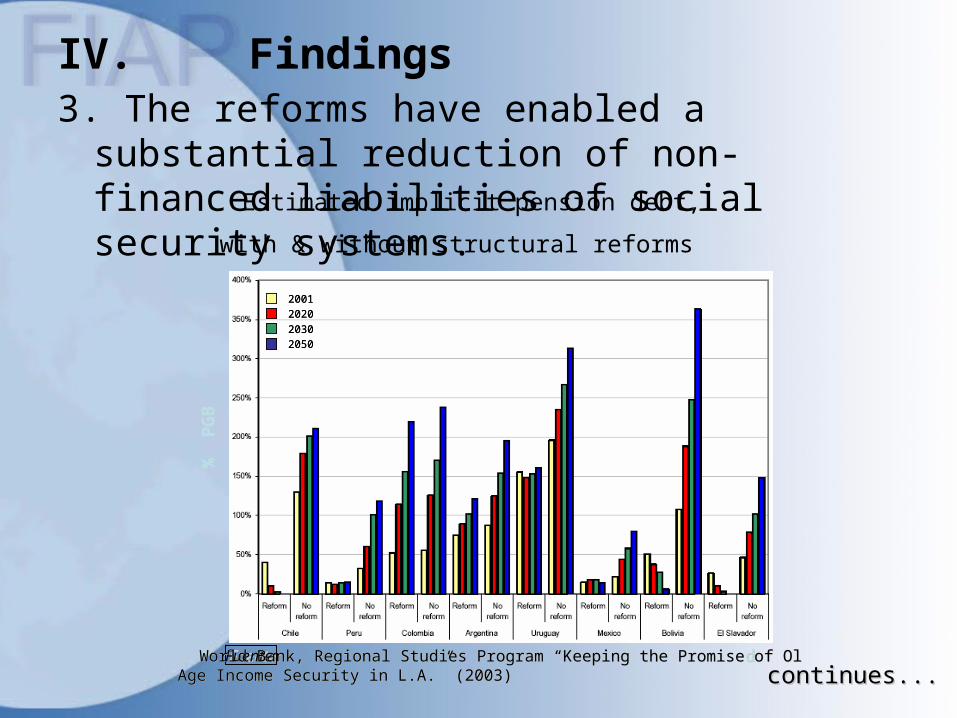
IV. Findings3. The reforms have enabled a substantial reduction of
non-financed liabilities of social security systems.
2001202020302050
Fuente:Fuente:World Bank, Regional Studies Program “Keeping the Promise of OlWorld Bank, Regional Studies Program “Keeping the Promise of Ol d d Age Income Security in L.A.” (2003)Age Income Security in L.A.” (2003)
% P
GB
2001202020302050
2001202020302050
Fuente:Fuente: World Bank, Regional Studies Program “Keeping the Promise of OlWorld Bank, Regional Studies Program “Keeping the Promise of Ol d d Age Income Security in L.A.” (2003)Age Income Security in L.A.” (2003)
% P
GB
Estimated implicit pension debt,
with & without structural reforms
continues...continues...
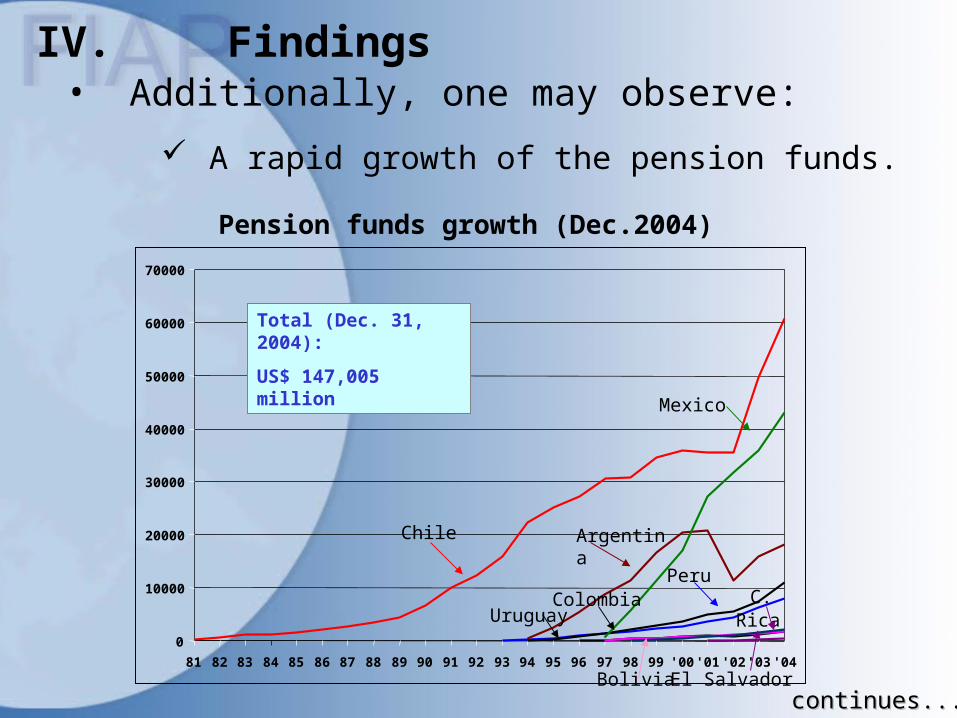
IV. Findings• Additionally, one may observe:
A rapid growth of the pension funds.
0
10000
20000
30000
40000
50000
60000
70000
81 82 83 84 85 86 87 88 89 90 91 92 93 94 95 96 97 98 99 '00 '01 '02 '03 '04
Total (Dec. 31, 2004):
US$ 147,005 million
Chile Argentina
Mexico
PeruColombia
Uruguay C. Rica
El SalvadorBolivia
Pension funds growth (Dec.2004)
continues...continues...
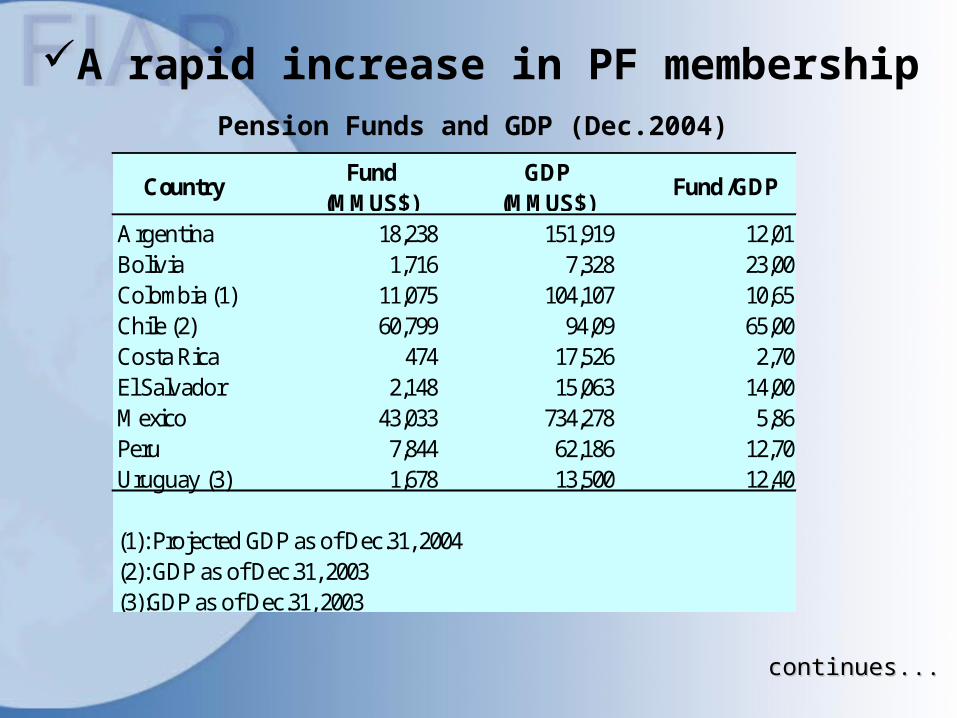
A rapid increase in PF membershipPension Funds and GDP (Dec.2004)
CountryFund
(MMUS$)GDP
(MMUS$)Fund /GDP
Argentina 18,238 151,919 12,01Bolivia 1,716 7,328 23,00Colombia (1) 11,075 104,107 10,65Chile (2) 60,799 94,09 65,00Costa Rica 474 17,526 2,70El Salvador 2,148 15,063 14,00Mexico 43,033 734,278 5,86Peru 7,844 62,186 12,70Uruguay (3) 1,678 13,500 12,40
(1): Projected GDP as of Dec.31, 2004(2): GDP as of Dec.31, 2003(3):GDP as of Dec.31, 2003
continues...continues...
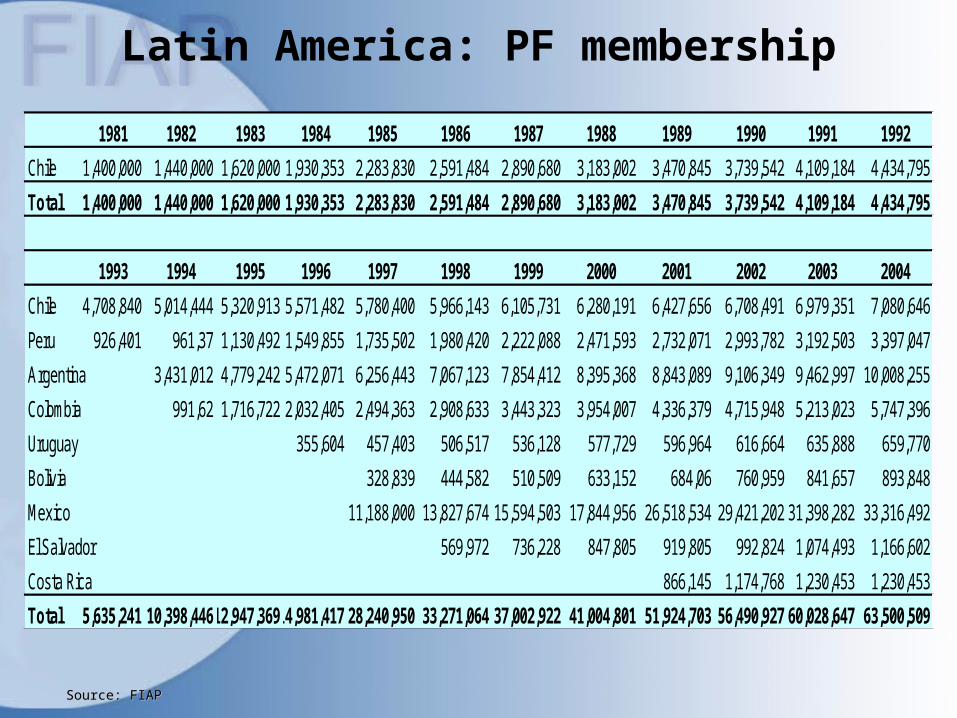
Latin America: PF membership
1981 1982 1983 1984 1985 1986 1987 1988 1989 1990 1991 1992
Chile 1,400,000 1,440,000 1,620,000 1,930,353 2,283,830 2,591,484 2,890,680 3,183,002 3,470,845 3,739,542 4,109,184 4,434,795
Total 1,400,000 1,440,000 1,620,000 1,930,353 2,283,830 2,591,484 2,890,680 3,183,002 3,470,845 3,739,542 4,109,184 4,434,795
1993 1994 1995 1996 1997 1998 1999 2000 2001 2002 2003 2004
Chile 4,708,840 5,014,444 5,320,913 5,571,482 5,780,400 5,966,143 6,105,731 6,280,191 6,427,656 6,708,491 6,979,351 7,080,646
Peru 926,401 961,37 1,130,492 1,549,855 1,735,502 1,980,420 2,222,088 2,471,593 2,732,071 2,993,782 3,192,503 3,397,047
Argentina 3,431,012 4,779,242 5,472,071 6,256,443 7,067,123 7,854,412 8,395,368 8,843,089 9,106,349 9,462,997 10,008,255
Colombia 991,62 1,716,722 2,032,405 2,494,363 2,908,633 3,443,323 3,954,007 4,336,379 4,715,948 5,213,023 5,747,396
Uruguay 355,604 457,403 506,517 536,128 577,729 596,964 616,664 635,888 659,770
Bolivia 328,839 444,582 510,509 633,152 684,06 760,959 841,657 893,848
Mexico 11,188,000 13,827,674 15,594,503 17,844,956 26,518,534 29,421,202 31,398,282 33,316,492
El Salvador 569,972 736,228 847,805 919,805 992,824 1,074,493 1,166,602
Costa Rica 866,145 1,174,768 1,230,453 1,230,453
Total 5,635,241 10,398,44612,947,36914,981,417 28,240,950 33,271,064 37,002,922 41,004,801 51,924,703 56,490,927 60,028,647 63,500,509
Source: FIAPSource: FIAP
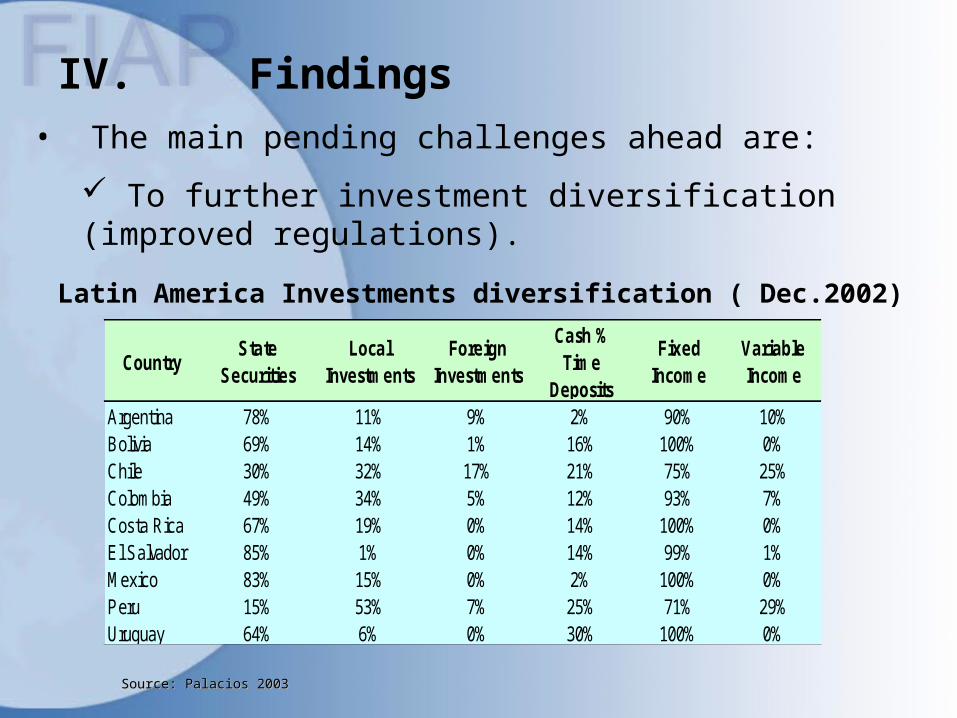
IV. Findings• The main pending challenges ahead are:
To further investment diversification (improved regulations).
Latin America Investments diversification ( Dec.2002)
CountryState
SecuritiesLocal
InvestmentsForeign
Investments
Cash % Time
Deposits
Fixed Income
Variable Income
Argentina 78% 11% 9% 2% 90% 10%Bolivia 69% 14% 1% 16% 100% 0%Chile 30% 32% 17% 21% 75% 25%Colombia 49% 34% 5% 12% 93% 7%Costa Rica 67% 19% 0% 14% 100% 0%El Salvador 85% 1% 0% 14% 99% 1%Mexico 83% 15% 0% 2% 100% 0%Peru 15% 53% 7% 25% 71% 29%Uruguay 64% 6% 0% 30% 100% 0%
Source: Palacios 2003Source: Palacios 2003

To increase the coverage & density of To increase the coverage & density of member contributions (greater labor market member contributions (greater labor market
flexibility)flexibility) Pension system reform coverage has been reformed in Pension system reform coverage has been reformed in a structural waya structural way
Source: Household surveys between 1997 and 2002, analysed by Todd PugatchSource: Household surveys between 1997 and 2002, analysed by Todd Pugatch

V. Lessons derived from the experience…
• Lesson 1:In the long-run, the purely Pay-as-you-go pension systems are not sustainable. The solution to this crisis lies in introducing a capitalization component into social security systems.
• Lesson 2:Introducing capitalization programs is not only necessary – it is also possible.
• Lesson 3:The decisions regarding the design of each Pillar, the relative size of each Program within the Second Pillar; and the Manner in which the new Capitalization Program is introduced are indeed crucial (the gradualism of the reform; a greater relative size of the capitalization program; and the non-competition between programs appear to have been beneficial in most cases).
continues...continues...

V. Lessons derived from the experience.
• Lesson 4:The detailed design of the Capitalization Program requires the maximum attention (although capitalization programs can be designed in many forms, not all of them yield the same results).
• Lesson 5:Pension fund investment regulations must promote the diversification of portfolios and avoid forced investments (or “earmarked investments”).
• Lesson 6:In order to maximize the positive economic impact of a pension system reform, it should be closely coordinated with a capital markets reform (and, eventually, tax and labor market reforms).
• Lesson 7:An effective & independent supervision of the various programs is crucial for the success of all pension reforms.