Embed Size (px)
Citation preview
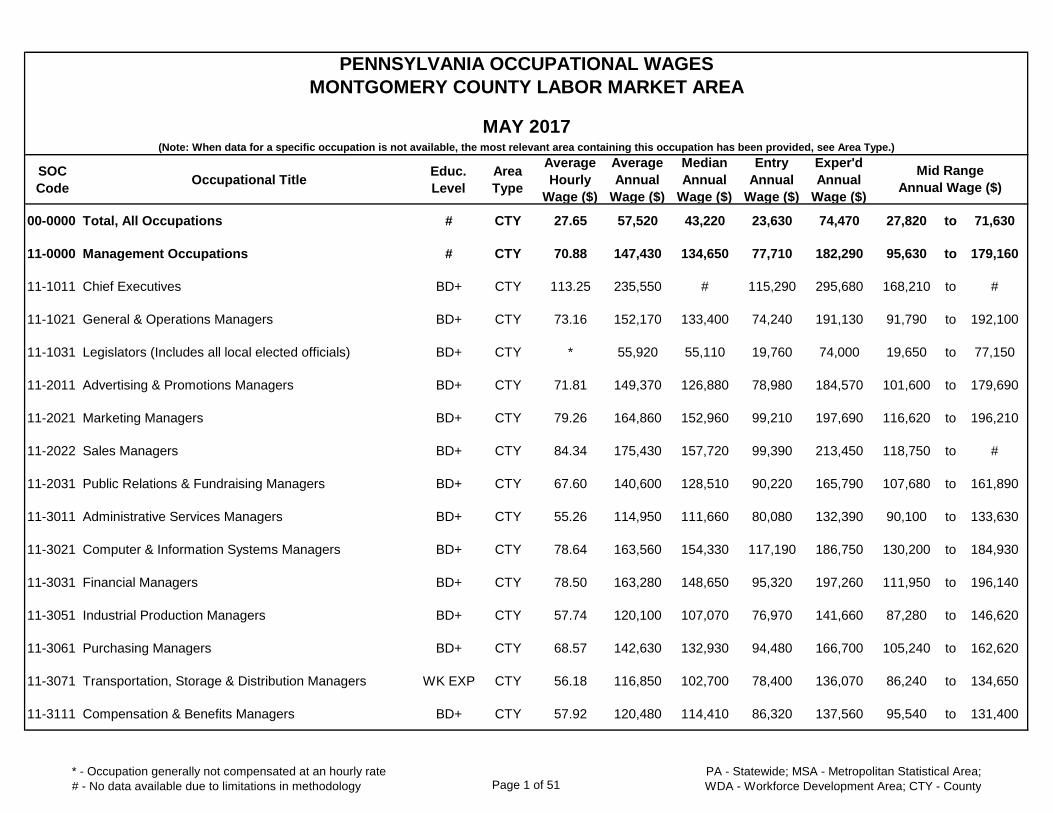
SOC
CodeOccupational Title
Educ.
Level
Area
Type
Average
Hourly
Wage ($)
Average
Annual
Wage ($)
Median
Annual
Wage ($)
Entry
Annual
Wage ($)
Exper'd
Annual
Wage ($)
00-0000 Total, All Occupations # CTY 27.65 57,520 43,220 23,630 74,470 27,820 to 71,630
11-0000 Management Occupations # CTY 70.88 147,430 134,650 77,710 182,290 95,630 to 179,160
11-1011 Chief Executives BD+ CTY 113.25 235,550 # 115,290 295,680 168,210 to #
11-1021 General & Operations Managers BD+ CTY 73.16 152,170 133,400 74,240 191,130 91,790 to 192,100
11-1031 Legislators (Includes all local elected officials) BD+ CTY * 55,920 55,110 19,760 74,000 19,650 to 77,150
11-2011 Advertising & Promotions Managers BD+ CTY 71.81 149,370 126,880 78,980 184,570 101,600 to 179,690
11-2021 Marketing Managers BD+ CTY 79.26 164,860 152,960 99,210 197,690 116,620 to 196,210
11-2022 Sales Managers BD+ CTY 84.34 175,430 157,720 99,390 213,450 118,750 to #
11-2031 Public Relations & Fundraising Managers BD+ CTY 67.60 140,600 128,510 90,220 165,790 107,680 to 161,890
11-3011 Administrative Services Managers BD+ CTY 55.26 114,950 111,660 80,080 132,390 90,100 to 133,630
11-3021 Computer & Information Systems Managers BD+ CTY 78.64 163,560 154,330 117,190 186,750 130,200 to 184,930
11-3031 Financial Managers BD+ CTY 78.50 163,280 148,650 95,320 197,260 111,950 to 196,140
11-3051 Industrial Production Managers BD+ CTY 57.74 120,100 107,070 76,970 141,660 87,280 to 146,620
11-3061 Purchasing Managers BD+ CTY 68.57 142,630 132,930 94,480 166,700 105,240 to 162,620
11-3071 Transportation, Storage & Distribution Managers WK EXP CTY 56.18 116,850 102,700 78,400 136,070 86,240 to 134,650
11-3111 Compensation & Benefits Managers BD+ CTY 57.92 120,480 114,410 86,320 137,560 95,540 to 131,400
PENNSYLVANIA OCCUPATIONAL WAGES
MONTGOMERY COUNTY LABOR MARKET AREA
MAY 2017(Note: When data for a specific occupation is not available, the most relevant area containing this occupation has been provided, see Area Type.)
Mid Range
Annual Wage ($)
* - Occupation generally not compensated at an hourly rate
# - No data available due to limitations in methodology Page 1 of 51PA - Statewide; MSA - Metropolitan Statistical Area;
WDA - Workforce Development Area; CTY - County
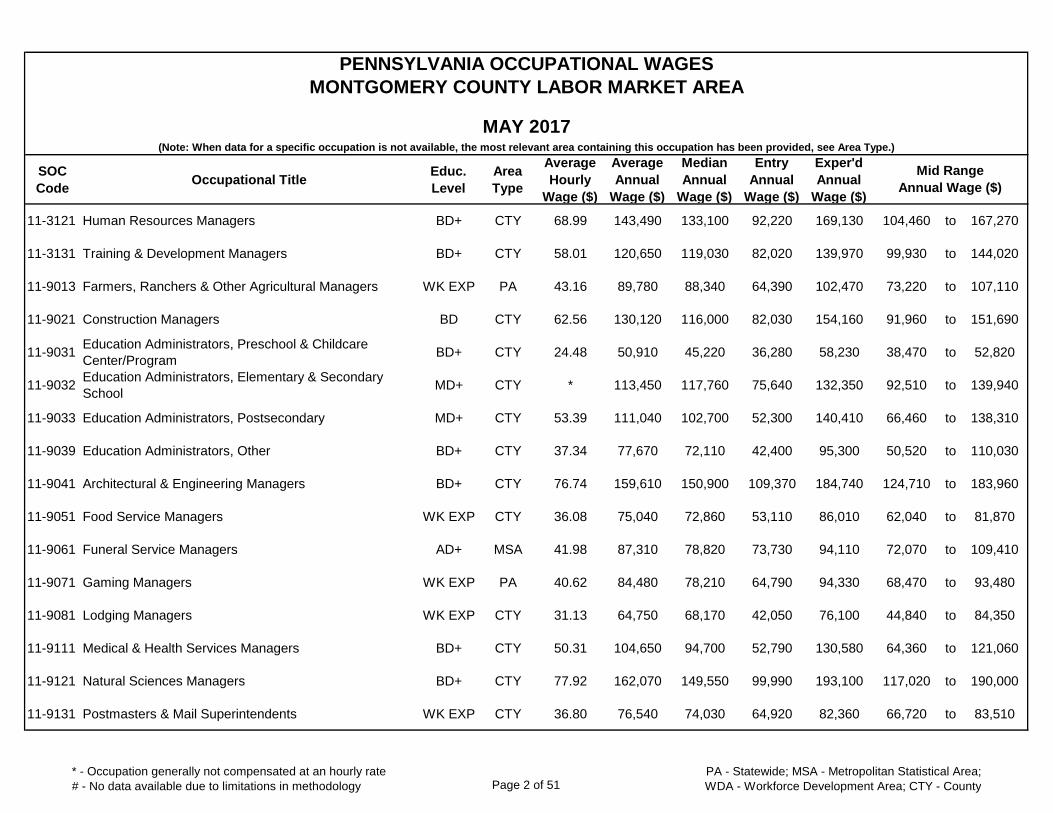
SOC
CodeOccupational Title
Educ.
Level
Area
Type
Average
Hourly
Wage ($)
Average
Annual
Wage ($)
Median
Annual
Wage ($)
Entry
Annual
Wage ($)
Exper'd
Annual
Wage ($)
PENNSYLVANIA OCCUPATIONAL WAGES
MONTGOMERY COUNTY LABOR MARKET AREA
MAY 2017(Note: When data for a specific occupation is not available, the most relevant area containing this occupation has been provided, see Area Type.)
Mid Range
Annual Wage ($)
11-3121 Human Resources Managers BD+ CTY 68.99 143,490 133,100 92,220 169,130 104,460 to 167,270
11-3131 Training & Development Managers BD+ CTY 58.01 120,650 119,030 82,020 139,970 99,930 to 144,020
11-9013 Farmers, Ranchers & Other Agricultural Managers WK EXP PA 43.16 89,780 88,340 64,390 102,470 73,220 to 107,110
11-9021 Construction Managers BD CTY 62.56 130,120 116,000 82,030 154,160 91,960 to 151,690
11-9031Education Administrators, Preschool & Childcare
Center/ProgramBD+ CTY 24.48 50,910 45,220 36,280 58,230 38,470 to 52,820
11-9032Education Administrators, Elementary & Secondary
SchoolMD+ CTY * 113,450 117,760 75,640 132,350 92,510 to 139,940
11-9033 Education Administrators, Postsecondary MD+ CTY 53.39 111,040 102,700 52,300 140,410 66,460 to 138,310
11-9039 Education Administrators, Other BD+ CTY 37.34 77,670 72,110 42,400 95,300 50,520 to 110,030
11-9041 Architectural & Engineering Managers BD+ CTY 76.74 159,610 150,900 109,370 184,740 124,710 to 183,960
11-9051 Food Service Managers WK EXP CTY 36.08 75,040 72,860 53,110 86,010 62,040 to 81,870
11-9061 Funeral Service Managers AD+ MSA 41.98 87,310 78,820 73,730 94,110 72,070 to 109,410
11-9071 Gaming Managers WK EXP PA 40.62 84,480 78,210 64,790 94,330 68,470 to 93,480
11-9081 Lodging Managers WK EXP CTY 31.13 64,750 68,170 42,050 76,100 44,840 to 84,350
11-9111 Medical & Health Services Managers BD+ CTY 50.31 104,650 94,700 52,790 130,580 64,360 to 121,060
11-9121 Natural Sciences Managers BD+ CTY 77.92 162,070 149,550 99,990 193,100 117,020 to 190,000
11-9131 Postmasters & Mail Superintendents WK EXP CTY 36.80 76,540 74,030 64,920 82,360 66,720 to 83,510
* - Occupation generally not compensated at an hourly rate
# - No data available due to limitations in methodology Page 2 of 51PA - Statewide; MSA - Metropolitan Statistical Area;
WDA - Workforce Development Area; CTY - County
SOC
CodeOccupational Title
Educ.
Level
Area
Type
Average
Hourly
Wage ($)
Average
Annual
Wage ($)
Median
Annual
Wage ($)
Entry
Annual
Wage ($)
Exper'd
Annual
Wage ($)
PENNSYLVANIA OCCUPATIONAL WAGES
MONTGOMERY COUNTY LABOR MARKET AREA
MAY 2017(Note: When data for a specific occupation is not available, the most relevant area containing this occupation has been provided, see Area Type.)
Mid Range
Annual Wage ($)
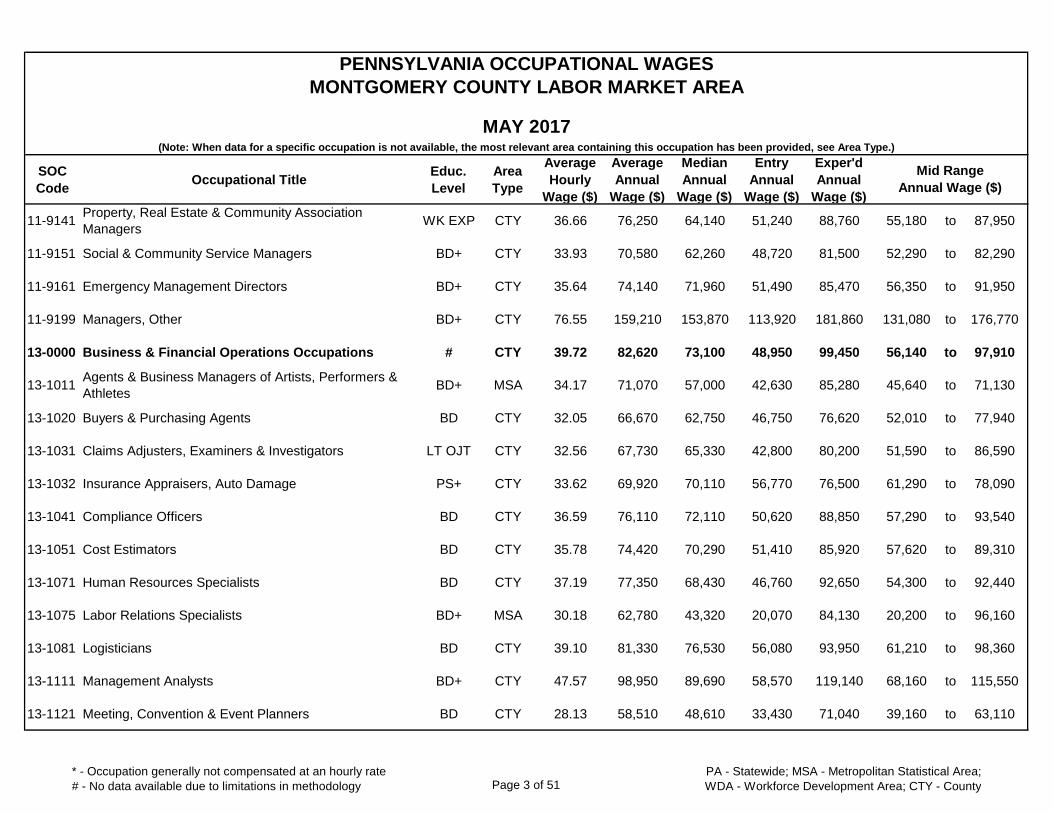
11-9141Property, Real Estate & Community Association
ManagersWK EXP CTY 36.66 76,250 64,140 51,240 88,760 55,180 to 87,950
11-9151 Social & Community Service Managers BD+ CTY 33.93 70,580 62,260 48,720 81,500 52,290 to 82,290
11-9161 Emergency Management Directors BD+ CTY 35.64 74,140 71,960 51,490 85,470 56,350 to 91,950
11-9199 Managers, Other BD+ CTY 76.55 159,210 153,870 113,920 181,860 131,080 to 176,770
13-0000 Business & Financial Operations Occupations # CTY 39.72 82,620 73,100 48,950 99,450 56,140 to 97,910
13-1011Agents & Business Managers of Artists, Performers &
AthletesBD+ MSA 34.17 71,070 57,000 42,630 85,280 45,640 to 71,130
13-1020 Buyers & Purchasing Agents BD CTY 32.05 66,670 62,750 46,750 76,620 52,010 to 77,940
13-1031 Claims Adjusters, Examiners & Investigators LT OJT CTY 32.56 67,730 65,330 42,800 80,200 51,590 to 86,590
13-1032 Insurance Appraisers, Auto Damage PS+ CTY 33.62 69,920 70,110 56,770 76,500 61,290 to 78,090
13-1041 Compliance Officers BD CTY 36.59 76,110 72,110 50,620 88,850 57,290 to 93,540
13-1051 Cost Estimators BD CTY 35.78 74,420 70,290 51,410 85,920 57,620 to 89,310
13-1071 Human Resources Specialists BD CTY 37.19 77,350 68,430 46,760 92,650 54,300 to 92,440
13-1075 Labor Relations Specialists BD+ MSA 30.18 62,780 43,320 20,070 84,130 20,200 to 96,160
13-1081 Logisticians BD CTY 39.10 81,330 76,530 56,080 93,950 61,210 to 98,360
13-1111 Management Analysts BD+ CTY 47.57 98,950 89,690 58,570 119,140 68,160 to 115,550
13-1121 Meeting, Convention & Event Planners BD CTY 28.13 58,510 48,610 33,430 71,040 39,160 to 63,110
* - Occupation generally not compensated at an hourly rate
# - No data available due to limitations in methodology Page 3 of 51PA - Statewide; MSA - Metropolitan Statistical Area;
WDA - Workforce Development Area; CTY - County

SOC
CodeOccupational Title
Educ.
Level
Area
Type
Average
Hourly
Wage ($)
Average
Annual
Wage ($)
Median
Annual
Wage ($)
Entry
Annual
Wage ($)
Exper'd
Annual
Wage ($)
PENNSYLVANIA OCCUPATIONAL WAGES
MONTGOMERY COUNTY LABOR MARKET AREA
MAY 2017(Note: When data for a specific occupation is not available, the most relevant area containing this occupation has been provided, see Area Type.)
Mid Range
Annual Wage ($)
13-1131 Fundraisers BD CTY 34.05 70,820 60,640 38,810 86,830 46,260 to 89,760
13-1141 Compensation, Benefits & Job Analysis Specialists BD+ CTY 31.32 65,150 65,400 41,120 77,160 45,930 to 78,130
13-1151 Training & Development Specialists BD+ CTY 35.15 73,110 66,520 47,260 86,040 53,120 to 88,010
13-1161 Market Research Analysts & Marketing Specialists BD CTY 37.31 77,600 69,760 45,830 93,490 53,500 to 95,480
13-1199 Business Operations Specialists, Other BD CTY 43.83 91,160 86,970 59,060 107,210 66,980 to 109,940
13-2011 Accountants & Auditors BD CTY 38.90 80,920 72,670 51,850 95,460 57,520 to 94,920
13-2021 Appraisers & Assessors of Real Estate BD+ CTY 37.14 77,250 86,010 51,750 90,000 57,090 to 95,220
13-2031 Budget Analysts BD CTY 36.93 76,810 75,920 59,020 85,710 64,940 to 90,130
13-2041 Credit Analysts BD CTY 36.22 75,330 67,500 50,630 87,680 55,580 to 94,190
13-2051 Financial Analysts BD CTY 46.29 96,280 78,850 54,900 116,960 61,060 to 107,850
13-2052 Personal Financial Advisors BD+ CTY 59.49 123,750 88,320 49,430 160,910 58,560 to 156,860
13-2053 Insurance Underwriters BD CTY 36.15 75,180 69,620 51,370 87,090 56,890 to 89,030
13-2061 Financial Examiners BD+ CTY 51.10 106,290 94,280 65,600 126,640 72,320 to 136,210
13-2071 Credit Counselors BD CTY 32.90 68,440 61,850 42,220 81,540 47,190 to 81,510
13-2072 Loan Officers BD CTY 39.86 82,910 69,400 42,760 102,990 51,660 to 97,100
13-2081 Tax Examiners & Collectors & Revenue Agents BD CTY 38.97 81,060 87,810 46,440 98,370 57,820 to 107,770
* - Occupation generally not compensated at an hourly rate
# - No data available due to limitations in methodology Page 4 of 51PA - Statewide; MSA - Metropolitan Statistical Area;
WDA - Workforce Development Area; CTY - County
SOC
CodeOccupational Title
Educ.
Level
Area
Type
Average
Hourly
Wage ($)
Average
Annual
Wage ($)
Median
Annual
Wage ($)
Entry
Annual
Wage ($)
Exper'd
Annual
Wage ($)
PENNSYLVANIA OCCUPATIONAL WAGES
MONTGOMERY COUNTY LABOR MARKET AREA
MAY 2017(Note: When data for a specific occupation is not available, the most relevant area containing this occupation has been provided, see Area Type.)
Mid Range
Annual Wage ($)
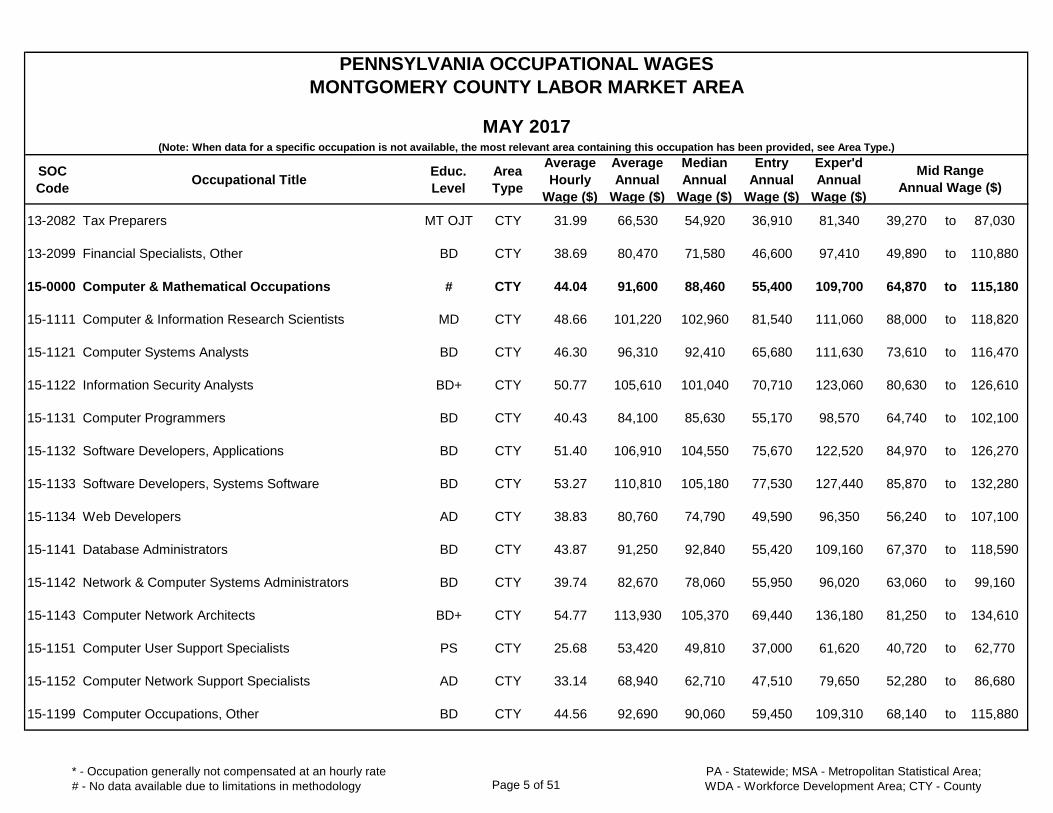
13-2082 Tax Preparers MT OJT CTY 31.99 66,530 54,920 36,910 81,340 39,270 to 87,030
13-2099 Financial Specialists, Other BD CTY 38.69 80,470 71,580 46,600 97,410 49,890 to 110,880
15-0000 Computer & Mathematical Occupations # CTY 44.04 91,600 88,460 55,400 109,700 64,870 to 115,180
15-1111 Computer & Information Research Scientists MD CTY 48.66 101,220 102,960 81,540 111,060 88,000 to 118,820
15-1121 Computer Systems Analysts BD CTY 46.30 96,310 92,410 65,680 111,630 73,610 to 116,470
15-1122 Information Security Analysts BD+ CTY 50.77 105,610 101,040 70,710 123,060 80,630 to 126,610
15-1131 Computer Programmers BD CTY 40.43 84,100 85,630 55,170 98,570 64,740 to 102,100
15-1132 Software Developers, Applications BD CTY 51.40 106,910 104,550 75,670 122,520 84,970 to 126,270
15-1133 Software Developers, Systems Software BD CTY 53.27 110,810 105,180 77,530 127,440 85,870 to 132,280
15-1134 Web Developers AD CTY 38.83 80,760 74,790 49,590 96,350 56,240 to 107,100
15-1141 Database Administrators BD CTY 43.87 91,250 92,840 55,420 109,160 67,370 to 118,590
15-1142 Network & Computer Systems Administrators BD CTY 39.74 82,670 78,060 55,950 96,020 63,060 to 99,160
15-1143 Computer Network Architects BD+ CTY 54.77 113,930 105,370 69,440 136,180 81,250 to 134,610
15-1151 Computer User Support Specialists PS CTY 25.68 53,420 49,810 37,000 61,620 40,720 to 62,770
15-1152 Computer Network Support Specialists AD CTY 33.14 68,940 62,710 47,510 79,650 52,280 to 86,680
15-1199 Computer Occupations, Other BD CTY 44.56 92,690 90,060 59,450 109,310 68,140 to 115,880
* - Occupation generally not compensated at an hourly rate
# - No data available due to limitations in methodology Page 5 of 51PA - Statewide; MSA - Metropolitan Statistical Area;
WDA - Workforce Development Area; CTY - County
SOC
CodeOccupational Title
Educ.
Level
Area
Type
Average
Hourly
Wage ($)
Average
Annual
Wage ($)
Median
Annual
Wage ($)
Entry
Annual
Wage ($)
Exper'd
Annual
Wage ($)
PENNSYLVANIA OCCUPATIONAL WAGES
MONTGOMERY COUNTY LABOR MARKET AREA
MAY 2017(Note: When data for a specific occupation is not available, the most relevant area containing this occupation has been provided, see Area Type.)
Mid Range
Annual Wage ($)
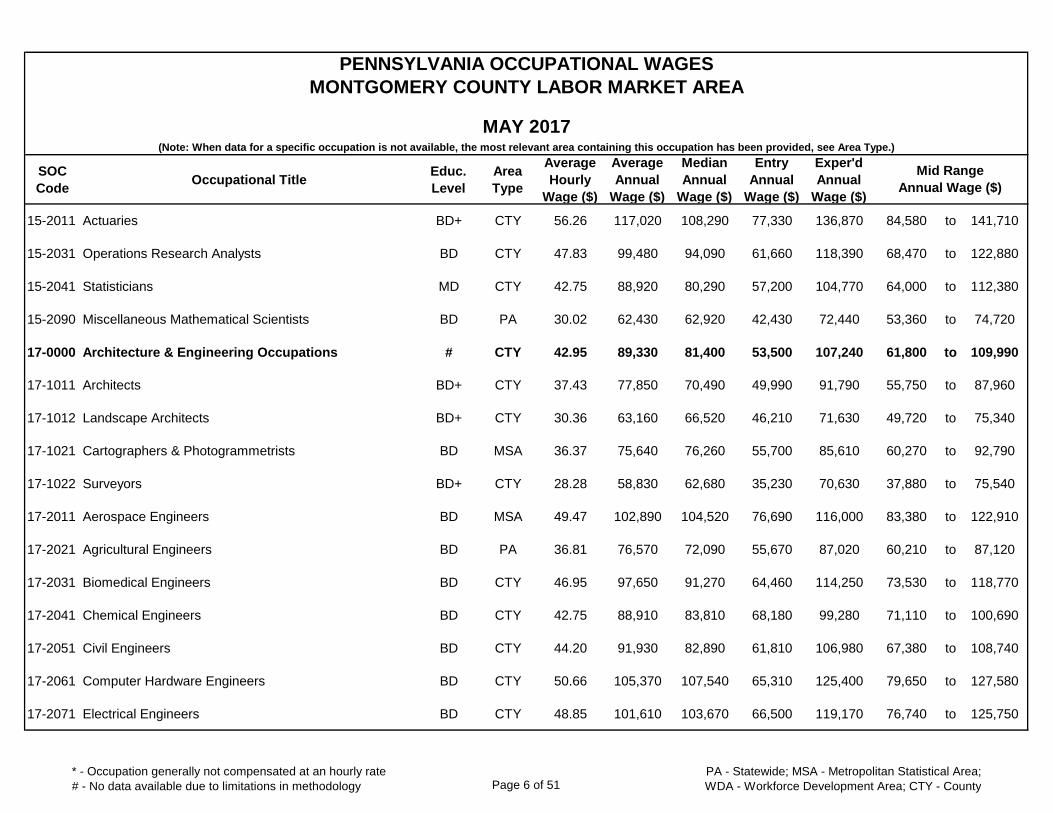
15-2011 Actuaries BD+ CTY 56.26 117,020 108,290 77,330 136,870 84,580 to 141,710
15-2031 Operations Research Analysts BD CTY 47.83 99,480 94,090 61,660 118,390 68,470 to 122,880
15-2041 Statisticians MD CTY 42.75 88,920 80,290 57,200 104,770 64,000 to 112,380
15-2090 Miscellaneous Mathematical Scientists BD PA 30.02 62,430 62,920 42,430 72,440 53,360 to 74,720
17-0000 Architecture & Engineering Occupations # CTY 42.95 89,330 81,400 53,500 107,240 61,800 to 109,990
17-1011 Architects BD+ CTY 37.43 77,850 70,490 49,990 91,790 55,750 to 87,960
17-1012 Landscape Architects BD+ CTY 30.36 63,160 66,520 46,210 71,630 49,720 to 75,340
17-1021 Cartographers & Photogrammetrists BD MSA 36.37 75,640 76,260 55,700 85,610 60,270 to 92,790
17-1022 Surveyors BD+ CTY 28.28 58,830 62,680 35,230 70,630 37,880 to 75,540
17-2011 Aerospace Engineers BD MSA 49.47 102,890 104,520 76,690 116,000 83,380 to 122,910
17-2021 Agricultural Engineers BD PA 36.81 76,570 72,090 55,670 87,020 60,210 to 87,120
17-2031 Biomedical Engineers BD CTY 46.95 97,650 91,270 64,460 114,250 73,530 to 118,770
17-2041 Chemical Engineers BD CTY 42.75 88,910 83,810 68,180 99,280 71,110 to 100,690
17-2051 Civil Engineers BD CTY 44.20 91,930 82,890 61,810 106,980 67,380 to 108,740
17-2061 Computer Hardware Engineers BD CTY 50.66 105,370 107,540 65,310 125,400 79,650 to 127,580
17-2071 Electrical Engineers BD CTY 48.85 101,610 103,670 66,500 119,170 76,740 to 125,750
* - Occupation generally not compensated at an hourly rate
# - No data available due to limitations in methodology Page 6 of 51PA - Statewide; MSA - Metropolitan Statistical Area;
WDA - Workforce Development Area; CTY - County
SOC
CodeOccupational Title
Educ.
Level
Area
Type
Average
Hourly
Wage ($)
Average
Annual
Wage ($)
Median
Annual
Wage ($)
Entry
Annual
Wage ($)
Exper'd
Annual
Wage ($)
PENNSYLVANIA OCCUPATIONAL WAGES
MONTGOMERY COUNTY LABOR MARKET AREA
MAY 2017(Note: When data for a specific occupation is not available, the most relevant area containing this occupation has been provided, see Area Type.)
Mid Range
Annual Wage ($)
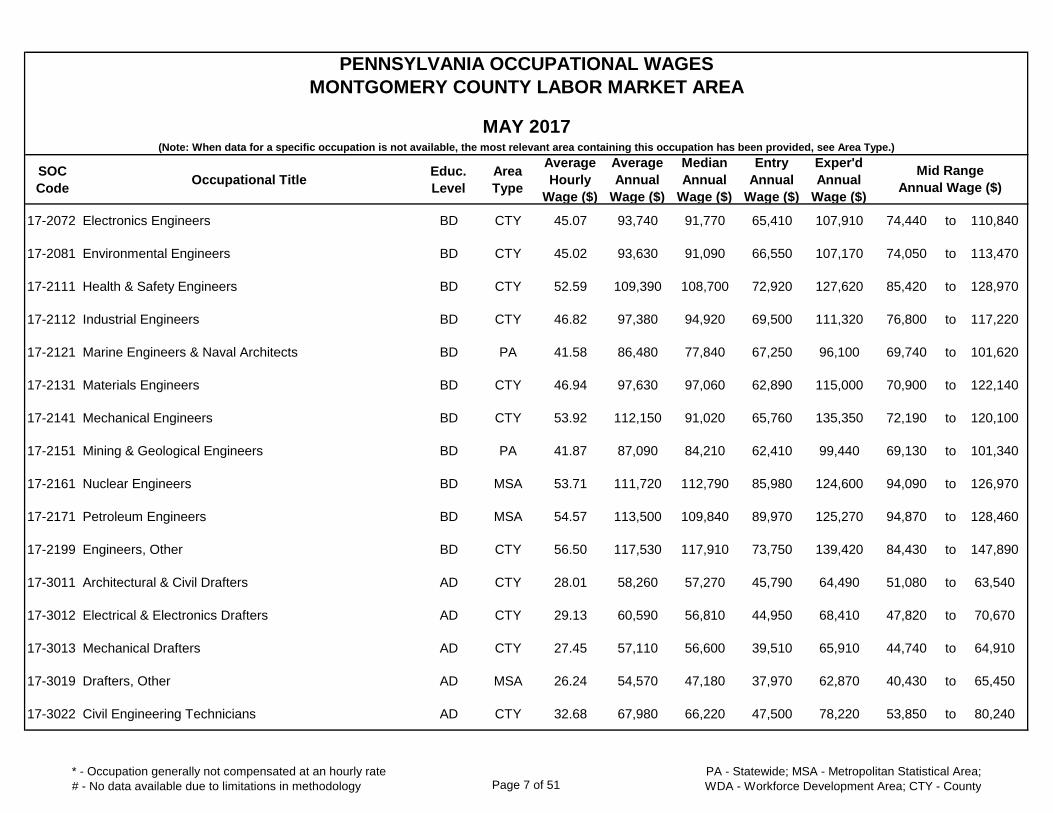
17-2072 Electronics Engineers BD CTY 45.07 93,740 91,770 65,410 107,910 74,440 to 110,840
17-2081 Environmental Engineers BD CTY 45.02 93,630 91,090 66,550 107,170 74,050 to 113,470
17-2111 Health & Safety Engineers BD CTY 52.59 109,390 108,700 72,920 127,620 85,420 to 128,970
17-2112 Industrial Engineers BD CTY 46.82 97,380 94,920 69,500 111,320 76,800 to 117,220
17-2121 Marine Engineers & Naval Architects BD PA 41.58 86,480 77,840 67,250 96,100 69,740 to 101,620
17-2131 Materials Engineers BD CTY 46.94 97,630 97,060 62,890 115,000 70,900 to 122,140
17-2141 Mechanical Engineers BD CTY 53.92 112,150 91,020 65,760 135,350 72,190 to 120,100
17-2151 Mining & Geological Engineers BD PA 41.87 87,090 84,210 62,410 99,440 69,130 to 101,340
17-2161 Nuclear Engineers BD MSA 53.71 111,720 112,790 85,980 124,600 94,090 to 126,970
17-2171 Petroleum Engineers BD MSA 54.57 113,500 109,840 89,970 125,270 94,870 to 128,460
17-2199 Engineers, Other BD CTY 56.50 117,530 117,910 73,750 139,420 84,430 to 147,890
17-3011 Architectural & Civil Drafters AD CTY 28.01 58,260 57,270 45,790 64,490 51,080 to 63,540
17-3012 Electrical & Electronics Drafters AD CTY 29.13 60,590 56,810 44,950 68,410 47,820 to 70,670
17-3013 Mechanical Drafters AD CTY 27.45 57,110 56,600 39,510 65,910 44,740 to 64,910
17-3019 Drafters, Other AD MSA 26.24 54,570 47,180 37,970 62,870 40,430 to 65,450
17-3022 Civil Engineering Technicians AD CTY 32.68 67,980 66,220 47,500 78,220 53,850 to 80,240
* - Occupation generally not compensated at an hourly rate
# - No data available due to limitations in methodology Page 7 of 51PA - Statewide; MSA - Metropolitan Statistical Area;
WDA - Workforce Development Area; CTY - County
SOC
CodeOccupational Title
Educ.
Level
Area
Type
Average
Hourly
Wage ($)
Average
Annual
Wage ($)
Median
Annual
Wage ($)
Entry
Annual
Wage ($)
Exper'd
Annual
Wage ($)
PENNSYLVANIA OCCUPATIONAL WAGES
MONTGOMERY COUNTY LABOR MARKET AREA
MAY 2017(Note: When data for a specific occupation is not available, the most relevant area containing this occupation has been provided, see Area Type.)
Mid Range
Annual Wage ($)
17-3023 Electrical & Electronic Engineering Technicians AD CTY 25.18 52,370 50,030 35,690 60,700 39,590 to 61,530
17-3024 Electro-Mechanical Technicians AD CTY 24.79 51,560 51,190 36,300 59,190 40,680 to 61,820
17-3025 Environmental Engineering Technicians AD CTY 23.50 48,880 45,250 32,020 57,310 35,650 to 60,720
17-3026 Industrial Engineering Technicians AD CTY 27.36 56,910 51,950 40,180 65,270 44,070 to 63,570
17-3027 Mechanical Engineering Technicians AD CTY 28.25 58,760 57,970 42,200 67,050 47,250 to 69,470
17-3029 Engineering Technicians, Other AD CTY 29.31 60,960 57,860 39,780 71,560 46,290 to 72,290
17-3031 Surveying & Mapping Technicians MT OJT CTY 26.80 55,750 56,560 43,900 61,680 47,500 to 62,340
19-0000 Life, Physical & Social Science Occupations # CTY 41.92 87,190 79,180 47,500 107,030 56,560 to 105,690
19-1011 Animal Scientists BD PA 25.77 53,610 53,450 29,020 65,900 30,660 to 69,330
19-1012 Food Scientists & Technologists BD CTY 33.35 69,370 68,740 44,440 81,840 52,020 to 89,390
19-1013 Soil & Plant Scientists BD MSA 36.77 76,490 53,220 40,050 94,710 42,830 to 117,020
19-1021 Biochemists & Biophysicists PhD CTY 43.49 90,470 80,770 54,640 108,380 61,290 to 105,370
19-1022 Microbiologists BD CTY 42.94 89,310 82,220 55,140 106,400 61,650 to 117,830
19-1023 Zoologists & Wildlife Biologists BD PA 32.31 67,200 62,400 49,070 76,270 53,270 to 78,260
19-1029 Biological Scientists, Other BD CTY 38.15 79,350 74,730 48,580 94,740 51,660 to 94,450
19-1031 Conservation Scientists BD CTY 22.29 46,370 39,800 27,890 55,610 29,510 to 57,480
* - Occupation generally not compensated at an hourly rate
# - No data available due to limitations in methodology Page 8 of 51PA - Statewide; MSA - Metropolitan Statistical Area;
WDA - Workforce Development Area; CTY - County
SOC
CodeOccupational Title
Educ.
Level
Area
Type
Average
Hourly
Wage ($)
Average
Annual
Wage ($)
Median
Annual
Wage ($)
Entry
Annual
Wage ($)
Exper'd
Annual
Wage ($)
PENNSYLVANIA OCCUPATIONAL WAGES
MONTGOMERY COUNTY LABOR MARKET AREA
MAY 2017(Note: When data for a specific occupation is not available, the most relevant area containing this occupation has been provided, see Area Type.)
Mid Range
Annual Wage ($)
19-1032 Foresters BD PA 32.95 68,530 67,600 53,970 75,820 60,590 to 78,920
19-1041 Epidemiologists MD PA 37.88 78,790 69,030 49,010 93,680 55,910 to 82,010
19-1042 Medical Scientists PhD CTY 53.39 111,060 101,600 72,060 130,560 81,240 to 129,870
19-1099 Life Scientists, Other BD MSA 39.40 81,950 76,350 51,990 96,930 57,430 to 100,040
19-2012 Physicists PhD CTY 67.64 140,680 123,460 102,070 159,990 113,950 to 166,800
19-2021 Atmospheric & Space Scientists BD PA 47.83 99,480 96,680 82,230 108,110 87,250 to 111,560
19-2031 Chemists BD CTY 36.42 75,760 69,210 47,950 89,660 52,530 to 87,810
19-2032 Materials Scientists BD CTY 45.19 93,990 93,550 69,330 106,310 78,410 to 106,120
19-2041 Environmental Scientists & Specialists BD CTY 34.51 71,790 63,410 49,950 82,700 54,420 to 83,330
19-2042 Geoscientists BD CTY 40.60 84,450 77,310 61,730 95,810 66,190 to 96,880
19-2099 Physical Scientists, Other BD MSA 70.54 146,720 120,890 62,830 188,660 81,790 to 186,330
19-3011 Economists MD CTY 66.04 137,350 135,940 78,810 166,630 94,670 to 187,330
19-3022 Survey Researchers MD MSA 28.92 60,150 55,470 40,950 69,750 44,690 to 71,840
19-3031 Clinical, Counseling & School Psychologists PhD CTY 39.75 82,680 81,810 63,480 92,280 70,230 to 95,870
19-3032 Industrial-Organizational Psychologists MD+ PA 43.82 91,140 74,460 49,010 112,200 54,840 to 119,160
19-3039 Psychologists, Other MD+ CTY 39.70 82,580 79,460 74,590 86,570 72,850 to 91,970
* - Occupation generally not compensated at an hourly rate
# - No data available due to limitations in methodology Page 9 of 51PA - Statewide; MSA - Metropolitan Statistical Area;
WDA - Workforce Development Area; CTY - County
SOC
CodeOccupational Title
Educ.
Level
Area
Type
Average
Hourly
Wage ($)
Average
Annual
Wage ($)
Median
Annual
Wage ($)
Entry
Annual
Wage ($)
Exper'd
Annual
Wage ($)
PENNSYLVANIA OCCUPATIONAL WAGES
MONTGOMERY COUNTY LABOR MARKET AREA
MAY 2017(Note: When data for a specific occupation is not available, the most relevant area containing this occupation has been provided, see Area Type.)
Mid Range
Annual Wage ($)
19-3041 Sociologists MD PA 49.66 103,280 97,570 58,930 125,460 63,480 to 136,970
19-3051 Urban & Regional Planners MD CTY 36.27 75,430 75,970 50,960 87,670 57,030 to 93,300
19-3091 Anthropologists & Archeologists MD CTY 32.03 66,620 62,920 44,720 77,570 47,340 to 76,050
19-3092 Geographers BD PA 37.03 77,020 81,320 47,300 91,870 61,690 to 101,010
19-3093 Historians MD CTY 27.20 56,570 54,270 44,830 62,440 46,700 to 64,890
19-3099 Social Scientists & Related Workers, Other BD CTY 43.73 90,960 90,630 59,700 106,590 69,150 to 120,000
19-4011 Agricultural & Food Science Technicians AD+ MSA 16.61 34,540 33,090 25,240 39,190 27,390 to 38,520
19-4021 Biological Technicians BD CTY 25.03 52,060 49,330 35,150 60,510 39,240 to 62,520
19-4031 Chemical Technicians AD+ CTY 21.72 45,180 43,490 31,330 52,110 34,820 to 51,870
19-4041 Geological & Petroleum Technicians AD+ PA 24.47 50,900 46,470 28,510 62,100 31,860 to 63,160
19-4051 Nuclear Technicians AD+ PA 42.27 87,930 91,280 66,160 98,810 79,120 to 100,770
19-4061 Social Science Research Assistants BD CTY 21.72 45,180 42,970 32,000 51,770 34,520 to 53,810
19-4091 Environmental Science & Protection Technicians AD CTY 22.67 47,140 46,390 32,430 54,500 38,080 to 57,950
19-4092 Forensic Science Technicians BD CTY 21.38 44,470 43,210 31,910 50,750 34,850 to 50,060
19-4093 Forest & Conservation Technicians AD PA 22.72 47,260 48,570 33,870 53,950 38,840 to 54,220
19-4099 Life, Physical & Social Science Technicians, Other AD CTY 24.83 51,650 50,940 31,500 61,730 35,760 to 67,510
* - Occupation generally not compensated at an hourly rate
# - No data available due to limitations in methodology Page 10 of 51PA - Statewide; MSA - Metropolitan Statistical Area;
WDA - Workforce Development Area; CTY - County
SOC
CodeOccupational Title
Educ.
Level
Area
Type
Average
Hourly
Wage ($)
Average
Annual
Wage ($)
Median
Annual
Wage ($)
Entry
Annual
Wage ($)
Exper'd
Annual
Wage ($)
PENNSYLVANIA OCCUPATIONAL WAGES
MONTGOMERY COUNTY LABOR MARKET AREA
MAY 2017(Note: When data for a specific occupation is not available, the most relevant area containing this occupation has been provided, see Area Type.)
Mid Range
Annual Wage ($)
21-0000 Community & Social Services Occupations # CTY 23.56 49,010 44,120 30,460 58,280 34,530 to 58,830
21-1012 Educational, Guidance, School & Vocational Counselors MD CTY 37.63 78,280 77,550 49,070 92,880 58,480 to 98,100
21-1013 Marriage & Family Therapists MD+ MSA 22.55 46,910 39,370 35,560 52,580 35,540 to 57,210
21-1015 Rehabilitation Counselors MD CTY 20.28 42,190 38,630 27,510 49,530 31,730 to 55,170
21-1018Substance Abuse, Behavioral Disorder & Mental Health
CounselorsBD CTY 22.42 46,640 43,900 32,510 53,700 35,970 to 54,690
21-1019 Counselors, Other MD CTY 20.76 43,170 44,490 20,410 54,560 23,260 to 60,600
21-1021 Child, Family & School Social Workers BD CTY 22.37 46,530 42,380 30,600 54,500 33,470 to 51,290
21-1022 Healthcare Social Workers MD+ CTY 26.82 55,780 55,490 41,360 62,990 46,160 to 63,390
21-1023 Mental Health & Substance Abuse Social Workers MD+ CTY 18.38 38,240 37,280 28,430 43,140 32,280 to 45,530
21-1029 Social Workers, Other BD CTY 30.65 63,740 64,040 51,940 69,650 53,920 to 73,040
21-1091 Health Educators BD CTY 29.30 60,940 58,830 37,630 72,600 43,700 to 79,530
21-1092 Probation Officers & Correctional Treatment Specialists BD CTY 26.49 55,110 52,320 43,480 60,920 45,050 to 61,680
21-1093 Social & Human Service Assistants ST OJT CTY 17.20 35,780 34,300 27,000 40,180 29,090 to 39,970
21-1094 Community Health Workers ST OJT CTY 24.66 51,300 42,230 33,290 60,300 35,430 to 70,430
21-1099 Community & Social Service Specialists, Other BD CTY 30.43 63,300 64,320 41,340 74,280 45,980 to 82,790
21-2011 Clergy BD CTY 25.29 52,610 45,400 27,690 65,070 30,180 to 59,430
* - Occupation generally not compensated at an hourly rate
# - No data available due to limitations in methodology Page 11 of 51PA - Statewide; MSA - Metropolitan Statistical Area;
WDA - Workforce Development Area; CTY - County

SOC
CodeOccupational Title
Educ.
Level
Area
Type
Average
Hourly
Wage ($)
Average
Annual
Wage ($)
Median
Annual
Wage ($)
Entry
Annual
Wage ($)
Exper'd
Annual
Wage ($)
PENNSYLVANIA OCCUPATIONAL WAGES
MONTGOMERY COUNTY LABOR MARKET AREA
MAY 2017(Note: When data for a specific occupation is not available, the most relevant area containing this occupation has been provided, see Area Type.)
Mid Range
Annual Wage ($)
21-2021 Directors, Religious Activities & Education BD+ CTY 23.51 48,900 45,220 24,870 60,920 27,030 to 59,480
21-2099 Religious Workers, Other BD CTY 10.21 21,240 17,990 16,870 23,430 16,560 to 19,910
23-0000 Legal Occupations # CTY 46.02 95,720 73,020 41,760 122,700 48,520 to 120,470
23-1011 Lawyers PROF CTY 58.47 121,620 97,320 55,370 154,740 69,910 to 153,760
23-1012 Judicial Law Clerks PhD MSA 15.81 32,890 30,870 27,340 35,670 27,600 to 37,750
23-1021Administrative Law Judges, Adjudicators & Hearing
OfficersPhD MSA 59.11 122,940 128,100 63,670 152,580 71,860 to 172,110
23-1022 Arbitrators, Mediators & Conciliators BD+ PA 32.01 66,580 61,890 39,720 80,010 45,400 to 78,930
23-1023 Judges, Magistrate Judges & Magistrates PhD PA 30.61 63,660 60,530 49,440 70,780 53,350 to 70,560
23-2011 Paralegals & Legal Assistants AD CTY 28.02 58,280 55,300 41,280 66,790 45,000 to 68,400
23-2091 Court Reporters PS MSA 30.06 62,530 66,040 45,190 71,200 52,090 to 74,040
23-2093 Title Examiners, Abstractors & Searchers MT OJT CTY 24.48 50,930 48,330 37,820 57,480 41,850 to 62,070
23-2099 Legal Support Workers, Other AD CTY 40.63 84,510 69,650 49,920 101,810 54,960 to 125,030
25-0000 Education, Training & Library Occupations # CTY 31.01 64,510 58,890 29,070 82,230 35,090 to 90,020
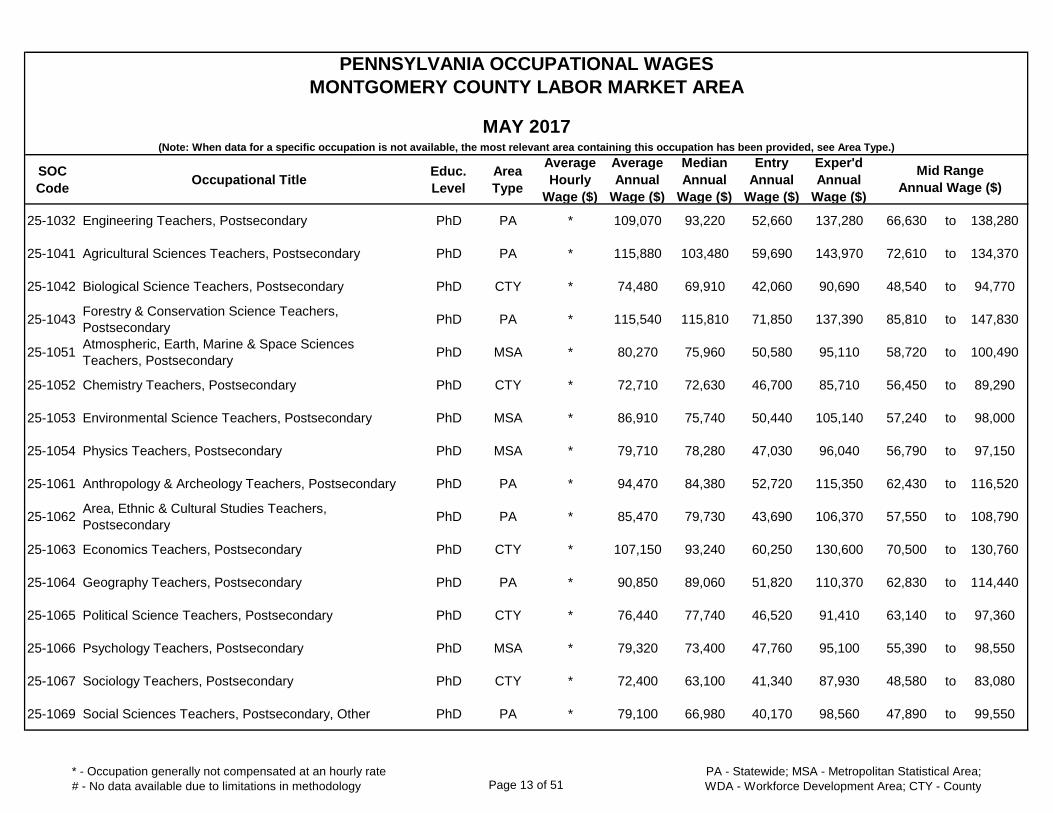
25-1011 Business Teachers, Postsecondary PhD CTY * 64,460 50,590 39,250 77,060 43,000 to 70,260
25-1021 Computer Science Teachers, Postsecondary PhD MSA * 79,840 72,620 49,100 95,200 54,070 to 97,960
25-1022 Mathematical Science Teachers, Postsecondary PhD CTY * 77,160 68,240 40,970 95,260 48,750 to 90,460
* - Occupation generally not compensated at an hourly rate
# - No data available due to limitations in methodology Page 12 of 51PA - Statewide; MSA - Metropolitan Statistical Area;
WDA - Workforce Development Area; CTY - County
SOC
CodeOccupational Title
Educ.
Level
Area
Type
Average
Hourly
Wage ($)
Average
Annual
Wage ($)
Median
Annual
Wage ($)
Entry
Annual
Wage ($)
Exper'd
Annual
Wage ($)
PENNSYLVANIA OCCUPATIONAL WAGES
MONTGOMERY COUNTY LABOR MARKET AREA
MAY 2017(Note: When data for a specific occupation is not available, the most relevant area containing this occupation has been provided, see Area Type.)
Mid Range
Annual Wage ($)
25-1032 Engineering Teachers, Postsecondary PhD PA * 109,070 93,220 52,660 137,280 66,630 to 138,280
25-1041 Agricultural Sciences Teachers, Postsecondary PhD PA * 115,880 103,480 59,690 143,970 72,610 to 134,370
25-1042 Biological Science Teachers, Postsecondary PhD CTY * 74,480 69,910 42,060 90,690 48,540 to 94,770
25-1043Forestry & Conservation Science Teachers,
PostsecondaryPhD PA * 115,540 115,810 71,850 137,390 85,810 to 147,830
25-1051Atmospheric, Earth, Marine & Space Sciences
Teachers, PostsecondaryPhD MSA * 80,270 75,960 50,580 95,110 58,720 to 100,490
25-1052 Chemistry Teachers, Postsecondary PhD CTY * 72,710 72,630 46,700 85,710 56,450 to 89,290
25-1053 Environmental Science Teachers, Postsecondary PhD MSA * 86,910 75,740 50,440 105,140 57,240 to 98,000
25-1054 Physics Teachers, Postsecondary PhD MSA * 79,710 78,280 47,030 96,040 56,790 to 97,150
25-1061 Anthropology & Archeology Teachers, Postsecondary PhD PA * 94,470 84,380 52,720 115,350 62,430 to 116,520
25-1062Area, Ethnic & Cultural Studies Teachers,
PostsecondaryPhD PA * 85,470 79,730 43,690 106,370 57,550 to 108,790
25-1063 Economics Teachers, Postsecondary PhD CTY * 107,150 93,240 60,250 130,600 70,500 to 130,760
25-1064 Geography Teachers, Postsecondary PhD PA * 90,850 89,060 51,820 110,370 62,830 to 114,440
25-1065 Political Science Teachers, Postsecondary PhD CTY * 76,440 77,740 46,520 91,410 63,140 to 97,360
25-1066 Psychology Teachers, Postsecondary PhD MSA * 79,320 73,400 47,760 95,100 55,390 to 98,550
25-1067 Sociology Teachers, Postsecondary PhD CTY * 72,400 63,100 41,340 87,930 48,580 to 83,080
25-1069 Social Sciences Teachers, Postsecondary, Other PhD PA * 79,100 66,980 40,170 98,560 47,890 to 99,550
* - Occupation generally not compensated at an hourly rate
# - No data available due to limitations in methodology Page 13 of 51PA - Statewide; MSA - Metropolitan Statistical Area;
WDA - Workforce Development Area; CTY - County
SOC
CodeOccupational Title
Educ.
Level
Area
Type
Average
Hourly
Wage ($)
Average
Annual
Wage ($)
Median
Annual
Wage ($)
Entry
Annual
Wage ($)
Exper'd
Annual
Wage ($)
PENNSYLVANIA OCCUPATIONAL WAGES
MONTGOMERY COUNTY LABOR MARKET AREA
MAY 2017(Note: When data for a specific occupation is not available, the most relevant area containing this occupation has been provided, see Area Type.)
Mid Range
Annual Wage ($)
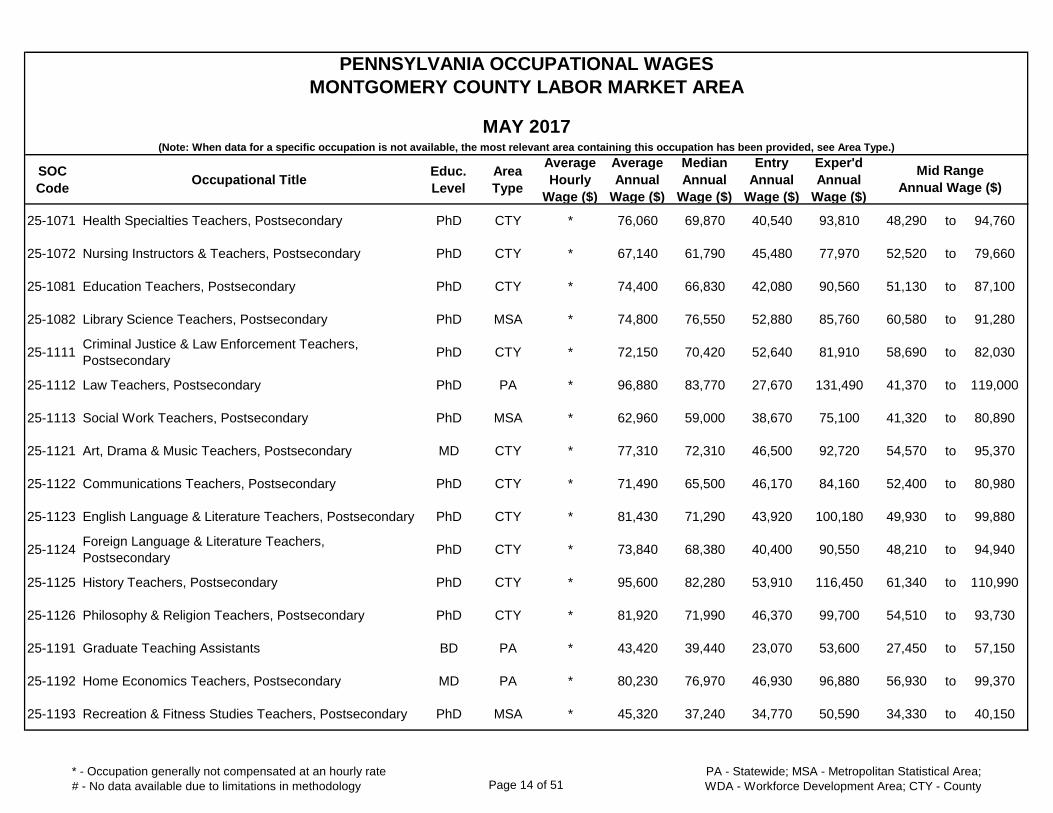
25-1071 Health Specialties Teachers, Postsecondary PhD CTY * 76,060 69,870 40,540 93,810 48,290 to 94,760
25-1072 Nursing Instructors & Teachers, Postsecondary PhD CTY * 67,140 61,790 45,480 77,970 52,520 to 79,660
25-1081 Education Teachers, Postsecondary PhD CTY * 74,400 66,830 42,080 90,560 51,130 to 87,100
25-1082 Library Science Teachers, Postsecondary PhD MSA * 74,800 76,550 52,880 85,760 60,580 to 91,280
25-1111Criminal Justice & Law Enforcement Teachers,
PostsecondaryPhD CTY * 72,150 70,420 52,640 81,910 58,690 to 82,030
25-1112 Law Teachers, Postsecondary PhD PA * 96,880 83,770 27,670 131,490 41,370 to 119,000
25-1113 Social Work Teachers, Postsecondary PhD MSA * 62,960 59,000 38,670 75,100 41,320 to 80,890
25-1121 Art, Drama & Music Teachers, Postsecondary MD CTY * 77,310 72,310 46,500 92,720 54,570 to 95,370
25-1122 Communications Teachers, Postsecondary PhD CTY * 71,490 65,500 46,170 84,160 52,400 to 80,980
25-1123 English Language & Literature Teachers, Postsecondary PhD CTY * 81,430 71,290 43,920 100,180 49,930 to 99,880
25-1124Foreign Language & Literature Teachers,
PostsecondaryPhD CTY * 73,840 68,380 40,400 90,550 48,210 to 94,940
25-1125 History Teachers, Postsecondary PhD CTY * 95,600 82,280 53,910 116,450 61,340 to 110,990
25-1126 Philosophy & Religion Teachers, Postsecondary PhD CTY * 81,920 71,990 46,370 99,700 54,510 to 93,730
25-1191 Graduate Teaching Assistants BD PA * 43,420 39,440 23,070 53,600 27,450 to 57,150
25-1192 Home Economics Teachers, Postsecondary MD PA * 80,230 76,970 46,930 96,880 56,930 to 99,370
25-1193 Recreation & Fitness Studies Teachers, Postsecondary PhD MSA * 45,320 37,240 34,770 50,590 34,330 to 40,150
* - Occupation generally not compensated at an hourly rate
# - No data available due to limitations in methodology Page 14 of 51PA - Statewide; MSA - Metropolitan Statistical Area;
WDA - Workforce Development Area; CTY - County
SOC
CodeOccupational Title
Educ.
Level
Area
Type
Average
Hourly
Wage ($)
Average
Annual
Wage ($)
Median
Annual
Wage ($)
Entry
Annual
Wage ($)
Exper'd
Annual
Wage ($)
PENNSYLVANIA OCCUPATIONAL WAGES
MONTGOMERY COUNTY LABOR MARKET AREA
MAY 2017(Note: When data for a specific occupation is not available, the most relevant area containing this occupation has been provided, see Area Type.)
Mid Range
Annual Wage ($)
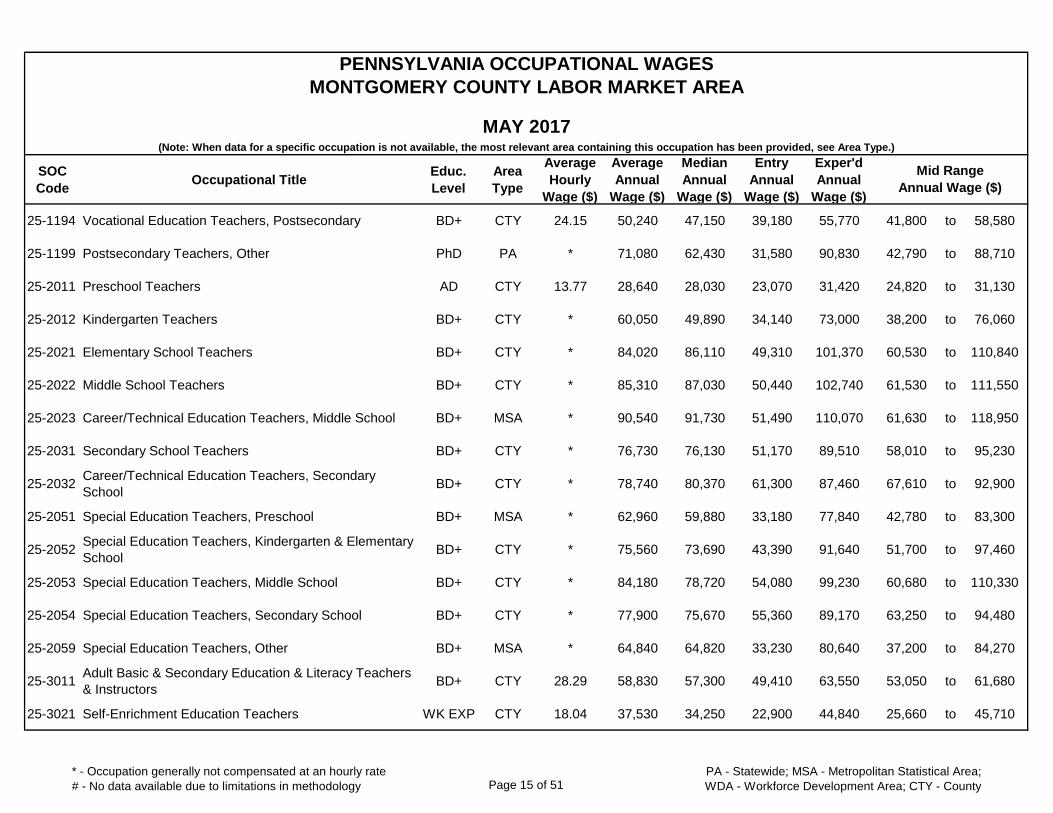
25-1194 Vocational Education Teachers, Postsecondary BD+ CTY 24.15 50,240 47,150 39,180 55,770 41,800 to 58,580
25-1199 Postsecondary Teachers, Other PhD PA * 71,080 62,430 31,580 90,830 42,790 to 88,710
25-2011 Preschool Teachers AD CTY 13.77 28,640 28,030 23,070 31,420 24,820 to 31,130
25-2012 Kindergarten Teachers BD+ CTY * 60,050 49,890 34,140 73,000 38,200 to 76,060
25-2021 Elementary School Teachers BD+ CTY * 84,020 86,110 49,310 101,370 60,530 to 110,840
25-2022 Middle School Teachers BD+ CTY * 85,310 87,030 50,440 102,740 61,530 to 111,550
25-2023 Career/Technical Education Teachers, Middle School BD+ MSA * 90,540 91,730 51,490 110,070 61,630 to 118,950
25-2031 Secondary School Teachers BD+ CTY * 76,730 76,130 51,170 89,510 58,010 to 95,230
25-2032Career/Technical Education Teachers, Secondary
SchoolBD+ CTY * 78,740 80,370 61,300 87,460 67,610 to 92,900
25-2051 Special Education Teachers, Preschool BD+ MSA * 62,960 59,880 33,180 77,840 42,780 to 83,300
25-2052Special Education Teachers, Kindergarten & Elementary
SchoolBD+ CTY * 75,560 73,690 43,390 91,640 51,700 to 97,460
25-2053 Special Education Teachers, Middle School BD+ CTY * 84,180 78,720 54,080 99,230 60,680 to 110,330
25-2054 Special Education Teachers, Secondary School BD+ CTY * 77,900 75,670 55,360 89,170 63,250 to 94,480
25-2059 Special Education Teachers, Other BD+ MSA * 64,840 64,820 33,230 80,640 37,200 to 84,270
25-3011Adult Basic & Secondary Education & Literacy Teachers
& InstructorsBD+ CTY 28.29 58,830 57,300 49,410 63,550 53,050 to 61,680
25-3021 Self-Enrichment Education Teachers WK EXP CTY 18.04 37,530 34,250 22,900 44,840 25,660 to 45,710
* - Occupation generally not compensated at an hourly rate
# - No data available due to limitations in methodology Page 15 of 51PA - Statewide; MSA - Metropolitan Statistical Area;
WDA - Workforce Development Area; CTY - County
SOC
CodeOccupational Title
Educ.
Level
Area
Type
Average
Hourly
Wage ($)
Average
Annual
Wage ($)
Median
Annual
Wage ($)
Entry
Annual
Wage ($)
Exper'd
Annual
Wage ($)
PENNSYLVANIA OCCUPATIONAL WAGES
MONTGOMERY COUNTY LABOR MARKET AREA
MAY 2017(Note: When data for a specific occupation is not available, the most relevant area containing this occupation has been provided, see Area Type.)
Mid Range
Annual Wage ($)
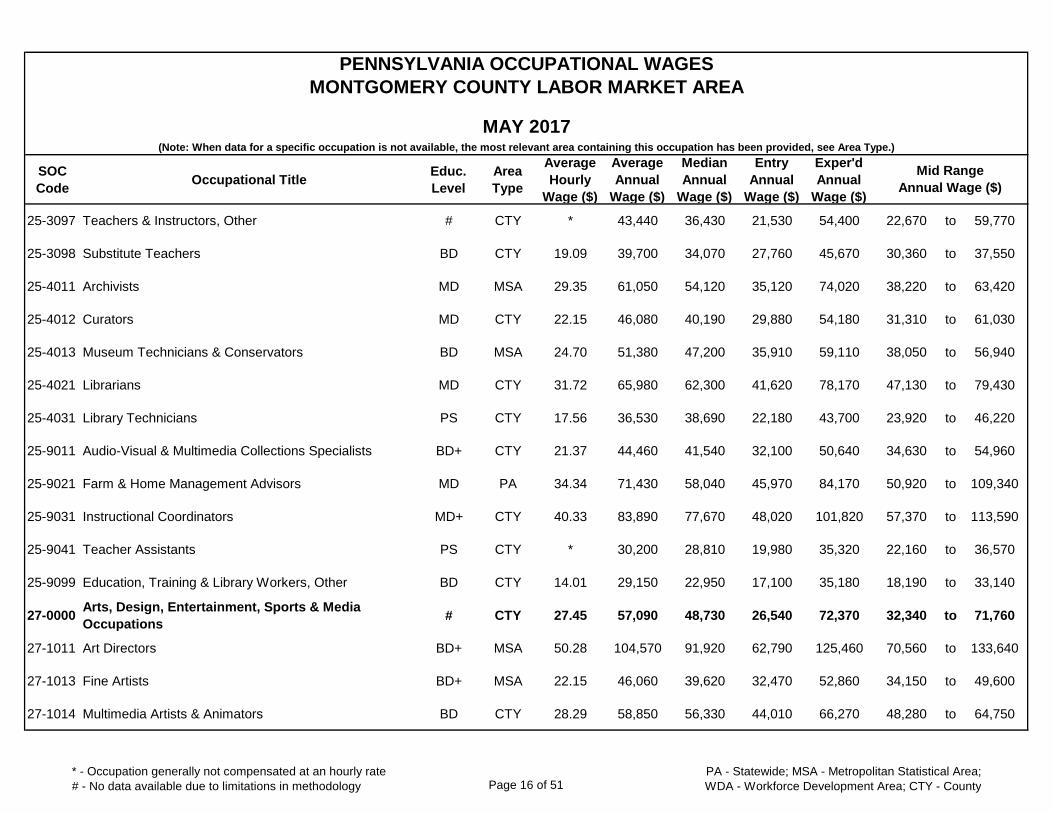
25-3097 Teachers & Instructors, Other # CTY * 43,440 36,430 21,530 54,400 22,670 to 59,770
25-3098 Substitute Teachers BD CTY 19.09 39,700 34,070 27,760 45,670 30,360 to 37,550
25-4011 Archivists MD MSA 29.35 61,050 54,120 35,120 74,020 38,220 to 63,420
25-4012 Curators MD CTY 22.15 46,080 40,190 29,880 54,180 31,310 to 61,030
25-4013 Museum Technicians & Conservators BD MSA 24.70 51,380 47,200 35,910 59,110 38,050 to 56,940
25-4021 Librarians MD CTY 31.72 65,980 62,300 41,620 78,170 47,130 to 79,430
25-4031 Library Technicians PS CTY 17.56 36,530 38,690 22,180 43,700 23,920 to 46,220
25-9011 Audio-Visual & Multimedia Collections Specialists BD+ CTY 21.37 44,460 41,540 32,100 50,640 34,630 to 54,960
25-9021 Farm & Home Management Advisors MD PA 34.34 71,430 58,040 45,970 84,170 50,920 to 109,340
25-9031 Instructional Coordinators MD+ CTY 40.33 83,890 77,670 48,020 101,820 57,370 to 113,590
25-9041 Teacher Assistants PS CTY * 30,200 28,810 19,980 35,320 22,160 to 36,570
25-9099 Education, Training & Library Workers, Other BD CTY 14.01 29,150 22,950 17,100 35,180 18,190 to 33,140
27-0000Arts, Design, Entertainment, Sports & Media
Occupations# CTY 27.45 57,090 48,730 26,540 72,370 32,340 to 71,760
27-1011 Art Directors BD+ MSA 50.28 104,570 91,920 62,790 125,460 70,560 to 133,640
27-1013 Fine Artists BD+ MSA 22.15 46,060 39,620 32,470 52,860 34,150 to 49,600
27-1014 Multimedia Artists & Animators BD CTY 28.29 58,850 56,330 44,010 66,270 48,280 to 64,750
* - Occupation generally not compensated at an hourly rate
# - No data available due to limitations in methodology Page 16 of 51PA - Statewide; MSA - Metropolitan Statistical Area;
WDA - Workforce Development Area; CTY - County
SOC
CodeOccupational Title
Educ.
Level
Area
Type
Average
Hourly
Wage ($)
Average
Annual
Wage ($)
Median
Annual
Wage ($)
Entry
Annual
Wage ($)
Exper'd
Annual
Wage ($)
PENNSYLVANIA OCCUPATIONAL WAGES
MONTGOMERY COUNTY LABOR MARKET AREA
MAY 2017(Note: When data for a specific occupation is not available, the most relevant area containing this occupation has been provided, see Area Type.)
Mid Range
Annual Wage ($)
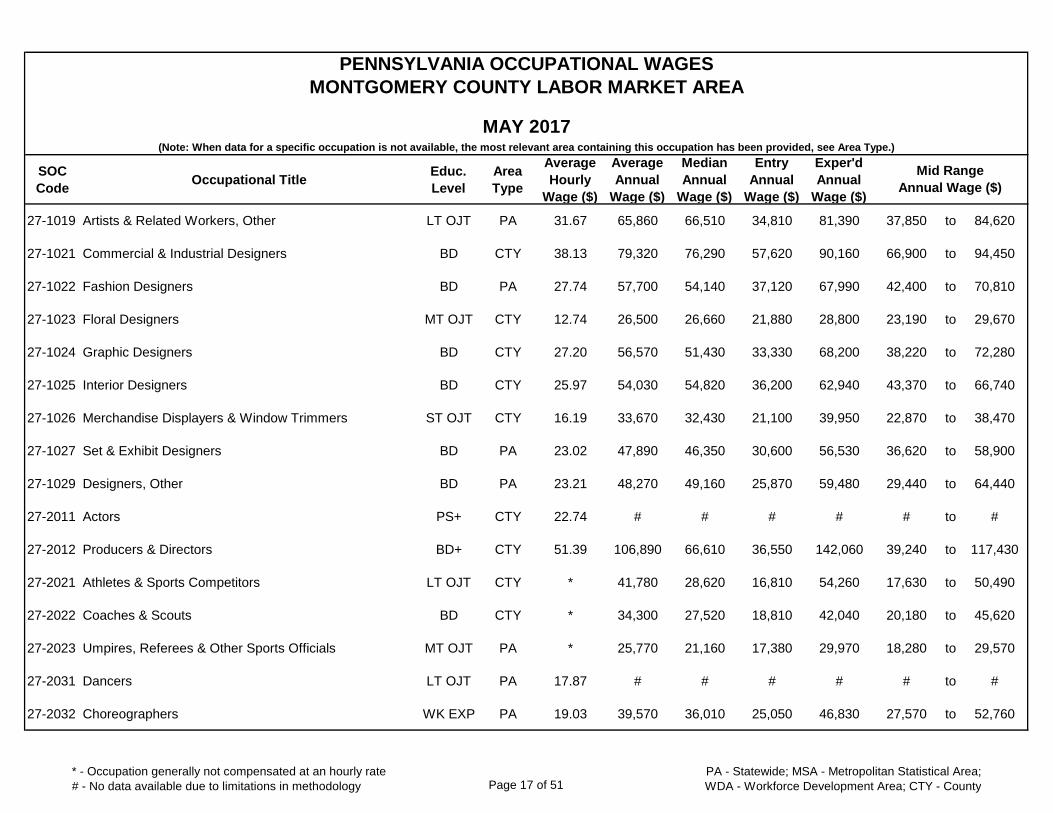
27-1019 Artists & Related Workers, Other LT OJT PA 31.67 65,860 66,510 34,810 81,390 37,850 to 84,620
27-1021 Commercial & Industrial Designers BD CTY 38.13 79,320 76,290 57,620 90,160 66,900 to 94,450
27-1022 Fashion Designers BD PA 27.74 57,700 54,140 37,120 67,990 42,400 to 70,810
27-1023 Floral Designers MT OJT CTY 12.74 26,500 26,660 21,880 28,800 23,190 to 29,670
27-1024 Graphic Designers BD CTY 27.20 56,570 51,430 33,330 68,200 38,220 to 72,280
27-1025 Interior Designers BD CTY 25.97 54,030 54,820 36,200 62,940 43,370 to 66,740
27-1026 Merchandise Displayers & Window Trimmers ST OJT CTY 16.19 33,670 32,430 21,100 39,950 22,870 to 38,470
27-1027 Set & Exhibit Designers BD PA 23.02 47,890 46,350 30,600 56,530 36,620 to 58,900
27-1029 Designers, Other BD PA 23.21 48,270 49,160 25,870 59,480 29,440 to 64,440
27-2011 Actors PS+ CTY 22.74 # # # # # to #
27-2012 Producers & Directors BD+ CTY 51.39 106,890 66,610 36,550 142,060 39,240 to 117,430
27-2021 Athletes & Sports Competitors LT OJT CTY * 41,780 28,620 16,810 54,260 17,630 to 50,490
27-2022 Coaches & Scouts BD CTY * 34,300 27,520 18,810 42,040 20,180 to 45,620
27-2023 Umpires, Referees & Other Sports Officials MT OJT PA * 25,770 21,160 17,380 29,970 18,280 to 29,570
27-2031 Dancers LT OJT PA 17.87 # # # # # to #
27-2032 Choreographers WK EXP PA 19.03 39,570 36,010 25,050 46,830 27,570 to 52,760
* - Occupation generally not compensated at an hourly rate
# - No data available due to limitations in methodology Page 17 of 51PA - Statewide; MSA - Metropolitan Statistical Area;
WDA - Workforce Development Area; CTY - County
SOC
CodeOccupational Title
Educ.
Level
Area
Type
Average
Hourly
Wage ($)
Average
Annual
Wage ($)
Median
Annual
Wage ($)
Entry
Annual
Wage ($)
Exper'd
Annual
Wage ($)
PENNSYLVANIA OCCUPATIONAL WAGES
MONTGOMERY COUNTY LABOR MARKET AREA
MAY 2017(Note: When data for a specific occupation is not available, the most relevant area containing this occupation has been provided, see Area Type.)
Mid Range
Annual Wage ($)
27-2041 Music Directors & Composers BD+ MSA 21.14 43,970 43,570 30,190 50,860 33,000 to 52,710
27-2042 Musicians & Singers LT OJT CTY 31.77 # # # # # to #
27-2099Entertainers & Performers, Sports & Related Workers,
OtherST OJT PA 14.01 # # # # # to #
27-3011 Radio & Television Announcers BD CTY 21.24 44,170 25,240 19,290 56,610 20,790 to 46,720
27-3022 Reporters & Correspondents BD MSA 19.66 40,890 36,840 26,130 48,280 29,990 to 46,210
27-3031 Public Relations Specialists BD CTY 34.04 70,800 62,860 41,140 85,640 46,920 to 83,510
27-3041 Editors BD+ CTY 27.87 57,980 50,610 22,370 75,790 19,690 to 81,450
27-3042 Technical Writers BD+ CTY 39.15 81,420 76,470 56,770 93,750 62,160 to 96,370
27-3043 Writers & Authors BD+ CTY 30.58 63,600 52,720 42,340 74,230 44,890 to 82,700
27-3091 Interpreters & Translators BD CTY 23.20 48,260 39,710 35,550 54,620 35,700 to 67,580
27-3099 Media & Communication Workers, Other ST OJT PA 29.73 61,830 54,150 34,460 75,510 39,980 to 83,960
27-4011 Audio & Video Equipment Technicians PS CTY 20.79 43,240 48,220 22,590 53,570 24,830 to 57,100
27-4012 Broadcast Technicians AD CTY 24.66 51,300 37,680 23,380 65,260 24,730 to 75,790
27-4014 Sound Engineering Technicians PS PA 21.17 44,040 39,710 21,680 55,220 25,920 to 55,940
27-4021 Photographers LT OJT CTY 20.92 43,510 40,370 27,810 51,360 31,860 to 52,850
27-4031 Camera Operators: TV, Video & Motion Picture BD MSA 19.78 41,150 43,270 23,930 49,760 32,780 to 51,340
* - Occupation generally not compensated at an hourly rate
# - No data available due to limitations in methodology Page 18 of 51PA - Statewide; MSA - Metropolitan Statistical Area;
WDA - Workforce Development Area; CTY - County
SOC
CodeOccupational Title
Educ.
Level
Area
Type
Average
Hourly
Wage ($)
Average
Annual
Wage ($)
Median
Annual
Wage ($)
Entry
Annual
Wage ($)
Exper'd
Annual
Wage ($)
PENNSYLVANIA OCCUPATIONAL WAGES
MONTGOMERY COUNTY LABOR MARKET AREA
MAY 2017(Note: When data for a specific occupation is not available, the most relevant area containing this occupation has been provided, see Area Type.)
Mid Range
Annual Wage ($)
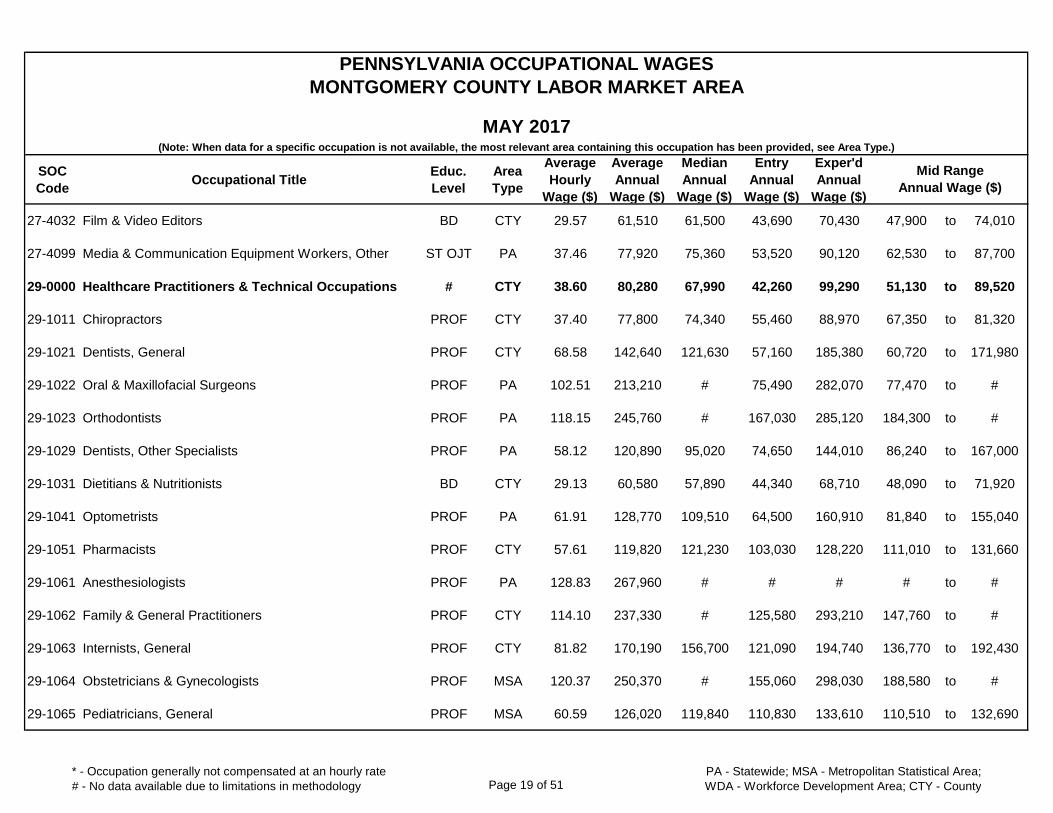
27-4032 Film & Video Editors BD CTY 29.57 61,510 61,500 43,690 70,430 47,900 to 74,010
27-4099 Media & Communication Equipment Workers, Other ST OJT PA 37.46 77,920 75,360 53,520 90,120 62,530 to 87,700
29-0000 Healthcare Practitioners & Technical Occupations # CTY 38.60 80,280 67,990 42,260 99,290 51,130 to 89,520
29-1011 Chiropractors PROF CTY 37.40 77,800 74,340 55,460 88,970 67,350 to 81,320
29-1021 Dentists, General PROF CTY 68.58 142,640 121,630 57,160 185,380 60,720 to 171,980
29-1022 Oral & Maxillofacial Surgeons PROF PA 102.51 213,210 # 75,490 282,070 77,470 to #
29-1023 Orthodontists PROF PA 118.15 245,760 # 167,030 285,120 184,300 to #
29-1029 Dentists, Other Specialists PROF PA 58.12 120,890 95,020 74,650 144,010 86,240 to 167,000
29-1031 Dietitians & Nutritionists BD CTY 29.13 60,580 57,890 44,340 68,710 48,090 to 71,920
29-1041 Optometrists PROF PA 61.91 128,770 109,510 64,500 160,910 81,840 to 155,040
29-1051 Pharmacists PROF CTY 57.61 119,820 121,230 103,030 128,220 111,010 to 131,660
29-1061 Anesthesiologists PROF PA 128.83 267,960 # # # # to #
29-1062 Family & General Practitioners PROF CTY 114.10 237,330 # 125,580 293,210 147,760 to #
29-1063 Internists, General PROF CTY 81.82 170,190 156,700 121,090 194,740 136,770 to 192,430
29-1064 Obstetricians & Gynecologists PROF MSA 120.37 250,370 # 155,060 298,030 188,580 to #
29-1065 Pediatricians, General PROF MSA 60.59 126,020 119,840 110,830 133,610 110,510 to 132,690
* - Occupation generally not compensated at an hourly rate
# - No data available due to limitations in methodology Page 19 of 51PA - Statewide; MSA - Metropolitan Statistical Area;
WDA - Workforce Development Area; CTY - County
SOC
CodeOccupational Title
Educ.
Level
Area
Type
Average
Hourly
Wage ($)
Average
Annual
Wage ($)
Median
Annual
Wage ($)
Entry
Annual
Wage ($)
Exper'd
Annual
Wage ($)
PENNSYLVANIA OCCUPATIONAL WAGES
MONTGOMERY COUNTY LABOR MARKET AREA
MAY 2017(Note: When data for a specific occupation is not available, the most relevant area containing this occupation has been provided, see Area Type.)
Mid Range
Annual Wage ($)
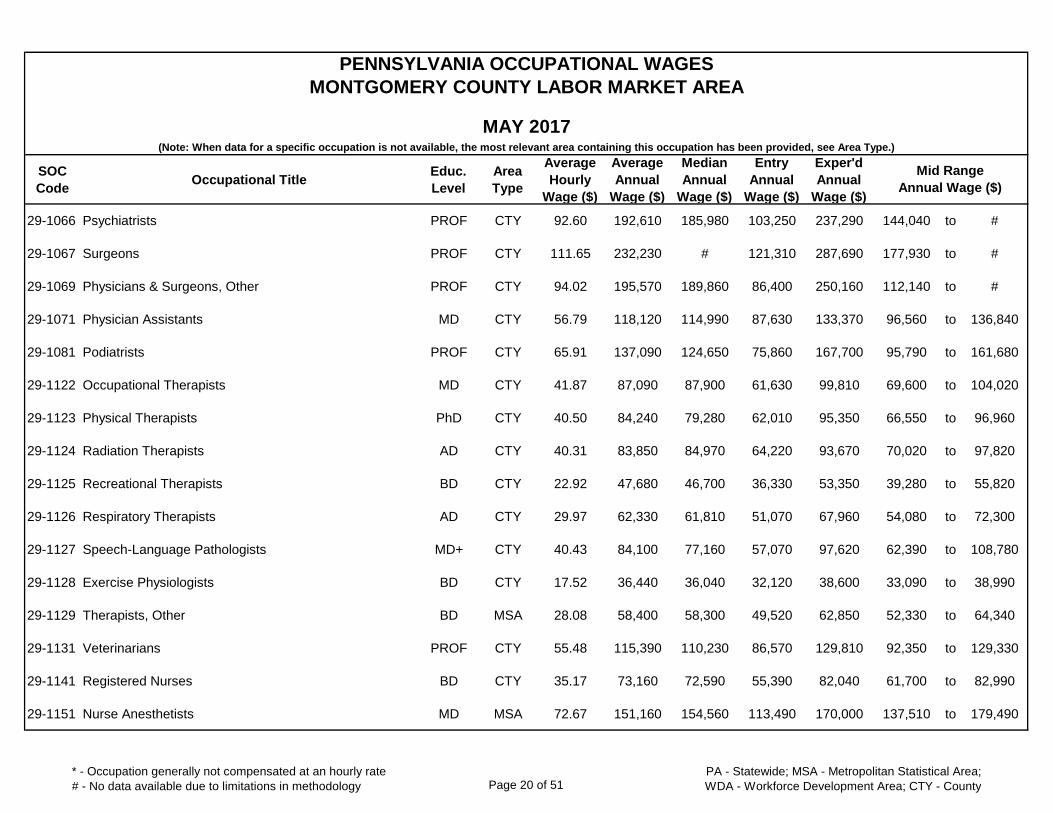
29-1066 Psychiatrists PROF CTY 92.60 192,610 185,980 103,250 237,290 144,040 to #
29-1067 Surgeons PROF CTY 111.65 232,230 # 121,310 287,690 177,930 to #
29-1069 Physicians & Surgeons, Other PROF CTY 94.02 195,570 189,860 86,400 250,160 112,140 to #
29-1071 Physician Assistants MD CTY 56.79 118,120 114,990 87,630 133,370 96,560 to 136,840
29-1081 Podiatrists PROF CTY 65.91 137,090 124,650 75,860 167,700 95,790 to 161,680
29-1122 Occupational Therapists MD CTY 41.87 87,090 87,900 61,630 99,810 69,600 to 104,020
29-1123 Physical Therapists PhD CTY 40.50 84,240 79,280 62,010 95,350 66,550 to 96,960
29-1124 Radiation Therapists AD CTY 40.31 83,850 84,970 64,220 93,670 70,020 to 97,820
29-1125 Recreational Therapists BD CTY 22.92 47,680 46,700 36,330 53,350 39,280 to 55,820
29-1126 Respiratory Therapists AD CTY 29.97 62,330 61,810 51,070 67,960 54,080 to 72,300
29-1127 Speech-Language Pathologists MD+ CTY 40.43 84,100 77,160 57,070 97,620 62,390 to 108,780
29-1128 Exercise Physiologists BD CTY 17.52 36,440 36,040 32,120 38,600 33,090 to 38,990
29-1129 Therapists, Other BD MSA 28.08 58,400 58,300 49,520 62,850 52,330 to 64,340
29-1131 Veterinarians PROF CTY 55.48 115,390 110,230 86,570 129,810 92,350 to 129,330
29-1141 Registered Nurses BD CTY 35.17 73,160 72,590 55,390 82,040 61,700 to 82,990
29-1151 Nurse Anesthetists MD MSA 72.67 151,160 154,560 113,490 170,000 137,510 to 179,490
* - Occupation generally not compensated at an hourly rate
# - No data available due to limitations in methodology Page 20 of 51PA - Statewide; MSA - Metropolitan Statistical Area;
WDA - Workforce Development Area; CTY - County
SOC
CodeOccupational Title
Educ.
Level
Area
Type
Average
Hourly
Wage ($)
Average
Annual
Wage ($)
Median
Annual
Wage ($)
Entry
Annual
Wage ($)
Exper'd
Annual
Wage ($)
PENNSYLVANIA OCCUPATIONAL WAGES
MONTGOMERY COUNTY LABOR MARKET AREA
MAY 2017(Note: When data for a specific occupation is not available, the most relevant area containing this occupation has been provided, see Area Type.)
Mid Range
Annual Wage ($)
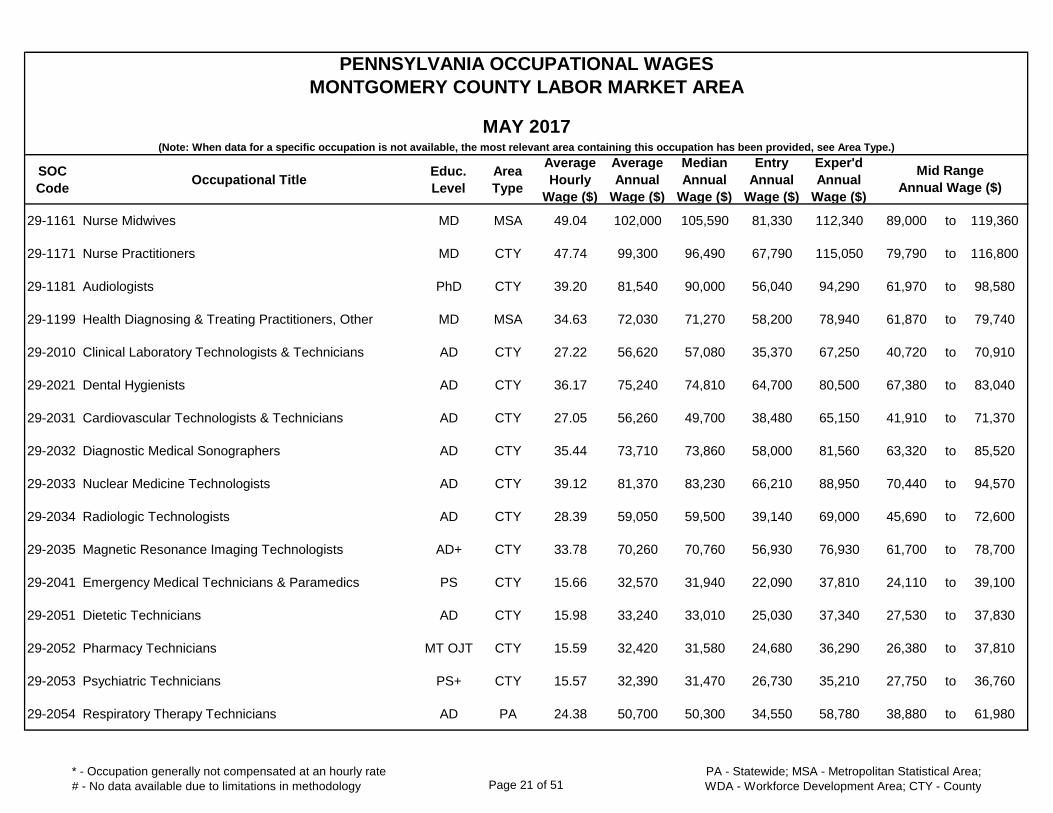
29-1161 Nurse Midwives MD MSA 49.04 102,000 105,590 81,330 112,340 89,000 to 119,360
29-1171 Nurse Practitioners MD CTY 47.74 99,300 96,490 67,790 115,050 79,790 to 116,800
29-1181 Audiologists PhD CTY 39.20 81,540 90,000 56,040 94,290 61,970 to 98,580
29-1199 Health Diagnosing & Treating Practitioners, Other MD MSA 34.63 72,030 71,270 58,200 78,940 61,870 to 79,740
29-2010 Clinical Laboratory Technologists & Technicians AD CTY 27.22 56,620 57,080 35,370 67,250 40,720 to 70,910
29-2021 Dental Hygienists AD CTY 36.17 75,240 74,810 64,700 80,500 67,380 to 83,040
29-2031 Cardiovascular Technologists & Technicians AD CTY 27.05 56,260 49,700 38,480 65,150 41,910 to 71,370
29-2032 Diagnostic Medical Sonographers AD CTY 35.44 73,710 73,860 58,000 81,560 63,320 to 85,520
29-2033 Nuclear Medicine Technologists AD CTY 39.12 81,370 83,230 66,210 88,950 70,440 to 94,570
29-2034 Radiologic Technologists AD CTY 28.39 59,050 59,500 39,140 69,000 45,690 to 72,600
29-2035 Magnetic Resonance Imaging Technologists AD+ CTY 33.78 70,260 70,760 56,930 76,930 61,700 to 78,700
29-2041 Emergency Medical Technicians & Paramedics PS CTY 15.66 32,570 31,940 22,090 37,810 24,110 to 39,100
29-2051 Dietetic Technicians AD CTY 15.98 33,240 33,010 25,030 37,340 27,530 to 37,830
29-2052 Pharmacy Technicians MT OJT CTY 15.59 32,420 31,580 24,680 36,290 26,380 to 37,810
29-2053 Psychiatric Technicians PS+ CTY 15.57 32,390 31,470 26,730 35,210 27,750 to 36,760
29-2054 Respiratory Therapy Technicians AD PA 24.38 50,700 50,300 34,550 58,780 38,880 to 61,980
* - Occupation generally not compensated at an hourly rate
# - No data available due to limitations in methodology Page 21 of 51PA - Statewide; MSA - Metropolitan Statistical Area;
WDA - Workforce Development Area; CTY - County
SOC
CodeOccupational Title
Educ.
Level
Area
Type
Average
Hourly
Wage ($)
Average
Annual
Wage ($)
Median
Annual
Wage ($)
Entry
Annual
Wage ($)
Exper'd
Annual
Wage ($)
PENNSYLVANIA OCCUPATIONAL WAGES
MONTGOMERY COUNTY LABOR MARKET AREA
MAY 2017(Note: When data for a specific occupation is not available, the most relevant area containing this occupation has been provided, see Area Type.)
Mid Range
Annual Wage ($)
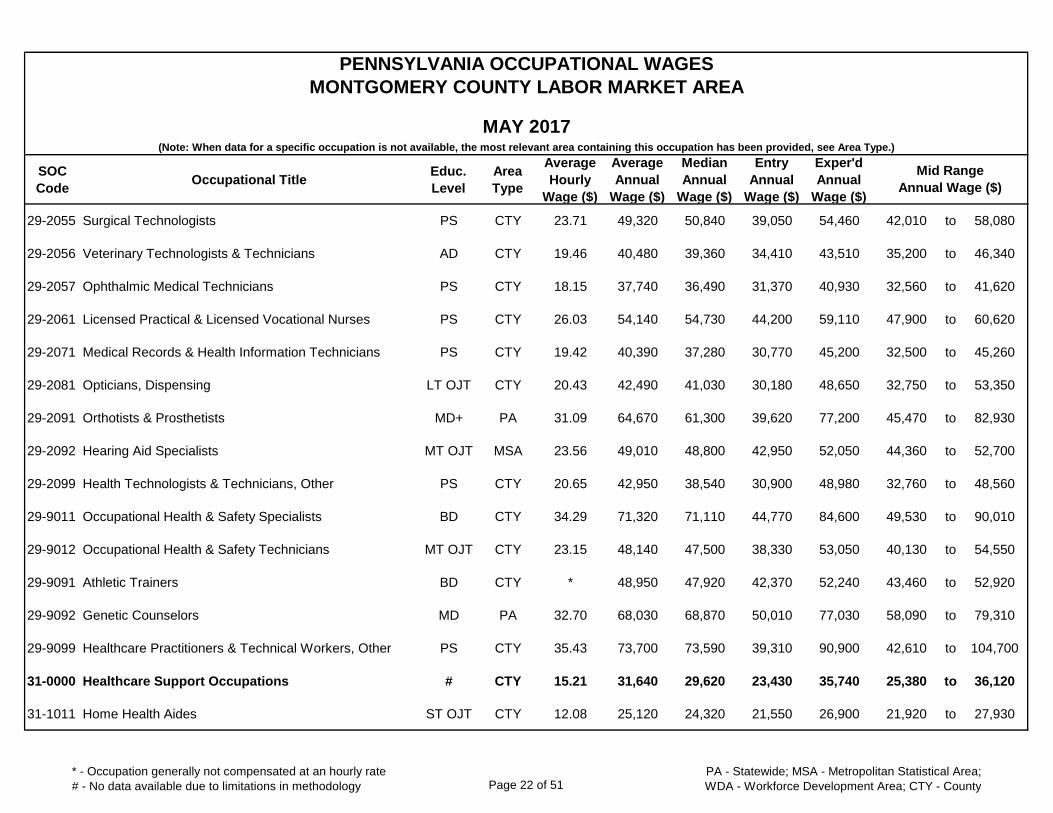
29-2055 Surgical Technologists PS CTY 23.71 49,320 50,840 39,050 54,460 42,010 to 58,080
29-2056 Veterinary Technologists & Technicians AD CTY 19.46 40,480 39,360 34,410 43,510 35,200 to 46,340
29-2057 Ophthalmic Medical Technicians PS CTY 18.15 37,740 36,490 31,370 40,930 32,560 to 41,620
29-2061 Licensed Practical & Licensed Vocational Nurses PS CTY 26.03 54,140 54,730 44,200 59,110 47,900 to 60,620
29-2071 Medical Records & Health Information Technicians PS CTY 19.42 40,390 37,280 30,770 45,200 32,500 to 45,260
29-2081 Opticians, Dispensing LT OJT CTY 20.43 42,490 41,030 30,180 48,650 32,750 to 53,350
29-2091 Orthotists & Prosthetists MD+ PA 31.09 64,670 61,300 39,620 77,200 45,470 to 82,930
29-2092 Hearing Aid Specialists MT OJT MSA 23.56 49,010 48,800 42,950 52,050 44,360 to 52,700
29-2099 Health Technologists & Technicians, Other PS CTY 20.65 42,950 38,540 30,900 48,980 32,760 to 48,560
29-9011 Occupational Health & Safety Specialists BD CTY 34.29 71,320 71,110 44,770 84,600 49,530 to 90,010
29-9012 Occupational Health & Safety Technicians MT OJT CTY 23.15 48,140 47,500 38,330 53,050 40,130 to 54,550
29-9091 Athletic Trainers BD CTY * 48,950 47,920 42,370 52,240 43,460 to 52,920
29-9092 Genetic Counselors MD PA 32.70 68,030 68,870 50,010 77,030 58,090 to 79,310
29-9099 Healthcare Practitioners & Technical Workers, Other PS CTY 35.43 73,700 73,590 39,310 90,900 42,610 to 104,700
31-0000 Healthcare Support Occupations # CTY 15.21 31,640 29,620 23,430 35,740 25,380 to 36,120
31-1011 Home Health Aides ST OJT CTY 12.08 25,120 24,320 21,550 26,900 21,920 to 27,930
* - Occupation generally not compensated at an hourly rate
# - No data available due to limitations in methodology Page 22 of 51PA - Statewide; MSA - Metropolitan Statistical Area;
WDA - Workforce Development Area; CTY - County
SOC
CodeOccupational Title
Educ.
Level
Area
Type
Average
Hourly
Wage ($)
Average
Annual
Wage ($)
Median
Annual
Wage ($)
Entry
Annual
Wage ($)
Exper'd
Annual
Wage ($)
PENNSYLVANIA OCCUPATIONAL WAGES
MONTGOMERY COUNTY LABOR MARKET AREA
MAY 2017(Note: When data for a specific occupation is not available, the most relevant area containing this occupation has been provided, see Area Type.)
Mid Range
Annual Wage ($)
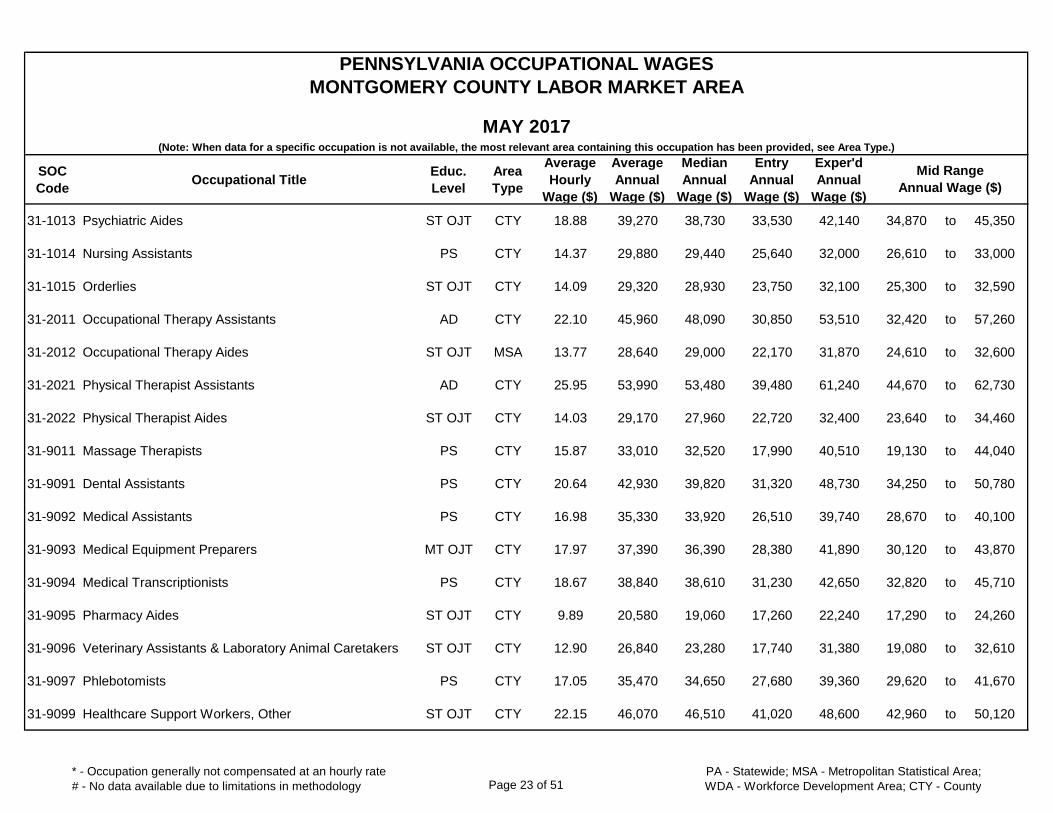
31-1013 Psychiatric Aides ST OJT CTY 18.88 39,270 38,730 33,530 42,140 34,870 to 45,350
31-1014 Nursing Assistants PS CTY 14.37 29,880 29,440 25,640 32,000 26,610 to 33,000
31-1015 Orderlies ST OJT CTY 14.09 29,320 28,930 23,750 32,100 25,300 to 32,590
31-2011 Occupational Therapy Assistants AD CTY 22.10 45,960 48,090 30,850 53,510 32,420 to 57,260
31-2012 Occupational Therapy Aides ST OJT MSA 13.77 28,640 29,000 22,170 31,870 24,610 to 32,600
31-2021 Physical Therapist Assistants AD CTY 25.95 53,990 53,480 39,480 61,240 44,670 to 62,730
31-2022 Physical Therapist Aides ST OJT CTY 14.03 29,170 27,960 22,720 32,400 23,640 to 34,460
31-9011 Massage Therapists PS CTY 15.87 33,010 32,520 17,990 40,510 19,130 to 44,040
31-9091 Dental Assistants PS CTY 20.64 42,930 39,820 31,320 48,730 34,250 to 50,780
31-9092 Medical Assistants PS CTY 16.98 35,330 33,920 26,510 39,740 28,670 to 40,100
31-9093 Medical Equipment Preparers MT OJT CTY 17.97 37,390 36,390 28,380 41,890 30,120 to 43,870
31-9094 Medical Transcriptionists PS CTY 18.67 38,840 38,610 31,230 42,650 32,820 to 45,710
31-9095 Pharmacy Aides ST OJT CTY 9.89 20,580 19,060 17,260 22,240 17,290 to 24,260
31-9096 Veterinary Assistants & Laboratory Animal Caretakers ST OJT CTY 12.90 26,840 23,280 17,740 31,380 19,080 to 32,610
31-9097 Phlebotomists PS CTY 17.05 35,470 34,650 27,680 39,360 29,620 to 41,670
31-9099 Healthcare Support Workers, Other ST OJT CTY 22.15 46,070 46,510 41,020 48,600 42,960 to 50,120
* - Occupation generally not compensated at an hourly rate
# - No data available due to limitations in methodology Page 23 of 51PA - Statewide; MSA - Metropolitan Statistical Area;
WDA - Workforce Development Area; CTY - County

SOC
CodeOccupational Title
Educ.
Level
Area
Type
Average
Hourly
Wage ($)
Average
Annual
Wage ($)
Median
Annual
Wage ($)
Entry
Annual
Wage ($)
Exper'd
Annual
Wage ($)
PENNSYLVANIA OCCUPATIONAL WAGES
MONTGOMERY COUNTY LABOR MARKET AREA
MAY 2017(Note: When data for a specific occupation is not available, the most relevant area containing this occupation has been provided, see Area Type.)
Mid Range
Annual Wage ($)
33-0000 Protective Service Occupations # CTY 19.69 40,960 31,780 21,050 50,910 23,730 to 47,370
33-1011 Supervisors - Correctional Officers WK EXP MSA 38.88 80,880 79,520 62,660 89,980 70,950 to 86,440
33-1012 Supervisors - Police & Detectives WK EXP CTY 56.33 117,170 116,910 96,730 127,400 106,580 to 128,990
33-1021 Supervisors - Fire Fighting & Prevention PS+ CTY 45.76 95,180 86,970 71,010 107,270 73,500 to 117,730
33-1099 Supervisors - Protective Service Workers, Other WK EXP CTY 20.55 42,740 39,580 29,700 49,250 32,890 to 50,040
33-2011 Firefighters PS+ CTY 17.95 37,340 35,720 27,780 42,120 30,420 to 41,330
33-2021 Fire Inspectors & Investigators PS+ CTY 22.48 46,760 38,990 21,820 59,230 23,140 to 60,320
33-3011 Bailiffs MT OJT MSA 15.55 32,340 28,600 22,260 37,370 23,490 to 43,150
33-3012 Correctional Officers & Jailers MT OJT MSA 24.68 51,330 47,230 41,650 56,170 42,040 to 60,310
33-3021 Detectives & Criminal Investigators WK EXP CTY 42.40 88,190 89,870 54,640 104,960 60,730 to 113,960
33-3041 Parking Enforcement Workers ST OJT CTY 20.73 43,110 44,220 36,650 46,340 40,060 to 48,320
33-3051 Police & Sheriff's Patrol Officers MT OJT CTY 40.88 85,030 90,560 62,740 96,170 76,940 to 99,480
33-9011 Animal Control Workers MT OJT MSA 20.17 41,960 38,900 29,140 48,370 33,320 to 53,930
33-9021 Private Detectives & Investigators WK EXP CTY 22.23 46,240 43,830 36,150 51,290 38,900 to 48,590
33-9031 Gaming Surveillance Officers & Gaming Investigators WK EXP MSA 24.36 50,660 53,070 37,760 57,110 44,500 to 57,420
33-9032 Security Guards ST OJT CTY 13.27 27,600 25,830 19,770 31,520 21,320 to 30,940
* - Occupation generally not compensated at an hourly rate
# - No data available due to limitations in methodology Page 24 of 51PA - Statewide; MSA - Metropolitan Statistical Area;
WDA - Workforce Development Area; CTY - County
SOC
CodeOccupational Title
Educ.
Level
Area
Type
Average
Hourly
Wage ($)
Average
Annual
Wage ($)
Median
Annual
Wage ($)
Entry
Annual
Wage ($)
Exper'd
Annual
Wage ($)
PENNSYLVANIA OCCUPATIONAL WAGES
MONTGOMERY COUNTY LABOR MARKET AREA
MAY 2017(Note: When data for a specific occupation is not available, the most relevant area containing this occupation has been provided, see Area Type.)
Mid Range
Annual Wage ($)
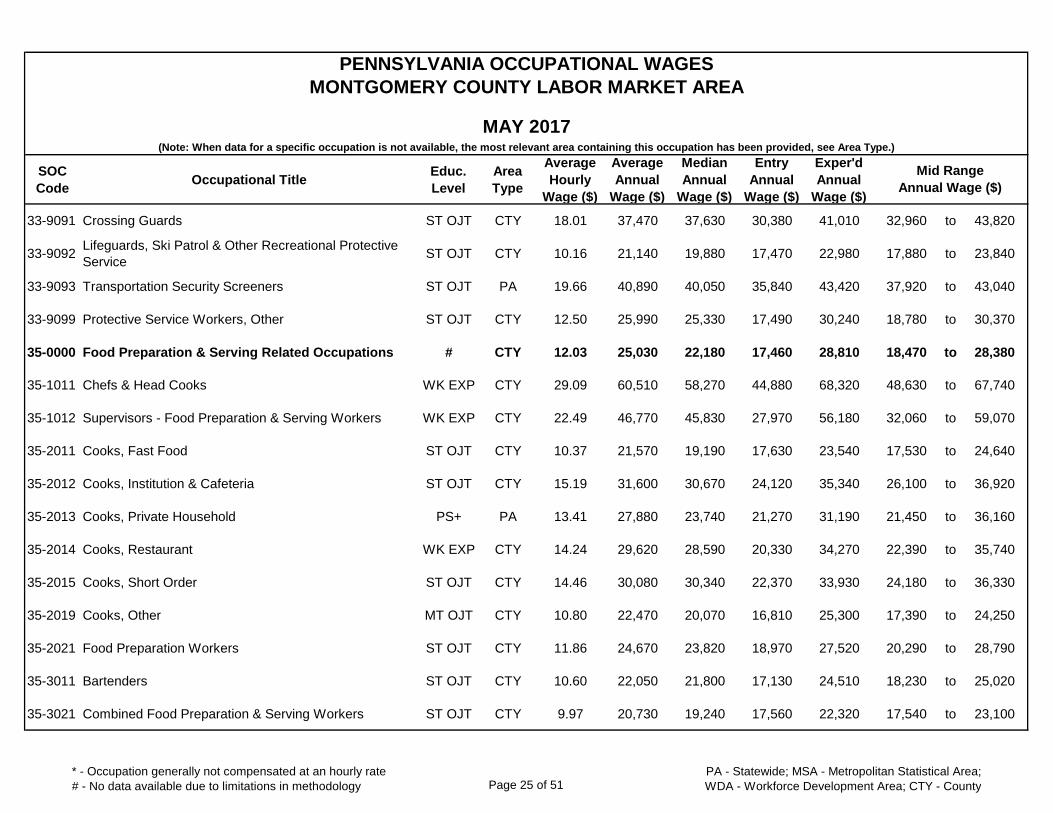
33-9091 Crossing Guards ST OJT CTY 18.01 37,470 37,630 30,380 41,010 32,960 to 43,820
33-9092Lifeguards, Ski Patrol & Other Recreational Protective
ServiceST OJT CTY 10.16 21,140 19,880 17,470 22,980 17,880 to 23,840
33-9093 Transportation Security Screeners ST OJT PA 19.66 40,890 40,050 35,840 43,420 37,920 to 43,040
33-9099 Protective Service Workers, Other ST OJT CTY 12.50 25,990 25,330 17,490 30,240 18,780 to 30,370
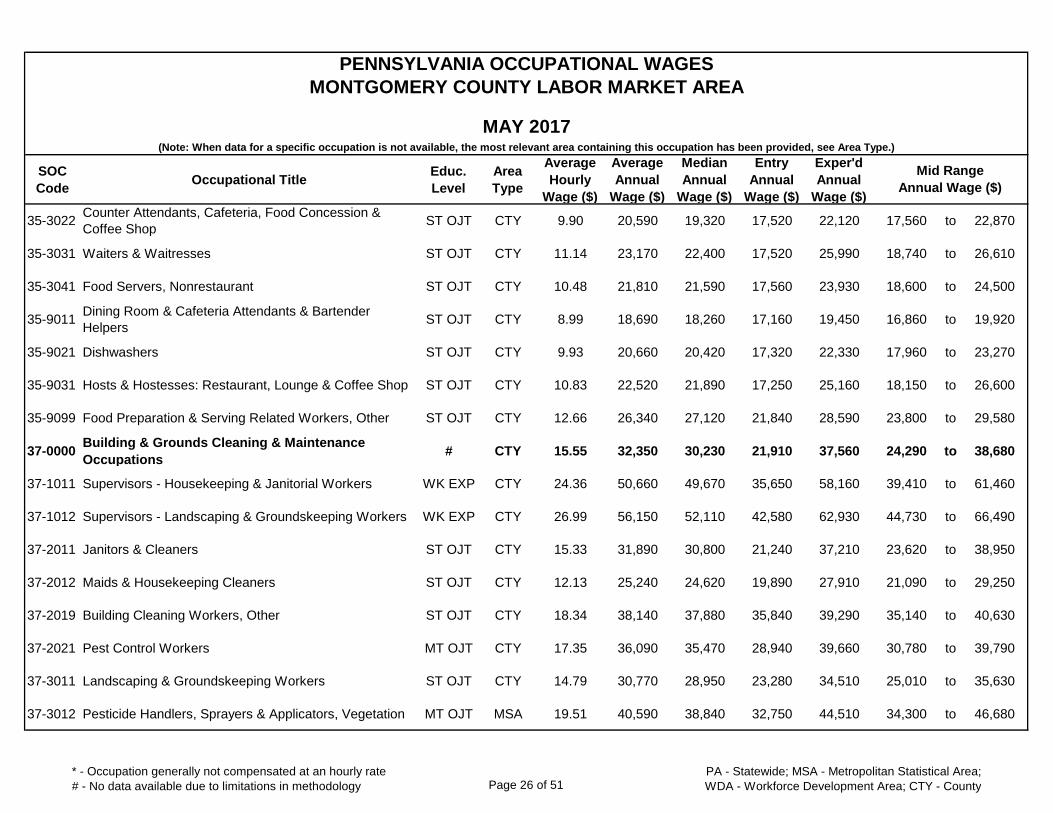
35-0000 Food Preparation & Serving Related Occupations # CTY 12.03 25,030 22,180 17,460 28,810 18,470 to 28,380
35-1011 Chefs & Head Cooks WK EXP CTY 29.09 60,510 58,270 44,880 68,320 48,630 to 67,740
35-1012 Supervisors - Food Preparation & Serving Workers WK EXP CTY 22.49 46,770 45,830 27,970 56,180 32,060 to 59,070
35-2011 Cooks, Fast Food ST OJT CTY 10.37 21,570 19,190 17,630 23,540 17,530 to 24,640
35-2012 Cooks, Institution & Cafeteria ST OJT CTY 15.19 31,600 30,670 24,120 35,340 26,100 to 36,920
35-2013 Cooks, Private Household PS+ PA 13.41 27,880 23,740 21,270 31,190 21,450 to 36,160
35-2014 Cooks, Restaurant WK EXP CTY 14.24 29,620 28,590 20,330 34,270 22,390 to 35,740
35-2015 Cooks, Short Order ST OJT CTY 14.46 30,080 30,340 22,370 33,930 24,180 to 36,330
35-2019 Cooks, Other MT OJT CTY 10.80 22,470 20,070 16,810 25,300 17,390 to 24,250
35-2021 Food Preparation Workers ST OJT CTY 11.86 24,670 23,820 18,970 27,520 20,290 to 28,790
35-3011 Bartenders ST OJT CTY 10.60 22,050 21,800 17,130 24,510 18,230 to 25,020
35-3021 Combined Food Preparation & Serving Workers ST OJT CTY 9.97 20,730 19,240 17,560 22,320 17,540 to 23,100
* - Occupation generally not compensated at an hourly rate
# - No data available due to limitations in methodology Page 25 of 51PA - Statewide; MSA - Metropolitan Statistical Area;
WDA - Workforce Development Area; CTY - County
SOC
CodeOccupational Title
Educ.
Level
Area
Type
Average
Hourly
Wage ($)
Average
Annual
Wage ($)
Median
Annual
Wage ($)
Entry
Annual
Wage ($)
Exper'd
Annual
Wage ($)
PENNSYLVANIA OCCUPATIONAL WAGES
MONTGOMERY COUNTY LABOR MARKET AREA
MAY 2017(Note: When data for a specific occupation is not available, the most relevant area containing this occupation has been provided, see Area Type.)
Mid Range
Annual Wage ($)
35-3022Counter Attendants, Cafeteria, Food Concession &
Coffee ShopST OJT CTY 9.90 20,590 19,320 17,520 22,120 17,560 to 22,870
35-3031 Waiters & Waitresses ST OJT CTY 11.14 23,170 22,400 17,520 25,990 18,740 to 26,610
35-3041 Food Servers, Nonrestaurant ST OJT CTY 10.48 21,810 21,590 17,560 23,930 18,600 to 24,500
35-9011Dining Room & Cafeteria Attendants & Bartender
HelpersST OJT CTY 8.99 18,690 18,260 17,160 19,450 16,860 to 19,920
35-9021 Dishwashers ST OJT CTY 9.93 20,660 20,420 17,320 22,330 17,960 to 23,270
35-9031 Hosts & Hostesses: Restaurant, Lounge & Coffee Shop ST OJT CTY 10.83 22,520 21,890 17,250 25,160 18,150 to 26,600
35-9099 Food Preparation & Serving Related Workers, Other ST OJT CTY 12.66 26,340 27,120 21,840 28,590 23,800 to 29,580
37-0000Building & Grounds Cleaning & Maintenance
Occupations# CTY 15.55 32,350 30,230 21,910 37,560 24,290 to 38,680
37-1011 Supervisors - Housekeeping & Janitorial Workers WK EXP CTY 24.36 50,660 49,670 35,650 58,160 39,410 to 61,460
37-1012 Supervisors - Landscaping & Groundskeeping Workers WK EXP CTY 26.99 56,150 52,110 42,580 62,930 44,730 to 66,490
37-2011 Janitors & Cleaners ST OJT CTY 15.33 31,890 30,800 21,240 37,210 23,620 to 38,950
37-2012 Maids & Housekeeping Cleaners ST OJT CTY 12.13 25,240 24,620 19,890 27,910 21,090 to 29,250
37-2019 Building Cleaning Workers, Other ST OJT CTY 18.34 38,140 37,880 35,840 39,290 35,140 to 40,630
37-2021 Pest Control Workers MT OJT CTY 17.35 36,090 35,470 28,940 39,660 30,780 to 39,790
37-3011 Landscaping & Groundskeeping Workers ST OJT CTY 14.79 30,770 28,950 23,280 34,510 25,010 to 35,630
37-3012 Pesticide Handlers, Sprayers & Applicators, Vegetation MT OJT MSA 19.51 40,590 38,840 32,750 44,510 34,300 to 46,680
* - Occupation generally not compensated at an hourly rate
# - No data available due to limitations in methodology Page 26 of 51PA - Statewide; MSA - Metropolitan Statistical Area;
WDA - Workforce Development Area; CTY - County
SOC
CodeOccupational Title
Educ.
Level
Area
Type
Average
Hourly
Wage ($)
Average
Annual
Wage ($)
Median
Annual
Wage ($)
Entry
Annual
Wage ($)
Exper'd
Annual
Wage ($)
PENNSYLVANIA OCCUPATIONAL WAGES
MONTGOMERY COUNTY LABOR MARKET AREA
MAY 2017(Note: When data for a specific occupation is not available, the most relevant area containing this occupation has been provided, see Area Type.)
Mid Range
Annual Wage ($)
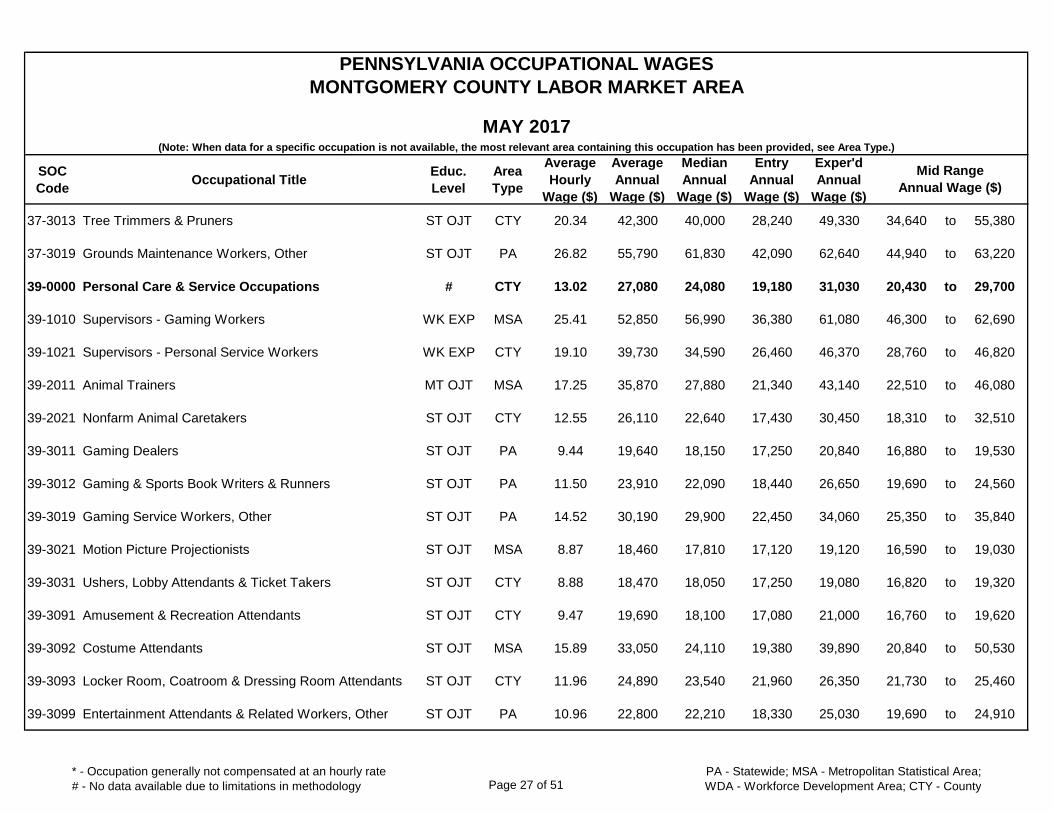
37-3013 Tree Trimmers & Pruners ST OJT CTY 20.34 42,300 40,000 28,240 49,330 34,640 to 55,380
37-3019 Grounds Maintenance Workers, Other ST OJT PA 26.82 55,790 61,830 42,090 62,640 44,940 to 63,220
39-0000 Personal Care & Service Occupations # CTY 13.02 27,080 24,080 19,180 31,030 20,430 to 29,700
39-1010 Supervisors - Gaming Workers WK EXP MSA 25.41 52,850 56,990 36,380 61,080 46,300 to 62,690
39-1021 Supervisors - Personal Service Workers WK EXP CTY 19.10 39,730 34,590 26,460 46,370 28,760 to 46,820
39-2011 Animal Trainers MT OJT MSA 17.25 35,870 27,880 21,340 43,140 22,510 to 46,080
39-2021 Nonfarm Animal Caretakers ST OJT CTY 12.55 26,110 22,640 17,430 30,450 18,310 to 32,510
39-3011 Gaming Dealers ST OJT PA 9.44 19,640 18,150 17,250 20,840 16,880 to 19,530
39-3012 Gaming & Sports Book Writers & Runners ST OJT PA 11.50 23,910 22,090 18,440 26,650 19,690 to 24,560
39-3019 Gaming Service Workers, Other ST OJT PA 14.52 30,190 29,900 22,450 34,060 25,350 to 35,840
39-3021 Motion Picture Projectionists ST OJT MSA 8.87 18,460 17,810 17,120 19,120 16,590 to 19,030
39-3031 Ushers, Lobby Attendants & Ticket Takers ST OJT CTY 8.88 18,470 18,050 17,250 19,080 16,820 to 19,320
39-3091 Amusement & Recreation Attendants ST OJT CTY 9.47 19,690 18,100 17,080 21,000 16,760 to 19,620
39-3092 Costume Attendants ST OJT MSA 15.89 33,050 24,110 19,380 39,890 20,840 to 50,530
39-3093 Locker Room, Coatroom & Dressing Room Attendants ST OJT CTY 11.96 24,890 23,540 21,960 26,350 21,730 to 25,460
39-3099 Entertainment Attendants & Related Workers, Other ST OJT PA 10.96 22,800 22,210 18,330 25,030 19,690 to 24,910
* - Occupation generally not compensated at an hourly rate
# - No data available due to limitations in methodology Page 27 of 51PA - Statewide; MSA - Metropolitan Statistical Area;
WDA - Workforce Development Area; CTY - County
SOC
CodeOccupational Title
Educ.
Level
Area
Type
Average
Hourly
Wage ($)
Average
Annual
Wage ($)
Median
Annual
Wage ($)
Entry
Annual
Wage ($)
Exper'd
Annual
Wage ($)
PENNSYLVANIA OCCUPATIONAL WAGES
MONTGOMERY COUNTY LABOR MARKET AREA
MAY 2017(Note: When data for a specific occupation is not available, the most relevant area containing this occupation has been provided, see Area Type.)
Mid Range
Annual Wage ($)
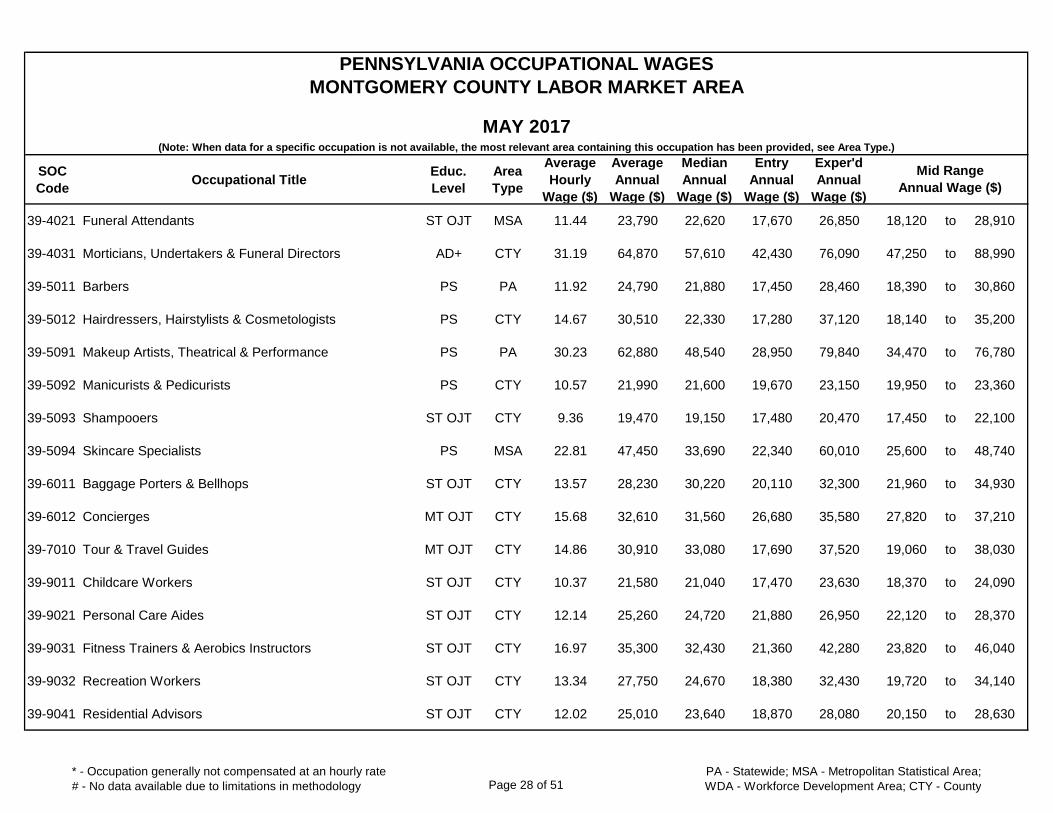
39-4021 Funeral Attendants ST OJT MSA 11.44 23,790 22,620 17,670 26,850 18,120 to 28,910
39-4031 Morticians, Undertakers & Funeral Directors AD+ CTY 31.19 64,870 57,610 42,430 76,090 47,250 to 88,990
39-5011 Barbers PS PA 11.92 24,790 21,880 17,450 28,460 18,390 to 30,860
39-5012 Hairdressers, Hairstylists & Cosmetologists PS CTY 14.67 30,510 22,330 17,280 37,120 18,140 to 35,200
39-5091 Makeup Artists, Theatrical & Performance PS PA 30.23 62,880 48,540 28,950 79,840 34,470 to 76,780
39-5092 Manicurists & Pedicurists PS CTY 10.57 21,990 21,600 19,670 23,150 19,950 to 23,360
39-5093 Shampooers ST OJT CTY 9.36 19,470 19,150 17,480 20,470 17,450 to 22,100
39-5094 Skincare Specialists PS MSA 22.81 47,450 33,690 22,340 60,010 25,600 to 48,740
39-6011 Baggage Porters & Bellhops ST OJT CTY 13.57 28,230 30,220 20,110 32,300 21,960 to 34,930
39-6012 Concierges MT OJT CTY 15.68 32,610 31,560 26,680 35,580 27,820 to 37,210
39-7010 Tour & Travel Guides MT OJT CTY 14.86 30,910 33,080 17,690 37,520 19,060 to 38,030
39-9011 Childcare Workers ST OJT CTY 10.37 21,580 21,040 17,470 23,630 18,370 to 24,090
39-9021 Personal Care Aides ST OJT CTY 12.14 25,260 24,720 21,880 26,950 22,120 to 28,370
39-9031 Fitness Trainers & Aerobics Instructors ST OJT CTY 16.97 35,300 32,430 21,360 42,280 23,820 to 46,040
39-9032 Recreation Workers ST OJT CTY 13.34 27,750 24,670 18,380 32,430 19,720 to 34,140
39-9041 Residential Advisors ST OJT CTY 12.02 25,010 23,640 18,870 28,080 20,150 to 28,630
* - Occupation generally not compensated at an hourly rate
# - No data available due to limitations in methodology Page 28 of 51PA - Statewide; MSA - Metropolitan Statistical Area;
WDA - Workforce Development Area; CTY - County
SOC
CodeOccupational Title
Educ.
Level
Area
Type
Average
Hourly
Wage ($)
Average
Annual
Wage ($)
Median
Annual
Wage ($)
Entry
Annual
Wage ($)
Exper'd
Annual
Wage ($)
PENNSYLVANIA OCCUPATIONAL WAGES
MONTGOMERY COUNTY LABOR MARKET AREA
MAY 2017(Note: When data for a specific occupation is not available, the most relevant area containing this occupation has been provided, see Area Type.)
Mid Range
Annual Wage ($)
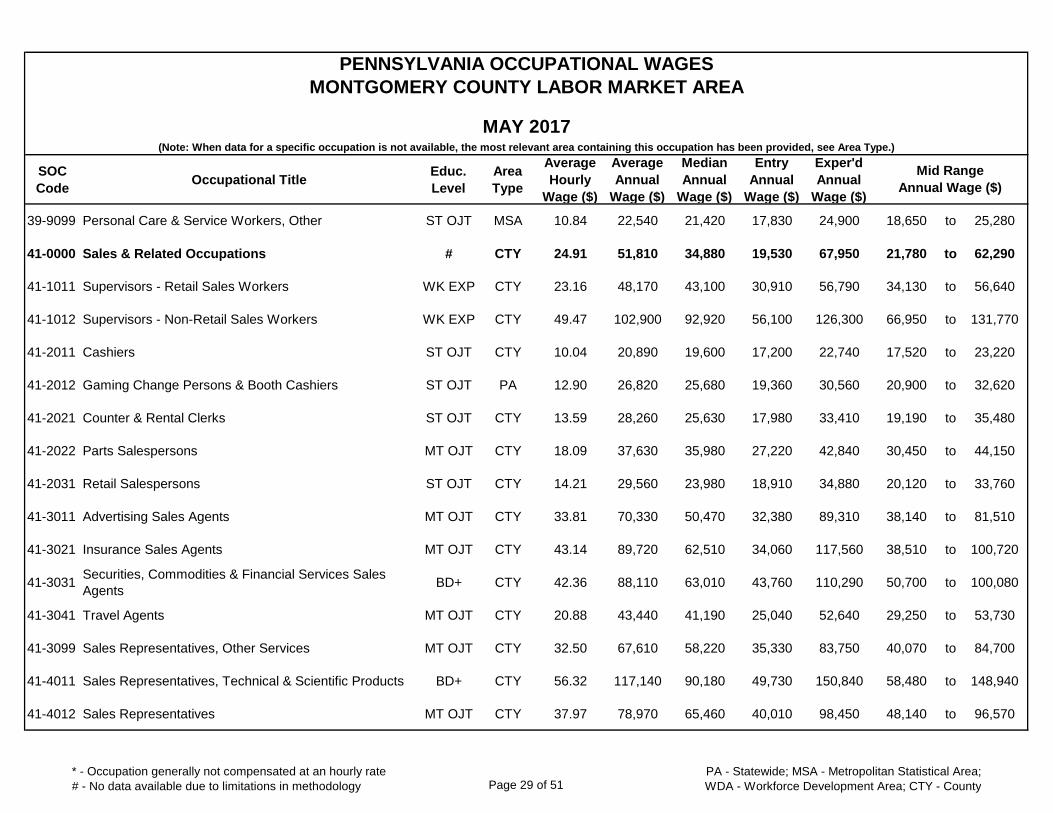
39-9099 Personal Care & Service Workers, Other ST OJT MSA 10.84 22,540 21,420 17,830 24,900 18,650 to 25,280
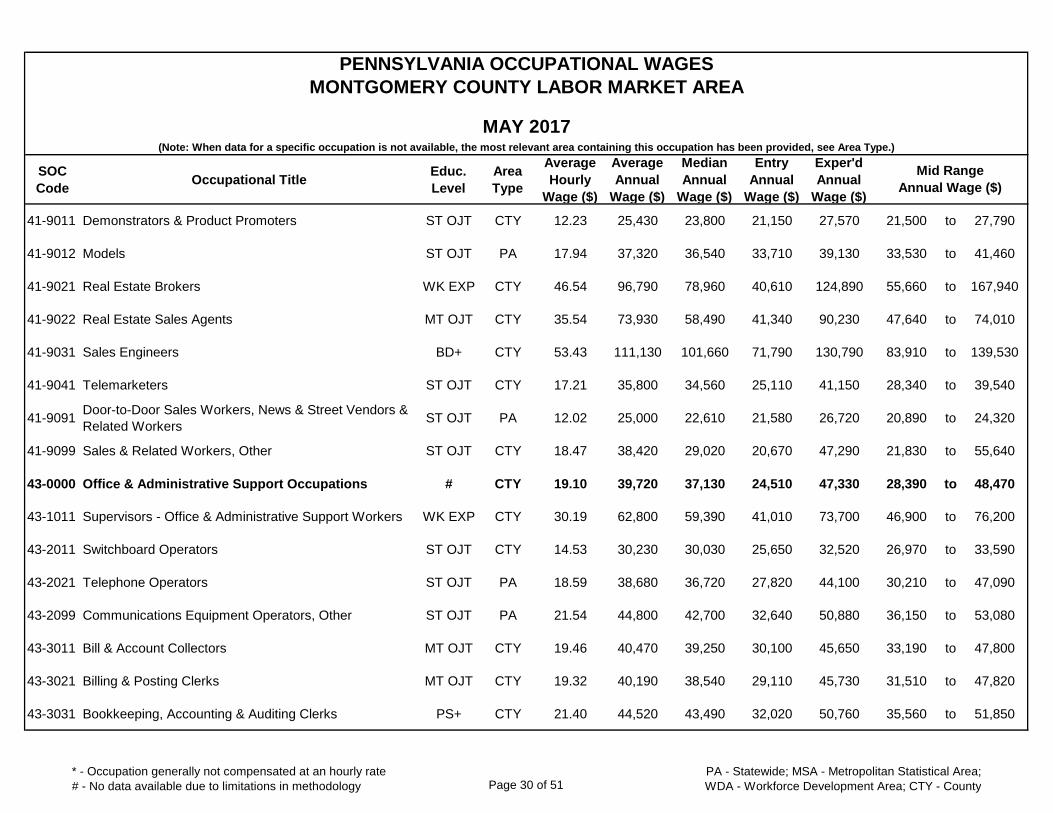
41-0000 Sales & Related Occupations # CTY 24.91 51,810 34,880 19,530 67,950 21,780 to 62,290
41-1011 Supervisors - Retail Sales Workers WK EXP CTY 23.16 48,170 43,100 30,910 56,790 34,130 to 56,640
41-1012 Supervisors - Non-Retail Sales Workers WK EXP CTY 49.47 102,900 92,920 56,100 126,300 66,950 to 131,770
41-2011 Cashiers ST OJT CTY 10.04 20,890 19,600 17,200 22,740 17,520 to 23,220
41-2012 Gaming Change Persons & Booth Cashiers ST OJT PA 12.90 26,820 25,680 19,360 30,560 20,900 to 32,620
41-2021 Counter & Rental Clerks ST OJT CTY 13.59 28,260 25,630 17,980 33,410 19,190 to 35,480
41-2022 Parts Salespersons MT OJT CTY 18.09 37,630 35,980 27,220 42,840 30,450 to 44,150
41-2031 Retail Salespersons ST OJT CTY 14.21 29,560 23,980 18,910 34,880 20,120 to 33,760
41-3011 Advertising Sales Agents MT OJT CTY 33.81 70,330 50,470 32,380 89,310 38,140 to 81,510
41-3021 Insurance Sales Agents MT OJT CTY 43.14 89,720 62,510 34,060 117,560 38,510 to 100,720
41-3031Securities, Commodities & Financial Services Sales
AgentsBD+ CTY 42.36 88,110 63,010 43,760 110,290 50,700 to 100,080
41-3041 Travel Agents MT OJT CTY 20.88 43,440 41,190 25,040 52,640 29,250 to 53,730
41-3099 Sales Representatives, Other Services MT OJT CTY 32.50 67,610 58,220 35,330 83,750 40,070 to 84,700
41-4011 Sales Representatives, Technical & Scientific Products BD+ CTY 56.32 117,140 90,180 49,730 150,840 58,480 to 148,940
41-4012 Sales Representatives MT OJT CTY 37.97 78,970 65,460 40,010 98,450 48,140 to 96,570
* - Occupation generally not compensated at an hourly rate
# - No data available due to limitations in methodology Page 29 of 51PA - Statewide; MSA - Metropolitan Statistical Area;
WDA - Workforce Development Area; CTY - County
SOC
CodeOccupational Title
Educ.
Level
Area
Type
Average
Hourly
Wage ($)
Average
Annual
Wage ($)
Median
Annual
Wage ($)
Entry
Annual
Wage ($)
Exper'd
Annual
Wage ($)
PENNSYLVANIA OCCUPATIONAL WAGES
MONTGOMERY COUNTY LABOR MARKET AREA
MAY 2017(Note: When data for a specific occupation is not available, the most relevant area containing this occupation has been provided, see Area Type.)
Mid Range
Annual Wage ($)
41-9011 Demonstrators & Product Promoters ST OJT CTY 12.23 25,430 23,800 21,150 27,570 21,500 to 27,790
41-9012 Models ST OJT PA 17.94 37,320 36,540 33,710 39,130 33,530 to 41,460
41-9021 Real Estate Brokers WK EXP CTY 46.54 96,790 78,960 40,610 124,890 55,660 to 167,940
41-9022 Real Estate Sales Agents MT OJT CTY 35.54 73,930 58,490 41,340 90,230 47,640 to 74,010
41-9031 Sales Engineers BD+ CTY 53.43 111,130 101,660 71,790 130,790 83,910 to 139,530
41-9041 Telemarketers ST OJT CTY 17.21 35,800 34,560 25,110 41,150 28,340 to 39,540
41-9091Door-to-Door Sales Workers, News & Street Vendors &
Related WorkersST OJT PA 12.02 25,000 22,610 21,580 26,720 20,890 to 24,320
41-9099 Sales & Related Workers, Other ST OJT CTY 18.47 38,420 29,020 20,670 47,290 21,830 to 55,640
43-0000 Office & Administrative Support Occupations # CTY 19.10 39,720 37,130 24,510 47,330 28,390 to 48,470
43-1011 Supervisors - Office & Administrative Support Workers WK EXP CTY 30.19 62,800 59,390 41,010 73,700 46,900 to 76,200
43-2011 Switchboard Operators ST OJT CTY 14.53 30,230 30,030 25,650 32,520 26,970 to 33,590
43-2021 Telephone Operators ST OJT PA 18.59 38,680 36,720 27,820 44,100 30,210 to 47,090
43-2099 Communications Equipment Operators, Other ST OJT PA 21.54 44,800 42,700 32,640 50,880 36,150 to 53,080
43-3011 Bill & Account Collectors MT OJT CTY 19.46 40,470 39,250 30,100 45,650 33,190 to 47,800
43-3021 Billing & Posting Clerks MT OJT CTY 19.32 40,190 38,540 29,110 45,730 31,510 to 47,820
43-3031 Bookkeeping, Accounting & Auditing Clerks PS+ CTY 21.40 44,520 43,490 32,020 50,760 35,560 to 51,850
* - Occupation generally not compensated at an hourly rate
# - No data available due to limitations in methodology Page 30 of 51PA - Statewide; MSA - Metropolitan Statistical Area;
WDA - Workforce Development Area; CTY - County
SOC
CodeOccupational Title
Educ.
Level
Area
Type
Average
Hourly
Wage ($)
Average
Annual
Wage ($)
Median
Annual
Wage ($)
Entry
Annual
Wage ($)
Exper'd
Annual
Wage ($)
PENNSYLVANIA OCCUPATIONAL WAGES
MONTGOMERY COUNTY LABOR MARKET AREA
MAY 2017(Note: When data for a specific occupation is not available, the most relevant area containing this occupation has been provided, see Area Type.)
Mid Range
Annual Wage ($)
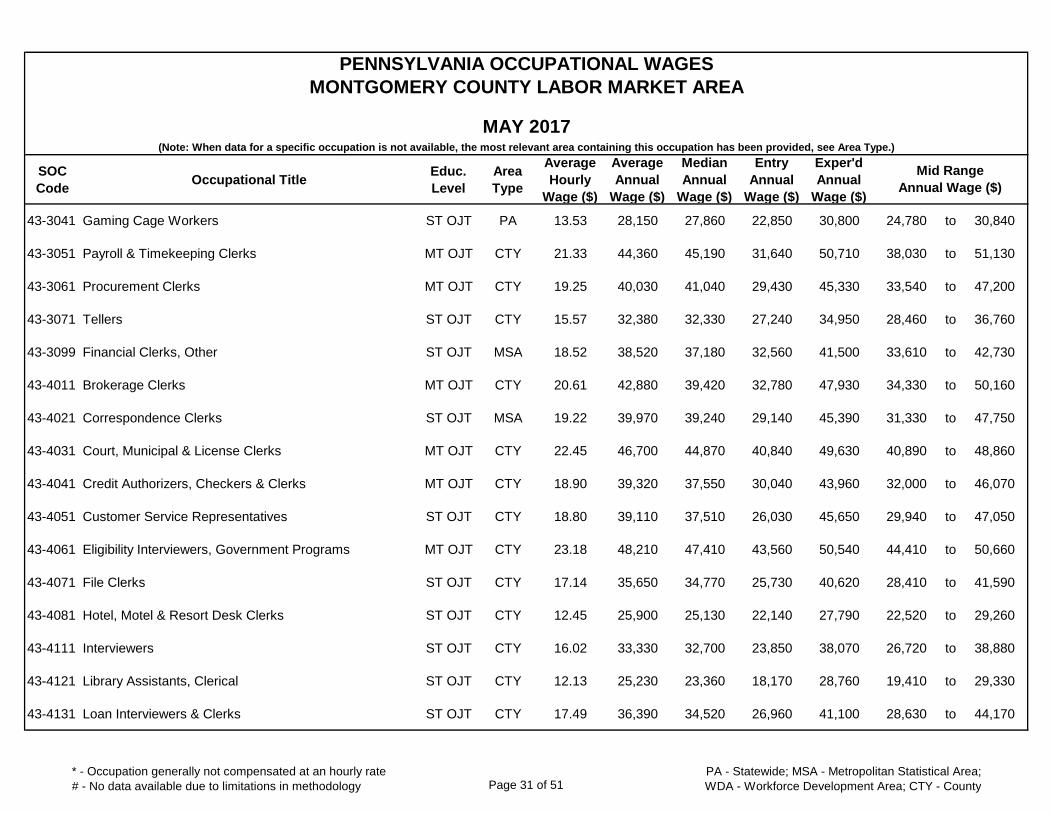
43-3041 Gaming Cage Workers ST OJT PA 13.53 28,150 27,860 22,850 30,800 24,780 to 30,840
43-3051 Payroll & Timekeeping Clerks MT OJT CTY 21.33 44,360 45,190 31,640 50,710 38,030 to 51,130
43-3061 Procurement Clerks MT OJT CTY 19.25 40,030 41,040 29,430 45,330 33,540 to 47,200
43-3071 Tellers ST OJT CTY 15.57 32,380 32,330 27,240 34,950 28,460 to 36,760
43-3099 Financial Clerks, Other ST OJT MSA 18.52 38,520 37,180 32,560 41,500 33,610 to 42,730
43-4011 Brokerage Clerks MT OJT CTY 20.61 42,880 39,420 32,780 47,930 34,330 to 50,160
43-4021 Correspondence Clerks ST OJT MSA 19.22 39,970 39,240 29,140 45,390 31,330 to 47,750
43-4031 Court, Municipal & License Clerks MT OJT CTY 22.45 46,700 44,870 40,840 49,630 40,890 to 48,860
43-4041 Credit Authorizers, Checkers & Clerks MT OJT CTY 18.90 39,320 37,550 30,040 43,960 32,000 to 46,070
43-4051 Customer Service Representatives ST OJT CTY 18.80 39,110 37,510 26,030 45,650 29,940 to 47,050
43-4061 Eligibility Interviewers, Government Programs MT OJT CTY 23.18 48,210 47,410 43,560 50,540 44,410 to 50,660
43-4071 File Clerks ST OJT CTY 17.14 35,650 34,770 25,730 40,620 28,410 to 41,590
43-4081 Hotel, Motel & Resort Desk Clerks ST OJT CTY 12.45 25,900 25,130 22,140 27,790 22,520 to 29,260
43-4111 Interviewers ST OJT CTY 16.02 33,330 32,700 23,850 38,070 26,720 to 38,880
43-4121 Library Assistants, Clerical ST OJT CTY 12.13 25,230 23,360 18,170 28,760 19,410 to 29,330
43-4131 Loan Interviewers & Clerks ST OJT CTY 17.49 36,390 34,520 26,960 41,100 28,630 to 44,170
* - Occupation generally not compensated at an hourly rate
# - No data available due to limitations in methodology Page 31 of 51PA - Statewide; MSA - Metropolitan Statistical Area;
WDA - Workforce Development Area; CTY - County
SOC
CodeOccupational Title
Educ.
Level
Area
Type
Average
Hourly
Wage ($)
Average
Annual
Wage ($)
Median
Annual
Wage ($)
Entry
Annual
Wage ($)
Exper'd
Annual
Wage ($)
PENNSYLVANIA OCCUPATIONAL WAGES
MONTGOMERY COUNTY LABOR MARKET AREA
MAY 2017(Note: When data for a specific occupation is not available, the most relevant area containing this occupation has been provided, see Area Type.)
Mid Range
Annual Wage ($)
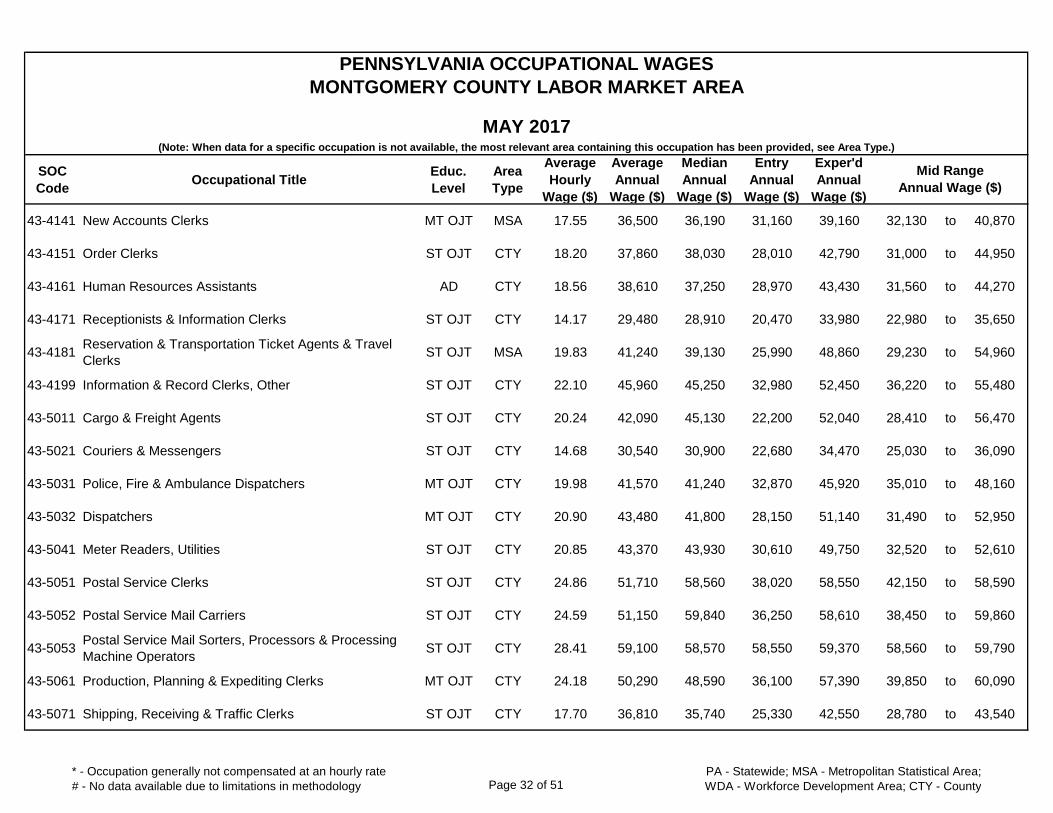
43-4141 New Accounts Clerks MT OJT MSA 17.55 36,500 36,190 31,160 39,160 32,130 to 40,870
43-4151 Order Clerks ST OJT CTY 18.20 37,860 38,030 28,010 42,790 31,000 to 44,950
43-4161 Human Resources Assistants AD CTY 18.56 38,610 37,250 28,970 43,430 31,560 to 44,270
43-4171 Receptionists & Information Clerks ST OJT CTY 14.17 29,480 28,910 20,470 33,980 22,980 to 35,650
43-4181Reservation & Transportation Ticket Agents & Travel
ClerksST OJT MSA 19.83 41,240 39,130 25,990 48,860 29,230 to 54,960
43-4199 Information & Record Clerks, Other ST OJT CTY 22.10 45,960 45,250 32,980 52,450 36,220 to 55,480
43-5011 Cargo & Freight Agents ST OJT CTY 20.24 42,090 45,130 22,200 52,040 28,410 to 56,470
43-5021 Couriers & Messengers ST OJT CTY 14.68 30,540 30,900 22,680 34,470 25,030 to 36,090
43-5031 Police, Fire & Ambulance Dispatchers MT OJT CTY 19.98 41,570 41,240 32,870 45,920 35,010 to 48,160
43-5032 Dispatchers MT OJT CTY 20.90 43,480 41,800 28,150 51,140 31,490 to 52,950
43-5041 Meter Readers, Utilities ST OJT CTY 20.85 43,370 43,930 30,610 49,750 32,520 to 52,610
43-5051 Postal Service Clerks ST OJT CTY 24.86 51,710 58,560 38,020 58,550 42,150 to 58,590
43-5052 Postal Service Mail Carriers ST OJT CTY 24.59 51,150 59,840 36,250 58,610 38,450 to 59,860
43-5053Postal Service Mail Sorters, Processors & Processing
Machine OperatorsST OJT CTY 28.41 59,100 58,570 58,550 59,370 58,560 to 59,790
43-5061 Production, Planning & Expediting Clerks MT OJT CTY 24.18 50,290 48,590 36,100 57,390 39,850 to 60,090
43-5071 Shipping, Receiving & Traffic Clerks ST OJT CTY 17.70 36,810 35,740 25,330 42,550 28,780 to 43,540
* - Occupation generally not compensated at an hourly rate
# - No data available due to limitations in methodology Page 32 of 51PA - Statewide; MSA - Metropolitan Statistical Area;
WDA - Workforce Development Area; CTY - County

SOC
CodeOccupational Title
Educ.
Level
Area
Type
Average
Hourly
Wage ($)
Average
Annual
Wage ($)
Median
Annual
Wage ($)
Entry
Annual
Wage ($)
Exper'd
Annual
Wage ($)
PENNSYLVANIA OCCUPATIONAL WAGES
MONTGOMERY COUNTY LABOR MARKET AREA
MAY 2017(Note: When data for a specific occupation is not available, the most relevant area containing this occupation has been provided, see Area Type.)
Mid Range
Annual Wage ($)
43-5081 Stock Clerks & Order Fillers ST OJT CTY 12.41 25,810 24,010 19,230 29,100 20,410 to 29,900
43-5111Weighers, Measurers, Checkers & Samplers,
RecordkeepingST OJT CTY 17.89 37,210 34,530 28,280 41,680 29,550 to 43,600
43-6011Executive Secretaries & Executive Administrative
AssistantsWK EXP CTY 30.54 63,520 62,580 43,710 73,430 50,560 to 75,680
43-6012 Legal Secretaries MT OJT CTY 28.57 59,430 58,960 50,260 64,020 52,840 to 66,590
43-6013 Medical Secretaries MT OJT CTY 18.31 38,090 38,560 27,200 43,540 30,780 to 46,190
43-6014 Secretaries ST OJT CTY 18.50 38,470 37,610 26,590 44,420 30,420 to 46,750
43-9011 Computer Operators MT OJT CTY 18.91 39,340 37,330 28,240 44,890 30,760 to 47,090
43-9021 Data Entry Keyers ST OJT CTY 15.48 32,190 30,970 22,060 37,250 24,090 to 37,880
43-9022 Word Processors & Typists ST OJT CTY 16.64 34,610 35,090 23,740 40,050 30,670 to 40,920
43-9031 Desktop Publishers AD CTY 25.89 53,850 46,380 31,810 64,870 34,880 to 74,930
43-9041 Insurance Claims & Policy Processing Clerks MT OJT CTY 20.81 43,280 43,060 33,500 48,160 35,910 to 49,690
43-9051 Mail Clerks & Mail Machine Operators ST OJT CTY 16.85 35,060 34,720 23,410 40,880 26,540 to 44,190
43-9061 Office Clerks, General ST OJT CTY 17.58 36,570 35,010 23,120 43,290 26,640 to 45,370
43-9071 Office Machine Operators ST OJT CTY 13.85 28,810 29,060 18,740 33,850 20,110 to 36,710
43-9081 Proofreaders & Copy Markers BD MSA 19.57 40,700 37,620 23,620 49,250 27,050 to 55,430
43-9111 Statistical Assistants BD CTY 25.33 52,690 51,660 37,350 60,360 39,360 to 64,330
* - Occupation generally not compensated at an hourly rate
# - No data available due to limitations in methodology Page 33 of 51PA - Statewide; MSA - Metropolitan Statistical Area;
WDA - Workforce Development Area; CTY - County
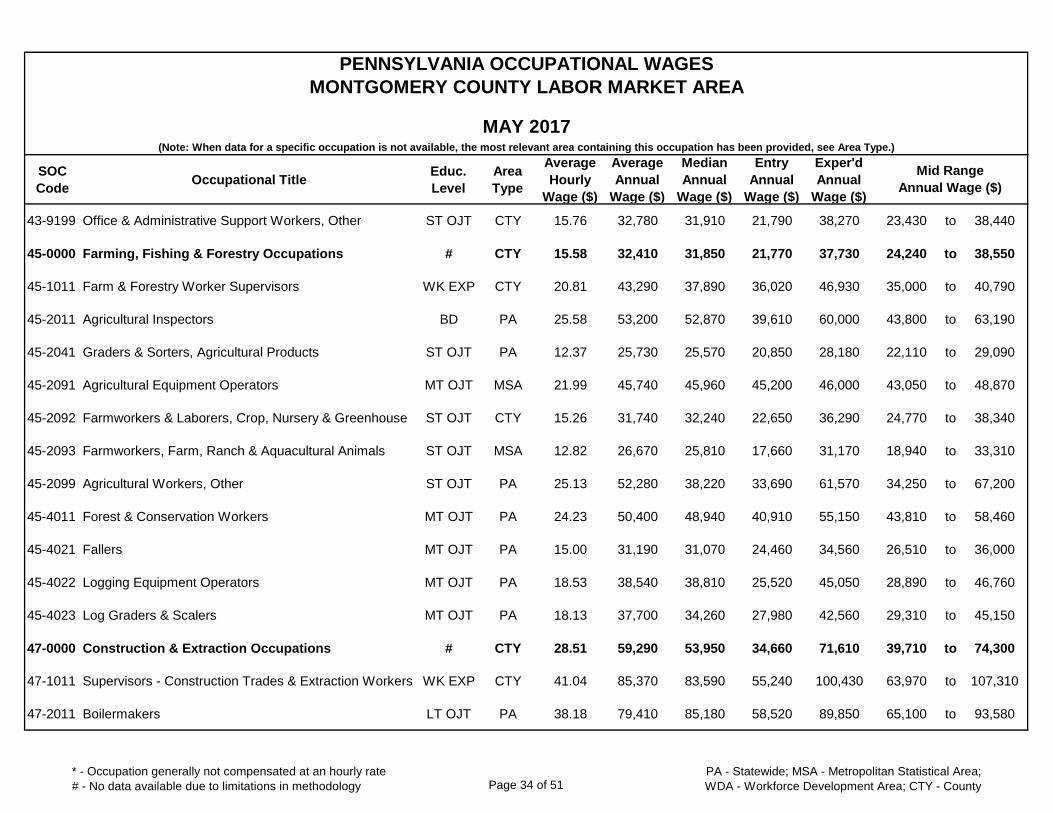
SOC
CodeOccupational Title
Educ.
Level
Area
Type
Average
Hourly
Wage ($)
Average
Annual
Wage ($)
Median
Annual
Wage ($)
Entry
Annual
Wage ($)
Exper'd
Annual
Wage ($)
PENNSYLVANIA OCCUPATIONAL WAGES
MONTGOMERY COUNTY LABOR MARKET AREA
MAY 2017(Note: When data for a specific occupation is not available, the most relevant area containing this occupation has been provided, see Area Type.)
Mid Range
Annual Wage ($)
43-9199 Office & Administrative Support Workers, Other ST OJT CTY 15.76 32,780 31,910 21,790 38,270 23,430 to 38,440
45-0000 Farming, Fishing & Forestry Occupations # CTY 15.58 32,410 31,850 21,770 37,730 24,240 to 38,550
45-1011 Farm & Forestry Worker Supervisors WK EXP CTY 20.81 43,290 37,890 36,020 46,930 35,000 to 40,790
45-2011 Agricultural Inspectors BD PA 25.58 53,200 52,870 39,610 60,000 43,800 to 63,190
45-2041 Graders & Sorters, Agricultural Products ST OJT PA 12.37 25,730 25,570 20,850 28,180 22,110 to 29,090
45-2091 Agricultural Equipment Operators MT OJT MSA 21.99 45,740 45,960 45,200 46,000 43,050 to 48,870
45-2092 Farmworkers & Laborers, Crop, Nursery & Greenhouse ST OJT CTY 15.26 31,740 32,240 22,650 36,290 24,770 to 38,340
45-2093 Farmworkers, Farm, Ranch & Aquacultural Animals ST OJT MSA 12.82 26,670 25,810 17,660 31,170 18,940 to 33,310
45-2099 Agricultural Workers, Other ST OJT PA 25.13 52,280 38,220 33,690 61,570 34,250 to 67,200
45-4011 Forest & Conservation Workers MT OJT PA 24.23 50,400 48,940 40,910 55,150 43,810 to 58,460
45-4021 Fallers MT OJT PA 15.00 31,190 31,070 24,460 34,560 26,510 to 36,000
45-4022 Logging Equipment Operators MT OJT PA 18.53 38,540 38,810 25,520 45,050 28,890 to 46,760
45-4023 Log Graders & Scalers MT OJT PA 18.13 37,700 34,260 27,980 42,560 29,310 to 45,150
47-0000 Construction & Extraction Occupations # CTY 28.51 59,290 53,950 34,660 71,610 39,710 to 74,300
47-1011 Supervisors - Construction Trades & Extraction Workers WK EXP CTY 41.04 85,370 83,590 55,240 100,430 63,970 to 107,310
47-2011 Boilermakers LT OJT PA 38.18 79,410 85,180 58,520 89,850 65,100 to 93,580
* - Occupation generally not compensated at an hourly rate
# - No data available due to limitations in methodology Page 34 of 51PA - Statewide; MSA - Metropolitan Statistical Area;
WDA - Workforce Development Area; CTY - County
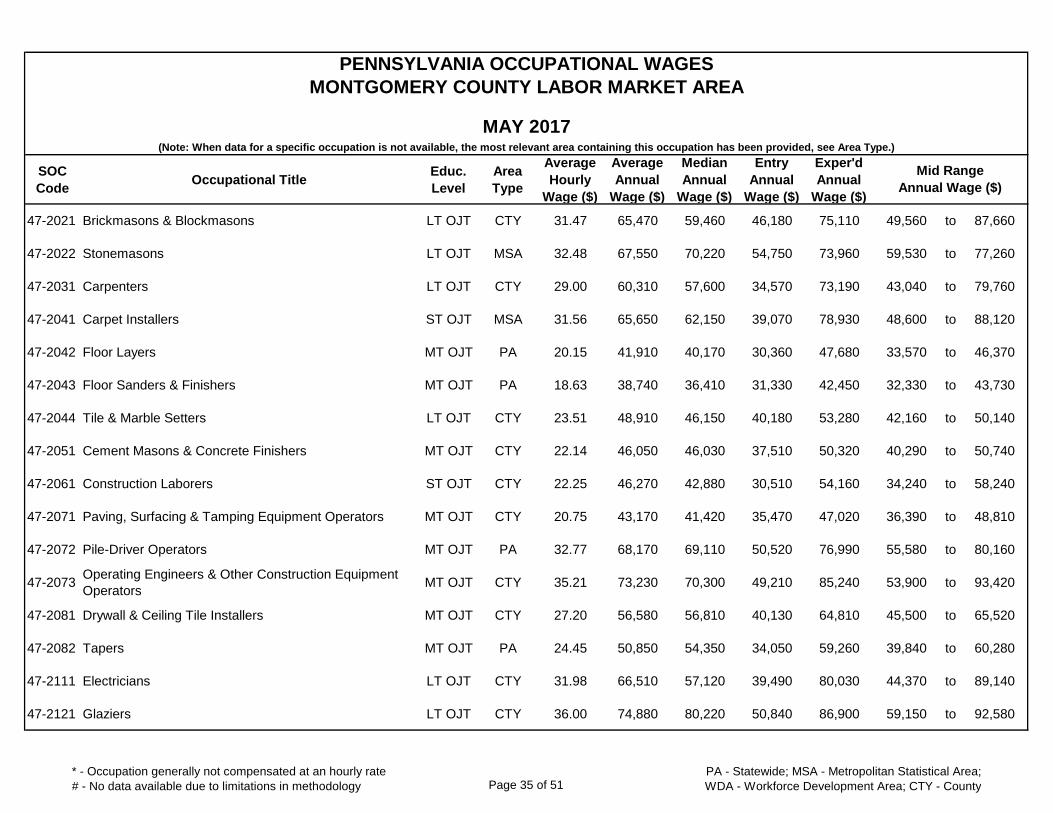
SOC
CodeOccupational Title
Educ.
Level
Area
Type
Average
Hourly
Wage ($)
Average
Annual
Wage ($)
Median
Annual
Wage ($)
Entry
Annual
Wage ($)
Exper'd
Annual
Wage ($)
PENNSYLVANIA OCCUPATIONAL WAGES
MONTGOMERY COUNTY LABOR MARKET AREA
MAY 2017(Note: When data for a specific occupation is not available, the most relevant area containing this occupation has been provided, see Area Type.)
Mid Range
Annual Wage ($)
47-2021 Brickmasons & Blockmasons LT OJT CTY 31.47 65,470 59,460 46,180 75,110 49,560 to 87,660
47-2022 Stonemasons LT OJT MSA 32.48 67,550 70,220 54,750 73,960 59,530 to 77,260
47-2031 Carpenters LT OJT CTY 29.00 60,310 57,600 34,570 73,190 43,040 to 79,760
47-2041 Carpet Installers ST OJT MSA 31.56 65,650 62,150 39,070 78,930 48,600 to 88,120
47-2042 Floor Layers MT OJT PA 20.15 41,910 40,170 30,360 47,680 33,570 to 46,370
47-2043 Floor Sanders & Finishers MT OJT PA 18.63 38,740 36,410 31,330 42,450 32,330 to 43,730
47-2044 Tile & Marble Setters LT OJT CTY 23.51 48,910 46,150 40,180 53,280 42,160 to 50,140
47-2051 Cement Masons & Concrete Finishers MT OJT CTY 22.14 46,050 46,030 37,510 50,320 40,290 to 50,740
47-2061 Construction Laborers ST OJT CTY 22.25 46,270 42,880 30,510 54,160 34,240 to 58,240
47-2071 Paving, Surfacing & Tamping Equipment Operators MT OJT CTY 20.75 43,170 41,420 35,470 47,020 36,390 to 48,810
47-2072 Pile-Driver Operators MT OJT PA 32.77 68,170 69,110 50,520 76,990 55,580 to 80,160
47-2073Operating Engineers & Other Construction Equipment
OperatorsMT OJT CTY 35.21 73,230 70,300 49,210 85,240 53,900 to 93,420
47-2081 Drywall & Ceiling Tile Installers MT OJT CTY 27.20 56,580 56,810 40,130 64,810 45,500 to 65,520
47-2082 Tapers MT OJT PA 24.45 50,850 54,350 34,050 59,260 39,840 to 60,280
47-2111 Electricians LT OJT CTY 31.98 66,510 57,120 39,490 80,030 44,370 to 89,140
47-2121 Glaziers LT OJT CTY 36.00 74,880 80,220 50,840 86,900 59,150 to 92,580
* - Occupation generally not compensated at an hourly rate
# - No data available due to limitations in methodology Page 35 of 51PA - Statewide; MSA - Metropolitan Statistical Area;
WDA - Workforce Development Area; CTY - County
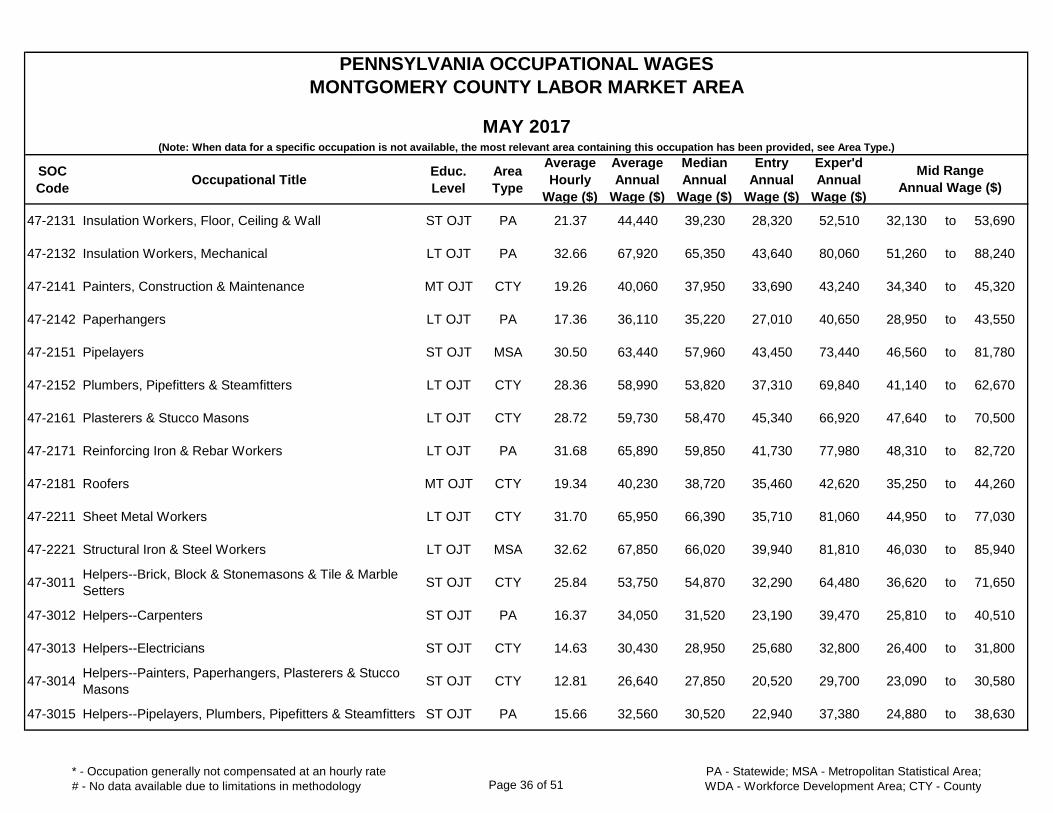
SOC
CodeOccupational Title
Educ.
Level
Area
Type
Average
Hourly
Wage ($)
Average
Annual
Wage ($)
Median
Annual
Wage ($)
Entry
Annual
Wage ($)
Exper'd
Annual
Wage ($)
PENNSYLVANIA OCCUPATIONAL WAGES
MONTGOMERY COUNTY LABOR MARKET AREA
MAY 2017(Note: When data for a specific occupation is not available, the most relevant area containing this occupation has been provided, see Area Type.)
Mid Range
Annual Wage ($)
47-2131 Insulation Workers, Floor, Ceiling & Wall ST OJT PA 21.37 44,440 39,230 28,320 52,510 32,130 to 53,690
47-2132 Insulation Workers, Mechanical LT OJT PA 32.66 67,920 65,350 43,640 80,060 51,260 to 88,240
47-2141 Painters, Construction & Maintenance MT OJT CTY 19.26 40,060 37,950 33,690 43,240 34,340 to 45,320
47-2142 Paperhangers LT OJT PA 17.36 36,110 35,220 27,010 40,650 28,950 to 43,550
47-2151 Pipelayers ST OJT MSA 30.50 63,440 57,960 43,450 73,440 46,560 to 81,780
47-2152 Plumbers, Pipefitters & Steamfitters LT OJT CTY 28.36 58,990 53,820 37,310 69,840 41,140 to 62,670
47-2161 Plasterers & Stucco Masons LT OJT CTY 28.72 59,730 58,470 45,340 66,920 47,640 to 70,500
47-2171 Reinforcing Iron & Rebar Workers LT OJT PA 31.68 65,890 59,850 41,730 77,980 48,310 to 82,720
47-2181 Roofers MT OJT CTY 19.34 40,230 38,720 35,460 42,620 35,250 to 44,260
47-2211 Sheet Metal Workers LT OJT CTY 31.70 65,950 66,390 35,710 81,060 44,950 to 77,030
47-2221 Structural Iron & Steel Workers LT OJT MSA 32.62 67,850 66,020 39,940 81,810 46,030 to 85,940
47-3011Helpers--Brick, Block & Stonemasons & Tile & Marble
SettersST OJT CTY 25.84 53,750 54,870 32,290 64,480 36,620 to 71,650
47-3012 Helpers--Carpenters ST OJT PA 16.37 34,050 31,520 23,190 39,470 25,810 to 40,510
47-3013 Helpers--Electricians ST OJT CTY 14.63 30,430 28,950 25,680 32,800 26,400 to 31,800
47-3014Helpers--Painters, Paperhangers, Plasterers & Stucco
MasonsST OJT CTY 12.81 26,640 27,850 20,520 29,700 23,090 to 30,580
47-3015 Helpers--Pipelayers, Plumbers, Pipefitters & Steamfitters ST OJT PA 15.66 32,560 30,520 22,940 37,380 24,880 to 38,630
* - Occupation generally not compensated at an hourly rate
# - No data available due to limitations in methodology Page 36 of 51PA - Statewide; MSA - Metropolitan Statistical Area;
WDA - Workforce Development Area; CTY - County
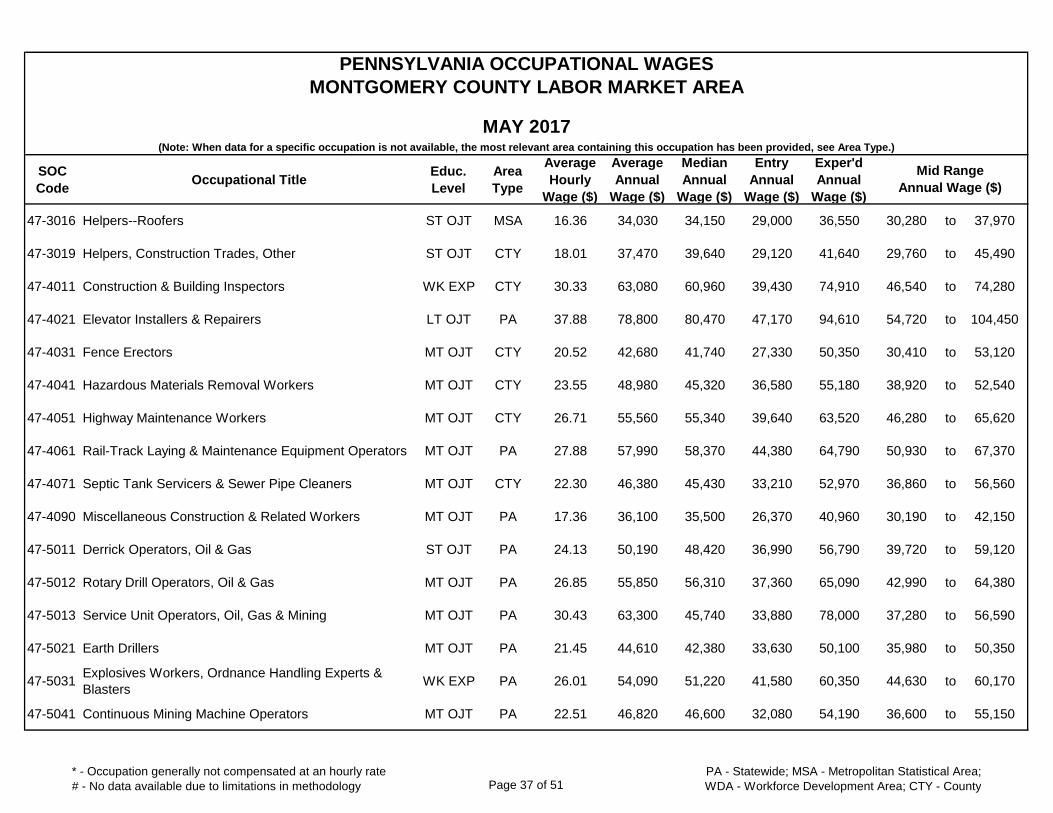
SOC
CodeOccupational Title
Educ.
Level
Area
Type
Average
Hourly
Wage ($)
Average
Annual
Wage ($)
Median
Annual
Wage ($)
Entry
Annual
Wage ($)
Exper'd
Annual
Wage ($)
PENNSYLVANIA OCCUPATIONAL WAGES
MONTGOMERY COUNTY LABOR MARKET AREA
MAY 2017(Note: When data for a specific occupation is not available, the most relevant area containing this occupation has been provided, see Area Type.)
Mid Range
Annual Wage ($)
47-3016 Helpers--Roofers ST OJT MSA 16.36 34,030 34,150 29,000 36,550 30,280 to 37,970
47-3019 Helpers, Construction Trades, Other ST OJT CTY 18.01 37,470 39,640 29,120 41,640 29,760 to 45,490
47-4011 Construction & Building Inspectors WK EXP CTY 30.33 63,080 60,960 39,430 74,910 46,540 to 74,280
47-4021 Elevator Installers & Repairers LT OJT PA 37.88 78,800 80,470 47,170 94,610 54,720 to 104,450
47-4031 Fence Erectors MT OJT CTY 20.52 42,680 41,740 27,330 50,350 30,410 to 53,120
47-4041 Hazardous Materials Removal Workers MT OJT CTY 23.55 48,980 45,320 36,580 55,180 38,920 to 52,540
47-4051 Highway Maintenance Workers MT OJT CTY 26.71 55,560 55,340 39,640 63,520 46,280 to 65,620
47-4061 Rail-Track Laying & Maintenance Equipment Operators MT OJT PA 27.88 57,990 58,370 44,380 64,790 50,930 to 67,370
47-4071 Septic Tank Servicers & Sewer Pipe Cleaners MT OJT CTY 22.30 46,380 45,430 33,210 52,970 36,860 to 56,560
47-4090 Miscellaneous Construction & Related Workers MT OJT PA 17.36 36,100 35,500 26,370 40,960 30,190 to 42,150
47-5011 Derrick Operators, Oil & Gas ST OJT PA 24.13 50,190 48,420 36,990 56,790 39,720 to 59,120
47-5012 Rotary Drill Operators, Oil & Gas MT OJT PA 26.85 55,850 56,310 37,360 65,090 42,990 to 64,380
47-5013 Service Unit Operators, Oil, Gas & Mining MT OJT PA 30.43 63,300 45,740 33,880 78,000 37,280 to 56,590
47-5021 Earth Drillers MT OJT PA 21.45 44,610 42,380 33,630 50,100 35,980 to 50,350
47-5031Explosives Workers, Ordnance Handling Experts &
BlastersWK EXP PA 26.01 54,090 51,220 41,580 60,350 44,630 to 60,170
47-5041 Continuous Mining Machine Operators MT OJT PA 22.51 46,820 46,600 32,080 54,190 36,600 to 55,150
* - Occupation generally not compensated at an hourly rate
# - No data available due to limitations in methodology Page 37 of 51PA - Statewide; MSA - Metropolitan Statistical Area;
WDA - Workforce Development Area; CTY - County
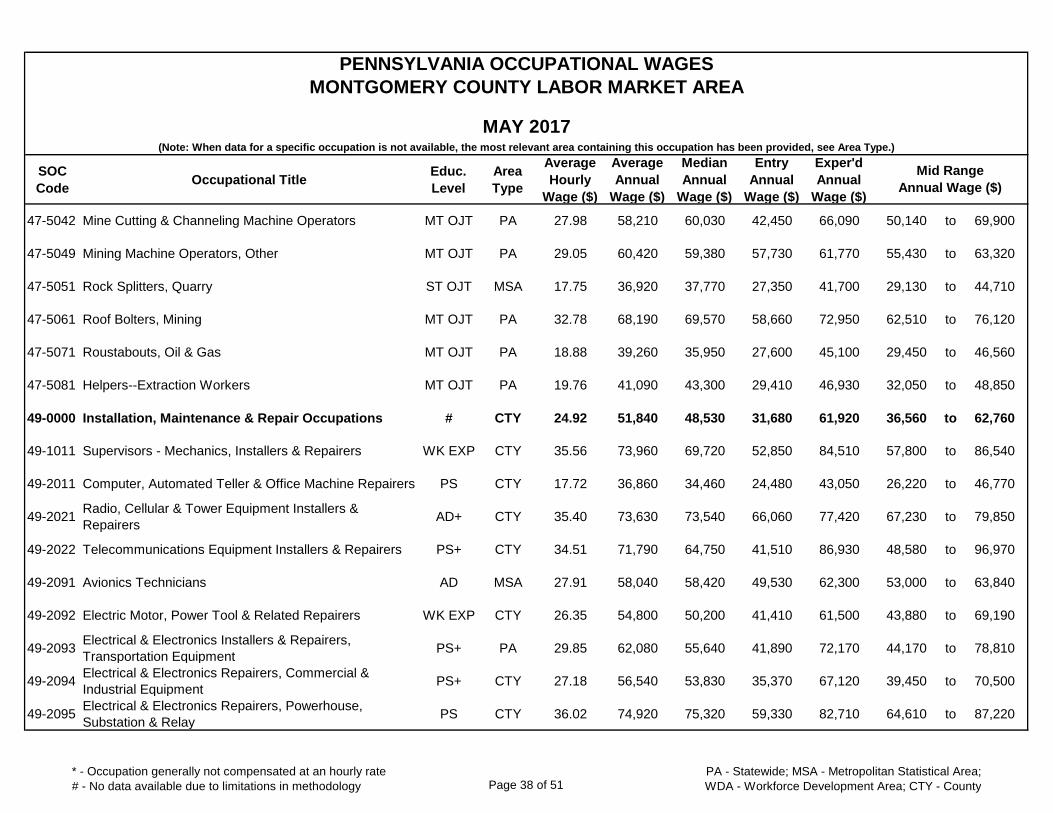
SOC
CodeOccupational Title
Educ.
Level
Area
Type
Average
Hourly
Wage ($)
Average
Annual
Wage ($)
Median
Annual
Wage ($)
Entry
Annual
Wage ($)
Exper'd
Annual
Wage ($)
PENNSYLVANIA OCCUPATIONAL WAGES
MONTGOMERY COUNTY LABOR MARKET AREA
MAY 2017(Note: When data for a specific occupation is not available, the most relevant area containing this occupation has been provided, see Area Type.)
Mid Range
Annual Wage ($)
47-5042 Mine Cutting & Channeling Machine Operators MT OJT PA 27.98 58,210 60,030 42,450 66,090 50,140 to 69,900
47-5049 Mining Machine Operators, Other MT OJT PA 29.05 60,420 59,380 57,730 61,770 55,430 to 63,320
47-5051 Rock Splitters, Quarry ST OJT MSA 17.75 36,920 37,770 27,350 41,700 29,130 to 44,710
47-5061 Roof Bolters, Mining MT OJT PA 32.78 68,190 69,570 58,660 72,950 62,510 to 76,120
47-5071 Roustabouts, Oil & Gas MT OJT PA 18.88 39,260 35,950 27,600 45,100 29,450 to 46,560
47-5081 Helpers--Extraction Workers MT OJT PA 19.76 41,090 43,300 29,410 46,930 32,050 to 48,850
49-0000 Installation, Maintenance & Repair Occupations # CTY 24.92 51,840 48,530 31,680 61,920 36,560 to 62,760
49-1011 Supervisors - Mechanics, Installers & Repairers WK EXP CTY 35.56 73,960 69,720 52,850 84,510 57,800 to 86,540
49-2011 Computer, Automated Teller & Office Machine Repairers PS CTY 17.72 36,860 34,460 24,480 43,050 26,220 to 46,770
49-2021Radio, Cellular & Tower Equipment Installers &
RepairersAD+ CTY 35.40 73,630 73,540 66,060 77,420 67,230 to 79,850
49-2022 Telecommunications Equipment Installers & Repairers PS+ CTY 34.51 71,790 64,750 41,510 86,930 48,580 to 96,970
49-2091 Avionics Technicians AD MSA 27.91 58,040 58,420 49,530 62,300 53,000 to 63,840
49-2092 Electric Motor, Power Tool & Related Repairers WK EXP CTY 26.35 54,800 50,200 41,410 61,500 43,880 to 69,190
49-2093Electrical & Electronics Installers & Repairers,
Transportation EquipmentPS+ PA 29.85 62,080 55,640 41,890 72,170 44,170 to 78,810
49-2094Electrical & Electronics Repairers, Commercial &
Industrial EquipmentPS+ CTY 27.18 56,540 53,830 35,370 67,120 39,450 to 70,500
49-2095Electrical & Electronics Repairers, Powerhouse,
Substation & RelayPS CTY 36.02 74,920 75,320 59,330 82,710 64,610 to 87,220
* - Occupation generally not compensated at an hourly rate
# - No data available due to limitations in methodology Page 38 of 51PA - Statewide; MSA - Metropolitan Statistical Area;
WDA - Workforce Development Area; CTY - County
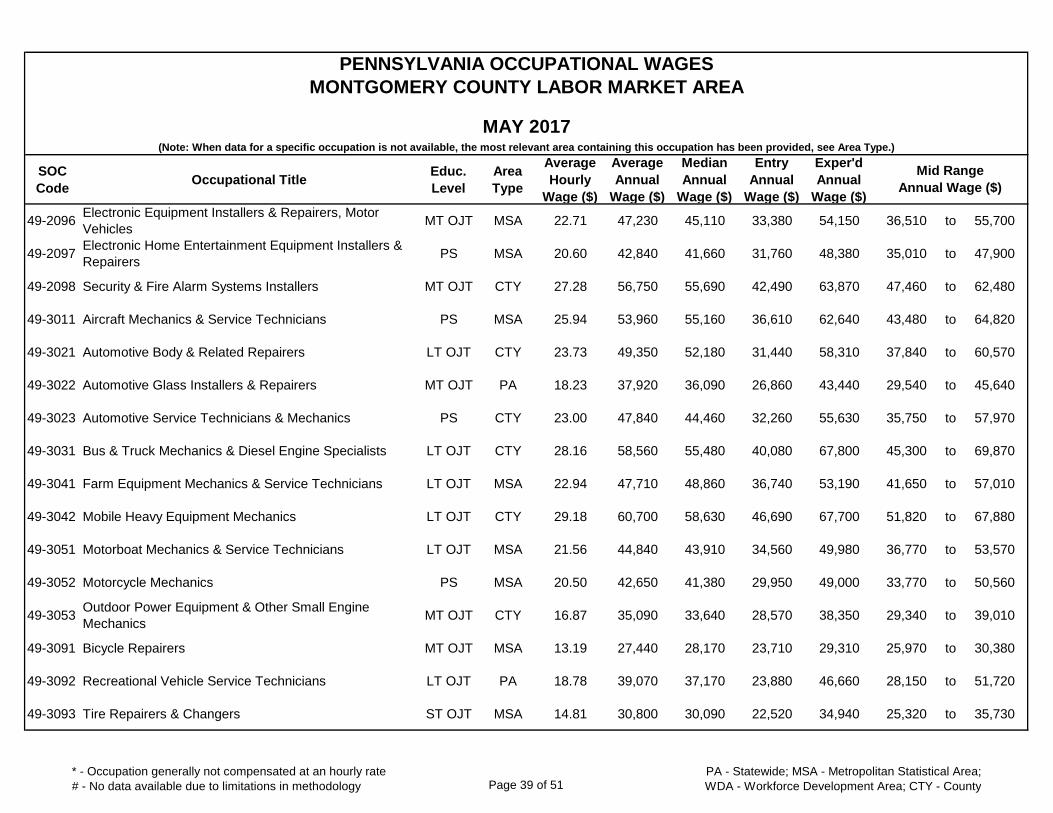
SOC
CodeOccupational Title
Educ.
Level
Area
Type
Average
Hourly
Wage ($)
Average
Annual
Wage ($)
Median
Annual
Wage ($)
Entry
Annual
Wage ($)
Exper'd
Annual
Wage ($)
PENNSYLVANIA OCCUPATIONAL WAGES
MONTGOMERY COUNTY LABOR MARKET AREA
MAY 2017(Note: When data for a specific occupation is not available, the most relevant area containing this occupation has been provided, see Area Type.)
Mid Range
Annual Wage ($)
49-2096Electronic Equipment Installers & Repairers, Motor
VehiclesMT OJT MSA 22.71 47,230 45,110 33,380 54,150 36,510 to 55,700
49-2097Electronic Home Entertainment Equipment Installers &
RepairersPS MSA 20.60 42,840 41,660 31,760 48,380 35,010 to 47,900
49-2098 Security & Fire Alarm Systems Installers MT OJT CTY 27.28 56,750 55,690 42,490 63,870 47,460 to 62,480
49-3011 Aircraft Mechanics & Service Technicians PS MSA 25.94 53,960 55,160 36,610 62,640 43,480 to 64,820
49-3021 Automotive Body & Related Repairers LT OJT CTY 23.73 49,350 52,180 31,440 58,310 37,840 to 60,570
49-3022 Automotive Glass Installers & Repairers MT OJT PA 18.23 37,920 36,090 26,860 43,440 29,540 to 45,640
49-3023 Automotive Service Technicians & Mechanics PS CTY 23.00 47,840 44,460 32,260 55,630 35,750 to 57,970
49-3031 Bus & Truck Mechanics & Diesel Engine Specialists LT OJT CTY 28.16 58,560 55,480 40,080 67,800 45,300 to 69,870
49-3041 Farm Equipment Mechanics & Service Technicians LT OJT MSA 22.94 47,710 48,860 36,740 53,190 41,650 to 57,010
49-3042 Mobile Heavy Equipment Mechanics LT OJT CTY 29.18 60,700 58,630 46,690 67,700 51,820 to 67,880
49-3051 Motorboat Mechanics & Service Technicians LT OJT MSA 21.56 44,840 43,910 34,560 49,980 36,770 to 53,570
49-3052 Motorcycle Mechanics PS MSA 20.50 42,650 41,380 29,950 49,000 33,770 to 50,560
49-3053Outdoor Power Equipment & Other Small Engine
MechanicsMT OJT CTY 16.87 35,090 33,640 28,570 38,350 29,340 to 39,010
49-3091 Bicycle Repairers MT OJT MSA 13.19 27,440 28,170 23,710 29,310 25,970 to 30,380
49-3092 Recreational Vehicle Service Technicians LT OJT PA 18.78 39,070 37,170 23,880 46,660 28,150 to 51,720
49-3093 Tire Repairers & Changers ST OJT MSA 14.81 30,800 30,090 22,520 34,940 25,320 to 35,730
* - Occupation generally not compensated at an hourly rate
# - No data available due to limitations in methodology Page 39 of 51PA - Statewide; MSA - Metropolitan Statistical Area;
WDA - Workforce Development Area; CTY - County
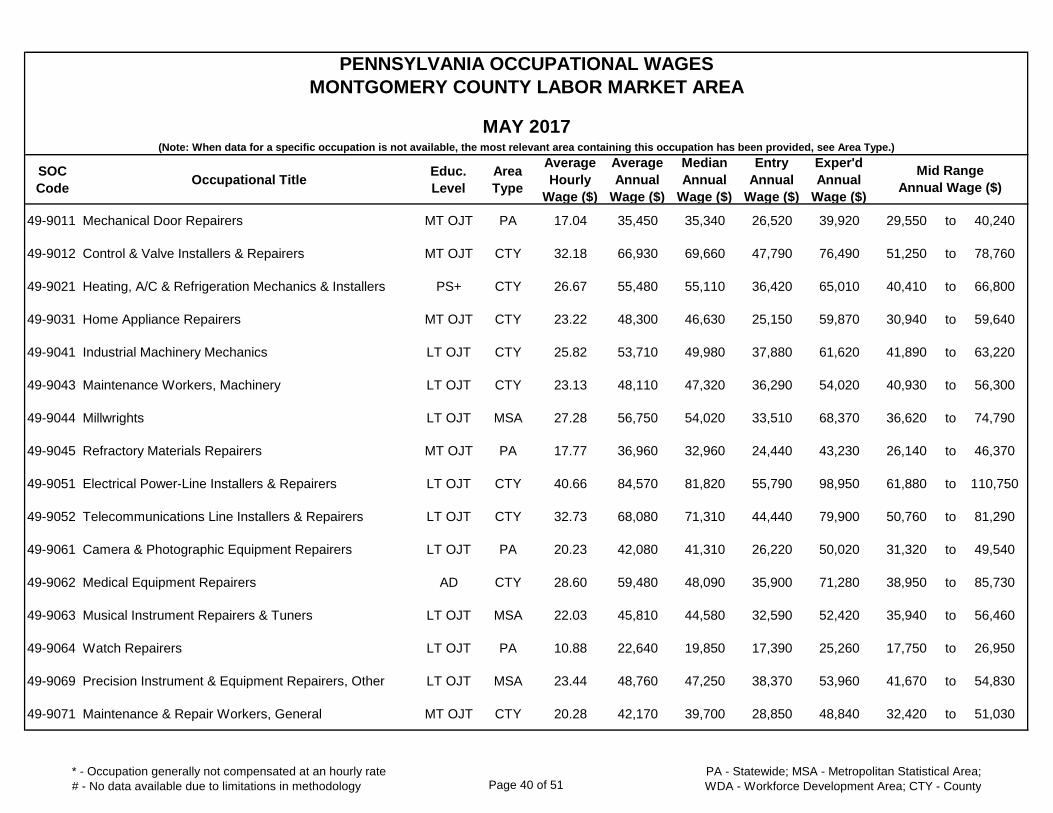
SOC
CodeOccupational Title
Educ.
Level
Area
Type
Average
Hourly
Wage ($)
Average
Annual
Wage ($)
Median
Annual
Wage ($)
Entry
Annual
Wage ($)
Exper'd
Annual
Wage ($)
PENNSYLVANIA OCCUPATIONAL WAGES
MONTGOMERY COUNTY LABOR MARKET AREA
MAY 2017(Note: When data for a specific occupation is not available, the most relevant area containing this occupation has been provided, see Area Type.)
Mid Range
Annual Wage ($)
49-9011 Mechanical Door Repairers MT OJT PA 17.04 35,450 35,340 26,520 39,920 29,550 to 40,240
49-9012 Control & Valve Installers & Repairers MT OJT CTY 32.18 66,930 69,660 47,790 76,490 51,250 to 78,760
49-9021 Heating, A/C & Refrigeration Mechanics & Installers PS+ CTY 26.67 55,480 55,110 36,420 65,010 40,410 to 66,800
49-9031 Home Appliance Repairers MT OJT CTY 23.22 48,300 46,630 25,150 59,870 30,940 to 59,640
49-9041 Industrial Machinery Mechanics LT OJT CTY 25.82 53,710 49,980 37,880 61,620 41,890 to 63,220
49-9043 Maintenance Workers, Machinery LT OJT CTY 23.13 48,110 47,320 36,290 54,020 40,930 to 56,300
49-9044 Millwrights LT OJT MSA 27.28 56,750 54,020 33,510 68,370 36,620 to 74,790
49-9045 Refractory Materials Repairers MT OJT PA 17.77 36,960 32,960 24,440 43,230 26,140 to 46,370
49-9051 Electrical Power-Line Installers & Repairers LT OJT CTY 40.66 84,570 81,820 55,790 98,950 61,880 to 110,750
49-9052 Telecommunications Line Installers & Repairers LT OJT CTY 32.73 68,080 71,310 44,440 79,900 50,760 to 81,290
49-9061 Camera & Photographic Equipment Repairers LT OJT PA 20.23 42,080 41,310 26,220 50,020 31,320 to 49,540
49-9062 Medical Equipment Repairers AD CTY 28.60 59,480 48,090 35,900 71,280 38,950 to 85,730
49-9063 Musical Instrument Repairers & Tuners LT OJT MSA 22.03 45,810 44,580 32,590 52,420 35,940 to 56,460
49-9064 Watch Repairers LT OJT PA 10.88 22,640 19,850 17,390 25,260 17,750 to 26,950
49-9069 Precision Instrument & Equipment Repairers, Other LT OJT MSA 23.44 48,760 47,250 38,370 53,960 41,670 to 54,830
49-9071 Maintenance & Repair Workers, General MT OJT CTY 20.28 42,170 39,700 28,850 48,840 32,420 to 51,030
* - Occupation generally not compensated at an hourly rate
# - No data available due to limitations in methodology Page 40 of 51PA - Statewide; MSA - Metropolitan Statistical Area;
WDA - Workforce Development Area; CTY - County
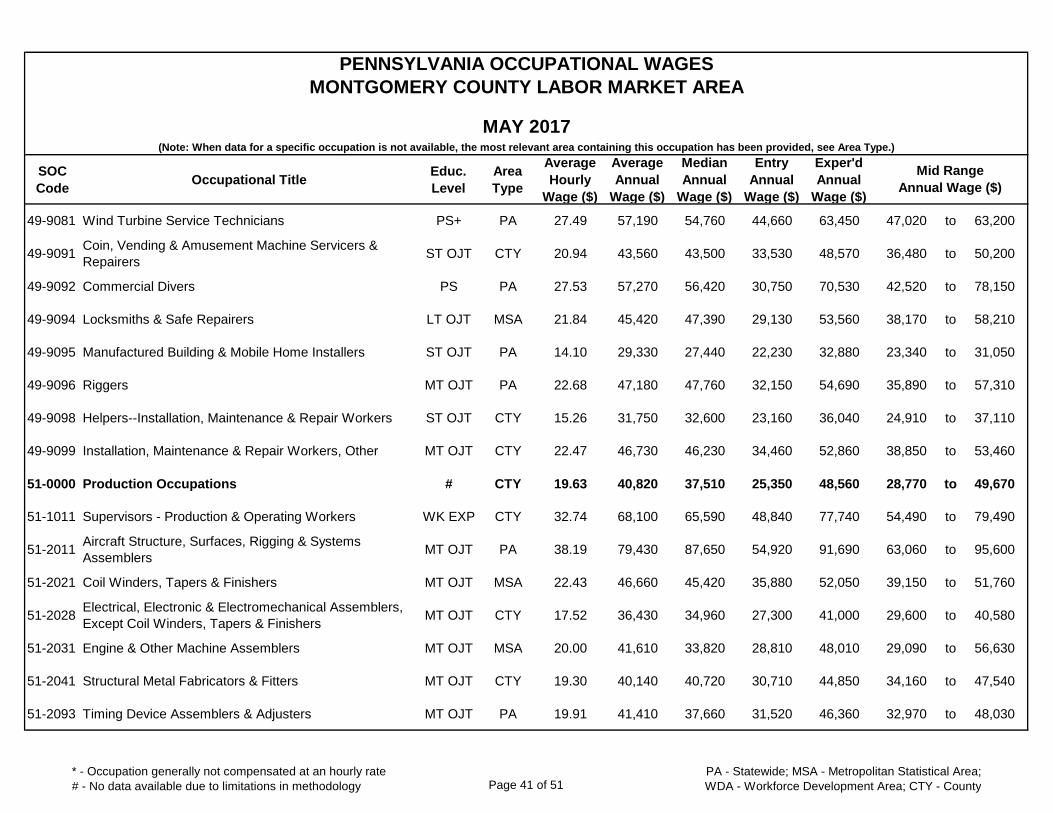
SOC
CodeOccupational Title
Educ.
Level
Area
Type
Average
Hourly
Wage ($)
Average
Annual
Wage ($)
Median
Annual
Wage ($)
Entry
Annual
Wage ($)
Exper'd
Annual
Wage ($)
PENNSYLVANIA OCCUPATIONAL WAGES
MONTGOMERY COUNTY LABOR MARKET AREA
MAY 2017(Note: When data for a specific occupation is not available, the most relevant area containing this occupation has been provided, see Area Type.)
Mid Range
Annual Wage ($)
49-9081 Wind Turbine Service Technicians PS+ PA 27.49 57,190 54,760 44,660 63,450 47,020 to 63,200
49-9091Coin, Vending & Amusement Machine Servicers &
RepairersST OJT CTY 20.94 43,560 43,500 33,530 48,570 36,480 to 50,200
49-9092 Commercial Divers PS PA 27.53 57,270 56,420 30,750 70,530 42,520 to 78,150
49-9094 Locksmiths & Safe Repairers LT OJT MSA 21.84 45,420 47,390 29,130 53,560 38,170 to 58,210
49-9095 Manufactured Building & Mobile Home Installers ST OJT PA 14.10 29,330 27,440 22,230 32,880 23,340 to 31,050
49-9096 Riggers MT OJT PA 22.68 47,180 47,760 32,150 54,690 35,890 to 57,310
49-9098 Helpers--Installation, Maintenance & Repair Workers ST OJT CTY 15.26 31,750 32,600 23,160 36,040 24,910 to 37,110
49-9099 Installation, Maintenance & Repair Workers, Other MT OJT CTY 22.47 46,730 46,230 34,460 52,860 38,850 to 53,460
51-0000 Production Occupations # CTY 19.63 40,820 37,510 25,350 48,560 28,770 to 49,670
51-1011 Supervisors - Production & Operating Workers WK EXP CTY 32.74 68,100 65,590 48,840 77,740 54,490 to 79,490
51-2011Aircraft Structure, Surfaces, Rigging & Systems
AssemblersMT OJT PA 38.19 79,430 87,650 54,920 91,690 63,060 to 95,600
51-2021 Coil Winders, Tapers & Finishers MT OJT MSA 22.43 46,660 45,420 35,880 52,050 39,150 to 51,760
51-2028Electrical, Electronic & Electromechanical Assemblers,
Except Coil Winders, Tapers & FinishersMT OJT CTY 17.52 36,430 34,960 27,300 41,000 29,600 to 40,580
51-2031 Engine & Other Machine Assemblers MT OJT MSA 20.00 41,610 33,820 28,810 48,010 29,090 to 56,630
51-2041 Structural Metal Fabricators & Fitters MT OJT CTY 19.30 40,140 40,720 30,710 44,850 34,160 to 47,540
51-2093 Timing Device Assemblers & Adjusters MT OJT PA 19.91 41,410 37,660 31,520 46,360 32,970 to 48,030
* - Occupation generally not compensated at an hourly rate
# - No data available due to limitations in methodology Page 41 of 51PA - Statewide; MSA - Metropolitan Statistical Area;
WDA - Workforce Development Area; CTY - County
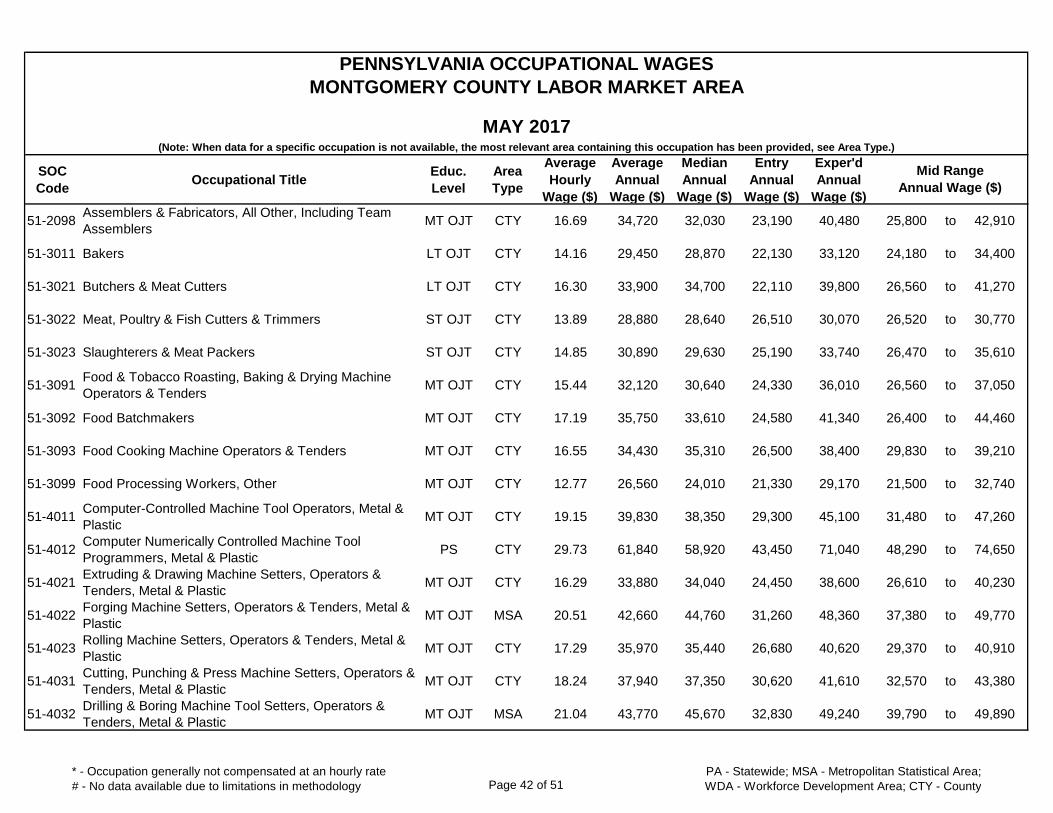
SOC
CodeOccupational Title
Educ.
Level
Area
Type
Average
Hourly
Wage ($)
Average
Annual
Wage ($)
Median
Annual
Wage ($)
Entry
Annual
Wage ($)
Exper'd
Annual
Wage ($)
PENNSYLVANIA OCCUPATIONAL WAGES
MONTGOMERY COUNTY LABOR MARKET AREA
MAY 2017(Note: When data for a specific occupation is not available, the most relevant area containing this occupation has been provided, see Area Type.)
Mid Range
Annual Wage ($)
51-2098Assemblers & Fabricators, All Other, Including Team
AssemblersMT OJT CTY 16.69 34,720 32,030 23,190 40,480 25,800 to 42,910
51-3011 Bakers LT OJT CTY 14.16 29,450 28,870 22,130 33,120 24,180 to 34,400
51-3021 Butchers & Meat Cutters LT OJT CTY 16.30 33,900 34,700 22,110 39,800 26,560 to 41,270
51-3022 Meat, Poultry & Fish Cutters & Trimmers ST OJT CTY 13.89 28,880 28,640 26,510 30,070 26,520 to 30,770
51-3023 Slaughterers & Meat Packers ST OJT CTY 14.85 30,890 29,630 25,190 33,740 26,470 to 35,610
51-3091Food & Tobacco Roasting, Baking & Drying Machine
Operators & TendersMT OJT CTY 15.44 32,120 30,640 24,330 36,010 26,560 to 37,050
51-3092 Food Batchmakers MT OJT CTY 17.19 35,750 33,610 24,580 41,340 26,400 to 44,460
51-3093 Food Cooking Machine Operators & Tenders MT OJT CTY 16.55 34,430 35,310 26,500 38,400 29,830 to 39,210
51-3099 Food Processing Workers, Other MT OJT CTY 12.77 26,560 24,010 21,330 29,170 21,500 to 32,740
51-4011Computer-Controlled Machine Tool Operators, Metal &
PlasticMT OJT CTY 19.15 39,830 38,350 29,300 45,100 31,480 to 47,260
51-4012Computer Numerically Controlled Machine Tool
Programmers, Metal & PlasticPS CTY 29.73 61,840 58,920 43,450 71,040 48,290 to 74,650
51-4021Extruding & Drawing Machine Setters, Operators &
Tenders, Metal & PlasticMT OJT CTY 16.29 33,880 34,040 24,450 38,600 26,610 to 40,230
51-4022Forging Machine Setters, Operators & Tenders, Metal &
PlasticMT OJT MSA 20.51 42,660 44,760 31,260 48,360 37,380 to 49,770
51-4023Rolling Machine Setters, Operators & Tenders, Metal &
PlasticMT OJT CTY 17.29 35,970 35,440 26,680 40,620 29,370 to 40,910
51-4031Cutting, Punching & Press Machine Setters, Operators &
Tenders, Metal & PlasticMT OJT CTY 18.24 37,940 37,350 30,620 41,610 32,570 to 43,380
51-4032Drilling & Boring Machine Tool Setters, Operators &
Tenders, Metal & PlasticMT OJT MSA 21.04 43,770 45,670 32,830 49,240 39,790 to 49,890
* - Occupation generally not compensated at an hourly rate
# - No data available due to limitations in methodology Page 42 of 51PA - Statewide; MSA - Metropolitan Statistical Area;
WDA - Workforce Development Area; CTY - County
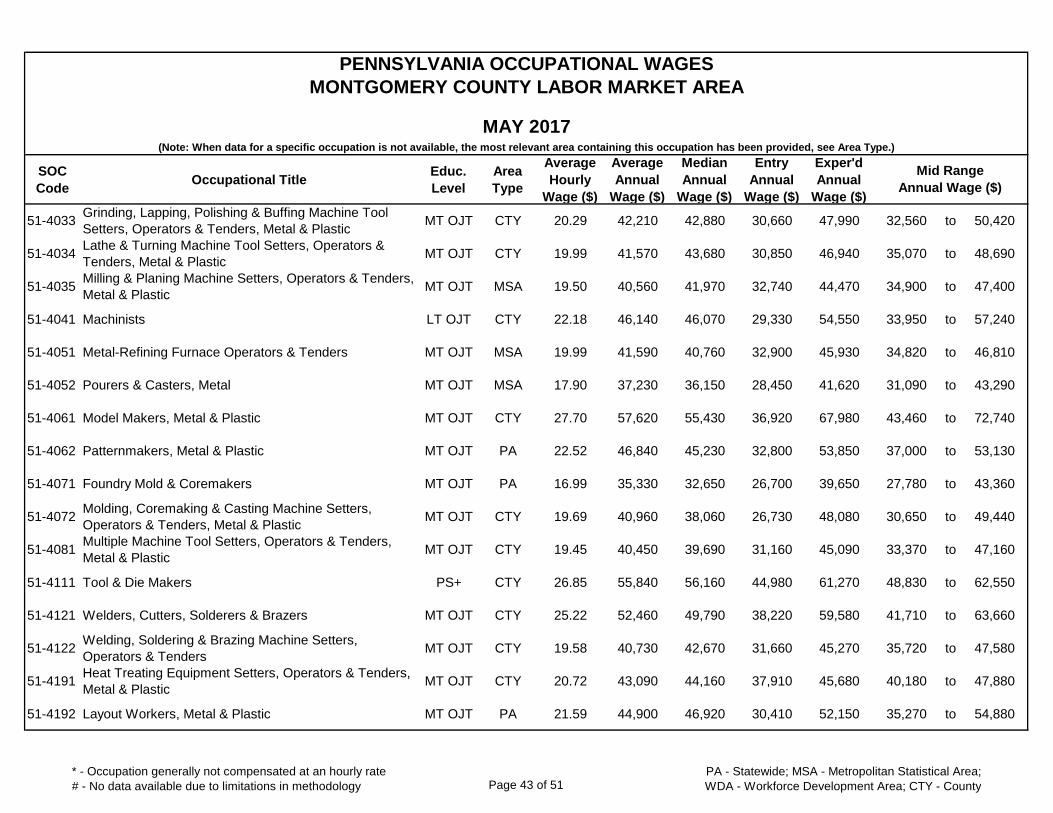
SOC
CodeOccupational Title
Educ.
Level
Area
Type
Average
Hourly
Wage ($)
Average
Annual
Wage ($)
Median
Annual
Wage ($)
Entry
Annual
Wage ($)
Exper'd
Annual
Wage ($)
PENNSYLVANIA OCCUPATIONAL WAGES
MONTGOMERY COUNTY LABOR MARKET AREA
MAY 2017(Note: When data for a specific occupation is not available, the most relevant area containing this occupation has been provided, see Area Type.)
Mid Range
Annual Wage ($)
51-4033Grinding, Lapping, Polishing & Buffing Machine Tool
Setters, Operators & Tenders, Metal & PlasticMT OJT CTY 20.29 42,210 42,880 30,660 47,990 32,560 to 50,420
51-4034Lathe & Turning Machine Tool Setters, Operators &
Tenders, Metal & PlasticMT OJT CTY 19.99 41,570 43,680 30,850 46,940 35,070 to 48,690
51-4035Milling & Planing Machine Setters, Operators & Tenders,
Metal & PlasticMT OJT MSA 19.50 40,560 41,970 32,740 44,470 34,900 to 47,400
51-4041 Machinists LT OJT CTY 22.18 46,140 46,070 29,330 54,550 33,950 to 57,240
51-4051 Metal-Refining Furnace Operators & Tenders MT OJT MSA 19.99 41,590 40,760 32,900 45,930 34,820 to 46,810
51-4052 Pourers & Casters, Metal MT OJT MSA 17.90 37,230 36,150 28,450 41,620 31,090 to 43,290
51-4061 Model Makers, Metal & Plastic MT OJT CTY 27.70 57,620 55,430 36,920 67,980 43,460 to 72,740
51-4062 Patternmakers, Metal & Plastic MT OJT PA 22.52 46,840 45,230 32,800 53,850 37,000 to 53,130
51-4071 Foundry Mold & Coremakers MT OJT PA 16.99 35,330 32,650 26,700 39,650 27,780 to 43,360
51-4072Molding, Coremaking & Casting Machine Setters,
Operators & Tenders, Metal & PlasticMT OJT CTY 19.69 40,960 38,060 26,730 48,080 30,650 to 49,440
51-4081Multiple Machine Tool Setters, Operators & Tenders,
Metal & PlasticMT OJT CTY 19.45 40,450 39,690 31,160 45,090 33,370 to 47,160
51-4111 Tool & Die Makers PS+ CTY 26.85 55,840 56,160 44,980 61,270 48,830 to 62,550
51-4121 Welders, Cutters, Solderers & Brazers MT OJT CTY 25.22 52,460 49,790 38,220 59,580 41,710 to 63,660
51-4122Welding, Soldering & Brazing Machine Setters,
Operators & TendersMT OJT CTY 19.58 40,730 42,670 31,660 45,270 35,720 to 47,580
51-4191Heat Treating Equipment Setters, Operators & Tenders,
Metal & PlasticMT OJT CTY 20.72 43,090 44,160 37,910 45,680 40,180 to 47,880
51-4192 Layout Workers, Metal & Plastic MT OJT PA 21.59 44,900 46,920 30,410 52,150 35,270 to 54,880
* - Occupation generally not compensated at an hourly rate
# - No data available due to limitations in methodology Page 43 of 51PA - Statewide; MSA - Metropolitan Statistical Area;
WDA - Workforce Development Area; CTY - County

SOC
CodeOccupational Title
Educ.
Level
Area
Type
Average
Hourly
Wage ($)
Average
Annual
Wage ($)
Median
Annual
Wage ($)
Entry
Annual
Wage ($)
Exper'd
Annual
Wage ($)
PENNSYLVANIA OCCUPATIONAL WAGES
MONTGOMERY COUNTY LABOR MARKET AREA
MAY 2017(Note: When data for a specific occupation is not available, the most relevant area containing this occupation has been provided, see Area Type.)
Mid Range
Annual Wage ($)
51-4193Plating & Coating Machine Setters, Operators &
Tenders, Metal & PlasticMT OJT CTY 18.48 38,440 37,860 29,660 42,820 32,800 to 44,080
51-4194 Tool Grinders, Filers & Sharpeners MT OJT MSA 18.24 37,950 37,800 29,710 42,060 31,450 to 45,020
51-4199 Metal Workers & Plastic Workers, Other MT OJT PA 18.68 38,860 38,220 23,840 46,370 28,060 to 48,340
51-5111 Prepress Technician & Workers PS CTY 24.68 51,330 48,860 38,350 57,810 41,380 to 61,200
51-5112 Printing Press Operators MT OJT CTY 21.58 44,890 41,130 32,560 51,060 34,600 to 53,600
51-5113 Print Binding & Finishing Workers MT OJT CTY 17.64 36,690 36,770 26,450 41,810 29,370 to 43,970
51-6011 Laundry & Dry-Cleaning Workers ST OJT CTY 11.59 24,100 22,910 18,840 26,730 19,990 to 26,870
51-6021 Pressers: Textile, Garment & Related Materials ST OJT CTY 9.12 18,980 18,780 17,220 19,860 17,130 to 21,120
51-6031 Sewing Machine Operators ST OJT CTY 13.72 28,530 25,970 19,560 33,020 21,280 to 34,450
51-6041 Shoe & Leather Workers & Repairers MT OJT PA 9.82 20,430 19,060 17,470 21,910 17,390 to 22,110
51-6042 Shoe Machine Operators & Tenders ST OJT PA 12.15 25,280 22,870 17,520 29,150 18,450 to 30,330
51-6051 Sewers, Hand MT OJT PA 13.63 28,350 30,810 20,850 32,100 21,940 to 35,160
51-6052 Tailors, Dressmakers & Custom Sewers MT OJT CTY 15.29 31,800 25,810 22,690 36,360 22,940 to 42,870
51-6061Textile Bleaching & Dyeing Machine Operators &
TendersST OJT CTY 12.45 25,900 23,170 19,000 29,350 20,250 to 27,550
51-6062 Textile Cutting Machine Setters, Operators & Tenders MT OJT MSA 18.80 39,100 42,900 27,230 45,030 29,580 to 47,850
51-6063Textile Knitting & Weaving Machine Setters, Operators &
TendersST OJT CTY 14.81 30,800 29,870 27,870 32,260 27,550 to 32,290
* - Occupation generally not compensated at an hourly rate
# - No data available due to limitations in methodology Page 44 of 51PA - Statewide; MSA - Metropolitan Statistical Area;
WDA - Workforce Development Area; CTY - County
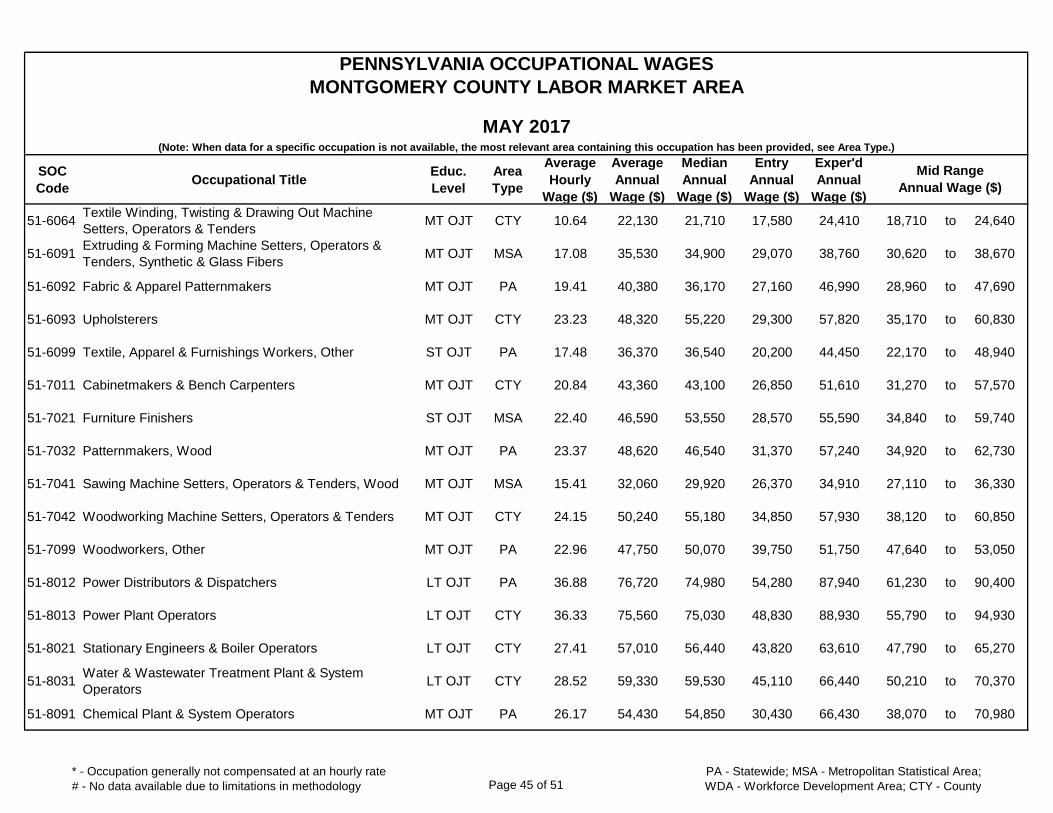
SOC
CodeOccupational Title
Educ.
Level
Area
Type
Average
Hourly
Wage ($)
Average
Annual
Wage ($)
Median
Annual
Wage ($)
Entry
Annual
Wage ($)
Exper'd
Annual
Wage ($)
PENNSYLVANIA OCCUPATIONAL WAGES
MONTGOMERY COUNTY LABOR MARKET AREA
MAY 2017(Note: When data for a specific occupation is not available, the most relevant area containing this occupation has been provided, see Area Type.)
Mid Range
Annual Wage ($)
51-6064Textile Winding, Twisting & Drawing Out Machine
Setters, Operators & TendersMT OJT CTY 10.64 22,130 21,710 17,580 24,410 18,710 to 24,640
51-6091Extruding & Forming Machine Setters, Operators &
Tenders, Synthetic & Glass FibersMT OJT MSA 17.08 35,530 34,900 29,070 38,760 30,620 to 38,670
51-6092 Fabric & Apparel Patternmakers MT OJT PA 19.41 40,380 36,170 27,160 46,990 28,960 to 47,690
51-6093 Upholsterers MT OJT CTY 23.23 48,320 55,220 29,300 57,820 35,170 to 60,830
51-6099 Textile, Apparel & Furnishings Workers, Other ST OJT PA 17.48 36,370 36,540 20,200 44,450 22,170 to 48,940
51-7011 Cabinetmakers & Bench Carpenters MT OJT CTY 20.84 43,360 43,100 26,850 51,610 31,270 to 57,570
51-7021 Furniture Finishers ST OJT MSA 22.40 46,590 53,550 28,570 55,590 34,840 to 59,740
51-7032 Patternmakers, Wood MT OJT PA 23.37 48,620 46,540 31,370 57,240 34,920 to 62,730
51-7041 Sawing Machine Setters, Operators & Tenders, Wood MT OJT MSA 15.41 32,060 29,920 26,370 34,910 27,110 to 36,330
51-7042 Woodworking Machine Setters, Operators & Tenders MT OJT CTY 24.15 50,240 55,180 34,850 57,930 38,120 to 60,850
51-7099 Woodworkers, Other MT OJT PA 22.96 47,750 50,070 39,750 51,750 47,640 to 53,050
51-8012 Power Distributors & Dispatchers LT OJT PA 36.88 76,720 74,980 54,280 87,940 61,230 to 90,400
51-8013 Power Plant Operators LT OJT CTY 36.33 75,560 75,030 48,830 88,930 55,790 to 94,930
51-8021 Stationary Engineers & Boiler Operators LT OJT CTY 27.41 57,010 56,440 43,820 63,610 47,790 to 65,270
51-8031Water & Wastewater Treatment Plant & System
OperatorsLT OJT CTY 28.52 59,330 59,530 45,110 66,440 50,210 to 70,370
51-8091 Chemical Plant & System Operators MT OJT PA 26.17 54,430 54,850 30,430 66,430 38,070 to 70,980
* - Occupation generally not compensated at an hourly rate
# - No data available due to limitations in methodology Page 45 of 51PA - Statewide; MSA - Metropolitan Statistical Area;
WDA - Workforce Development Area; CTY - County

SOC
CodeOccupational Title
Educ.
Level
Area
Type
Average
Hourly
Wage ($)
Average
Annual
Wage ($)
Median
Annual
Wage ($)
Entry
Annual
Wage ($)
Exper'd
Annual
Wage ($)
PENNSYLVANIA OCCUPATIONAL WAGES
MONTGOMERY COUNTY LABOR MARKET AREA
MAY 2017(Note: When data for a specific occupation is not available, the most relevant area containing this occupation has been provided, see Area Type.)
Mid Range
Annual Wage ($)
51-8092 Gas Plant Operators LT OJT MSA 36.51 75,940 75,440 64,190 81,810 67,050 to 85,490
51-8093Petroleum Pump System Operators, Refinery Operators
& GaugersMT OJT MSA 33.20 69,060 65,070 53,130 77,030 56,470 to 81,130
51-8099 Plant & System Operators, Other MT OJT PA 25.94 53,960 53,580 37,200 62,330 41,180 to 62,890
51-9011 Chemical Equipment Operators & Tenders MT OJT CTY 20.74 43,140 42,470 33,010 48,200 35,700 to 49,490
51-9012Separating, Filtering, Clarifying, Precipitating & Still
Machine Setters, Operators & TendersMT OJT CTY 19.63 40,840 37,630 26,240 48,140 29,260 to 51,910
51-9021Crushing, Grinding & Polishing Machine Setters,
Operators & TendersMT OJT MSA 17.29 35,970 35,550 27,150 40,390 29,790 to 41,630
51-9022 Grinding & Polishing Workers, Hand MT OJT CTY 20.09 41,790 38,620 27,850 48,750 30,900 to 54,940
51-9023Mixing & Blending Machine Setters, Operators &
TendersMT OJT CTY 21.33 44,370 42,560 34,460 49,330 36,090 to 49,770
51-9031 Cutters & Trimmers, Hand ST OJT CTY 13.20 27,450 24,280 18,790 31,780 20,210 to 29,710
51-9032 Cutting & Slicing Machine Setters, Operators & Tenders MT OJT CTY 18.90 39,310 37,340 29,440 44,250 31,820 to 46,530
51-9041Extruding, Forming, Pressing & Compacting Machine
Setters, Operators & TendersMT OJT CTY 16.00 33,290 32,920 24,730 37,570 26,470 to 39,350
51-9051 Furnace, Kiln, Oven, Drier & Kettle Operators & Tenders MT OJT PA 19.37 40,290 38,260 30,060 45,400 32,210 to 48,990
51-9061 Inspectors, Testers, Sorters, Samplers & Weighers MT OJT CTY 20.55 42,740 42,000 28,800 49,720 33,810 to 50,020
51-9071 Jewelers & Precious Stone & Metal Workers LT OJT CTY 18.56 38,610 37,730 24,330 45,760 26,260 to 50,000
51-9081 Dental Laboratory Technicians MT OJT MSA 22.06 45,890 44,710 28,870 54,400 32,740 to 57,430
51-9082 Medical Appliance Technicians MT OJT MSA 24.41 50,780 48,350 38,080 57,130 41,310 to 58,660
* - Occupation generally not compensated at an hourly rate
# - No data available due to limitations in methodology Page 46 of 51PA - Statewide; MSA - Metropolitan Statistical Area;
WDA - Workforce Development Area; CTY - County

SOC
CodeOccupational Title
Educ.
Level
Area
Type
Average
Hourly
Wage ($)
Average
Annual
Wage ($)
Median
Annual
Wage ($)
Entry
Annual
Wage ($)
Exper'd
Annual
Wage ($)
PENNSYLVANIA OCCUPATIONAL WAGES
MONTGOMERY COUNTY LABOR MARKET AREA
MAY 2017(Note: When data for a specific occupation is not available, the most relevant area containing this occupation has been provided, see Area Type.)
Mid Range
Annual Wage ($)
51-9083 Ophthalmic Laboratory Technicians MT OJT CTY 18.43 38,340 37,310 30,500 42,260 33,120 to 43,730
51-9111 Packaging & Filling Machine Operators & Tenders MT OJT CTY 16.59 34,500 32,680 26,130 38,690 27,650 to 40,010
51-9121Coating, Painting & Spraying Machine Setters,
Operators & TendersMT OJT CTY 19.82 41,230 42,970 30,550 46,570 32,640 to 48,870
51-9122 Painters, Transportation Equipment MT OJT CTY 24.73 51,450 50,190 45,120 54,610 45,400 to 56,570
51-9123 Painting, Coating & Decorating Workers MT OJT MSA 16.71 34,760 31,400 27,460 38,410 28,080 to 39,320
51-9141 Semiconductor Processors MT OJT PA 20.21 42,050 42,060 33,890 46,120 36,120 to 48,480
51-9151Photographic Process Workers & Processing Machine
OperatorsST OJT CTY 12.79 26,590 26,200 19,990 29,900 21,470 to 31,540
51-9191 Adhesive Bonding Machine Operators & Tenders MT OJT MSA 17.48 36,350 35,170 27,400 40,820 29,620 to 40,960
51-9192Cleaning, Washing & Metal Pickling Equipment
Operators & TendersMT OJT CTY 13.61 28,310 27,130 22,330 31,300 23,020 to 32,550
51-9193 Cooling & Freezing Equipment Operators & Tenders MT OJT CTY 13.62 28,330 27,800 22,840 31,070 23,820 to 32,150
51-9194 Etchers & Engravers MT OJT CTY 19.94 41,470 41,250 34,540 44,940 35,880 to 47,750
51-9195 Molders, Shapers & Casters, Except Metal & Plastic LT OJT CTY 15.04 31,290 30,440 26,490 33,690 27,400 to 35,190
51-9196 Paper Goods Machine Setters, Operators & Tenders MT OJT MSA 19.17 39,870 40,460 30,060 44,780 33,450 to 46,870
51-9197 Tire Builders MT OJT PA 15.53 32,310 30,310 27,840 34,540 27,770 to 34,460
51-9198 Helpers--Production Workers ST OJT CTY 14.05 29,230 28,080 21,760 32,970 23,920 to 32,750
51-9199 Production Workers, Other MT OJT CTY 15.13 31,460 27,730 20,820 36,790 22,810 to 33,940
* - Occupation generally not compensated at an hourly rate
# - No data available due to limitations in methodology Page 47 of 51PA - Statewide; MSA - Metropolitan Statistical Area;
WDA - Workforce Development Area; CTY - County

SOC
CodeOccupational Title
Educ.
Level
Area
Type
Average
Hourly
Wage ($)
Average
Annual
Wage ($)
Median
Annual
Wage ($)
Entry
Annual
Wage ($)
Exper'd
Annual
Wage ($)
PENNSYLVANIA OCCUPATIONAL WAGES
MONTGOMERY COUNTY LABOR MARKET AREA
MAY 2017(Note: When data for a specific occupation is not available, the most relevant area containing this occupation has been provided, see Area Type.)
Mid Range
Annual Wage ($)
53-0000 Transportation & Material Moving Occupations # CTY 17.69 36,790 33,950 22,030 44,170 24,640 to 45,970
53-1011 Aircraft Cargo Handling Supervisors WK EXP PA 27.25 56,680 53,370 36,170 66,930 38,990 to 71,700
53-1048Supervisors - Transportation & Material Moving
Workers, Except Aircraft Cargo HandlingWK EXP CTY 28.61 59,510 58,730 38,310 70,110 43,080 to 73,660
53-2011 Airline Pilots, Copilots & Flight Engineers BD+ PA * 145,000 174,630 71,220 181,890 80,370 to 196,860
53-2012 Commercial Pilots MT OJT PA * 80,800 73,350 45,500 98,450 55,590 to 100,220
53-2021 Air Traffic Controllers AD+ PA 54.81 114,000 108,250 69,740 136,120 76,390 to 144,680
53-2022 Airfield Operations Specialists LT OJT PA 33.32 69,300 61,980 29,810 89,050 36,250 to 87,530
53-2031 Flight Attendants WK EXP PA * 66,080 62,090 42,220 78,010 48,140 to 78,240
53-3011 Ambulance Drivers & Attendants MT OJT MSA 11.31 23,520 23,640 23,090 23,740 22,140 to 25,160
53-3021 Bus Drivers, Transit & Intercity MT OJT MSA 14.63 30,420 32,420 21,180 35,040 23,980 to 36,020
53-3022 Bus Drivers, School or Special Client ST OJT CTY 17.02 35,410 36,040 24,810 40,710 28,350 to 42,740
53-3031 Driver/Sales Workers ST OJT CTY 13.89 28,880 21,570 17,540 34,550 18,160 to 36,670
53-3032 Heavy & Tractor-Trailer Truck Drivers PS CTY 23.70 49,290 48,730 37,570 55,150 41,400 to 58,150
53-3033 Light Truck or Delivery Services Drivers ST OJT CTY 18.03 37,490 34,840 20,280 46,100 23,020 to 48,640
53-3041 Taxi Drivers & Chauffeurs ST OJT CTY 12.46 25,920 25,780 19,750 29,000 21,330 to 30,200
53-3099 Motor Vehicle Operators, Other ST OJT MSA 28.92 60,150 47,500 21,400 79,530 22,950 to 52,600
* - Occupation generally not compensated at an hourly rate
# - No data available due to limitations in methodology Page 48 of 51PA - Statewide; MSA - Metropolitan Statistical Area;
WDA - Workforce Development Area; CTY - County

SOC
CodeOccupational Title
Educ.
Level
Area
Type
Average
Hourly
Wage ($)
Average
Annual
Wage ($)
Median
Annual
Wage ($)
Entry
Annual
Wage ($)
Exper'd
Annual
Wage ($)
PENNSYLVANIA OCCUPATIONAL WAGES
MONTGOMERY COUNTY LABOR MARKET AREA
MAY 2017(Note: When data for a specific occupation is not available, the most relevant area containing this occupation has been provided, see Area Type.)
Mid Range
Annual Wage ($)
53-4011 Locomotive Engineers WK EXP PA 32.16 66,880 62,710 49,350 75,650 53,210 to 80,070
53-4013 Rail Yard Engineers, Dinkey Operators & Hostlers MT OJT PA 23.44 48,760 47,880 39,280 53,500 42,110 to 56,420
53-4021 Railroad Brake, Signal & Switch Operators MT OJT PA 27.86 57,950 54,670 41,500 66,170 45,390 to 69,500
53-4031 Railroad Conductors & Yardmasters MT OJT PA 30.83 64,120 60,620 46,130 73,110 50,680 to 78,550
53-4041 Subway & Streetcar Operators MT OJT PA 24.98 51,960 57,050 36,790 59,550 44,450 to 61,990
53-5011 Sailors & Marine Oilers MT OJT PA 17.73 36,880 33,540 24,080 43,280 27,530 to 39,460
53-5021 Captains, Mates & Pilots of Water Vessels PS+ MSA 34.97 72,740 75,890 49,010 84,600 50,770 to 90,950
53-5022 Motorboat Operators PS+ PA 27.37 56,930 56,400 35,540 67,620 37,900 to 67,200
53-5031 Ship Engineers PS+ PA 33.84 70,390 65,390 48,760 81,210 55,200 to 79,390
53-6011 Bridge & Lock Tenders ST OJT PA 25.31 52,640 54,040 46,610 55,660 49,270 to 58,140
53-6021 Parking Lot Attendants ST OJT CTY 11.76 24,450 24,040 19,780 26,790 20,910 to 28,070
53-6031 Automotive & Watercraft Service Attendants ST OJT CTY 9.04 18,800 18,140 17,120 19,650 16,750 to 19,530
53-6041 Traffic Technicians MT OJT PA 25.07 52,160 50,330 42,740 56,870 44,100 to 58,940
53-6051 Transportation Inspectors MT OJT CTY 42.82 89,070 95,900 58,040 104,590 81,980 to 110,880
53-6061 Transportation Attendants ST OJT PA 10.67 22,180 20,350 17,880 24,330 18,280 to 24,720
53-6099 Transportation Workers, Other ST OJT CTY 19.83 41,250 38,570 35,540 44,110 35,440 to 41,700
* - Occupation generally not compensated at an hourly rate
# - No data available due to limitations in methodology Page 49 of 51PA - Statewide; MSA - Metropolitan Statistical Area;
WDA - Workforce Development Area; CTY - County

SOC
CodeOccupational Title
Educ.
Level
Area
Type
Average
Hourly
Wage ($)
Average
Annual
Wage ($)
Median
Annual
Wage ($)
Entry
Annual
Wage ($)
Exper'd
Annual
Wage ($)
PENNSYLVANIA OCCUPATIONAL WAGES
MONTGOMERY COUNTY LABOR MARKET AREA
MAY 2017(Note: When data for a specific occupation is not available, the most relevant area containing this occupation has been provided, see Area Type.)
Mid Range
Annual Wage ($)
53-7011 Conveyor Operators & Tenders ST OJT CTY 21.09 43,870 45,130 38,980 46,310 41,410 to 48,860
53-7021 Crane & Tower Operators WK EXP MSA 29.03 60,370 54,340 30,490 75,310 35,650 to 89,180
53-7031 Dredge Operators MT OJT PA 19.82 41,230 41,180 34,540 44,570 35,890 to 46,470
53-7032 Excavating & Loading Machine & Dragline Operators WK EXP CTY 20.14 41,890 39,410 34,080 45,790 35,040 to 48,400
53-7033 Loading Machine Operators, Underground Mining ST OJT PA 28.87 60,040 59,990 52,620 63,750 55,060 to 64,890
53-7041 Hoist & Winch Operators ST OJT PA 19.94 41,480 37,410 30,750 46,840 32,640 to 43,770
53-7051 Industrial Truck & Tractor Operators ST OJT CTY 18.70 38,910 38,070 30,020 43,350 31,900 to 45,400
53-7061 Cleaners of Vehicles & Equipment ST OJT CTY 10.71 22,280 20,720 17,550 24,650 18,220 to 24,320
53-7062 Laborers & Freight, Stock & Material Movers ST OJT CTY 15.87 33,000 30,090 22,530 38,240 24,290 to 38,090
53-7063 Machine Feeders & Offbearers ST OJT CTY 16.43 34,180 31,970 23,240 39,640 26,540 to 41,630
53-7064 Packers & Packagers, Hand ST OJT CTY 15.01 31,220 29,940 22,520 35,580 25,070 to 36,760
53-7071 Gas Compressor & Gas Pumping Station Operators MT OJT PA 28.48 59,240 59,830 43,510 67,100 49,040 to 70,720
53-7072 Pump Operators MT OJT PA 21.92 45,590 44,200 24,690 56,030 33,460 to 61,170
53-7073 Wellhead Pumpers WK EXP PA 19.83 41,250 36,890 30,410 46,670 32,040 to 46,260
53-7081 Refuse & Recyclable Material Collectors ST OJT CTY 23.48 48,830 48,690 35,640 55,430 41,550 to 58,730
53-7111 Mine Shuttle Car Operators ST OJT PA 30.87 64,210 63,010 57,450 67,590 57,380 to 71,800
* - Occupation generally not compensated at an hourly rate
# - No data available due to limitations in methodology Page 50 of 51PA - Statewide; MSA - Metropolitan Statistical Area;
WDA - Workforce Development Area; CTY - County
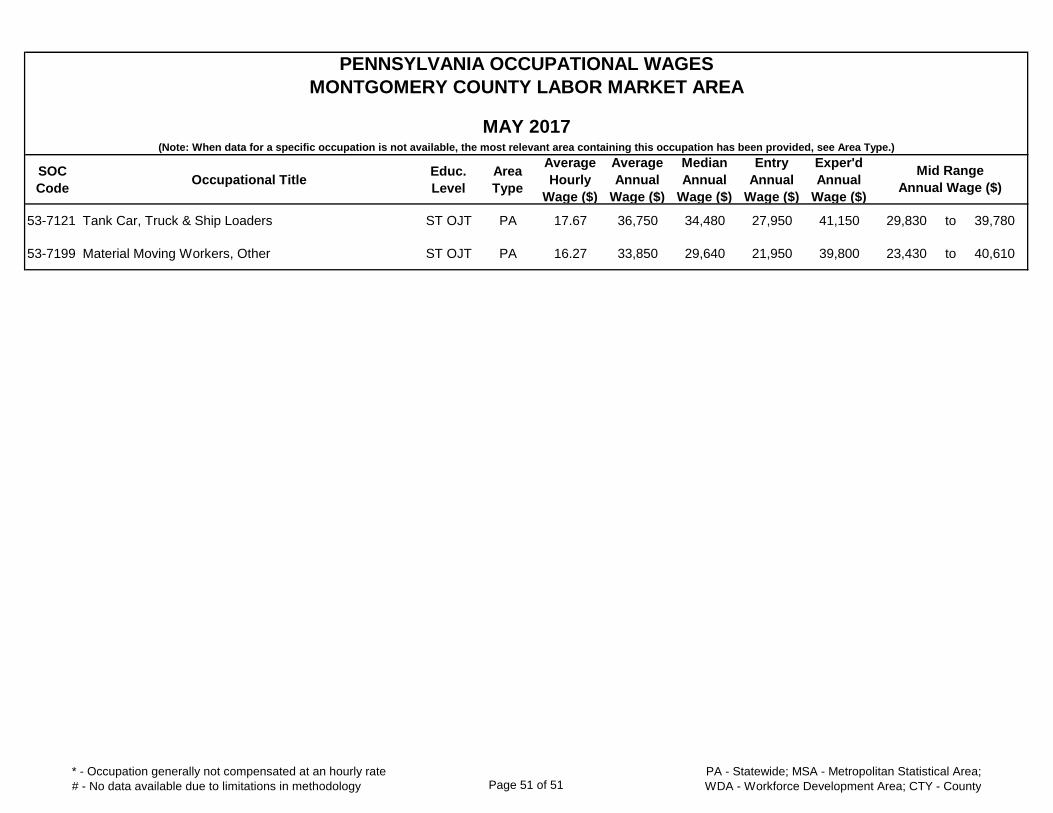
SOC
CodeOccupational Title
Educ.
Level
Area
Type
Average
Hourly
Wage ($)
Average
Annual
Wage ($)
Median
Annual
Wage ($)
Entry
Annual
Wage ($)
Exper'd
Annual
Wage ($)
PENNSYLVANIA OCCUPATIONAL WAGES
MONTGOMERY COUNTY LABOR MARKET AREA
MAY 2017(Note: When data for a specific occupation is not available, the most relevant area containing this occupation has been provided, see Area Type.)
Mid Range
Annual Wage ($)
53-7121 Tank Car, Truck & Ship Loaders ST OJT PA 17.67 36,750 34,480 27,950 41,150 29,830 to 39,780
53-7199 Material Moving Workers, Other ST OJT PA 16.27 33,850 29,640 21,950 39,800 23,430 to 40,610
* - Occupation generally not compensated at an hourly rate
# - No data available due to limitations in methodology Page 51 of 51PA - Statewide; MSA - Metropolitan Statistical Area;
WDA - Workforce Development Area; CTY - County