Embed Size (px)
Citation preview
Estimated Projected Percent Due to Due to Due to Total
2016 2026 Change Growth 1/
Exits 2/
Transfers 3/
Demand 4/
00-0000 Total, All Occupations 6,181,960 6,523,990 5.5% 34,203 298,241 394,436 726,880
11-0000 Management Occupations 296,550 314,550 6.1% 1,800 8,816 14,556 25,172
11-1000 Top Executives 86,570 91,060 5.2% 448 1,950 5,043 7,441
11-1011 Chief Executives 12,200 11,340 -7.0% -86 340 483 737
11-1021 General & Operations Managers 72,410 77,680 7.3% 527 1,556 4,477 6,560
11-1031 Legislators 1,960 2,030 3.6% 8 54 84 146
11-2000 Advertising, Marketing, Promotions, Public Relations & Sales Managers 18,420 19,800 7.5% 138 435 1,162 1,735
11-2011 Advertising & Promotions Managers 620 640 3.2% 3 17 47 67
11-2021 Marketing Managers 6,560 7,130 8.7% 58 156 415 629
11-2022 Sales Managers 9,400 10,010 6.5% 62 220 589 871
11-2031 Public Relations & Fundraising Managers 1,860 2,020 8.6% 16 43 110 169
11-3000 Operations Specialties Managers 53,850 59,750 11.0% 590 1,313 2,885 4,788
11-3011 Administrative Services Managers 7,150 7,780 8.8% 63 224 365 652
11-3021 Computer & Information Systems Managers 12,570 13,800 9.8% 123 232 718 1,073
11-3031 Financial Managers 17,050 20,070 17.7% 302 427 918 1,647
11-3051 Industrial Production Managers 5,950 6,100 2.5% 14 140 275 429
11-3061 Purchasing Managers 2,000 2,120 6.0% 12 60 101 173
11-3071 Transportation, Storage & Distribution Managers 3,340 3,650 9.3% 30 80 182 292
11-3111 Compensation & Benefits Managers 540 570 5.6% 3 12 26 41
11-3121 Human Resources Managers 4,250 4,610 8.5% 36 110 238 384
11-3131 Training & Development Managers 990 1,060 7.1% 7 28 61 96
11-9000 Other Management Occupations 137,710 143,940 4.5% 623 5,118 5,467 11,208
11-9013 Farmers, Ranchers & Other Agricultural Managers 39,860 38,310 -3.9% -156 2,285 580 2,709
11-9021 Construction Managers 11,940 13,010 9.0% 108 286 554 948
11-9031 Education Admin., Preschool & Childcare Center/Program 3,030 3,240 6.9% 21 88 143 252
11-9032 Education Administrators, Elementary & Secondary School 7,820 8,260 5.6% 44 226 366 636
11-9033 Education Administrators, Postsecondary 4,530 4,880 7.7% 36 132 214 382
11-9039 Education Administrators, Other 1,170 1,230 5.1% 7 34 55 96
11-9041 Architectural & Engineering Managers 5,850 6,260 7.0% 41 122 291 454
11-9051 Food Service Managers 8,030 8,560 6.6% 53 263 612 928
11-9061 Funeral Service Managers 910 930 2.2% 2 25 39 66
11-9071 Gaming Managers 120 120 0.0% 0 3 10 13
11-9081 Lodging Managers 1,700 1,750 2.9% 5 59 111 175
11-9111 Medical & Health Services Managers 14,310 17,300 20.9% 299 429 771 1,499
11-9121 Natural Sciences Managers 2,230 2,410 8.1% 18 52 130 200
Pennsylvania
Occupational Employment
2016-2026 Long-Term Projections
SOC
CodeOccupational Title
Employment Outlook Annual Demand
1
Pennsylvania Department of Labor & Industry
Center for Workforce Information & Analysis
Estimated Projected Percent Due to Due to Due to Total
2016 2026 Change Growth 1/
Exits 2/
Transfers 3/
Demand 4/
Pennsylvania
Occupational Employment
2016-2026 Long-Term Projections
SOC
CodeOccupational Title
Employment Outlook Annual Demand
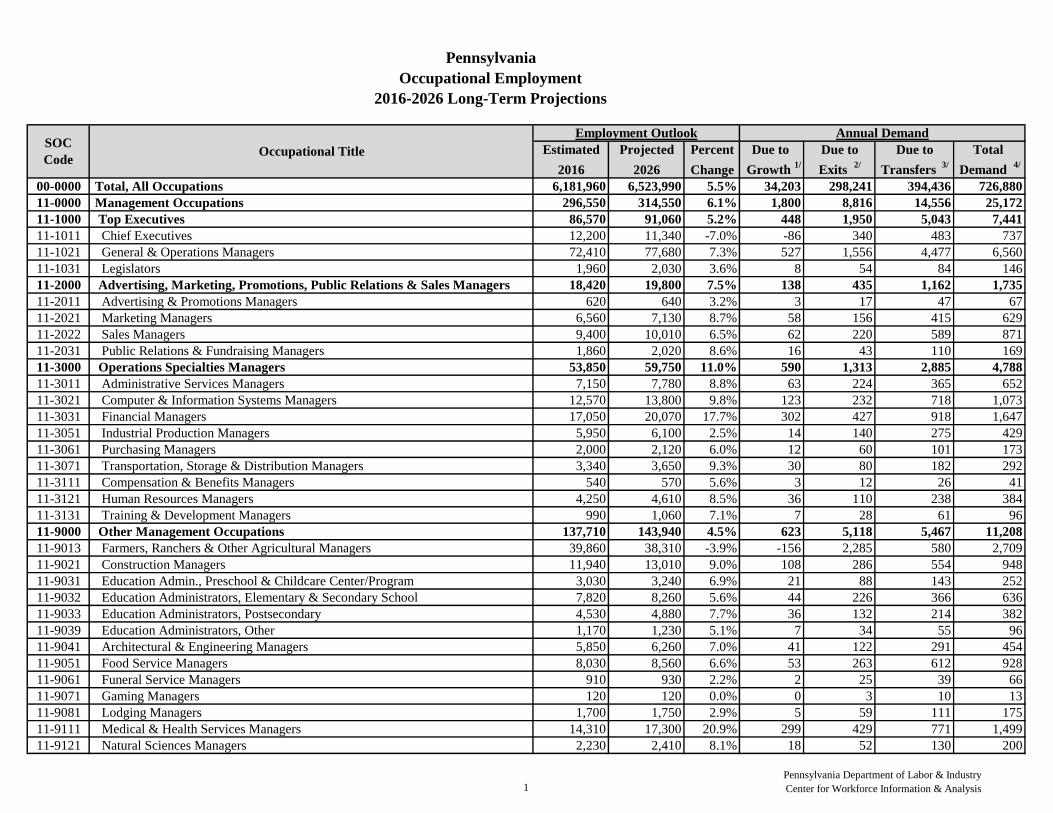
11-9131 Postmasters & Mail Superintendents 800 600 -25.0% -20 19 29 28
11-9141 Property, Real Estate & Community Association Managers 4,350 4,590 5.5% 24 185 150 359
11-9151 Social & Community Service Managers 7,620 8,330 9.3% 72 262 416 750
11-9161 Emergency Management Directors 450 470 4.4% 3 18 17 38
11-9199 Managers, Other 23,020 23,680 2.9% 65 632 980 1,677
13-0000 Business & Financial Operations Occupations 292,690 313,790 7.2% 2,110 8,746 17,743 28,599
13-1000 Business Operations Specialists 177,240 188,640 6.4% 1,140 5,406 11,102 17,648
13-1011 Agents & Business Managers of Artists, Performers & Athletes 270 280 3.7% 1 11 20 32
13-1021 Buyers & Purchasing Agents, Farm Products 400 370 -7.5% -3 18 26 41
13-1022 Wholesale & Retail Buyers 3,570 3,410 -4.5% -16 138 252 374
13-1023 Purchasing Agents 12,810 12,230 -4.5% -59 372 692 1,005
13-1031 Claims Adjusters, Examiners & Investigators 13,720 13,280 -3.2% -44 338 752 1,046
13-1032 Insurance Appraisers, Auto Damage 570 570 0.0% 0 14 32 46
13-1041 Compliance Officers 12,320 13,210 7.2% 89 358 643 1,090
13-1051 Cost Estimators 9,350 10,340 10.6% 99 310 639 1,048
13-1071 Human Resources Specialists 23,060 24,810 7.6% 175 695 1,573 2,443
13-1074 Farm Labor Contractors 50 60 20.0% 0 2 4 6
13-1075 Labor Relations Specialists 5,100 4,730 -7.3% -37 143 323 429
13-1081 Logisticians 5,220 5,670 8.6% 44 134 384 562
13-1111 Management Analysts 27,860 31,030 11.4% 317 946 1,522 2,785
13-1121 Meeting, Convention & Event Planners 3,570 3,840 7.6% 27 140 277 444
13-1131 Fundraisers 3,070 3,350 9.1% 28 100 210 338
13-1141 Compensation, Benefits & Job Analysis Specialists 3,330 3,630 9.0% 30 88 189 307
13-1151 Training & Development Specialists 10,580 11,530 9.0% 94 340 710 1,144
13-1161 Market Research Analysts & Marketing Specialists 25,590 28,550 11.6% 296 718 1,858 2,872
13-1199 Business Operations Specialists, Other 16,790 17,770 5.8% 97 542 997 1,636
13-2000 Financial Specialists 115,450 125,150 8.4% 970 3,340 6,640 10,950
13-2011 Accountants & Auditors 57,850 62,820 8.6% 498 1,781 3,472 5,751
13-2021 Appraisers & Assessors of Real Estate 2,010 2,160 7.5% 15 72 60 147
13-2031 Budget Analysts 1,730 1,850 6.9% 12 48 82 142
13-2041 Credit Analysts 2,400 2,550 6.2% 14 57 142 213
13-2051 Financial Analysts 11,180 12,590 12.6% 142 237 747 1,126
13-2052 Personal Financial Advisors 10,860 12,600 16.0% 173 289 574 1,036
13-2053 Insurance Underwriters 4,900 4,540 -7.3% -36 121 253 338
13-2061 Financial Examiners 1,630 1,770 8.6% 14 48 78 140
2
Pennsylvania Department of Labor & Industry
Center for Workforce Information & Analysis
Estimated Projected Percent Due to Due to Due to Total
2016 2026 Change Growth 1/
Exits 2/
Transfers 3/
Demand 4/
Pennsylvania
Occupational Employment
2016-2026 Long-Term Projections
SOC
CodeOccupational Title
Employment Outlook Annual Demand
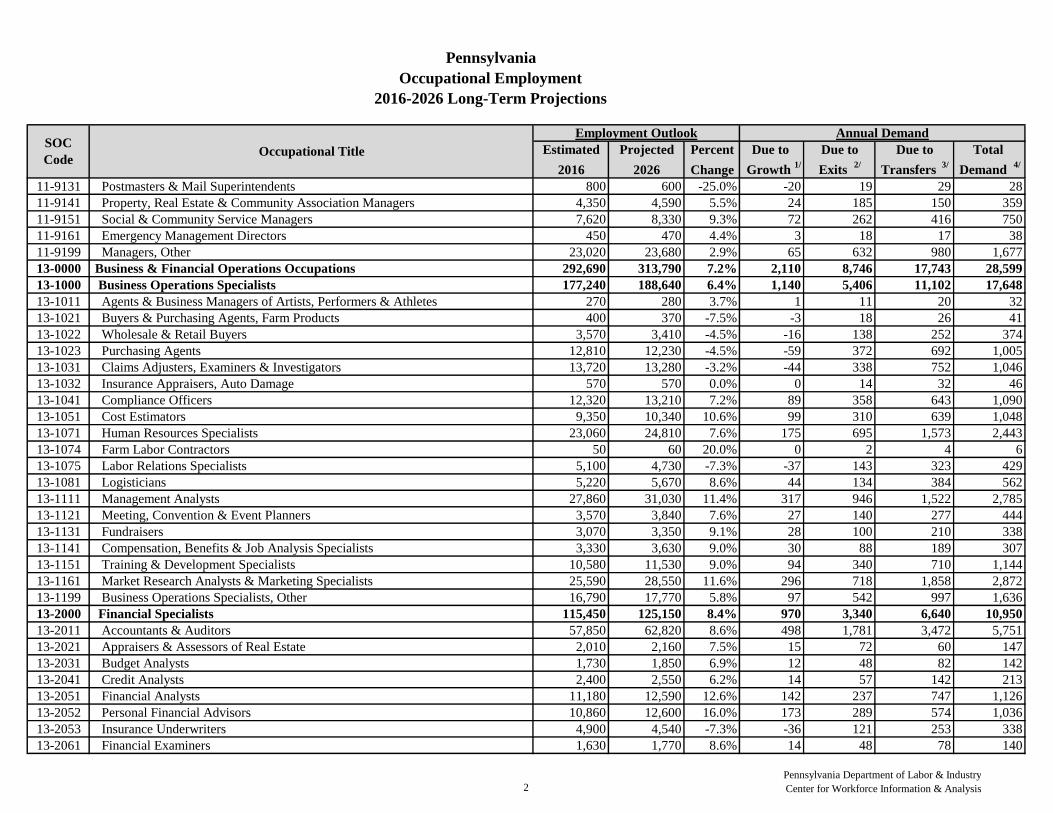
13-2071 Credit Counselors 1,760 1,910 8.5% 15 44 102 161
13-2072 Loan Officers 12,120 12,740 5.1% 62 300 689 1,051
13-2081 Tax Examiners, Collectors & Revenue Agents 2,610 2,630 0.8% 1 78 102 181
13-2082 Tax Preparers 2,350 2,580 9.8% 23 133 122 278
13-2099 Financial Specialists, Other 4,060 4,410 8.6% 35 130 219 384
15-0000 Computer & Mathematical Occupations 158,430 175,590 10.8% 1,715 2,880 7,996 12,591
15-1100 Computer Occupations 151,400 166,620 10.1% 1,521 2,727 7,632 11,880
15-1111 Computer & Information Research Scientists 610 690 13.1% 7 9 33 49
15-1121 Computer Systems Analysts 22,300 23,990 7.6% 169 423 1,034 1,626
15-1122 Information Security Analysts 3,010 3,780 25.6% 78 60 165 303
15-1131 Computer Programmers 13,910 12,730 -8.5% -117 233 594 710
15-1132 Software Developers, Applications 25,130 31,790 26.5% 666 389 1,397 2,452
15-1133 Software Developers, Systems Software 10,330 11,540 11.7% 121 150 537 808
15-1134 Web Developers 5,910 6,580 11.3% 68 117 316 501
15-1141 Database Administrators 5,790 6,370 10.0% 58 128 253 439
15-1142 Network & Computer Systems Administrators 14,210 14,900 4.9% 69 205 684 958
15-1143 Computer Network Architects 5,700 5,940 4.2% 24 82 286 392
15-1151 Computer User Support Specialists 26,570 29,300 10.3% 272 568 1,438 2,278
15-1152 Computer Network Support Specialists 7,180 7,460 3.9% 28 149 377 554
15-1199 Computer Occupations, Other 10,770 11,560 7.3% 80 216 518 814
15-2000 Mathematical Scientists 7,030 8,970 27.6% 194 152 364 710
15-2011 Actuaries 1,560 1,910 22.4% 35 22 82 139
15-2021 Mathematicians 80 100 25.0% 2 2 4 8
15-2031 Operations Research Analysts 2,640 3,310 25.4% 67 61 112 240
15-2041 Statisticians 2,720 3,620 33.1% 90 67 164 321
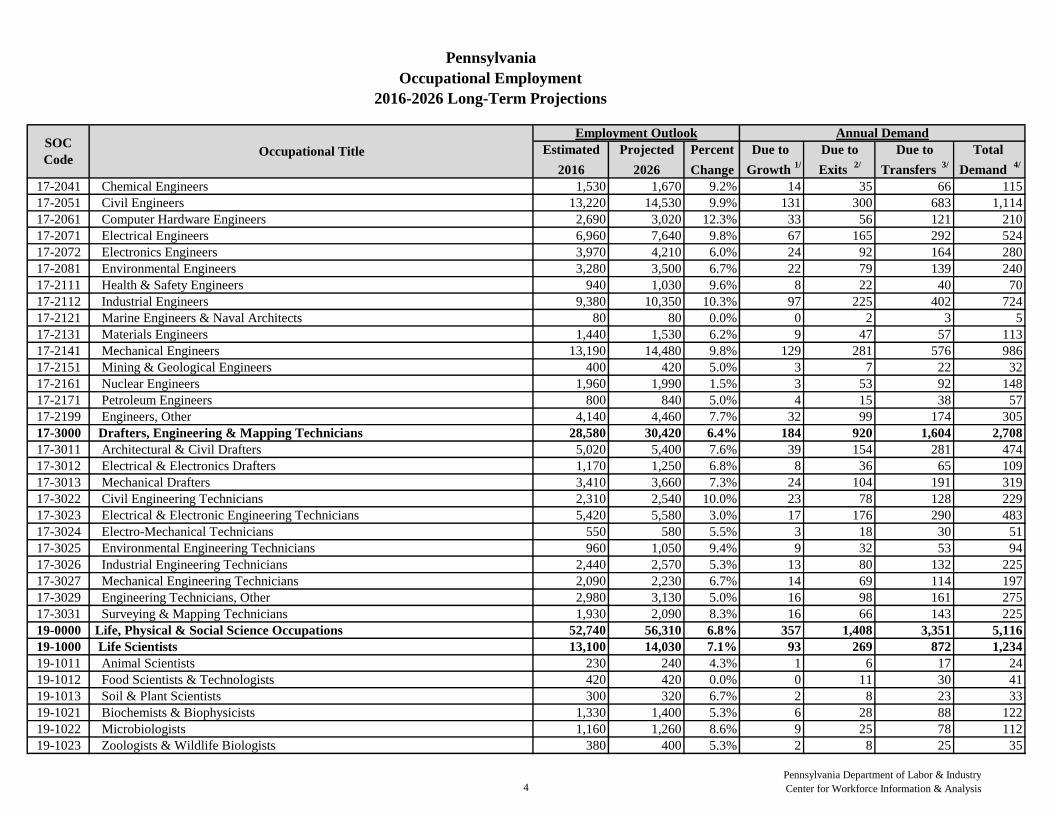
17-0000 Architecture & Engineering Occupations 102,530 110,710 8.0% 818 2,656 4,906 8,380
17-1000 Architects, Surveyors & Cartographers 7,360 7,670 4.2% 31 197 328 556
17-1011 Architects 4,700 4,790 1.9% 9 120 212 341
17-1012 Landscape Architects 810 830 2.5% 2 21 37 60
17-1021 Cartographers & Photogrammetrists 230 260 13.0% 3 7 10 20
17-1022 Surveyors 1,620 1,780 9.9% 16 50 69 135
17-2000 Engineers 66,590 72,620 9.1% 603 1,539 2,974 5,116
17-2011 Aerospace Engineers 1,480 1,660 12.2% 18 36 56 110
17-2021 Agricultural Engineers 120 130 8.3% 1 3 5 9
17-2031 Biomedical Engineers 1,020 1,090 6.9% 7 23 46 76
3
Pennsylvania Department of Labor & Industry
Center for Workforce Information & Analysis
Estimated Projected Percent Due to Due to Due to Total
2016 2026 Change Growth 1/
Exits 2/
Transfers 3/
Demand 4/
Pennsylvania
Occupational Employment
2016-2026 Long-Term Projections
SOC
CodeOccupational Title
Employment Outlook Annual Demand
17-2041 Chemical Engineers 1,530 1,670 9.2% 14 35 66 115
17-2051 Civil Engineers 13,220 14,530 9.9% 131 300 683 1,114
17-2061 Computer Hardware Engineers 2,690 3,020 12.3% 33 56 121 210
17-2071 Electrical Engineers 6,960 7,640 9.8% 67 165 292 524
17-2072 Electronics Engineers 3,970 4,210 6.0% 24 92 164 280
17-2081 Environmental Engineers 3,280 3,500 6.7% 22 79 139 240
17-2111 Health & Safety Engineers 940 1,030 9.6% 8 22 40 70
17-2112 Industrial Engineers 9,380 10,350 10.3% 97 225 402 724
17-2121 Marine Engineers & Naval Architects 80 80 0.0% 0 2 3 5
17-2131 Materials Engineers 1,440 1,530 6.2% 9 47 57 113
17-2141 Mechanical Engineers 13,190 14,480 9.8% 129 281 576 986
17-2151 Mining & Geological Engineers 400 420 5.0% 3 7 22 32
17-2161 Nuclear Engineers 1,960 1,990 1.5% 3 53 92 148
17-2171 Petroleum Engineers 800 840 5.0% 4 15 38 57
17-2199 Engineers, Other 4,140 4,460 7.7% 32 99 174 305
17-3000 Drafters, Engineering & Mapping Technicians 28,580 30,420 6.4% 184 920 1,604 2,708
17-3011 Architectural & Civil Drafters 5,020 5,400 7.6% 39 154 281 474
17-3012 Electrical & Electronics Drafters 1,170 1,250 6.8% 8 36 65 109
17-3013 Mechanical Drafters 3,410 3,660 7.3% 24 104 191 319
17-3022 Civil Engineering Technicians 2,310 2,540 10.0% 23 78 128 229
17-3023 Electrical & Electronic Engineering Technicians 5,420 5,580 3.0% 17 176 290 483
17-3024 Electro-Mechanical Technicians 550 580 5.5% 3 18 30 51
17-3025 Environmental Engineering Technicians 960 1,050 9.4% 9 32 53 94
17-3026 Industrial Engineering Technicians 2,440 2,570 5.3% 13 80 132 225
17-3027 Mechanical Engineering Technicians 2,090 2,230 6.7% 14 69 114 197
17-3029 Engineering Technicians, Other 2,980 3,130 5.0% 16 98 161 275
17-3031 Surveying & Mapping Technicians 1,930 2,090 8.3% 16 66 143 225
19-0000 Life, Physical & Social Science Occupations 52,740 56,310 6.8% 357 1,408 3,351 5,116
19-1000 Life Scientists 13,100 14,030 7.1% 93 269 872 1,234
19-1011 Animal Scientists 230 240 4.3% 1 6 17 24
19-1012 Food Scientists & Technologists 420 420 0.0% 0 11 30 41
19-1013 Soil & Plant Scientists 300 320 6.7% 2 8 23 33
19-1021 Biochemists & Biophysicists 1,330 1,400 5.3% 6 28 88 122
19-1022 Microbiologists 1,160 1,260 8.6% 9 25 78 112
19-1023 Zoologists & Wildlife Biologists 380 400 5.3% 2 8 25 35
4
Pennsylvania Department of Labor & Industry
Center for Workforce Information & Analysis
Estimated Projected Percent Due to Due to Due to Total
2016 2026 Change Growth 1/
Exits 2/
Transfers 3/
Demand 4/
Pennsylvania
Occupational Employment
2016-2026 Long-Term Projections
SOC
CodeOccupational Title
Employment Outlook Annual Demand
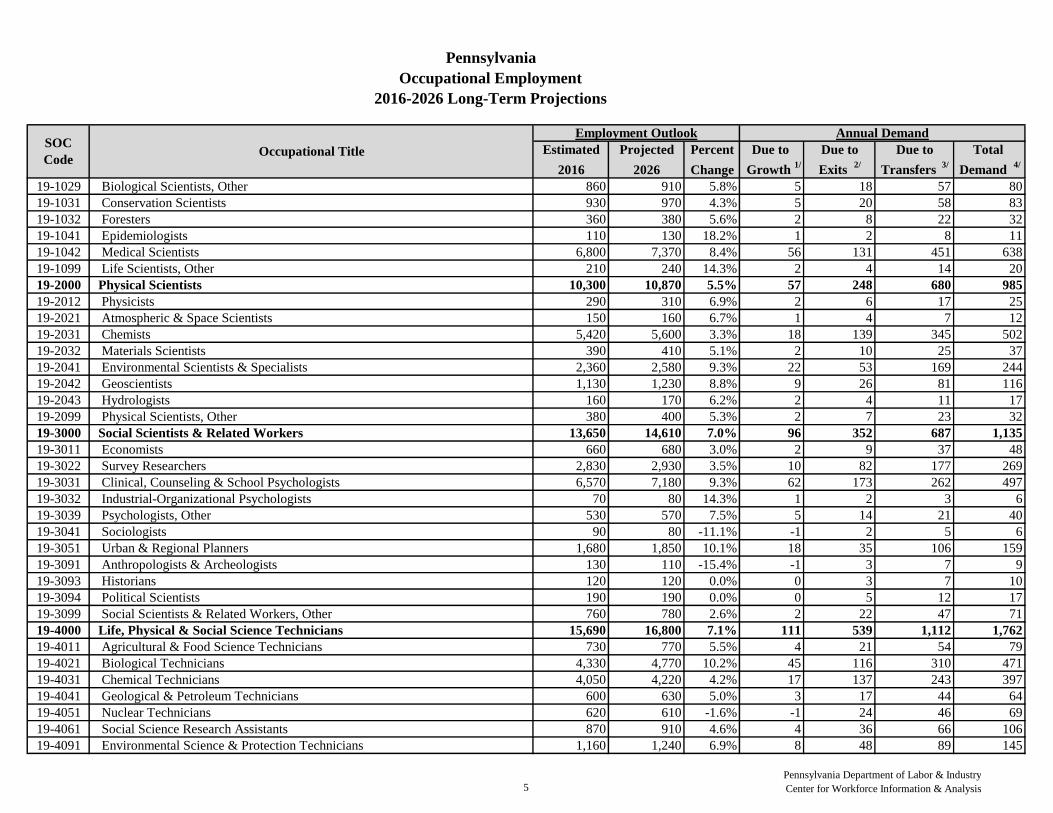
19-1029 Biological Scientists, Other 860 910 5.8% 5 18 57 80
19-1031 Conservation Scientists 930 970 4.3% 5 20 58 83
19-1032 Foresters 360 380 5.6% 2 8 22 32
19-1041 Epidemiologists 110 130 18.2% 1 2 8 11
19-1042 Medical Scientists 6,800 7,370 8.4% 56 131 451 638
19-1099 Life Scientists, Other 210 240 14.3% 2 4 14 20
19-2000 Physical Scientists 10,300 10,870 5.5% 57 248 680 985
19-2012 Physicists 290 310 6.9% 2 6 17 25
19-2021 Atmospheric & Space Scientists 150 160 6.7% 1 4 7 12
19-2031 Chemists 5,420 5,600 3.3% 18 139 345 502
19-2032 Materials Scientists 390 410 5.1% 2 10 25 37
19-2041 Environmental Scientists & Specialists 2,360 2,580 9.3% 22 53 169 244
19-2042 Geoscientists 1,130 1,230 8.8% 9 26 81 116
19-2043 Hydrologists 160 170 6.2% 2 4 11 17
19-2099 Physical Scientists, Other 380 400 5.3% 2 7 23 32
19-3000 Social Scientists & Related Workers 13,650 14,610 7.0% 96 352 687 1,135
19-3011 Economists 660 680 3.0% 2 9 37 48
19-3022 Survey Researchers 2,830 2,930 3.5% 10 82 177 269
19-3031 Clinical, Counseling & School Psychologists 6,570 7,180 9.3% 62 173 262 497
19-3032 Industrial-Organizational Psychologists 70 80 14.3% 1 2 3 6
19-3039 Psychologists, Other 530 570 7.5% 5 14 21 40
19-3041 Sociologists 90 80 -11.1% -1 2 5 6
19-3051 Urban & Regional Planners 1,680 1,850 10.1% 18 35 106 159
19-3091 Anthropologists & Archeologists 130 110 -15.4% -1 3 7 9
19-3093 Historians 120 120 0.0% 0 3 7 10
19-3094 Political Scientists 190 190 0.0% 0 5 12 17
19-3099 Social Scientists & Related Workers, Other 760 780 2.6% 2 22 47 71
19-4000 Life, Physical & Social Science Technicians 15,690 16,800 7.1% 111 539 1,112 1,762
19-4011 Agricultural & Food Science Technicians 730 770 5.5% 4 21 54 79
19-4021 Biological Technicians 4,330 4,770 10.2% 45 116 310 471
19-4031 Chemical Technicians 4,050 4,220 4.2% 17 137 243 397
19-4041 Geological & Petroleum Technicians 600 630 5.0% 3 17 44 64
19-4051 Nuclear Technicians 620 610 -1.6% -1 24 46 69
19-4061 Social Science Research Assistants 870 910 4.6% 4 36 66 106
19-4091 Environmental Science & Protection Technicians 1,160 1,240 6.9% 8 48 89 145
5
Pennsylvania Department of Labor & Industry
Center for Workforce Information & Analysis
Estimated Projected Percent Due to Due to Due to Total
2016 2026 Change Growth 1/
Exits 2/
Transfers 3/
Demand 4/
Pennsylvania
Occupational Employment
2016-2026 Long-Term Projections
SOC
CodeOccupational Title
Employment Outlook Annual Demand
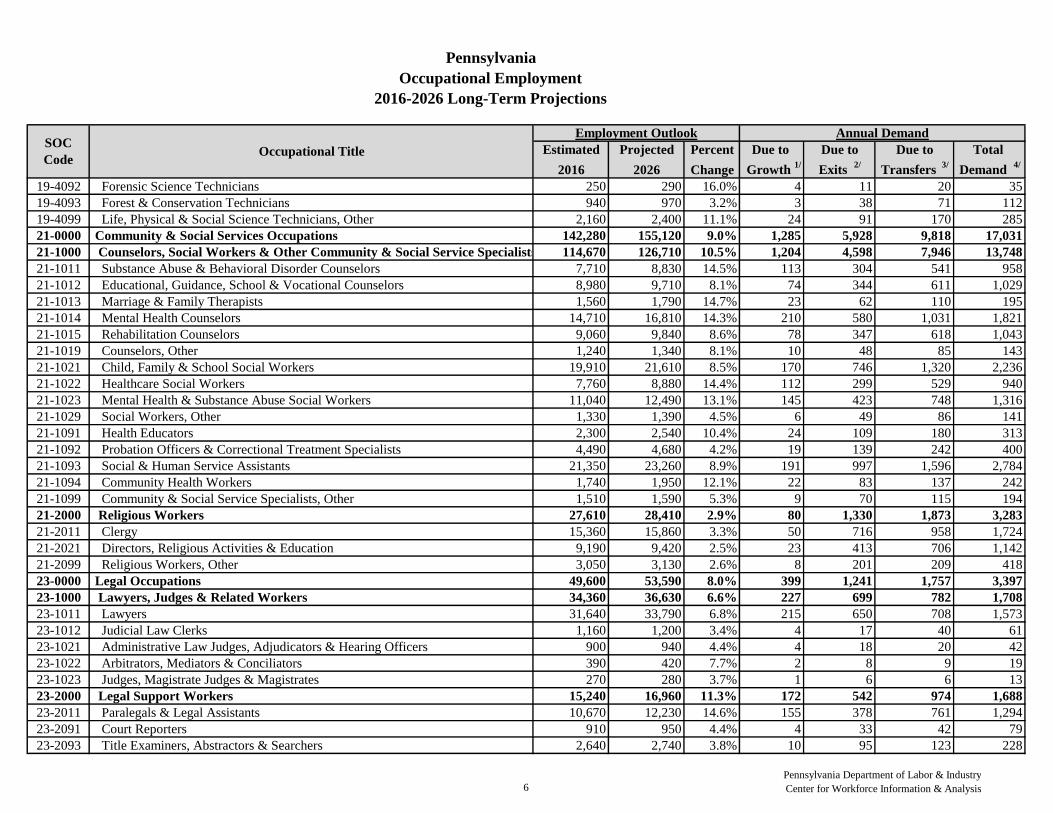
19-4092 Forensic Science Technicians 250 290 16.0% 4 11 20 35
19-4093 Forest & Conservation Technicians 940 970 3.2% 3 38 71 112
19-4099 Life, Physical & Social Science Technicians, Other 2,160 2,400 11.1% 24 91 170 285
21-0000 Community & Social Services Occupations 142,280 155,120 9.0% 1,285 5,928 9,818 17,031
21-1000 Counselors, Social Workers & Other Community & Social Service Specialists 114,670 126,710 10.5% 1,204 4,598 7,946 13,748
21-1011 Substance Abuse & Behavioral Disorder Counselors 7,710 8,830 14.5% 113 304 541 958
21-1012 Educational, Guidance, School & Vocational Counselors 8,980 9,710 8.1% 74 344 611 1,029
21-1013 Marriage & Family Therapists 1,560 1,790 14.7% 23 62 110 195
21-1014 Mental Health Counselors 14,710 16,810 14.3% 210 580 1,031 1,821
21-1015 Rehabilitation Counselors 9,060 9,840 8.6% 78 347 618 1,043
21-1019 Counselors, Other 1,240 1,340 8.1% 10 48 85 143
21-1021 Child, Family & School Social Workers 19,910 21,610 8.5% 170 746 1,320 2,236
21-1022 Healthcare Social Workers 7,760 8,880 14.4% 112 299 529 940
21-1023 Mental Health & Substance Abuse Social Workers 11,040 12,490 13.1% 145 423 748 1,316
21-1029 Social Workers, Other 1,330 1,390 4.5% 6 49 86 141
21-1091 Health Educators 2,300 2,540 10.4% 24 109 180 313
21-1092 Probation Officers & Correctional Treatment Specialists 4,490 4,680 4.2% 19 139 242 400
21-1093 Social & Human Service Assistants 21,350 23,260 8.9% 191 997 1,596 2,784
21-1094 Community Health Workers 1,740 1,950 12.1% 22 83 137 242
21-1099 Community & Social Service Specialists, Other 1,510 1,590 5.3% 9 70 115 194
21-2000 Religious Workers 27,610 28,410 2.9% 80 1,330 1,873 3,283
21-2011 Clergy 15,360 15,860 3.3% 50 716 958 1,724
21-2021 Directors, Religious Activities & Education 9,190 9,420 2.5% 23 413 706 1,142
21-2099 Religious Workers, Other 3,050 3,130 2.6% 8 201 209 418
23-0000 Legal Occupations 49,600 53,590 8.0% 399 1,241 1,757 3,397
23-1000 Lawyers, Judges & Related Workers 34,360 36,630 6.6% 227 699 782 1,708
23-1011 Lawyers 31,640 33,790 6.8% 215 650 708 1,573
23-1012 Judicial Law Clerks 1,160 1,200 3.4% 4 17 40 61
23-1021 Administrative Law Judges, Adjudicators & Hearing Officers 900 940 4.4% 4 18 20 42
23-1022 Arbitrators, Mediators & Conciliators 390 420 7.7% 2 8 9 19
23-1023 Judges, Magistrate Judges & Magistrates 270 280 3.7% 1 6 6 13
23-2000 Legal Support Workers 15,240 16,960 11.3% 172 542 974 1,688
23-2011 Paralegals & Legal Assistants 10,670 12,230 14.6% 155 378 761 1,294
23-2091 Court Reporters 910 950 4.4% 4 33 42 79
23-2093 Title Examiners, Abstractors & Searchers 2,640 2,740 3.8% 10 95 123 228
6
Pennsylvania Department of Labor & Industry
Center for Workforce Information & Analysis
Estimated Projected Percent Due to Due to Due to Total
2016 2026 Change Growth 1/
Exits 2/
Transfers 3/
Demand 4/
Pennsylvania
Occupational Employment
2016-2026 Long-Term Projections
SOC
CodeOccupational Title
Employment Outlook Annual Demand
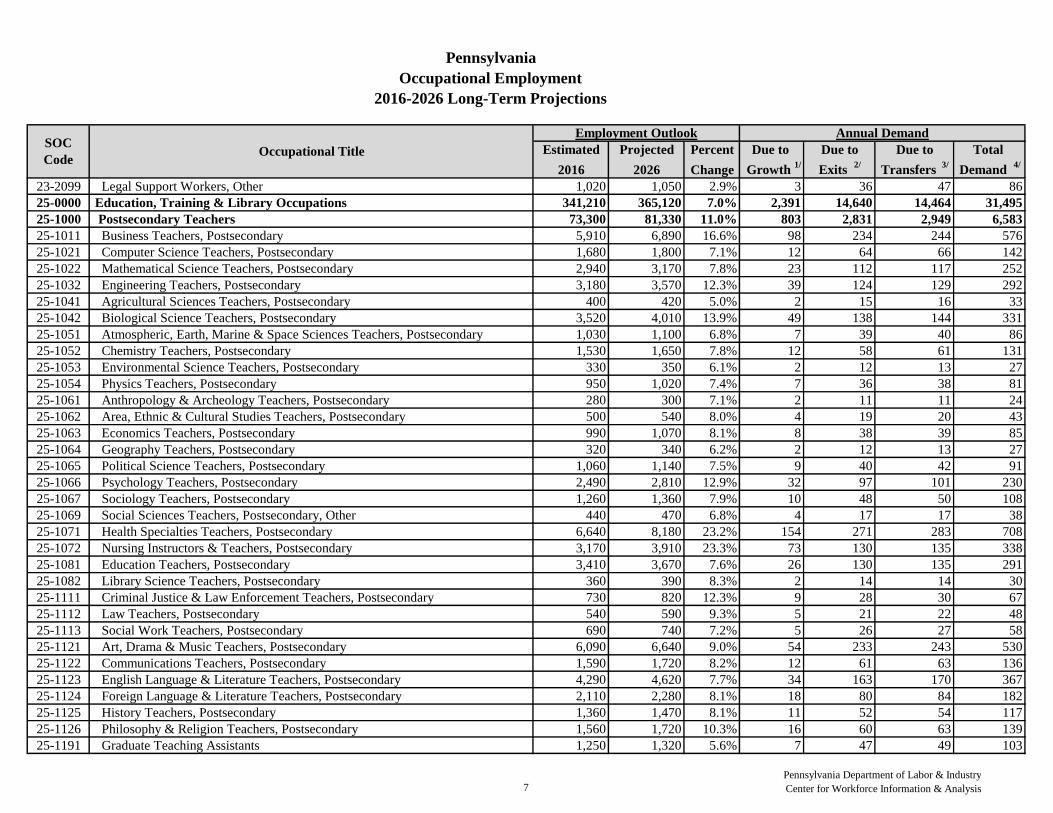
23-2099 Legal Support Workers, Other 1,020 1,050 2.9% 3 36 47 86
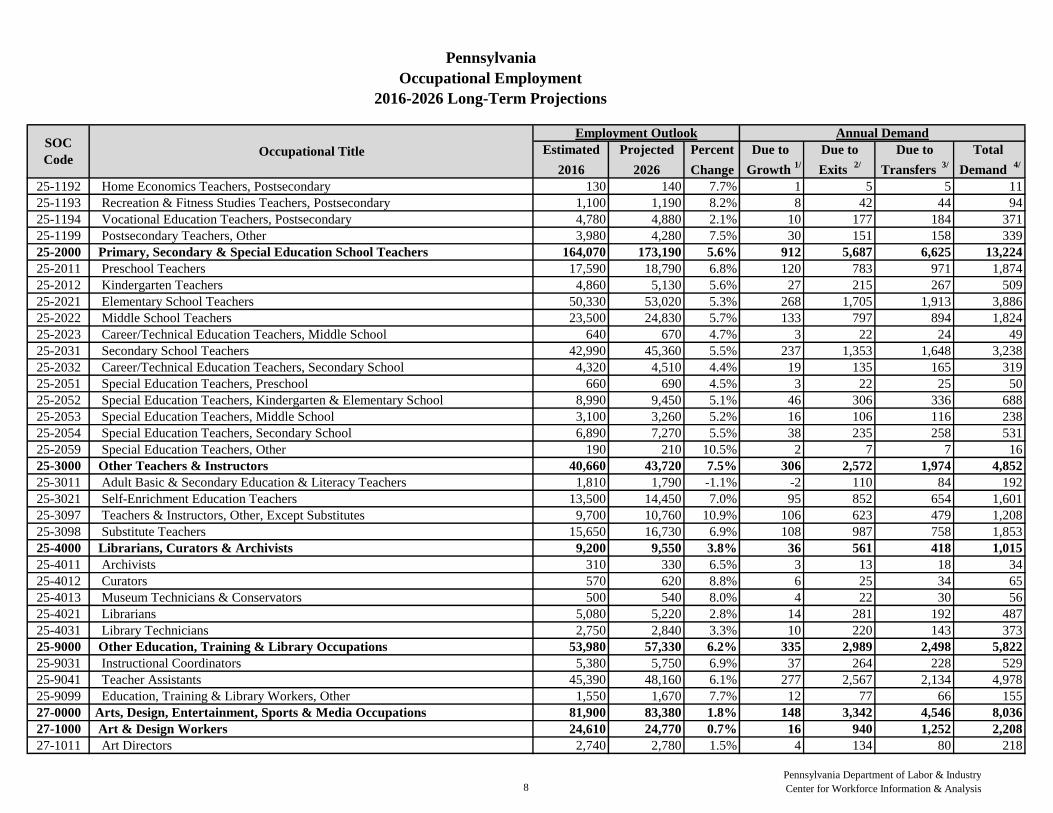
25-0000 Education, Training & Library Occupations 341,210 365,120 7.0% 2,391 14,640 14,464 31,495
25-1000 Postsecondary Teachers 73,300 81,330 11.0% 803 2,831 2,949 6,583
25-1011 Business Teachers, Postsecondary 5,910 6,890 16.6% 98 234 244 576
25-1021 Computer Science Teachers, Postsecondary 1,680 1,800 7.1% 12 64 66 142
25-1022 Mathematical Science Teachers, Postsecondary 2,940 3,170 7.8% 23 112 117 252
25-1032 Engineering Teachers, Postsecondary 3,180 3,570 12.3% 39 124 129 292
25-1041 Agricultural Sciences Teachers, Postsecondary 400 420 5.0% 2 15 16 33
25-1042 Biological Science Teachers, Postsecondary 3,520 4,010 13.9% 49 138 144 331
25-1051 Atmospheric, Earth, Marine & Space Sciences Teachers, Postsecondary 1,030 1,100 6.8% 7 39 40 86
25-1052 Chemistry Teachers, Postsecondary 1,530 1,650 7.8% 12 58 61 131
25-1053 Environmental Science Teachers, Postsecondary 330 350 6.1% 2 12 13 27
25-1054 Physics Teachers, Postsecondary 950 1,020 7.4% 7 36 38 81
25-1061 Anthropology & Archeology Teachers, Postsecondary 280 300 7.1% 2 11 11 24
25-1062 Area, Ethnic & Cultural Studies Teachers, Postsecondary 500 540 8.0% 4 19 20 43
25-1063 Economics Teachers, Postsecondary 990 1,070 8.1% 8 38 39 85
25-1064 Geography Teachers, Postsecondary 320 340 6.2% 2 12 13 27
25-1065 Political Science Teachers, Postsecondary 1,060 1,140 7.5% 9 40 42 91
25-1066 Psychology Teachers, Postsecondary 2,490 2,810 12.9% 32 97 101 230
25-1067 Sociology Teachers, Postsecondary 1,260 1,360 7.9% 10 48 50 108
25-1069 Social Sciences Teachers, Postsecondary, Other 440 470 6.8% 4 17 17 38
25-1071 Health Specialties Teachers, Postsecondary 6,640 8,180 23.2% 154 271 283 708
25-1072 Nursing Instructors & Teachers, Postsecondary 3,170 3,910 23.3% 73 130 135 338
25-1081 Education Teachers, Postsecondary 3,410 3,670 7.6% 26 130 135 291
25-1082 Library Science Teachers, Postsecondary 360 390 8.3% 2 14 14 30
25-1111 Criminal Justice & Law Enforcement Teachers, Postsecondary 730 820 12.3% 9 28 30 67
25-1112 Law Teachers, Postsecondary 540 590 9.3% 5 21 22 48
25-1113 Social Work Teachers, Postsecondary 690 740 7.2% 5 26 27 58
25-1121 Art, Drama & Music Teachers, Postsecondary 6,090 6,640 9.0% 54 233 243 530
25-1122 Communications Teachers, Postsecondary 1,590 1,720 8.2% 12 61 63 136
25-1123 English Language & Literature Teachers, Postsecondary 4,290 4,620 7.7% 34 163 170 367
25-1124 Foreign Language & Literature Teachers, Postsecondary 2,110 2,280 8.1% 18 80 84 182
25-1125 History Teachers, Postsecondary 1,360 1,470 8.1% 11 52 54 117
25-1126 Philosophy & Religion Teachers, Postsecondary 1,560 1,720 10.3% 16 60 63 139
25-1191 Graduate Teaching Assistants 1,250 1,320 5.6% 7 47 49 103
7
Pennsylvania Department of Labor & Industry
Center for Workforce Information & Analysis
Estimated Projected Percent Due to Due to Due to Total
2016 2026 Change Growth 1/
Exits 2/
Transfers 3/
Demand 4/
Pennsylvania
Occupational Employment
2016-2026 Long-Term Projections
SOC
CodeOccupational Title
Employment Outlook Annual Demand
25-1192 Home Economics Teachers, Postsecondary 130 140 7.7% 1 5 5 11
25-1193 Recreation & Fitness Studies Teachers, Postsecondary 1,100 1,190 8.2% 8 42 44 94
25-1194 Vocational Education Teachers, Postsecondary 4,780 4,880 2.1% 10 177 184 371
25-1199 Postsecondary Teachers, Other 3,980 4,280 7.5% 30 151 158 339
25-2000 Primary, Secondary & Special Education School Teachers 164,070 173,190 5.6% 912 5,687 6,625 13,224
25-2011 Preschool Teachers 17,590 18,790 6.8% 120 783 971 1,874
25-2012 Kindergarten Teachers 4,860 5,130 5.6% 27 215 267 509
25-2021 Elementary School Teachers 50,330 53,020 5.3% 268 1,705 1,913 3,886
25-2022 Middle School Teachers 23,500 24,830 5.7% 133 797 894 1,824
25-2023 Career/Technical Education Teachers, Middle School 640 670 4.7% 3 22 24 49
25-2031 Secondary School Teachers 42,990 45,360 5.5% 237 1,353 1,648 3,238
25-2032 Career/Technical Education Teachers, Secondary School 4,320 4,510 4.4% 19 135 165 319
25-2051 Special Education Teachers, Preschool 660 690 4.5% 3 22 25 50
25-2052 Special Education Teachers, Kindergarten & Elementary School 8,990 9,450 5.1% 46 306 336 688
25-2053 Special Education Teachers, Middle School 3,100 3,260 5.2% 16 106 116 238
25-2054 Special Education Teachers, Secondary School 6,890 7,270 5.5% 38 235 258 531
25-2059 Special Education Teachers, Other 190 210 10.5% 2 7 7 16
25-3000 Other Teachers & Instructors 40,660 43,720 7.5% 306 2,572 1,974 4,852
25-3011 Adult Basic & Secondary Education & Literacy Teachers 1,810 1,790 -1.1% -2 110 84 192
25-3021 Self-Enrichment Education Teachers 13,500 14,450 7.0% 95 852 654 1,601
25-3097 Teachers & Instructors, Other, Except Substitutes 9,700 10,760 10.9% 106 623 479 1,208
25-3098 Substitute Teachers 15,650 16,730 6.9% 108 987 758 1,853
25-4000 Librarians, Curators & Archivists 9,200 9,550 3.8% 36 561 418 1,015
25-4011 Archivists 310 330 6.5% 3 13 18 34
25-4012 Curators 570 620 8.8% 6 25 34 65
25-4013 Museum Technicians & Conservators 500 540 8.0% 4 22 30 56
25-4021 Librarians 5,080 5,220 2.8% 14 281 192 487
25-4031 Library Technicians 2,750 2,840 3.3% 10 220 143 373
25-9000 Other Education, Training & Library Occupations 53,980 57,330 6.2% 335 2,989 2,498 5,822
25-9031 Instructional Coordinators 5,380 5,750 6.9% 37 264 228 529
25-9041 Teacher Assistants 45,390 48,160 6.1% 277 2,567 2,134 4,978
25-9099 Education, Training & Library Workers, Other 1,550 1,670 7.7% 12 77 66 155
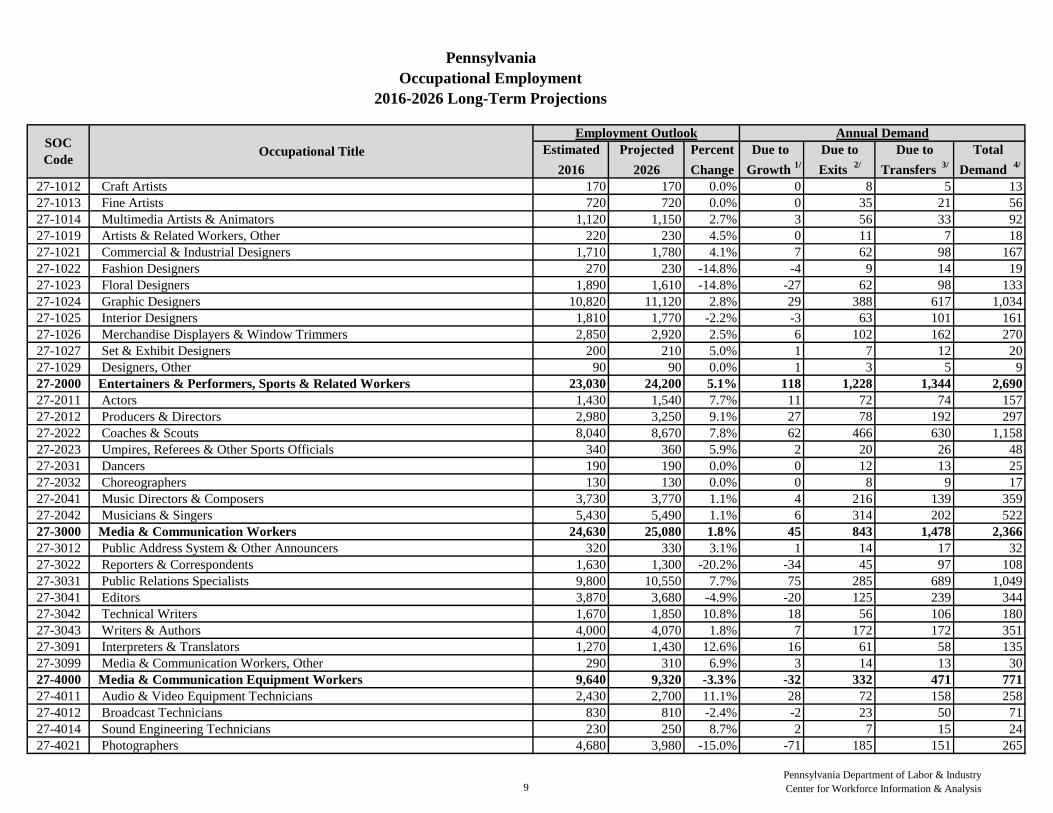
27-0000 Arts, Design, Entertainment, Sports & Media Occupations 81,900 83,380 1.8% 148 3,342 4,546 8,036
27-1000 Art & Design Workers 24,610 24,770 0.7% 16 940 1,252 2,208
27-1011 Art Directors 2,740 2,780 1.5% 4 134 80 218
8
Pennsylvania Department of Labor & Industry
Center for Workforce Information & Analysis
Estimated Projected Percent Due to Due to Due to Total
2016 2026 Change Growth 1/
Exits 2/
Transfers 3/
Demand 4/
Pennsylvania
Occupational Employment
2016-2026 Long-Term Projections
SOC
CodeOccupational Title
Employment Outlook Annual Demand
27-1012 Craft Artists 170 170 0.0% 0 8 5 13
27-1013 Fine Artists 720 720 0.0% 0 35 21 56
27-1014 Multimedia Artists & Animators 1,120 1,150 2.7% 3 56 33 92
27-1019 Artists & Related Workers, Other 220 230 4.5% 0 11 7 18
27-1021 Commercial & Industrial Designers 1,710 1,780 4.1% 7 62 98 167
27-1022 Fashion Designers 270 230 -14.8% -4 9 14 19
27-1023 Floral Designers 1,890 1,610 -14.8% -27 62 98 133
27-1024 Graphic Designers 10,820 11,120 2.8% 29 388 617 1,034
27-1025 Interior Designers 1,810 1,770 -2.2% -3 63 101 161
27-1026 Merchandise Displayers & Window Trimmers 2,850 2,920 2.5% 6 102 162 270
27-1027 Set & Exhibit Designers 200 210 5.0% 1 7 12 20
27-1029 Designers, Other 90 90 0.0% 1 3 5 9
27-2000 Entertainers & Performers, Sports & Related Workers 23,030 24,200 5.1% 118 1,228 1,344 2,690
27-2011 Actors 1,430 1,540 7.7% 11 72 74 157
27-2012 Producers & Directors 2,980 3,250 9.1% 27 78 192 297
27-2022 Coaches & Scouts 8,040 8,670 7.8% 62 466 630 1,158
27-2023 Umpires, Referees & Other Sports Officials 340 360 5.9% 2 20 26 48
27-2031 Dancers 190 190 0.0% 0 12 13 25
27-2032 Choreographers 130 130 0.0% 0 8 9 17
27-2041 Music Directors & Composers 3,730 3,770 1.1% 4 216 139 359
27-2042 Musicians & Singers 5,430 5,490 1.1% 6 314 202 522
27-3000 Media & Communication Workers 24,630 25,080 1.8% 45 843 1,478 2,366
27-3012 Public Address System & Other Announcers 320 330 3.1% 1 14 17 32
27-3022 Reporters & Correspondents 1,630 1,300 -20.2% -34 45 97 108
27-3031 Public Relations Specialists 9,800 10,550 7.7% 75 285 689 1,049
27-3041 Editors 3,870 3,680 -4.9% -20 125 239 344
27-3042 Technical Writers 1,670 1,850 10.8% 18 56 106 180
27-3043 Writers & Authors 4,000 4,070 1.8% 7 172 172 351
27-3091 Interpreters & Translators 1,270 1,430 12.6% 16 61 58 135
27-3099 Media & Communication Workers, Other 290 310 6.9% 3 14 13 30
27-4000 Media & Communication Equipment Workers 9,640 9,320 -3.3% -32 332 471 771
27-4011 Audio & Video Equipment Technicians 2,430 2,700 11.1% 28 72 158 258
27-4012 Broadcast Technicians 830 810 -2.4% -2 23 50 71
27-4014 Sound Engineering Technicians 230 250 8.7% 2 7 15 24
27-4021 Photographers 4,680 3,980 -15.0% -71 185 151 265
9
Pennsylvania Department of Labor & Industry
Center for Workforce Information & Analysis
Estimated Projected Percent Due to Due to Due to Total
2016 2026 Change Growth 1/
Exits 2/
Transfers 3/
Demand 4/
Pennsylvania
Occupational Employment
2016-2026 Long-Term Projections
SOC
CodeOccupational Title
Employment Outlook Annual Demand
27-4031 Camera Operators: TV, Video & Motion Picture 740 780 5.4% 4 22 48 74
27-4032 Film & Video Editors 500 560 12.0% 6 16 34 56
27-4099 Media & Communication Equipment Workers, Other 240 240 0.0% 1 7 15 23
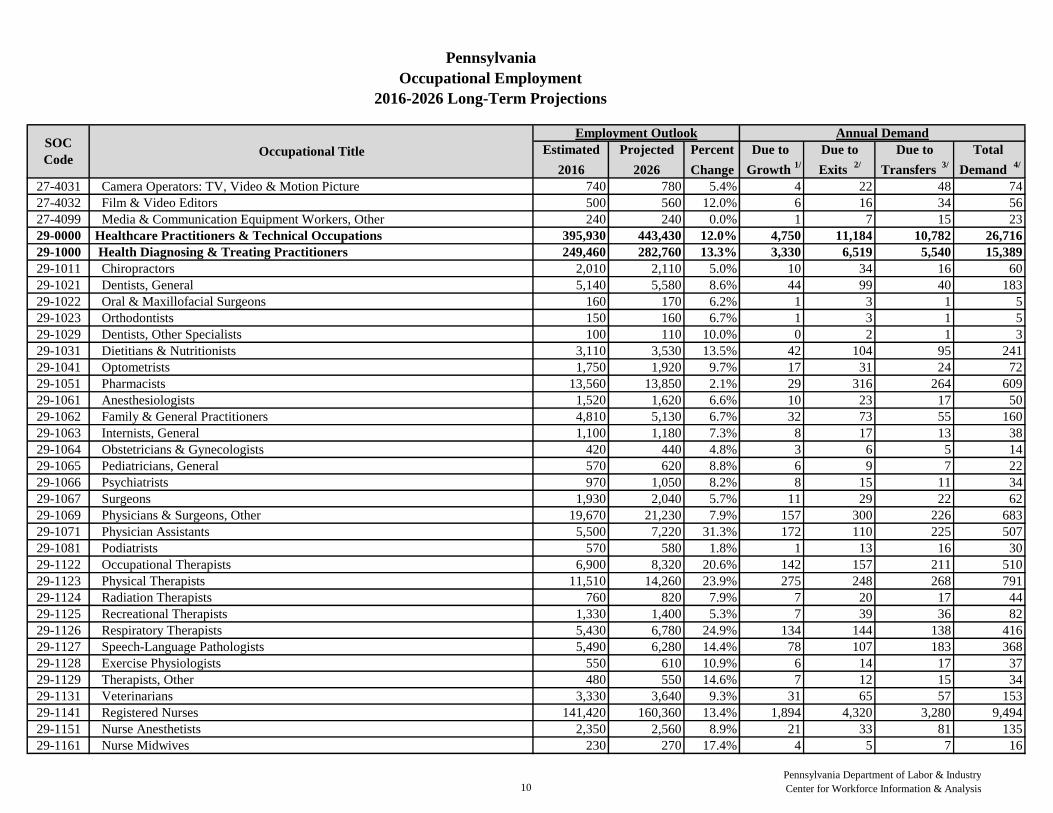
29-0000 Healthcare Practitioners & Technical Occupations 395,930 443,430 12.0% 4,750 11,184 10,782 26,716
29-1000 Health Diagnosing & Treating Practitioners 249,460 282,760 13.3% 3,330 6,519 5,540 15,389
29-1011 Chiropractors 2,010 2,110 5.0% 10 34 16 60
29-1021 Dentists, General 5,140 5,580 8.6% 44 99 40 183
29-1022 Oral & Maxillofacial Surgeons 160 170 6.2% 1 3 1 5
29-1023 Orthodontists 150 160 6.7% 1 3 1 5
29-1029 Dentists, Other Specialists 100 110 10.0% 0 2 1 3
29-1031 Dietitians & Nutritionists 3,110 3,530 13.5% 42 104 95 241
29-1041 Optometrists 1,750 1,920 9.7% 17 31 24 72
29-1051 Pharmacists 13,560 13,850 2.1% 29 316 264 609
29-1061 Anesthesiologists 1,520 1,620 6.6% 10 23 17 50
29-1062 Family & General Practitioners 4,810 5,130 6.7% 32 73 55 160
29-1063 Internists, General 1,100 1,180 7.3% 8 17 13 38
29-1064 Obstetricians & Gynecologists 420 440 4.8% 3 6 5 14
29-1065 Pediatricians, General 570 620 8.8% 6 9 7 22
29-1066 Psychiatrists 970 1,050 8.2% 8 15 11 34
29-1067 Surgeons 1,930 2,040 5.7% 11 29 22 62
29-1069 Physicians & Surgeons, Other 19,670 21,230 7.9% 157 300 226 683
29-1071 Physician Assistants 5,500 7,220 31.3% 172 110 225 507
29-1081 Podiatrists 570 580 1.8% 1 13 16 30
29-1122 Occupational Therapists 6,900 8,320 20.6% 142 157 211 510
29-1123 Physical Therapists 11,510 14,260 23.9% 275 248 268 791
29-1124 Radiation Therapists 760 820 7.9% 7 20 17 44
29-1125 Recreational Therapists 1,330 1,400 5.3% 7 39 36 82
29-1126 Respiratory Therapists 5,430 6,780 24.9% 134 144 138 416
29-1127 Speech-Language Pathologists 5,490 6,280 14.4% 78 107 183 368
29-1128 Exercise Physiologists 550 610 10.9% 6 14 17 37
29-1129 Therapists, Other 480 550 14.6% 7 12 15 34
29-1131 Veterinarians 3,330 3,640 9.3% 31 65 57 153
29-1141 Registered Nurses 141,420 160,360 13.4% 1,894 4,320 3,280 9,494
29-1151 Nurse Anesthetists 2,350 2,560 8.9% 21 33 81 135
29-1161 Nurse Midwives 230 270 17.4% 4 5 7 16
10
Pennsylvania Department of Labor & Industry
Center for Workforce Information & Analysis
Estimated Projected Percent Due to Due to Due to Total
2016 2026 Change Growth 1/
Exits 2/
Transfers 3/
Demand 4/
Pennsylvania
Occupational Employment
2016-2026 Long-Term Projections
SOC
CodeOccupational Title
Employment Outlook Annual Demand
29-1171 Nurse Practitioners 5,140 6,710 30.5% 157 115 170 442
29-1181 Audiologists 660 750 13.6% 9 18 14 41
29-1199 Health Diagnosing & Treating Practitioners, Other 870 920 5.7% 5 36 9 50
29-2000 Health Technologists & Technicians 139,760 153,300 9.7% 1,355 4,508 5,049 10,912
29-2011 Medical & Clinical Laboratory Technologists 8,040 8,810 9.6% 77 255 255 587
29-2012 Medical & Clinical Laboratory Technicians 7,700 8,590 11.6% 89 246 246 581
29-2021 Dental Hygienists 9,770 10,530 7.8% 76 367 228 671
29-2031 Cardiovascular Technologists & Technicians 2,880 3,130 8.7% 26 78 75 179
29-2032 Diagnostic Medical Sonographers 2,550 2,990 17.3% 45 72 69 186
29-2033 Nuclear Medicine Technologists 910 980 7.7% 6 24 24 54
29-2034 Radiologic Technologists 10,240 11,190 9.3% 95 277 267 639
29-2035 Magnetic Resonance Imaging Technologists 1,190 1,290 8.4% 10 32 31 73
29-2041 Emergency Medical Technicians & Paramedics 12,150 13,700 12.8% 156 225 532 913
29-2051 Dietetic Technicians 1,210 1,330 9.9% 13 41 56 110
29-2052 Pharmacy Technicians 16,430 17,670 7.5% 125 554 756 1,435
29-2053 Psychiatric Technicians 2,050 2,020 -1.5% -3 66 90 153
29-2054 Respiratory Therapy Technicians 320 270 -15.6% -5 10 13 18
29-2055 Surgical Technologists 3,800 4,230 11.3% 43 130 178 351
29-2056 Veterinary Technologists & Technicians 4,890 5,390 10.2% 50 167 228 445
29-2057 Ophthalmic Medical Technicians 1,430 1,580 10.5% 15 49 66 130
29-2061 Licensed Practical & Licensed Vocational Nurses 38,740 42,320 9.2% 358 1,429 1,408 3,195
29-2071 Medical Records & Health Information Technicians 7,770 8,610 10.8% 84 240 244 568
29-2081 Opticians, Dispensing 3,410 3,680 7.9% 27 118 131 276
29-2091 Orthotists & Prosthetists 290 320 10.3% 3 8 10 21
29-2092 Hearing Aid Specialists 260 280 7.7% 2 8 9 19
29-2099 Health Technologists & Technicians, Other 3,760 4,400 17.0% 64 113 135 312
29-9000 Other Healthcare Practitioners & Technical Occupations 6,710 7,370 9.8% 66 156 193 415
29-9011 Occupational Health & Safety Specialists 3,260 3,470 6.4% 21 75 92 188
29-9012 Occupational Health & Safety Technicians 790 840 6.3% 4 18 22 44
29-9091 Athletic Trainers 1,570 1,870 19.1% 31 38 47 116
29-9092 Genetic Counselors 70 90 28.6% 2 2 2 6
29-9099 Healthcare Practitioners & Technical Workers, Other 1,010 1,100 8.9% 8 24 29 61
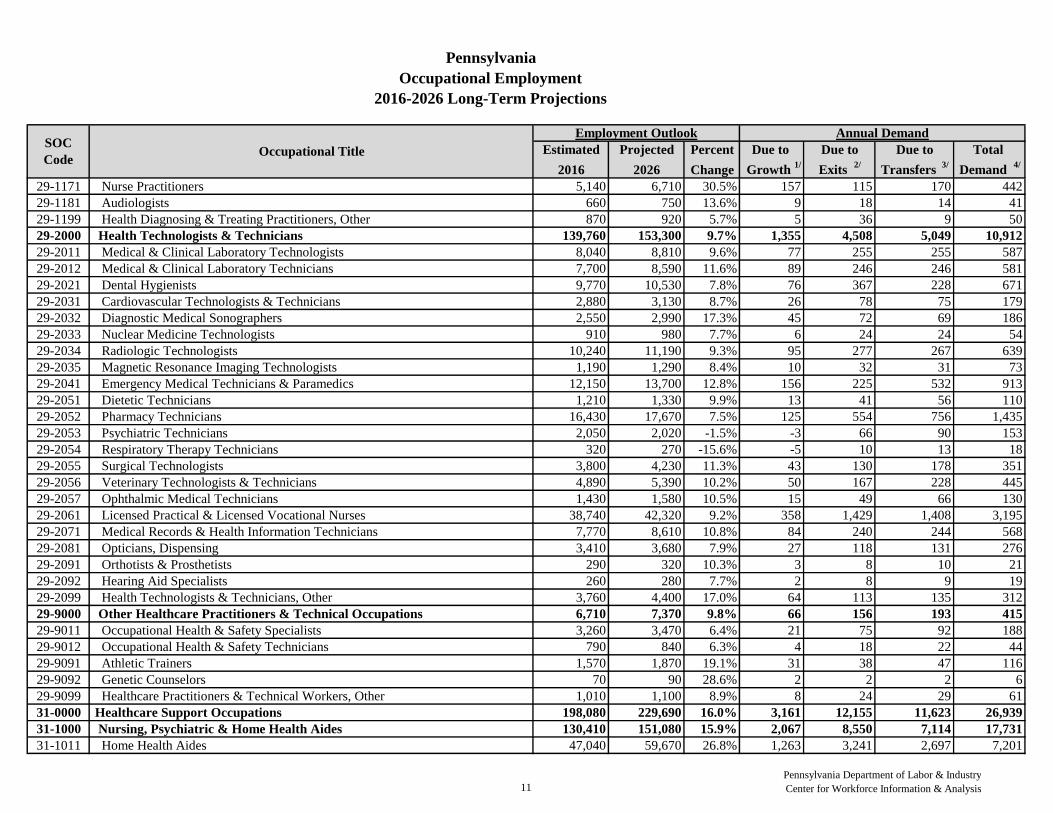
31-0000 Healthcare Support Occupations 198,080 229,690 16.0% 3,161 12,155 11,623 26,939
31-1000 Nursing, Psychiatric & Home Health Aides 130,410 151,080 15.9% 2,067 8,550 7,114 17,731
31-1011 Home Health Aides 47,040 59,670 26.8% 1,263 3,241 2,697 7,201
11
Pennsylvania Department of Labor & Industry
Center for Workforce Information & Analysis
Estimated Projected Percent Due to Due to Due to Total
2016 2026 Change Growth 1/
Exits 2/
Transfers 3/
Demand 4/
Pennsylvania
Occupational Employment
2016-2026 Long-Term Projections
SOC
CodeOccupational Title
Employment Outlook Annual Demand
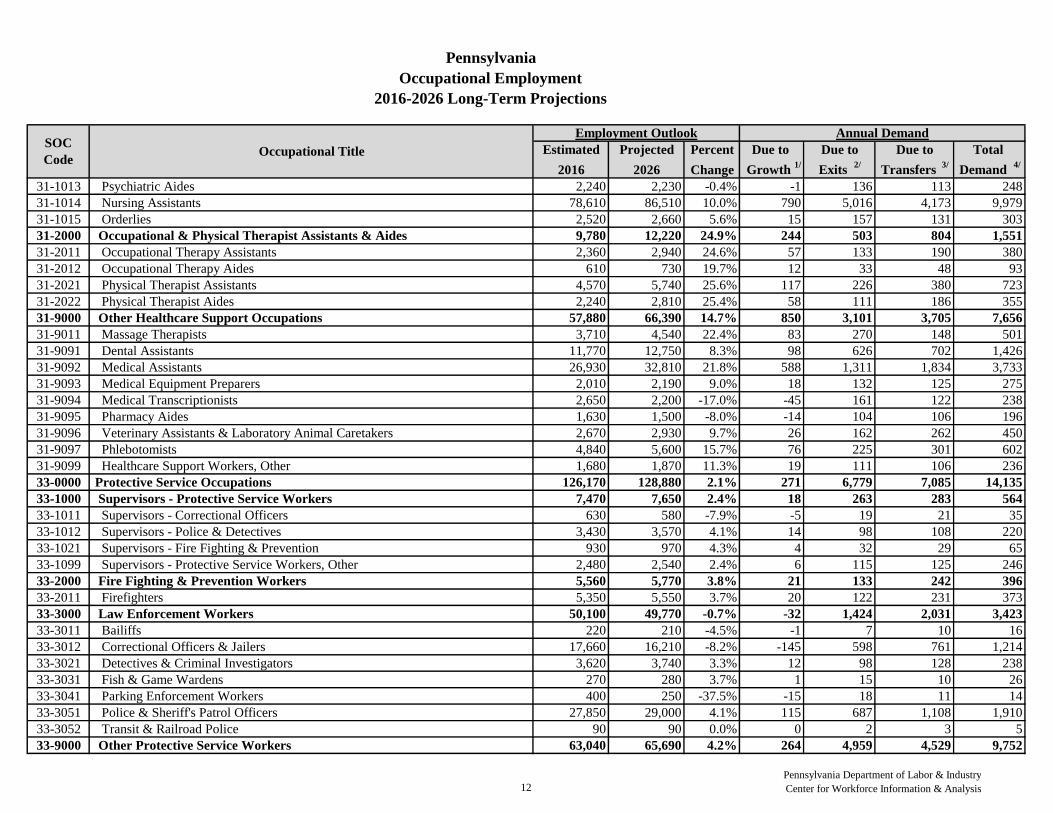
31-1013 Psychiatric Aides 2,240 2,230 -0.4% -1 136 113 248
31-1014 Nursing Assistants 78,610 86,510 10.0% 790 5,016 4,173 9,979
31-1015 Orderlies 2,520 2,660 5.6% 15 157 131 303
31-2000 Occupational & Physical Therapist Assistants & Aides 9,780 12,220 24.9% 244 503 804 1,551
31-2011 Occupational Therapy Assistants 2,360 2,940 24.6% 57 133 190 380
31-2012 Occupational Therapy Aides 610 730 19.7% 12 33 48 93
31-2021 Physical Therapist Assistants 4,570 5,740 25.6% 117 226 380 723
31-2022 Physical Therapist Aides 2,240 2,810 25.4% 58 111 186 355
31-9000 Other Healthcare Support Occupations 57,880 66,390 14.7% 850 3,101 3,705 7,656
31-9011 Massage Therapists 3,710 4,540 22.4% 83 270 148 501
31-9091 Dental Assistants 11,770 12,750 8.3% 98 626 702 1,426
31-9092 Medical Assistants 26,930 32,810 21.8% 588 1,311 1,834 3,733
31-9093 Medical Equipment Preparers 2,010 2,190 9.0% 18 132 125 275
31-9094 Medical Transcriptionists 2,650 2,200 -17.0% -45 161 122 238
31-9095 Pharmacy Aides 1,630 1,500 -8.0% -14 104 106 196
31-9096 Veterinary Assistants & Laboratory Animal Caretakers 2,670 2,930 9.7% 26 162 262 450
31-9097 Phlebotomists 4,840 5,600 15.7% 76 225 301 602
31-9099 Healthcare Support Workers, Other 1,680 1,870 11.3% 19 111 106 236
33-0000 Protective Service Occupations 126,170 128,880 2.1% 271 6,779 7,085 14,135
33-1000 Supervisors - Protective Service Workers 7,470 7,650 2.4% 18 263 283 564
33-1011 Supervisors - Correctional Officers 630 580 -7.9% -5 19 21 35
33-1012 Supervisors - Police & Detectives 3,430 3,570 4.1% 14 98 108 220
33-1021 Supervisors - Fire Fighting & Prevention 930 970 4.3% 4 32 29 65
33-1099 Supervisors - Protective Service Workers, Other 2,480 2,540 2.4% 6 115 125 246
33-2000 Fire Fighting & Prevention Workers 5,560 5,770 3.8% 21 133 242 396
33-2011 Firefighters 5,350 5,550 3.7% 20 122 231 373
33-3000 Law Enforcement Workers 50,100 49,770 -0.7% -32 1,424 2,031 3,423
33-3011 Bailiffs 220 210 -4.5% -1 7 10 16
33-3012 Correctional Officers & Jailers 17,660 16,210 -8.2% -145 598 761 1,214
33-3021 Detectives & Criminal Investigators 3,620 3,740 3.3% 12 98 128 238
33-3031 Fish & Game Wardens 270 280 3.7% 1 15 10 26
33-3041 Parking Enforcement Workers 400 250 -37.5% -15 18 11 14
33-3051 Police & Sheriff's Patrol Officers 27,850 29,000 4.1% 115 687 1,108 1,910
33-3052 Transit & Railroad Police 90 90 0.0% 0 2 3 5
33-9000 Other Protective Service Workers 63,040 65,690 4.2% 264 4,959 4,529 9,752
12
Pennsylvania Department of Labor & Industry
Center for Workforce Information & Analysis
Estimated Projected Percent Due to Due to Due to Total
2016 2026 Change Growth 1/
Exits 2/
Transfers 3/
Demand 4/
Pennsylvania
Occupational Employment
2016-2026 Long-Term Projections
SOC
CodeOccupational Title
Employment Outlook Annual Demand
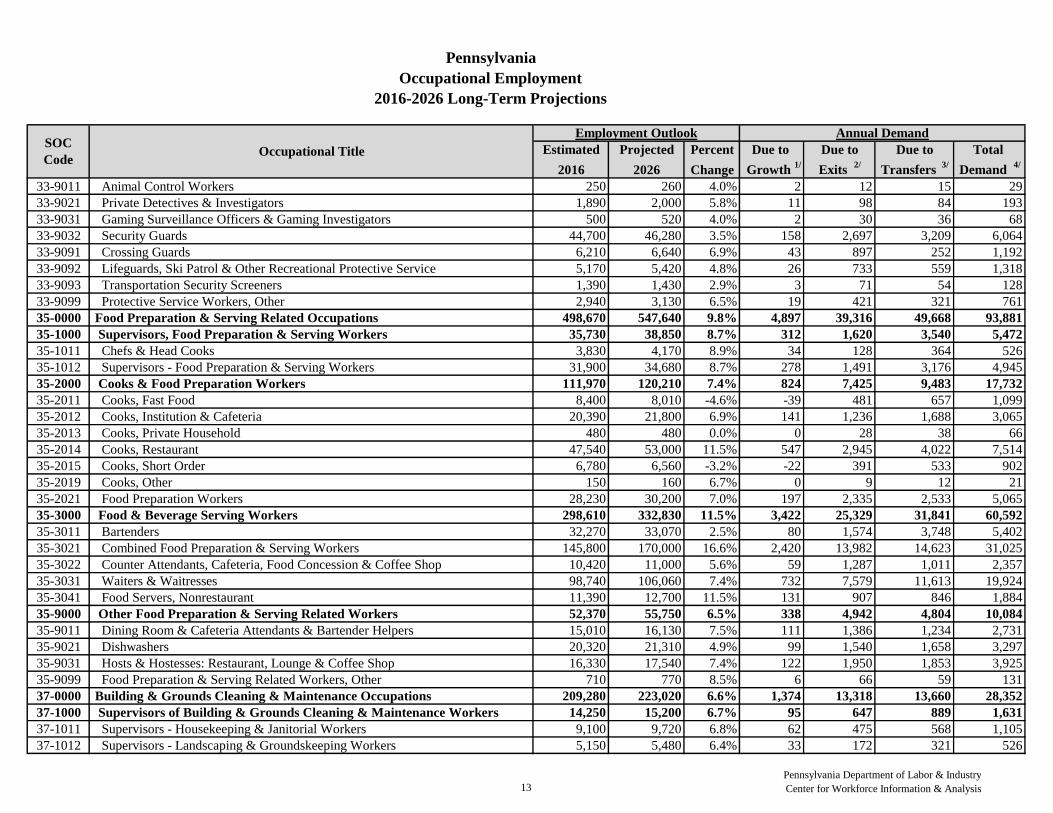
33-9011 Animal Control Workers 250 260 4.0% 2 12 15 29
33-9021 Private Detectives & Investigators 1,890 2,000 5.8% 11 98 84 193
33-9031 Gaming Surveillance Officers & Gaming Investigators 500 520 4.0% 2 30 36 68
33-9032 Security Guards 44,700 46,280 3.5% 158 2,697 3,209 6,064
33-9091 Crossing Guards 6,210 6,640 6.9% 43 897 252 1,192
33-9092 Lifeguards, Ski Patrol & Other Recreational Protective Service 5,170 5,420 4.8% 26 733 559 1,318
33-9093 Transportation Security Screeners 1,390 1,430 2.9% 3 71 54 128
33-9099 Protective Service Workers, Other 2,940 3,130 6.5% 19 421 321 761
35-0000 Food Preparation & Serving Related Occupations 498,670 547,640 9.8% 4,897 39,316 49,668 93,881
35-1000 Supervisors, Food Preparation & Serving Workers 35,730 38,850 8.7% 312 1,620 3,540 5,472
35-1011 Chefs & Head Cooks 3,830 4,170 8.9% 34 128 364 526
35-1012 Supervisors - Food Preparation & Serving Workers 31,900 34,680 8.7% 278 1,491 3,176 4,945
35-2000 Cooks & Food Preparation Workers 111,970 120,210 7.4% 824 7,425 9,483 17,732
35-2011 Cooks, Fast Food 8,400 8,010 -4.6% -39 481 657 1,099
35-2012 Cooks, Institution & Cafeteria 20,390 21,800 6.9% 141 1,236 1,688 3,065
35-2013 Cooks, Private Household 480 480 0.0% 0 28 38 66
35-2014 Cooks, Restaurant 47,540 53,000 11.5% 547 2,945 4,022 7,514
35-2015 Cooks, Short Order 6,780 6,560 -3.2% -22 391 533 902
35-2019 Cooks, Other 150 160 6.7% 0 9 12 21
35-2021 Food Preparation Workers 28,230 30,200 7.0% 197 2,335 2,533 5,065
35-3000 Food & Beverage Serving Workers 298,610 332,830 11.5% 3,422 25,329 31,841 60,592
35-3011 Bartenders 32,270 33,070 2.5% 80 1,574 3,748 5,402
35-3021 Combined Food Preparation & Serving Workers 145,800 170,000 16.6% 2,420 13,982 14,623 31,025
35-3022 Counter Attendants, Cafeteria, Food Concession & Coffee Shop 10,420 11,000 5.6% 59 1,287 1,011 2,357
35-3031 Waiters & Waitresses 98,740 106,060 7.4% 732 7,579 11,613 19,924
35-3041 Food Servers, Nonrestaurant 11,390 12,700 11.5% 131 907 846 1,884
35-9000 Other Food Preparation & Serving Related Workers 52,370 55,750 6.5% 338 4,942 4,804 10,084
35-9011 Dining Room & Cafeteria Attendants & Bartender Helpers 15,010 16,130 7.5% 111 1,386 1,234 2,731
35-9021 Dishwashers 20,320 21,310 4.9% 99 1,540 1,658 3,297
35-9031 Hosts & Hostesses: Restaurant, Lounge & Coffee Shop 16,330 17,540 7.4% 122 1,950 1,853 3,925
35-9099 Food Preparation & Serving Related Workers, Other 710 770 8.5% 6 66 59 131
37-0000 Building & Grounds Cleaning & Maintenance Occupations 209,280 223,020 6.6% 1,374 13,318 13,660 28,352
37-1000 Supervisors of Building & Grounds Cleaning & Maintenance Workers 14,250 15,200 6.7% 95 647 889 1,631
37-1011 Supervisors - Housekeeping & Janitorial Workers 9,100 9,720 6.8% 62 475 568 1,105
37-1012 Supervisors - Landscaping & Groundskeeping Workers 5,150 5,480 6.4% 33 172 321 526
13
Pennsylvania Department of Labor & Industry
Center for Workforce Information & Analysis
Estimated Projected Percent Due to Due to Due to Total
2016 2026 Change Growth 1/
Exits 2/
Transfers 3/
Demand 4/
Pennsylvania
Occupational Employment
2016-2026 Long-Term Projections
SOC
CodeOccupational Title
Employment Outlook Annual Demand
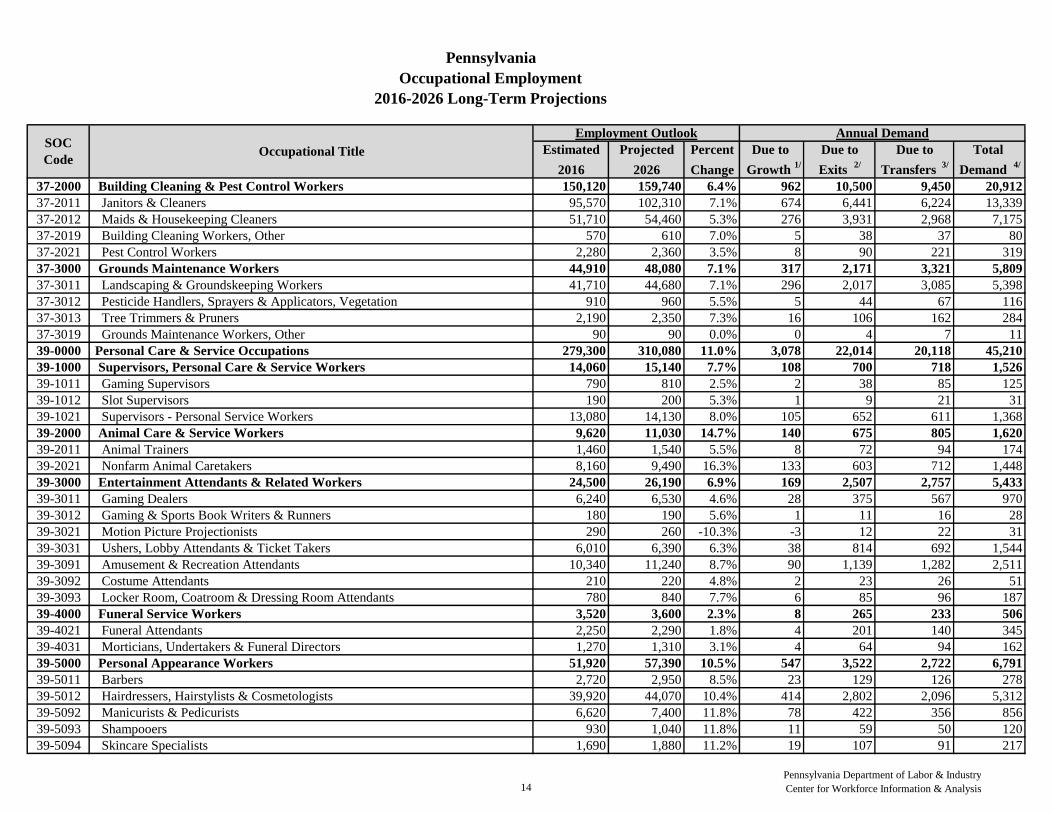
37-2000 Building Cleaning & Pest Control Workers 150,120 159,740 6.4% 962 10,500 9,450 20,912
37-2011 Janitors & Cleaners 95,570 102,310 7.1% 674 6,441 6,224 13,339
37-2012 Maids & Housekeeping Cleaners 51,710 54,460 5.3% 276 3,931 2,968 7,175
37-2019 Building Cleaning Workers, Other 570 610 7.0% 5 38 37 80
37-2021 Pest Control Workers 2,280 2,360 3.5% 8 90 221 319
37-3000 Grounds Maintenance Workers 44,910 48,080 7.1% 317 2,171 3,321 5,809
37-3011 Landscaping & Groundskeeping Workers 41,710 44,680 7.1% 296 2,017 3,085 5,398
37-3012 Pesticide Handlers, Sprayers & Applicators, Vegetation 910 960 5.5% 5 44 67 116
37-3013 Tree Trimmers & Pruners 2,190 2,350 7.3% 16 106 162 284
37-3019 Grounds Maintenance Workers, Other 90 90 0.0% 0 4 7 11
39-0000 Personal Care & Service Occupations 279,300 310,080 11.0% 3,078 22,014 20,118 45,210
39-1000 Supervisors, Personal Care & Service Workers 14,060 15,140 7.7% 108 700 718 1,526
39-1011 Gaming Supervisors 790 810 2.5% 2 38 85 125
39-1012 Slot Supervisors 190 200 5.3% 1 9 21 31
39-1021 Supervisors - Personal Service Workers 13,080 14,130 8.0% 105 652 611 1,368
39-2000 Animal Care & Service Workers 9,620 11,030 14.7% 140 675 805 1,620
39-2011 Animal Trainers 1,460 1,540 5.5% 8 72 94 174
39-2021 Nonfarm Animal Caretakers 8,160 9,490 16.3% 133 603 712 1,448
39-3000 Entertainment Attendants & Related Workers 24,500 26,190 6.9% 169 2,507 2,757 5,433
39-3011 Gaming Dealers 6,240 6,530 4.6% 28 375 567 970
39-3012 Gaming & Sports Book Writers & Runners 180 190 5.6% 1 11 16 28
39-3021 Motion Picture Projectionists 290 260 -10.3% -3 12 22 31
39-3031 Ushers, Lobby Attendants & Ticket Takers 6,010 6,390 6.3% 38 814 692 1,544
39-3091 Amusement & Recreation Attendants 10,340 11,240 8.7% 90 1,139 1,282 2,511
39-3092 Costume Attendants 210 220 4.8% 2 23 26 51
39-3093 Locker Room, Coatroom & Dressing Room Attendants 780 840 7.7% 6 85 96 187
39-4000 Funeral Service Workers 3,520 3,600 2.3% 8 265 233 506
39-4021 Funeral Attendants 2,250 2,290 1.8% 4 201 140 345
39-4031 Morticians, Undertakers & Funeral Directors 1,270 1,310 3.1% 4 64 94 162
39-5000 Personal Appearance Workers 51,920 57,390 10.5% 547 3,522 2,722 6,791
39-5011 Barbers 2,720 2,950 8.5% 23 129 126 278
39-5012 Hairdressers, Hairstylists & Cosmetologists 39,920 44,070 10.4% 414 2,802 2,096 5,312
39-5092 Manicurists & Pedicurists 6,620 7,400 11.8% 78 422 356 856
39-5093 Shampooers 930 1,040 11.8% 11 59 50 120
39-5094 Skincare Specialists 1,690 1,880 11.2% 19 107 91 217
14
Pennsylvania Department of Labor & Industry
Center for Workforce Information & Analysis
Estimated Projected Percent Due to Due to Due to Total
2016 2026 Change Growth 1/
Exits 2/
Transfers 3/
Demand 4/
Pennsylvania
Occupational Employment
2016-2026 Long-Term Projections
SOC
CodeOccupational Title
Employment Outlook Annual Demand
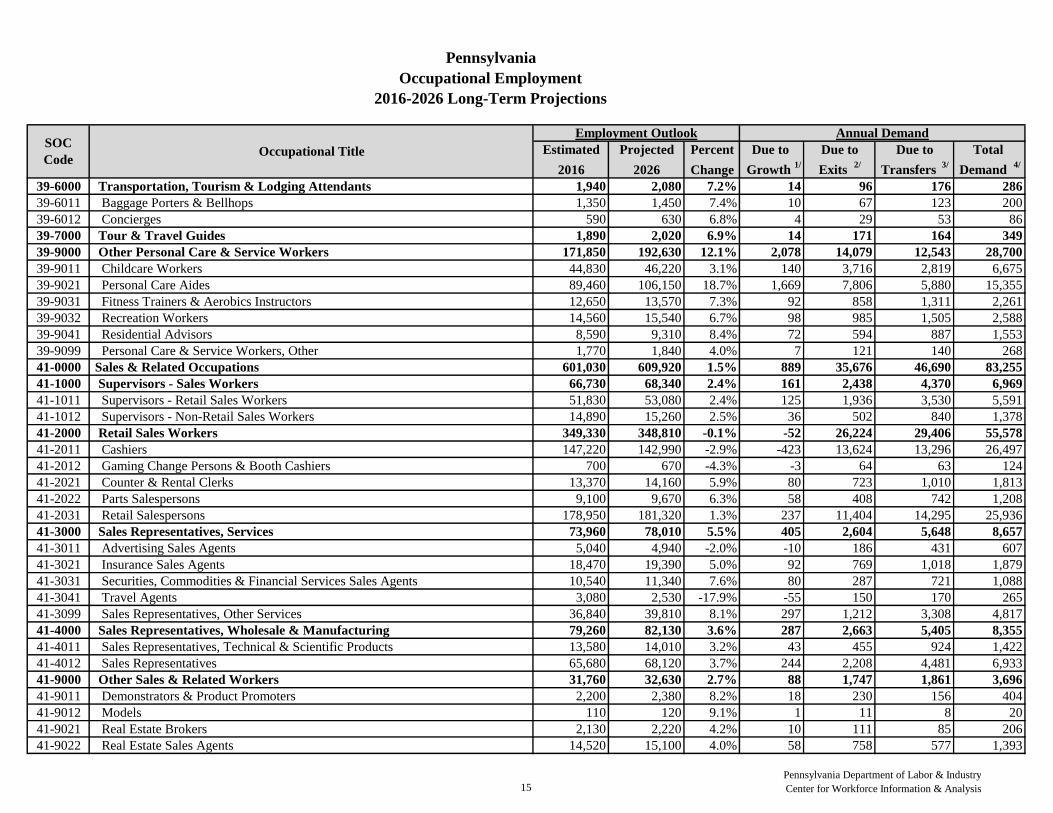
39-6000 Transportation, Tourism & Lodging Attendants 1,940 2,080 7.2% 14 96 176 286
39-6011 Baggage Porters & Bellhops 1,350 1,450 7.4% 10 67 123 200
39-6012 Concierges 590 630 6.8% 4 29 53 86
39-7000 Tour & Travel Guides 1,890 2,020 6.9% 14 171 164 349
39-9000 Other Personal Care & Service Workers 171,850 192,630 12.1% 2,078 14,079 12,543 28,700
39-9011 Childcare Workers 44,830 46,220 3.1% 140 3,716 2,819 6,675
39-9021 Personal Care Aides 89,460 106,150 18.7% 1,669 7,806 5,880 15,355
39-9031 Fitness Trainers & Aerobics Instructors 12,650 13,570 7.3% 92 858 1,311 2,261
39-9032 Recreation Workers 14,560 15,540 6.7% 98 985 1,505 2,588
39-9041 Residential Advisors 8,590 9,310 8.4% 72 594 887 1,553
39-9099 Personal Care & Service Workers, Other 1,770 1,840 4.0% 7 121 140 268
41-0000 Sales & Related Occupations 601,030 609,920 1.5% 889 35,676 46,690 83,255
41-1000 Supervisors - Sales Workers 66,730 68,340 2.4% 161 2,438 4,370 6,969
41-1011 Supervisors - Retail Sales Workers 51,830 53,080 2.4% 125 1,936 3,530 5,591
41-1012 Supervisors - Non-Retail Sales Workers 14,890 15,260 2.5% 36 502 840 1,378
41-2000 Retail Sales Workers 349,330 348,810 -0.1% -52 26,224 29,406 55,578
41-2011 Cashiers 147,220 142,990 -2.9% -423 13,624 13,296 26,497
41-2012 Gaming Change Persons & Booth Cashiers 700 670 -4.3% -3 64 63 124
41-2021 Counter & Rental Clerks 13,370 14,160 5.9% 80 723 1,010 1,813
41-2022 Parts Salespersons 9,100 9,670 6.3% 58 408 742 1,208
41-2031 Retail Salespersons 178,950 181,320 1.3% 237 11,404 14,295 25,936
41-3000 Sales Representatives, Services 73,960 78,010 5.5% 405 2,604 5,648 8,657
41-3011 Advertising Sales Agents 5,040 4,940 -2.0% -10 186 431 607
41-3021 Insurance Sales Agents 18,470 19,390 5.0% 92 769 1,018 1,879
41-3031 Securities, Commodities & Financial Services Sales Agents 10,540 11,340 7.6% 80 287 721 1,088
41-3041 Travel Agents 3,080 2,530 -17.9% -55 150 170 265
41-3099 Sales Representatives, Other Services 36,840 39,810 8.1% 297 1,212 3,308 4,817
41-4000 Sales Representatives, Wholesale & Manufacturing 79,260 82,130 3.6% 287 2,663 5,405 8,355
41-4011 Sales Representatives, Technical & Scientific Products 13,580 14,010 3.2% 43 455 924 1,422
41-4012 Sales Representatives 65,680 68,120 3.7% 244 2,208 4,481 6,933
41-9000 Other Sales & Related Workers 31,760 32,630 2.7% 88 1,747 1,861 3,696
41-9011 Demonstrators & Product Promoters 2,200 2,380 8.2% 18 230 156 404
41-9012 Models 110 120 9.1% 1 11 8 20
41-9021 Real Estate Brokers 2,130 2,220 4.2% 10 111 85 206
41-9022 Real Estate Sales Agents 14,520 15,100 4.0% 58 758 577 1,393
15
Pennsylvania Department of Labor & Industry
Center for Workforce Information & Analysis
Estimated Projected Percent Due to Due to Due to Total
2016 2026 Change Growth 1/
Exits 2/
Transfers 3/
Demand 4/
Pennsylvania
Occupational Employment
2016-2026 Long-Term Projections
SOC
CodeOccupational Title
Employment Outlook Annual Demand
41-9031 Sales Engineers 3,460 3,630 4.9% 17 83 272 372
41-9041 Telemarketers 6,390 6,140 -3.9% -25 374 591 940
41-9091 Door-to-Door Sales Workers, News & Street Vendors & Related Workers 1,480 1,420 -4.1% -6 98 54 146
41-9099 Sales & Related Workers, Other 1,470 1,630 10.9% 15 82 118 215
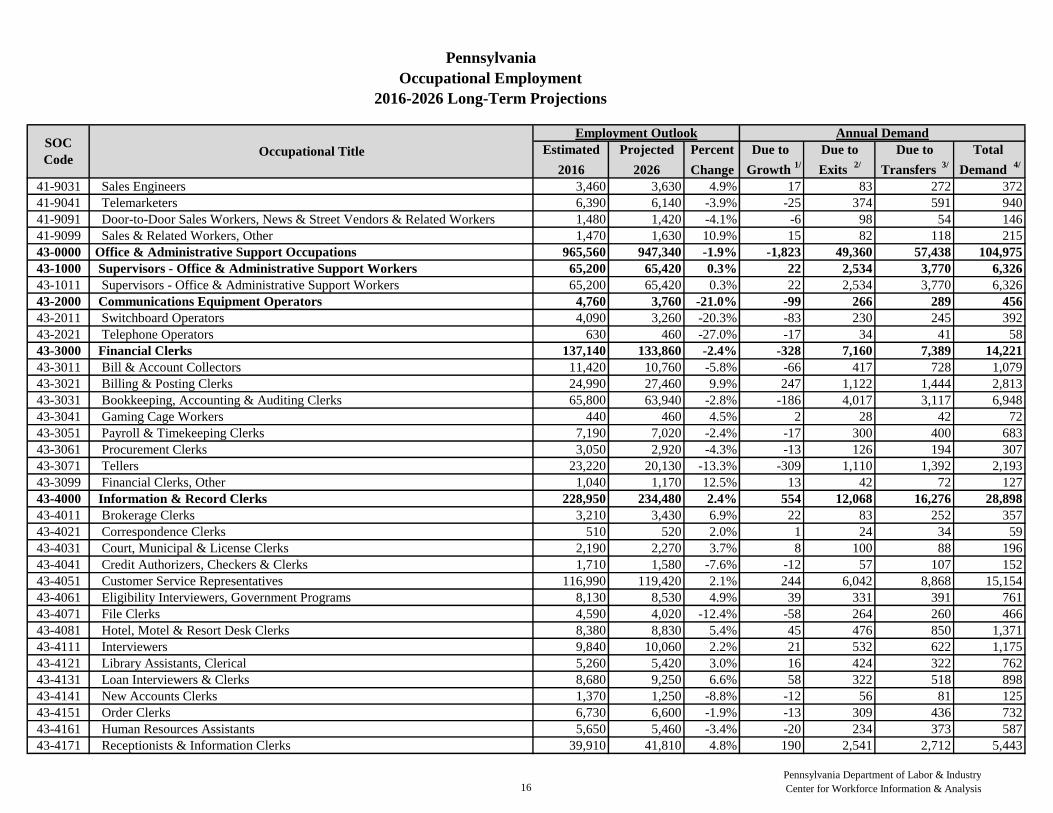
43-0000 Office & Administrative Support Occupations 965,560 947,340 -1.9% -1,823 49,360 57,438 104,975
43-1000 Supervisors - Office & Administrative Support Workers 65,200 65,420 0.3% 22 2,534 3,770 6,326
43-1011 Supervisors - Office & Administrative Support Workers 65,200 65,420 0.3% 22 2,534 3,770 6,326
43-2000 Communications Equipment Operators 4,760 3,760 -21.0% -99 266 289 456
43-2011 Switchboard Operators 4,090 3,260 -20.3% -83 230 245 392
43-2021 Telephone Operators 630 460 -27.0% -17 34 41 58
43-3000 Financial Clerks 137,140 133,860 -2.4% -328 7,160 7,389 14,221
43-3011 Bill & Account Collectors 11,420 10,760 -5.8% -66 417 728 1,079
43-3021 Billing & Posting Clerks 24,990 27,460 9.9% 247 1,122 1,444 2,813
43-3031 Bookkeeping, Accounting & Auditing Clerks 65,800 63,940 -2.8% -186 4,017 3,117 6,948
43-3041 Gaming Cage Workers 440 460 4.5% 2 28 42 72
43-3051 Payroll & Timekeeping Clerks 7,190 7,020 -2.4% -17 300 400 683
43-3061 Procurement Clerks 3,050 2,920 -4.3% -13 126 194 307
43-3071 Tellers 23,220 20,130 -13.3% -309 1,110 1,392 2,193
43-3099 Financial Clerks, Other 1,040 1,170 12.5% 13 42 72 127
43-4000 Information & Record Clerks 228,950 234,480 2.4% 554 12,068 16,276 28,898
43-4011 Brokerage Clerks 3,210 3,430 6.9% 22 83 252 357
43-4021 Correspondence Clerks 510 520 2.0% 1 24 34 59
43-4031 Court, Municipal & License Clerks 2,190 2,270 3.7% 8 100 88 196
43-4041 Credit Authorizers, Checkers & Clerks 1,710 1,580 -7.6% -12 57 107 152
43-4051 Customer Service Representatives 116,990 119,420 2.1% 244 6,042 8,868 15,154
43-4061 Eligibility Interviewers, Government Programs 8,130 8,530 4.9% 39 331 391 761
43-4071 File Clerks 4,590 4,020 -12.4% -58 264 260 466
43-4081 Hotel, Motel & Resort Desk Clerks 8,380 8,830 5.4% 45 476 850 1,371
43-4111 Interviewers 9,840 10,060 2.2% 21 532 622 1,175
43-4121 Library Assistants, Clerical 5,260 5,420 3.0% 16 424 322 762
43-4131 Loan Interviewers & Clerks 8,680 9,250 6.6% 58 322 518 898
43-4141 New Accounts Clerks 1,370 1,250 -8.8% -12 56 81 125
43-4151 Order Clerks 6,730 6,600 -1.9% -13 309 436 732
43-4161 Human Resources Assistants 5,650 5,460 -3.4% -20 234 373 587
43-4171 Receptionists & Information Clerks 39,910 41,810 4.8% 190 2,541 2,712 5,443
16
Pennsylvania Department of Labor & Industry
Center for Workforce Information & Analysis
Estimated Projected Percent Due to Due to Due to Total
2016 2026 Change Growth 1/
Exits 2/
Transfers 3/
Demand 4/
Pennsylvania
Occupational Employment
2016-2026 Long-Term Projections
SOC
CodeOccupational Title
Employment Outlook Annual Demand
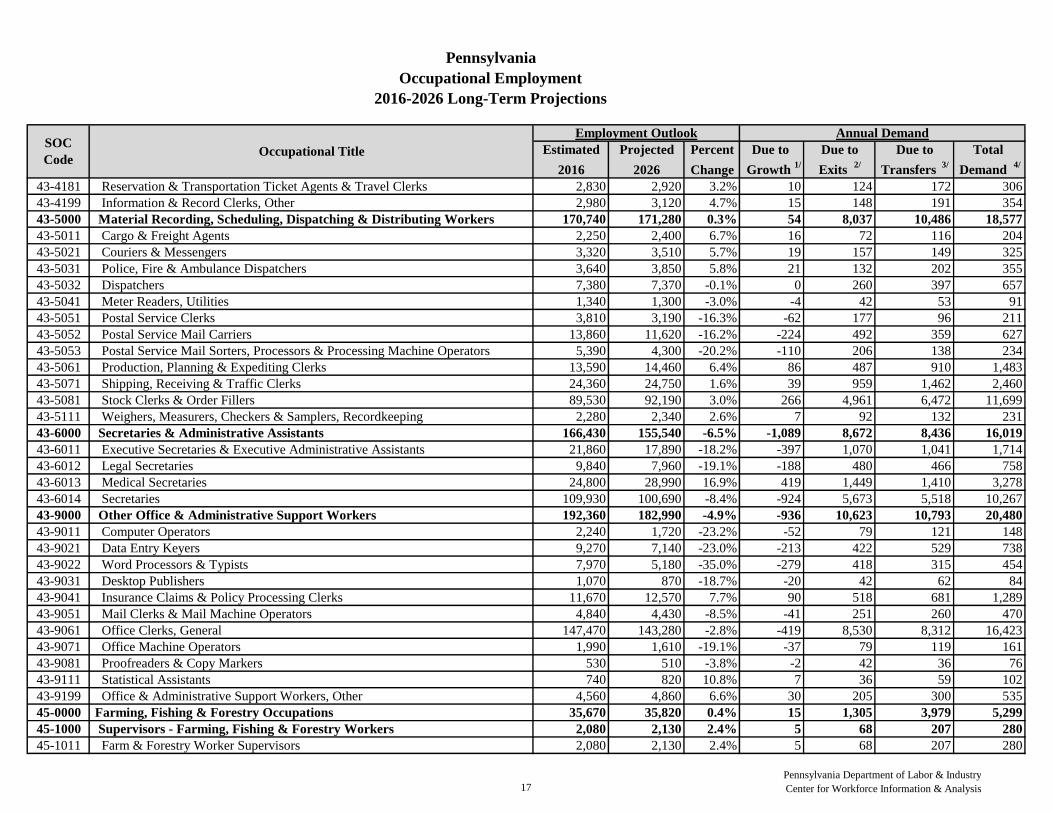
43-4181 Reservation & Transportation Ticket Agents & Travel Clerks 2,830 2,920 3.2% 10 124 172 306
43-4199 Information & Record Clerks, Other 2,980 3,120 4.7% 15 148 191 354
43-5000 Material Recording, Scheduling, Dispatching & Distributing Workers 170,740 171,280 0.3% 54 8,037 10,486 18,577
43-5011 Cargo & Freight Agents 2,250 2,400 6.7% 16 72 116 204
43-5021 Couriers & Messengers 3,320 3,510 5.7% 19 157 149 325
43-5031 Police, Fire & Ambulance Dispatchers 3,640 3,850 5.8% 21 132 202 355
43-5032 Dispatchers 7,380 7,370 -0.1% 0 260 397 657
43-5041 Meter Readers, Utilities 1,340 1,300 -3.0% -4 42 53 91
43-5051 Postal Service Clerks 3,810 3,190 -16.3% -62 177 96 211
43-5052 Postal Service Mail Carriers 13,860 11,620 -16.2% -224 492 359 627
43-5053 Postal Service Mail Sorters, Processors & Processing Machine Operators 5,390 4,300 -20.2% -110 206 138 234
43-5061 Production, Planning & Expediting Clerks 13,590 14,460 6.4% 86 487 910 1,483
43-5071 Shipping, Receiving & Traffic Clerks 24,360 24,750 1.6% 39 959 1,462 2,460
43-5081 Stock Clerks & Order Fillers 89,530 92,190 3.0% 266 4,961 6,472 11,699
43-5111 Weighers, Measurers, Checkers & Samplers, Recordkeeping 2,280 2,340 2.6% 7 92 132 231
43-6000 Secretaries & Administrative Assistants 166,430 155,540 -6.5% -1,089 8,672 8,436 16,019
43-6011 Executive Secretaries & Executive Administrative Assistants 21,860 17,890 -18.2% -397 1,070 1,041 1,714
43-6012 Legal Secretaries 9,840 7,960 -19.1% -188 480 466 758
43-6013 Medical Secretaries 24,800 28,990 16.9% 419 1,449 1,410 3,278
43-6014 Secretaries 109,930 100,690 -8.4% -924 5,673 5,518 10,267
43-9000 Other Office & Administrative Support Workers 192,360 182,990 -4.9% -936 10,623 10,793 20,480
43-9011 Computer Operators 2,240 1,720 -23.2% -52 79 121 148
43-9021 Data Entry Keyers 9,270 7,140 -23.0% -213 422 529 738
43-9022 Word Processors & Typists 7,970 5,180 -35.0% -279 418 315 454
43-9031 Desktop Publishers 1,070 870 -18.7% -20 42 62 84
43-9041 Insurance Claims & Policy Processing Clerks 11,670 12,570 7.7% 90 518 681 1,289
43-9051 Mail Clerks & Mail Machine Operators 4,840 4,430 -8.5% -41 251 260 470
43-9061 Office Clerks, General 147,470 143,280 -2.8% -419 8,530 8,312 16,423
43-9071 Office Machine Operators 1,990 1,610 -19.1% -37 79 119 161
43-9081 Proofreaders & Copy Markers 530 510 -3.8% -2 42 36 76
43-9111 Statistical Assistants 740 820 10.8% 7 36 59 102
43-9199 Office & Administrative Support Workers, Other 4,560 4,860 6.6% 30 205 300 535
45-0000 Farming, Fishing & Forestry Occupations 35,670 35,820 0.4% 15 1,305 3,979 5,299
45-1000 Supervisors - Farming, Fishing & Forestry Workers 2,080 2,130 2.4% 5 68 207 280
45-1011 Farm & Forestry Worker Supervisors 2,080 2,130 2.4% 5 68 207 280
17
Pennsylvania Department of Labor & Industry
Center for Workforce Information & Analysis
Estimated Projected Percent Due to Due to Due to Total
2016 2026 Change Growth 1/
Exits 2/
Transfers 3/
Demand 4/
Pennsylvania
Occupational Employment
2016-2026 Long-Term Projections
SOC
CodeOccupational Title
Employment Outlook Annual Demand
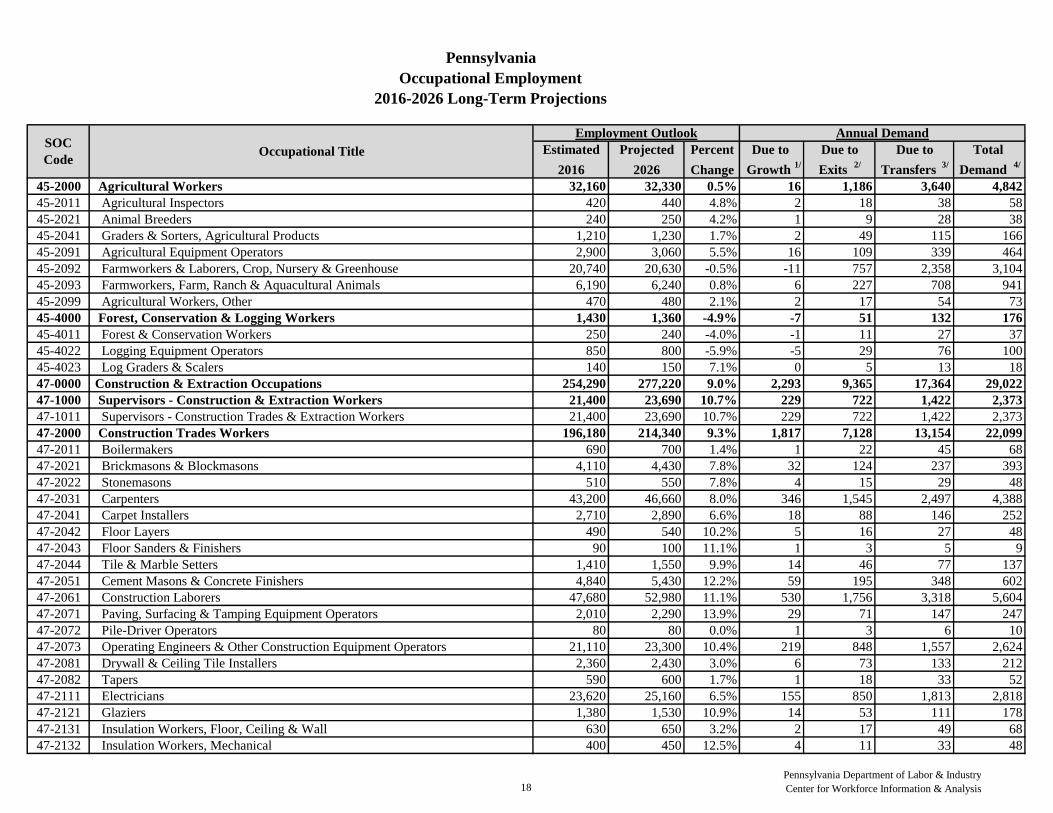
45-2000 Agricultural Workers 32,160 32,330 0.5% 16 1,186 3,640 4,842
45-2011 Agricultural Inspectors 420 440 4.8% 2 18 38 58
45-2021 Animal Breeders 240 250 4.2% 1 9 28 38
45-2041 Graders & Sorters, Agricultural Products 1,210 1,230 1.7% 2 49 115 166
45-2091 Agricultural Equipment Operators 2,900 3,060 5.5% 16 109 339 464
45-2092 Farmworkers & Laborers, Crop, Nursery & Greenhouse 20,740 20,630 -0.5% -11 757 2,358 3,104
45-2093 Farmworkers, Farm, Ranch & Aquacultural Animals 6,190 6,240 0.8% 6 227 708 941
45-2099 Agricultural Workers, Other 470 480 2.1% 2 17 54 73
45-4000 Forest, Conservation & Logging Workers 1,430 1,360 -4.9% -7 51 132 176
45-4011 Forest & Conservation Workers 250 240 -4.0% -1 11 27 37
45-4022 Logging Equipment Operators 850 800 -5.9% -5 29 76 100
45-4023 Log Graders & Scalers 140 150 7.1% 0 5 13 18
47-0000 Construction & Extraction Occupations 254,290 277,220 9.0% 2,293 9,365 17,364 29,022
47-1000 Supervisors - Construction & Extraction Workers 21,400 23,690 10.7% 229 722 1,422 2,373
47-1011 Supervisors - Construction Trades & Extraction Workers 21,400 23,690 10.7% 229 722 1,422 2,373
47-2000 Construction Trades Workers 196,180 214,340 9.3% 1,817 7,128 13,154 22,099
47-2011 Boilermakers 690 700 1.4% 1 22 45 68
47-2021 Brickmasons & Blockmasons 4,110 4,430 7.8% 32 124 237 393
47-2022 Stonemasons 510 550 7.8% 4 15 29 48
47-2031 Carpenters 43,200 46,660 8.0% 346 1,545 2,497 4,388
47-2041 Carpet Installers 2,710 2,890 6.6% 18 88 146 252
47-2042 Floor Layers 490 540 10.2% 5 16 27 48
47-2043 Floor Sanders & Finishers 90 100 11.1% 1 3 5 9
47-2044 Tile & Marble Setters 1,410 1,550 9.9% 14 46 77 137
47-2051 Cement Masons & Concrete Finishers 4,840 5,430 12.2% 59 195 348 602
47-2061 Construction Laborers 47,680 52,980 11.1% 530 1,756 3,318 5,604
47-2071 Paving, Surfacing & Tamping Equipment Operators 2,010 2,290 13.9% 29 71 147 247
47-2072 Pile-Driver Operators 80 80 0.0% 1 3 6 10
47-2073 Operating Engineers & Other Construction Equipment Operators 21,110 23,300 10.4% 219 848 1,557 2,624
47-2081 Drywall & Ceiling Tile Installers 2,360 2,430 3.0% 6 73 133 212
47-2082 Tapers 590 600 1.7% 1 18 33 52
47-2111 Electricians 23,620 25,160 6.5% 155 850 1,813 2,818
47-2121 Glaziers 1,380 1,530 10.9% 14 53 111 178
47-2131 Insulation Workers, Floor, Ceiling & Wall 630 650 3.2% 2 17 49 68
47-2132 Insulation Workers, Mechanical 400 450 12.5% 4 11 33 48
18
Pennsylvania Department of Labor & Industry
Center for Workforce Information & Analysis
Estimated Projected Percent Due to Due to Due to Total
2016 2026 Change Growth 1/
Exits 2/
Transfers 3/
Demand 4/
Pennsylvania
Occupational Employment
2016-2026 Long-Term Projections
SOC
CodeOccupational Title
Employment Outlook Annual Demand
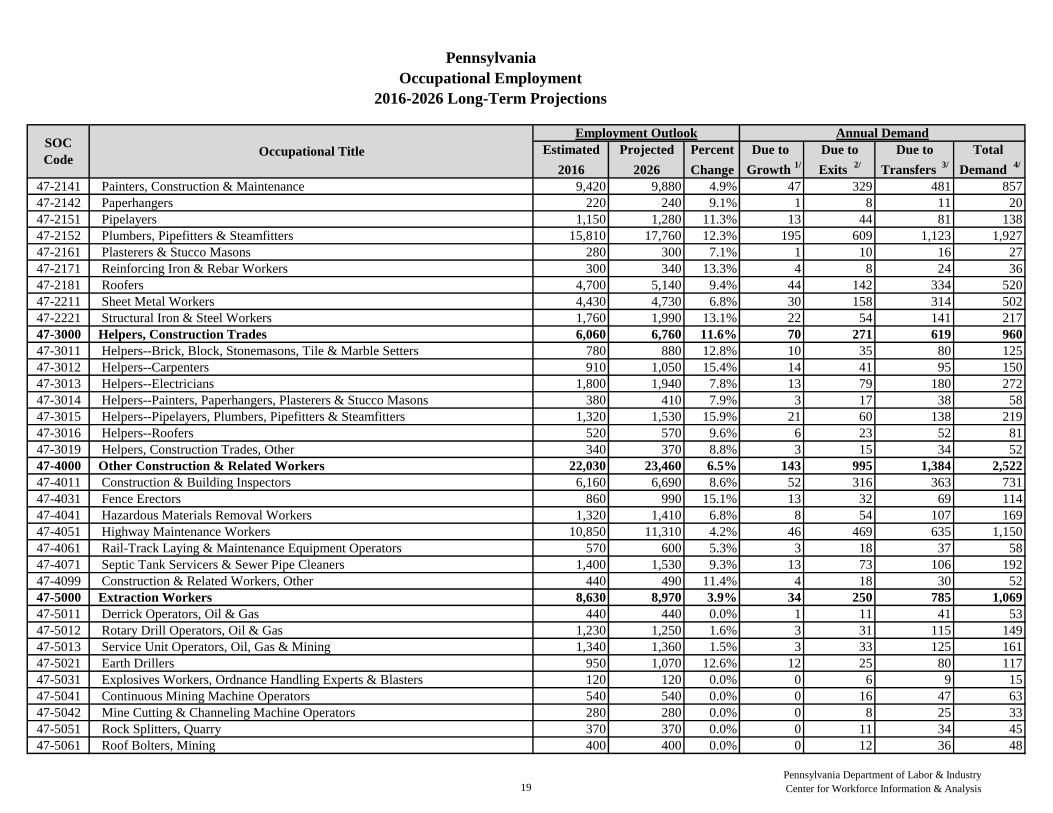
47-2141 Painters, Construction & Maintenance 9,420 9,880 4.9% 47 329 481 857
47-2142 Paperhangers 220 240 9.1% 1 8 11 20
47-2151 Pipelayers 1,150 1,280 11.3% 13 44 81 138
47-2152 Plumbers, Pipefitters & Steamfitters 15,810 17,760 12.3% 195 609 1,123 1,927
47-2161 Plasterers & Stucco Masons 280 300 7.1% 1 10 16 27
47-2171 Reinforcing Iron & Rebar Workers 300 340 13.3% 4 8 24 36
47-2181 Roofers 4,700 5,140 9.4% 44 142 334 520
47-2211 Sheet Metal Workers 4,430 4,730 6.8% 30 158 314 502
47-2221 Structural Iron & Steel Workers 1,760 1,990 13.1% 22 54 141 217
47-3000 Helpers, Construction Trades 6,060 6,760 11.6% 70 271 619 960
47-3011 Helpers--Brick, Block, Stonemasons, Tile & Marble Setters 780 880 12.8% 10 35 80 125
47-3012 Helpers--Carpenters 910 1,050 15.4% 14 41 95 150
47-3013 Helpers--Electricians 1,800 1,940 7.8% 13 79 180 272
47-3014 Helpers--Painters, Paperhangers, Plasterers & Stucco Masons 380 410 7.9% 3 17 38 58
47-3015 Helpers--Pipelayers, Plumbers, Pipefitters & Steamfitters 1,320 1,530 15.9% 21 60 138 219
47-3016 Helpers--Roofers 520 570 9.6% 6 23 52 81
47-3019 Helpers, Construction Trades, Other 340 370 8.8% 3 15 34 52
47-4000 Other Construction & Related Workers 22,030 23,460 6.5% 143 995 1,384 2,522
47-4011 Construction & Building Inspectors 6,160 6,690 8.6% 52 316 363 731
47-4031 Fence Erectors 860 990 15.1% 13 32 69 114
47-4041 Hazardous Materials Removal Workers 1,320 1,410 6.8% 8 54 107 169
47-4051 Highway Maintenance Workers 10,850 11,310 4.2% 46 469 635 1,150
47-4061 Rail-Track Laying & Maintenance Equipment Operators 570 600 5.3% 3 18 37 58
47-4071 Septic Tank Servicers & Sewer Pipe Cleaners 1,400 1,530 9.3% 13 73 106 192
47-4099 Construction & Related Workers, Other 440 490 11.4% 4 18 30 52
47-5000 Extraction Workers 8,630 8,970 3.9% 34 250 785 1,069
47-5011 Derrick Operators, Oil & Gas 440 440 0.0% 1 11 41 53
47-5012 Rotary Drill Operators, Oil & Gas 1,230 1,250 1.6% 3 31 115 149
47-5013 Service Unit Operators, Oil, Gas & Mining 1,340 1,360 1.5% 3 33 125 161
47-5021 Earth Drillers 950 1,070 12.6% 12 25 80 117
47-5031 Explosives Workers, Ordnance Handling Experts & Blasters 120 120 0.0% 0 6 9 15
47-5041 Continuous Mining Machine Operators 540 540 0.0% 0 16 47 63
47-5042 Mine Cutting & Channeling Machine Operators 280 280 0.0% 0 8 25 33
47-5051 Rock Splitters, Quarry 370 370 0.0% 0 11 34 45
47-5061 Roof Bolters, Mining 400 400 0.0% 0 12 36 48
19
Pennsylvania Department of Labor & Industry
Center for Workforce Information & Analysis
Estimated Projected Percent Due to Due to Due to Total
2016 2026 Change Growth 1/
Exits 2/
Transfers 3/
Demand 4/
Pennsylvania
Occupational Employment
2016-2026 Long-Term Projections
SOC
CodeOccupational Title
Employment Outlook Annual Demand
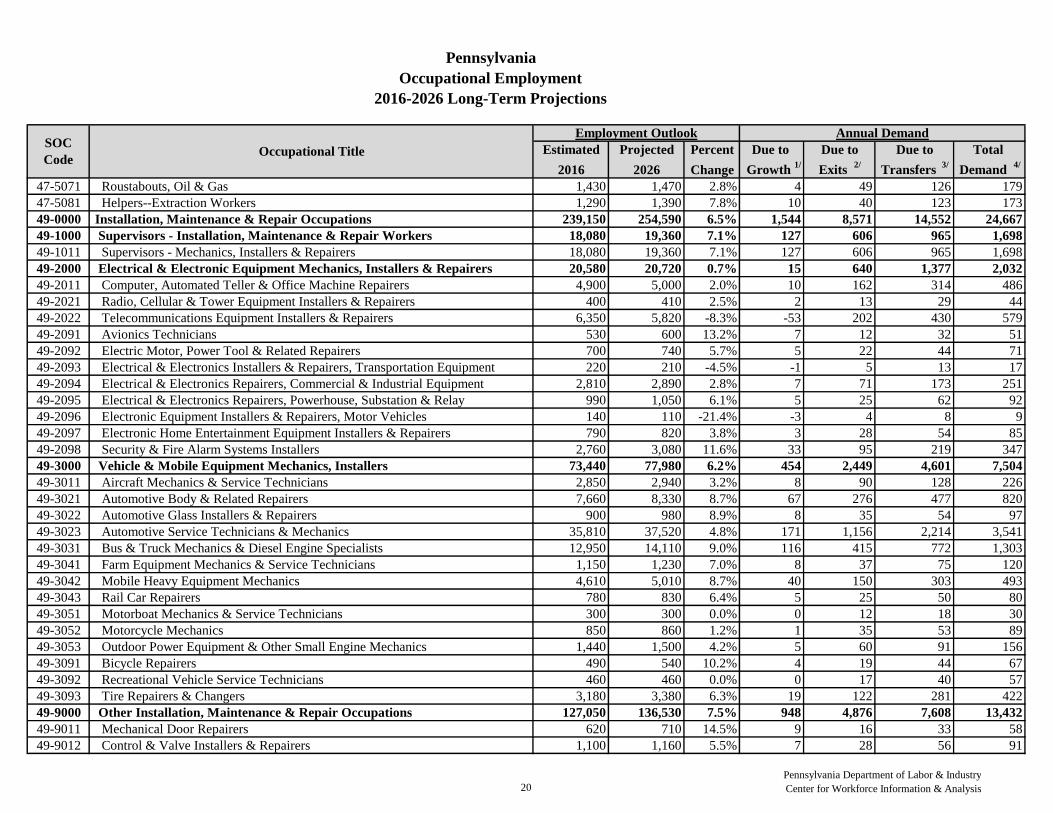
47-5071 Roustabouts, Oil & Gas 1,430 1,470 2.8% 4 49 126 179
47-5081 Helpers--Extraction Workers 1,290 1,390 7.8% 10 40 123 173
49-0000 Installation, Maintenance & Repair Occupations 239,150 254,590 6.5% 1,544 8,571 14,552 24,667
49-1000 Supervisors - Installation, Maintenance & Repair Workers 18,080 19,360 7.1% 127 606 965 1,698
49-1011 Supervisors - Mechanics, Installers & Repairers 18,080 19,360 7.1% 127 606 965 1,698
49-2000 Electrical & Electronic Equipment Mechanics, Installers & Repairers 20,580 20,720 0.7% 15 640 1,377 2,032
49-2011 Computer, Automated Teller & Office Machine Repairers 4,900 5,000 2.0% 10 162 314 486
49-2021 Radio, Cellular & Tower Equipment Installers & Repairers 400 410 2.5% 2 13 29 44
49-2022 Telecommunications Equipment Installers & Repairers 6,350 5,820 -8.3% -53 202 430 579
49-2091 Avionics Technicians 530 600 13.2% 7 12 32 51
49-2092 Electric Motor, Power Tool & Related Repairers 700 740 5.7% 5 22 44 71
49-2093 Electrical & Electronics Installers & Repairers, Transportation Equipment 220 210 -4.5% -1 5 13 17
49-2094 Electrical & Electronics Repairers, Commercial & Industrial Equipment 2,810 2,890 2.8% 7 71 173 251
49-2095 Electrical & Electronics Repairers, Powerhouse, Substation & Relay 990 1,050 6.1% 5 25 62 92
49-2096 Electronic Equipment Installers & Repairers, Motor Vehicles 140 110 -21.4% -3 4 8 9
49-2097 Electronic Home Entertainment Equipment Installers & Repairers 790 820 3.8% 3 28 54 85
49-2098 Security & Fire Alarm Systems Installers 2,760 3,080 11.6% 33 95 219 347
49-3000 Vehicle & Mobile Equipment Mechanics, Installers 73,440 77,980 6.2% 454 2,449 4,601 7,504
49-3011 Aircraft Mechanics & Service Technicians 2,850 2,940 3.2% 8 90 128 226
49-3021 Automotive Body & Related Repairers 7,660 8,330 8.7% 67 276 477 820
49-3022 Automotive Glass Installers & Repairers 900 980 8.9% 8 35 54 97
49-3023 Automotive Service Technicians & Mechanics 35,810 37,520 4.8% 171 1,156 2,214 3,541
49-3031 Bus & Truck Mechanics & Diesel Engine Specialists 12,950 14,110 9.0% 116 415 772 1,303
49-3041 Farm Equipment Mechanics & Service Technicians 1,150 1,230 7.0% 8 37 75 120
49-3042 Mobile Heavy Equipment Mechanics 4,610 5,010 8.7% 40 150 303 493
49-3043 Rail Car Repairers 780 830 6.4% 5 25 50 80
49-3051 Motorboat Mechanics & Service Technicians 300 300 0.0% 0 12 18 30
49-3052 Motorcycle Mechanics 850 860 1.2% 1 35 53 89
49-3053 Outdoor Power Equipment & Other Small Engine Mechanics 1,440 1,500 4.2% 5 60 91 156
49-3091 Bicycle Repairers 490 540 10.2% 4 19 44 67
49-3092 Recreational Vehicle Service Technicians 460 460 0.0% 0 17 40 57
49-3093 Tire Repairers & Changers 3,180 3,380 6.3% 19 122 281 422
49-9000 Other Installation, Maintenance & Repair Occupations 127,050 136,530 7.5% 948 4,876 7,608 13,432
49-9011 Mechanical Door Repairers 620 710 14.5% 9 16 33 58
49-9012 Control & Valve Installers & Repairers 1,100 1,160 5.5% 7 28 56 91
20
Pennsylvania Department of Labor & Industry
Center for Workforce Information & Analysis
Estimated Projected Percent Due to Due to Due to Total
2016 2026 Change Growth 1/
Exits 2/
Transfers 3/
Demand 4/
Pennsylvania
Occupational Employment
2016-2026 Long-Term Projections
SOC
CodeOccupational Title
Employment Outlook Annual Demand
49-9021 Heating, A/C & Refrigeration Mechanics & Installers 14,310 15,920 11.3% 162 418 1,013 1,593
49-9031 Home Appliance Repairers 1,500 1,460 -2.7% -4 72 64 132
49-9041 Industrial Machinery Mechanics 15,410 16,630 7.9% 122 541 828 1,491
49-9043 Maintenance Workers, Machinery 6,020 6,550 8.8% 53 268 363 684
49-9044 Millwrights 1,680 1,830 8.9% 15 56 99 170
49-9045 Refractory Materials Repairers 160 170 6.2% 0 6 8 14
49-9051 Electrical Power-Line Installers & Repairers 4,550 5,140 13.0% 59 122 254 435
49-9052 Telecommunications Line Installers & Repairers 6,010 6,120 1.8% 11 148 449 608
49-9061 Camera & Photographic Equipment Repairers 60 60 0.0% 0 2 3 5
49-9062 Medical Equipment Repairers 2,650 2,790 5.3% 14 104 128 246
49-9063 Musical Instrument Repairers & Tuners 670 640 -4.5% -3 25 31 53
49-9069 Precision Instrument & Equipment Repairers, Other 140 150 7.1% 0 6 7 13
49-9071 Maintenance & Repair Workers, General 60,990 65,300 7.1% 431 2,572 3,511 6,514
49-9091 Coin, Vending & Amusement Machine Servicers & Repairers 1,380 1,280 -7.2% -10 57 90 137
49-9094 Locksmiths & Safe Repairers 660 610 -7.6% -5 31 27 53
49-9096 Riggers 480 520 8.3% 4 16 34 54
49-9097 Signal & Track Switch Repairers 240 230 -4.2% 0 9 14 23
49-9098 Helpers--Installation, Maintenance & Repair Workers 4,680 5,130 9.6% 45 235 370 650
49-9099 Installation, Maintenance & Repair Workers, Other 3,420 3,710 8.5% 29 131 204 364
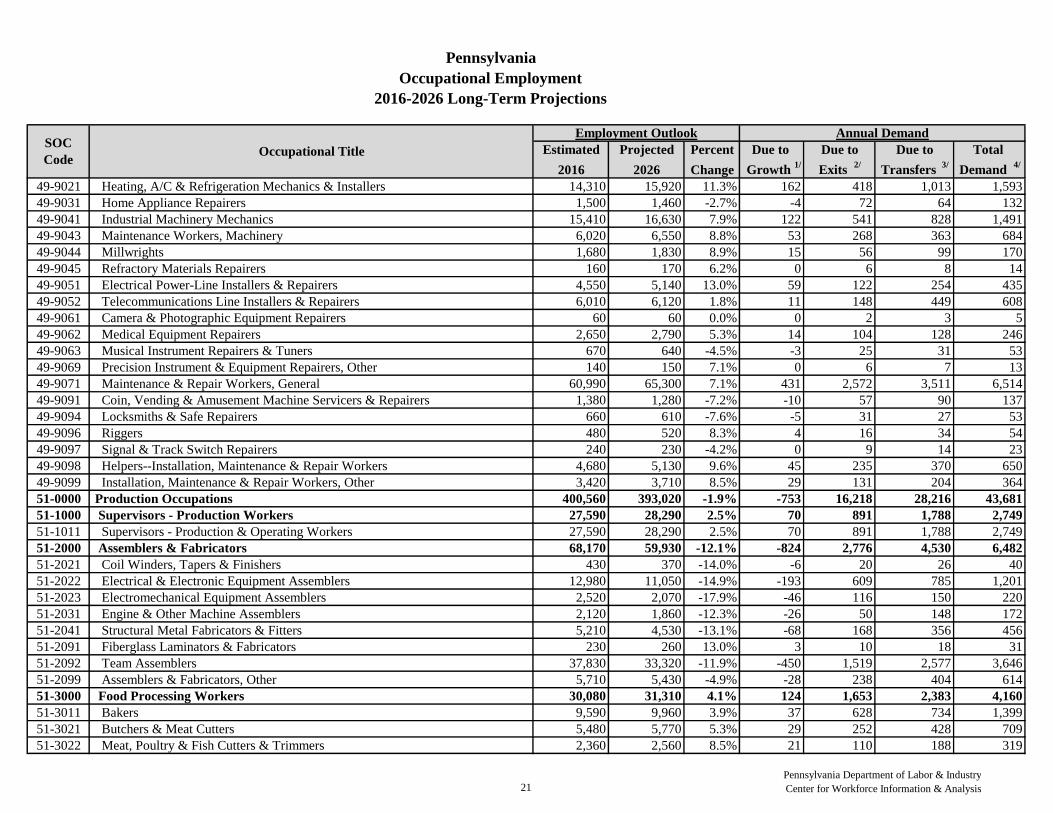
51-0000 Production Occupations 400,560 393,020 -1.9% -753 16,218 28,216 43,681
51-1000 Supervisors - Production Workers 27,590 28,290 2.5% 70 891 1,788 2,749
51-1011 Supervisors - Production & Operating Workers 27,590 28,290 2.5% 70 891 1,788 2,749
51-2000 Assemblers & Fabricators 68,170 59,930 -12.1% -824 2,776 4,530 6,482
51-2021 Coil Winders, Tapers & Finishers 430 370 -14.0% -6 20 26 40
51-2022 Electrical & Electronic Equipment Assemblers 12,980 11,050 -14.9% -193 609 785 1,201
51-2023 Electromechanical Equipment Assemblers 2,520 2,070 -17.9% -46 116 150 220
51-2031 Engine & Other Machine Assemblers 2,120 1,860 -12.3% -26 50 148 172
51-2041 Structural Metal Fabricators & Fitters 5,210 4,530 -13.1% -68 168 356 456
51-2091 Fiberglass Laminators & Fabricators 230 260 13.0% 3 10 18 31
51-2092 Team Assemblers 37,830 33,320 -11.9% -450 1,519 2,577 3,646
51-2099 Assemblers & Fabricators, Other 5,710 5,430 -4.9% -28 238 404 614
51-3000 Food Processing Workers 30,080 31,310 4.1% 124 1,653 2,383 4,160
51-3011 Bakers 9,590 9,960 3.9% 37 628 734 1,399
51-3021 Butchers & Meat Cutters 5,480 5,770 5.3% 29 252 428 709
51-3022 Meat, Poultry & Fish Cutters & Trimmers 2,360 2,560 8.5% 21 110 188 319
21
Pennsylvania Department of Labor & Industry
Center for Workforce Information & Analysis
Estimated Projected Percent Due to Due to Due to Total
2016 2026 Change Growth 1/
Exits 2/
Transfers 3/
Demand 4/
Pennsylvania
Occupational Employment
2016-2026 Long-Term Projections
SOC
CodeOccupational Title
Employment Outlook Annual Demand
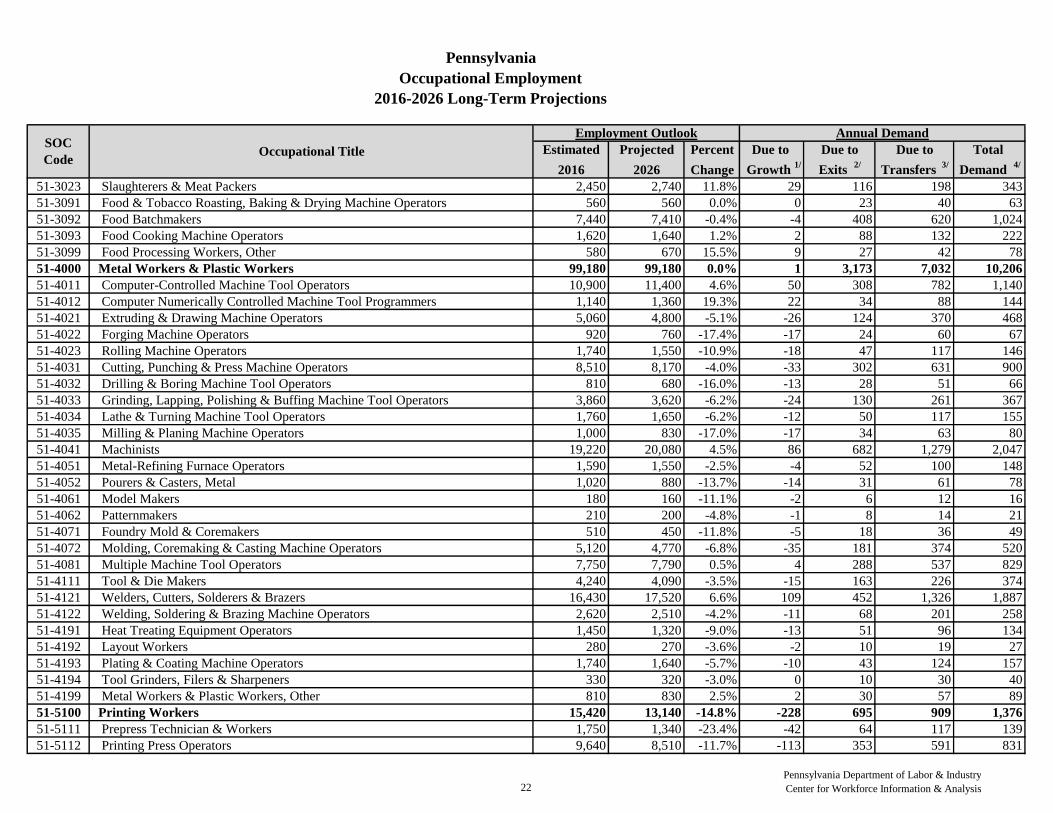
51-3023 Slaughterers & Meat Packers 2,450 2,740 11.8% 29 116 198 343
51-3091 Food & Tobacco Roasting, Baking & Drying Machine Operators 560 560 0.0% 0 23 40 63
51-3092 Food Batchmakers 7,440 7,410 -0.4% -4 408 620 1,024
51-3093 Food Cooking Machine Operators 1,620 1,640 1.2% 2 88 132 222
51-3099 Food Processing Workers, Other 580 670 15.5% 9 27 42 78
51-4000 Metal Workers & Plastic Workers 99,180 99,180 0.0% 1 3,173 7,032 10,206
51-4011 Computer-Controlled Machine Tool Operators 10,900 11,400 4.6% 50 308 782 1,140
51-4012 Computer Numerically Controlled Machine Tool Programmers 1,140 1,360 19.3% 22 34 88 144
51-4021 Extruding & Drawing Machine Operators 5,060 4,800 -5.1% -26 124 370 468
51-4022 Forging Machine Operators 920 760 -17.4% -17 24 60 67
51-4023 Rolling Machine Operators 1,740 1,550 -10.9% -18 47 117 146
51-4031 Cutting, Punching & Press Machine Operators 8,510 8,170 -4.0% -33 302 631 900
51-4032 Drilling & Boring Machine Tool Operators 810 680 -16.0% -13 28 51 66
51-4033 Grinding, Lapping, Polishing & Buffing Machine Tool Operators 3,860 3,620 -6.2% -24 130 261 367
51-4034 Lathe & Turning Machine Tool Operators 1,760 1,650 -6.2% -12 50 117 155
51-4035 Milling & Planing Machine Operators 1,000 830 -17.0% -17 34 63 80
51-4041 Machinists 19,220 20,080 4.5% 86 682 1,279 2,047
51-4051 Metal-Refining Furnace Operators 1,590 1,550 -2.5% -4 52 100 148
51-4052 Pourers & Casters, Metal 1,020 880 -13.7% -14 31 61 78
51-4061 Model Makers 180 160 -11.1% -2 6 12 16
51-4062 Patternmakers 210 200 -4.8% -1 8 14 21
51-4071 Foundry Mold & Coremakers 510 450 -11.8% -5 18 36 49
51-4072 Molding, Coremaking & Casting Machine Operators 5,120 4,770 -6.8% -35 181 374 520
51-4081 Multiple Machine Tool Operators 7,750 7,790 0.5% 4 288 537 829
51-4111 Tool & Die Makers 4,240 4,090 -3.5% -15 163 226 374
51-4121 Welders, Cutters, Solderers & Brazers 16,430 17,520 6.6% 109 452 1,326 1,887
51-4122 Welding, Soldering & Brazing Machine Operators 2,620 2,510 -4.2% -11 68 201 258
51-4191 Heat Treating Equipment Operators 1,450 1,320 -9.0% -13 51 96 134
51-4192 Layout Workers 280 270 -3.6% -2 10 19 27
51-4193 Plating & Coating Machine Operators 1,740 1,640 -5.7% -10 43 124 157
51-4194 Tool Grinders, Filers & Sharpeners 330 320 -3.0% 0 10 30 40
51-4199 Metal Workers & Plastic Workers, Other 810 830 2.5% 2 30 57 89
51-5100 Printing Workers 15,420 13,140 -14.8% -228 695 909 1,376
51-5111 Prepress Technician & Workers 1,750 1,340 -23.4% -42 64 117 139
51-5112 Printing Press Operators 9,640 8,510 -11.7% -113 353 591 831
22
Pennsylvania Department of Labor & Industry
Center for Workforce Information & Analysis
Estimated Projected Percent Due to Due to Due to Total
2016 2026 Change Growth 1/
Exits 2/
Transfers 3/
Demand 4/
Pennsylvania
Occupational Employment
2016-2026 Long-Term Projections
SOC
CodeOccupational Title
Employment Outlook Annual Demand
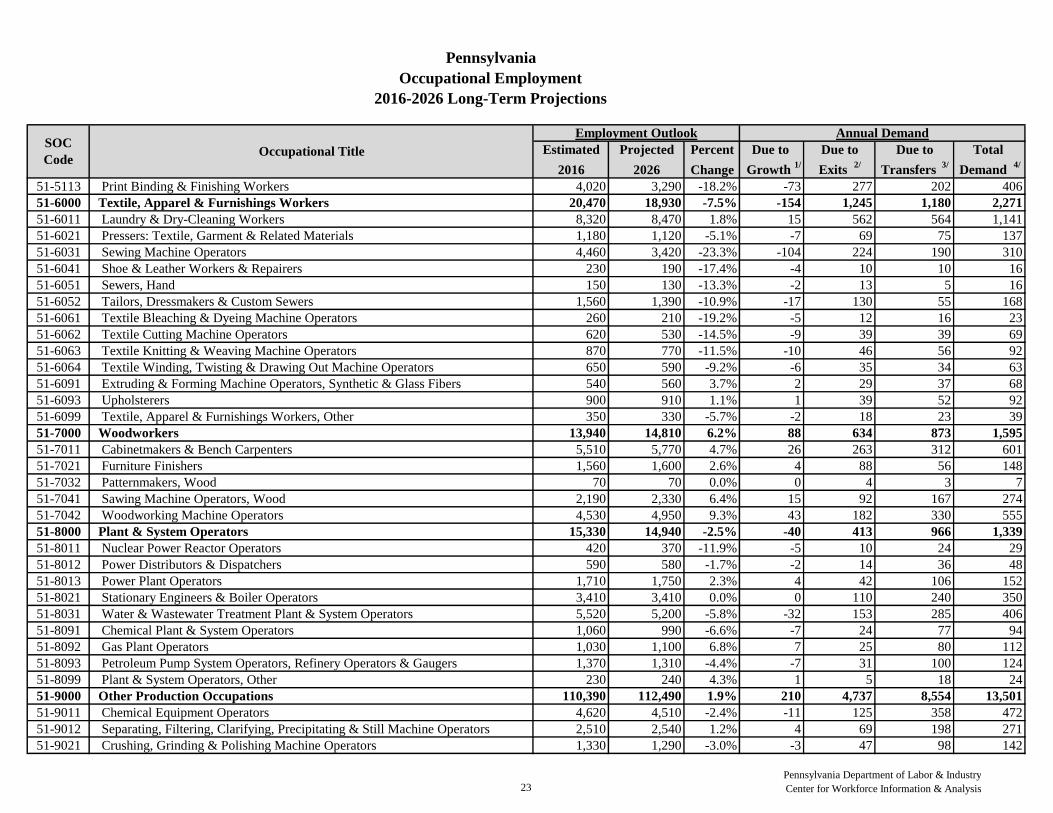
51-5113 Print Binding & Finishing Workers 4,020 3,290 -18.2% -73 277 202 406
51-6000 Textile, Apparel & Furnishings Workers 20,470 18,930 -7.5% -154 1,245 1,180 2,271
51-6011 Laundry & Dry-Cleaning Workers 8,320 8,470 1.8% 15 562 564 1,141
51-6021 Pressers: Textile, Garment & Related Materials 1,180 1,120 -5.1% -7 69 75 137
51-6031 Sewing Machine Operators 4,460 3,420 -23.3% -104 224 190 310
51-6041 Shoe & Leather Workers & Repairers 230 190 -17.4% -4 10 10 16
51-6051 Sewers, Hand 150 130 -13.3% -2 13 5 16
51-6052 Tailors, Dressmakers & Custom Sewers 1,560 1,390 -10.9% -17 130 55 168
51-6061 Textile Bleaching & Dyeing Machine Operators 260 210 -19.2% -5 12 16 23
51-6062 Textile Cutting Machine Operators 620 530 -14.5% -9 39 39 69
51-6063 Textile Knitting & Weaving Machine Operators 870 770 -11.5% -10 46 56 92
51-6064 Textile Winding, Twisting & Drawing Out Machine Operators 650 590 -9.2% -6 35 34 63
51-6091 Extruding & Forming Machine Operators, Synthetic & Glass Fibers 540 560 3.7% 2 29 37 68
51-6093 Upholsterers 900 910 1.1% 1 39 52 92
51-6099 Textile, Apparel & Furnishings Workers, Other 350 330 -5.7% -2 18 23 39
51-7000 Woodworkers 13,940 14,810 6.2% 88 634 873 1,595
51-7011 Cabinetmakers & Bench Carpenters 5,510 5,770 4.7% 26 263 312 601
51-7021 Furniture Finishers 1,560 1,600 2.6% 4 88 56 148
51-7032 Patternmakers, Wood 70 70 0.0% 0 4 3 7
51-7041 Sawing Machine Operators, Wood 2,190 2,330 6.4% 15 92 167 274
51-7042 Woodworking Machine Operators 4,530 4,950 9.3% 43 182 330 555
51-8000 Plant & System Operators 15,330 14,940 -2.5% -40 413 966 1,339
51-8011 Nuclear Power Reactor Operators 420 370 -11.9% -5 10 24 29
51-8012 Power Distributors & Dispatchers 590 580 -1.7% -2 14 36 48
51-8013 Power Plant Operators 1,710 1,750 2.3% 4 42 106 152
51-8021 Stationary Engineers & Boiler Operators 3,410 3,410 0.0% 0 110 240 350
51-8031 Water & Wastewater Treatment Plant & System Operators 5,520 5,200 -5.8% -32 153 285 406
51-8091 Chemical Plant & System Operators 1,060 990 -6.6% -7 24 77 94
51-8092 Gas Plant Operators 1,030 1,100 6.8% 7 25 80 112
51-8093 Petroleum Pump System Operators, Refinery Operators & Gaugers 1,370 1,310 -4.4% -7 31 100 124
51-8099 Plant & System Operators, Other 230 240 4.3% 1 5 18 24
51-9000 Other Production Occupations 110,390 112,490 1.9% 210 4,737 8,554 13,501
51-9011 Chemical Equipment Operators 4,620 4,510 -2.4% -11 125 358 472
51-9012 Separating, Filtering, Clarifying, Precipitating & Still Machine Operators 2,510 2,540 1.2% 4 69 198 271
51-9021 Crushing, Grinding & Polishing Machine Operators 1,330 1,290 -3.0% -3 47 98 142
23
Pennsylvania Department of Labor & Industry
Center for Workforce Information & Analysis
Estimated Projected Percent Due to Due to Due to Total
2016 2026 Change Growth 1/
Exits 2/
Transfers 3/
Demand 4/
Pennsylvania
Occupational Employment
2016-2026 Long-Term Projections
SOC
CodeOccupational Title
Employment Outlook Annual Demand
51-9022 Grinding & Polishing Workers, Hand 950 810 -14.7% -14 32 66 84
51-9023 Mixing & Blending Machine Operators 6,080 6,090 0.2% 1 219 456 676
51-9031 Cutters & Trimmers, Hand 180 150 -16.7% -3 6 12 15
51-9032 Cutting & Slicing Machine Operators 2,380 2,370 -0.4% -1 86 181 266
51-9041 Extruding, Forming, Pressing & Compacting Machine Operators 2,600 2,670 2.7% 6 102 212 320
51-9051 Furnace, Kiln, Oven, Drier & Kettle Operators 610 610 0.0% 1 26 34 61
51-9061 Inspectors, Testers, Sorters, Samplers & Weighers 20,450 19,260 -5.8% -119 825 1,520 2,226
51-9071 Jewelers & Precious Stone & Metal Workers 980 870 -11.2% -10 55 41 86
51-9081 Dental Laboratory Technicians 1,330 1,340 0.8% 1 58 89 148
51-9082 Medical Appliance Technicians 1,190 1,220 2.5% 3 52 80 135
51-9083 Ophthalmic Laboratory Technicians 1,140 1,200 5.3% 6 50 78 134
51-9111 Packaging & Filling Machine Operators 19,000 19,580 3.1% 58 912 1,281 2,251
51-9121 Coating, Painting & Spraying Machine Operators 3,860 4,180 8.3% 32 115 301 448
51-9122 Painters, Transportation Equipment 2,320 2,570 10.8% 25 70 183 278
51-9123 Painting, Coating & Decorating Workers 580 610 5.2% 3 17 44 64
51-9141 Semiconductor Processors 490 500 2.0% 1 19 36 56
51-9151 Photographic Process Workers & Processing Machine Operators 1,280 960 -25.0% -32 58 116 142
51-9191 Adhesive Bonding Machine Operators 760 760 0.0% -1 35 46 80
51-9192 Cleaning, Washing & Metal Pickling Equipment Operators 810 820 1.2% 1 38 67 106
51-9193 Cooling & Freezing Equipment Operators 550 540 -1.8% 0 22 40 62
51-9194 Etchers & Engravers 300 310 3.3% 1 18 18 37
51-9195 Molders, Shapers & Casters, Except Metal & Plastic 2,240 2,330 4.0% 9 88 141 238
51-9196 Paper Goods Machine Operators 6,770 6,490 -4.1% -28 239 432 643
51-9197 Tire Builders 460 480 4.3% 2 15 38 55
51-9198 Helpers--Production Workers 20,880 23,280 11.5% 240 1,184 2,103 3,527
51-9199 Production Workers, Other 3,740 4,130 10.4% 38 155 288 481
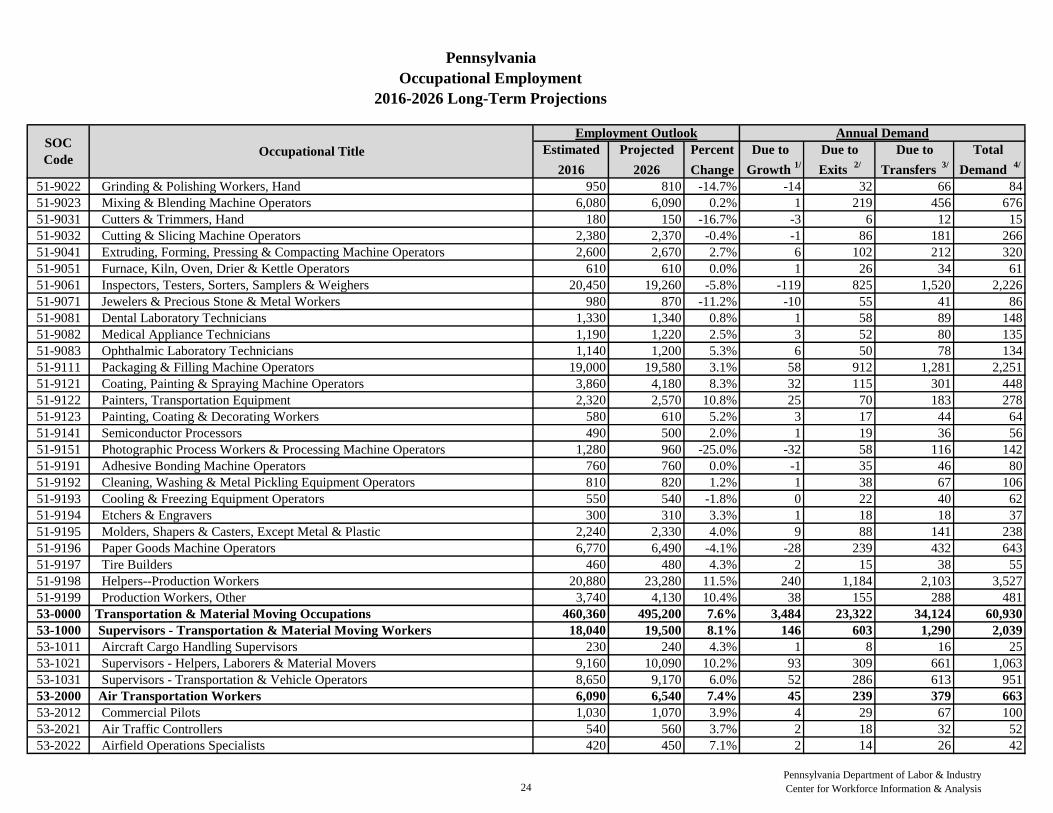
53-0000 Transportation & Material Moving Occupations 460,360 495,200 7.6% 3,484 23,322 34,124 60,930
53-1000 Supervisors - Transportation & Material Moving Workers 18,040 19,500 8.1% 146 603 1,290 2,039
53-1011 Aircraft Cargo Handling Supervisors 230 240 4.3% 1 8 16 25
53-1021 Supervisors - Helpers, Laborers & Material Movers 9,160 10,090 10.2% 93 309 661 1,063
53-1031 Supervisors - Transportation & Vehicle Operators 8,650 9,170 6.0% 52 286 613 951
53-2000 Air Transportation Workers 6,090 6,540 7.4% 45 239 379 663
53-2012 Commercial Pilots 1,030 1,070 3.9% 4 29 67 100
53-2021 Air Traffic Controllers 540 560 3.7% 2 18 32 52
53-2022 Airfield Operations Specialists 420 450 7.1% 2 14 26 42
24
Pennsylvania Department of Labor & Industry
Center for Workforce Information & Analysis
Estimated Projected Percent Due to Due to Due to Total
2016 2026 Change Growth 1/
Exits 2/
Transfers 3/
Demand 4/
Pennsylvania
Occupational Employment
2016-2026 Long-Term Projections
SOC
CodeOccupational Title
Employment Outlook Annual Demand
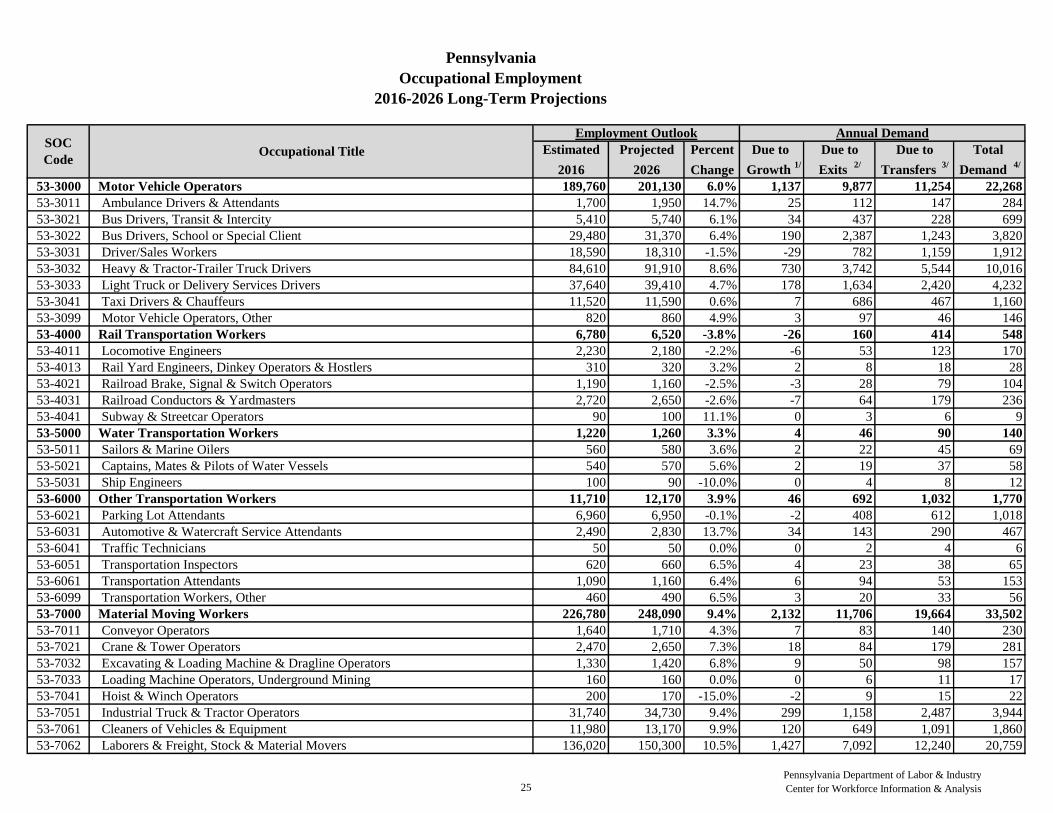
53-3000 Motor Vehicle Operators 189,760 201,130 6.0% 1,137 9,877 11,254 22,268
53-3011 Ambulance Drivers & Attendants 1,700 1,950 14.7% 25 112 147 284
53-3021 Bus Drivers, Transit & Intercity 5,410 5,740 6.1% 34 437 228 699
53-3022 Bus Drivers, School or Special Client 29,480 31,370 6.4% 190 2,387 1,243 3,820
53-3031 Driver/Sales Workers 18,590 18,310 -1.5% -29 782 1,159 1,912
53-3032 Heavy & Tractor-Trailer Truck Drivers 84,610 91,910 8.6% 730 3,742 5,544 10,016
53-3033 Light Truck or Delivery Services Drivers 37,640 39,410 4.7% 178 1,634 2,420 4,232
53-3041 Taxi Drivers & Chauffeurs 11,520 11,590 0.6% 7 686 467 1,160
53-3099 Motor Vehicle Operators, Other 820 860 4.9% 3 97 46 146
53-4000 Rail Transportation Workers 6,780 6,520 -3.8% -26 160 414 548
53-4011 Locomotive Engineers 2,230 2,180 -2.2% -6 53 123 170
53-4013 Rail Yard Engineers, Dinkey Operators & Hostlers 310 320 3.2% 2 8 18 28
53-4021 Railroad Brake, Signal & Switch Operators 1,190 1,160 -2.5% -3 28 79 104
53-4031 Railroad Conductors & Yardmasters 2,720 2,650 -2.6% -7 64 179 236
53-4041 Subway & Streetcar Operators 90 100 11.1% 0 3 6 9
53-5000 Water Transportation Workers 1,220 1,260 3.3% 4 46 90 140
53-5011 Sailors & Marine Oilers 560 580 3.6% 2 22 45 69
53-5021 Captains, Mates & Pilots of Water Vessels 540 570 5.6% 2 19 37 58
53-5031 Ship Engineers 100 90 -10.0% 0 4 8 12
53-6000 Other Transportation Workers 11,710 12,170 3.9% 46 692 1,032 1,770
53-6021 Parking Lot Attendants 6,960 6,950 -0.1% -2 408 612 1,018
53-6031 Automotive & Watercraft Service Attendants 2,490 2,830 13.7% 34 143 290 467
53-6041 Traffic Technicians 50 50 0.0% 0 2 4 6
53-6051 Transportation Inspectors 620 660 6.5% 4 23 38 65
53-6061 Transportation Attendants 1,090 1,160 6.4% 6 94 53 153
53-6099 Transportation Workers, Other 460 490 6.5% 3 20 33 56
53-7000 Material Moving Workers 226,780 248,090 9.4% 2,132 11,706 19,664 33,502
53-7011 Conveyor Operators 1,640 1,710 4.3% 7 83 140 230
53-7021 Crane & Tower Operators 2,470 2,650 7.3% 18 84 179 281
53-7032 Excavating & Loading Machine & Dragline Operators 1,330 1,420 6.8% 9 50 98 157
53-7033 Loading Machine Operators, Underground Mining 160 160 0.0% 0 6 11 17
53-7041 Hoist & Winch Operators 200 170 -15.0% -2 9 15 22
53-7051 Industrial Truck & Tractor Operators 31,740 34,730 9.4% 299 1,158 2,487 3,944
53-7061 Cleaners of Vehicles & Equipment 11,980 13,170 9.9% 120 649 1,091 1,860
53-7062 Laborers & Freight, Stock & Material Movers 136,020 150,300 10.5% 1,427 7,092 12,240 20,759
25
Pennsylvania Department of Labor & Industry
Center for Workforce Information & Analysis
Estimated Projected Percent Due to Due to Due to Total
2016 2026 Change Growth 1/
Exits 2/
Transfers 3/
Demand 4/
Pennsylvania
Occupational Employment
2016-2026 Long-Term Projections
SOC
CodeOccupational Title
Employment Outlook Annual Demand
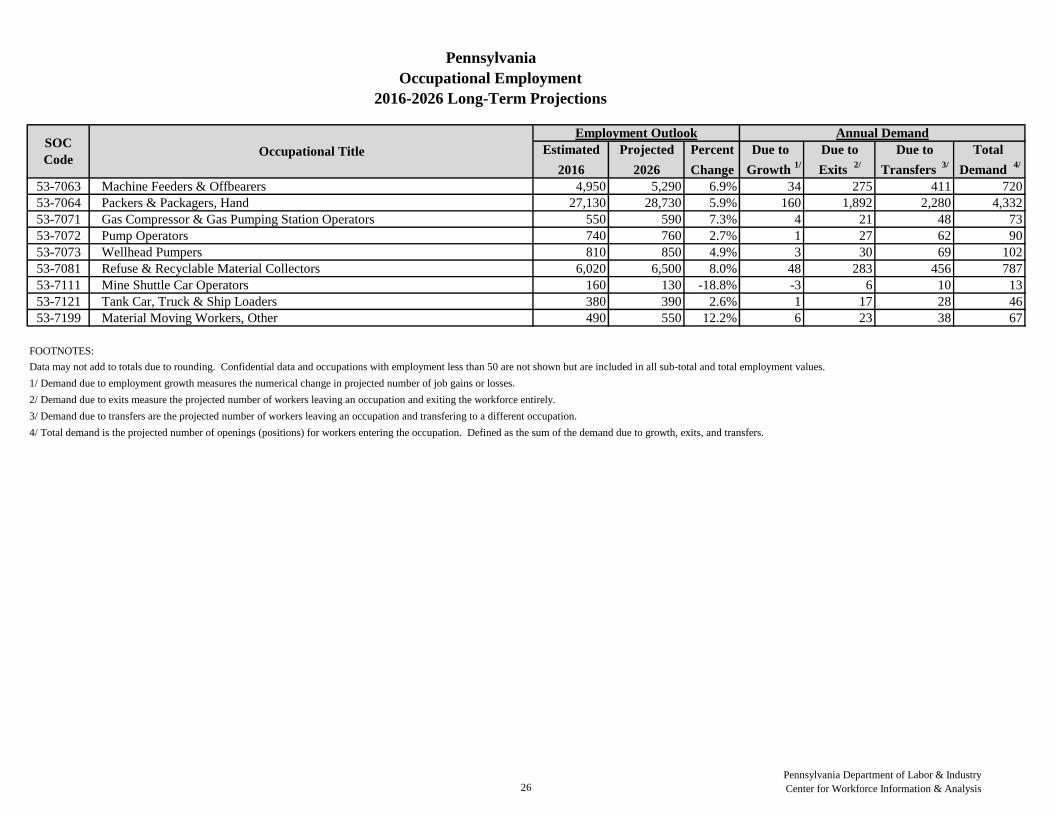
53-7063 Machine Feeders & Offbearers 4,950 5,290 6.9% 34 275 411 720
53-7064 Packers & Packagers, Hand 27,130 28,730 5.9% 160 1,892 2,280 4,332
53-7071 Gas Compressor & Gas Pumping Station Operators 550 590 7.3% 4 21 48 73
53-7072 Pump Operators 740 760 2.7% 1 27 62 90
53-7073 Wellhead Pumpers 810 850 4.9% 3 30 69 102
53-7081 Refuse & Recyclable Material Collectors 6,020 6,500 8.0% 48 283 456 787
53-7111 Mine Shuttle Car Operators 160 130 -18.8% -3 6 10 13
53-7121 Tank Car, Truck & Ship Loaders 380 390 2.6% 1 17 28 46
53-7199 Material Moving Workers, Other 490 550 12.2% 6 23 38 67
FOOTNOTES:
Data may not add to totals due to rounding. Confidential data and occupations with employment less than 50 are not shown but are included in all sub-total and total employment values.
1/ Demand due to employment growth measures the numerical change in projected number of job gains or losses.
2/ Demand due to exits measure the projected number of workers leaving an occupation and exiting the workforce entirely.
3/ Demand due to transfers are the projected number of workers leaving an occupation and transfering to a different occupation.
4/ Total demand is the projected number of openings (positions) for workers entering the occupation. Defined as the sum of the demand due to growth, exits, and transfers.
26
Pennsylvania Department of Labor & Industry
Center for Workforce Information & Analysis
![[XLS] · Web view271306 7055119038 7055114012 27.182500000000001 82.273799999999994 271822274 2620162 9 51 6 7221 9039 271307 7055119039 7055114039 27.093299999999999 82.380399999999995](https://img.pdfslide.us/doc/110x75/5aaf67987f8b9a6b308d444c/xls-view271306-7055119038-7055114012-27182500000000001-82273799999999994-271822274.jpg)


![PROCEEDINGS OF SPIE · 9039 0N PearlTrees web-based interface for teaching informatics in the radiology residency [9039-22] M. Y. Licurse, T. S. Cook, Hospital of the Univ. of Pennsylvania](https://img.pdfslide.us/doc/110x75/5feebcd9e4bb1e061174045b/proceedings-of-spie-9039-0n-pearltrees-web-based-interface-for-teaching-informatics.jpg)