Embed Size (px)
Citation preview
396 Journal of Chemical Education • Vol. 85 No. 3 March 2008 • www.JCE.DivCHED.org • © Division of Chemical Education
In the Laboratory
We describe two introductory laboratory activities for a general education course for preservice elementary teachers. Such courses often enroll students who feel alienated from science, so introducing them to new ways of thinking about science is important, for their own learning and in relation to their future teaching (1–2). To address this, we and oth-ers created a curriculum focused on the needs and interests of elementary education majors (3). Part of this involved lab materials to develop an understanding of inquiry science. To do this, we have used the science writing heuristic (SWH), since it integrates guided-inquiry methods with writing-to-learn strate-gies (4–11). Greenbowe and others have shown that the use of the SWH in college courses can deepen understanding (8) and consequently lead to improved performance on lecture quizzes and examinations (5).
Laboratory environments that utilize the SWH approach have students write before, during, and after the lab using a template, which we have adapted to include the following five elements:
1. Beginning ideas 2. Tests 3. Evidence 4. Reflection (done in discussion mode with the instruc-
tor) 5. Conclusions and meaning-making (done after the lab
period)
This method is unfamiliar to many students, so its effective use requires careful introduction. In this paper we describe the process and experience of incorporating the SWH in two labs that help students learn the heuristic and develop comfort with inquiry learning.
An Inquiry into the History of Pennies
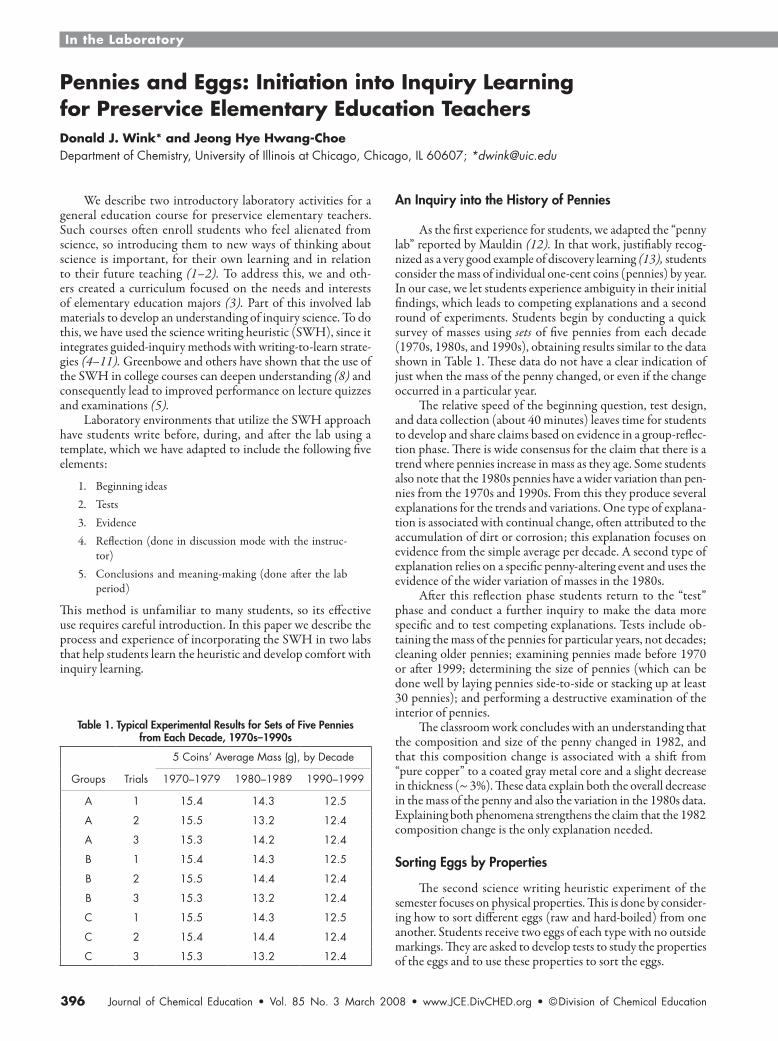
As the first experience for students, we adapted the “penny lab” reported by Mauldin (12). In that work, justifiably recog-nized as a very good example of discovery learning (13), students consider the mass of individual one-cent coins (pennies) by year. In our case, we let students experience ambiguity in their initial findings, which leads to competing explanations and a second round of experiments. Students begin by conducting a quick survey of masses using sets of five pennies from each decade (1970s, 1980s, and 1990s), obtaining results similar to the data shown in Table 1. These data do not have a clear indication of just when the mass of the penny changed, or even if the change occurred in a particular year.
The relative speed of the beginning question, test design, and data collection (about 40 minutes) leaves time for students to develop and share claims based on evidence in a group-reflec-tion phase. There is wide consensus for the claim that there is a trend where pennies increase in mass as they age. Some students also note that the 1980s pennies have a wider variation than pen-nies from the 1970s and 1990s. From this they produce several explanations for the trends and variations. One type of explana-tion is associated with continual change, often attributed to the accumulation of dirt or corrosion; this explanation focuses on evidence from the simple average per decade. A second type of explanation relies on a specific penny-altering event and uses the evidence of the wider variation of masses in the 1980s.
After this reflection phase students return to the “test” phase and conduct a further inquiry to make the data more specific and to test competing explanations. Tests include ob-taining the mass of the pennies for particular years, not decades; cleaning older pennies; examining pennies made before 1970 or after 1999; determining the size of pennies (which can be done well by laying pennies side-to-side or stacking up at least 30 pennies); and performing a destructive examination of the interior of pennies.
The classroom work concludes with an understanding that the composition and size of the penny changed in 1982, and that this composition change is associated with a shift from “pure copper” to a coated gray metal core and a slight decrease in thickness (~ 3%). These data explain both the overall decrease in the mass of the penny and also the variation in the 1980s data. Explaining both phenomena strengthens the claim that the 1982 composition change is the only explanation needed.
Sorting Eggs by Properties
The second science writing heuristic experiment of the semester focuses on physical properties. This is done by consider-ing how to sort different eggs (raw and hard-boiled) from one another. Students receive two eggs of each type with no outside markings. They are asked to develop tests to study the properties of the eggs and to use these properties to sort the eggs.
Pennies and Eggs: Initiation into Inquiry Learning for Preservice Elementary Education TeachersDonald J. Wink* and Jeong Hye Hwang-ChoeDepartment of Chemistry, University of Illinois at Chicago, Chicago, IL 60607; *[email protected]
Table 1. Typical Experimental Results for Sets of Five Pennies from Each Decade, 1970s–1990s
5 Coins’ Average Mass (g), by Decade
Groups Trials 1970–1979 1980–1989 1990–1999
A 1 15.4 14.3 12.5
A 2 15.5 13.2 12.4
A 3 15.3 14.2 12.4
B 1 15.4 14.3 12.5
B 2 15.5 14.4 12.4
B 3 15.3 13.2 12.4
C 1 15.5 14.3 12.5
C 2 15.4 14.4 12.4
C 3 15.3 13.2 12.4
© Division of Chemical Education • www.JCE.DivCHED.org • Vol. 85 No. 3 March 2008 • Journal of Chemical Education 397
In the Laboratory
Student tests initially emphasize observable properties of the eggs, including overall mass, volume, color, and the effects of motion (including spinning). Students note that some quantita-tive measurements, such as total mass, are easy to do precisely (centigram balances are available for this), while other measure-ments, such as egg volume, are much less precise. In this case initial claims may be inconsistent, since egg mass itself does not correlate with other properties, such as color or ease of spinning.1 An important property they consider is flotation in solutions of different density: for about one month after purchase uncooked eggs sink in pure water but float in salt water, depending on the amount of salt and the type of egg. Observing the flotation of eggs prompts them to consider the relationship of mass, volume, and density qualitatively. They also note that hard-boiled eggs are consistently denser than uncooked eggs.2
The class discussion at this point turns to the problem of getting numerical data that do allow consistent sorting of eggs. They know that volume is hard to measure in this case and that mass is an unreliable indicator. So they turn to the problem of measuring the density of the eggs, which in turn requires a sec-ond round of tests that lets them “observe” density by measuring the density of the surrounding solution. Typically, eggs increase in density by about 7% in being hard-boiled. For example, a class of students working with somewhat aged eggs (2–3 weeks after purchase) found raw eggs that had densities that averaged 1.01 ± 0.03 g cm‒3, while eggs from the same batch that were hard-boiled had densities that averaged 1.08 ± 0.04 g cm‒3.
Hazards
Neither of these labs poses any significant hazards.
Result and Discussion
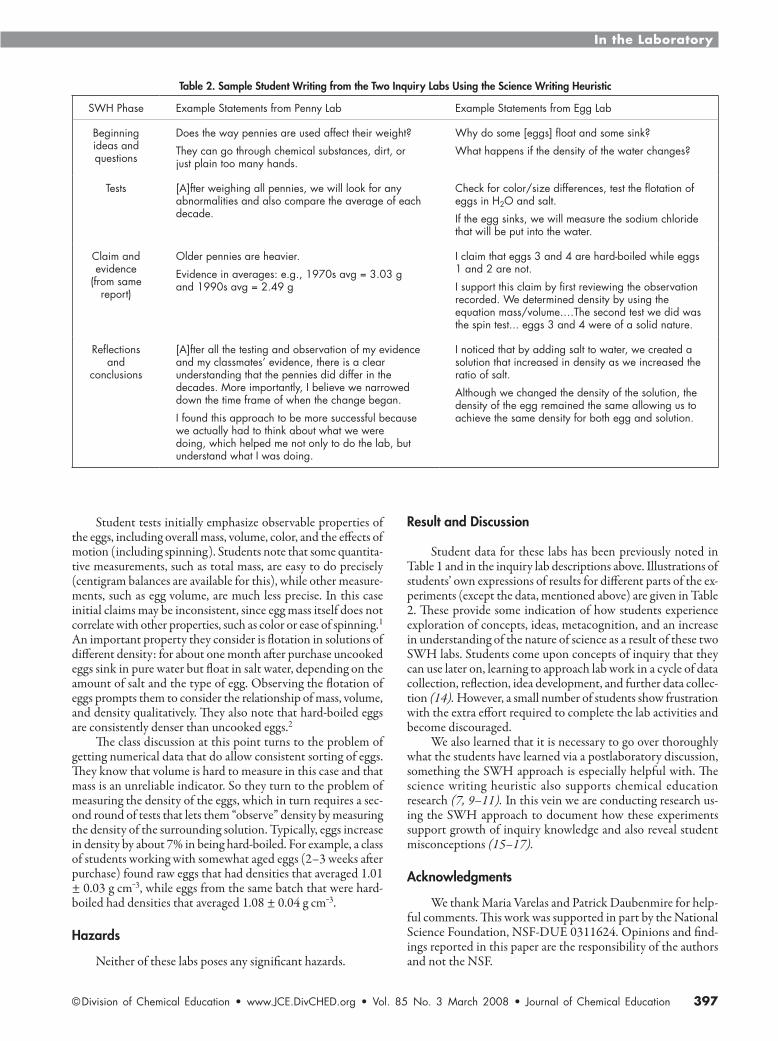
Student data for these labs has been previously noted in Table 1 and in the inquiry lab descriptions above. Illustrations of students’ own expressions of results for different parts of the ex-periments (except the data, mentioned above) are given in Table 2. These provide some indication of how students experience exploration of concepts, ideas, metacognition, and an increase in understanding of the nature of science as a result of these two SWH labs. Students come upon concepts of inquiry that they can use later on, learning to approach lab work in a cycle of data collection, reflection, idea development, and further data collec-tion (14). However, a small number of students show frustration with the extra effort required to complete the lab activities and become discouraged.
We also learned that it is necessary to go over thoroughly what the students have learned via a postlaboratory discussion, something the SWH approach is especially helpful with. The science writing heuristic also supports chemical education research (7, 9–11). In this vein we are conducting research us-ing the SWH approach to document how these experiments support growth of inquiry knowledge and also reveal student misconceptions (15–17).
Acknowledgments
We thank Maria Varelas and Patrick Daubenmire for help-ful comments. This work was supported in part by the National Science Foundation, NSF-DUE 0311624. Opinions and find-ings reported in this paper are the responsibility of the authors and not the NSF.
Table 2. Sample Student Writing from the Two Inquiry Labs Using the Science Writing Heuristic
SWH Phase Example Statements from Penny Lab Example Statements from Egg Lab
Beginning ideas and questions
Does the way pennies are used affect their weight?
They can go through chemical substances, dirt, or just plain too many hands.
Why do some [eggs] float and some sink?
What happens if the density of the water changes?
Tests [A]fter weighing all pennies, we will look for any abnormalities and also compare the average of each decade.
Check for color/size differences, test the flotation of eggs in H2O and salt.
If the egg sinks, we will measure the sodium chloride that will be put into the water.
Claim and evidence
(from same report)
Older pennies are heavier.
Evidence in averages: e.g., 1970s avg = 3.03 g and 1990s avg = 2.49 g
I claim that eggs 3 and 4 are hard-boiled while eggs 1 and 2 are not.
I support this claim by first reviewing the observation recorded. We determined density by using the equation mass/volume.…The second test we did was the spin test... eggs 3 and 4 were of a solid nature.
Reflections and
conclusions
[A]fter all the testing and observation of my evidence and my classmates’ evidence, there is a clear understanding that the pennies did differ in the decades. More importantly, I believe we narrowed down the time frame of when the change began.
I found this approach to be more successful because we actually had to think about what we were doing, which helped me not only to do the lab, but understand what I was doing.
I noticed that by adding salt to water, we created a solution that increased in density as we increased the ratio of salt.
Although we changed the density of the solution, the density of the egg remained the same allowing us to achieve the same density for both egg and solution.
398 Journal of Chemical Education • Vol. 85 No. 3 March 2008 • www.JCE.DivCHED.org • © Division of Chemical Education
In the Laboratory
Notes
1. Large eggs have a range in mass of 57–64 g; uncooked eggs at the upper edge of this range weigh more than cooked (hard-boiled) eggs at the lower edge of the range (14). 2. A hard-boiled egg is denser than an uncooked egg of the same freshness for about one day after cooking. Hard-boiled eggs then becomes less dense than an uncooked egg.
Literature Cited
1. Barton, A. C. J. Curriculum Studies 2000, 22, 797–820. 2. Bianchini, J.; Colburn, A. J. Res. Sci. Teach. 2000, 37, 177–
209. 3. Varelas, M.; Plotnick, R.; Wink, D.; Fan, Q.; Harris, Y. J. Coll. Sci.
Teach., in press. 4. Hand, B.; Prain, V. Sci. Educ. 2002, 86 (6), 737–755. 5. Greenbowe, T. J; Hand, B. Introduction to the Science Writing
Heuristic. In Chemists’ Guide to Effective Teaching; Pienta, N. J., Cooper, M. M., Greenbowe, T. J., Eds.; Prentice-Hall: Upper Saddle River, NJ, 2005; pp 140–154.
6. Keys, C. W.; Hand, B.; Prain, V.; Collins, S. J. Res. Sci. Teach. 1999, 36, 1065–1084.
7. Burke, K. A.; Greenbowe, T. J.; Hand, B. M. J. Chem. Educ. 2006, 83, 1032–1038.
8. Keys, C. J. Res. Sci. Teach. 2000, 36, 1044–1061.
9. Burke, K. A.; Hand, B.; Poock, J.; Greenbowe, T. J. Coll. Sci. Teach. 2005, 35, 36–41.
10. Hand, B. Int. J. Sci. Educ. 2004, 6, 131–149. 11. Rudd, J. A.; Greenbowe, T. J.; Hand, B. M.; Legg, M. J. J. Chem.
Educ. 2001, 78, 1680–1686. 12. Mauldin, R. F. J. Chem. Educ. 1997, 74, 952–955. 13. Herrick, R. S.; Nestor, L. P.; Benedetto, D. A. J. Chem. Educ.
1999, 76, 1411–1413. 14. USDA Egg Market Report. http://www.ams.usda.gov/poultry/
mncs/ShellEgg/2003Reports/011303e.pdf (accessed Nov 2007). 15. Abraham, M. Inquiry and Learning Cycles Approach. In Chemists’
Guide to Effective Teaching, Pienta, N. J., Cooper, M. M., Green-bowe, T. J., Eds.; Prentice-Hall: Upper Saddle River, NJ, 2005; pp 41–52.
16. Mullet, E.; Gervais, H. Int. J. Sci. Educ. 1990, 12 (2), 217–226. 17. Rowell, J.; Dawson, C.; Lyndon, Harry. Int. J. Sci. Educ. 1990, 12
(2), 167–175.
Supporting JCE Online Materialhttp://www.jce.divched.org/Journal/Issues/2008/Mar/abs396.htmlAbstract and keywordsArticle PDF with links to cited URLs and JCE articlesSupplement Student handouts Instructor notes