Embed Size (px)
Citation preview
External Report
The following report is an overview of the 2010-2011 recruiting season for Penn State’s Smeal College of Business. This data includes internships during Fall 2010, Spring 2011, and Summer 2011. It also encompasses co-ops, which are 2 semester experiences (Spring/Summer 2011 and Summer/Fall 2011). The data is compiled through many channels including the Penn State Data Warehouse, student and company feedback forms, as well as the National Association of Colleges and Employers (NACE).
All information is based only on undergraduate students at Penn
State’s University Park campus who are enrolled in the Smeal College of Business.
All information is accurate as of January 17, 2012. This is the final report for the 2010-2011 recruiting season.

Internship/co-op placements up by 18% 25% increase in company on-campus recruiting activity 25% increase in on campus interview postings Placements 2010-2011 change 2009-2010
Total 1303 18% 1109
Fall 2010 47 -20% 59
Spring 2011 103 27% 81
Spring/Summer 2011 92 -7% 99
Summer 2011 993 26% 786
Summer/Fall 2011 68 -19% 84
Accounting 266 39% 192
Actuarial Science 55 25% 44
Business Administration* 148 n/a n/a
Economics 22 0% 23
Finance 270 -13% 312
Management 53 -17% 64
Management Information Systems 28 27% 22
Marketing 209 4% 201
Supply Chain & Information Systems 252 15% 222
Interview Stats 2010-2011 change 2009-2010
Companies Recruting On-Campus 176 25% 141
Internships/Co-ops Posted 844 10% 765
Total Interviews Conducted 2818 6% 2658
*In 2010-2011, we improved the way recruiting stats were tracked to ensure accuracy. Because of this, changes cannot be calculated for Business Administration placements between these 2 years.
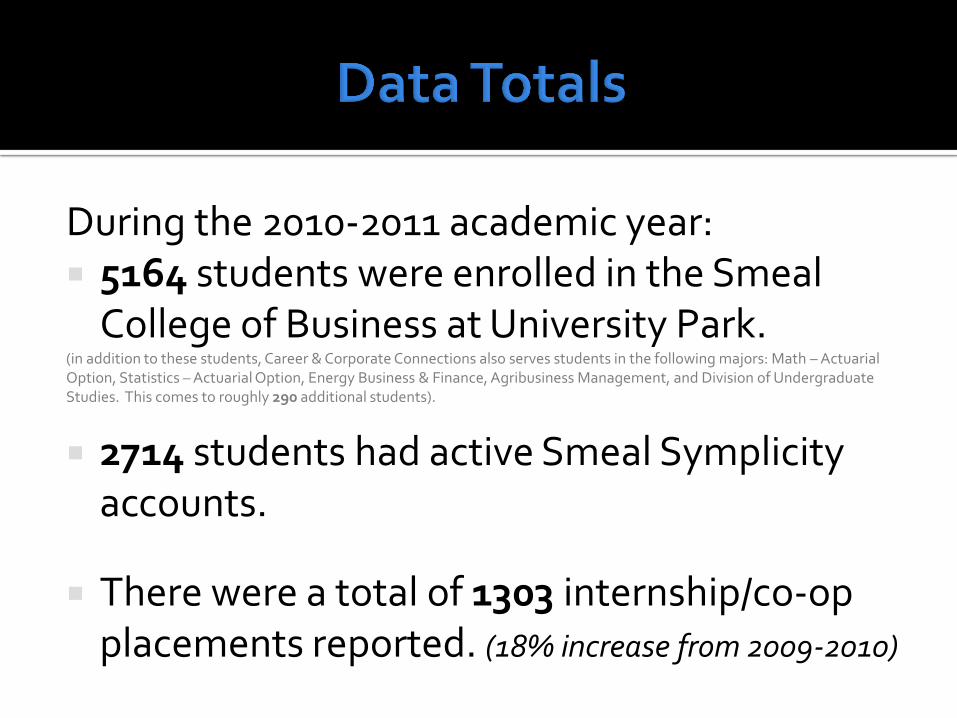
During the 2010-2011 academic year: 5164 students were enrolled in the Smeal
College of Business at University Park. (in addition to these students, Career & Corporate Connections also serves students in the following majors: Math – Actuarial Option, Statistics – Actuarial Option, Energy Business & Finance, Agribusiness Management, and Division of Undergraduate Studies. This comes to roughly 290 additional students).
2714 students had active Smeal Symplicity accounts.
There were a total of 1303 internship/co-op placements reported. (18% increase from 2009-2010)
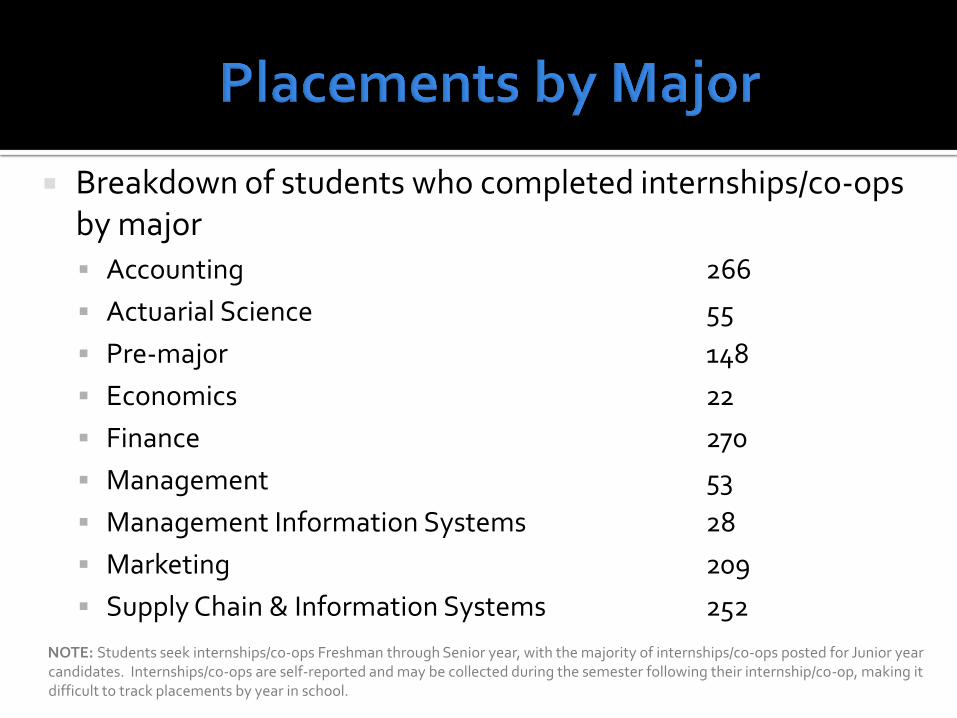
Breakdown of students who completed internships/co-ops by major
Accounting 266
Actuarial Science 55
Pre-major 148
Economics 22
Finance 270
Management 53
Management Information Systems 28
Marketing 209
Supply Chain & Information Systems 252
NOTE: Students seek internships/co-ops Freshman through Senior year, with the majority of internships/co-ops posted for Junior year candidates. Internships/co-ops are self-reported and may be collected during the semester following their internship/co-op, making it difficult to track placements by year in school.
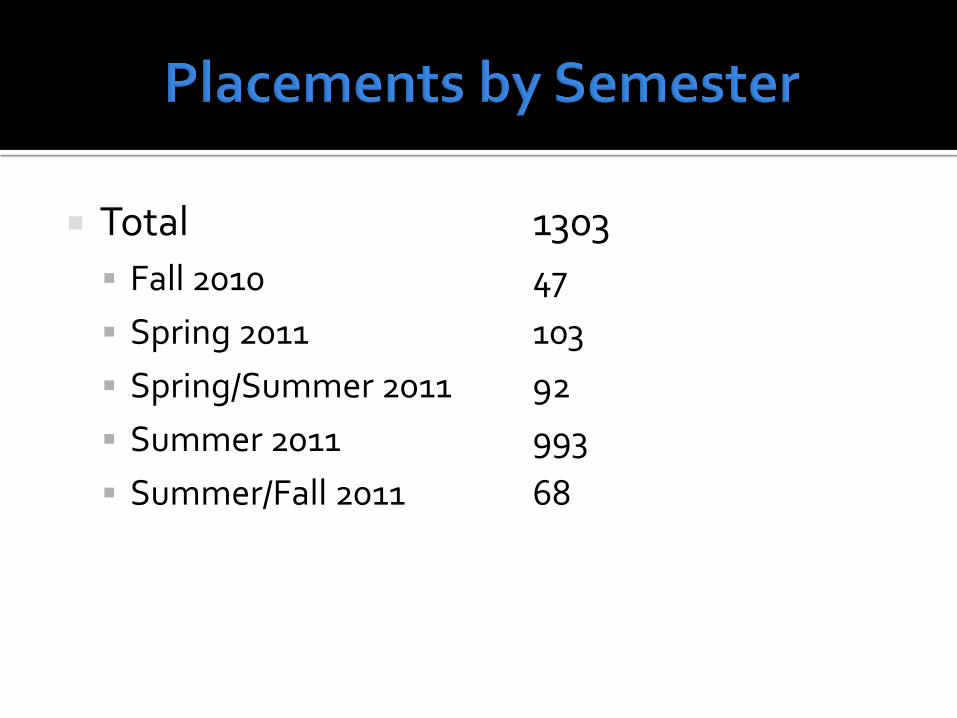
Total 1303
Fall 2010 47
Spring 2011 103
Spring/Summer 2011 92
Summer 2011 993
Summer/Fall 2011 68
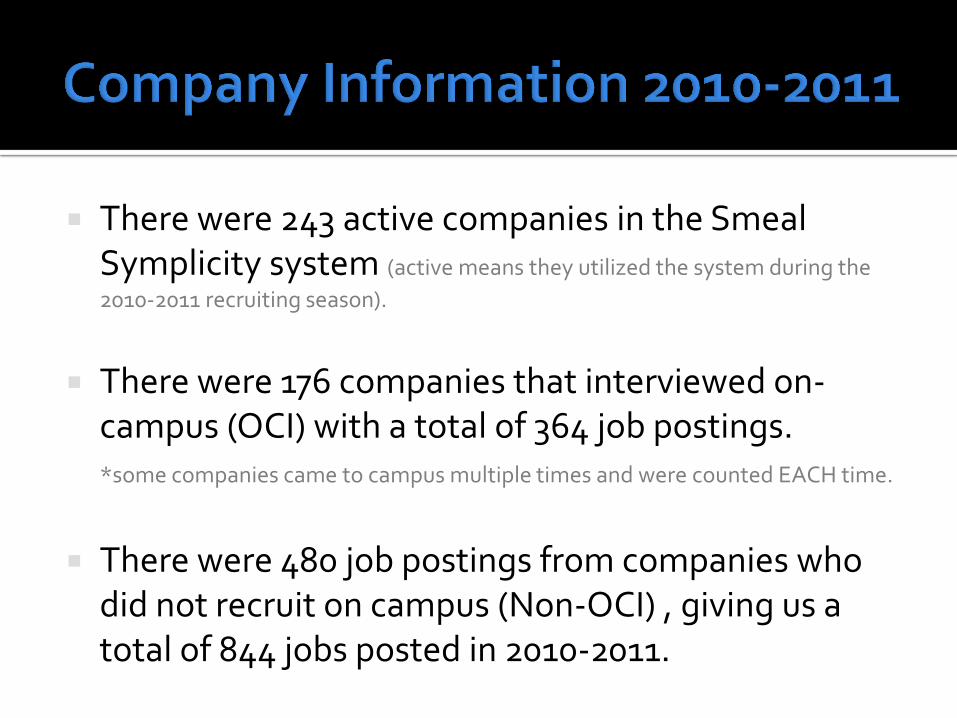
There were 243 active companies in the Smeal Symplicity system (active means they utilized the system during the
2010-2011 recruiting season).
There were 176 companies that interviewed on-
campus (OCI) with a total of 364 job postings. *some companies came to campus multiple times and were counted EACH time.
There were 480 job postings from companies who
did not recruit on campus (Non-OCI) , giving us a total of 844 jobs posted in 2010-2011.
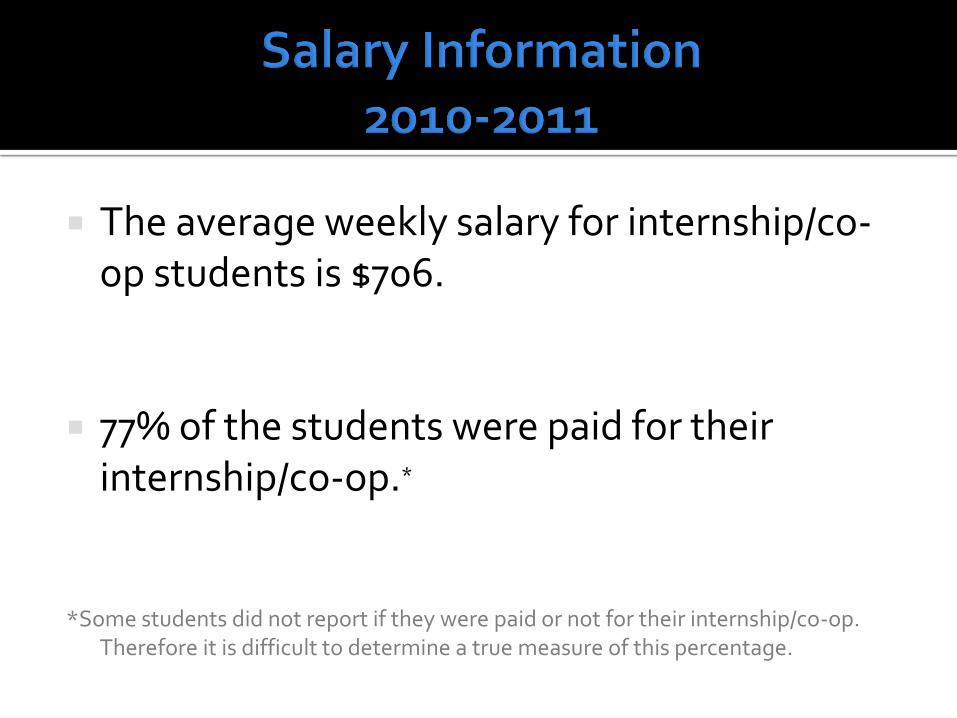
The average weekly salary for internship/co-op students is $706.
77% of the students were paid for their
internship/co-op.*
*Some students did not report if they were paid or not for their internship/co-op. Therefore it is difficult to determine a true measure of this percentage.
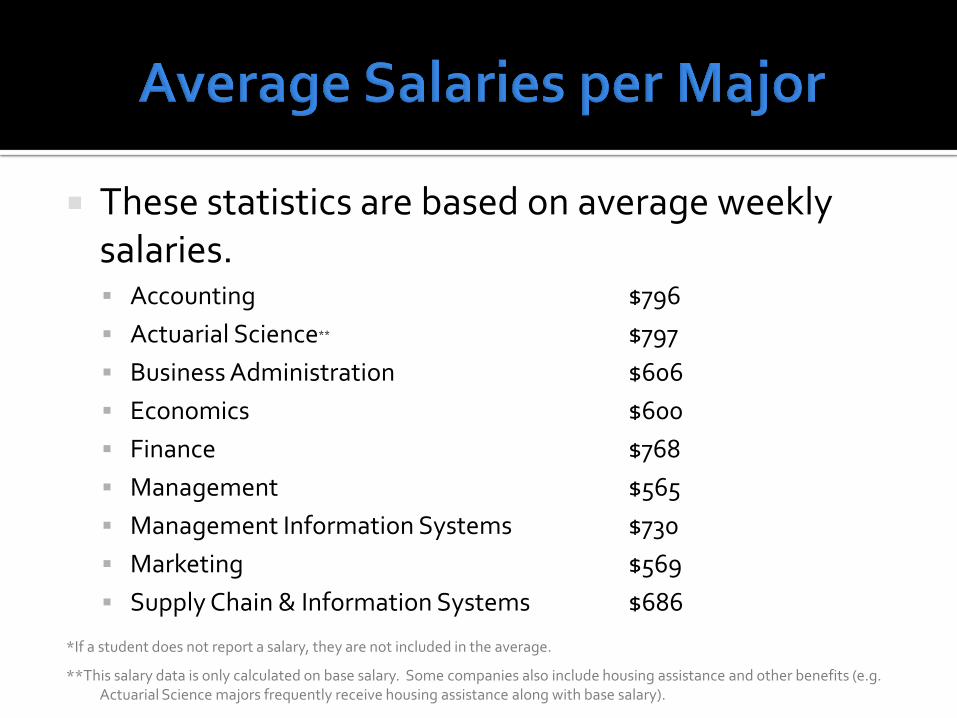
These statistics are based on average weekly salaries. Accounting $796
Actuarial Science** $797
Business Administration $606
Economics $600
Finance $768
Management $565
Management Information Systems $730
Marketing $569
Supply Chain & Information Systems $686 *If a student does not report a salary, they are not included in the average.
**This salary data is only calculated on base salary. Some companies also include housing assistance and other benefits (e.g. Actuarial Science majors frequently receive housing assistance along with base salary).
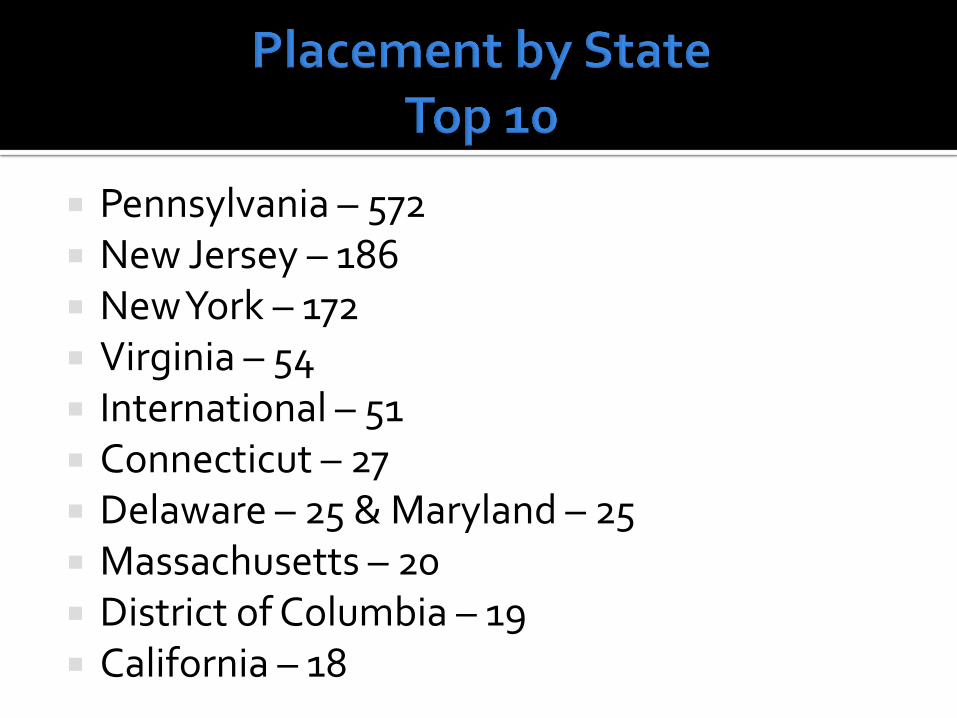
Pennsylvania – 572 New Jersey – 186 New York – 172 Virginia – 54 International – 51 Connecticut – 27 Delaware – 25 & Maryland – 25 Massachusetts – 20 District of Columbia – 19 California – 18
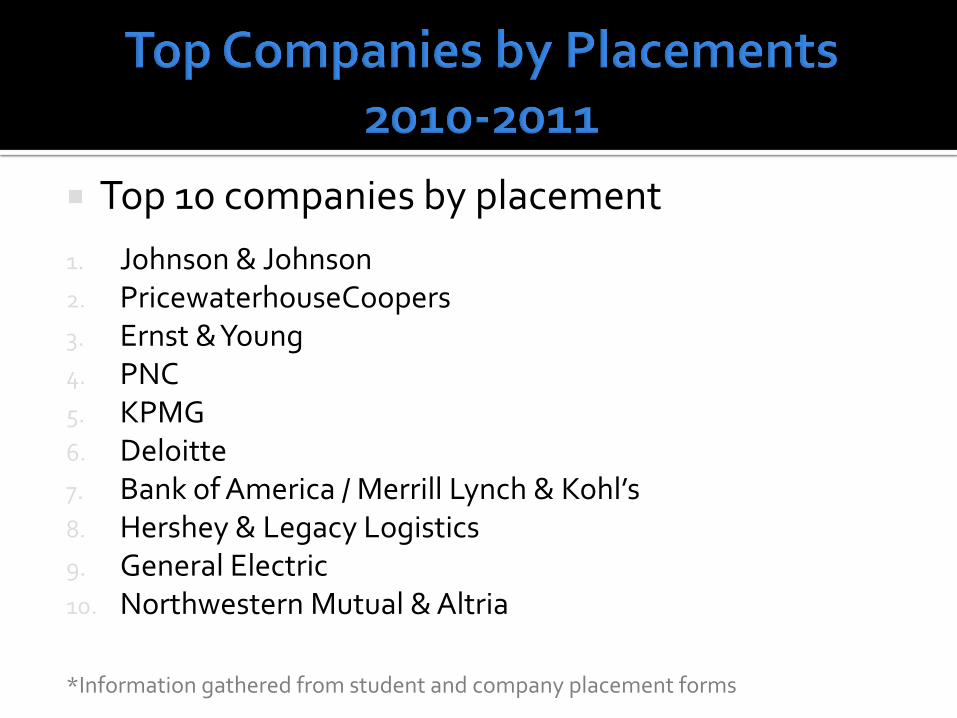
Top 10 companies by placement
1. Johnson & Johnson 2. PricewaterhouseCoopers 3. Ernst & Young 4. PNC 5. KPMG 6. Deloitte 7. Bank of America / Merrill Lynch & Kohl’s 8. Hershey & Legacy Logistics 9. General Electric 10. Northwestern Mutual & Altria
*Information gathered from student and company placement forms