Embed Size (px)
Citation preview
Environmental Noise Impact Assessment For
Pengrowth Lindbergh SAGD Project
Prepared for: Pengrowth Energy Corporation
Prepared by:
S. Bilawchuk, M.Sc., P.Eng.
aci Acoustical Consultants Inc. Edmonton, Alberta
APEGGA Permit to Practice #P7735
aci Project #: 11-027 November 24, 2011
aci Acoustical Consultants Inc. 5031 – 210 Street Edmonton, Alberta, Canada T6M 0A8 Phone: (780) 414-6373, Fax: (780) 414-6376 www.aciacoustical.com
November 24, 2011
Executive Summary aci Acoustical Consultants Inc., of Edmonton AB, was retained by Pengrowth Energy Corporation to
conduct an environmental noise impact assessment (NIA) for the proposed Lindbergh SAGD Project
(the Project) in northeast Alberta in Township 58 and Range 05, W4M. The purpose of the work was to
conduct a site visit to measure current noise levels, to generate a computer noise model of the Project
under Baseline Case, Application Case, and Cumulative Case conditions, and to compare the resultant
sound levels to the Alberta Energy Resources Conservation Board (ERCB) permissible sound level
guidelines (Directive 038 on Noise Control, 2007).
The results of the noise modeling indicated Baseline Case noise levels associated with existing area
noise sources (with the average ambient sound level of 35 dBA included) are below the ERCB Directive
038 PSL of 40 dBA LeqNight1 for all residential receptors within approximately 4 km of the Project.
The Application Case noise levels associated with the Project (with the average ambient sound level of
35 dBA included) will be below the ERCB Directive 038 PSL of 40 dBA LeqNight for all surrounding
residential and theoretical 1,500 m receptors. T he Project-only noise levels (i.e. no a verage ambient
sound level) were more than 5 dBA below the PSL at all of the receptors.
The Cumulative Case noise levels associated with the existing noise sources and Project noise sources
(with the average ambient sound level of 35 dBA included) will be below the ERCB Directive 038 PSL
of 40 dBA LeqNight for all residential receptors within approximately 4 km of the Project. In addition,
the dBC – dBA sound levels are projected to be less than 20 dB at all locations in the Cumulative Case.
As specified in ERCB Directive 038, if the dBC – dBA sound levels are less than 20 dB, the noise is not
considered to have a low frequency tonal component. A s a result, no additional noise mitigation is
required.
1 The term Leq represents the energy equivalent sound level. This is a measure of the equivalent sound level for a specified period of time accounting for fluctuations.
Pengrowth Energy Corporation – Lindbergh SAGD Project – NIA Project #11-027
i November 24, 2011
Table of Contents
1.0 Introduction ..................................................................................................................................... 1 2.0 Project Location and Description .................................................................................................... 1 3.0 Measurement & Modeling Methods................................................................................................ 2
3.1. Baseline Noise Monitoring .......................................................................................................... 2 3.2. Site Sound Level Measurements ................................................................................................. 2 3.3. Computer Noise Modeling (General) .......................................................................................... 3 3.4. Noise Sources .............................................................................................................................. 4 3.5. Modeling Confidence .................................................................................................................. 5
4.0 Permissible Sound Levels ............................................................................................................... 6 5.0 Results and Discussion .................................................................................................................... 8
5.1. Baseline Case Results .................................................................................................................. 8 5.2. Application Case Results............................................................................................................. 9 5.3. Cumulative Case Results ........................................................................................................... 11 5.4. Noise Mitigation Measures ....................................................................................................... 12
5.4.1. Construction Noise ............................................................................................................ 12 6.0 Conclusion ..................................................................................................................................... 13 7.0 References ..................................................................................................................................... 14 Appendix I NOISE MODELING PARAMETERS ............................................................................... 19 Appendix II MEASUREMENT EQUIPMENT USED.......................................................................... 23 Appendix III THE ASSESSMENT OF ENVIRONMENTAL NOISE (GENERAL) ........................... 27 Appendix IV SOUND LEVELS OF FAMILIAR NOISE SOURCES .................................................. 39 Appendix V PERMISSIBLE SOUND LEVEL DETERMINATION ................................................... 41 Appendix VI APPLICATION CASE NOISE SOURCE ORDER-RANKING ..................................... 42 Appendix VII NOISE IMPACT ASSESSMENT .................................................................................. 45
List of Tables Table 1. Basic Night-Time Sound Levels (as per ERCB Directive 038) ................................................... 7 Table 2. Baseline Case Modeled Sound Levels ......................................................................................... 8 Table 3. Baseline Case Modeled dBA and dBC Sound Levels .................................................................. 8 Table 4. Application Case Modeled Sound Levels .................................................................................... 9 Table 5. Application Case Modeled dBA and dBC Sound Levels .......................................................... 10 Table 6. Cumulative Case Modeled Sound Levels .................................................................................. 11 Table 7. Cumulative Case Modeled dBA and dBC Sound Levels ........................................................... 11
List of Figures Figure 1. Study Area ................................................................................................................................ 15 Figure 2. Baseline Case Modeled Night-time Noise Levels (Without ASL) ........................................... 16 Figure 3. Application Case Modeled Night-time Noise Levels (Without ASL) ...................................... 17 Figure 4. Cumulative Case Modeled Night-time Noise Levels (Without ASL) ...................................... 18
Pengrowth Energy Corporation – Lindbergh SAGD Project – NIA Project #11-027
1 November 24, 2011
1.0 Introduction
aci Acoustical Consultants Inc., of Edmonton AB, was retained by Pengrowth Energy Corporation to
conduct an environmental noise impact assessment (NIA) for the proposed Lindbergh SAGD Project
(the Project) in northeast Alberta in Township 58 and Range 05, W4M. The purpose of the work was to
conduct a site visit to measure current noise levels, to generate a computer noise model of the Project
under Baseline Case, Application Case, and Cumulative Case conditions, and to compare the resultant
sound levels to the Alberta Energy Resources Conservation Board (ERCB) permissible sound level
guidelines (Directive 038 on Noise Control, 2007).
2.0 Project Location and Description
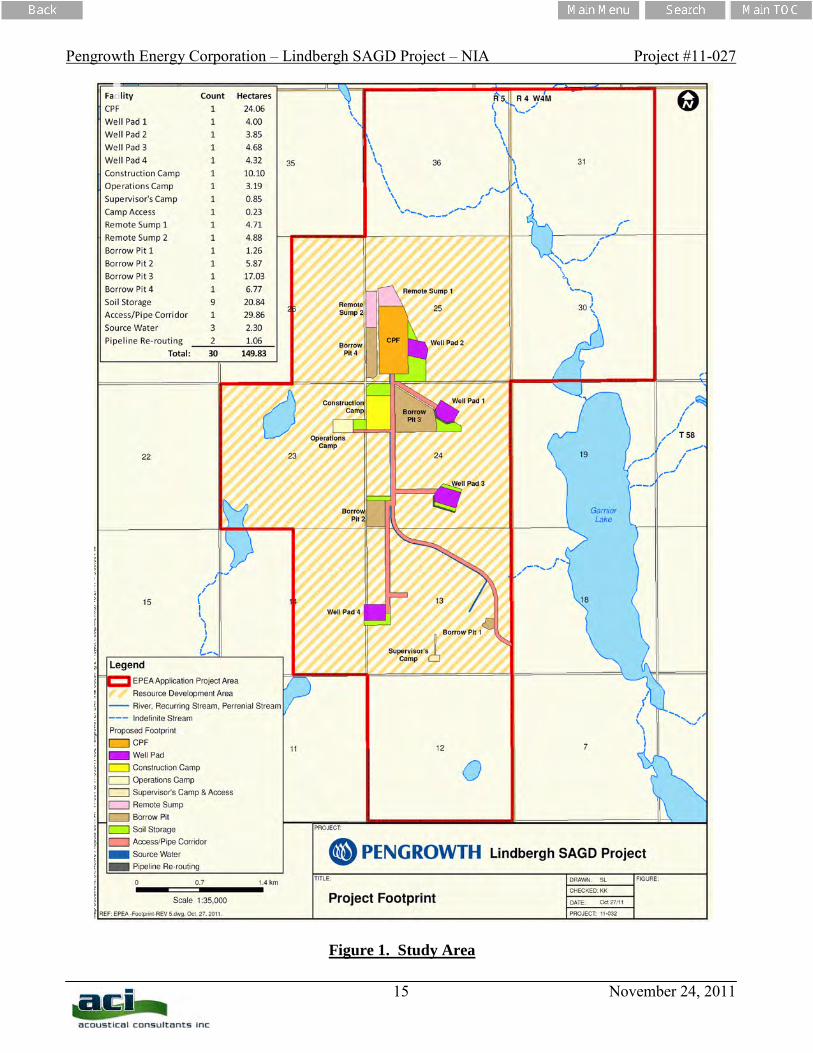
The Project is located approximately 22 km south-southeast of Bonnyville, Alberta, within Township 58
and Range 05, W4M, as shown in Fig. 1. The Project will consist of a central processing facility (CPF)
and 4 well-pads. At the CPF, there will be equipment required for steam generation, water/oil
separation, materials storage, pumping, and on-site utilities. At the well-pads there will be equipment for
pumping and piping.
Other than the Project, there are numerous other industrial noise sources within approximately 5 km. These include:
- Various well-sites with small internal combustion engines and surface pumps operated by Canadian Natural Resources Ltd (CNRL) and Bonavista Energy Ltd.,
- 2 small compressor stations operated by Bonavista Energy Ltd. (with internal combustion engines),
- Compressor station operated by Inter Pipeline (with electrically driven pumps). The full list of sites with LSDs and noise producing equipment is provided in Appendix I. Al l of the locations were confirmed during a site visit on June 13, 2011. Note that there is also an existing facility at the Pengrowth site, however, it is no longer operational and will be removed prior to start-up of the Project. As such, it has not been included in the assessment. In addition, the nearest significant road is RG RD 50 which is not considered heavily traveled1. 1 Traffic volumes are less than 10-vehicles per hour during the night-time based on 2010 Alberta Transportation Traffic Counts
Pengrowth Energy Corporation – Lindbergh SAGD Project – NIA Project #11-027
2 November 24, 2011
There are no r esidential receptors within 1,500 m of Project noise sources. T here are seven (7) residential receptors within approximately 4,000 m of Project noise sources (the closest resident is approximately 3,200 m from the nearest Project noise source), and they have been included in the assessment. Residents beyond 4,000 m were not included in the assessment because the noise modeling indicated that the impact at 4,000 m was negligible so there was no r eason to evaluate at further distances. Topographically, the land surrounding the Project has a general downward slope from west to east with lakes on the eastern portion. There is a change in elevation of approximately 100 m from the lowest to the highest point within a 1.5 km radius surrounding the Project. Topographical mapping information for the entire area was incorporated into the model. The land is generally covered in trees, bush, grain crops, and field grasses throughout. As such, the vegetative sound absorption is significant. 3.0 Measurement & Modeling Methods
3.1. Baseline Noise Monitoring
Given the significant distance from the nearest resident to the closest proposed Project noise sources, a baseline noise monitoring was not conducted. This conforms with the requirements of the ERCB Directive 038 on Noise Control. 3.2. Site Sound Level Measurements
As part of the study, a site visit to the study area was conducted on June 13, 2011. During the site visit, existing noise sources were identified and sound level measurements were conducted to determine sound power levels for use in the computer noise model. Not every single noise source was measured. In most cases, the equipment was consistent from site to site. The only thing that changed was the quantity of each item. For example, some of the well sites had 3 internal combustion engines and 3 pumps, while others had a different number of engines and pumps. All, however, had the same engines and the same pumps. T here were some engines that had additional noise mitigation, and those were measured separately. As such, the sound power levels used in the noise model accurately reflect the existing noise sources observed within the study area of approximately 5 km surrounding the Project. Sound level measurements were conducted using a Brüel and Kjær Type 2250 Precision Integrating Sound Level Meter (SLM). T he distance from the noise source to the SLM was measured and the
Pengrowth Energy Corporation – Lindbergh SAGD Project – NIA Project #11-027
3 November 24, 2011
surrounding reflective conditions were noted. The sound pressure level data obtained was then used to determine the appropriate octave band sound power level data for the noise source. Refer to Appendix II for a detailed description of the measurement instrumentation used.
3.3. Computer Noise Modeling (General)
The computer noise modeling was conducted using the CADNA/A (version 4.2.139) software package.
CADNA/A allows for the modeling of various noise sources such as road, rail, and stationary sources.
Topographical features such as land contours, vegetation, and bodies of water and meteorological
conditions such as temperature, relative humidity, wind-speed and wind-direction are considered in the
assessment. The modeling methods utilized met or exceeded the requirements of the ERCB Directive
038 on Noise Control.
The calculation method used for noise propagation follows the International Standards Organization
(ISO) 9613-2. All receiver locations were assumed as being downwind from the source(s). In particular,
as stated in Section 5 of the ISO 9613-2 document:
“Downwind propagation conditions for the method specified in this part of IS0 9613 are as specified in 5.4.3.3 of IS0 1996-2:1987, namely - wind direction within an angle of ± 450 of the direction connecting the centre of the
dominant sound source and the centre of the specified receiver region, with the wind blowing from source to receiver, and
- wind speed between approximately 1 m/s and 5 m/s, measured at a height of 3 m to 11 m above the ground.
The equations for calculating the average downwind sound pressure level LAT(DW) in this part of IS0 9613, including the equations for attenuation given in clause 7, are the average for meteorological conditions within these limits. The term average here means the average over a short time interval, as defined in 3.1. These equations also hold, equivalently, for average propagation under a well-developed moderate ground-based temperature inversion, such as commonly occurs on clear, calm nights”.
Due to the large size of the study area and the density of vegetation within the study area, vegetative sound absorption was included in the model. A ground absorption coefficient of 0.5 was used along with a temperature of 100C and a relative humidity of 70%. Although there are trees in the area, they were

Pengrowth Energy Corporation – Lindbergh SAGD Project – NIA Project #11-027
4 November 24, 2011
not incorporated into the model. As a result, all sound level propagation calculations are considered a conservative representation of summertime conditions (as specified in ERCB Directive 038) As part of the study, three noise modeling scenarios were conducted, including:
1) Baseline Case: T his included all existing noise sources within approximately 5 km of the Project. The noise levels were calculated at all residential receptors within approximately 4 km of the Project.
2) Application Case: T his included all noise sources associated with the Project without the existing surrounding noise sources. The noise levels were calculated at all residential receptors within approximately 4 km of the Project as well as at a radius of 1,500 m from the Project.
3) Cumulative Case: This included all existing noise sources as well as those associated with the Project. The noise levels were calculated at all residential receptors within approximately 4 km of the Project.
The computer noise modeling results were calculated in two ways. First, sound levels were calculated at the residential and theoretical 1,500 m receiver locations. Second, sound levels were calculated using a 20 m x 20 m receptor grid pattern within the entire study area. This provided color noise contours for easier visualization and evaluation of the results. 3.4. Noise Sources
Sound power levels for existing noise sources were determined based on sound level measurements
conducted within the study area for specific noise producing items. The noise sources for the equipment
associated with the Project are provided in Appendix I. The data were obtained either from equipment
specific information provided by Pengrowth Energy Corporation and assessments carried out for other
projects using similar operating equipment combined with aci in-house measurement information and
calculations using methods presented in various texts. All sound power levels (PWLs) used in the
modeling are considered conservative.
All noise sources have been modeled as point sources at their appropriate heights1. Sound power levels
for all noise sources were modeled using octave-band information. Buildings and tanks were included in
1 The heights for many of the sources are generally slightly higher than actual. This makes the model more conservative
Pengrowth Energy Corporation – Lindbergh SAGD Project – NIA Project #11-027
5 November 24, 2011
the modeling calculations because of their ability to provide shielding as well as reflection for noise1.
Refer to Appendix I for building and tank dimensions.
Finally, ERCB Directive 038 requires the assessment to include background ambient noise levels in the
model. As specified in ERCB Directive 038, in most rural areas of Alberta where there is an absence of
industrial noise sources the average night-time ambient noise level is approximately 35 dBA. This is
known as the average ambient sound level (ASL). This value was used as the ambient condition in the
modeling with the various existing and Project related noise sources added.
3.5. Modeling Confidence
As mentioned previously, the algorithms used for the noise modeling follow the ISO 9613 standard. The
published accuracy for this standard is ±3 dBA between 100 m – 1,000 m. A ccuracy levels beyond
1,000 m are not published. Professional experience based on similar noise models and measurements
conducted over large distances shows that, as expected, as the distance increases, the associated accuracy
in prediction decreases. Experience has shown that environmental factors such as wind, temperature
inversions, topography and ground cover all have increasing effects over distances larger than
approximately 1,500 m. As such, for all receptors within approximately 1,500 m of the various noise
sources, the prediction confidence is considered high, while for all receptors beyond 1,500 m, the
prediction confidence is considered moderate.
1 Exterior building and tank walls were modeled with an absorption coefficient of 0.21 which is generally highly reflective.
Pengrowth Energy Corporation – Lindbergh SAGD Project – NIA Project #11-027
6 November 24, 2011
4.0 Permissible Sound Levels
Environmental noise levels from industrial noise sources are commonly described in terms of equivalent
sound levels or Leq. This is the level of a steady sound having the same acoustic energy, over a given
time period, as the fluctuating sound. In addition, this energy averaged level is A–weighted to account
for the reduced sensitivity of average human hearing to low frequency sounds. These Leq in dBA, which
are the most common environmental noise measure, are often given for day-time (07:00 to 22:00)
LeqDay and night-time (22:00 to 07:00) LeqNight while other criteria use the entire 24-hour period as
Leq24. Refer to Appendix III for a description of the acoustical terms used and to Appendix IV for a list
of common noise sources.
The document which most directly relates to the Permissible Sound Levels (PSL’s) for this NIA is the
ERCB Directive 038 on Noise Control (2007). ERCB Directive 038 sets the PSL at the receiver location
based on population density and relative distances to heavily traveled road and rail as shown in Table 1.
In all instances, there is a Basic Sound Level (BSL) of 40 dBA for the night-time (night-time hours are
22:00 – 07:00) and 50 dBA for the day-time (day-time hours are 07:00 – 22:00). N ote that for this
location, none of the adjustments to the BSL, discussed in ERCB Directive 038, apply. As such, for the
residential receptors, the PSLs are an LeqNight of 40 dBA and an LeqDay of 50 dBA. Finally, ERCB
Directive 038 specifies that new or modified facilities must meet a PSL-Night of 40 d BA at 1,500 m
from the facility fence-line if there are no closer dwellings. As such, the PSLs at a distance of 1,500 m
are an LeqNight of 40 dBA and an LeqDay of 50 dBA. Refer to Appendix V for a detailed
determination of the permissible sound levels.
The PSLs provided are related to noise associated with activities and processes at the Project and are not
related to vehicle traffic on nearby highways (or access roads). This includes all traffic related to the
construction and operation of the Facility. N oises from traffic sources are not covered by any
regulations or guidelines at the municipal, provincial, or federal levels. As such, an assessment of the
noises related to vehicle traffic was not conducted. In addition, construction noise is not specifically
regulated by ERCB Directive 038. However, construction noise mitigation recommendations are
provided in Section 5.4.1.
Pengrowth Energy Corporation – Lindbergh SAGD Project – NIA Project #11-027
7 November 24, 2011
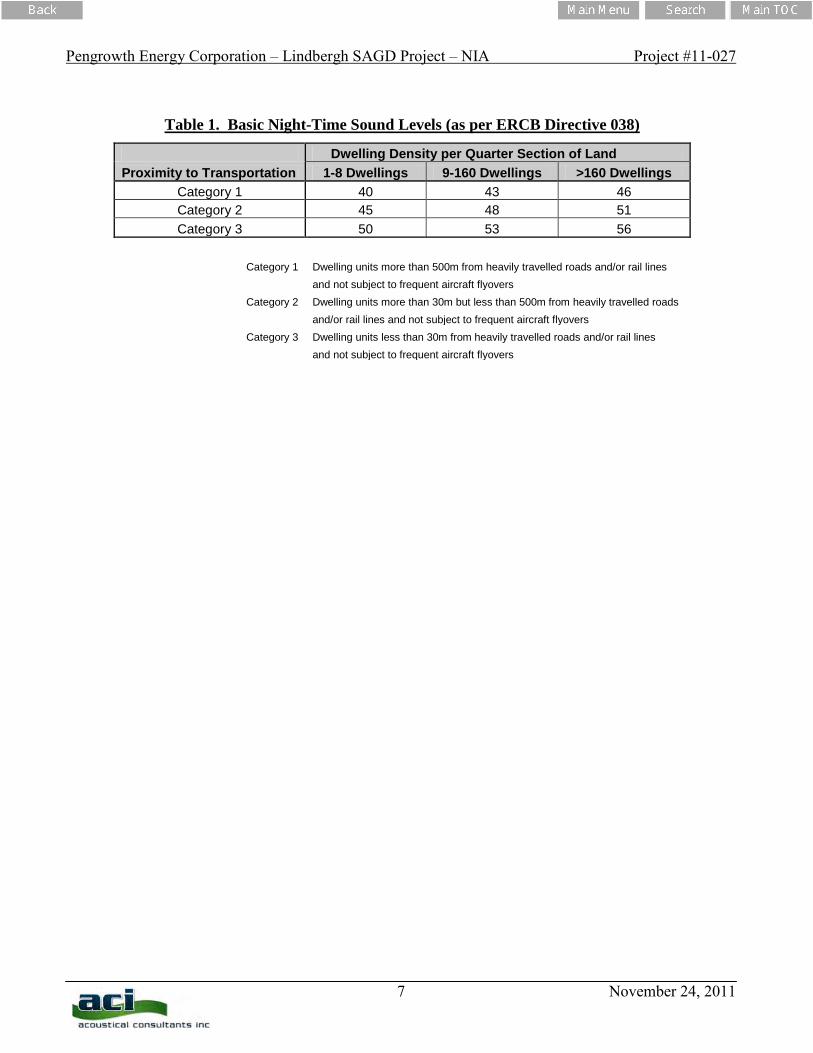
Table 1. Basic Night-Time Sound Levels (as per ERCB Directive 038)
Dwelling Density per Quarter Section of Land Proximity to Transportation 1-8 Dwellings 9-160 Dwellings >160 Dwellings
Category 1 40 43 46 Category 2 45 48 51 Category 3 50 53 56
Category 1 Dwelling units more than 500m from heavily travelled roads and/or rail lines
and not subject to frequent aircraft flyovers Category 2 Dwelling units more than 30m but less than 500m from heavily travelled roads
and/or rail lines and not subject to frequent aircraft flyovers Category 3 Dwelling units less than 30m from heavily travelled roads and/or rail lines
and not subject to frequent aircraft flyovers
Pengrowth Energy Corporation – Lindbergh SAGD Project – NIA Project #11-027
8 November 24, 2011
5.0 Results and Discussion
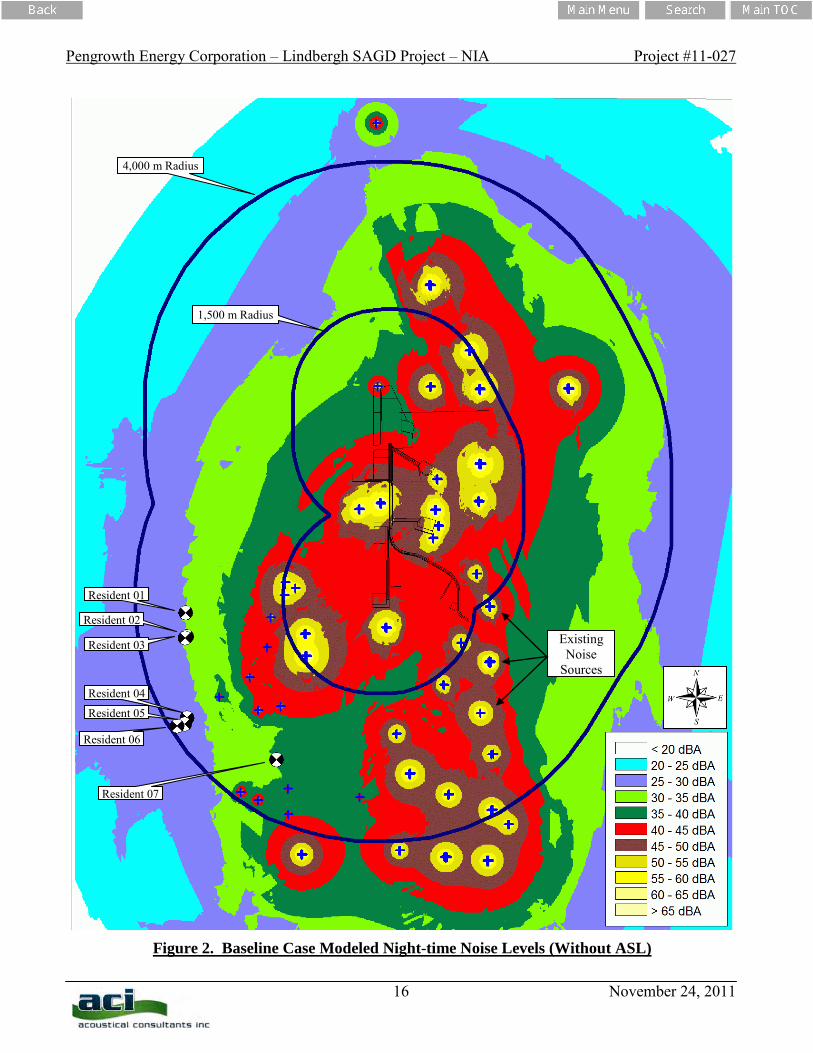
5.1. Baseline Case Results
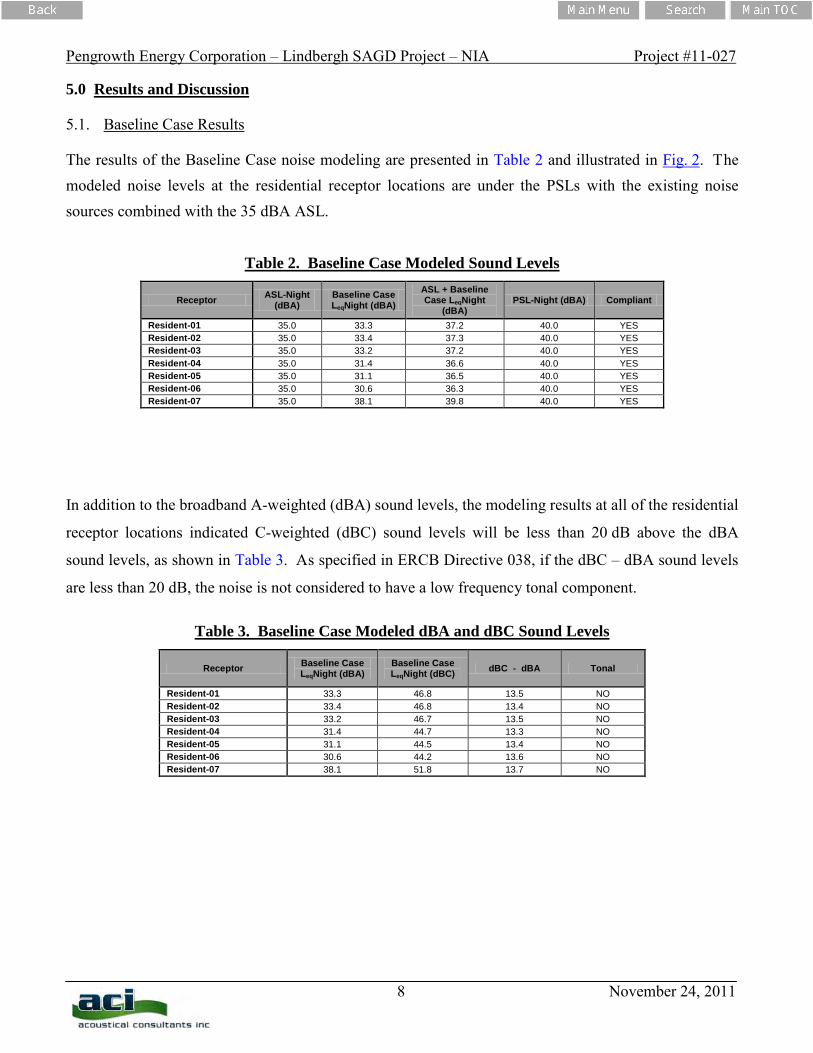
The results of the Baseline Case noise modeling are presented in Table 2 and illustrated in Fig. 2. The modeled noise levels at the residential receptor locations are under the PSLs with the existing noise sources combined with the 35 dBA ASL.
Table 2. Baseline Case Modeled Sound Levels
Receptor ASL-Night (dBA)
Baseline Case LeqNight (dBA)
ASL + Baseline Case LeqNight
(dBA) PSL-Night (dBA) Compliant
Resident-01 35.0 33.3 37.2 40.0 YES Resident-02 35.0 33.4 37.3 40.0 YES Resident-03 35.0 33.2 37.2 40.0 YES Resident-04 35.0 31.4 36.6 40.0 YES Resident-05 35.0 31.1 36.5 40.0 YES Resident-06 35.0 30.6 36.3 40.0 YES Resident-07 35.0 38.1 39.8 40.0 YES
In addition to the broadband A-weighted (dBA) sound levels, the modeling results at all of the residential
receptor locations indicated C-weighted (dBC) sound levels will be less than 20 dB above the dBA
sound levels, as shown in Table 3. As specified in ERCB Directive 038, if the dBC – dBA sound levels
are less than 20 dB, the noise is not considered to have a low frequency tonal component.
Table 3. Baseline Case Modeled dBA and dBC Sound Levels
Receptor Baseline Case LeqNight (dBA)
Baseline Case LeqNight (dBC) dBC - dBA Tonal
Resident-01 33.3 46.8 13.5 NO Resident-02 33.4 46.8 13.4 NO Resident-03 33.2 46.7 13.5 NO Resident-04 31.4 44.7 13.3 NO Resident-05 31.1 44.5 13.4 NO Resident-06 30.6 44.2 13.6 NO Resident-07 38.1 51.8 13.7 NO
Pengrowth Energy Corporation – Lindbergh SAGD Project – NIA Project #11-027
9 November 24, 2011
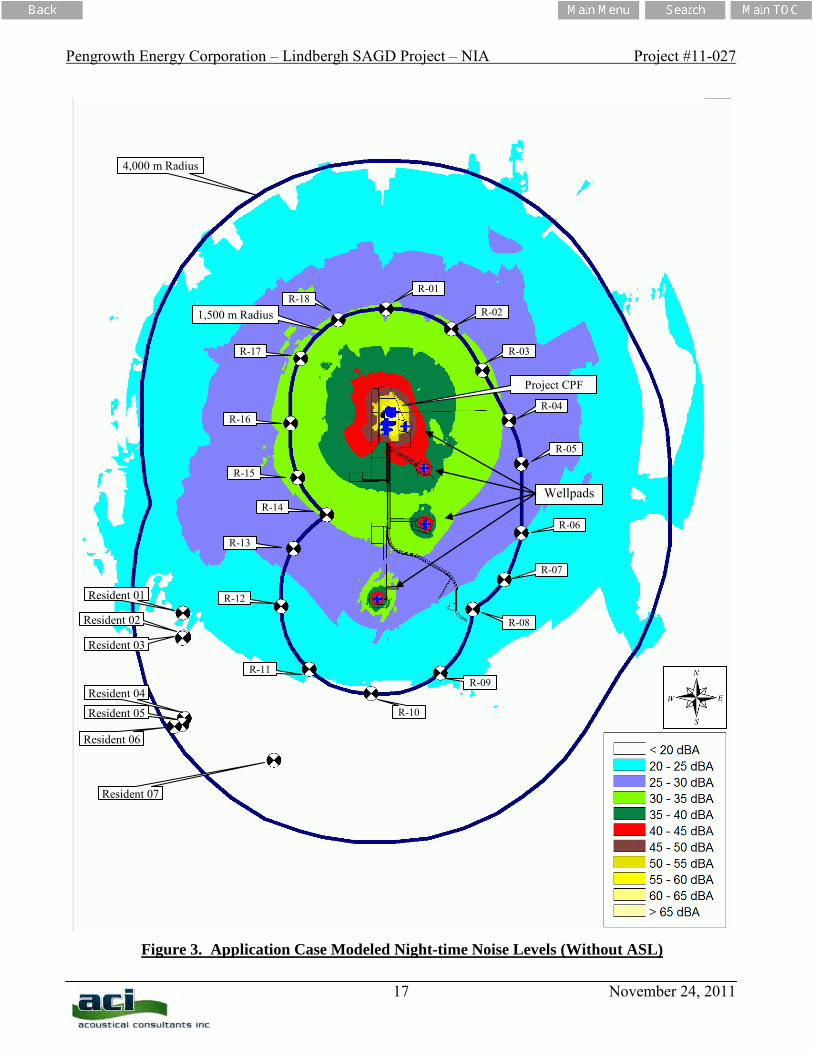
5.2. Application Case Results
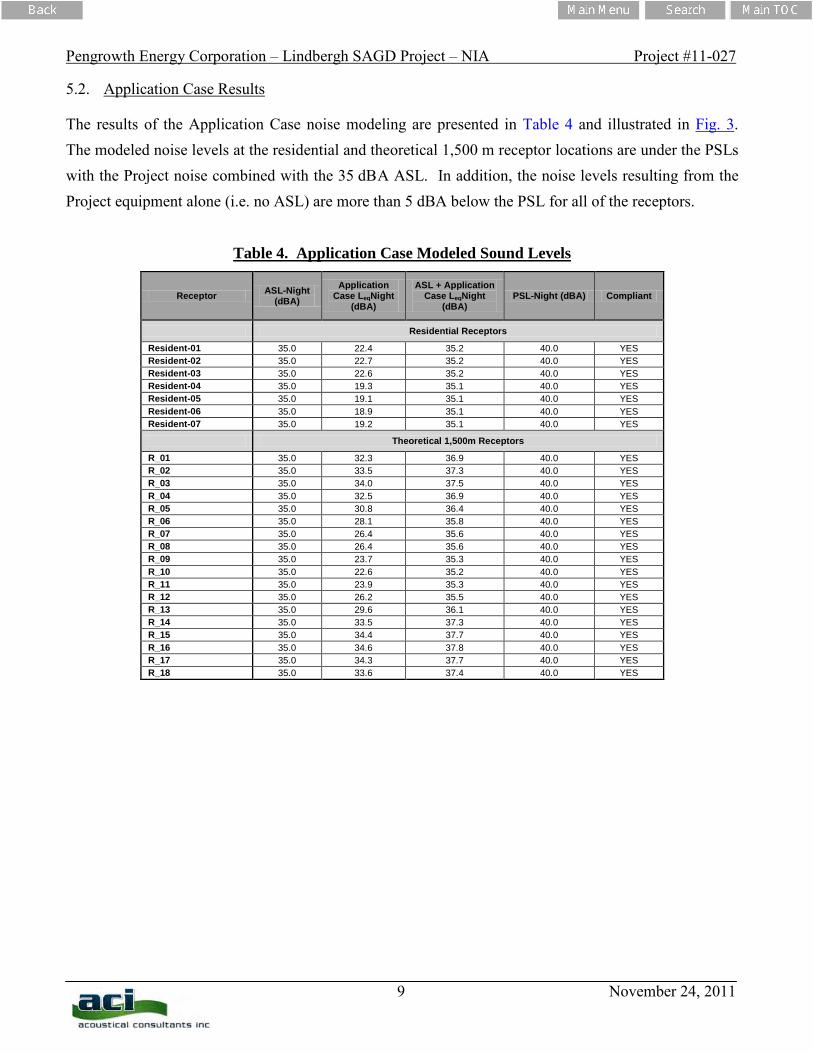
The results of the Application Case noise modeling are presented in Table 4 and illustrated in Fig. 3. The modeled noise levels at the residential and theoretical 1,500 m receptor locations are under the PSLs with the Project noise combined with the 35 dBA ASL. In addition, the noise levels resulting from the Project equipment alone (i.e. no ASL) are more than 5 dBA below the PSL for all of the receptors.
Table 4. Application Case Modeled Sound Levels
Receptor ASL-Night (dBA)
Application Case LeqNight
(dBA)
ASL + Application Case LeqNight
(dBA) PSL-Night (dBA) Compliant
Residential Receptors
Resident-01 35.0 22.4 35.2 40.0 YES Resident-02 35.0 22.7 35.2 40.0 YES Resident-03 35.0 22.6 35.2 40.0 YES Resident-04 35.0 19.3 35.1 40.0 YES Resident-05 35.0 19.1 35.1 40.0 YES Resident-06 35.0 18.9 35.1 40.0 YES Resident-07 35.0 19.2 35.1 40.0 YES
Theoretical 1,500m Receptors
R_01 35.0 32.3 36.9 40.0 YES R_02 35.0 33.5 37.3 40.0 YES R_03 35.0 34.0 37.5 40.0 YES R_04 35.0 32.5 36.9 40.0 YES R_05 35.0 30.8 36.4 40.0 YES R_06 35.0 28.1 35.8 40.0 YES R_07 35.0 26.4 35.6 40.0 YES R_08 35.0 26.4 35.6 40.0 YES R_09 35.0 23.7 35.3 40.0 YES R_10 35.0 22.6 35.2 40.0 YES R_11 35.0 23.9 35.3 40.0 YES R_12 35.0 26.2 35.5 40.0 YES R_13 35.0 29.6 36.1 40.0 YES R_14 35.0 33.5 37.3 40.0 YES R_15 35.0 34.4 37.7 40.0 YES R_16 35.0 34.6 37.8 40.0 YES R_17 35.0 34.3 37.7 40.0 YES R_18 35.0 33.6 37.4 40.0 YES
Pengrowth Energy Corporation – Lindbergh SAGD Project – NIA Project #11-027
10 November 24, 2011
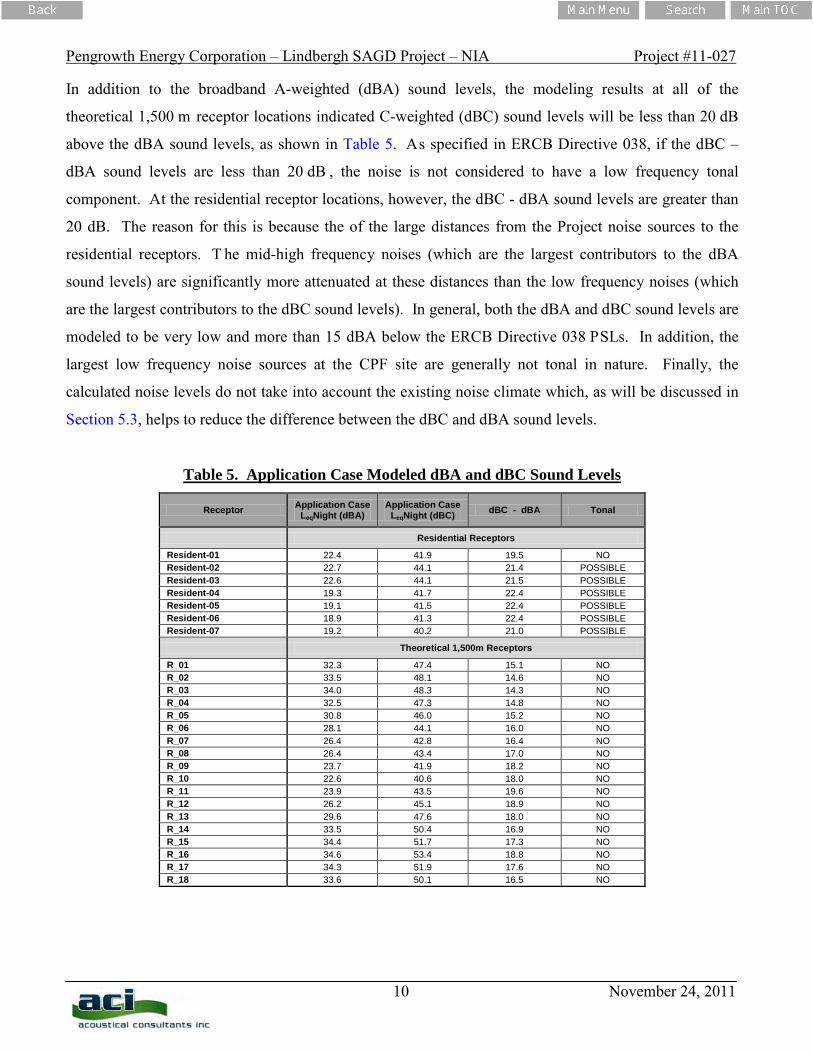
In addition to the broadband A-weighted (dBA) sound levels, the modeling results at all of the
theoretical 1,500 m receptor locations indicated C-weighted (dBC) sound levels will be less than 20 dB
above the dBA sound levels, as shown in Table 5. As specified in ERCB Directive 038, if the dBC –
dBA sound levels are less than 20 dB , the noise is not considered to have a low frequency tonal
component. At the residential receptor locations, however, the dBC - dBA sound levels are greater than
20 dB. The reason for this is because the of the large distances from the Project noise sources to the
residential receptors. T he mid-high frequency noises (which are the largest contributors to the dBA
sound levels) are significantly more attenuated at these distances than the low frequency noises (which
are the largest contributors to the dBC sound levels). In general, both the dBA and dBC sound levels are
modeled to be very low and more than 15 dBA below the ERCB Directive 038 PSLs. In addition, the
largest low frequency noise sources at the CPF site are generally not tonal in nature. Finally, the
calculated noise levels do not take into account the existing noise climate which, as will be discussed in
Section 5.3, helps to reduce the difference between the dBC and dBA sound levels.
Table 5. Application Case Modeled dBA and dBC Sound Levels
Receptor Application Case LeqNight (dBA)
Application Case LeqNight (dBC) dBC - dBA Tonal
Residential Receptors
Resident-01 22.4 41.9 19.5 NO Resident-02 22.7 44.1 21.4 POSSIBLE Resident-03 22.6 44.1 21.5 POSSIBLE Resident-04 19.3 41.7 22.4 POSSIBLE Resident-05 19.1 41.5 22.4 POSSIBLE Resident-06 18.9 41.3 22.4 POSSIBLE Resident-07 19.2 40.2 21.0 POSSIBLE
Theoretical 1,500m Receptors
R_01 32.3 47.4 15.1 NO R_02 33.5 48.1 14.6 NO R_03 34.0 48.3 14.3 NO R_04 32.5 47.3 14.8 NO R_05 30.8 46.0 15.2 NO R_06 28.1 44.1 16.0 NO R_07 26.4 42.8 16.4 NO R_08 26.4 43.4 17.0 NO R_09 23.7 41.9 18.2 NO R_10 22.6 40.6 18.0 NO R_11 23.9 43.5 19.6 NO R_12 26.2 45.1 18.9 NO R_13 29.6 47.6 18.0 NO R_14 33.5 50.4 16.9 NO R_15 34.4 51.7 17.3 NO R_16 34.6 53.4 18.8 NO R_17 34.3 51.9 17.6 NO R_18 33.6 50.1 16.5 NO
Pengrowth Energy Corporation – Lindbergh SAGD Project – NIA Project #11-027
11 November 24, 2011
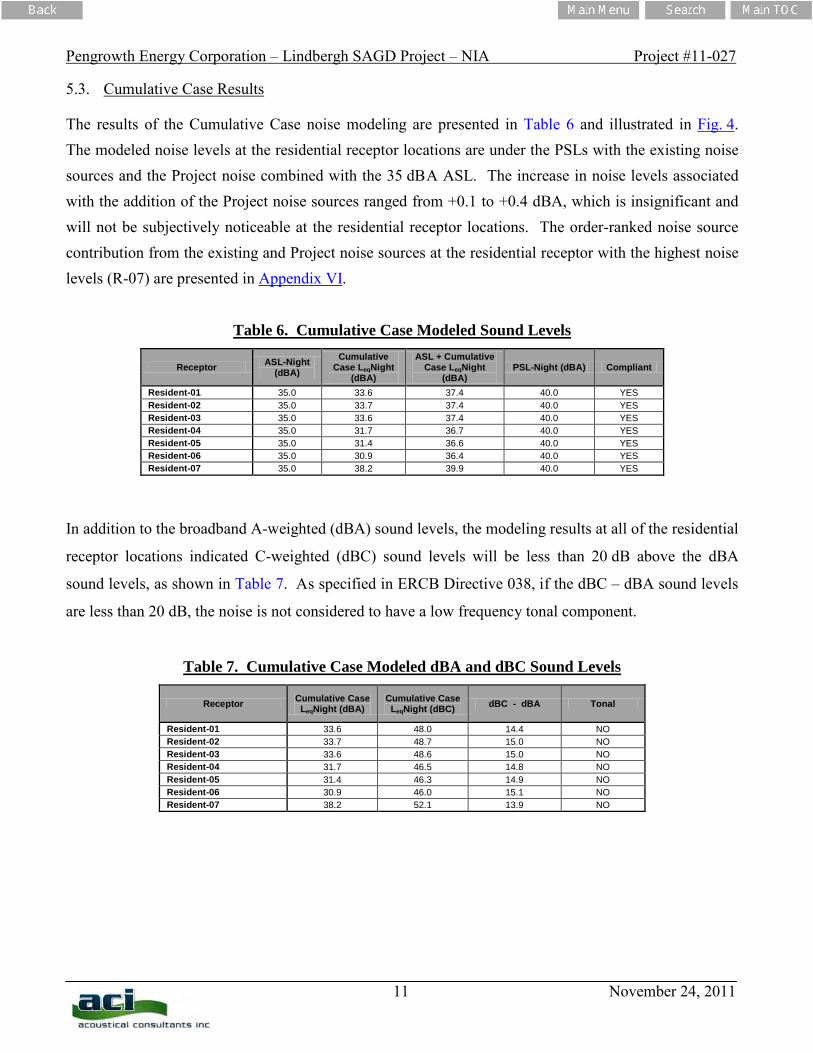
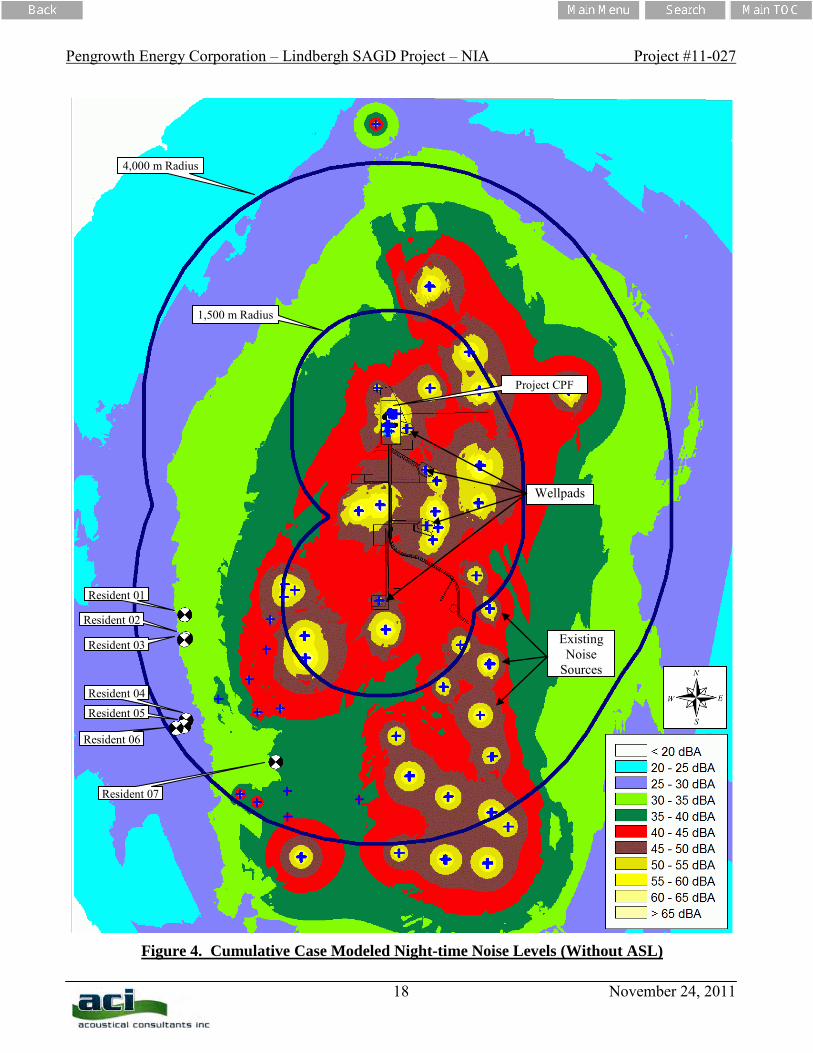
5.3. Cumulative Case Results
The results of the Cumulative Case noise modeling are presented in Table 6 and illustrated in Fig. 4. The modeled noise levels at the residential receptor locations are under the PSLs with the existing noise sources and the Project noise combined with the 35 dBA ASL. The increase in noise levels associated with the addition of the Project noise sources ranged from +0.1 to +0.4 dBA, which is insignificant and will not be subjectively noticeable at the residential receptor locations. The order-ranked noise source contribution from the existing and Project noise sources at the residential receptor with the highest noise levels (R-07) are presented in Appendix VI.
Table 6. Cumulative Case Modeled Sound Levels
Receptor ASL-Night (dBA)
Cumulative Case LeqNight
(dBA)
ASL + Cumulative Case LeqNight
(dBA) PSL-Night (dBA) Compliant
Resident-01 35.0 33.6 37.4 40.0 YES Resident-02 35.0 33.7 37.4 40.0 YES Resident-03 35.0 33.6 37.4 40.0 YES Resident-04 35.0 31.7 36.7 40.0 YES Resident-05 35.0 31.4 36.6 40.0 YES Resident-06 35.0 30.9 36.4 40.0 YES Resident-07 35.0 38.2 39.9 40.0 YES
In addition to the broadband A-weighted (dBA) sound levels, the modeling results at all of the residential
receptor locations indicated C-weighted (dBC) sound levels will be less than 20 dB above the dBA
sound levels, as shown in Table 7. As specified in ERCB Directive 038, if the dBC – dBA sound levels
are less than 20 dB, the noise is not considered to have a low frequency tonal component.
Table 7. Cumulative Case Modeled dBA and dBC Sound Levels
Receptor Cumulative Case LeqNight (dBA)
Cumulative Case LeqNight (dBC) dBC - dBA Tonal
Resident-01 33.6 48.0 14.4 NO Resident-02 33.7 48.7 15.0 NO Resident-03 33.6 48.6 15.0 NO Resident-04 31.7 46.5 14.8 NO Resident-05 31.4 46.3 14.9 NO Resident-06 30.9 46.0 15.1 NO Resident-07 38.2 52.1 13.9 NO
Pengrowth Energy Corporation – Lindbergh SAGD Project – NIA Project #11-027
12 November 24, 2011
5.4. Noise Mitigation Measures
The results of the noise modeling indicated that no specific additional noise mitigation measures are
required for the Project equipment.
5.4.1. Construction Noise
Although there are no specific construction noise level limits detailed by ERCB Directive 038, there are
general recommendations for construction noise mitigation. This includes all activities associated with
construction of the facility, well-pads (including drilling), borrow-pits, etc. The document states:
“While Directive 038 is not applicable to construction noise, licensees should attempt to take the following reasonable mitigating measures to reduce the impact on nearby dwellings of construction noise from new facilities or modifications to existing facilities. Licensees should:
- Conduct construction activity between the hours of 07:00 and 22:00 to reduce the potential impact of construction noise;
- Advise nearby residents of significant noise-causing activities and schedule these events to reduce disruption to them;
- Ensure all internal combustion engines are fitted with appropriate muffler systems; and
- Take advantage of acoustical screening from existing on-site buildings to shield dwellings from construction equipment noise.
Should a valid complaint be made during construction, the licensee is expected to respond expeditiously and take appropriate action to ensure that the issue has been managed responsibly.”
Pengrowth Energy Corporation – Lindbergh SAGD Project – NIA Project #11-027
13 November 24, 2011
6.0 Conclusion
The results of the noise modeling indicated Baseline Case noise levels associated with existing area
noise sources (with the average ambient sound level of 35 dBA included) are below the ERCB Directive
038 PSL of 40 dBA LeqNight for all residential receptors within approximately 4 km of the Project.
The Application Case noise levels associated with the Project (with the average ambient sound level of
35 dBA included) will be below the ERCB Directive 038 PSL of 40 dBA LeqNight for all surrounding
residential and theoretical 1,500 m receptors. The Project-only noise levels (i.e. no a verage ambient
sound level) were more than 5 dBA below the PSL at all of the receptors.
The Cumulative Case noise levels associated with the existing noise sources and Project noise sources
(with the average ambient sound level of 35 dBA included) will be below the ERCB Directive 038 PSL
of 40 dBA LeqNight for all residential receptors within approximately 4 km of the Project. In addition,
the dBC – dBA sound levels are projected to be less than 20 dB at all locations in the Cumulative Case.
As specified in ERCB Directive 038, if the dBC – dBA sound levels are less than 20 dB, the noise is not
considered to have a low frequency tonal component. As a result, no additional noise mitigation is
required.
A short form (ERCB form) noise impact assessment is presented in Appendix VII.
Pengrowth Energy Corporation – Lindbergh SAGD Project – NIA Project #11-027
14 November 24, 2011
7.0 References
- Alberta Energy Resources Conservation Board (ERCB), Directive 038 on Noise Control, 2007,
Calgary, Alberta.
- International Organization for Standardization (ISO), Standard 1996-1, Acoustics – Description,
measurement and assessment of environmental noise – Part 1: Basic quantities and assessment
procedures, 2003, Geneva Switzerland.
- International Organization for Standardization (ISO), Standard 9613-1, Acoustics – Attenuation
of sound during propagation outdoors – Part 1: Calculation of absorption of sound by the
atmosphere, 1993, Geneva Switzerland.
- International Organization for Standardization (ISO), Standard 9613-2, Acoustics – Attenuation
of sound during propagation outdoors – Part 2: General method of calculation, 1996, Geneva
Switzerland.
Pengrowth Energy Corporation – Lindbergh SAGD Project – NIA Project #11-027
15 November 24, 2011
Figure 1. Study Area
Pengrowth Energy Corporation – Lindbergh SAGD Project – NIA Project #11-027
16 November 24, 2011
Figure 2. Baseline Case Modeled Night-time Noise Levels (Without ASL)
4,000 m Radius
Existing Noise
Sources
Resident 01
Resident 02
Resident 03
Resident 04
Resident 05
Resident 06
Resident 07
1,500 m Radius
Pengrowth Energy Corporation – Lindbergh SAGD Project – NIA Project #11-027
17 November 24, 2011
Figure 3. Application Case Modeled Night-time Noise Levels (Without ASL)
4,000 m Radius
Wellpads
Resident 01
Resident 02
Resident 03
Resident 04
Resident 05
Resident 06
Resident 07
1,500 m Radius
Project CPF
R-01
R-02
R-03
R-04
R-05
R-06
R-07
R-18
R-17
R-16
R-15
R-14
R-13
R-08
R-09
R-10
R-12
R-11
Pengrowth Energy Corporation – Lindbergh SAGD Project – NIA Project #11-027
18 November 24, 2011
Figure 4. Cumulative Case Modeled Night-time Noise Levels (Without ASL)
4,000 m Radius
Existing Noise
Sources
Resident 01
Resident 02
Resident 03
Resident 04
Resident 05
Resident 06
Resident 07
1,500 m Radius
Wellpads
Project CPF
Pengrowth Energy Corporation – Lindbergh SAGD Project – NIA Project #11-027
19 November 24, 2011
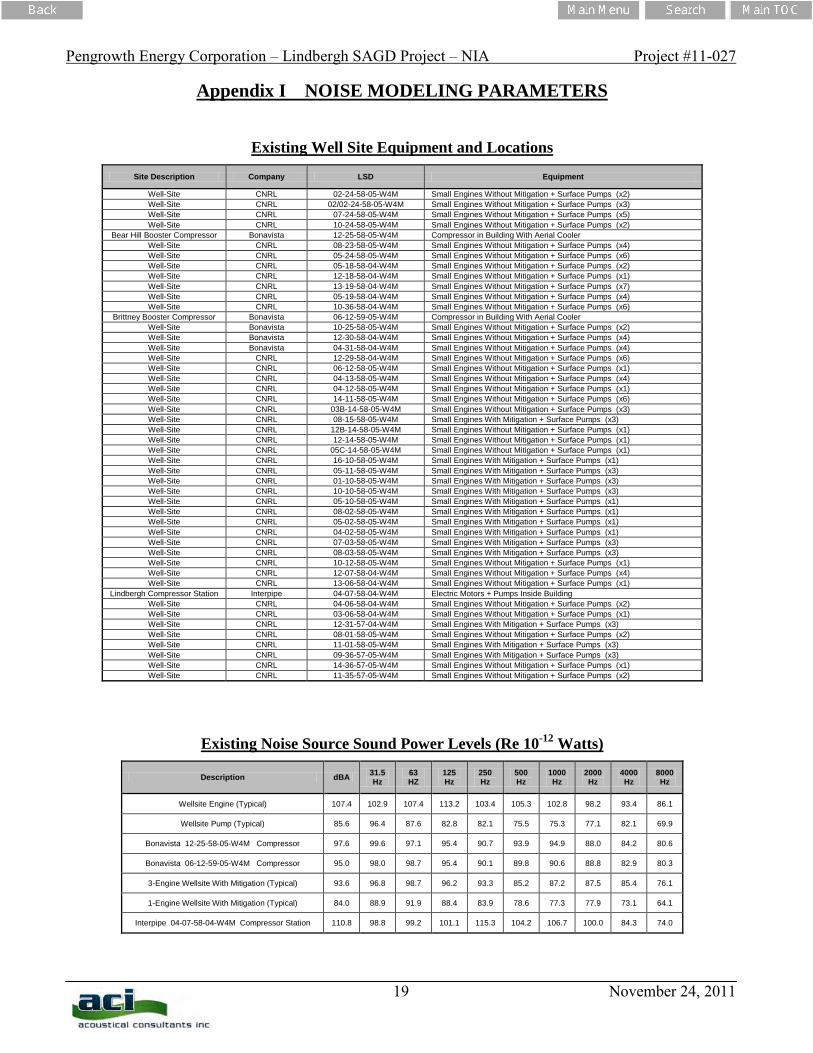
Appendix I NOISE MODELING PARAMETERS
Existing Well Site Equipment and Locations
Site Description Company LSD Equipment
Well-Site CNRL 02-24-58-05-W4M Small Engines Without Mitigation + Surface Pumps (x2) Well-Site CNRL 02/02-24-58-05-W4M Small Engines Without Mitigation + Surface Pumps (x3) Well-Site CNRL 07-24-58-05-W4M Small Engines Without Mitigation + Surface Pumps (x5) Well-Site CNRL 10-24-58-05-W4M Small Engines Without Mitigation + Surface Pumps (x2)
Bear Hill Booster Compressor Bonavista 12-25-58-05-W4M Compressor in Building With Aerial Cooler Well-Site CNRL 08-23-58-05-W4M Small Engines Without Mitigation + Surface Pumps (x4) Well-Site CNRL 05-24-58-05-W4M Small Engines Without Mitigation + Surface Pumps (x6) Well-Site CNRL 05-18-58-04-W4M Small Engines Without Mitigation + Surface Pumps (x2) Well-Site CNRL 12-18-58-04-W4M Small Engines Without Mitigation + Surface Pumps (x1) Well-Site CNRL 13-19-58-04-W4M Small Engines Without Mitigation + Surface Pumps (x7) Well-Site CNRL 05-19-58-04-W4M Small Engines Without Mitigation + Surface Pumps (x4) Well-Site CNRL 10-36-58-04-W4M Small Engines Without Mitigation + Surface Pumps (x6)
Brittney Booster Compressor Bonavista 06-12-59-05-W4M Compressor in Building With Aerial Cooler Well-Site Bonavista 10-25-58-05-W4M Small Engines Without Mitigation + Surface Pumps (x2) Well-Site Bonavista 12-30-58-04-W4M Small Engines Without Mitigation + Surface Pumps (x4) Well-Site Bonavista 04-31-58-04-W4M Small Engines Without Mitigation + Surface Pumps (x4) Well-Site CNRL 12-29-58-04-W4M Small Engines Without Mitigation + Surface Pumps (x6) Well-Site CNRL 06-12-58-05-W4M Small Engines Without Mitigation + Surface Pumps (x1) Well-Site CNRL 04-13-58-05-W4M Small Engines Without Mitigation + Surface Pumps (x4) Well-Site CNRL 04-12-58-05-W4M Small Engines Without Mitigation + Surface Pumps (x1) Well-Site CNRL 14-11-58-05-W4M Small Engines Without Mitigation + Surface Pumps (x6) Well-Site CNRL 03B-14-58-05-W4M Small Engines Without Mitigation + Surface Pumps (x3) Well-Site CNRL 08-15-58-05-W4M Small Engines With Mitigation + Surface Pumps (x3) Well-Site CNRL 12B-14-58-05-W4M Small Engines Without Mitigation + Surface Pumps (x1) Well-Site CNRL 12-14-58-05-W4M Small Engines Without Mitigation + Surface Pumps (x1) Well-Site CNRL 05C-14-58-05-W4M Small Engines Without Mitigation + Surface Pumps (x1) Well-Site CNRL 16-10-58-05-W4M Small Engines With Mitigation + Surface Pumps (x1) Well-Site CNRL 05-11-58-05-W4M Small Engines With Mitigation + Surface Pumps (x3) Well-Site CNRL 01-10-58-05-W4M Small Engines With Mitigation + Surface Pumps (x3) Well-Site CNRL 10-10-58-05-W4M Small Engines With Mitigation + Surface Pumps (x3) Well-Site CNRL 05-10-58-05-W4M Small Engines With Mitigation + Surface Pumps (x1) Well-Site CNRL 08-02-58-05-W4M Small Engines With Mitigation + Surface Pumps (x1) Well-Site CNRL 05-02-58-05-W4M Small Engines With Mitigation + Surface Pumps (x1) Well-Site CNRL 04-02-58-05-W4M Small Engines With Mitigation + Surface Pumps (x1) Well-Site CNRL 07-03-58-05-W4M Small Engines With Mitigation + Surface Pumps (x3) Well-Site CNRL 08-03-58-05-W4M Small Engines With Mitigation + Surface Pumps (x3) Well-Site CNRL 10-12-58-05-W4M Small Engines Without Mitigation + Surface Pumps (x1) Well-Site CNRL 12-07-58-04-W4M Small Engines Without Mitigation + Surface Pumps (x4) Well-Site CNRL 13-06-58-04-W4M Small Engines Without Mitigation + Surface Pumps (x1)
Lindbergh Compressor Station Interpipe 04-07-58-04-W4M Electric Motors + Pumps Inside Building Well-Site CNRL 04-06-58-04-W4M Small Engines Without Mitigation + Surface Pumps (x2) Well-Site CNRL 03-06-58-04-W4M Small Engines Without Mitigation + Surface Pumps (x1) Well-Site CNRL 12-31-57-04-W4M Small Engines With Mitigation + Surface Pumps (x3) Well-Site CNRL 08-01-58-05-W4M Small Engines Without Mitigation + Surface Pumps (x2) Well-Site CNRL 11-01-58-05-W4M Small Engines With Mitigation + Surface Pumps (x3) Well-Site CNRL 09-36-57-05-W4M Small Engines With Mitigation + Surface Pumps (x3) Well-Site CNRL 14-36-57-05-W4M Small Engines Without Mitigation + Surface Pumps (x1) Well-Site CNRL 11-35-57-05-W4M Small Engines Without Mitigation + Surface Pumps (x2)
Existing Noise Source Sound Power Levels (Re 10-12 Watts)
Description dBA 31.5 Hz
63 HZ
125 Hz
250 Hz
500 Hz
1000 Hz
2000 Hz
4000 Hz
8000 Hz
Wellsite Engine (Typical) 107.4 102.9 107.4 113.2 103.4 105.3 102.8 98.2 93.4 86.1
Wellsite Pump (Typical) 85.6 96.4 87.6 82.8 82.1 75.5 75.3 77.1 82.1 69.9
Bonavista 12-25-58-05-W4M Compressor 97.6 99.6 97.1 95.4 90.7 93.9 94.9 88.0 84.2 80.6
Bonavista 06-12-59-05-W4M Compressor 95.0 98.0 98.7 95.4 90.1 89.8 90.6 88.8 82.9 80.3
3-Engine Wellsite With Mitigation (Typical) 93.6 96.8 98.7 96.2 93.3 85.2 87.2 87.5 85.4 76.1
1-Engine Wellsite With Mitigation (Typical) 84.0 88.9 91.9 88.4 83.9 78.6 77.3 77.9 73.1 64.1
Interpipe 04-07-58-04-W4M Compressor Station 110.8 98.8 99.2 101.1 115.3 104.2 106.7 100.0 84.3 74.0
Pengrowth Energy Corporation – Lindbergh SAGD Project – NIA Project #11-027
20 November 24, 2011
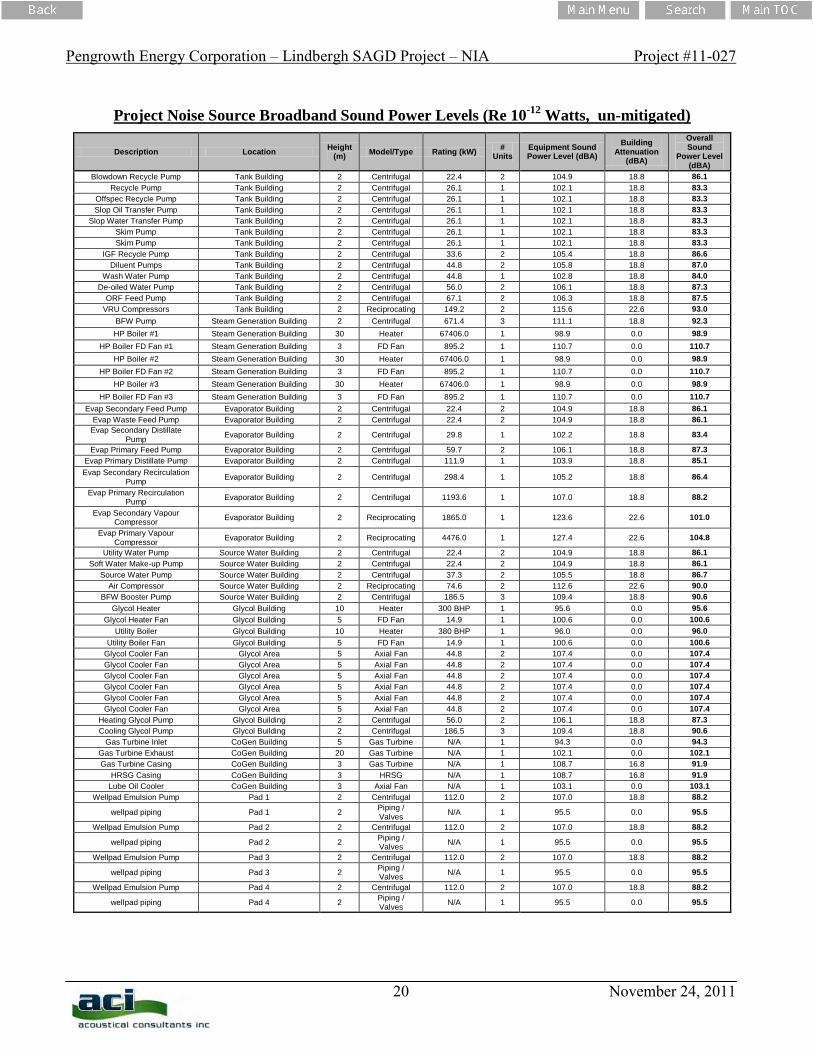
Project Noise Source Broadband Sound Power Levels (Re 10-12 Watts, un-mitigated)
Description Location Height (m) Model/Type Rating (kW) #
Units Equipment Sound Power Level (dBA)
Building Attenuation
(dBA)
Overall Sound
Power Level (dBA)
Blowdown Recycle Pump Tank Building 2 Centrifugal 22.4 2 104.9 18.8 86.1 Recycle Pump Tank Building 2 Centrifugal 26.1 1 102.1 18.8 83.3
Offspec Recycle Pump Tank Building 2 Centrifugal 26.1 1 102.1 18.8 83.3 Slop Oil Transfer Pump Tank Building 2 Centrifugal 26.1 1 102.1 18.8 83.3
Slop Water Transfer Pump Tank Building 2 Centrifugal 26.1 1 102.1 18.8 83.3 Skim Pump Tank Building 2 Centrifugal 26.1 1 102.1 18.8 83.3 Skim Pump Tank Building 2 Centrifugal 26.1 1 102.1 18.8 83.3
IGF Recycle Pump Tank Building 2 Centrifugal 33.6 2 105.4 18.8 86.6 Diluent Pumps Tank Building 2 Centrifugal 44.8 2 105.8 18.8 87.0
Wash Water Pump Tank Building 2 Centrifugal 44.8 1 102.8 18.8 84.0 De-oiled Water Pump Tank Building 2 Centrifugal 56.0 2 106.1 18.8 87.3
ORF Feed Pump Tank Building 2 Centrifugal 67.1 2 106.3 18.8 87.5 VRU Compressors Tank Building 2 Reciprocating 149.2 2 115.6 22.6 93.0
BFW Pump Steam Generation Building 2 Centrifugal 671.4 3 111.1 18.8 92.3 HP Boiler #1 Steam Generation Building 30 Heater 67406.0 1 98.9 0.0 98.9
HP Boiler FD Fan #1 Steam Generation Building 3 FD Fan 895.2 1 110.7 0.0 110.7 HP Boiler #2 Steam Generation Building 30 Heater 67406.0 1 98.9 0.0 98.9
HP Boiler FD Fan #2 Steam Generation Building 3 FD Fan 895.2 1 110.7 0.0 110.7 HP Boiler #3 Steam Generation Building 30 Heater 67406.0 1 98.9 0.0 98.9
HP Boiler FD Fan #3 Steam Generation Building 3 FD Fan 895.2 1 110.7 0.0 110.7 Evap Secondary Feed Pump Evaporator Building 2 Centrifugal 22.4 2 104.9 18.8 86.1
Evap Waste Feed Pump Evaporator Building 2 Centrifugal 22.4 2 104.9 18.8 86.1 Evap Secondary Distillate
Pump Evaporator Building 2 Centrifugal 29.8 1 102.2 18.8 83.4
Evap Primary Feed Pump Evaporator Building 2 Centrifugal 59.7 2 106.1 18.8 87.3 Evap Primary Distillate Pump Evaporator Building 2 Centrifugal 111.9 1 103.9 18.8 85.1 Evap Secondary Recirculation
Pump Evaporator Building 2 Centrifugal 298.4 1 105.2 18.8 86.4
Evap Primary Recirculation Pump Evaporator Building 2 Centrifugal 1193.6 1 107.0 18.8 88.2
Evap Secondary Vapour Compressor Evaporator Building 2 Reciprocating 1865.0 1 123.6 22.6 101.0
Evap Primary Vapour Compressor Evaporator Building 2 Reciprocating 4476.0 1 127.4 22.6 104.8
Utility Water Pump Source Water Building 2 Centrifugal 22.4 2 104.9 18.8 86.1 Soft Water Make-up Pump Source Water Building 2 Centrifugal 22.4 2 104.9 18.8 86.1
Source Water Pump Source Water Building 2 Centrifugal 37.3 2 105.5 18.8 86.7 Air Compressor Source Water Building 2 Reciprocating 74.6 2 112.6 22.6 90.0
BFW Booster Pump Source Water Building 2 Centrifugal 186.5 3 109.4 18.8 90.6 Glycol Heater Glycol Building 10 Heater 300 BHP 1 95.6 0.0 95.6
Glycol Heater Fan Glycol Building 5 FD Fan 14.9 1 100.6 0.0 100.6 Utility Boiler Glycol Building 10 Heater 380 BHP 1 96.0 0.0 96.0
Utility Boiler Fan Glycol Building 5 FD Fan 14.9 1 100.6 0.0 100.6 Glycol Cooler Fan Glycol Area 5 Axial Fan 44.8 2 107.4 0.0 107.4 Glycol Cooler Fan Glycol Area 5 Axial Fan 44.8 2 107.4 0.0 107.4 Glycol Cooler Fan Glycol Area 5 Axial Fan 44.8 2 107.4 0.0 107.4 Glycol Cooler Fan Glycol Area 5 Axial Fan 44.8 2 107.4 0.0 107.4 Glycol Cooler Fan Glycol Area 5 Axial Fan 44.8 2 107.4 0.0 107.4 Glycol Cooler Fan Glycol Area 5 Axial Fan 44.8 2 107.4 0.0 107.4
Heating Glycol Pump Glycol Building 2 Centrifugal 56.0 2 106.1 18.8 87.3 Cooling Glycol Pump Glycol Building 2 Centrifugal 186.5 3 109.4 18.8 90.6
Gas Turbine Inlet CoGen Building 5 Gas Turbine N/A 1 94.3 0.0 94.3 Gas Turbine Exhaust CoGen Building 20 Gas Turbine N/A 1 102.1 0.0 102.1 Gas Turbine Casing CoGen Building 3 Gas Turbine N/A 1 108.7 16.8 91.9
HRSG Casing CoGen Building 3 HRSG N/A 1 108.7 16.8 91.9 Lube Oil Cooler CoGen Building 3 Axial Fan N/A 1 103.1 0.0 103.1
Wellpad Emulsion Pump Pad 1 2 Centrifugal 112.0 2 107.0 18.8 88.2
wellpad piping Pad 1 2 Piping / Valves N/A 1 95.5 0.0 95.5
Wellpad Emulsion Pump Pad 2 2 Centrifugal 112.0 2 107.0 18.8 88.2
wellpad piping Pad 2 2 Piping / Valves N/A 1 95.5 0.0 95.5
Wellpad Emulsion Pump Pad 3 2 Centrifugal 112.0 2 107.0 18.8 88.2
wellpad piping Pad 3 2 Piping / Valves N/A 1 95.5 0.0 95.5
Wellpad Emulsion Pump Pad 4 2 Centrifugal 112.0 2 107.0 18.8 88.2
wellpad piping Pad 4 2 Piping / Valves N/A 1 95.5 0.0 95.5
Pengrowth Energy Corporation – Lindbergh SAGD Project – NIA Project #11-027
21 November 24, 2011
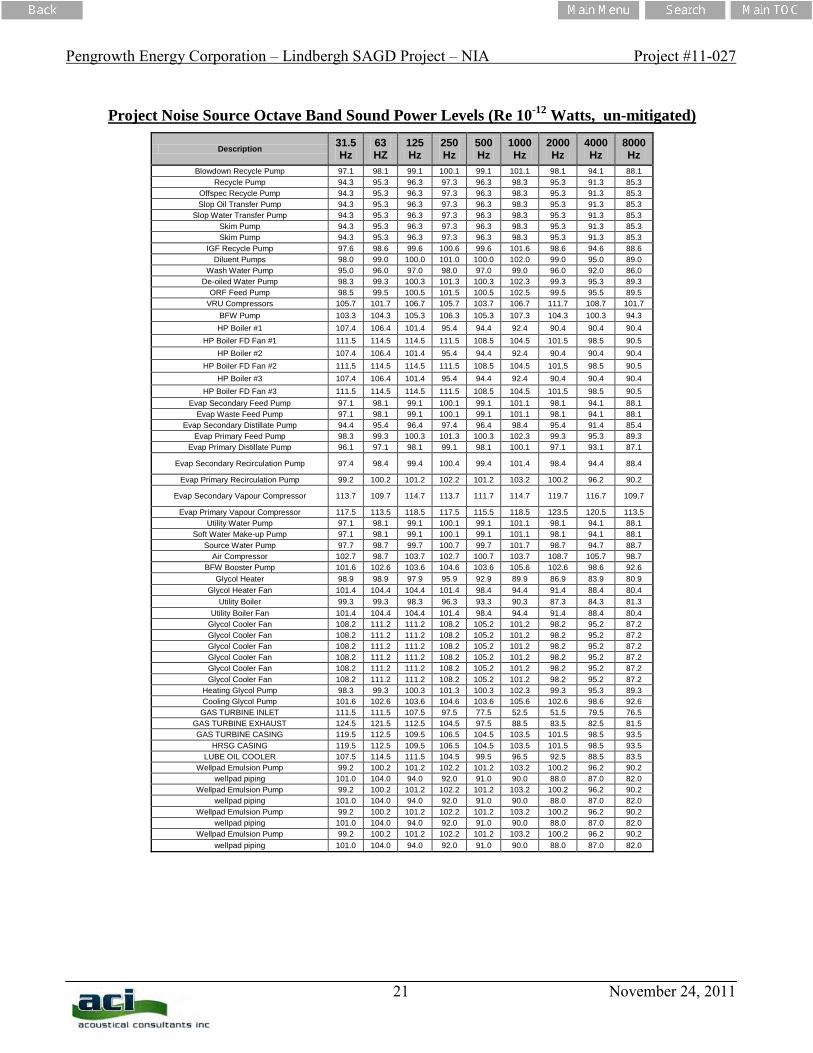
Project Noise Source Octave Band Sound Power Levels (Re 10-12 Watts, un-mitigated)
Description 31.5 Hz
63 HZ
125 Hz
250 Hz
500 Hz
1000 Hz
2000 Hz
4000 Hz
8000 Hz
Blowdown Recycle Pump 97.1 98.1 99.1 100.1 99.1 101.1 98.1 94.1 88.1 Recycle Pump 94.3 95.3 96.3 97.3 96.3 98.3 95.3 91.3 85.3
Offspec Recycle Pump 94.3 95.3 96.3 97.3 96.3 98.3 95.3 91.3 85.3 Slop Oil Transfer Pump 94.3 95.3 96.3 97.3 96.3 98.3 95.3 91.3 85.3
Slop Water Transfer Pump 94.3 95.3 96.3 97.3 96.3 98.3 95.3 91.3 85.3 Skim Pump 94.3 95.3 96.3 97.3 96.3 98.3 95.3 91.3 85.3 Skim Pump 94.3 95.3 96.3 97.3 96.3 98.3 95.3 91.3 85.3
IGF Recycle Pump 97.6 98.6 99.6 100.6 99.6 101.6 98.6 94.6 88.6 Diluent Pumps 98.0 99.0 100.0 101.0 100.0 102.0 99.0 95.0 89.0
Wash Water Pump 95.0 96.0 97.0 98.0 97.0 99.0 96.0 92.0 86.0 De-oiled Water Pump 98.3 99.3 100.3 101.3 100.3 102.3 99.3 95.3 89.3
ORF Feed Pump 98.5 99.5 100.5 101.5 100.5 102.5 99.5 95.5 89.5 VRU Compressors 105.7 101.7 106.7 105.7 103.7 106.7 111.7 108.7 101.7
BFW Pump 103.3 104.3 105.3 106.3 105.3 107.3 104.3 100.3 94.3 HP Boiler #1 107.4 106.4 101.4 95.4 94.4 92.4 90.4 90.4 90.4
HP Boiler FD Fan #1 111.5 114.5 114.5 111.5 108.5 104.5 101.5 98.5 90.5 HP Boiler #2 107.4 106.4 101.4 95.4 94.4 92.4 90.4 90.4 90.4
HP Boiler FD Fan #2 111.5 114.5 114.5 111.5 108.5 104.5 101.5 98.5 90.5 HP Boiler #3 107.4 106.4 101.4 95.4 94.4 92.4 90.4 90.4 90.4
HP Boiler FD Fan #3 111.5 114.5 114.5 111.5 108.5 104.5 101.5 98.5 90.5 Evap Secondary Feed Pump 97.1 98.1 99.1 100.1 99.1 101.1 98.1 94.1 88.1
Evap Waste Feed Pump 97.1 98.1 99.1 100.1 99.1 101.1 98.1 94.1 88.1 Evap Secondary Distillate Pump 94.4 95.4 96.4 97.4 96.4 98.4 95.4 91.4 85.4
Evap Primary Feed Pump 98.3 99.3 100.3 101.3 100.3 102.3 99.3 95.3 89.3 Evap Primary Distillate Pump 96.1 97.1 98.1 99.1 98.1 100.1 97.1 93.1 87.1
Evap Secondary Recirculation Pump 97.4 98.4 99.4 100.4 99.4 101.4 98.4 94.4 88.4
Evap Primary Recirculation Pump 99.2 100.2 101.2 102.2 101.2 103.2 100.2 96.2 90.2
Evap Secondary Vapour Compressor 113.7 109.7 114.7 113.7 111.7 114.7 119.7 116.7 109.7
Evap Primary Vapour Compressor 117.5 113.5 118.5 117.5 115.5 118.5 123.5 120.5 113.5 Utility Water Pump 97.1 98.1 99.1 100.1 99.1 101.1 98.1 94.1 88.1
Soft Water Make-up Pump 97.1 98.1 99.1 100.1 99.1 101.1 98.1 94.1 88.1 Source Water Pump 97.7 98.7 99.7 100.7 99.7 101.7 98.7 94.7 88.7
Air Compressor 102.7 98.7 103.7 102.7 100.7 103.7 108.7 105.7 98.7 BFW Booster Pump 101.6 102.6 103.6 104.6 103.6 105.6 102.6 98.6 92.6
Glycol Heater 98.9 98.9 97.9 95.9 92.9 89.9 86.9 83.9 80.9 Glycol Heater Fan 101.4 104.4 104.4 101.4 98.4 94.4 91.4 88.4 80.4
Utility Boiler 99.3 99.3 98.3 96.3 93.3 90.3 87.3 84.3 81.3 Utility Boiler Fan 101.4 104.4 104.4 101.4 98.4 94.4 91.4 88.4 80.4
Glycol Cooler Fan 108.2 111.2 111.2 108.2 105.2 101.2 98.2 95.2 87.2 Glycol Cooler Fan 108.2 111.2 111.2 108.2 105.2 101.2 98.2 95.2 87.2 Glycol Cooler Fan 108.2 111.2 111.2 108.2 105.2 101.2 98.2 95.2 87.2 Glycol Cooler Fan 108.2 111.2 111.2 108.2 105.2 101.2 98.2 95.2 87.2 Glycol Cooler Fan 108.2 111.2 111.2 108.2 105.2 101.2 98.2 95.2 87.2 Glycol Cooler Fan 108.2 111.2 111.2 108.2 105.2 101.2 98.2 95.2 87.2
Heating Glycol Pump 98.3 99.3 100.3 101.3 100.3 102.3 99.3 95.3 89.3 Cooling Glycol Pump 101.6 102.6 103.6 104.6 103.6 105.6 102.6 98.6 92.6
GAS TURBINE INLET 111.5 111.5 107.5 97.5 77.5 52.5 51.5 79.5 76.5 GAS TURBINE EXHAUST 124.5 121.5 112.5 104.5 97.5 88.5 83.5 82.5 81.5 GAS TURBINE CASING 119.5 112.5 109.5 106.5 104.5 103.5 101.5 98.5 93.5
HRSG CASING 119.5 112.5 109.5 106.5 104.5 103.5 101.5 98.5 93.5 LUBE OIL COOLER 107.5 114.5 111.5 104.5 99.5 96.5 92.5 88.5 83.5
Wellpad Emulsion Pump 99.2 100.2 101.2 102.2 101.2 103.2 100.2 96.2 90.2 wellpad piping 101.0 104.0 94.0 92.0 91.0 90.0 88.0 87.0 82.0
Wellpad Emulsion Pump 99.2 100.2 101.2 102.2 101.2 103.2 100.2 96.2 90.2 wellpad piping 101.0 104.0 94.0 92.0 91.0 90.0 88.0 87.0 82.0
Wellpad Emulsion Pump 99.2 100.2 101.2 102.2 101.2 103.2 100.2 96.2 90.2 wellpad piping 101.0 104.0 94.0 92.0 91.0 90.0 88.0 87.0 82.0
Wellpad Emulsion Pump 99.2 100.2 101.2 102.2 101.2 103.2 100.2 96.2 90.2 wellpad piping 101.0 104.0 94.0 92.0 91.0 90.0 88.0 87.0 82.0
Pengrowth Energy Corporation – Lindbergh SAGD Project – NIA Project #11-027
22 November 24, 2011
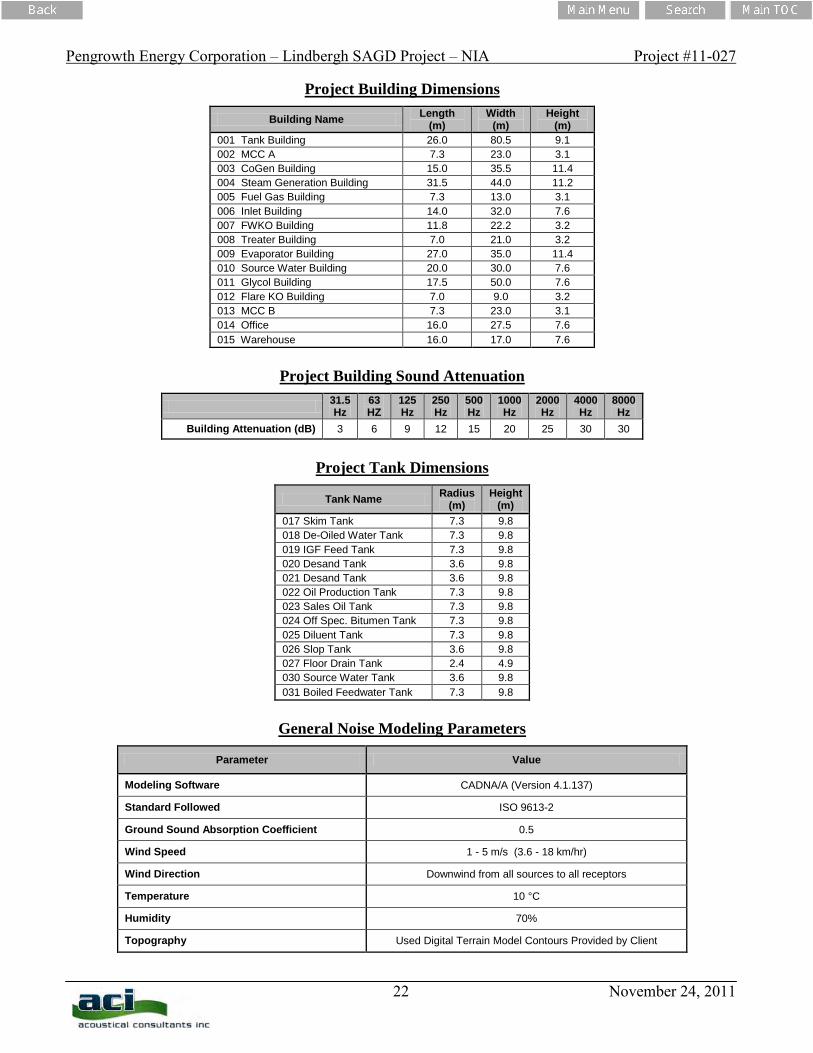
Project Building Dimensions
Building Name Length (m)
Width (m)
Height (m)
001 Tank Building 26.0 80.5 9.1 002 MCC A 7.3 23.0 3.1 003 CoGen Building 15.0 35.5 11.4 004 Steam Generation Building 31.5 44.0 11.2 005 Fuel Gas Building 7.3 13.0 3.1 006 Inlet Building 14.0 32.0 7.6 007 FWKO Building 11.8 22.2 3.2 008 Treater Building 7.0 21.0 3.2 009 Evaporator Building 27.0 35.0 11.4 010 Source Water Building 20.0 30.0 7.6 011 Glycol Building 17.5 50.0 7.6 012 Flare KO Building 7.0 9.0 3.2 013 MCC B 7.3 23.0 3.1 014 Office 16.0 27.5 7.6 015 Warehouse 16.0 17.0 7.6
Project Building Sound Attenuation
31.5 Hz
63 HZ
125 Hz
250 Hz
500 Hz
1000 Hz
2000 Hz
4000 Hz
8000 Hz
Building Attenuation (dB) 3 6 9 12 15 20 25 30 30
Project Tank Dimensions
Tank Name Radius (m)
Height (m)
017 Skim Tank 7.3 9.8 018 De-Oiled Water Tank 7.3 9.8 019 IGF Feed Tank 7.3 9.8 020 Desand Tank 3.6 9.8 021 Desand Tank 3.6 9.8 022 Oil Production Tank 7.3 9.8 023 Sales Oil Tank 7.3 9.8 024 Off Spec. Bitumen Tank 7.3 9.8 025 Diluent Tank 7.3 9.8 026 Slop Tank 3.6 9.8 027 Floor Drain Tank 2.4 4.9 030 Source Water Tank 3.6 9.8 031 Boiled Feedwater Tank 7.3 9.8
General Noise Modeling Parameters
Parameter Value
Modeling Software CADNA/A (Version 4.1.137)
Standard Followed ISO 9613-2
Ground Sound Absorption Coefficient 0.5
Wind Speed 1 - 5 m/s (3.6 - 18 km/hr)
Wind Direction Downwind from all sources to all receptors
Temperature 10 °C
Humidity 70%
Topography Used Digital Terrain Model Contours Provided by Client
Pengrowth Energy Corporation – Lindbergh SAGD Project – NIA Project #11-027
23 November 24, 2011
Appendix II MEASUREMENT EQUIPMENT USED
The sound level measurement equipment used consisted of a Brüel and Kjær Type 2250 Precision Integrating Sound Level Meter on a tripod with a windscreen. The system acquired data for a minimum of 30-second Leq samples using 1/3 octave band frequency analysis and overall A-weighted and C-weighted sound levels. The sound level meter conforms to Type 1, ANSI S1.4, ANSI S1.43, IEC 61672-1, IEC 60651, IEC 60804 and DIN 45657. The 1/3 octave filters conform to S1.11 – Type 0-C, and IEC 61260 – Class 0. T he calibrator conforms to IEC 942 and ANSI S1.40. The sound level meter, pre-amplifier and microphone were certified on November 2, 2009 and the calibrator (type B&K 4231) was certified on November 4, 2010 by a NIST NVLAP Accredited Calibration Laboratory for all requirements of ISO 17025: 1999 a nd relevant requirements of ISO 9002:1994, ISO 9001:2000 and ANSI/NCSL Z540: 1994 P art 1. A ll measurement methods and instrumentation conform to the requirements of the ERCB Directive 038. Refer to the next section in the Appendix for a detailed description of the various acoustical descriptive terms used.
Pengrowth Energy Corporation – Lindbergh SAGD Project – NIA Project #11-027
24 November 24, 2011
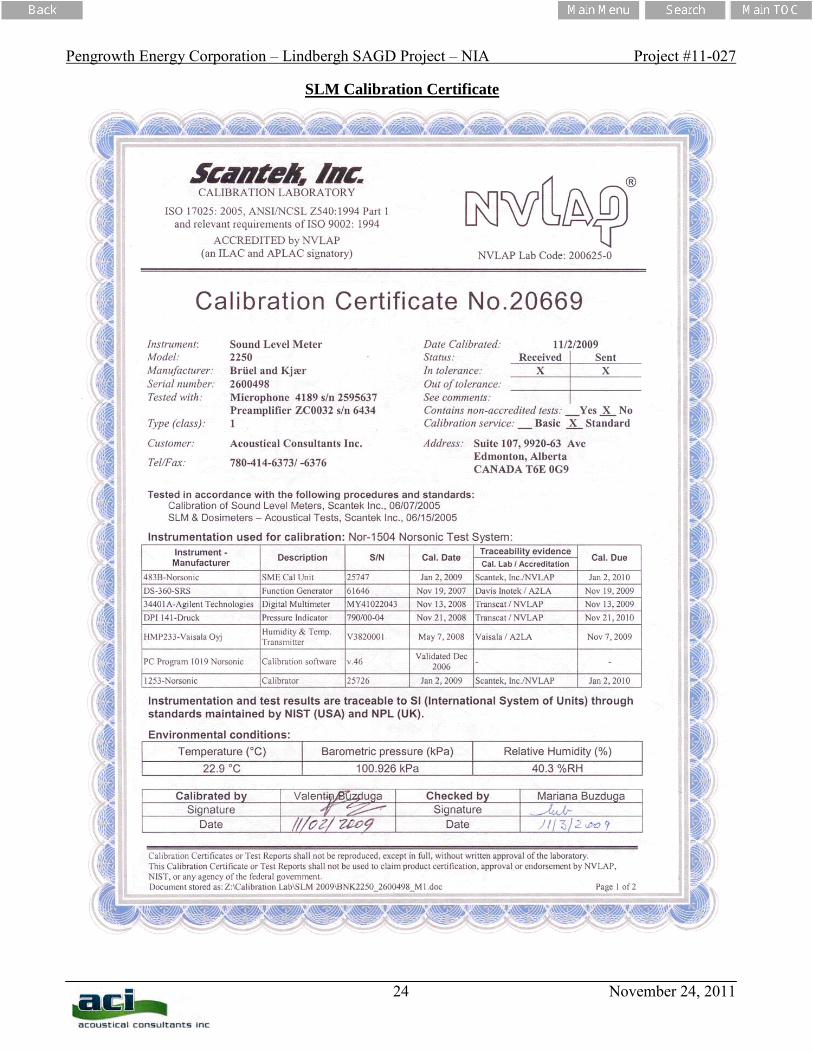
SLM Calibration Certificate
Pengrowth Energy Corporation – Lindbergh SAGD Project – NIA Project #11-027
25 November 24, 2011
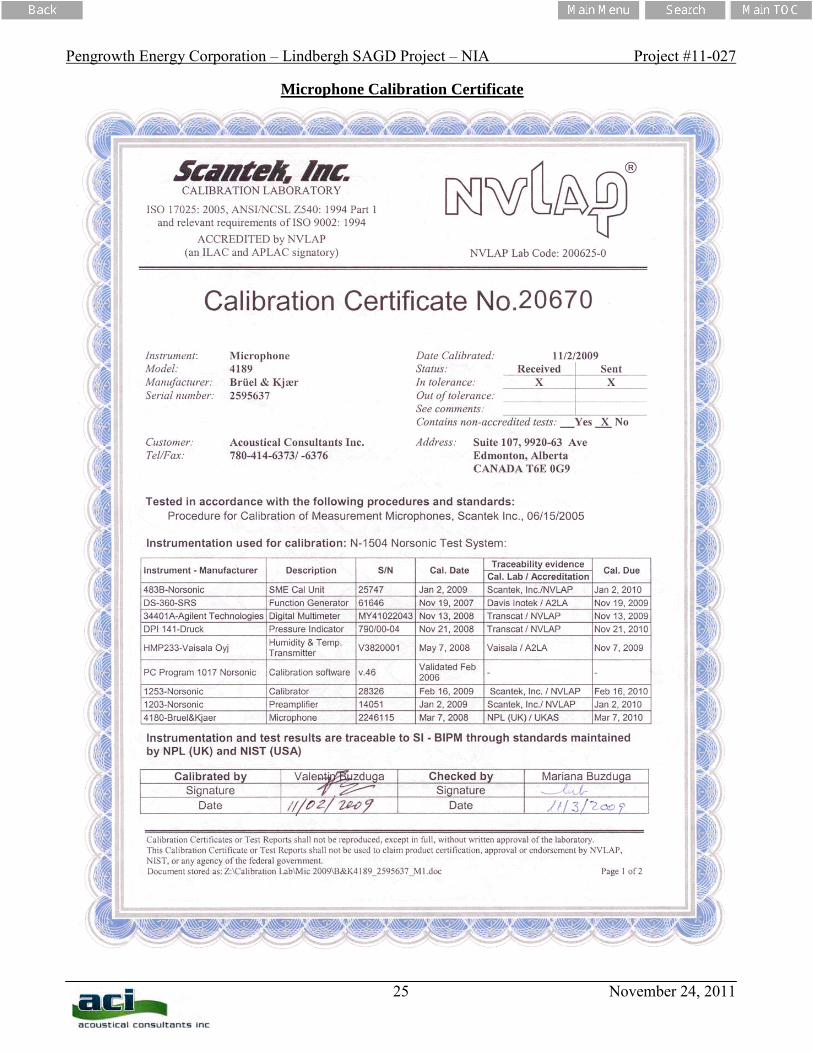
Microphone Calibration Certificate
Pengrowth Energy Corporation – Lindbergh SAGD Project – NIA Project #11-027
26 November 24, 2011
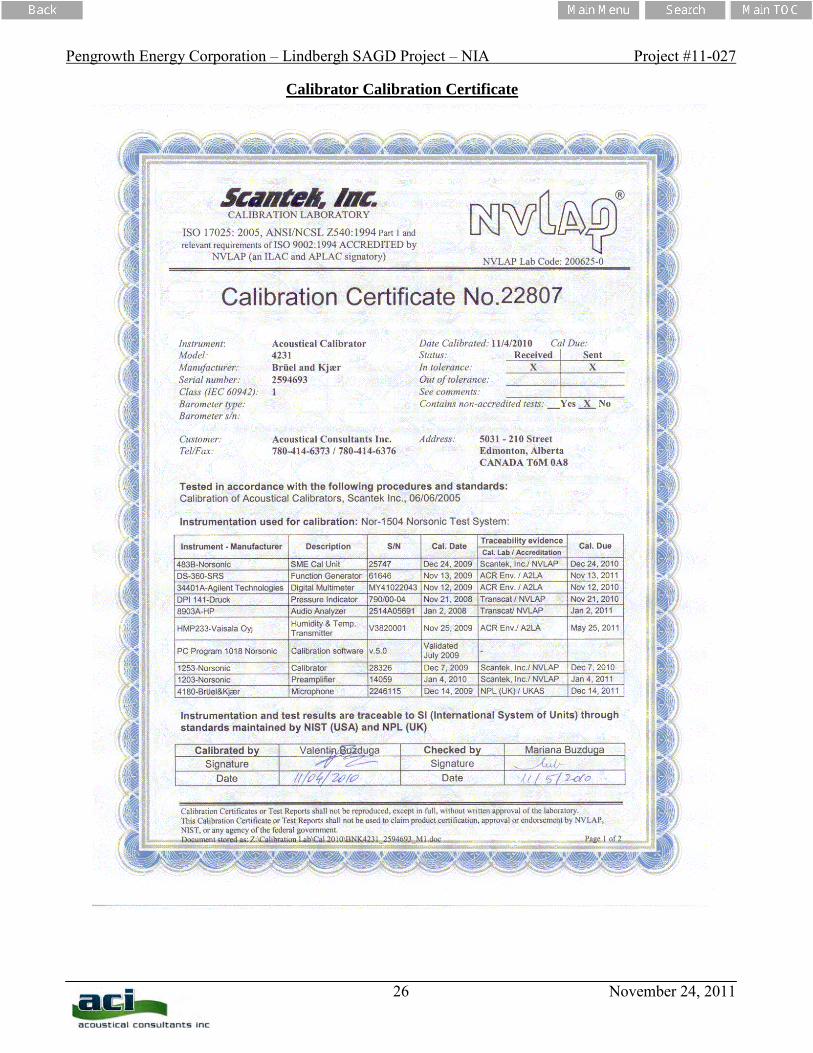
Calibrator Calibration Certificate
Pengrowth Energy Corporation – Lindbergh SAGD Project – NIA Project #11-027
27 November 24, 2011
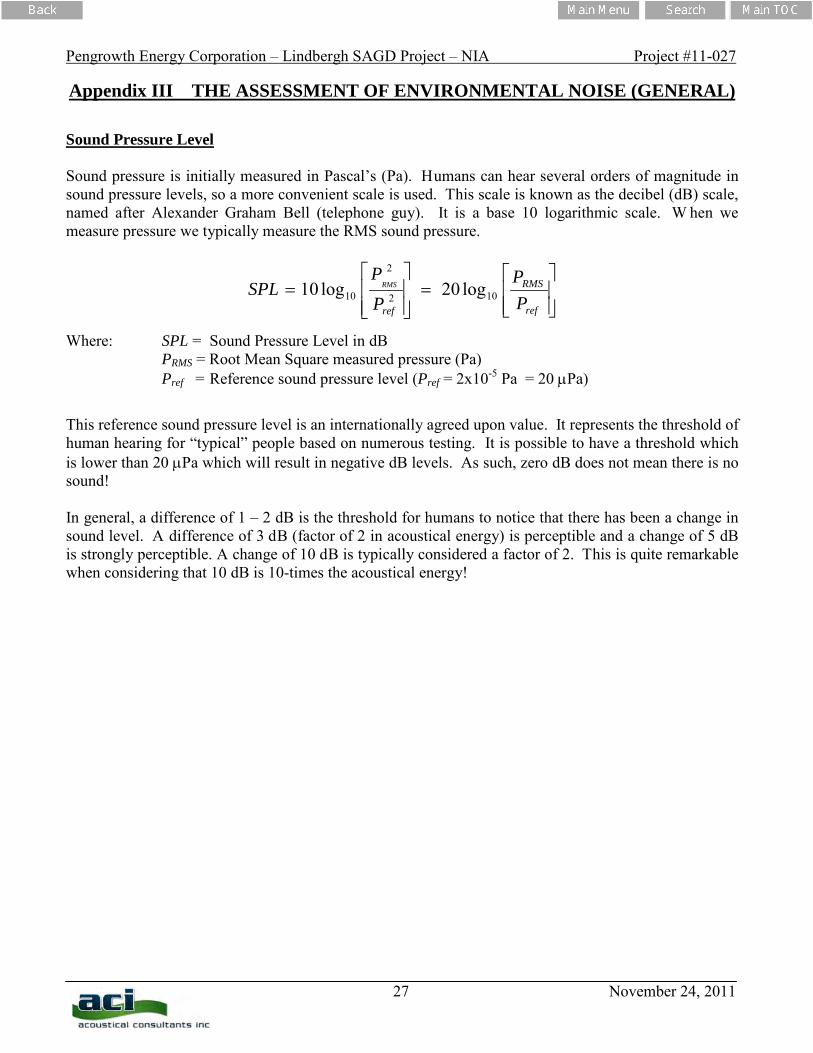
Appendix III THE ASSESSMENT OF ENVIRONMENTAL NOISE (GENERAL) Sound Pressure Level Sound pressure is initially measured in Pascal’s (Pa). Humans can hear several orders of magnitude in sound pressure levels, so a more convenient scale is used. This scale is known as the decibel (dB) scale, named after Alexander Graham Bell (telephone guy). It is a base 10 logarithmic scale. W hen we measure pressure we typically measure the RMS sound pressure.
=
=
ref
RMS
ref PP
PP
SPL RMS102
2
10 log20log10
Where: SPL = Sound Pressure Level in dB PRMS = Root Mean Square measured pressure (Pa) Pref = Reference sound pressure level (Pref = 2x10⁻⁵ Pa = 20 µPa)
This reference sound pressure level is an internationally agreed upon value. It represents the threshold of human hearing for “typical” people based on numerous testing. It is possible to have a threshold which is lower than 20 µPa which will result in negative dB levels. As such, zero dB does not mean there is no sound! In general, a difference of 1 – 2 dB is the threshold for humans to notice that there has been a change in sound level. A difference of 3 dB (factor of 2 in acoustical energy) is perceptible and a change of 5 dB is strongly perceptible. A change of 10 dB is typically considered a factor of 2. This is quite remarkable when considering that 10 dB is 10-times the acoustical energy!
Pengrowth Energy Corporation – Lindbergh SAGD Project – NIA Project #11-027
28 November 24, 2011
Pengrowth Energy Corporation – Lindbergh SAGD Project – NIA Project #11-027
29 November 24, 2011
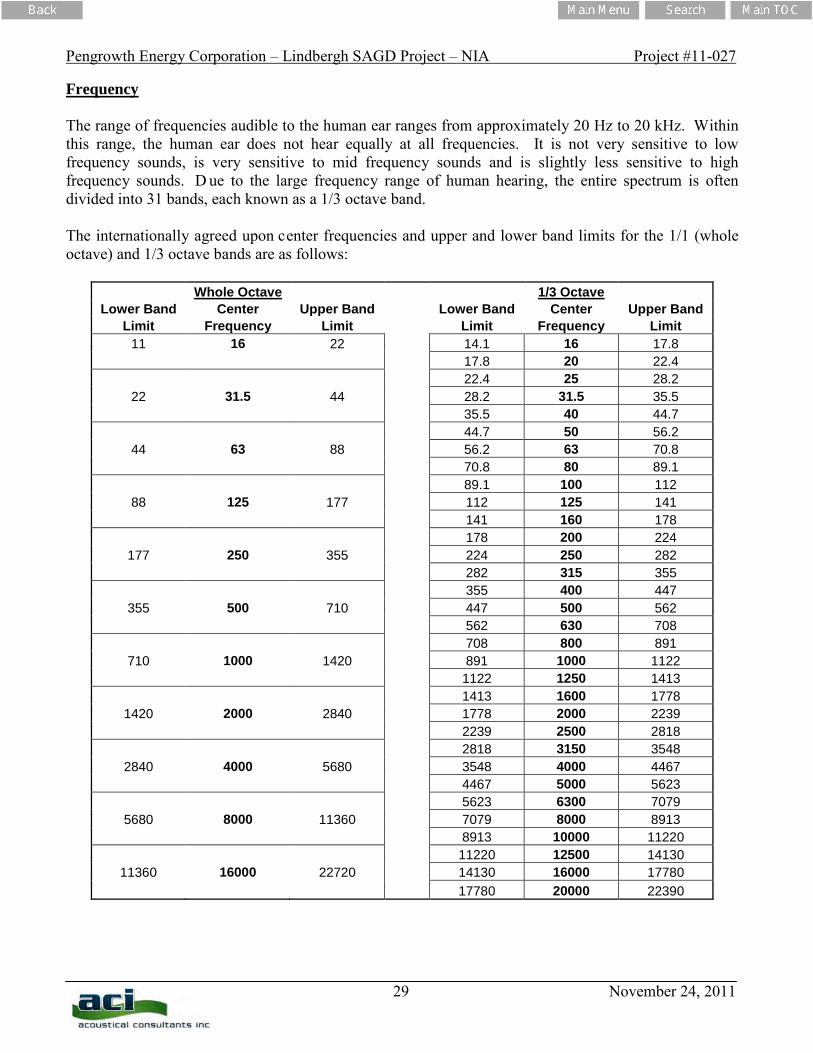
Frequency The range of frequencies audible to the human ear ranges from approximately 20 Hz to 20 kHz. Within this range, the human ear does not hear equally at all frequencies. It is not very sensitive to low frequency sounds, is very sensitive to mid frequency sounds and is slightly less sensitive to high frequency sounds. D ue to the large frequency range of human hearing, the entire spectrum is often divided into 31 bands, each known as a 1/3 octave band. The internationally agreed upon center frequencies and upper and lower band limits for the 1/1 (whole octave) and 1/3 octave bands are as follows:
Whole Octave 1/3 Octave Lower Band Center Upper Band Lower Band Center Upper Band
Limit Frequency Limit Limit Frequency Limit 11 16 22 14.1 16 17.8 17.8 20 22.4 22.4 25 28.2
22 31.5 44 28.2 31.5 35.5 35.5 40 44.7 44.7 50 56.2
44 63 88 56.2 63 70.8 70.8 80 89.1 89.1 100 112
88 125 177 112 125 141 141 160 178 178 200 224
177 250 355 224 250 282 282 315 355 355 400 447
355 500 710 447 500 562 562 630 708 708 800 891
710 1000 1420 891 1000 1122 1122 1250 1413 1413 1600 1778
1420 2000 2840 1778 2000 2239 2239 2500 2818 2818 3150 3548
2840 4000 5680 3548 4000 4467 4467 5000 5623 5623 6300 7079
5680 8000 11360 7079 8000 8913 8913 10000 11220 11220 12500 14130
11360 16000 22720 14130 16000 17780 17780 20000 22390

Pengrowth Energy Corporation – Lindbergh SAGD Project – NIA Project #11-027
30 November 24, 2011
Human hearing is most sensitive at approximately 3500 Hz which corresponds to the ¼ wavelength of the ear canal (approximately 2.5 cm). B ecause of this range of sensitivity to various frequencies, we typically apply various weighting networks to the broadband measured sound to more appropriately account for the way humans hear. By default, the most common weighting network used is the so-called “A-weighting”. It can be seen in the figure that the low frequency sounds are reduced significantly with the A-weighting.
Combination of Sounds When combining multiple sound sources the general equation is:
Σ=Σ=
10110 10log10
iSPLn
inSPL
Examples: - Two sources of 50 dB each add together to result in 53 dB. - Three sources of 50 dB each add together to result in 55 dB. - Ten sources of 50 dB each add together to result in 60 dB. - One source of 50 dB added to another source of 40 dB results in 50.4 dB
It can be seen that, if multiple similar sources exist, removing or reducing only one source will have little effect.
Pengrowth Energy Corporation – Lindbergh SAGD Project – NIA Project #11-027
31 November 24, 2011
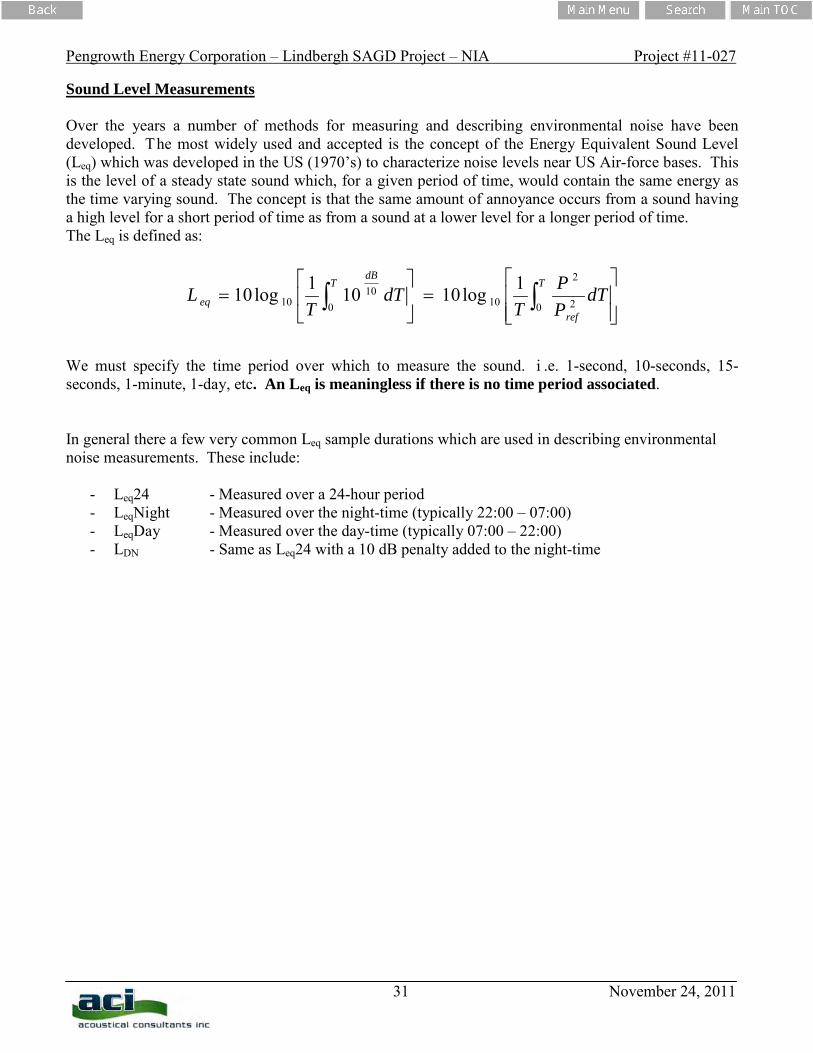
Sound Level Measurements Over the years a number of methods for measuring and describing environmental noise have been developed. The most widely used and accepted is the concept of the Energy Equivalent Sound Level (Leq) which was developed in the US (1970’s) to characterize noise levels near US Air-force bases. This is the level of a steady state sound which, for a given period of time, would contain the same energy as the time varying sound. The concept is that the same amount of annoyance occurs from a sound having a high level for a short period of time as from a sound at a lower level for a longer period of time. The Leq is defined as:
=
= ∫∫
T
ref
TdB
eq dTPP
TdT
TL
0 2
2
10010
101log10101log10
We must specify the time period over which to measure the sound. i .e. 1-second, 10-seconds, 15-seconds, 1-minute, 1-day, etc. An Leq is meaningless if there is no time period associated. In general there a few very common Leq sample durations which are used in describing environmental noise measurements. These include:
- Leq24 - Measured over a 24-hour period - LeqNight - Measured over the night-time (typically 22:00 – 07:00) - LeqDay - Measured over the day-time (typically 07:00 – 22:00) - LDN - Same as Leq24 with a 10 dB penalty added to the night-time
Pengrowth Energy Corporation – Lindbergh SAGD Project – NIA Project #11-027
32 November 24, 2011
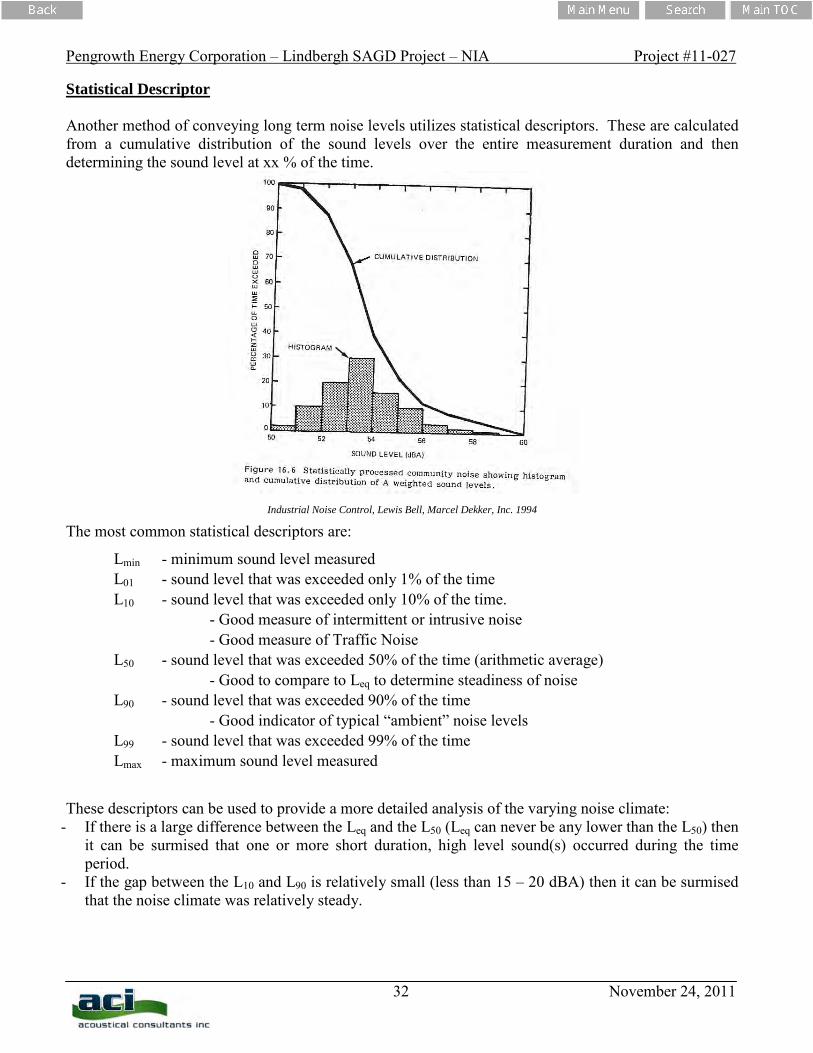
Statistical Descriptor Another method of conveying long term noise levels utilizes statistical descriptors. These are calculated from a cumulative distribution of the sound levels over the entire measurement duration and then determining the sound level at xx % of the time.
Industrial Noise Control, Lewis Bell, Marcel Dekker, Inc. 1994
The most common statistical descriptors are:
Lmin - minimum sound level measured L01 - sound level that was exceeded only 1% of the time
L10 - sound level that was exceeded only 10% of the time. - Good measure of intermittent or intrusive noise - Good measure of Traffic Noise
L50 - sound level that was exceeded 50% of the time (arithmetic average) - Good to compare to Leq to determine steadiness of noise L90 - sound level that was exceeded 90% of the time - Good indicator of typical “ambient” noise levels L99 - sound level that was exceeded 99% of the time
Lmax - maximum sound level measured
These descriptors can be used to provide a more detailed analysis of the varying noise climate: - If there is a large difference between the Leq and the L50 (Leq can never be any lower than the L50) then
it can be surmised that one or more short duration, high level sound(s) occurred during the time period.
- If the gap between the L10 and L90 is relatively small (less than 15 – 20 dBA) then it can be surmised that the noise climate was relatively steady.
Pengrowth Energy Corporation – Lindbergh SAGD Project – NIA Project #11-027
33 November 24, 2011
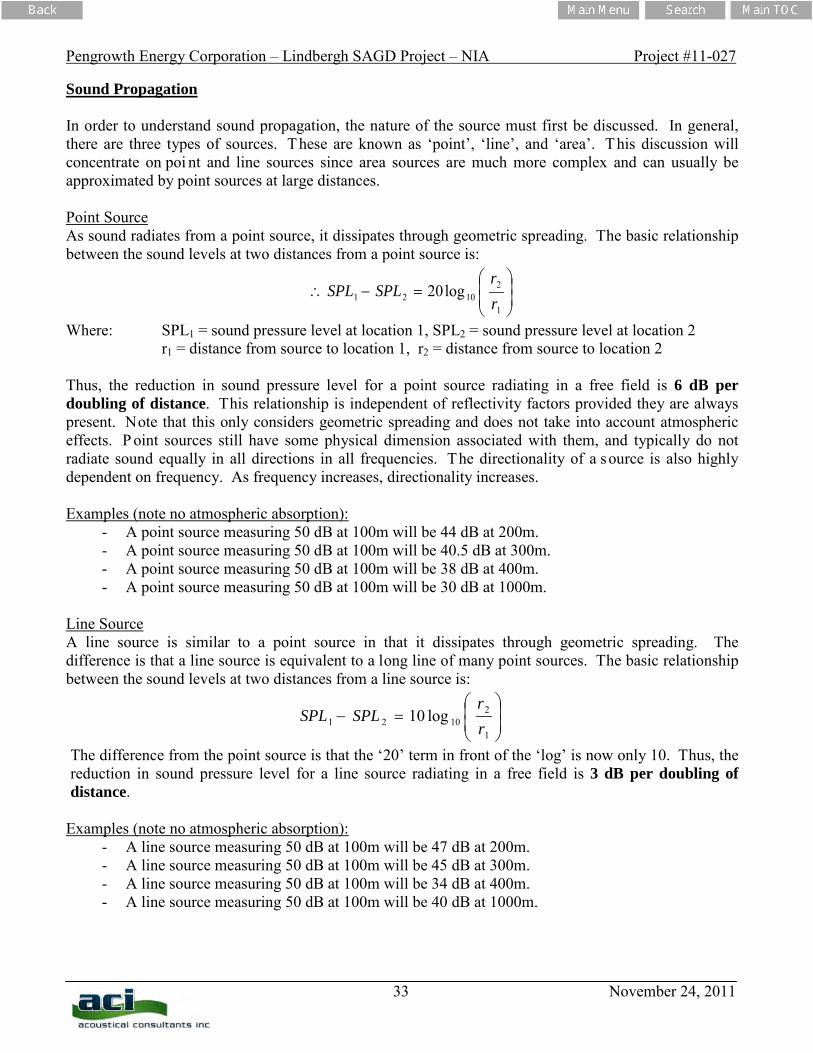
Sound Propagation In order to understand sound propagation, the nature of the source must first be discussed. In general, there are three types of sources. These are known as ‘point’, ‘line’, and ‘area’. This discussion will concentrate on poi nt and line sources since area sources are much more complex and can usually be approximated by point sources at large distances. Point Source As sound radiates from a point source, it dissipates through geometric spreading. The basic relationship between the sound levels at two distances from a point source is:
=−∴
1
21021 log20
rr
SPLSPL
Where: SPL1 = sound pressure level at location 1, SPL2 = sound pressure level at location 2 r1 = distance from source to location 1, r2 = distance from source to location 2 Thus, the reduction in sound pressure level for a point source radiating in a free field is 6 dB per doubling of distance. This relationship is independent of reflectivity factors provided they are always present. Note that this only considers geometric spreading and does not take into account atmospheric effects. P oint sources still have some physical dimension associated with them, and typically do not radiate sound equally in all directions in all frequencies. The directionality of a source is also highly dependent on frequency. As frequency increases, directionality increases. Examples (note no atmospheric absorption):
- A point source measuring 50 dB at 100m will be 44 dB at 200m. - A point source measuring 50 dB at 100m will be 40.5 dB at 300m. - A point source measuring 50 dB at 100m will be 38 dB at 400m. - A point source measuring 50 dB at 100m will be 30 dB at 1000m.
Line Source A line source is similar to a point source in that it dissipates through geometric spreading. The difference is that a line source is equivalent to a long line of many point sources. The basic relationship between the sound levels at two distances from a line source is:
=−
1
21021 log10
rr
SPLSPL
The difference from the point source is that the ‘20’ term in front of the ‘log’ is now only 10. Thus, the reduction in sound pressure level for a line source radiating in a free field is 3 dB per doubling of distance.
Examples (note no atmospheric absorption): - A line source measuring 50 dB at 100m will be 47 dB at 200m. - A line source measuring 50 dB at 100m will be 45 dB at 300m. - A line source measuring 50 dB at 100m will be 34 dB at 400m. - A line source measuring 50 dB at 100m will be 40 dB at 1000m.
Pengrowth Energy Corporation – Lindbergh SAGD Project – NIA Project #11-027
34 November 24, 2011
Atmospheric Absorption As sound transmits through a medium, there is an attenuation (or dissipation of acoustic energy) which can be attributed to three mechanisms:
1) Viscous Effects - Dissipation of acoustic energy due to fluid friction which results in thermodynamically irreversible propagation of sound.
2) Heat Conduction Effects - Heat transfer between high and low temperature regions in the wave which result in non-adiabatic propagation of the sound.
3) Inter Molecular Energy Interchanges - Molecular energy relaxation effects which result in a time lag between changes in translational kinetic energy and the energy associated with rotation and vibration of the molecules.
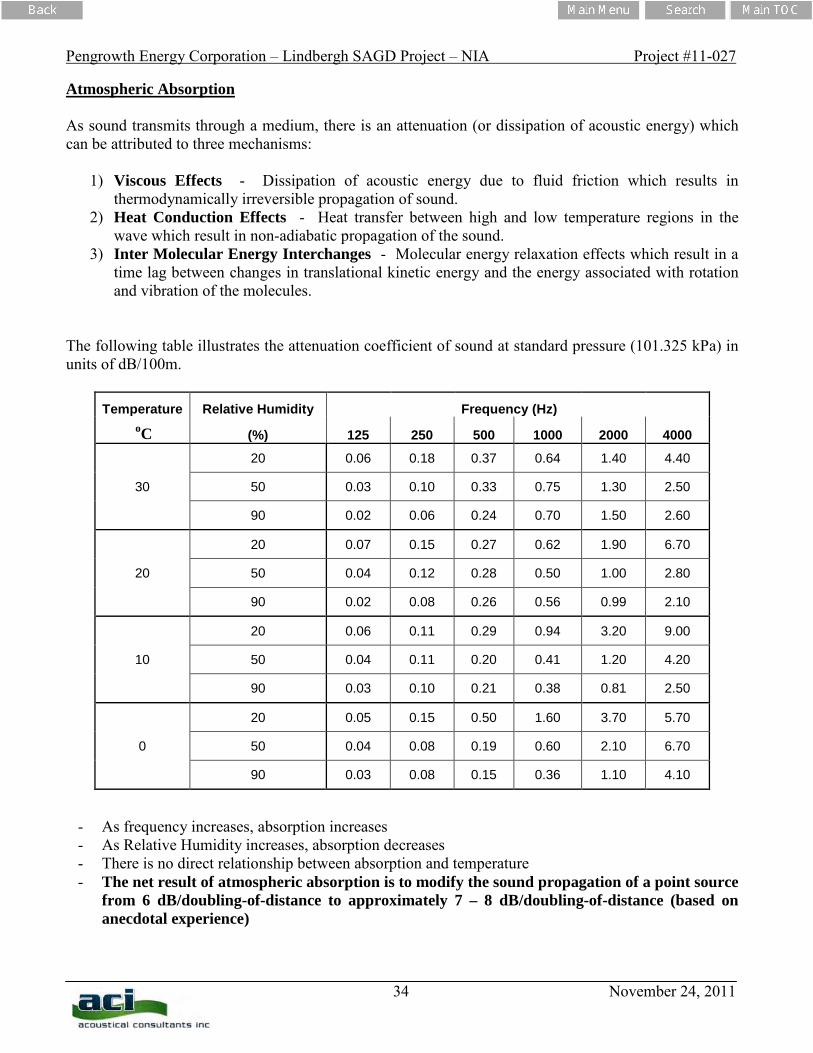
The following table illustrates the attenuation coefficient of sound at standard pressure (101.325 kPa) in units of dB/100m.
Temperature Relative Humidity Frequency (Hz) oC (%) 125 250 500 1000 2000 4000
20 0.06 0.18 0.37 0.64 1.40 4.40
30 50 0.03 0.10 0.33 0.75 1.30 2.50
90 0.02 0.06 0.24 0.70 1.50 2.60
20 0.07 0.15 0.27 0.62 1.90 6.70
20 50 0.04 0.12 0.28 0.50 1.00 2.80
90 0.02 0.08 0.26 0.56 0.99 2.10
20 0.06 0.11 0.29 0.94 3.20 9.00
10 50 0.04 0.11 0.20 0.41 1.20 4.20
90 0.03 0.10 0.21 0.38 0.81 2.50
20 0.05 0.15 0.50 1.60 3.70 5.70
0 50 0.04 0.08 0.19 0.60 2.10 6.70
90 0.03 0.08 0.15 0.36 1.10 4.10
- As frequency increases, absorption increases - As Relative Humidity increases, absorption decreases - There is no direct relationship between absorption and temperature - The net result of atmospheric absorption is to modify the sound propagation of a point source
from 6 dB/doubling-of-distance to approximately 7 – 8 dB/doubling-of-distance (based on anecdotal experience)
Pengrowth Energy Corporation – Lindbergh SAGD Project – NIA Project #11-027
35 November 24, 2011
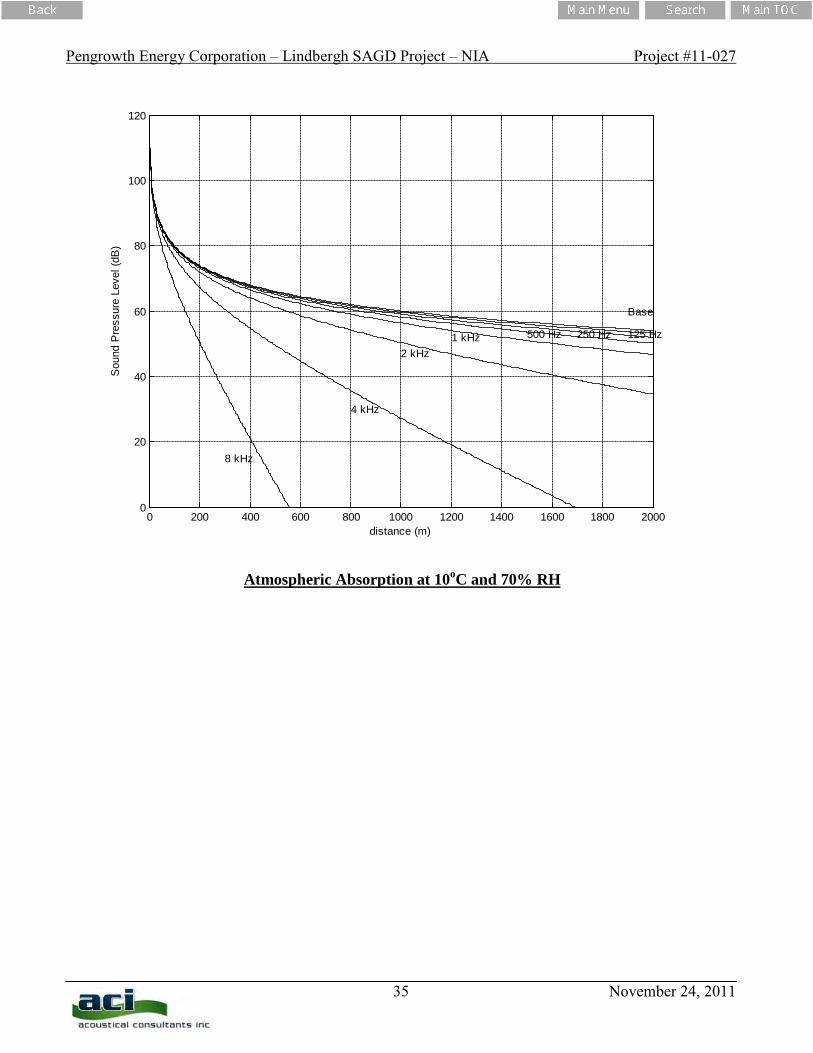
Atmospheric Absorption at 10oC and 70% RH
0 200 400 600 800 1000 1200 1400 1600 1800 20000
20
40
60
80
100
120
distance (m)
Sou
nd P
ress
ure
Leve
l (dB
)
8 kHz
4 kHz
2 kHz1 kHz 500 Hz 250 Hz 125 Hz
Base
Pengrowth Energy Corporation – Lindbergh SAGD Project – NIA Project #11-027
36 November 24, 2011
Meteorological Effects There are many meteorological factors which can affect how sound propagates over large distances. These various phenomena must be considered when trying to determine the relative impact of a noise source either after installation or during the design stage. Wind - Can greatly alter the noise climate away from a source depending on direction - Sound levels downwind from a source can be increased due to refraction of sound back down towards
the surface. This is due to the generally higher velocities as altitude increases. - Sound levels upwind from a source can be decreased due to a “bending” of the sound away from the
earth’s surface. - Sound level differences of ±10dB are possible depending on s everity of wind and distance from
source. - Sound levels crosswind are generally not disturbed by an appreciable amount - Wind tends to generate its own noise, however, and can provide a high degree of masking relative to a
noise source of particular interest.
Temperature - Temperature effects can be similar to wind effects - Typically, the temperature is warmer at ground level than it is at higher elevations. - If there is a very large difference between the ground temperature (very warm) and the air aloft (only
a few hundred meters) then the transmitted sound refracts upward due to the changing speed of sound. - If the air aloft is warmer than the ground temperature (known as an inversion) the resulting higher
speed of sound aloft tends to refract the transmitted sound back down towards the ground. T his essentially works on Snell’s law of reflection and refraction.
- Temperature inversions typically happen early in the morning and are most common over large bodies of water or across river valleys.
- Sound level differences of ±10dB are possible depending on gradient of temperature and distance from source.
Rain
- Rain does not affect sound propagation by an appreciable amount unless it is very heavy - The larger concern is the noise generated by the rain itself. A heavy rain striking the ground can
cause a significant amount of highly broadband noise. The amount of noise generated is difficult to predict.
- Rain can also affect the output of various noise sources such as vehicle traffic. Summary
- In general, these wind and temperature effects are difficult to predict - Empirical models (based on measured data) have been generated to attempt to account for these
effects. - Environmental noise measurements must be conducted with these effects in mind. Sometimes it is
desired to have completely calm conditions, other times a “worst case” of downwind noise levels are desired.
Pengrowth Energy Corporation – Lindbergh SAGD Project – NIA Project #11-027
37 November 24, 2011
Topographical Effects Similar to the various atmospheric effects outlined in the previous section, the effect of various geographical and vegetative factors must also be considered when examining the propagation of noise over large distances. Topography
- One of the most important factors in sound propagation. - Can provide a natural barrier between source and receiver (i.e. if berm or hill in between). - Can provide a natural amplifier between source and receiver (i.e. large valley in between or hard
reflective surface in between). - Must look at location of topographical features relative to source and receiver to determine
importance (i.e. small berm 1km away from source and 1km away from receiver will make negligible impact).
Grass
- Can be an effective absorber due to large area covered - Only effective at low height above ground. Does not affect sound transmitted direct from source
to receiver if there is line of sight. - Typically less absorption than atmospheric absorption when there is line of sight. - Approximate rule of thumb based on empirical data is:
)100/(31)(log18 10 mdBfAg −= Where: Ag is the absorption amount
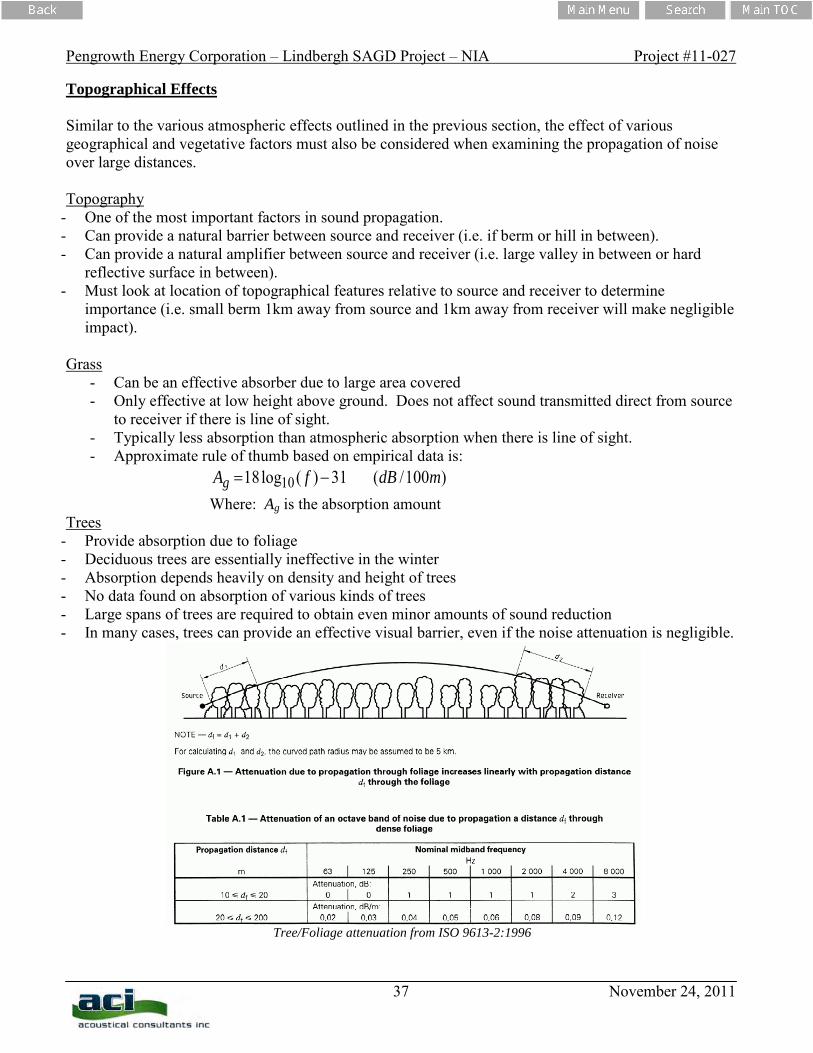
Trees - Provide absorption due to foliage - Deciduous trees are essentially ineffective in the winter - Absorption depends heavily on density and height of trees - No data found on absorption of various kinds of trees - Large spans of trees are required to obtain even minor amounts of sound reduction - In many cases, trees can provide an effective visual barrier, even if the noise attenuation is negligible.
Tree/Foliage attenuation from ISO 9613-2:1996
Pengrowth Energy Corporation – Lindbergh SAGD Project – NIA Project #11-027
38 November 24, 2011
Bodies of Water - Large bodies of water can provide the opposite effect to grass and trees. - Reflections caused by small incidence angles (grazing) can result in larger sound levels at great
distances (increased reflectivity, Q). - Typically air temperatures are warmer high aloft since air temperatures near water surface tend to be
more constant. Result is a high probability of temperature inversion. - Sound levels can “carry” much further. Snow
- Covers the ground for much of the year in northern climates. - Can act as an absorber or reflector (and varying degrees in between). - Freshly fallen snow can be quite absorptive. - Snow which has been sitting for a while and hard packed due to wind can be quite reflective. - Falling snow can be more absorptive than rain, but does not tend to produce its own noise. - Snow can cover grass which might have provided some means of absorption. - Typically sound propagates with less impedance in winter due to hard snow on ground and no foliage
on trees/shrubs.
Pengrowth Energy Corporation – Lindbergh SAGD Project – NIA Project #11-027
39 November 24, 2011
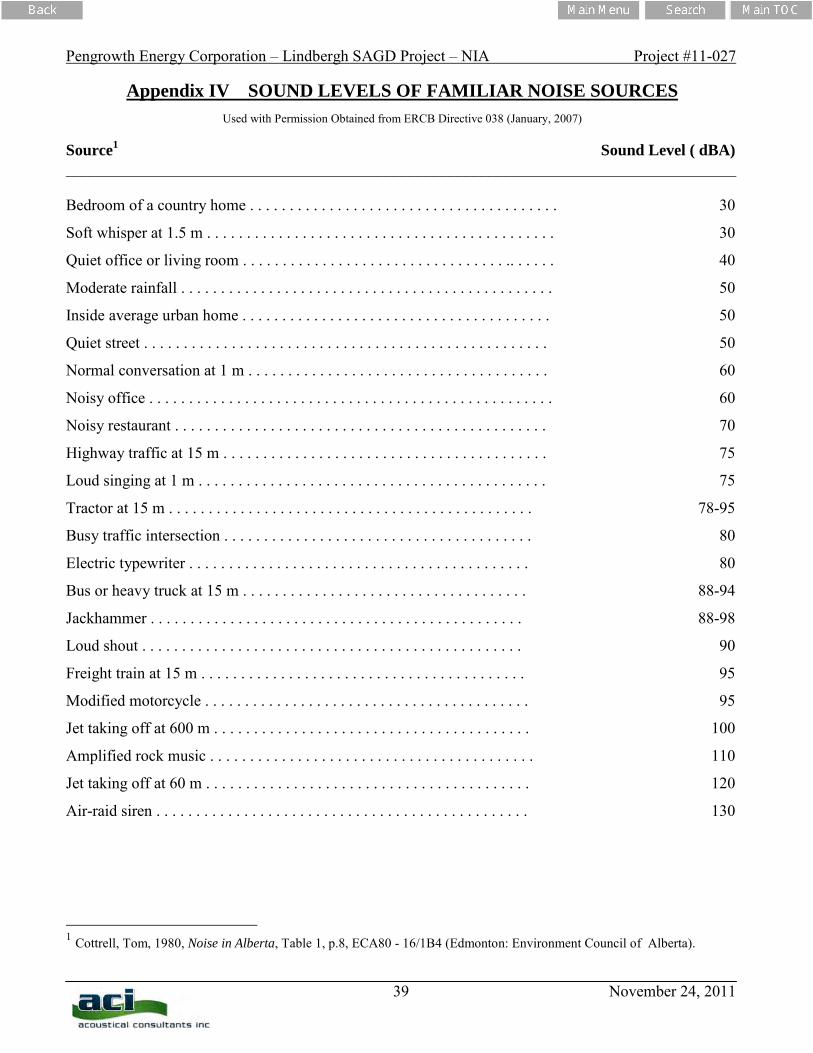
Appendix IV SOUND LEVELS OF FAMILIAR NOISE SOURCES Used with Permission Obtained from ERCB Directive 038 (January, 2007)
Source1 Sound Level ( dBA)
____________________________________________________________________________________ Bedroom of a country home . . . . . . . . . . . . . . . . . . . . . . . . . . . . . . . . . . . . . . . 30
Soft whisper at 1.5 m . . . . . . . . . . . . . . . . . . . . . . . . . . . . . . . . . . . . . . . . . . . . 30
Quiet office or living room . . . . . . . . . . . . . . . . . . . . . . . . . . . . . . . . . .. . . . . . 40
Moderate rainfall . . . . . . . . . . . . . . . . . . . . . . . . . . . . . . . . . . . . . . . . . . . . . . . 50
Inside average urban home . . . . . . . . . . . . . . . . . . . . . . . . . . . . . . . . . . . . . . . 50
Quiet street . . . . . . . . . . . . . . . . . . . . . . . . . . . . . . . . . . . . . . . . . . . . . . . . . . . 50
Normal conversation at 1 m . . . . . . . . . . . . . . . . . . . . . . . . . . . . . . . . . . . . . . 60
Noisy office . . . . . . . . . . . . . . . . . . . . . . . . . . . . . . . . . . . . . . . . . . . . . . . . . . . 60
Noisy restaurant . . . . . . . . . . . . . . . . . . . . . . . . . . . . . . . . . . . . . . . . . . . . . . . 70
Highway traffic at 15 m . . . . . . . . . . . . . . . . . . . . . . . . . . . . . . . . . . . . . . . . . 75
Loud singing at 1 m . . . . . . . . . . . . . . . . . . . . . . . . . . . . . . . . . . . . . . . . . . . . 75
Tractor at 15 m . . . . . . . . . . . . . . . . . . . . . . . . . . . . . . . . . . . . . . . . . . . . . . 78-95
Busy traffic intersection . . . . . . . . . . . . . . . . . . . . . . . . . . . . . . . . . . . . . . . 80
Electric typewriter . . . . . . . . . . . . . . . . . . . . . . . . . . . . . . . . . . . . . . . . . . . 80
Bus or heavy truck at 15 m . . . . . . . . . . . . . . . . . . . . . . . . . . . . . . . . . . . . 88-94
Jackhammer . . . . . . . . . . . . . . . . . . . . . . . . . . . . . . . . . . . . . . . . . . . . . . . 88-98
Loud shout . . . . . . . . . . . . . . . . . . . . . . . . . . . . . . . . . . . . . . . . . . . . . . . . 90
Freight train at 15 m . . . . . . . . . . . . . . . . . . . . . . . . . . . . . . . . . . . . . . . . . 95
Modified motorcycle . . . . . . . . . . . . . . . . . . . . . . . . . . . . . . . . . . . . . . . . . 95
Jet taking off at 600 m . . . . . . . . . . . . . . . . . . . . . . . . . . . . . . . . . . . . . . . . 100
Amplified rock music . . . . . . . . . . . . . . . . . . . . . . . . . . . . . . . . . . . . . . . . . 110
Jet taking off at 60 m . . . . . . . . . . . . . . . . . . . . . . . . . . . . . . . . . . . . . . . . . 120
Air-raid siren . . . . . . . . . . . . . . . . . . . . . . . . . . . . . . . . . . . . . . . . . . . . . . . 130
1 Cottrell, Tom, 1980, Noise in Alberta, Table 1, p.8, ECA80 - 16/1B4 (Edmonton: Environment Council of Alberta).
Pengrowth Energy Corporation – Lindbergh SAGD Project – NIA Project #11-027
40 November 24, 2011
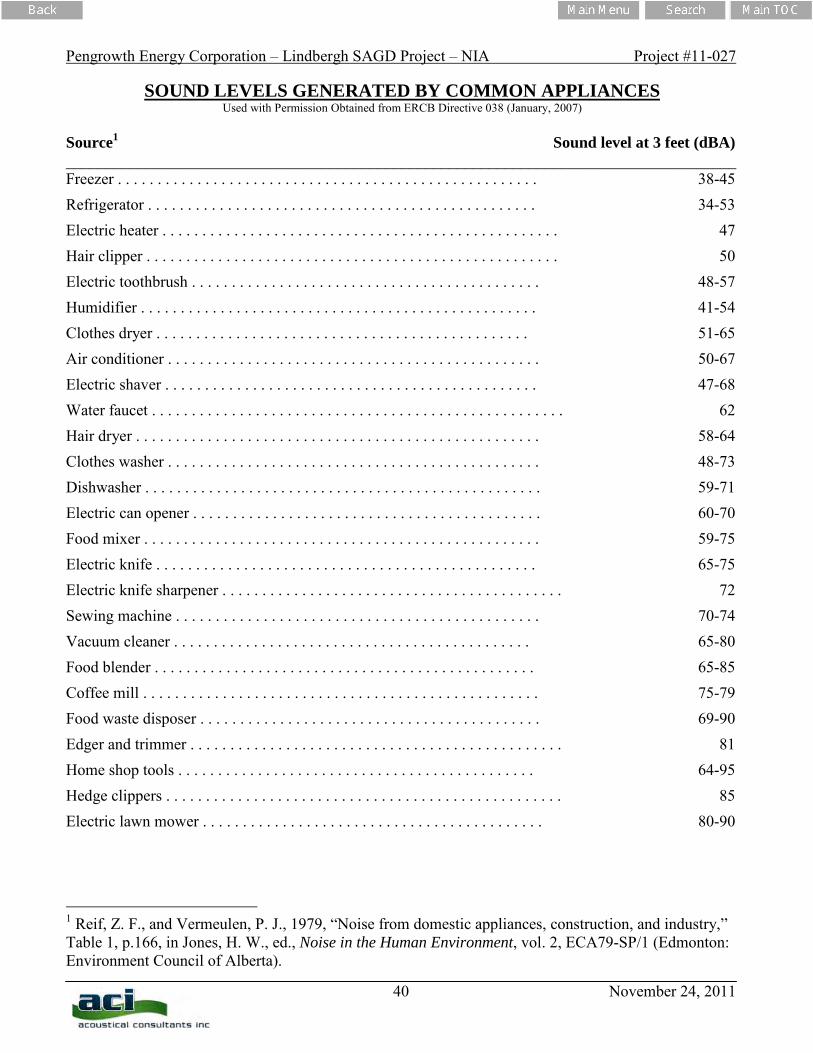
SOUND LEVELS GENERATED BY COMMON APPLIANCES Used with Permission Obtained from ERCB Directive 038 (January, 2007)
Source1 Sound level at 3 feet (dBA)
____________________________________________________________________________________ Freezer . . . . . . . . . . . . . . . . . . . . . . . . . . . . . . . . . . . . . . . . . . . . . . . . . . . . . 38-45 Refrigerator . . . . . . . . . . . . . . . . . . . . . . . . . . . . . . . . . . . . . . . . . . . . . . . . . 34-53 Electric heater . . . . . . . . . . . . . . . . . . . . . . . . . . . . . . . . . . . . . . . . . . . . . . . . . . 47 Hair clipper . . . . . . . . . . . . . . . . . . . . . . . . . . . . . . . . . . . . . . . . . . . . . . . . . . . . 50 Electric toothbrush . . . . . . . . . . . . . . . . . . . . . . . . . . . . . . . . . . . . . . . . . . . . 48-57 Humidifier . . . . . . . . . . . . . . . . . . . . . . . . . . . . . . . . . . . . . . . . . . . . . . . . . . 41-54 Clothes dryer . . . . . . . . . . . . . . . . . . . . . . . . . . . . . . . . . . . . . . . . . . . . . . . 51-65 Air conditioner . . . . . . . . . . . . . . . . . . . . . . . . . . . . . . . . . . . . . . . . . . . . . . . 50-67 Electric shaver . . . . . . . . . . . . . . . . . . . . . . . . . . . . . . . . . . . . . . . . . . . . . . . 47-68 Water faucet . . . . . . . . . . . . . . . . . . . . . . . . . . . . . . . . . . . . . . . . . . . . . . . . . . . . 62 Hair dryer . . . . . . . . . . . . . . . . . . . . . . . . . . . . . . . . . . . . . . . . . . . . . . . . . . . 58-64 Clothes washer . . . . . . . . . . . . . . . . . . . . . . . . . . . . . . . . . . . . . . . . . . . . . . . 48-73 Dishwasher . . . . . . . . . . . . . . . . . . . . . . . . . . . . . . . . . . . . . . . . . . . . . . . . . . 59-71 Electric can opener . . . . . . . . . . . . . . . . . . . . . . . . . . . . . . . . . . . . . . . . . . . . 60-70 Food mixer . . . . . . . . . . . . . . . . . . . . . . . . . . . . . . . . . . . . . . . . . . . . . . . . . . 59-75 Electric knife . . . . . . . . . . . . . . . . . . . . . . . . . . . . . . . . . . . . . . . . . . . . . . . . 65-75 Electric knife sharpener . . . . . . . . . . . . . . . . . . . . . . . . . . . . . . . . . . . . . . . . . . . 72 Sewing machine . . . . . . . . . . . . . . . . . . . . . . . . . . . . . . . . . . . . . . . . . . . . . . 70-74 Vacuum cleaner . . . . . . . . . . . . . . . . . . . . . . . . . . . . . . . . . . . . . . . . . . . . . 65-80 Food blender . . . . . . . . . . . . . . . . . . . . . . . . . . . . . . . . . . . . . . . . . . . . . . . . 65-85 Coffee mill . . . . . . . . . . . . . . . . . . . . . . . . . . . . . . . . . . . . . . . . . . . . . . . . . . 75-79 Food waste disposer . . . . . . . . . . . . . . . . . . . . . . . . . . . . . . . . . . . . . . . . . . . 69-90 Edger and trimmer . . . . . . . . . . . . . . . . . . . . . . . . . . . . . . . . . . . . . . . . . . . . . . . 81 Home shop tools . . . . . . . . . . . . . . . . . . . . . . . . . . . . . . . . . . . . . . . . . . . . . 64-95 Hedge clippers . . . . . . . . . . . . . . . . . . . . . . . . . . . . . . . . . . . . . . . . . . . . . . . . . . 85 Electric lawn mower . . . . . . . . . . . . . . . . . . . . . . . . . . . . . . . . . . . . . . . . . . . 80-90
1 Reif, Z. F., and Vermeulen, P. J., 1979, “Noise from domestic appliances, construction, and industry,” Table 1, p.166, in Jones, H. W., ed., Noise in the Human Environment, vol. 2, ECA79-SP/1 (Edmonton: Environment Council of Alberta).
Pengrowth Energy Corporation – Lindbergh SAGD Project – NIA Project #11-027
41 November 24, 2011
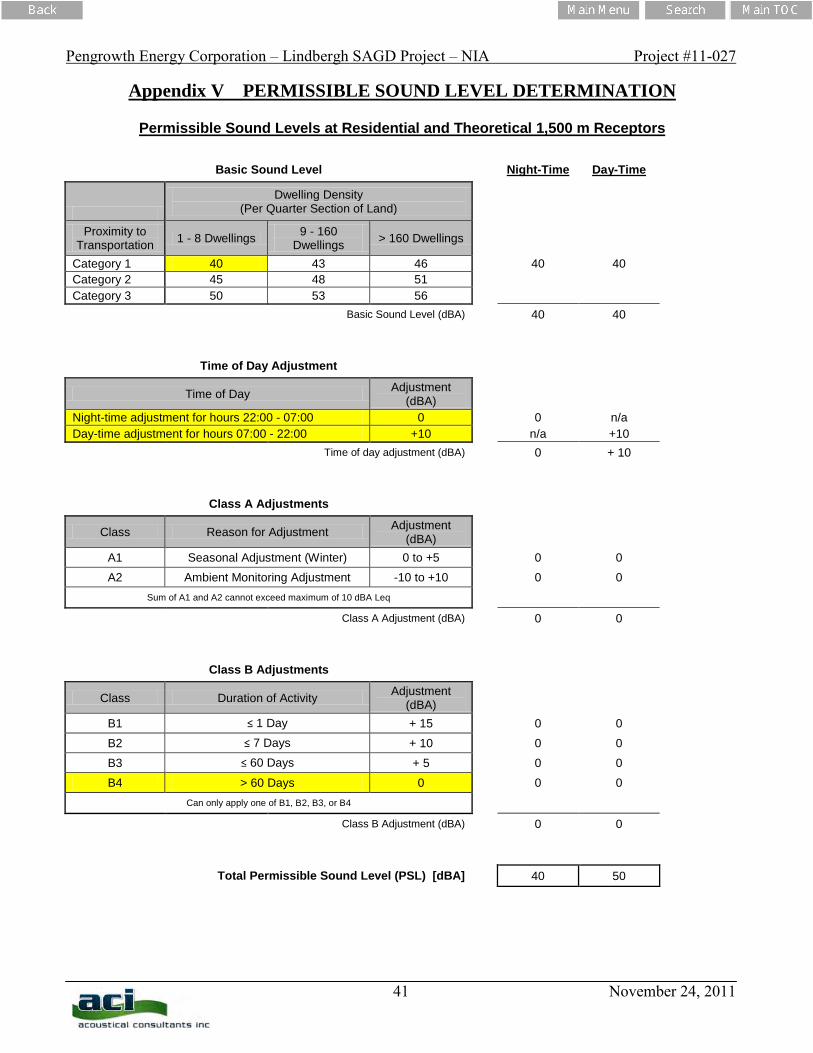
Appendix V PERMISSIBLE SOUND LEVEL DETERMINATION
Permissible Sound Levels at Residential and Theoretical 1,500 m Receptors
Basic Sound Level
Night-Time Day-Time
Dwelling Density
(Per Quarter Section of Land) Proximity to
Transportation 1 - 8 Dwellings 9 - 160 Dwellings > 160 Dwellings
Category 1 40 43 46 40 40 Category 2 45 48 51 Category 3 50 53 56
Basic Sound Level (dBA)
40 40
Time of Day Adjustment
Time of Day Adjustment
(dBA) Night-time adjustment for hours 22:00 - 07:00 0
0 n/a Day-time adjustment for hours 07:00 - 22:00 +10
n/a +10
Time of day adjustment (dBA)
0 + 10
Class A Adjustments
Class Reason for Adjustment Adjustment
(dBA) A1 Seasonal Adjustment (Winter) 0 to +5
0 0 A2 Ambient Monitoring Adjustment -10 to +10
0 0
Sum of A1 and A2 cannot exceed maximum of 10 dBA Leq
Class A Adjustment (dBA)
0 0
Class B Adjustments
Class Duration of Activity Adjustment
(dBA) B1 ≤ 1 Day + 15
0 0 B2 ≤ 7 Days + 10
0 0
B3 ≤ 60 Days + 5
0 0 B4 > 60 Days 0
0 0
Can only apply one of B1, B2, B3, or B4
Class B Adjustment (dBA)
0 0
Total Permissible Sound Level (PSL) [dBA]
40 50
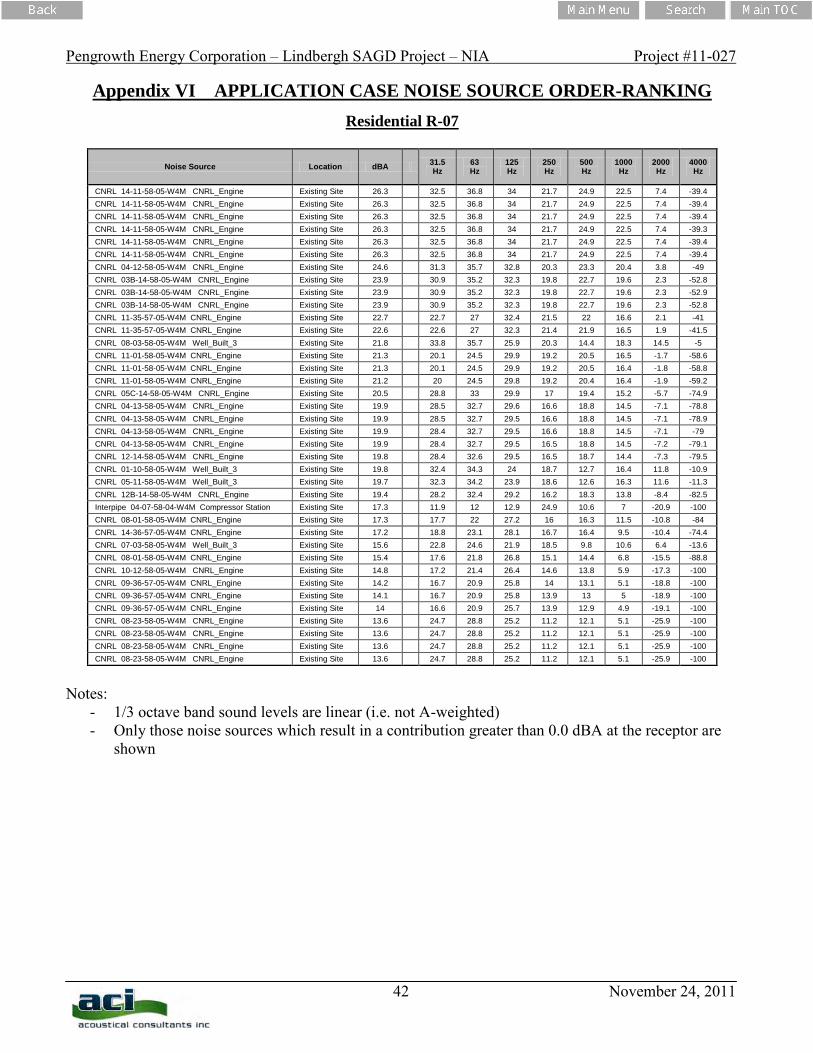
Pengrowth Energy Corporation – Lindbergh SAGD Project – NIA Project #11-027
42 November 24, 2011
Appendix VI APPLICATION CASE NOISE SOURCE ORDER-RANKING Residential R-07
Noise Source Location dBA 31.5
Hz 63 Hz
125 Hz
250 Hz
500 Hz
1000 Hz
2000 Hz
4000 Hz
CNRL 14-11-58-05-W4M CNRL_Engine Existing Site 26.3 32.5 36.8 34 21.7 24.9 22.5 7.4 -39.4 CNRL 14-11-58-05-W4M CNRL_Engine Existing Site 26.3 32.5 36.8 34 21.7 24.9 22.5 7.4 -39.4 CNRL 14-11-58-05-W4M CNRL_Engine Existing Site 26.3 32.5 36.8 34 21.7 24.9 22.5 7.4 -39.4 CNRL 14-11-58-05-W4M CNRL_Engine Existing Site 26.3 32.5 36.8 34 21.7 24.9 22.5 7.4 -39.3 CNRL 14-11-58-05-W4M CNRL_Engine Existing Site 26.3 32.5 36.8 34 21.7 24.9 22.5 7.4 -39.4 CNRL 14-11-58-05-W4M CNRL_Engine Existing Site 26.3 32.5 36.8 34 21.7 24.9 22.5 7.4 -39.4 CNRL 04-12-58-05-W4M CNRL_Engine Existing Site 24.6 31.3 35.7 32.8 20.3 23.3 20.4 3.8 -49 CNRL 03B-14-58-05-W4M CNRL_Engine Existing Site 23.9 30.9 35.2 32.3 19.8 22.7 19.6 2.3 -52.8 CNRL 03B-14-58-05-W4M CNRL_Engine Existing Site 23.9 30.9 35.2 32.3 19.8 22.7 19.6 2.3 -52.9 CNRL 03B-14-58-05-W4M CNRL_Engine Existing Site 23.9 30.9 35.2 32.3 19.8 22.7 19.6 2.3 -52.8 CNRL 11-35-57-05-W4M CNRL_Engine Existing Site 22.7 22.7 27 32.4 21.5 22 16.6 2.1 -41 CNRL 11-35-57-05-W4M CNRL_Engine Existing Site 22.6 22.6 27 32.3 21.4 21.9 16.5 1.9 -41.5 CNRL 08-03-58-05-W4M Well_Built_3 Existing Site 21.8 33.8 35.7 25.9 20.3 14.4 18.3 14.5 -5 CNRL 11-01-58-05-W4M CNRL_Engine Existing Site 21.3 20.1 24.5 29.9 19.2 20.5 16.5 -1.7 -58.6 CNRL 11-01-58-05-W4M CNRL_Engine Existing Site 21.3 20.1 24.5 29.9 19.2 20.5 16.4 -1.8 -58.8 CNRL 11-01-58-05-W4M CNRL_Engine Existing Site 21.2 20 24.5 29.8 19.2 20.4 16.4 -1.9 -59.2 CNRL 05C-14-58-05-W4M CNRL_Engine Existing Site 20.5 28.8 33 29.9 17 19.4 15.2 -5.7 -74.9 CNRL 04-13-58-05-W4M CNRL_Engine Existing Site 19.9 28.5 32.7 29.6 16.6 18.8 14.5 -7.1 -78.8 CNRL 04-13-58-05-W4M CNRL_Engine Existing Site 19.9 28.5 32.7 29.5 16.6 18.8 14.5 -7.1 -78.9 CNRL 04-13-58-05-W4M CNRL_Engine Existing Site 19.9 28.4 32.7 29.5 16.6 18.8 14.5 -7.1 -79 CNRL 04-13-58-05-W4M CNRL_Engine Existing Site 19.9 28.4 32.7 29.5 16.5 18.8 14.5 -7.2 -79.1 CNRL 12-14-58-05-W4M CNRL_Engine Existing Site 19.8 28.4 32.6 29.5 16.5 18.7 14.4 -7.3 -79.5 CNRL 01-10-58-05-W4M Well_Built_3 Existing Site 19.8 32.4 34.3 24 18.7 12.7 16.4 11.8 -10.9 CNRL 05-11-58-05-W4M Well_Built_3 Existing Site 19.7 32.3 34.2 23.9 18.6 12.6 16.3 11.6 -11.3 CNRL 12B-14-58-05-W4M CNRL_Engine Existing Site 19.4 28.2 32.4 29.2 16.2 18.3 13.8 -8.4 -82.5 Interpipe 04-07-58-04-W4M Compressor Station Existing Site 17.3 11.9 12 12.9 24.9 10.6 7 -20.9 -100 CNRL 08-01-58-05-W4M CNRL_Engine Existing Site 17.3 17.7 22 27.2 16 16.3 11.5 -10.8 -84 CNRL 14-36-57-05-W4M CNRL_Engine Existing Site 17.2 18.8 23.1 28.1 16.7 16.4 9.5 -10.4 -74.4 CNRL 07-03-58-05-W4M Well_Built_3 Existing Site 15.6 22.8 24.6 21.9 18.5 9.8 10.6 6.4 -13.6 CNRL 08-01-58-05-W4M CNRL_Engine Existing Site 15.4 17.6 21.8 26.8 15.1 14.4 6.8 -15.5 -88.8 CNRL 10-12-58-05-W4M CNRL_Engine Existing Site 14.8 17.2 21.4 26.4 14.6 13.8 5.9 -17.3 -100 CNRL 09-36-57-05-W4M CNRL_Engine Existing Site 14.2 16.7 20.9 25.8 14 13.1 5.1 -18.8 -100 CNRL 09-36-57-05-W4M CNRL_Engine Existing Site 14.1 16.7 20.9 25.8 13.9 13 5 -18.9 -100 CNRL 09-36-57-05-W4M CNRL_Engine Existing Site 14 16.6 20.9 25.7 13.9 12.9 4.9 -19.1 -100 CNRL 08-23-58-05-W4M CNRL_Engine Existing Site 13.6 24.7 28.8 25.2 11.2 12.1 5.1 -25.9 -100 CNRL 08-23-58-05-W4M CNRL_Engine Existing Site 13.6 24.7 28.8 25.2 11.2 12.1 5.1 -25.9 -100 CNRL 08-23-58-05-W4M CNRL_Engine Existing Site 13.6 24.7 28.8 25.2 11.2 12.1 5.1 -25.9 -100 CNRL 08-23-58-05-W4M CNRL_Engine Existing Site 13.6 24.7 28.8 25.2 11.2 12.1 5.1 -25.9 -100
Notes:
- 1/3 octave band sound levels are linear (i.e. not A-weighted) - Only those noise sources which result in a contribution greater than 0.0 dBA at the receptor are
shown
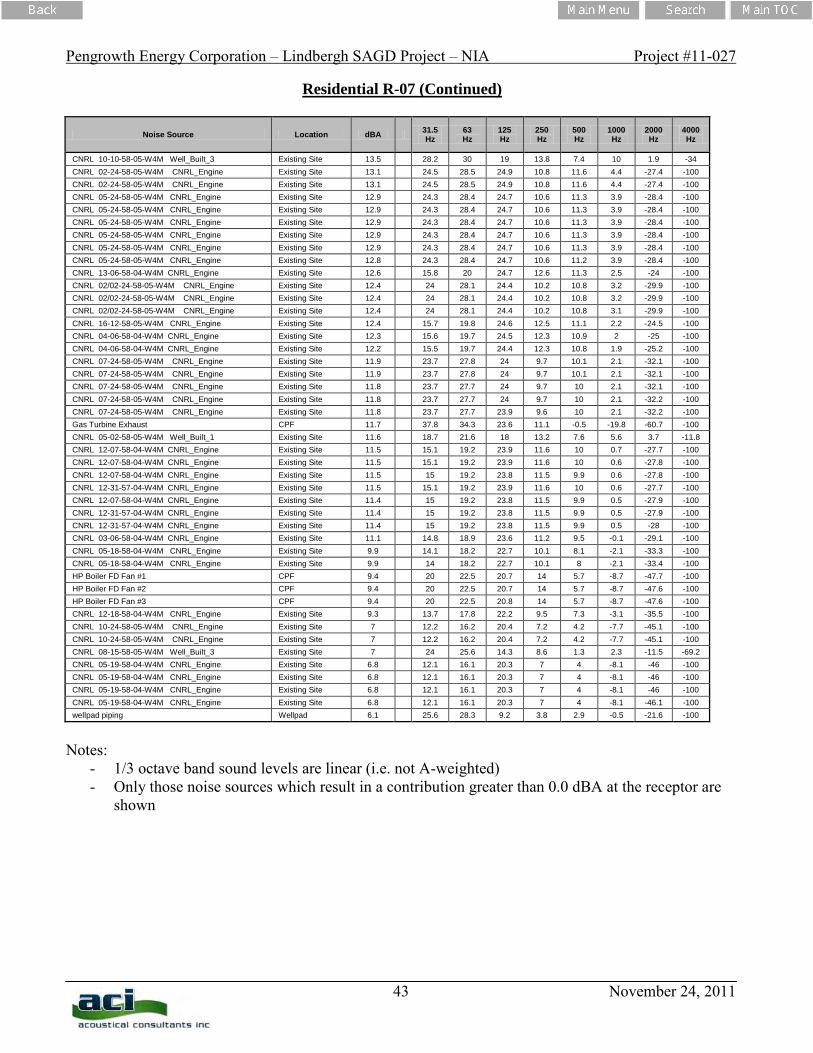
Pengrowth Energy Corporation – Lindbergh SAGD Project – NIA Project #11-027
43 November 24, 2011
Residential R-07 (Continued)
Noise Source Location dBA 31.5 Hz
63 Hz
125 Hz
250 Hz
500 Hz
1000 Hz
2000 Hz
4000 Hz
CNRL 10-10-58-05-W4M Well_Built_3 Existing Site 13.5 28.2 30 19 13.8 7.4 10 1.9 -34 CNRL 02-24-58-05-W4M CNRL_Engine Existing Site 13.1 24.5 28.5 24.9 10.8 11.6 4.4 -27.4 -100 CNRL 02-24-58-05-W4M CNRL_Engine Existing Site 13.1 24.5 28.5 24.9 10.8 11.6 4.4 -27.4 -100 CNRL 05-24-58-05-W4M CNRL_Engine Existing Site 12.9 24.3 28.4 24.7 10.6 11.3 3.9 -28.4 -100 CNRL 05-24-58-05-W4M CNRL_Engine Existing Site 12.9 24.3 28.4 24.7 10.6 11.3 3.9 -28.4 -100 CNRL 05-24-58-05-W4M CNRL_Engine Existing Site 12.9 24.3 28.4 24.7 10.6 11.3 3.9 -28.4 -100 CNRL 05-24-58-05-W4M CNRL_Engine Existing Site 12.9 24.3 28.4 24.7 10.6 11.3 3.9 -28.4 -100 CNRL 05-24-58-05-W4M CNRL_Engine Existing Site 12.9 24.3 28.4 24.7 10.6 11.3 3.9 -28.4 -100 CNRL 05-24-58-05-W4M CNRL_Engine Existing Site 12.8 24.3 28.4 24.7 10.6 11.2 3.9 -28.4 -100 CNRL 13-06-58-04-W4M CNRL_Engine Existing Site 12.6 15.8 20 24.7 12.6 11.3 2.5 -24 -100 CNRL 02/02-24-58-05-W4M CNRL_Engine Existing Site 12.4 24 28.1 24.4 10.2 10.8 3.2 -29.9 -100 CNRL 02/02-24-58-05-W4M CNRL_Engine Existing Site 12.4 24 28.1 24.4 10.2 10.8 3.2 -29.9 -100 CNRL 02/02-24-58-05-W4M CNRL_Engine Existing Site 12.4 24 28.1 24.4 10.2 10.8 3.1 -29.9 -100 CNRL 16-12-58-05-W4M CNRL_Engine Existing Site 12.4 15.7 19.8 24.6 12.5 11.1 2.2 -24.5 -100 CNRL 04-06-58-04-W4M CNRL_Engine Existing Site 12.3 15.6 19.7 24.5 12.3 10.9 2 -25 -100 CNRL 04-06-58-04-W4M CNRL_Engine Existing Site 12.2 15.5 19.7 24.4 12.3 10.8 1.9 -25.2 -100 CNRL 07-24-58-05-W4M CNRL_Engine Existing Site 11.9 23.7 27.8 24 9.7 10.1 2.1 -32.1 -100 CNRL 07-24-58-05-W4M CNRL_Engine Existing Site 11.9 23.7 27.8 24 9.7 10.1 2.1 -32.1 -100 CNRL 07-24-58-05-W4M CNRL_Engine Existing Site 11.8 23.7 27.7 24 9.7 10 2.1 -32.1 -100 CNRL 07-24-58-05-W4M CNRL_Engine Existing Site 11.8 23.7 27.7 24 9.7 10 2.1 -32.2 -100 CNRL 07-24-58-05-W4M CNRL_Engine Existing Site 11.8 23.7 27.7 23.9 9.6 10 2.1 -32.2 -100 Gas Turbine Exhaust CPF 11.7 37.8 34.3 23.6 11.1 -0.5 -19.8 -60.7 -100 CNRL 05-02-58-05-W4M Well_Built_1 Existing Site 11.6 18.7 21.6 18 13.2 7.6 5.6 3.7 -11.8 CNRL 12-07-58-04-W4M CNRL_Engine Existing Site 11.5 15.1 19.2 23.9 11.6 10 0.7 -27.7 -100 CNRL 12-07-58-04-W4M CNRL_Engine Existing Site 11.5 15.1 19.2 23.9 11.6 10 0.6 -27.8 -100 CNRL 12-07-58-04-W4M CNRL_Engine Existing Site 11.5 15 19.2 23.8 11.5 9.9 0.6 -27.8 -100 CNRL 12-31-57-04-W4M CNRL_Engine Existing Site 11.5 15.1 19.2 23.9 11.6 10 0.6 -27.7 -100 CNRL 12-07-58-04-W4M CNRL_Engine Existing Site 11.4 15 19.2 23.8 11.5 9.9 0.5 -27.9 -100 CNRL 12-31-57-04-W4M CNRL_Engine Existing Site 11.4 15 19.2 23.8 11.5 9.9 0.5 -27.9 -100 CNRL 12-31-57-04-W4M CNRL_Engine Existing Site 11.4 15 19.2 23.8 11.5 9.9 0.5 -28 -100 CNRL 03-06-58-04-W4M CNRL_Engine Existing Site 11.1 14.8 18.9 23.6 11.2 9.5 -0.1 -29.1 -100 CNRL 05-18-58-04-W4M CNRL_Engine Existing Site 9.9 14.1 18.2 22.7 10.1 8.1 -2.1 -33.3 -100 CNRL 05-18-58-04-W4M CNRL_Engine Existing Site 9.9 14 18.2 22.7 10.1 8 -2.1 -33.4 -100 HP Boiler FD Fan #1 CPF 9.4 20 22.5 20.7 14 5.7 -8.7 -47.7 -100 HP Boiler FD Fan #2 CPF 9.4 20 22.5 20.7 14 5.7 -8.7 -47.6 -100 HP Boiler FD Fan #3 CPF 9.4 20 22.5 20.8 14 5.7 -8.7 -47.6 -100 CNRL 12-18-58-04-W4M CNRL_Engine Existing Site 9.3 13.7 17.8 22.2 9.5 7.3 -3.1 -35.5 -100 CNRL 10-24-58-05-W4M CNRL_Engine Existing Site 7 12.2 16.2 20.4 7.2 4.2 -7.7 -45.1 -100 CNRL 10-24-58-05-W4M CNRL_Engine Existing Site 7 12.2 16.2 20.4 7.2 4.2 -7.7 -45.1 -100 CNRL 08-15-58-05-W4M Well_Built_3 Existing Site 7 24 25.6 14.3 8.6 1.3 2.3 -11.5 -69.2 CNRL 05-19-58-04-W4M CNRL_Engine Existing Site 6.8 12.1 16.1 20.3 7 4 -8.1 -46 -100 CNRL 05-19-58-04-W4M CNRL_Engine Existing Site 6.8 12.1 16.1 20.3 7 4 -8.1 -46 -100 CNRL 05-19-58-04-W4M CNRL_Engine Existing Site 6.8 12.1 16.1 20.3 7 4 -8.1 -46 -100 CNRL 05-19-58-04-W4M CNRL_Engine Existing Site 6.8 12.1 16.1 20.3 7 4 -8.1 -46.1 -100 wellpad piping Wellpad 6.1 25.6 28.3 9.2 3.8 2.9 -0.5 -21.6 -100
Notes:
- 1/3 octave band sound levels are linear (i.e. not A-weighted) - Only those noise sources which result in a contribution greater than 0.0 dBA at the receptor are
shown
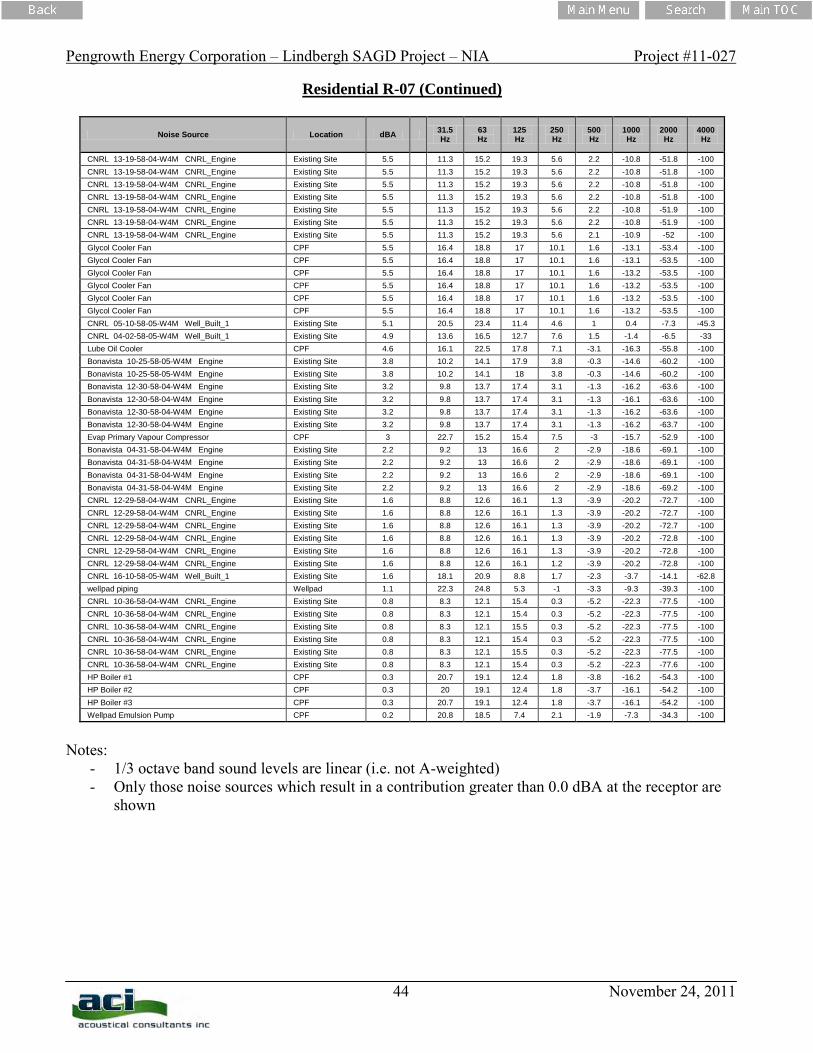
Pengrowth Energy Corporation – Lindbergh SAGD Project – NIA Project #11-027
44 November 24, 2011
Residential R-07 (Continued)
Noise Source Location dBA 31.5 Hz
63 Hz
125 Hz
250 Hz
500 Hz
1000 Hz
2000 Hz
4000 Hz
CNRL 13-19-58-04-W4M CNRL_Engine Existing Site 5.5 11.3 15.2 19.3 5.6 2.2 -10.8 -51.8 -100 CNRL 13-19-58-04-W4M CNRL_Engine Existing Site 5.5 11.3 15.2 19.3 5.6 2.2 -10.8 -51.8 -100 CNRL 13-19-58-04-W4M CNRL_Engine Existing Site 5.5 11.3 15.2 19.3 5.6 2.2 -10.8 -51.8 -100 CNRL 13-19-58-04-W4M CNRL_Engine Existing Site 5.5 11.3 15.2 19.3 5.6 2.2 -10.8 -51.8 -100 CNRL 13-19-58-04-W4M CNRL_Engine Existing Site 5.5 11.3 15.2 19.3 5.6 2.2 -10.8 -51.9 -100 CNRL 13-19-58-04-W4M CNRL_Engine Existing Site 5.5 11.3 15.2 19.3 5.6 2.2 -10.8 -51.9 -100 CNRL 13-19-58-04-W4M CNRL_Engine Existing Site 5.5 11.3 15.2 19.3 5.6 2.1 -10.9 -52 -100 Glycol Cooler Fan CPF 5.5 16.4 18.8 17 10.1 1.6 -13.1 -53.4 -100 Glycol Cooler Fan CPF 5.5 16.4 18.8 17 10.1 1.6 -13.1 -53.5 -100 Glycol Cooler Fan CPF 5.5 16.4 18.8 17 10.1 1.6 -13.2 -53.5 -100 Glycol Cooler Fan CPF 5.5 16.4 18.8 17 10.1 1.6 -13.2 -53.5 -100 Glycol Cooler Fan CPF 5.5 16.4 18.8 17 10.1 1.6 -13.2 -53.5 -100 Glycol Cooler Fan CPF 5.5 16.4 18.8 17 10.1 1.6 -13.2 -53.5 -100 CNRL 05-10-58-05-W4M Well_Built_1 Existing Site 5.1 20.5 23.4 11.4 4.6 1 0.4 -7.3 -45.3 CNRL 04-02-58-05-W4M Well_Built_1 Existing Site 4.9 13.6 16.5 12.7 7.6 1.5 -1.4 -6.5 -33 Lube Oil Cooler CPF 4.6 16.1 22.5 17.8 7.1 -3.1 -16.3 -55.8 -100 Bonavista 10-25-58-05-W4M Engine Existing Site 3.8 10.2 14.1 17.9 3.8 -0.3 -14.6 -60.2 -100 Bonavista 10-25-58-05-W4M Engine Existing Site 3.8 10.2 14.1 18 3.8 -0.3 -14.6 -60.2 -100 Bonavista 12-30-58-04-W4M Engine Existing Site 3.2 9.8 13.7 17.4 3.1 -1.3 -16.2 -63.6 -100 Bonavista 12-30-58-04-W4M Engine Existing Site 3.2 9.8 13.7 17.4 3.1 -1.3 -16.1 -63.6 -100 Bonavista 12-30-58-04-W4M Engine Existing Site 3.2 9.8 13.7 17.4 3.1 -1.3 -16.2 -63.6 -100 Bonavista 12-30-58-04-W4M Engine Existing Site 3.2 9.8 13.7 17.4 3.1 -1.3 -16.2 -63.7 -100 Evap Primary Vapour Compressor CPF 3 22.7 15.2 15.4 7.5 -3 -15.7 -52.9 -100 Bonavista 04-31-58-04-W4M Engine Existing Site 2.2 9.2 13 16.6 2 -2.9 -18.6 -69.1 -100 Bonavista 04-31-58-04-W4M Engine Existing Site 2.2 9.2 13 16.6 2 -2.9 -18.6 -69.1 -100 Bonavista 04-31-58-04-W4M Engine Existing Site 2.2 9.2 13 16.6 2 -2.9 -18.6 -69.1 -100 Bonavista 04-31-58-04-W4M Engine Existing Site 2.2 9.2 13 16.6 2 -2.9 -18.6 -69.2 -100 CNRL 12-29-58-04-W4M CNRL_Engine Existing Site 1.6 8.8 12.6 16.1 1.3 -3.9 -20.2 -72.7 -100 CNRL 12-29-58-04-W4M CNRL_Engine Existing Site 1.6 8.8 12.6 16.1 1.3 -3.9 -20.2 -72.7 -100 CNRL 12-29-58-04-W4M CNRL_Engine Existing Site 1.6 8.8 12.6 16.1 1.3 -3.9 -20.2 -72.7 -100 CNRL 12-29-58-04-W4M CNRL_Engine Existing Site 1.6 8.8 12.6 16.1 1.3 -3.9 -20.2 -72.8 -100 CNRL 12-29-58-04-W4M CNRL_Engine Existing Site 1.6 8.8 12.6 16.1 1.3 -3.9 -20.2 -72.8 -100 CNRL 12-29-58-04-W4M CNRL_Engine Existing Site 1.6 8.8 12.6 16.1 1.2 -3.9 -20.2 -72.8 -100 CNRL 16-10-58-05-W4M Well_Built_1 Existing Site 1.6 18.1 20.9 8.8 1.7 -2.3 -3.7 -14.1 -62.8 wellpad piping Wellpad 1.1 22.3 24.8 5.3 -1 -3.3 -9.3 -39.3 -100 CNRL 10-36-58-04-W4M CNRL_Engine Existing Site 0.8 8.3 12.1 15.4 0.3 -5.2 -22.3 -77.5 -100 CNRL 10-36-58-04-W4M CNRL_Engine Existing Site 0.8 8.3 12.1 15.4 0.3 -5.2 -22.3 -77.5 -100 CNRL 10-36-58-04-W4M CNRL_Engine Existing Site 0.8 8.3 12.1 15.5 0.3 -5.2 -22.3 -77.5 -100 CNRL 10-36-58-04-W4M CNRL_Engine Existing Site 0.8 8.3 12.1 15.4 0.3 -5.2 -22.3 -77.5 -100 CNRL 10-36-58-04-W4M CNRL_Engine Existing Site 0.8 8.3 12.1 15.5 0.3 -5.2 -22.3 -77.5 -100 CNRL 10-36-58-04-W4M CNRL_Engine Existing Site 0.8 8.3 12.1 15.4 0.3 -5.2 -22.3 -77.6 -100 HP Boiler #1 CPF 0.3 20.7 19.1 12.4 1.8 -3.8 -16.2 -54.3 -100 HP Boiler #2 CPF 0.3 20 19.1 12.4 1.8 -3.7 -16.1 -54.2 -100 HP Boiler #3 CPF 0.3 20.7 19.1 12.4 1.8 -3.7 -16.1 -54.2 -100 Wellpad Emulsion Pump CPF 0.2 20.8 18.5 7.4 2.1 -1.9 -7.3 -34.3 -100
Notes:
- 1/3 octave band sound levels are linear (i.e. not A-weighted) - Only those noise sources which result in a contribution greater than 0.0 dBA at the receptor are
shown
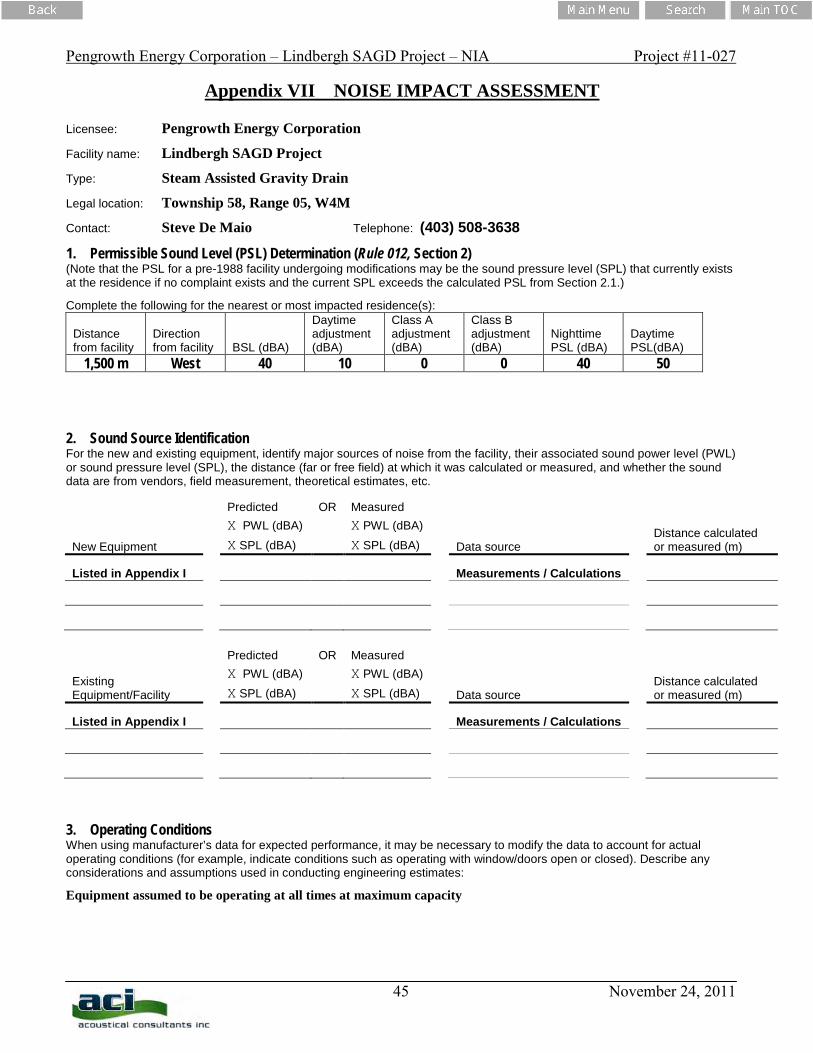
Pengrowth Energy Corporation – Lindbergh SAGD Project – NIA Project #11-027
45 November 24, 2011
Appendix VII NOISE IMPACT ASSESSMENT
Licensee: Pengrowth Energy Corporation
Facility name: Lindbergh SAGD Project
Type: Steam Assisted Gravity Drain
Legal location: Township 58, Range 05, W4M
Contact: Steve De Maio Telephone: (403) 508-3638
1. Permissible Sound Level (PSL) Determination (Rule 012, Section 2) (Note that the PSL for a pre-1988 facility undergoing modifications may be the sound pressure level (SPL) that currently exists at the residence if no complaint exists and the current SPL exceeds the calculated PSL from Section 2.1.) Complete the following for the nearest or most impacted residence(s):
Distance from facility
Direction from facility BSL (dBA)
Daytime adjustment (dBA)
Class A adjustment (dBA)
Class B adjustment (dBA)
Nighttime PSL (dBA)
Daytime PSL(dBA)
1,500 m West 40 10 0 0 40 50 2. Sound Source Identification For the new and existing equipment, identify major sources of noise from the facility, their associated sound power level (PWL) or sound pressure level (SPL), the distance (far or free field) at which it was calculated or measured, and whether the sound data are from vendors, field measurement, theoretical estimates, etc.
New Equipment
Predicted OR Measured
Distance calculated or measured (m)
X PWL (dBA) X PWL (dBA) X SPL (dBA) X SPL (dBA) Data source
Listed in Appendix I Measurements / Calculations
Existing Equipment/Facility
Predicted OR Measured
Distance calculated or measured (m)
X PWL (dBA) X PWL (dBA) X SPL (dBA) X SPL (dBA) Data source
Listed in Appendix I Measurements / Calculations
3. Operating Conditions When using manufacturer’s data for expected performance, it may be necessary to modify the data to account for actual operating conditions (for example, indicate conditions such as operating with window/doors open or closed). Describe any considerations and assumptions used in conducting engineering estimates:
Equipment assumed to be operating at all times at maximum capacity

Pengrowth Energy Corporation – Lindbergh SAGD Project – NIA Project #11-027
46 November 24, 2011
4. Modelling Parameters If modelling was conducted, identify the parameters used (see Section 3.5.1): Ground absorption 0.5, Temperature 100C, Relative Humitidy 70%, all receptors downwind, Following ISO 9613
5. Predicted Sound Level/Compliance Determination Identify the predicted overall (cumulative) sound level at the nearest of most impacted residence. Typically, only the nighttime sound level is necessary, as levels do not often change from daytime to nighttime. However, if there are differences between day and night operations, both levels must be calculated.
Predicted sound level to the nearest or most impacted residence from new facility (including any existing facilities):
Modeled Leq-Night = 34.6 dBA, ASL = 35.0 dBA, Overall Leq-Night = 37.8 dBA, PSL-Night: 40 dBA
Is the predicted sound level less than the permissible sound level? YES If YES, go to number 7 6. Compliance Determination/Attenuation Measures (a) If 5 is NO, identify the noise attenuation measures the licensee is committing to:
Predicted sound level to the nearest or most impacted residence from the facility (with noise attenuation measures):
N/A
Is the predicted sound level less than the permissible sound level? YES If YES, go to number 7 (b) If 6 (a) is NO or the licensee is not committing to any noise attenuation measures, the facility is not in compliance. If further attenuation measures are not practical, provide the reasons why the measures proposed to reduce the impacts are not practical. Note: If 6 (a) is NO, the Noise Impact Assessment must be included with the application filed as non-routine.
7. Explain what measures have been taken to address construction noise. Advising nearby residents of significant noise sources and appropriately scheduling Mufflers on all internal combustion engines Taking advantage of acoustical screening Limiting vehicle access during night-time
8. Analyst’s Name : Steven Bilawchuk, M.Sc., P.Eng.
Company: ACI Acoustical Consultants Inc.
Title: Director
Telephone: (780) 414-6373 Date: November 24, 2011