Embed Size (px)
Citation preview

1
PENETRADAR IRIS
GROUND PENETRATING RADAR

2
Table of Contents
Introduction ……………………………………………………………...…..………3
Description ……………………………………………………………..…...….…….4
Waveform Display Mode …………………………………………………………..5
Calibration Menu ……………………………………………………….……..……7
Free Space Calibration ……………………...…………………………….…………….7
Flat Metal Plate Calibration …………………...………………………………………9
DMI Calibration …………………………………………...…………………………..11
Time Scale Calibration …………………………….………………….……………….13
Data Acquisition Mode ……………………………….………….….…….………15
Measure Menu ………………………………………….…….…….….….......…..16
Color Profile Plot …………………………………………………………….…….18
Measurement Results ……………………………………………….…….………20

3
Introduction
The Penetradar Integrated Radar Inspection System (IRIS) combines ground penetrating radar
technology with data acquisition and data processing hardware and software into an integrated
and automatic GPR system.
Penetradar IRIS family of GPR systems have the ability to "see" through solid materials such
as asphalt, concrete and soil providing unique information on the condition and thickness of
the material examined. Penetradar's wide range of non-contacting antennas are ideally suited
for pavement, bridge deck, tunnel and runway inspection applications, such as the
measurement of pavement layer thickness, detection of voids beneath rigid pavement and
moisture accumulation within base layers. The IRIS is also used to detect corrosion related
delamination and deterioration of bridge deck concrete. When used with ground contacting
antennas the IRIS GPR systems can be used to detect pipes and utility lines, underground
storage tanks (UST's) and for many other geophysical inspection applications.

4
Description
The Radar Data Acquisition (RDA) software was specifically developed for high speed data
acquisition. The software provides maximum flexibility to the users for different applications.
The RDA software has two operational modes: Waveform Display Mode and Data
Acquisition Mode.
Waveform Display Mode: Displays radar data in real-time eliminating the use of
conventional oscilloscope.
Data Acquisition Mode: Allows real-time data collection at highway speeds, with up to four
Penetradar PS-24 radar systems installed.
To start the Radar Data Acquisition application, click the RDA program icon in the IRIS
software program group; or click START, point to Penetradar IRIS and select Radar Data
Acquisition.
The RDA main menu includes: File, View, Set, Calibration, Measure, Display, Acquire
and Help which are shown in Figure 1. The control buttons on the tool bar are assigned to
perform the following task:
Buttons 1...4: Enable/disable data acquisition at signal channel 1...4, respectively.
Button 5: Show/hide waveform display from the Test Port located on the front panel of the
ACPRO computer.
Button 6: Show/hide DMI signals.
Button "NS/MS": Toggle to display signals either in sampled-time (ms) or in real-time unit
(ns).
Button "Signal Preprocessing": Toggle to enable/disable signal preprocessing functions.
Button "Internal DMI": Toggle to enable/disable internal DMI counts (simulated DMI
signals).
Button "Display/Freeze Real-Time Signal": Toggle to display or freeze radar signals on
screen.
Button "Start Data Acquisition": Press to start RDA operation.
Button "Stop Data Acquisition": Press to stop RDA operation.
The radar data file has a fixed size file header which contains the acquisition parameters. The
DMI count associated with each radar signal is stamped to the data for the purpose of
identifying distance location on the structure.
To enhance signal qualities, the RDA software is also equipped with functions to conduct
Calibration measurements and Signal Preprocessing.

5
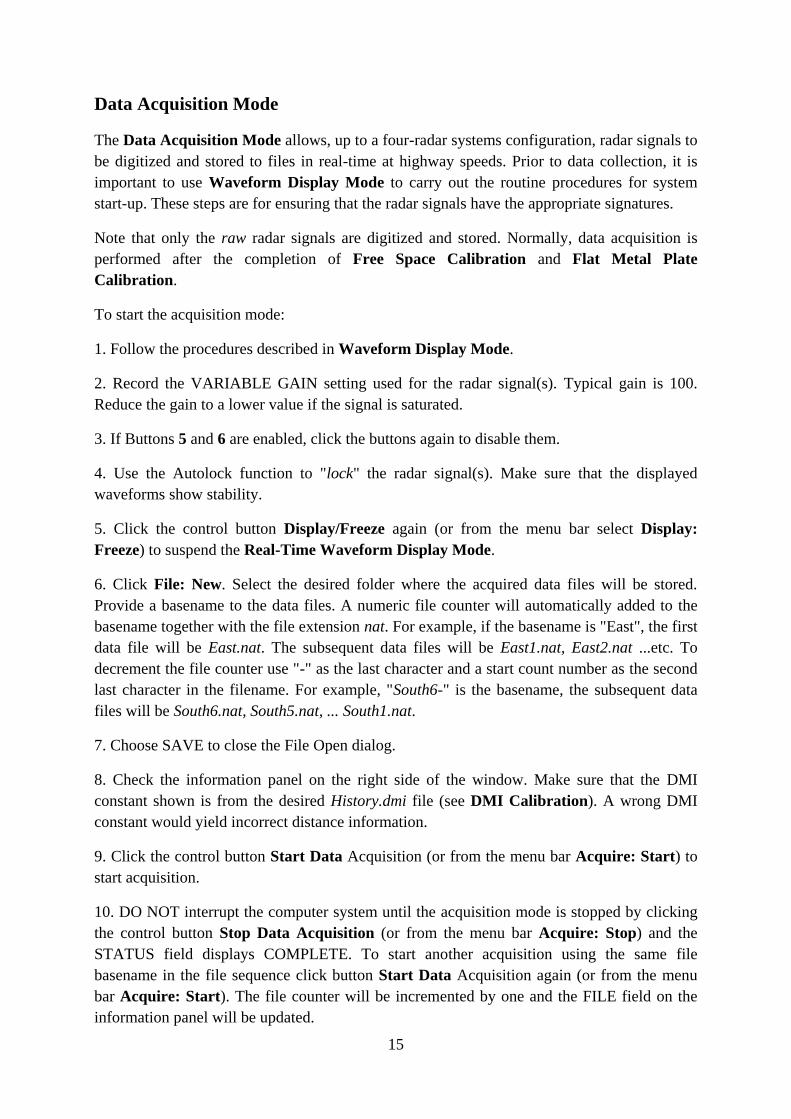
Figure 1. Software window
Waveform Display Mode
The Waveform Display Mode displays the real-time response of radar signals on the
computer screen thus eliminating the needs of using conventional oscilloscope for system
monitoring.
The Waveform Display Mode is normally the routine procedures used in the Penetradar IRIS
system start-up. These steps are for ensuring that the radar signals have the proper signatures
as described in the Penetradar IRIS Hardware Operation Manual.
To start the display mode:
1. In the Penetradar IRIS program group click Radar Data Acquisition; or click START,
point to Penetradar IRIS and select Radar Data Acquisition. The application window with
the title "IRIS-Real-time Data Acquisition Utility" appears on the screen.
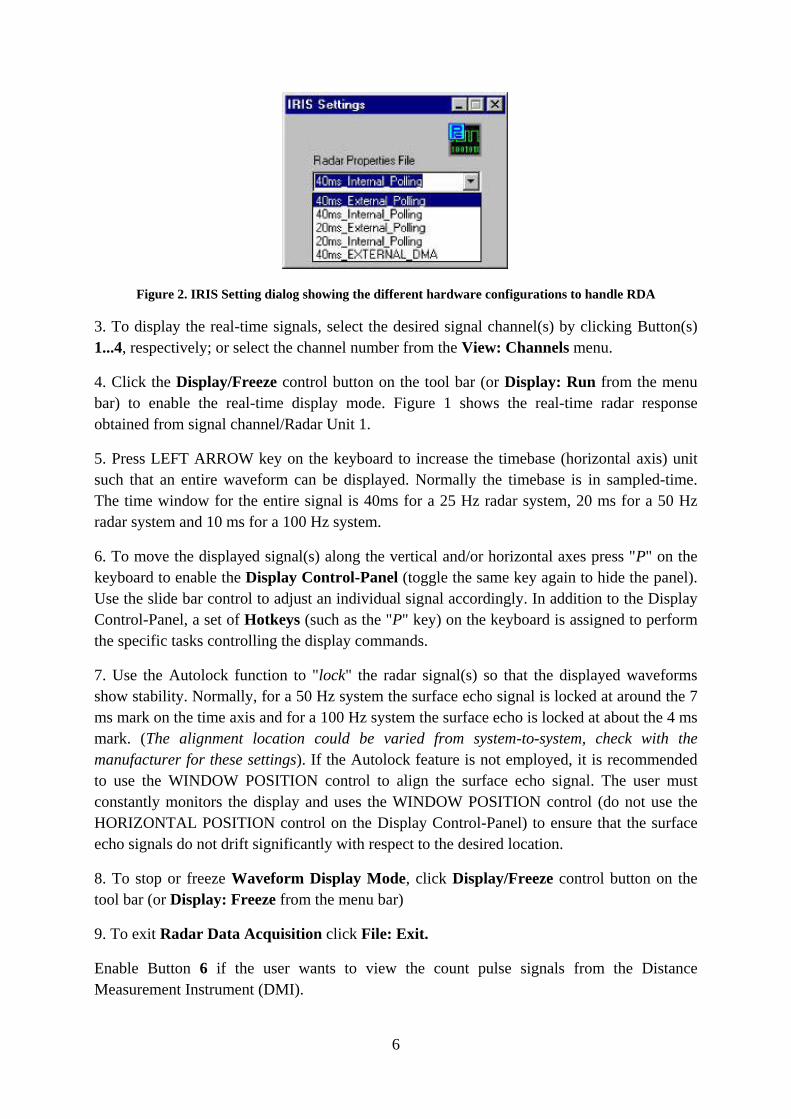
2. From the menu bar select Set: IRIS Settings to display the IRIS Settings dialog box as
shown in Figure 2:
The list box RADAR PROPERTIES FILE contains several sets of hardware specifications.
Select the one, recommended by the manufacturer, which agrees with the user's hardware
configuration.
6
Figure 2. IRIS Setting dialog showing the different hardware configurations to handle RDA
3. To display the real-time signals, select the desired signal channel(s) by clicking Button(s)
1...4, respectively; or select the channel number from the View: Channels menu.
4. Click the Display/Freeze control button on the tool bar (or Display: Run from the menu
bar) to enable the real-time display mode. Figure 1 shows the real-time radar response
obtained from signal channel/Radar Unit 1.
5. Press LEFT ARROW key on the keyboard to increase the timebase (horizontal axis) unit
such that an entire waveform can be displayed. Normally the timebase is in sampled-time.
The time window for the entire signal is 40ms for a 25 Hz radar system, 20 ms for a 50 Hz
radar system and 10 ms for a 100 Hz system.
6. To move the displayed signal(s) along the vertical and/or horizontal axes press "P" on the
keyboard to enable the Display Control-Panel (toggle the same key again to hide the panel).
Use the slide bar control to adjust an individual signal accordingly. In addition to the Display
Control-Panel, a set of Hotkeys (such as the "P" key) on the keyboard is assigned to perform
the specific tasks controlling the display commands.
7. Use the Autolock function to "lock" the radar signal(s) so that the displayed waveforms
show stability. Normally, for a 50 Hz system the surface echo signal is locked at around the 7
ms mark on the time axis and for a 100 Hz system the surface echo is locked at about the 4 ms
mark. (The alignment location could be varied from system-to-system, check with the
manufacturer for these settings). If the Autolock feature is not employed, it is recommended
to use the WINDOW POSITION control to align the surface echo signal. The user must
constantly monitors the display and uses the WINDOW POSITION control (do not use the
HORIZONTAL POSITION control on the Display Control-Panel) to ensure that the surface
echo signals do not drift significantly with respect to the desired location.
8. To stop or freeze Waveform Display Mode, click Display/Freeze control button on the
tool bar (or Display: Freeze from the menu bar)
9. To exit Radar Data Acquisition click File: Exit.
Enable Button 6 if the user wants to view the count pulse signals from the Distance
Measurement Instrument (DMI).
7
Calibration Menu
The Calibration menu contains four different selections: Free Space Calibration, Flat Plate
Calibration, DMI Calibration and Time Scale Calibration.
Free Space Calibration: Collect the template data from free space. The data is used in
Clutter Removal function.
Flat Plate Calibration: Acquire the template data from flat metal plate. The data is used in
Surface Decorrelation function and calculating the relative dielectric constant of the top layer
material.
DMI Calibration: Compute the DMI constant for distance accuracy.
Time Scale Calibration: Check the radar "time scale factor".
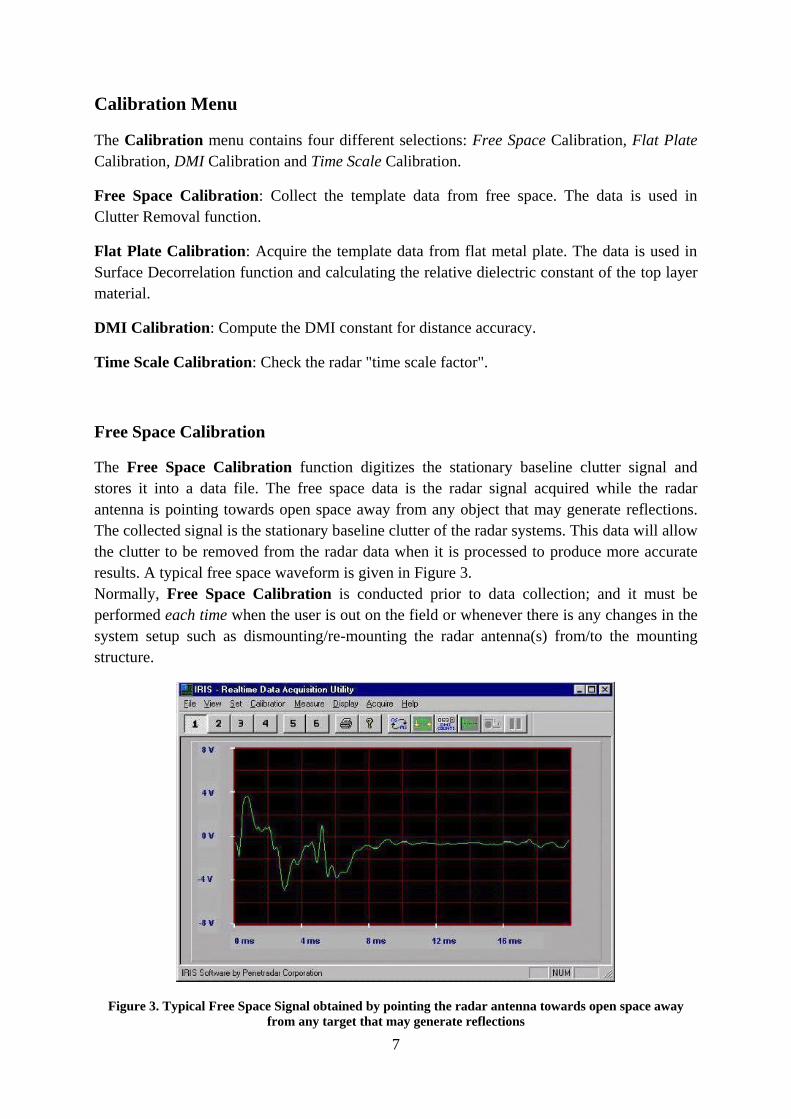
Free Space Calibration
The Free Space Calibration function digitizes the stationary baseline clutter signal and
stores it into a data file. The free space data is the radar signal acquired while the radar
antenna is pointing towards open space away from any object that may generate reflections.
The collected signal is the stationary baseline clutter of the radar systems. This data will allow
the clutter to be removed from the radar data when it is processed to produce more accurate
results. A typical free space waveform is given in Figure 3.
Normally, Free Space Calibration is conducted prior to data collection; and it must be
performed each time when the user is out on the field or whenever there is any changes in the
system setup such as dismounting/re-mounting the radar antenna(s) from/to the mounting
structure.
Figure 3. Typical Free Space Signal obtained by pointing the radar antenna towards open space away
from any target that may generate reflections

8
To acquire Free Space signals:
1. Set up Radar Data Acquisition as described in Waveform Display Mode.
2. If Buttons 5 and 6 are enabled, click the button again to disable them.
3. Make sure that the vehicle is at parking position; mount all radar antennas pointing upward
toward open space.
4. Check the signal(s) again to ensure that Autolock is still engaged. Minor adjustment using
the WINDOW POSITION control may be required.
5. Record the VARIABLE GAIN setting used for the Free Space signal. Typical gain is 100.
6. Click the Display/Freeze toolbar button (or from the menu select Display: Freeze) to
suspend Waveform Display Mode.
7. Click File: New. Select the desired folder where the Free Space data file will be stored.
Click CANCEL to close the dialog box. If the users do not specify any folder, by default the
data file will be saved to folder ..\IRIS\Output.
8. Click Calibration: Free Space to set up Free Space data acquisition. The default file name
for the first file is Fspace1.nat; Fspace2.nat for the second file and etc., where the numeral
"1" and "2" are the file counter. Normally, a single data file can be used to hold the free space
data from all four units.
9. Click the Start Data Acquisition toolbar button (or from the menu select Acquire: Start)
to start Free Space data acquisition. The information panel on the right-side of the viewing
window indicates the acquisition status. Observe the signals displayed on the screen. DO
NOT interrupt the computer system or go near to the antennas.
10. Acquisition stops when the file size reaches a certain size (usually several hundreds of
kilobytes depending on the number of Radar Units used). To override this situation, click the
control button Enable/Disable Internal DMI to enable simulated DMI signals. This feature
allows a continuous stream of data to be acquired until the operation is stopped by clicking
the Stop Data Acquisition control button. The internal DMI mode must be manually disabled
by toggling the Enable/Disable Internal DMI control button again otherwise the actual DMI
signals may not be used by the RDA software.
11. On the information panel, the message COMPLETE is shown in the STATUS field.
Click the Stop Data Acquisition toolbar button (or from the menu select Acquire: Stop) to
stop Free Space data acquisition.
Note that if the users re-run Free Space Calibration, any current free space files on the same
folder will be replaced. It is important to save/rename the current files.

9
Flat Metal Plate Calibration
The Flat Metal Plate Calibration function collects and stores the reflection from the flat
metal plate into a data file. The flat metal plate signal is the radar signal reflected from a flat
metal plate with the antenna mounted at the operating height. This data will allow the
processing algorithm to remove the strong surface echo from the data and determine the
power of the radar signal emitted towards the ground surface. A typical flat metal plate
waveform is given in Figure 4.
Normally, the Flat Metal Plate Calibration is conducted prior to data collection; and it must
be performed each time when the user is out on the field or whenever there is any changes in
the system setup such as changing operating height or dismounting/re-mounting the radar
antenna(s) from/to the mounting structure.
Figure 4. Typical Flat Metal Plate Signal obtained by mounting the radar antenna at operating height
above a flat metal plate
To acquire Flat Metal Plate signals:
1. Set up Radar Data Acquisition as described in Waveform Display Mode.
2. If Buttons 5 and 6 are enabled, click the buttons again to disable them.
3. Make sure that the vehicle is at parking position, select an operating height and mount all
radar antennas pointing straight downward towards the ground surface.
4. Place a flat metal plate (at least 1 meter square in size) on the ground and center it beneath
the first radar antenna.

10
5. Click File:New. Select the desired folder where the Flat Plate data will be stored. Click
CANCEL to close the dialog box. If the users do not specify any folder, by default the data
file will be saved to ..\IRIS\Output.
6. Check the signal(s) again to ensure that Autolock is still engaged. Minor adjustment using
the WINDOW POSITION control may be required.
7. Record the VARIABLE GAIN setting used for the Flat Metal Plate signal. Typical gain is
40.
8. Click the Display/Freeze toolbar button (or from the menu select Display: Freeze) to
suspend Waveform Display Mode.
9. Click Calibration: Flat Plate to set up Flat Plate data acquisition. The default file name
for the first file is Fplate1.nat and second file is Fplate2.nat etc., where the numeral "1" and
"2" are the file counter. The flat plate data should be acquired at one Radar Unit per time and
the data file should only have the flat plate data for that respective channel (i.e. there should
be four flat plate data files for a four-radar units configuration). For multiple radars
configuration, enable all signal channels in Flat Plate Calibration. For example for a three
radar antennas system, Fplate1.nat will have the flat plate data on signal channel 1;
Fplate2.nat will have the flat plate data on signal channel 2 and Fplate3.nat will have the flat
plate data on signal channel 3.
10. Acquisition stops when the file size reaches a certain size (usually several hundreds of
kilobytes depending on the number of Radar Units used). To override this situation, click the
control button Enable/Disable Internal DMI to enable simulated DMI signals. This feature
allows a continuous stream of data to be acquired until the operation is stopped by clicking
the Stop Data Acquisition control button. The internal DMI mode must be manually disabled
by toggling the Enable/Disable Internal DMI control button again otherwise the actual DMI
signals may not be used by the RDA software.
11. On the information panel, the message COMPLETE is shown in the STATUS field. Click
the Stop Data Acquisition toolbar button (or from the menu select Acquire: Stop) to stop
Flat Metal Plate data acquisition.
12. Move the flat plate over to the next radar antenna. Repeat Steps 6 to11 for each individual
radar antenna.
Note that if the users re-run Flat Metal Plate Calibration, any current flat metal plate files
on the same folder will be replaced. It is important to save/rename the current files.

11
DMI Calibration
The DMI Calibration performs the calibration of the DMI that is to be used for the distance
measurement during acquisition. The calibration constant, called DMI constant (cm/pulse),
indicates the distance resolution of the DMI relating to the vehicle in use. DMI calibration
should be performed at least ones every six month period or whenever the users find the
calibration constant needed to be updated.
To start DMI calibration:
1. Mark the start and end lines for a known distance (recommend to use at least 1000 feet) for
which the GPR vehicle will be traveled on for the DMI calibration.
2. Click Calibration: DMI to display the DMI Calibration dialog as shown in Figure 5.
Figure 5. DMI CALIBRATION showing the dialog from CALIBRATE DMI tab.
3. Select the DMI CALIBRATION tab and enter the distance to be traveled in the
CALIBRATE DISTANCE field. Select the proper unit in the MEASUREMENT UNITS
field.
4. Click START and start driving the vehicle forward away from the start line at normal
speed. The distance traveled is shown in the COMPUTED DISTANCE data field. This value
is the product of the DMI constant shown in the CURRENT DMI CONSTANT data field and
the number of DMI pulses indicated in the NUMBER OF DMI PULSES data field
5. Click STOP when the vehicle comes to a full stop at the end line. The new constant is
displayed in NEW DMI CONSTANT field.

12
6. Click APPLY NEW to use the new DMI constant in the CURRENT DMI CONSTANT
field.
7. Repeat Steps 5 to 7 until the measurement in the COMPUTED DISTANCE field agrees
well with the actual distance traveled.
8. Click OK to save the new DMI constant to the file History.dmi. By default, this file is
saved in the folder ..\IRIS\Software\Latest. To abort any changes click CANCEL.
To select any previous DMI constants saved in the History.dmi file, click the DMI HISTORY
tab to display the dialog as shown in Figure 6. Choose the desired value and click APPLY
DMI CONSTANT FROM THE LIST button to load the value to the SELECTED DMI
CONSTANT field. The value in the CURRENT DMI CONSTANT field in the DMI
CALIBRATION Tab will be automatically updated.
Figure 6. DMI CALIBRATION showing the DMI HISTORY tab dialog
The users can also type in a user-defined constant in the SELECTED DMI CONSTANT field.
Click the SET USER DEFINED DMI CONSTANT button, provide the desired value in the
SELECTED DMI CONSTANT field, and click the APPLY USER DEFINED DMI
CONSTANT button to load the user-defined constant to the CURRENT DMI CONSTANT
field in the DMI CALIBRATION tab.
The Radar Data Acquisition software requires the History.dmi file in ..\Software\Latest
folder, otherwise the latest DMI constant will not be used. If History.dmi is not in
..\Software\Latest folder, it is necessary to move/copy the file to the said folder.

13
Time Scale Calibration
The Time Scale Calibration is used to check the time calibration factor of the radar
hardware. The radar system is delivered with a factory setting for time calibration factor.
For example, a factor of 1 is interpreted as 1.0 nanosecond (real-time) equivalent to 1.0
millisecond (sampled-time). For maximum accuracy in range or depth measurement, a time
calibration should be performed on six month intervals. The time calibration factor can be
user adjusted. This adjustment is designated as CAL and is located on the Radar Unit front
panel. Rotation of the recessed potentiometer alters the time calibration factor.
To perform time scale calibration:
1. Make sure that the vehicle is at parking position. Mount the radar antennas so that they can
provide at least 16 inches clearance from the ground surface.
2. Put an object, for instance an empty carton box, on the ground with the height dimension of
about 12 inches directly underneath the desired antenna. Place the flat metal plate on top of
the object and center under the antenna.
3. Follow the procedures described in Waveform Display Mode.
4. From the tool bar select the desired signal channel where time scale calibration will be
performed. Observe the waveform on the screen. Locate the surface echo signal.
5. Click the mouse right button to display a vertical marker line. Align this line with the
surface echo peak.
6. Remove the object. Place the flat metal plate on the ground, center and directly under the
same antenna.
7. Do not move/drag the existing marker line. Observe the new waveform and locate the new
surface echo signal.
8. Click the mouse right button again to display a second marker line. Align this line with the
new surface echo peak as shown in Figure 7.
9. From the menu bar click Calibration: Time Scale to display the Time Scale Calibration
dialog as shown in Figure 8.
10. Input the height dimension of the object (or the distance flat plate was raised from the
ground surface to a known height) in the DISTANCE field. Select the proper unit in the UNIT
field. Select the desired Radar Unit in the RADAR field. The time delay, in milliseconds,
between the two marker lines is automatically computed and shown in the MILLISECONDS
field.

14
Figure 7. Radar waveform used for computing time scale calibration factor
Figure 8. Time Scale Calibration dialog
11. Check the value given in the TIME SCALE (ns/ms) field. If the computed value is very
close to the factory setting, time scale calibration is complete. Click DONE to close the
dialog.
12. Check the value given in the TIME SCALE (ns/ms) field. If the computed value does not
agree with the factory setting, adjust the CAL potentiometer (see Penetradar IRIS
Hardware Operation Manual) on the Radar Unit. Repeat Steps 2 to10 until the value in the
TIME SCALE (ns/ms) field matches with the factory setting. Click APPLY TS to accept the
new value. Choose DONE to close the dialog.
Note that the Time Scale Calibration function is only a tool to measure the hardware setting.
The value shown in TIME SCALE (ns/ms) will not be stored to the system.
Therefore it is important to adjust the CAL potentiometer to match the hardware settings.
15
Data Acquisition Mode
The Data Acquisition Mode allows, up to a four-radar systems configuration, radar signals to
be digitized and stored to files in real-time at highway speeds. Prior to data collection, it is
important to use Waveform Display Mode to carry out the routine procedures for system
start-up. These steps are for ensuring that the radar signals have the appropriate signatures.
Note that only the raw radar signals are digitized and stored. Normally, data acquisition is
performed after the completion of Free Space Calibration and Flat Metal Plate
Calibration.
To start the acquisition mode:
1. Follow the procedures described in Waveform Display Mode.
2. Record the VARIABLE GAIN setting used for the radar signal(s). Typical gain is 100.
Reduce the gain to a lower value if the signal is saturated.
3. If Buttons 5 and 6 are enabled, click the buttons again to disable them.
4. Use the Autolock function to "lock" the radar signal(s). Make sure that the displayed
waveforms show stability.
5. Click the control button Display/Freeze again (or from the menu bar select Display:
Freeze) to suspend the Real-Time Waveform Display Mode.
6. Click File: New. Select the desired folder where the acquired data files will be stored.
Provide a basename to the data files. A numeric file counter will automatically added to the
basename together with the file extension nat. For example, if the basename is "East", the first
data file will be East.nat. The subsequent data files will be East1.nat, East2.nat ...etc. To
decrement the file counter use "-" as the last character and a start count number as the second
last character in the filename. For example, "South6-" is the basename, the subsequent data
files will be South6.nat, South5.nat, ... South1.nat.
7. Choose SAVE to close the File Open dialog.
8. Check the information panel on the right side of the window. Make sure that the DMI
constant shown is from the desired History.dmi file (see DMI Calibration). A wrong DMI
constant would yield incorrect distance information.
9. Click the control button Start Data Acquisition (or from the menu bar Acquire: Start) to
start acquisition.
10. DO NOT interrupt the computer system until the acquisition mode is stopped by clicking
the control button Stop Data Acquisition (or from the menu bar Acquire: Stop) and the
STATUS field displays COMPLETE. To start another acquisition using the same file
basename in the file sequence click button Start Data Acquisition again (or from the menu
bar Acquire: Start). The file counter will be incremented by one and the FILE field on the
information panel will be updated.

16
If data acquisition is setup using the file basename format, the function keys [F1] and [F2]
can be used to initiate the acquire start and stop commands.
11. If the vehicle is at parking position (i.e. no DMI signals), only a small number of radar
waveforms will be acquired and save to the data file. To override this situation, click the
control button Enable/Disable Internal DMI to enable simulated DMI signals. This feature
allows a continuous stream of data to be acquired until the operation is stopped by clicking
the Stop Data Acquisition control button. The internal DMI mode must be manually disabled
by toggling the Enable/Disable Internal DMI control button.
Measure Menu
The Measure menu is used to measure the depth thickness from the displayed waveforms.
To use the Measure function:
1. Follow the procedures described in Waveform Display Mode.
2. Select the desired signal channel where waveforms will be measured.
3. Click the Display/Freeze toolbar button (or from the menu select Display: Freeze) to
suspend Waveform Display Mode.
4. Click the mouse right button to display a vertical marker line on the viewing window. Drag
the marker line to align with the surface echo peak as shown in Figure 9.
5. Click the mouse right button again to display a second marker line and align it with the
desired subsurface echo peak as shown in Figure 9.
6. From the menu select Measure: Thickness to display the Thickness Measurement dialog
as shown in Figure 9.
7. Make sure the RADAR field is showing the correct Radar Unit number.
8. From the SELECTED MATERIAL field, select the material to be measured and its typical
relative dielectric constant value is displayed in the DIELECTRIC CONSTANT field; or
select the user-defined option (from the material list) to directly give a specific dielectric
constant value.
17
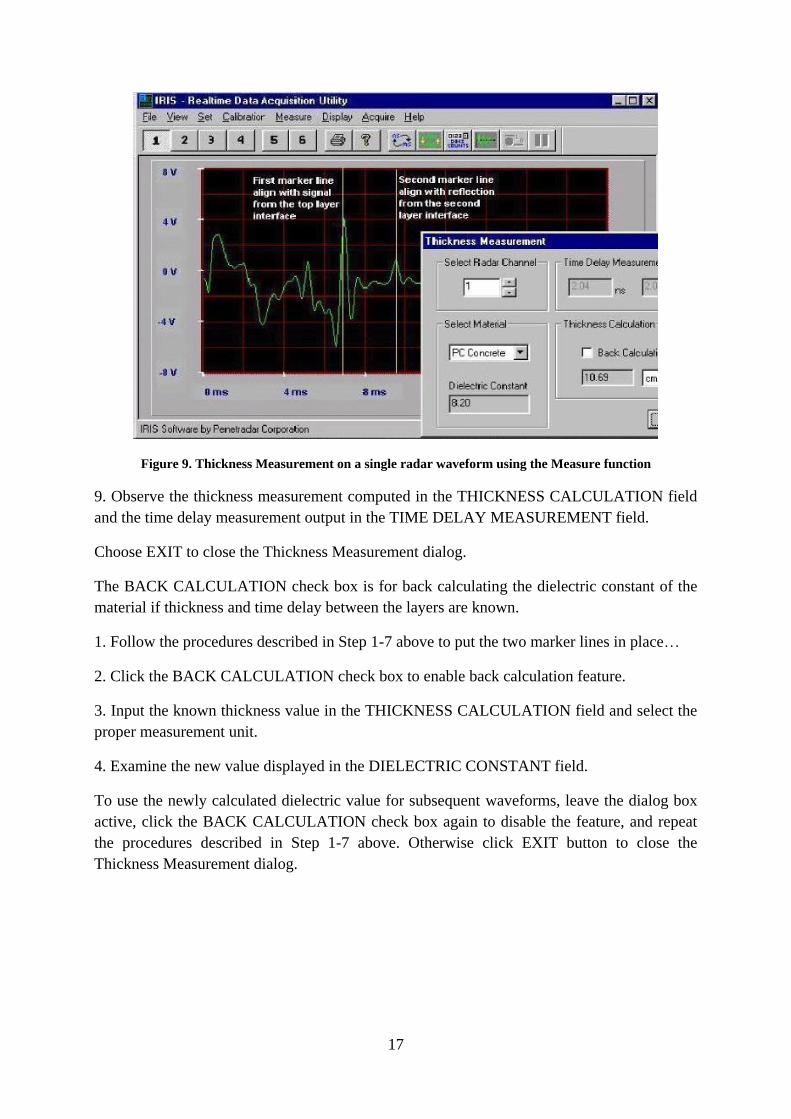
Figure 9. Thickness Measurement on a single radar waveform using the Measure function
9. Observe the thickness measurement computed in the THICKNESS CALCULATION field
and the time delay measurement output in the TIME DELAY MEASUREMENT field.
Choose EXIT to close the Thickness Measurement dialog.
The BACK CALCULATION check box is for back calculating the dielectric constant of the
material if thickness and time delay between the layers are known.
1. Follow the procedures described in Step 1-7 above to put the two marker lines in place…
2. Click the BACK CALCULATION check box to enable back calculation feature.
3. Input the known thickness value in the THICKNESS CALCULATION field and select the
proper measurement unit.
4. Examine the new value displayed in the DIELECTRIC CONSTANT field.
To use the newly calculated dielectric value for subsequent waveforms, leave the dialog box
active, click the BACK CALCULATION check box again to disable the feature, and repeat
the procedures described in Step 1-7 above. Otherwise click EXIT button to close the
Thickness Measurement dialog.

18
Color Profile Plot
The Color Profile Plot displays data in colorized format, showing signal amplitude as color
bands, versus distance traveled as shown in Figure 10. Click the Color Profile Plot icon in
the Penetradar IRIS program group or click Tools: Color Intensity Plot in the Bridge
Processing or Pavement Processing applications. The main window for the Color Profile
Plot program with the menu bar: File, Channel, Scrolling, Settings, View, and Help together
with tool bar appears.
Figure 10. Color Profile Plot displays radar waveforms from signal channel 2
File
Selections in the File menu include:
OPEN: Load the data file, normally *.nat files, to be reviewed as shown in Figure 10.
EXIT: Close the application.
To produce a hardcopy of the displayed waveform, use ALT-PRINT SCREEN to copy the
screen display to the system buffer and paste it to the MS Paint Brush.
Channel
Click #1, 2, 3 or 4 to display waveforms from the desired signal channel (Buttons 1, 2, 3 and 4
on the tool bar have the same effect).
Scrolling
Selections in the Scrolling menu include:

19
LEFT: Left scrolling the display.
RIGHT: Right scrolling the display.
STOP: Stop scrolling.
Note that the direction arrow buttons on the tool bar and horizontal scroll bar have the same
control features.
Settings
Selections in the Settings menu include:
PREPROCESSING: See Signal PreProcessing in Radar Data Acquisition software. Click
the button with the "gears" icon on the tool bar is the same as selecting Settings:
Preprocessing.
OPTIONS: Modify the display settings: Click the button with the " pointing" icon on the tool
bar is the same as selecting Settings: Options.
1. GENERAL SETTINGS TAB: Adjust the display parameters.
2. COLOR SCHEMES TAB: Select the color choice and mapping method in displaying the
radar data.
3. SCOPE SETTINGS TAB: Adjust the scope display settings.
View
Selections in the View menu include:
TOOL BAR: Hide/show the tool bar.
STATUS BAR: Hide/show the status bar.

20
Measurement Results

21

22

23
Milad Aminzadeh
Zurich, 30.11.2012