Embed Size (px)
Citation preview

Journal of Rock Mechanics and Geotechnical Engineering. 2010, 2 (1): 12–31
Pellet mixtures in isolation barriers
E. E. Alonso1*, C. Hoffmann2, E. Romero3 1 Civil Engineering, Technical University of Catalonia, Barcelona, 08034, Spain 2 Technical University of Catalonia, Barcelona, 08034, Spain 3 Geotechnical Laboratory, Technical University of Catalonia, Barcelona, 08034, Spain
Received 15 May 2009; received in revised form 16 October 2009; accepted 15 November 2009
Abstract: Granular mixtures made of high-density pellets of bentonite are being evaluated as an alternative buffer material for waste isolation. Ease of handling is an often-mentioned advantage. The paper describes the experimental program performed to characterize the hydro-mechanical (HM) behaviour of compacted pellet mixtures. Grain size distribution was adjusted to a maximum pellet size compatible with the specimen’s dimensions. Dry densities of statically compacted specimens varied in most of the cases in the range from 1.3 to 1.5 Mg/m3. Pellets had a very high dry density, close to 2 Mg/m3. The outstanding characteristic of these mixtures is their discontinuous porosity. Pore sizes of the compacted pellets varied around 10 nm. However, the inter-pellet size of the pores was four to five orders of magnitude higher. This double porosity and the highly expansive nature of the pellets controlled all the hydraulic and mechanical properties of the mixture.
Performed tests include infiltration tests using different water injection rates and mechanisms of water transfer (in liquid and vapour phases), suction-controlled oedometer tests and swelling pressure tests. The interpretation of some performed tests required back analysis procedures using a hydro-mechanical (HM) computer code.
Material response was studied within the framework of the elastoplastic constitutive model proposed by Alonso et al. (1990) (Barcelona basic model, BBM). Parameters for the model were identified and also a set of hydraulic laws are necessary to perform coupled HM analysis.
A large scale in-situ test (the “EB” test in Mont Terri, Switzerland) was described and analyzed. Rock barrier parameters were adjusted on the basis of available tests. The test excavation, barrier emplacement and forced hydration were simulated by means of the CODE_BRIGHT program. The comparison between measurements and computed results include data on relative humidity in the rock and the buffer, swelling pressures and displacements. Key words: bentonite; partial saturation; suction; granular mixture; in-situ test; hydro-mechanical model; nuclear waste disposal; excavation disturbed zone
1 Introduction A bentonite based pelletized material has been considered as an alternative buffer material for the isolation of high-level radioactive waste. The aim of using bentonite-crushed pellets as filling material in the construction of engineering barriers is to improve some aspects of the barrier emplacement operations and to avoid some difficulties experienced in alter- native concepts previously tested. As the bentonite pellet mixtures can be emplaced using pneumatic projection techniques, the backfilling operation becomes an easier and potentially robotized procedure. Doi: 10.3724/SP.J.1235.2010.00012 *Corresponding author: Tel: +34-93-4017259; E-mail: [email protected]
The “EB” project integrates two main groups of
experimental activities, a real scale test performed at
the underground laboratory of Mont Terri (Switzerland),
and a comprehensive laboratory experimental programme.
Figure 1 shows a cross section of the proposed disposal
concept and a scheme of different activities performed
within the project.
The aim of this paper is: (1) to present the main
results of the experimental programme performed to
characterize the hydro-mechanical response of
compacted pellet’s mixtures; and (2) to describe the
modeling performed. Due to the small amount of free water available in
the host clay shale formation (Opalinus clay), an artificial hydration system was needed in order to saturate the buffer within reasonable testing times. The

E. E. Alonso et al. / Journal of Rock Mechanics and Geotechnical Engineering. 2010, 2 (1): 12–31 13
EB Project
Full scale test Experimental program
Hydro-mechanical characterization of bentonite pellet mixtures
Gain insight into:•Saturated permeability•Total hydration times•Swelling pressure•Compressibility with suction•Influence of the wetting rate
Demonstration test performed in a realistic environment
Validate:•Emplacement operations•Material behaviour•Hydration system
InterpretationNumerical Modelling
CODE_BRIGHT
FRONTAL VIEW
PELLETS
CANISTER
BLOCKS
INJECTORS
Fig.1 EB project. Scheme representing the different activities involved in the project. Cross section of the disposal tunnel and buffer.
saturation process was forced by injecting liquid water
into the buffer material by means of a system of
interconnected tubes (Fig.2). Tubes are connected in
such a way that the water goes into the material from
the front to the back of the small emplacement tunnel
and from the floor to the roof.
CONCRETE BASE
PELLETS
DATA AQUISITION SYSTEM
WA
TE
R(P
ears
on
)
WATER INJECTION POINT
WATER INJECTION SYSTEM (Filled by levels)PAIR
WATER
FRONTAL VIEW
PELLETS
CANISTER
BLOCKS
INJECTORS
WATER
WATER LEVEL 1
LEVEL 2
LEVEL 3
CO
NC
RE
TE
PL
UG
Open to atmosphere
Fig.2 Scheme of the artificial hydration system.
2 Tested material
2.1 Febex bentonite and pellet fabrication procedure
Bentonite pellets were obtained from a Ca-bentonite
powder (FEBEX bentonite [1]). Powder was pre-
heated (120 ºC) and then compacted using a roller
press. As a result of this process, very high dry density
granules with very low water content were obtained.
This process is schematically represented in Fig.3. The
fraction of granules with sizes larger than 10 mm was
used as the base material for the production of pellets
using a jaw crusher. Basic properties of FEBEX
bentonite and the initial compaction state of pellets are
shown in Table 1.
I) Pre-heated bentonite powder 120ºC
(w=3-4%)
II) High dry density granules
ROLLER PRESS
III) Crushing, classification by size
and mixture preparation
d=1.95 Mg/m3
e=0.38
Sro=0.28
s= 250-300 MPa
I) Pre-heated bentonite powder 120ºC
(w=3-4%)
II) High dry density granules
ROLLER PRESS
III) Crushing, classification by size
and mixture preparation
d=1.95 Mg/m3
e=0.38
Sro=0.28
s= 250-300 MPa
Fig.3 Fabrication process of bentonite pellets.
Table 1. Material properties of FEBEX bentonite powder and bentonite pellets.
FEBEX bentonite
Mineral density, s (Mg/m3)
Plastic limit, wP
(%) Liquid limit, wL (%)
Percentage of particles with sizes < 75 m
2.7 47 93 85
Bentonite pellets
Dry density,d (Mg/m3)
Initial void ratio, e0
Initial water content, w0 (%)
Initial suction(MPa)
1.95 0.38 3–4 250–300
2.2 Pellet mixtures and sample preparation
The material tested in the laboratory was based on the pellet mixtures actually used for the emplacement of the EB “in-situ” experiment. Grain size distribution was adjusted to a maximum pellet size compatible with the specimen’s dimensions. A minimum size of 0.4 mm was selected to avoid segregation during sample preparation.
The maximum pellet size used for sample preparation was selected considering the sample size of different testing cells. Dmax = 4 mm was used for test series performed on samples of 50 mm in diameter and 20 mm high. Values of Dmax = 10 or 15 mm were used for tests performed on samples 50 or 75 mm in diameter and 50 or 100 mm high, respectively.
Grain size distribution curves are shown in Fig.4. Fraction passing, p, is calculated by
max min max
min max
/ /100
1 /
D D D Dp
D D
(1)
A pluviation method for specimen preparation leads to very low dry densities (1.05 to 1.15 Mg/m3). Speci- mens have been tested at dry densities in the range from
(1) Pre-heated bentonite powder (120 (℃))
(w = 3%–4%)
Roller press
(2) High dry density granules
Dry density, d = 1.95 Mg/m3 Void ratio, e = 0.38 Degree of saturation, Sro = 0.28 Suction, s = 250–300 MPa
(3) Crushing, classification by size and mixture preparation
EB project
Experimentalprogram
Hydro-mechanical characterization of bentonite pellet mixtures
Gain insight into:·Saturated permeability ·Total hydration times ·Swelling pressure ·Compressibility with suction ·Influence of the wetting rate Frontal view
Pellets
Canister
Blocks
Injectors
numerical modelling code bright
Interpretation
Full scale test Demonstration test performed in a realistic environment
Validate: ·Emplacement
operations ·Material behaviour ·Hydration system
PelletsInjectors
Canister
Blocks
Frontal view Concrete base
Water injection system (filled by levels)
Level 3 Water Pellets
WaterLevel 2
Level 1 Water
Open to atmosphere
PAIR
Wat
er (
Pea
rson
)
Con
cret
e pl
ug
Water injection point Data acquisition system
14 E. E. Alonso et al. / Journal of Rock Mechanics and Geotechnical Engineering. 2010, 2 (1): 12–31
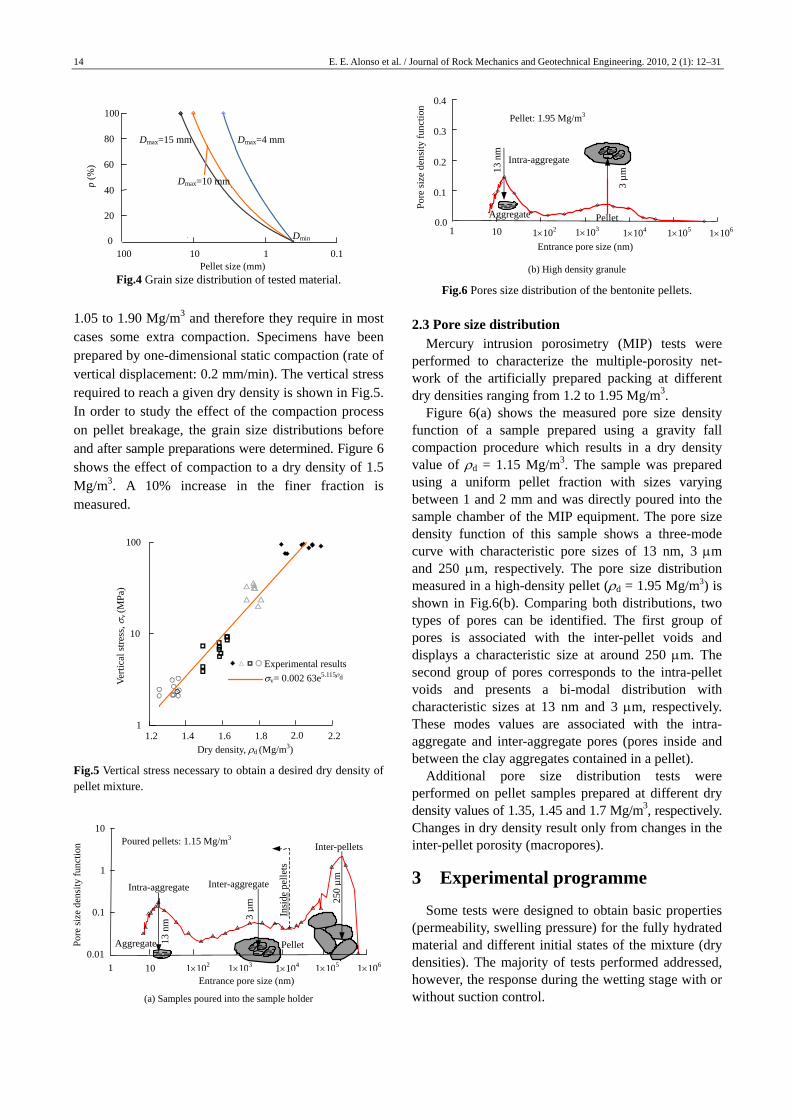
Fig.4 Grain size distribution of tested material.
1.05 to 1.90 Mg/m3 and therefore they require in most cases some extra compaction. Specimens have been prepared by one-dimensional static compaction (rate of vertical displacement: 0.2 mm/min). The vertical stress required to reach a given dry density is shown in Fig.5. In order to study the effect of the compaction process on pellet breakage, the grain size distributions before and after sample preparations were determined. Figure 6 shows the effect of compaction to a dry density of 1.5 Mg/m3. A 10% increase in the finer fraction is measured.
Fig.5 Vertical stress necessary to obtain a desired dry density of pellet mixture.
(a) Samples poured into the sample holder
(b) High density granule
Fig.6 Pores size distribution of the bentonite pellets.
2.3 Pore size distribution Mercury intrusion porosimetry (MIP) tests were
performed to characterize the multiple-porosity net- work of the artificially prepared packing at different dry densities ranging from 1.2 to 1.95 Mg/m3.
Figure 6(a) shows the measured pore size density function of a sample prepared using a gravity fall compaction procedure which results in a dry density value of d = 1.15 Mg/m3. The sample was prepared using a uniform pellet fraction with sizes varying between 1 and 2 mm and was directly poured into the sample chamber of the MIP equipment. The pore size density function of this sample shows a three-mode curve with characteristic pore sizes of 13 nm, 3 m and 250 m, respectively. The pore size distribution measured in a high-density pellet (d = 1.95 Mg/m3) is shown in Fig.6(b). Comparing both distributions, two types of pores can be identified. The first group of pores is associated with the inter-pellet voids and displays a characteristic size at around 250 m. The second group of pores corresponds to the intra-pellet voids and presents a bi-modal distribution with characteristic sizes at 13 nm and 3 m, respectively. These modes values are associated with the intra- aggregate and inter-aggregate pores (pores inside and between the clay aggregates contained in a pellet).
Additional pore size distribution tests were performed on pellet samples prepared at different dry density values of 1.35, 1.45 and 1.7 Mg/m3, respectively. Changes in dry density result only from changes in the inter-pellet porosity (macropores).
3 Experimental programme
Some tests were designed to obtain basic properties (permeability, swelling pressure) for the fully hydrated material and different initial states of the mixture (dry densities). The majority of tests performed addressed, however, the response during the wetting stage with or without suction control.
1.2 1.4 1.6 1.8 2.0 2.21
10
100
Experimental results
v= 0.002 63e5.115d
Dry density, d (Mg/m3)
Ver
tical
str
ess,
v
(MP
a)
0.1
100
0
20
40
60
80
. Dmin
100 10 1Pellet size (mm)
Dmax=4 mm Dmax=15 mm
Dmax=10 mm p (%
)
1106
0.01
0.1
1
10
1 10 1102 1103 1104 1105
Poured pellets: 1.15 Mg/m3
Inter-aggregate Intra-aggregate
Aggregate Pellet 13
nm
3 µ
m 25
0 µ
m
Inter-pellets
Insi
de p
elle
ts
Entrance pore size (nm)
Por
e si
ze d
ensi
ty f
unct
ion
100.0
0.1
0.2
0.3
0.4
1102
Entrance pore size (nm)
Pellet: 1.95 Mg/m3
13 n
m
Intra-aggregate
3 µ
m
Aggregate Pellet1 1105
1104
1106
1103
Por
e si
ze d
ensi
ty f
unct
ion

E. E. Alonso et al. / Journal of Rock Mechanics and Geotechnical Engineering. 2010, 2 (1): 12–31 15
3.1 Saturated mixtures
3.1.1 Permeability
Saturated permeability was determined by means of constant head permeability tests performed on samples prepared at dry density values varying from 1.05 to 1.6 Mg/m3 (Fig.7). The saturated permeability of the material is controlled by the dry density sample and can be described by the following regression:
w dLn 9.73 13.79k (2)
where kw is the saturated permeability (m/s).
Fig.7 Saturated permeability of bentonite pellet mixtures prepared at different dry density values.
3.1.2 Swelling response
The vertical swelling pressure was defined as the vertical stress measured at the end of the test.
Results are presented in Fig.8 together with values reported for the FEBEX bentonite and also the swelling pressure derived from swelling under load tests. Good agreement is observed between pellet mixtures and the results obtained for compacted FEBEX bentonite. The conclusion is that the initial water content (which varies between 4% and 14% in the specimens) does not affect the swelling potential.
Fig.8 Variation of swelling pressure with dry density.
3.2 Hydraulic response during wetting
3.2.1 Water retention curves
Water content-suction relationships were derived from wetting at constant volume tests performed on samples prepared at dry density values of 1.3, 1.5 and 1.95 Mg/m3. Suction was controlled in wetting paths starting at a suction of 300 MPa. A vapour transfer technique was used to control the suction from 300 to 3 MPa. Then the axis translation technique was used to reduce suction values from 3 MPa to zero (saturation). Further details of this technique are described in Ref.[2]. Using this technique, the equilibrium is assumed when no mass exchange is computed.
Measured water retention data are presented in Fig.9 for three densities of compacted specimens. Two different zones can be defined in the retention curves. At high suctions, the influence of void ratio is found to be negligible in the water content-suction relationships of the compacted mixtures. Water is stored within the granules and water content in the sample is mainly dependent on the specific surface of the clay, the soil microstructure and the pore fluid chemistry. As suction decreases and the water content increases enough to partially fill the inter-pellet voids, the suction-water content relationship depends on the void ratio. For modelling purposes, the experimental results were adjusted by means of a modified van Genuchten law given by
11
g gl ll rle
sOsl rl
1 1sP P P PS S
SS S P P
(3)
where rlS is minimum degree of saturation, slS is maximum degree of saturation; Pg and Pl are gas and liquid pressure; OP is air entry value; and , s and Ps are experimental parameters.
Fig.9 Water retention curves obtained during wetting at constant volume in samples with dry density values of 1.3, 1.5 and 1.95 Mg/m3. 3.2.2 Hydraulic response
Slow and fast infiltration tests were performed in order to investigate the wetting rate on the material
0.0 0.1 0.2 0.3 0.4 0.50.01
0.1
1
10
100
1 000
Suc
tion
(M
Pa)
d =1.3 Mg/m3
d =1.5 Mg/m3
d =1.95 Mg/m3
Inter-pellet water
Intra-pellet water
Micro-structural water
Vapour transfer
3 MPa
Axis transfer (Liquid water)
Water content
1.0 1.2 1.4 1.6 1.8 2.011015
11014
11013
11012
11011
11010
1109
1108 Experimental results
Pellets FEBEX bentonite
d (Mg/m3)
k w (
m/s
)
0
2
4
6
8
10
1.2 1.3 1.4 1.5 1.6 1.7 1.8 1.9
12 Wetting under constant load
FEBEX Wetting at constant volume (ENRESA, 2000) Experimental results (swelling pressure tests)
2.0–3.0 MPa
0.5–0.7 MPa
d (Mg/m3)
v(
0) (
MPa
)
16 E. E. Alonso et al. / Journal of Rock Mechanics and Geotechnical Engineering. 2010, 2 (1): 12–31
response. Observed behaviours are described as follows:
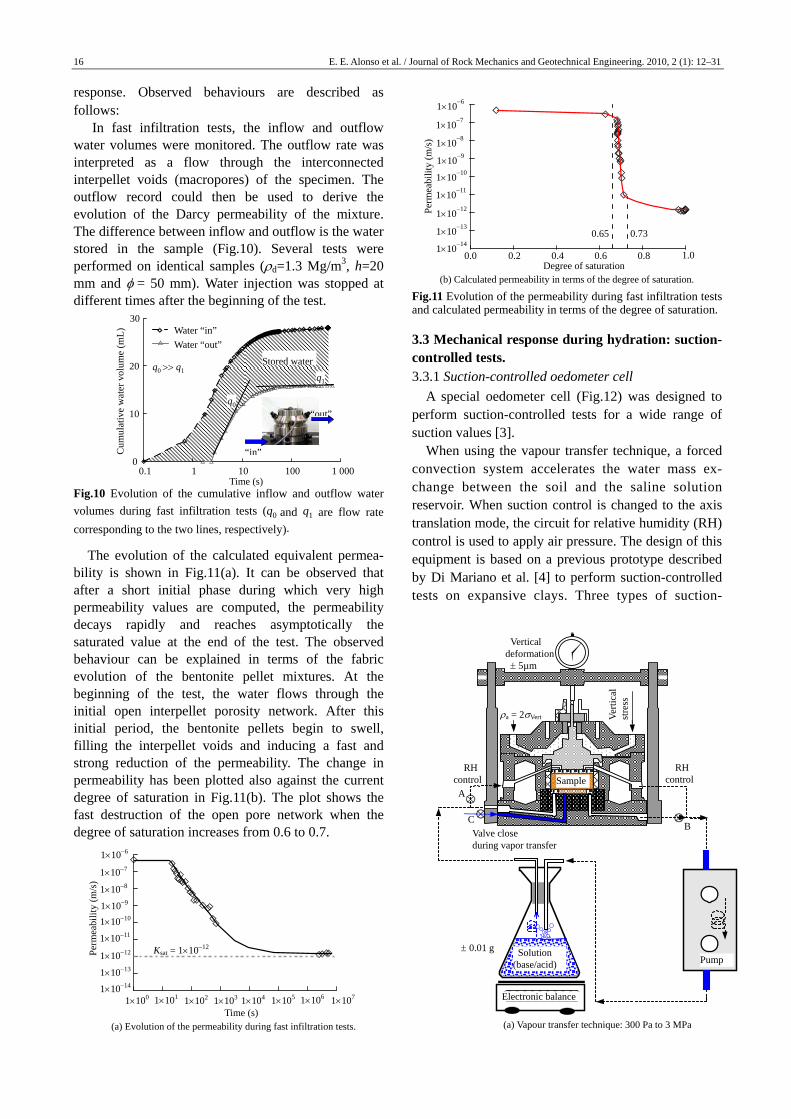
In fast infiltration tests, the inflow and outflow water volumes were monitored. The outflow rate was interpreted as a flow through the interconnected interpellet voids (macropores) of the specimen. The outflow record could then be used to derive the evolution of the Darcy permeability of the mixture. The difference between inflow and outflow is the water stored in the sample (Fig.10). Several tests were performed on identical samples (d=1.3 Mg/m3, h=20 mm and = 50 mm). Water injection was stopped at different times after the beginning of the test.
Fig.10 Evolution of the cumulative inflow and outflow water
volumes during fast infiltration tests (q0 and q1 are flow rate
corresponding to the two lines, respectively).
The evolution of the calculated equivalent permea- bility is shown in Fig.11(a). It can be observed that after a short initial phase during which very high permeability values are computed, the permeability decays rapidly and reaches asymptotically the saturated value at the end of the test. The observed behaviour can be explained in terms of the fabric evolution of the bentonite pellet mixtures. At the beginning of the test, the water flows through the initial open interpellet porosity network. After this initial period, the bentonite pellets begin to swell, filling the interpellet voids and inducing a fast and strong reduction of the permeability. The change in permeability has been plotted also against the current degree of saturation in Fig.11(b). The plot shows the fast destruction of the open pore network when the degree of saturation increases from 0.6 to 0.7.
(a) Evolution of the permeability during fast infiltration tests.
(b) Calculated permeability in terms of the degree of saturation.
Fig.11 Evolution of the permeability during fast infiltration tests and calculated permeability in terms of the degree of saturation.
3.3 Mechanical response during hydration: suction- controlled tests. 3.3.1 Suction-controlled oedometer cell
A special oedometer cell (Fig.12) was designed to perform suction-controlled tests for a wide range of suction values [3].
When using the vapour transfer technique, a forced convection system accelerates the water mass ex- change between the soil and the saline solution reservoir. When suction control is changed to the axis translation mode, the circuit for relative humidity (RH) control is used to apply air pressure. The design of this equipment is based on a previous prototype described by Di Mariano et al. [4] to perform suction-controlled tests on expansive clays. Three types of suction-
30
0.1 1 10 100 1 000 0
10
20
q0
q1
q0 q1 Stored water
“in”
“out”
Water “in”
Water “out”
Time (s)
Cum
ulat
ive
wat
er v
olum
e (m
L)
1100 1102 1104 1106
11011
1108
1107
t
1109
11010
11012
11013
11014
1106
1101 1103 1105 1107
Time (s)
Ksat = 11012
Per
mea
bilit
y (m
/s)
0.0 0.2 0.4 0.6 0.8 1.0
11011
1108
1107
1109
11010
11012
11013
11014
1106
Per
mea
bilit
y (m
/s)
Degree of saturation
0.65 0.73
0.01 g
A
B
(a) Vapour transfer technique: 300 Pa to 3 MPa
Vertical deformation 5µm
a = 2Vert
Sample RH
controlRH
control
C
Valve close during vapor transfer
Pump Solution
(base/acid)
Electronic balance
Ver
tical
st
ress

E. E. Alonso et al. / Journal of Rock Mechanics and Geotechnical Engineering. 2010, 2 (1): 12–31 17
Fig.12 Testing cell and testing configuration used during suction-controlled oedometer tests.
controlled tests were performed: loading at constant suction, wetting at constant load and wetting at constant volume. Stress paths for these tests are sketched in Fig.13.
Fig.13 Different stress paths applied during suction-controlled
tests.
3.3.2 Loading at constant suction Loading at constant suction tests were performed on
samples prepared at dry density values of 1.3, 1.5, 1.7 and 1.95 Mg/m3 in order to examine the evolution of the mixture compressibility with suction and the initial dry density of the sample. Most tests were performed on samples prepared at 1.3 and 1.5 Mg/m3 (the average emplacement dry density was 1.36 Mg/m3 [5]). Typical compressibility curves obtained during these tests are shown in Figs.14 and 15.
Figure 13 shows the effect of suction on the material compressibility whereas the effect of the initial dry density is highlighted in Fig.14. Based on these tests, the elastic and the elastoplastic compressibility coefficients (oed and oed), and the apparent yield (overconsolidation) stress for different suctions were
(a)
(b)
Fig.14 Effect of suction on material compressibility (d=1.5 Mg/m3).
(a)
(b)
Fig.15 Effect of initial dry density on material compressibility. Compressibility curves for samples prepared at dry density values of 1.3 and 1.5 Mg/m3.
derived. Compressibility coefficients and their evolution with suction are presented in Fig.16. It can be observed that material stiffness decreases as suction decreases. The effect of the confining stress is also apparent in the
1.6
1.8
2.0
2.2
10 100 1 000 10 000
oed(sat) = 0.161
1 350 kPa
1 610 kPa
oed(60) = 0.130oed(60) = 0.027
oed(sat) = 0.064
oed(sat) = 0.070
oed(60) = 0.035
60 MPa
Saturated
Net vertical stress (kPa) S
peci
fic
volu
me
(v =
1+
e)
1.6
1.8
2.0
2.2
10 100 1 000 10 000
oed(60) = 0.210
1 260 kPa oed(60) 0.130
oed(60) = 0.05–0.065
d=1.3 Mg/m3
oed(60) = 0.035 1 610 kPa
d=1.5 Mg/m3
oed(60) = 0.027
Net vertical stress (kPa)
Spe
cifi
c vo
lum
e (v
= 1
+e)
Metallic disc
Ver
tical
st
ress
(b) Axis transfer technique: 1.5 MPa to saturation
Vertical deformation 5µm
a = 2Vert
Sample
ua
ua
Air
pre
ssur
e uw
Wat
er p
ress
ure
C Ceramic disc HAEV: 1.5 MPa
Base
10 100 1 000 10 0000.01
0.1
1
10
100
1 000
Wetting
As compacted
Net vertical stress (kPa)
Suc
tion
(M
Pa)
10 100 1 000 10 0000.01
0.1
1
10
100
1 000As compacted d=1.5 Mg/m3
Loading Wetting
d=1.3 Mg/m3
Net vertical stress (kPa)
Suc
tion
(M
Pa)
1
LC
2 3
As compacted
Net vertical stress
Suc
tion
1: Loading at constant suction2: Wetting at constant volume3: Wetting at constant load
O

18 E. E. Alonso et al. / Journal of Rock Mechanics and Geotechnical Engineering. 2010, 2 (1): 12–31
(a) d=1.3 Mg/m3
(b) d=1.5 Mg/m3
Fig.16 Evolution of the material stiffness with suction for samples prepared at dry density values of 1.3 and 1.5 Mg/m3. stiffness parameters. The variation of the yield (overconsolidation) stress with suction is given in Fig.17 for specimens compacted to d =1.3 Mg/m3 and d =1.5 Mg/m3. Loading collapse yield curves which fit the experimental data are also plotted.
(a) d =1.3 Mg/m3
(b) d=1.5 Mg/m3
Fig.17 Evolution of the overconsolidation pressure with suction for samples prepared at dry density values of 1.3 and 1.5 Mg/m3. Load-collapse (LC) yield surfaces are interpolated through test data.
Material response was interpreted within the framework of the elastoplastic model proposed by Alonso et al. [6]. A comparison between experimental compressibility coefficients and the model functions adopted for compressibility coefficients (s) and (s) are shown in Fig.18.
(b) d=1.3 Mg/m3
10 100 1 000 10 0001
10
100
1 000
s =300 MPa
s=60 MPa
Saturation
Net vertical stress (kPa)
1 (
s)
.
10 100 1 000 10 000 1
10
100
s=60 MPa
Saturation
Net vertical stress (kPa)
1 (
s)
Net vertical stress (kPa) 10 100 1 000 10 000
1
10
100
1 000
s=300 MPa
s=60 MPa
s=2 MPaSaturation
1 (
s)
10 000 100 1 000 1
10
100
s=60 MPa
s=2 MPa
Saturation
Net vertical stress (kPa)
1 (
s)
0.01 0.1 1 100.1
1
10
100
1 000
Net vertical stress (MPa)
Suc
tion
(M
Pa)
As compacted
60 MPa
LC
Overconsolidation pressure
0.01 0.1 1 100.1
1
10
100
1 000
Net vertical stress (MPa) S
ucti
on (
MP
a)
Overconsolidation pressure
As compacted
LC
2 MPa
(s
)
0.1 1 10 100 1 000
0.15
0.10
0.05
0.00
s = 300 MPa (test) s = 60 MPa (test)
Saturation
700 MPa
70 MPa
Model
Suction (MPa) (a)
0.1 1 10 100 Suction (MPa)
1 000
0.15
0.10
0.05
0.00
0.20
0.25
(
s)
1 600 kPa
750 kPaSaturation
s=300 MPa (test)
s=60 MPa (test)
Model
E. E. Alonso et al. / Journal of Rock Mechanics and Geotechnical Engineering. 2010, 2 (1): 12–31 19
(c)
(d) d=1.5 Mg/m3
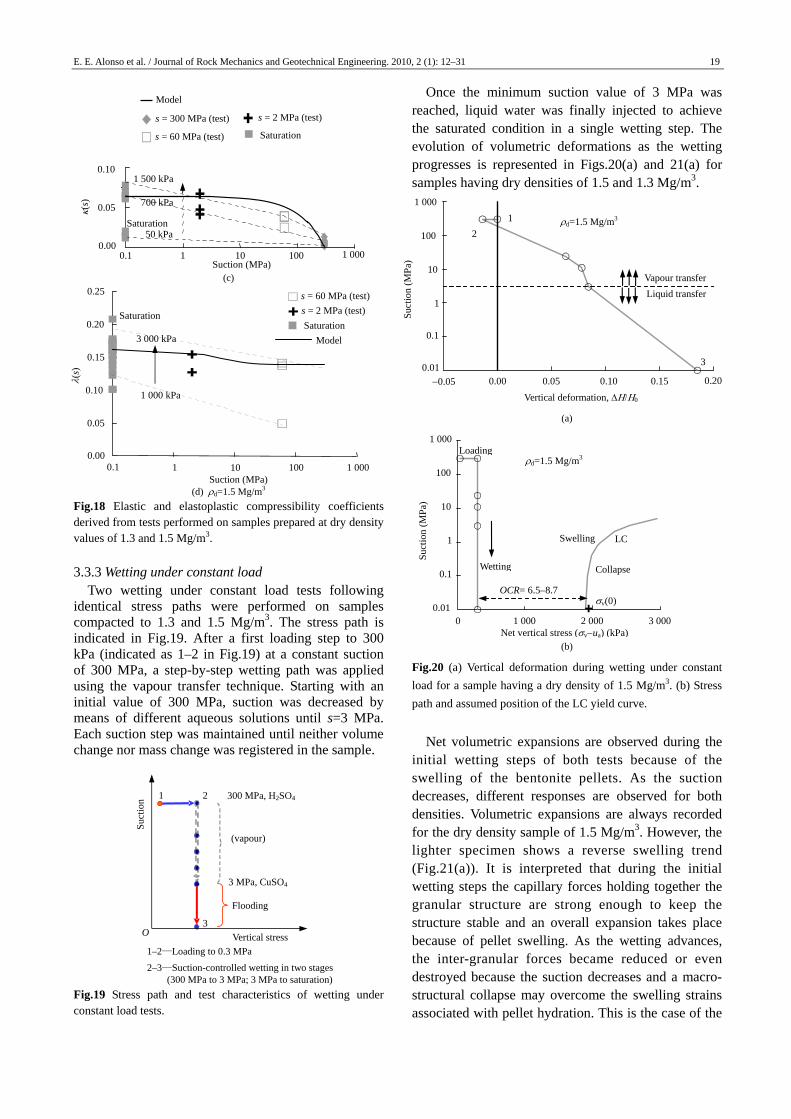
Fig.18 Elastic and elastoplastic compressibility coefficients derived from tests performed on samples prepared at dry density values of 1.3 and 1.5 Mg/m3.
3.3.3 Wetting under constant load Two wetting under constant load tests following
identical stress paths were performed on samples compacted to 1.3 and 1.5 Mg/m3. The stress path is indicated in Fig.19. After a first loading step to 300 kPa (indicated as 1–2 in Fig.19) at a constant suction of 300 MPa, a step-by-step wetting path was applied using the vapour transfer technique. Starting with an initial value of 300 MPa, suction was decreased by means of different aqueous solutions until s=3 MPa. Each suction step was maintained until neither volume change nor mass change was registered in the sample.
Fig.19 Stress path and test characteristics of wetting under constant load tests.
Once the minimum suction value of 3 MPa was reached, liquid water was finally injected to achieve the saturated condition in a single wetting step. The evolution of volumetric deformations as the wetting progresses is represented in Figs.20(a) and 21(a) for samples having dry densities of 1.5 and 1.3 Mg/m3.
(a)
(b)
Fig.20 (a) Vertical deformation during wetting under constant
load for a sample having a dry density of 1.5 Mg/m3. (b) Stress
path and assumed position of the LC yield curve.
Net volumetric expansions are observed during the initial wetting steps of both tests because of the swelling of the bentonite pellets. As the suction decreases, different responses are observed for both densities. Volumetric expansions are always recorded for the dry density sample of 1.5 Mg/m3. However, the lighter specimen shows a reverse swelling trend (Fig.21(a)). It is interpreted that during the initial wetting steps the capillary forces holding together the granular structure are strong enough to keep the structure stable and an overall expansion takes place because of pellet swelling. As the wetting advances, the inter-granular forces became reduced or even destroyed because the suction decreases and a macro- structural collapse may overcome the swelling strains associated with pellet hydration. This is the case of the
(
s)
0.1 101 100 1 000 0.00
0.05
0.10
0.15
0.20
0.25 s = 60 MPa (test)
s = 2 MPa (test)
Saturation
Model
1 000 kPa
3 000 kPa
Saturation
Suction (MPa)
(s)
0.200.05 0.00 0.05 0.10 0.150.01
0.1
1
10
100
1 000
1
2
3
Vertical deformation,
d=1.5 Mg/m3
Vapour transfer
Liquid transfer
Suc
tion
(M
Pa)
0 1 000 2 000 3 0000.01
0.1
1
10
100
1 000
LC
Loadingd=1.5 Mg/m3
Wetting
Swelling
Collapse
OCR= 6.5–8.7v(0)
Net vertical stress (vua) (kPa)
Suc
tion
(M
Pa)
1–2—Loading to 0.3 MPa
2–3—Suction-controlled wetting in two stages (300 MPa to 3 MPa; 3 MPa to saturation)
Vertical stress
1 2
3
Flooding
300 MPa, H2SO4
(vapour)
Suc
tion
3 MPa, CuSO4
O
0.10
0.05
0.00 0.1 1 10 100
Suction (MPa)
s = 300 MPa (test)
s = 60 MPa (test)
s = 2 MPa (test)
Saturation
1 500 kPa
700 kPa
50 kPa
Saturation
Model
1 000

20 E. E. Alonso et al. / Journal of Rock Mechanics and Geotechnical Engineering. 2010, 2 (1): 12–31
(a)
(b)
Fig.21 (a) Vertical deformation during wetting under constant
load for a sample having a dry density of 1.3 Mg/m3. (b) Stress
path and position of the LC yield curve.
lighter specimen (1.3 Mg/m3) when the suction reaches values below 10 MPa.
This process can be interpreted in terms of the BBM model. In the case of the denser specimen (d=1.5 Mg/m3) the stress path followed is developed within the elastic domain and net volumetric expansions take place all along the wetting path. In the second specimen (d=1.3 Mg/m3), the yield curve is closer to the imposed path. After an initial elastic path where swelling deformations are computed, the stress path hits the yield surface and a collapse of the granular structure occurs. The volumetric deformation at the end of the test is, however, a net expansion. 3.3.4 Wetting at constant volume (swelling pressure
tests)
In order to gain an additional insight into the swelling properties of the mixture, controlled wetting under constant volume tests was performed on specimens having dry densities of 1.3 and 1.5 Mg/m3. The stress path is schematically plotted in Fig.22. As shown in previous tests, the vapour transfer technique was first used to apply a step-by-step wetting from 300 to 3 MPa. Once this value was reached, samples were
Fig.22 Stress path and test characteristics of wetting at constant volume tests.
wetted to reach saturation in a single wetting step. The recorded vertical stress and water content
changes as suction is decreased are shown in Fig.23 for the 1.3 Mg/m3 specimen. The data shown in Fig.24 were collected during 3 months. The highest swelling pressure increment is developed in the first wetting stage and it maintains a nearly constant value on further suction decrease. However, a small reduction was detected when suction decreased below 32 MPa.
(a)
(b)
Fig.23 Recorded evolution of vertical swelling pressure and water content of specimen having d= 1.3 Mg/m3 during wetting at constant volume.
The observed behaviour can be explained consi- dering the occurrence of two concurrent phenomena: the expansion of the pellets and the evolution of the intergranular forces upon wetting. Initially, when the suction is reduced, the bentonite granules swell and a net pressure increment is developed to maintain a constant volume condition. During this initial stage,
0 1 000 2 000 3 0000.01
0.1
1
10
100
1 000
d=1.3 Mg/m3
Loading
Wetting
Col
laps
e
OCR= 1.1–1.2
LC
Suc
tion
(M
Pa)
Net vertical stress (kPa)
1
2
3
Flooding
(Slow)
300 MPa, H2SO4
Suc
tion
Vertical stress
As compacted
3 MPa, CuSO4
1–2 Multi-stage wetting
2–3 Fast flooding
O 0.05 0.00 0.05 0.10 0.15 0.20
0.01
0.1
1
10
100
1 000
1
2
3 MPa Vapour transfer
Liquid transfer
d=1.3 Mg/m3
Vertical deformation
Suc
tion
(M
Pa)

E. E. Alonso et al. / Journal of Rock Mechanics and Geotechnical Engineering. 2010, 2 (1): 12–31 21
(a) d=1.3 Mg/m3
(b) d=1.5 Mg/m3
Fig.24 Stress paths of swelling pressure tests.
the stress path is in the elastic region far from the LC yield locus which describes the yielding of the granular fabric. It is interpreted that the intergranular forces are strong enough to keep the granular arrangements stable and no collapse is produced. However, as wetting progresses, the contact between granules decreases in strength and stiffness, the intergranular forces decrease and the overall structure is prone to undergo collapse. Both phenomena coexist during the wetting path. An essentially constant swelling pressure represents a balance between them. The stress path follows approximately the LC yield curve. Figure 24 shows a plot of the swelling pressure evolution during wetting for the two different dry densities tested.
4 Modelling the field behaviour of a granular expansive barrier 4.1 Hydration system
Due to the small amount of free water available in the Opalinus clay shale formation, an artificial hydration system was needed in order to get the buffer saturated within reasonable testing times.
Preliminary simulations indicated that in order to obtain full saturation within the expected times, three layers of hydration points had to be emplaced. A distance of 0.15 m between wetting tubes was suggested.
Based on these recommendations, the hydration
system was designed and built, 37 injection tubes were arranged in a three layer configuration. Additionally, a pervious mat was used to cover the tubes, canister and the bentonite blocks in order to favour the water distribution in these zones (Fig.25). A cross section of the tunnel showing a schematic view of the hydration system is illustrated in Fig.25(a). Tubes were connected in such a way that the water flows into buffer materials from the floor to the roof of the excavation as indicated in Fig.25(b).
Fig.25 Hydration system.
4.2 Instrumentation
A number of sensors were placed at different tunnel sections (Fig.26). Relative humidity sensors (rock and buffer), displacement sensors (canister and rock), piezometers (rock) and total pressure cells (buffer) were placed at different radial distances.
Fig.26 Different tunnel sections for the installation of sensors.
The movement of the canister was monitored by measuring the horizontal and vertical displacements of two fixed points of the canister by means of extensometers located in sections A1 and A2 (Fig.27(a)).
The position of the relative humidity sensors in the cross sections B1 and B2 is shown in Fig.27(b).
0.1 1 100.01
0.1
1
10
100
1 000
LC
1 2
3
Vapour transfer
Axis transfer
Net vertical stress (MPa)
Suc
tion
(M
Pa)
0.1 1 100.01
0.1
1
10
100
1 000
LC
Vapour transfer
Axis transfer
1
2
3
Net vertical stress (MPa)
Suc
tion
(M
Pa)
(a)
(b)
Pellets Injectors
Canister
Blocks
Frontal view Concrete base
Water injection system (filled by levels)
Level 3
Level 2
Water Pellets
Water
Level 1Water
Water injection point Data acquisition system
Volume
Con
cret
e pl
ug
Opened to atmosphere
Wat
er (
Pea
rson
)
PAIR
B1A1 A2 B2 E
C1 C2 D1 D2
Section 0.47
5 m
0.
15 m
0.15
m
0.35
m
0.75 m1.125 m 1.125 m 1.125 m 1.125 m0.75 m
Plug
x =
0.0
0 m
x =
0.7
5 m
x =
1.8
75 m
x =
2.3
5 m
x
= 2
.50
m
x =
3.0
0 m
x =
3.3
5 m
x
= 3
.50
m
x =
4.1
25 m
x =
6.2
5 m
x =
7.0
0 m

22 E. E. Alonso et al. / Journal of Rock Mechanics and Geotechnical Engineering. 2010, 2 (1): 12–31
Fig.27 Location of the different sensors in the buffer. EA: extensometers; WB: relative humidity; PE: total pressure.
Swelling pressure cells were placed in section E at the contacts between the buffer and the canister and between the tunnel wall and the buffer as indicated in Fig.27(c).
The relative humidity sensors placed in sections A1 and A2 are plotted in Fig.28. Their measurements will be later compared with calculations.
Fig.28 Location of the different sensors in the rock. WB: Relative humidity sensors. 4.3 Testing procedure
Due to the high interconnectivity existing in the granular fill because of the large interpellet voids, high initial water injection rates were expected at the beginning of the hydration phase. After this initial period, the bentonite pellets begin to swell filling the interpellet voids, blocking the incoming water and making the water permeability decrease several orders of magnitude. This phenomenon was observed in different infiltration tests performed during the experimental program.
In view of this behaviour, it was decided to apply a high injection pressure, with the purpose of maximi- zing the initial water intake and reducing the expected saturation time.
During the first part of the hydration phase, water pressure was held constant and a volume of 6.7 m3 of water was injected during the first two days. Immediately afterwards, the water injection was stopped because some of the injected water was observed to be coming out of the tunnel. This lost of water was attributed to sealing problems in the concrete plug or, alternatively, to the presence of conductive joints in the rock. No water was injected for 120 days. After this period, water injection was resumed and a total flux rate criterion was adopted to control the injection. A volume of 25 litres per day was injected in two stages (12, 5 litres twice a day, in a ten- minute interval). Figure 29 shows the history of water injection during the period May 2002–January 2004.
Fig.29 Water injection history.
5 Numerical modelling 5.1 Geometry, initial and boundary conditions
The model is shown in Fig.30.
Fig.30 (a) Initial configuration. (b) Tunnel opening. (c) Buffer emplacement and hydration.
EA1/1
EA1/2
EA2/1
EA2/2
(a) Canister displacement
(b) Relative humidity
WB1/1 WB1/2
WB1/3
WB1/4
Section B1
WB2/1 WB2/2
WB2/3
WB2/4
Section B2
(c) Pressure
PE2
PE3
PE4
PE5 PE6
PE7
PE8
PE1
Section E
WB24/10
WB23/06
(a) Section A1 (b) Section A2
WB21/06 WB21/01
WB22/01
WB22/10
WB24/01
WB23/01
20
Automatic injection
1
2
3
6 May 11 Sep.Hydration starts
January 2004
16
12
8
4
0
Inje
cted
wat
er (
103 L
)
120 days
Natural water
redistribution
Simmetry plane axis
v=6.0 MPa PW = 1.0 MPa
Initial stress field
v=6.0 MPa
H=4.8 MPa
Initial stress waterfield
1.0 MPa
PW=1.0 MPa40 m
80 m
PW
=1.
0 M
Pa
HR =93%s=10 MPa
PW
=1.
0 M
Pa
40 m 40 m
v=6.0 MPa
PW = 1.0 MPa v=6.0 MPa
PW = 1.0 MPa
PW
=1.
0 M
Pa
(a) Initial configuration (b) Tunnel opening (c) Buffer emplacement
and hydration

E. E. Alonso et al. / Journal of Rock Mechanics and Geotechnical Engineering. 2010, 2 (1): 12–31 23
5.1.1 Initial state (Fig.30(a))
The two-dimensional plane strain domain considered for the “start” configuration of the problem is 80 m wide and 80 m high (with a central plane of symmetry). This implies a minimum distance of 25RTunnel (RTunnel is the average tunnel radius) from the centre of the EB niche to the boundaries.
An anisotropic stress field with vertical and horizontal stress values of 6.0 and 4.8 MPa, respect- tively, and a constant water pressure field of 1.0 MPa was the assumed initial state. These values were approximated from data available for the Mont Terri site [7]. The following boundary conditions were assumed in calculations:
(1) No horizontal displacement was allowed along vertical boundaries;
(2) No vertical displacement was permitted along the lower horizontal boundary of the considered domain;
(3) A compressive vertical stress of 6.0 MPa was applied along the upper horizontal boundary;
(4) A constant water pressure value of 1.0 MPa was applied along the upper and lower horizontal boundaries of the domain and along the vertical boundary situated far from the tunnel opening. 5.1.2 Tunnel opening (Fig.30(b))
Once the initial state configuration was defined, the tunnel construction was simulated. This part of the analysis provides the stress and water pressure fields, prevailing at the time of buffer emplacement (160 days after tunnel opening in this case) and the expected development of damaged zones around the tunnel (EDZ). A relative humidity, RH=93%, equivalent to a suction of 10 MPa, was adopted as a boundary condition on the tunnel surface. 5.1.3 Buffer emplacement and hydration phase (Fig. 30(c))
Once the tunnel is opened the buffer materials are emplaced and the hydration phase starts. The initial water pressure and stress fields for this stage correspond to the end of the construction period (160 days). The initial and boundary conditions, section shape and distribution of materials for this step are illustrated in Fig.30(c). Suction values of 300 and 150 MPa were assumed as initial values for the bentonite pellet and blocks, respectively. An isotropic state of confining stress of 0.3 MPa was selected as the initial state for both bentonite materials. 5.2 Constitutive models
The host rock and the bentonite fill materials were described by means of elastoplastic models. Perfectly elastic models were utilized to represent the concrete base, the metallic canister and the geotextile material.
The Opalinus clay is a claystone that can be idealized as a composite material, made of a clay matrix interlocked by bonds. A comprehensive description of the Opalinus clay was presented by Pearson et al. [8]. A constitutive model for bonded materials was formulated by Vaunat et al. [9]. Bonds response follows a damage model proposed by Carol et al. [10], whereas the clay matrix was described by means of an elastoplastic model based on a Hoek and Brown failure criterion.
The Terzaghi effective stress principle was adopted. Volumetric changes due to changes in suction are incorporated via the effective stress law. Compacted blocks and the granular pellet fill were described by the elastoplastic model (BBM [6]). Details to the model, parameter description and its application to the modelling of laboratory tests are given by Hoffmann et al. [11]. 5.3 Model parameters
Parameter values for the bentonite blocks were approximated from data reported in the FEBEX final report [1]. For the bentonite pellets, the experimental information discussed by Hoffmann et al. [3] provided the necessary data. The relevant characteristics of the pellet mixtures tested in the laboratory are summarized as follows.
Pellet mixtures exhibit a remarkable multi-modal structure. In general, two groups of voids can be defined. The largest size is associated with the interpellet voids (macropores) whereas the smaller sizes (micropores associated with inter and intra clay aggregates) are found inside the highly compacted pellets. The largest pores disappear not only when the dry density of the mixture increases but also when the mixture is wetted.
The hydraulic response of the material when it is first exposed to a water injection is characterized by the high connectivity of the network of the interpellet voids. Therefore, high inflow rates are expected. However, as the dense pellets hydrate, at the expense of the free circulating water they swell and fill the macropores, and the permeability decreases several orders of magnitude. This behaviour is illustrated in Fig.11 which shows the evolution of the apparent permeability with the degree of saturation observed during an infiltration test [12]. The relationship given in Fig.11 is useful for modelling purposes. It provides the change in the intrinsic permeability and relates it to the degree of saturation, making it possible to conduct realistic flow analysis with limited effort.
The outlined behaviour at microscopic level explains the constitutive response observed when

24 E. E. Alonso et al. / Journal of Rock Mechanics and Geotechnical Engineering. 2010, 2 (1): 12–31
specimens are wetted. If the water infiltrates fast into the sample, the interpellet voids become saturated and the intergranular forces are reduced. Then, a global collapse of the granular structure could take place. It all depends on the stress level existing in the fill. Later, as the expansive pellets hydrate, a swelling response is measured. The macroscopically observed behaviour is the result of both mechanisms and their interaction. In particular, different rates of wetting lead to different mechanical responses.
For modelling purposes, the pellet mixture has been characterized by a modified version of the BBM which incorporates the main features of the behaviour outlined. Experimental data were available for a range of dry densities. Parameters were interpolated for the average “in-situ” dry density (d =1.36 Mg/m3).
Figure 11 suggests that a suitable simplification for the variation of the permeability with saturation is to accept a discrete “two permeability” model. During the fast injection of water (first two days), a high permeability (k=108 m/s) was assumed. The subsequent redistribution period leads to a major reduction in permeability (k=1012 m/s). In fact, the average degree of saturation computed after the initial volume of water was injected when Sr=0.8 was well within the range of “low permeability” shown in Fig.11.
A dependence of the elastic compressibility coeffi- cient oed with the current suction was introduced. The swelling behaviour was modelled through the elastic compressibility coefficient,s. To be realistic, s was made dependent on the net mean stress and suction.
The deviatoric behaviour was characterized by a common critical state slope (M=1.5) and a value k = 0.1.
In order to reproduce the hydraulic response of the bentonite pellet material, a “two permeability” model with intrinsic permeability values ranging from k=1015 to 1020 m2 was adopted. In the case of the bentonite blocks, an intrinsic permeability value of k =1021 m2
was used during all the hydration phase.
6 Comparison between computed results and observed behaviour
6.1 Tunnel construction
Modelling tunnel construction provided water pressure and stress fields at the end of the excavation. They constitute the initial conditions for the buffer hydration phase. It was also useful to obtain some information about the influence of the excavation damaged zone (EDZ) on the barrier performance. In the following
section, the evolution of the water pressure and stress field after tunnel opening and during the ventilation period are presented. A sensitivity analysis of the computed rock response is presented. The effect of the tunnel relative humidity and the rock permeability are explored. A comparison between computed results and measured values is also presented. 6.1.1 Water pressure and stress fields
A ventilation period of 160 days was assumed considering a constant relative humidity value of 93% inside the tunnel. This value was adopted on the basis of some numerical simulations performed during the heating experiment (HE) performed at Mont Terri [13]. Calculated contours of water pressure in the rock after 160 days of ventilation are illustrated in Fig.31. Only positive water pressure values are indicated. The water pressure profile in the rock along a horizontal axis (Ox) is also plotted. Note that a ring of rock, having negative pore pressure, is calculated around the tunnel. It has an average thickness of 1 m. This is indicated also in Fig.32(a). Total stress fields at the end of the 160 day ventilation period are illustrated in Fig.32(b), (c). Stress changes along horizontal and vertical axes
Fig.31 Water pressure field after 160 days of tunnel opening. A drained zone of about 1 m thick is calculated.
(a) Water pressure
Wat
er p
ress
ure
(MPa
)
0 5 10 15 20 2510
8
6
4
2
0
2
Des
atur
ated
zon
e T
unne
l wal
l
Axis Ox (m)
0 2 4 6 8 10 12 140.0
0.5
1.0
1.5
2.0
1.0 MPa
0.215 860.013 245 0.566 69 0.839 61 0.937 29 0.975 36 0.990 92
131 3 5 7 9 11 15
0.372 76
0.461 57
Axis Ox (m) Negativepressure
Wat
er p
ress
ure
(MPa
)
0.5
1.0
1.5
2.0

E. E. Alonso et al. / Journal of Rock Mechanics and Geotechnical Engineering. 2010, 2 (1): 12–31 25
Oy
o
Oy
Ox
(b) Case 2 (c) Case 3
x
y
z
HR=80%s=30 MPa
K=0.51019 m2
o
x
z
x HR=80%s=30 MPa
K=1.11019
m2
o
y
z
HR=93% s=10 MPa
(a) Case 1
y
o
x
K=1.11019 m2
(b) Horizontal stress
(c) Vertical stress
Fig.32 Variation of water pressure and total stress field on horizontal and vertical axes.
are presented. The circumferential stress in the rock reaches a peak at a short distance. It marks the development of the plastic zone, which is a thin layer of rock around tunnel surface.
In order to analyze the influence of the assumed relative humidity during the ventilation phase and the intrinsic permeability value adopted for the rock, a sensitivity analysis was performed. Three different cases were considered combining different values as shown in Fig.33.
Fig.33 Rock intrinsic permeability and tunnel Relative Humidity adopted in calculations.
The relative humidity values were related to suction values by means of the psychometric law given by
w v
w v0
= lnRT u
M u
- (4)
where is the total suction (kPa), w is the water
density (kg/m3), R is the universal gas constant (8.314 32 J/(mol·K)), T is the absolute temperature (K), v is the molecular mass of water (18.016 kg/mol), and uv/uv0 gives the relative humidity as the ratio between the partial pressure of water vapour in the air (uv) and the partial pressure at saturation (uv0).
Suction records based on model predictions and in- situ measurements, once the tunnel was opened, during the ventilation period are shown in Figs.15 and 16 for cross sections A1 and A2, respectively. In all the plots, the history of injected volume of water after the ventilation period is also indicated as a general reference (the water injection phase is described in more detail later).
The two instrumented sections A1 and A2 display almost the same response during this period. According to the values registered in sensors located at a distance of 0.1 m from the tunnel wall, (WB0_01, WB2_01, WB23_01 and WB24_01), the relative humidity value in the rock, near the tunnel wall was about 80% after almost 100 days of ventilation. This is equivalent to a suction of around 30 MPa. On the other hand, sensors located at distances of 0.6 and 1.0 m from the tunnel wall (WB0_06, WB2_10, WB23_06 and WB24_10) registered a relative humidity value of around 95%, indicating a suction value of 7 MPa. The best agreement is found for case 3 (a relative humidity of 89% in the tunnel and a rock intrinsic permeability of 0.51019 m2) although some discrepancies remain. It is concluded that the relative humidity value assumed initially for the ventilation period seems to be higher than the in-situ value. Figures 34 and 35 also point out the dominant effect of rock permeability to control the evolution of the relative humidity inside the rock.
(a) WB0_01
(b) WB2_01
0 5 10 15 20 2510
8
6
4
2
0
)
Stre
ss (
MPa
)
yy
xx
zz
xx
yy
zz
Tun
nel r
oof
wal
l
yy=0 MPa
xx=zz=4.8 MPa
Axis Oy (m)
0 200 400 600 800
0
20
40
60
80
0
4
8
12
16
20
Water injected
Model
Test
Case 1 Case 2 Case 3
10
10
30
50
70
Suc
tion
(M
Pa)
Time (day)
Inje
cted
vol
ume
(m3 )
WB11
Canister
0 200 400 600 8000
4
8
12
16
20
Water injected
0
20
40
60
80
10
10
30
50
70
Suc
tion
(M
Pa)
Case 1Case 2Case 3
Model
Test
Time (day)
WB11
Canister
Inje
cted
vol
ume
(m3 )
yy=6.0 MPa
0 5 10 15 20 2510
8
6
4
2
0 St
ress
(M
Pa)
yy=0 MPa yy
xx
zz
xx
yy
zz
xx=zz=4.8 MPa
Tun
nel s
ide
wal
l
Axis Ox (m)
26 E. E. Alonso et al. / Journal of Rock Mechanics and Geotechnical Engineering. 2010, 2 (1): 12–31
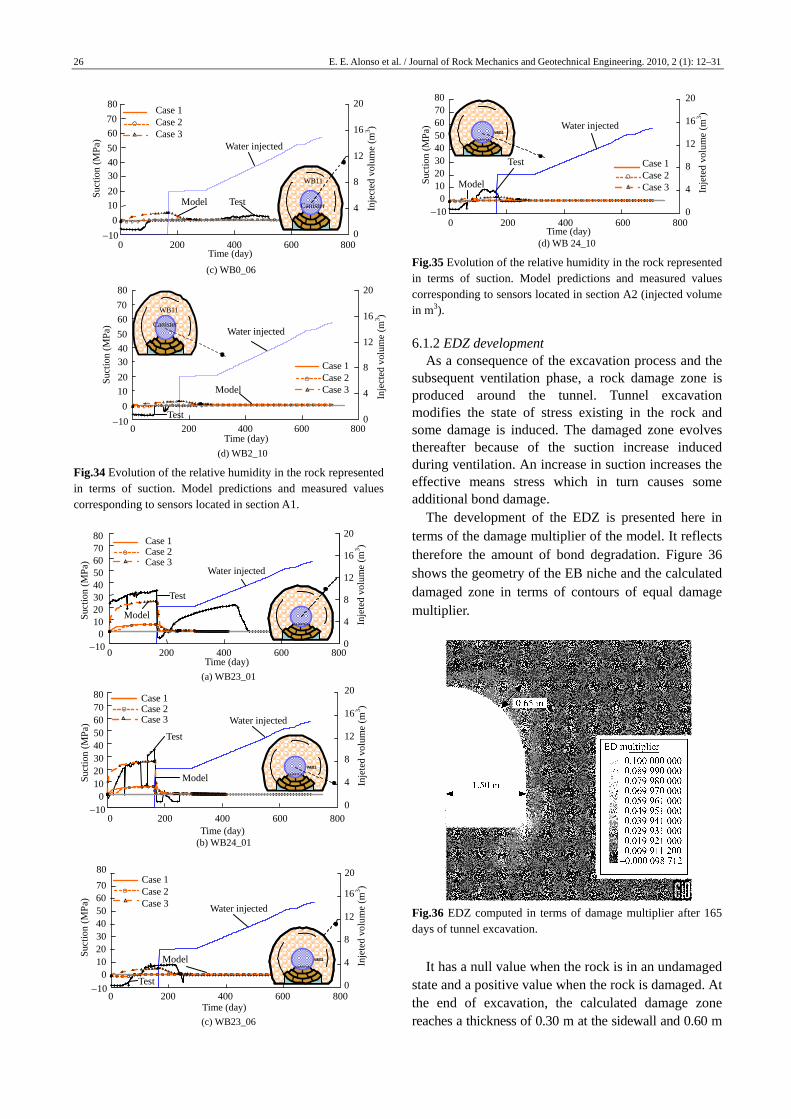
(c) WB0_06
(d) WB2_10
Fig.34 Evolution of the relative humidity in the rock represented in terms of suction. Model predictions and measured values corresponding to sensors located in section A1.
(a) WB23_01
(b) WB24_01
(c) WB23_06
(d) WB 24_10
Fig.35 Evolution of the relative humidity in the rock represented in terms of suction. Model predictions and measured values corresponding to sensors located in section A2 (injected volume in m3).
6.1.2 EDZ development As a consequence of the excavation process and the
subsequent ventilation phase, a rock damage zone is produced around the tunnel. Tunnel excavation modifies the state of stress existing in the rock and some damage is induced. The damaged zone evolves thereafter because of the suction increase induced during ventilation. An increase in suction increases the effective means stress which in turn causes some additional bond damage.
The development of the EDZ is presented here in terms of the damage multiplier of the model. It reflects therefore the amount of bond degradation. Figure 36 shows the geometry of the EB niche and the calculated damaged zone in terms of contours of equal damage multiplier.
Fig.36 EDZ computed in terms of damage multiplier after 165 days of tunnel excavation.
It has a null value when the rock is in an undamaged state and a positive value when the rock is damaged. At the end of excavation, the calculated damage zone reaches a thickness of 0.30 m at the sidewall and 0.60 m
0 200 400 600 8000
4
8
12
16
20
Water injected
0
20
40
60
80
10
10
30
50
70
Suc
tion
(M
Pa)
Inje
cted
vol
ume
(m3 )
Test
Case 1 Case 2 Case 3
Time (day)
Model Canister
WB11
0 200 400 600 800 0
4
8
12
16
20
Water injected
Model
0
20
40
60
80
10
10
30
50
70
Suc
tion
(M
Pa)
Inje
cted
vol
ume
(m3 )
Test
Case 1Case 2Case 3
Time (day)
Canister
WB11
20
0 200 400 600 800 10
10
30
50
70
CA N I STER
0
20
40
60
80
0
4
8
12
16
CA N I STER
Suc
tion
(M
Pa)
Time (day)
Test
Model
Case 1 Case 2 Case 3
Inje
ted
volu
me
(m3 )
Water injected
Suc
tion
(M
Pa)
10
Time (day) 0 200 400 600 800
CA N I S TE R W B 1 1
Water injected
Case 1 Case 2 Case 3
0
4
8
12
16
20
Inje
ted
volu
me
(m3 )
10
30
50
70
0
20
40
60
80
Test
Model
Suc
tion
(M
Pa)
0 200 400 600 800
C A N I S TE R C A N I S TE R WB 1 1
Water injected
Case 1 Case 2 Case 3
10
10
30
50
70
0
20
40
60
Test
Model
0
4
8
12
16
Inje
ted
volu
me
(m3 )
Time (day)
80 20
0 200 400 600 800
CANISTER
WB11Water injected
10
10
30
50
70
0
20
40
60
80
Suc
tion
(M
Pa)
Time (day)
0
4
8
12
16
20
Inje
ted
volu
me
(m3 )
Case 1Case 2Case 3
Test
Model

E. E. Alonso et al. / Journal of Rock Mechanics and Geotechnical Engineering. 2010, 2 (1): 12–31 27
on the niche crown. This is in accordance with some hydraulic and geophysical measurements reported by BGR [14]. They reported higher permeability values within a ring of 50 cm from tunnel wall. The sharp lower corner induces a bigger damage zone.
Figure 37 shows the evolution of the damage multiplier at different positions on the sidewall (dash line) and roof (continuous line) of the niche. The damage multiplier increases quickly during the first ten days of drying and increases later at a lower rate. This effect is associated with the change in the suction of rock. The intensity of damage decreases as the distance to the exposed tunnel wall increases and it reflects the distribution of suction. However, the shape of the tunnel and the initial state of stress controls the damage pattern around the opening.
(a)
(b)
Fig.37 Evolution of the damage multiplier for different distances to the tunnel surface.
6.2 Buffer hydration phase
6.2.1 Wetting history for computational purposes
After the 160 days ventilation period, buffer materials were emplaced and the hydration phase started.
Since the real scale tests are fully three-dimensional, especially if one considers the sequence of hydration, some different hypotheses have to be adopted to
reproduce the real hydration history in the 2D model developed. The following characteristics of the hydration system are relevant in this regard:
(1) Tubes are connected in such a way that the water flows into buffer materials from the floor to the roof and from front to the end of the excavation;
(2) Only the history of the total injected water volume and injection pressure at the water reservoir tank were controlled;
(3) No additional information is available consi- dering the internal distribution of flow rates and water pressures except for the reaction of different sensors located in the buffer.
The major uncertainty, however, lies in the water losses through the host rock and the concrete plug. Leakages were observed around the plug immediately after the beginning of the injection. If the known injected water volumes are plotted against time (Fig.38), the accumulated volume exceeds the calculated volume of voids (13.50 m3) in July 2003, 450 days after the beginning of the test, when the buffer was far from being saturated. Therefore no reliable information on the amount of water actually hydrating the buffer is available. On the other hand, the model reacts to imposed flow rates with increments in the water pressure which may not be realistic. In order to approximate the volume of water actually hydrating the buffer, the following sequence of boundary conditions were applied. A constant injection pressure of 10 kPa was assumed during the first 65 days of injection. Then a rest period of 55 days was imposed. Then, after the beginning of the injection for 120 days, a constant injection rate of 20 L per day was introduced. However, if the injection pressure increases beyond 10 kPa, a constant pressure condition pw=10 kPa was imposed at the injection points.
The calculated history of water volumes injected is also given in Fig.38. For the “automatic” water injection period (beyond September, 2002) the model predicts a decrease in water injection rate. The constant rate of water actually injected is not considered with a realistic rate for the water actually hydrating the buffer for the reasons given. 6.2.2 Buffer behaviour
Swelling pressure and the relative humidity were monitored in the buffer material during the hydration phase. Swelling pressure was measured in the central section of the tunnel (section E) and the relative humidity evolution was monitored in two sections (B1 and B2). Some additional information regarding the movement of the canister was obtained through the extensometers emplaced at both ends of the metallic
0 10 20 30 40 50 60 70 80 90 100 1100.00
0.01
0.02
0.03
0.04
0.05
Time (day)
Dam
age
mul
tipli
er
r=0.00 m (wall)
r=0.05 m (wall)
r=0.25 m (wall)
r=0.45 m (wall)
r=0.65 m (wall)
r=0.00 m (crown)
r=0.05 m (crown)
r=0.25 m (crown)
r=0.45 m (crown)
r=0.65 m (crown)
Crown
Wall

28 E. E. Alonso et al. / Journal of Rock Mechanics and Geotechnical Engineering. 2010, 2 (1): 12–31
Fig.38 Total injected water volume and computed volumes actually hydrating the buffer are compared.
cylinder in the following paragraphs. comparison between measured and computed results will be presented. 6.2.3 Relative humidity
Relative humidity was monitored in two sections by means of four sensors emplaced in each one of them, two are located within the blocks and two within the pellets. The corresponding suction values were calculated by means of the psychrometric relationship. A comparison between the real and computed values is shown in Fig.39. The history of injected water is also given in all the comparison plots as a general reference.
The evolution of suction within the bentonite pellets buffer for sections B1 and B2 is presented in Fig.39(a) (sensors WB11, WB12, WB21 and WB22). In section B1 (sensors WB11 and WB12), suction decreased fast but in section B2 (sensors WB21 and WB22) a slower wetting was observed. These results indicate that the heterogeneous hydration process takes place in the mass of pellets. The model predicts a fast decrease in suction due to the relative large volume of water initially injected. However the relative humidity measurements show a slower hydration rate.
Fig.39 Evolution of suction during the hydration phase.
In the case of bentonite blocks (sensors WB13, WB14, WB23 and WB24) in Fig.39(b), a more consistent picture emerges. The water redistribution state is reflected in the sensors response. The final injection stage, which provided a constant daily volume of water results in an increased rate of suction reduction. The calculated response of the blocks is reasonably well predicted although the intermediate redistribution period is barely noticed in the model. The bentonite blocks seem to be close to saturation after 400 days of hydration. Some areas within the pellet buffer remain partially saturated after 600 days of hydration.
Swelling pressure was monitored by means of eight total pressure cells located in the central section of the tunnel (sensors PE1 to PE8 located in section E). Measured and computed values corresponding to the pellet buffer material are presented in Figs.40 and 41.
(a)
(b)
Fig.40 Calculated and measured swelling pressure during the hydration phase for sensors located within the pellets PE1 and PE2.
0 200 400 600 8000
100
200
300
400
500
0
4
8
12
16
20Test
Model Injected water
WB22
WB12 WB21
WB11
WB11, WB21WB12, WB22
Section B1 Section B2
Time (day)
Suc
tion
(M
Pa)
Inje
cted
vol
ume
(m3 )
(a) Suction evolution within the pellets
0 200 400 600 800 0
40
80
120
160
0
4
8
12
16
20WB13 Section B1 WB23 Section B2
WB13, WB23
WB14, WB24
WB24
WB14
Model
Test
Time (day)
Suc
tion
(M
Pa)
Inje
cted
vol
ume
(m3 )
(b) Suction evolution within the blocks
Injected water
WB14 Section B1 WB24 Section B2
0 200 400 600 8000
4
8
12
16
0
4
8
12
16
20
PE1 Model
Injected water
Test
Tota
l str
ess
(kg/
cm2 )
Inje
cted
vol
ume
(m3 )
Time (day)
0 200 400 600 800 0
4
8
12
16
0
4
8
12
16
20
PE2
Time (day)
Test
Model
Injected water
Inje
cted
vol
ume
(m3 )
Tota
l str
ess
(kg/
cm2 )
0 150 300 450 600 750 9000
4 000
8 000
12 000
16 000
20 000
Natural water redistributionInitial injection (constant PW=10 kPa) 1
2 3-a
3-b
Contant flow rate condition
Contant injection pressure condition
1 2 3
Initial injection Natural water redistributionAutomatic injection starts
2
3
1 1 2
3-a
3-b 6 700 L
2 800 L
120 days
35 days
Calculated voids volume (13 500 L) Test
Model
6 May Hydration starts
Automatic injection 11 September January 2004
Inje
cted
wat
er (
L)
Time (day)

E. E. Alonso et al. / Journal of Rock Mechanics and Geotechnical Engineering. 2010, 2 (1): 12–31 29
(a)
(b)
Fig.41 Calculated and measured swelling pressure during the hydration phase for sensors located within the bentonite pellets PE3, PE4, PE7 and PE8.
A good agreement is found between computed and predicted stress evolution especially for the vertical stress sensors (PE1 and PE2).
The swelling pressure evolution observed in sensors PE1, PE3 and PE7 shows some transient pressure drops which have been associated with local collapse phenomena of the granular fill. However, these observed effects could not be reproduced in the numerical simulations despite the nature of constitutive model used for the bentonite pellets, especially well suited to capture collapse.
Measured and computed results for the swelling pressure of bentonite blocks are shown in Fig.42. Results obtained in the “in-situ” test are well reproduced by the numerical model. No drops in the swelling pressure evolution are observed in the bentonite blocks, which is probably a result of its high density.
(a)
(b)
Fig.42 Calculated and measured swelling pressure during the hydration phase for sensors located within the bentonite blocks PE5 and PE6.
The movement of the canister was monitored by means of two extensometers emplaced in sections corresponding at the ends of the canister, sections A1 and A2. The movement of the canister observed during the test is presented in Fig.43.
(a) Section A1
(b) Section A2 Fig.43 Calculated and computed displacements of the canister during the hydration phase. A positive measurement in the vertical extensometers indicates an upward movement of the canister and a positive measurement in the horizontal exten- someters is interpreted as a left side movement (considering a frontal view).
In section A1 (sensors EA1/1 and EA1/2), an upward movement of 6 mm and a left to right horizontal movement of around 4 mm were measured. In section A2 (sensors EA2/1 and EA2/2), no vertical movement was registered but a right to left displacement of around 14 mm was measured. Zero
Inje
cted
vol
ume
(m3 )
0 200 400 600 8000
4
8
12
16
0
4
8
12
16
20
PE3 PE7
Test (PE7)
Test (PE3) Model
Time (day)
Tota
l str
ess
(kg/
cm2 )
Injected water
0 200 400 600 8000
4
8
12
16
0
4
8
12
16
20
Inje
cted
vol
ume
(m3 )
Tota
l str
ess
(kg/
cm2 )
Time (day)
Model Test (PE8)
PE8
Injected water
Test (PE4) PE4
0 200 400 600 8000
4
8
12
16
0
4
8
12
16
20
PE5
Model
Test Injected water
Time (day)
Tota
l str
ess
(kg/
cm2 )
Inje
cted
vol
ume
(m3 )
0 200 400 600 8000
4
8
12
16
20
0
4
8
12
16
20
Inje
cted
vol
ume
(m3 )
Time (day)
Tota
l str
ess
(kg/
cm2 )
Injected water
Test
Model
PE6
0 200 400 600 8000
4
8
12
16
20
0
4
8
12
16
20
EA1_2
EA1_1
EA1_2
Model
Injected water EA1_2
EA1_1Test
Time (day)
Inje
cted
vol
ume
(m3 )
Ver
tical
dis
plac
emen
t (m
m)
4
0 200 400 600 8000
4
8
12
16
20
0
4
8
12
16
20
C
_
EA2_
1 EA2_2
Model (EA2_2)
Test (EA2_1)
Test EA2_2 Inje
cted
vol
ume
(m3 )
Time (day)
Ver
tical
dis
plac
emen
t (m
m)
Injected water
4
WB11

30 E. E. Alonso et al. / Journal of Rock Mechanics and Geotechnical Engineering. 2010, 2 (1): 12–31
horizontal displacement is obviously predicted by the model because of symmetrical conditions and an upward movement of 16 mm was calculated at the end of the modelled period. The reason for this calculated upward motion is the higher swelling potential of the dense blocks compared with the lighter pellet mixture.
Significant discrepancies are observed when the observed and predicted behaviours are compared especially as far as the horizontal displacement is concerned. Horizontal movement of the canister could be related to the different dry density values of the buffer material at both sides of the canister. The vertical movement is probably caused by the higher dry density value of the bentonite blocks with respect to the bentonite pellets. This upward tendency is qualitatively reproduced by the model, but not the actual displacement.
7 Discussion and conclusions
A material made of bentonite pellets is being suggested as a suitable alternative for the construction of isolating barriers in deep HWL repositories. Ease of handling is an advantage of using this material. The EB project, whose main results have been reported, includes two main experimental activities, a real scale test and a laboratory testing programme performed to characterize the hydro-mechanical response of bentonite pellet mixtures.
The outstanding characteristic of these mixtures is its discontinuous porosity. Pore size distribution of the samples displays multi-modal pore size density functions where two main groups of pores can be identified. One group of pores corresponds to the pores inside the bentonite pellets, having sizes in the order of 10 nm. The second group of pores is associated with the inter pellet pores (macropores) and they are four to five orders of magnitude larger. This double porosity and the highly expansive nature of the pellets controlled the hydraulic and mechanical properties of the mixture.
The saturated permeability and the swelling pressure of the material appear to be mainly controlled by the overall dry density of the sample rather than the initial grain size distribution.
The hydraulic response was examined by means of infiltration tests where the evolution of the saturated permeability was investigated. Material response during a fast hydration process can be described assuming two different phases. During the initial phase water goes into the sample through the interconnected macroporosity and the bentonite pellets remain almost
unchanged. During this stage, very high inflow rates are computed in correspondence with high permeability values. After this initial phase, the bentonite pellets start to hydrate exchanging water with the water stored in the macropores. The bentonite granules swell, filling the macropores and reducing dramatically the permeability four orders of magnitude. Modelling the hydraulic response of the material will require consideration of the evolution of the material structure as the hydration progresses.
The volume change response was investigated by means of suction-controlled oedometer tests performed using oedometers. Loading at constant suction, wetting under constant load and wetting at constant volume tests were performed to examine the material com- pressibility and its swelling response as the hydration progress (suction decreases). The observed behaviour was interpreted considering the fundamental ideas presented by Alonso et al. [6] in the Barcelona basic model (BBM). The model was used to reproduce the two fundamental mechanisms of volume change observed in the material, one associated with the swelling of the bentonite granules and the other with the granular packing response.
It is concluded that the BBM offers a convenient conceptual framework to describe this pellet based material compacted at the dry density expected “in- situ” in the EB test.
The modelling performed is presented and compared with the actual field behaviour. The following results may be highlighted:
A damage model for the rock was considered. As a result of the tunnel opening an excavation damaged zone (EDZ) was induced around the excavation. The calculated thickness of the EDZ is similar to in-situ deter- minations based on geophysical procedures and local determinations of permeability.
The desaturation/saturation response of the rock and the associated damage is critically controlled by boundary conditions at the tunnel, water retention properties and permeability of the rock. Some uncertainties remain on the exact values actually operated in the EB experiment
The evolution of relative humidity in the bentonite blocks which constitute the “cradle” of the simulated canister is reasonably well captured by the model. However, calculated hydration rates in the pellet fill are faster than measurements. This is attributed to the complex evolution of permeability of the pellet mixture as it becomes wetted.
Measured total stresses within the bentonite blocks are well reproduced by the model. A good agreement
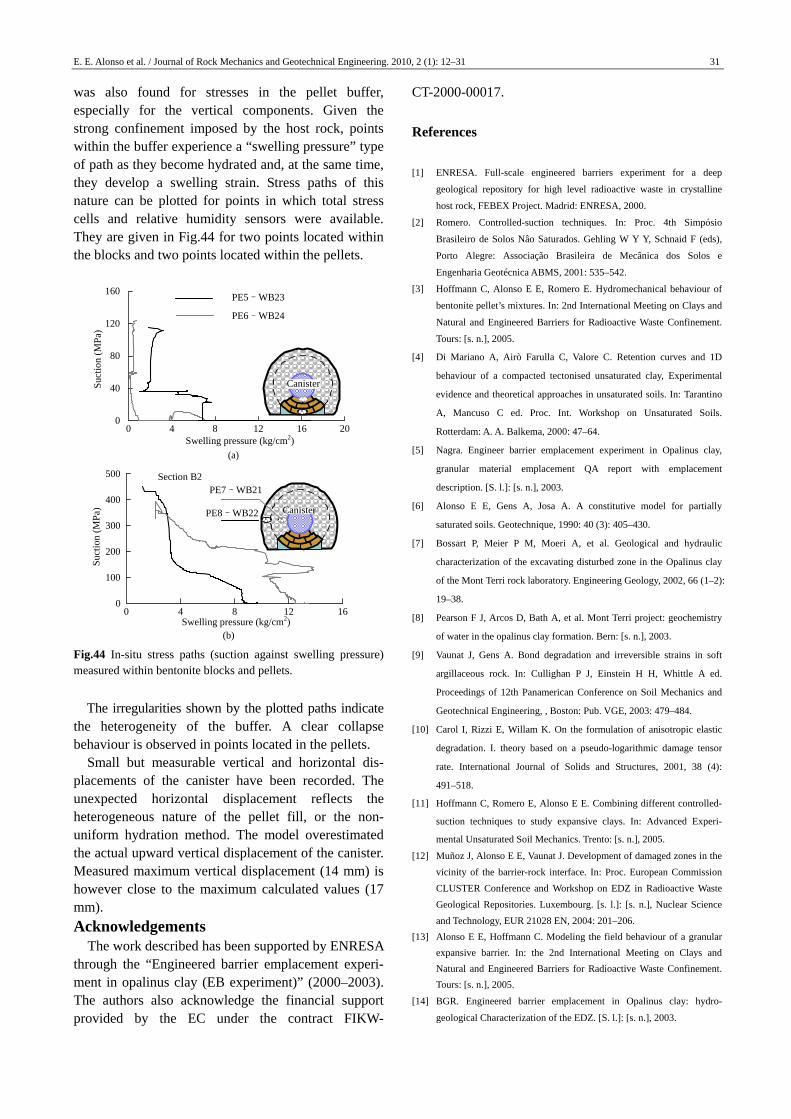
E. E. Alonso et al. / Journal of Rock Mechanics and Geotechnical Engineering. 2010, 2 (1): 12–31 31
was also found for stresses in the pellet buffer, especially for the vertical components. Given the strong confinement imposed by the host rock, points within the buffer experience a “swelling pressure” type of path as they become hydrated and, at the same time, they develop a swelling strain. Stress paths of this nature can be plotted for points in which total stress cells and relative humidity sensors were available. They are given in Fig.44 for two points located within the blocks and two points located within the pellets.
(a)
(b)
Fig.44 In-situ stress paths (suction against swelling pressure) measured within bentonite blocks and pellets.
The irregularities shown by the plotted paths indicate the heterogeneity of the buffer. A clear collapse behaviour is observed in points located in the pellets.
Small but measurable vertical and horizontal dis- placements of the canister have been recorded. The unexpected horizontal displacement reflects the heterogeneous nature of the pellet fill, or the non- uniform hydration method. The model overestimated the actual upward vertical displacement of the canister. Measured maximum vertical displacement (14 mm) is however close to the maximum calculated values (17 mm).
Acknowledgements The work described has been supported by ENRESA
through the “Engineered barrier emplacement experi- ment in opalinus clay (EB experiment)” (2000–2003). The authors also acknowledge the financial support provided by the EC under the contract FIKW-
CT-2000-00017.
References
[1] ENRESA. Full-scale engineered barriers experiment for a deep
geological repository for high level radioactive waste in crystalline
host rock, FEBEX Project. Madrid: ENRESA, 2000.
[2] Romero. Controlled-suction techniques. In: Proc. 4th Simpósio
Brasileiro de Solos Nâo Saturados. Gehling W Y Y, Schnaid F (eds),
Porto Alegre: Associação Brasileira de Mecânica dos Solos e
Engenharia Geotécnica ABMS, 2001: 535–542.
[3] Hoffmann C, Alonso E E, Romero E. Hydromechanical behaviour of
bentonite pellet’s mixtures. In: 2nd International Meeting on Clays and
Natural and Engineered Barriers for Radioactive Waste Confinement.
Tours: [s. n.], 2005.
[4] Di Mariano A, Airò Farulla C, Valore C. Retention curves and 1D
behaviour of a compacted tectonised unsaturated clay, Experimental
evidence and theoretical approaches in unsaturated soils. In: Tarantino
A, Mancuso C ed. Proc. Int. Workshop on Unsaturated Soils.
Rotterdam: A. A. Balkema, 2000: 47–64.
[5] Nagra. Engineer barrier emplacement experiment in Opalinus clay,
granular material emplacement QA report with emplacement
description. [S. l.]: [s. n.], 2003.
[6] Alonso E E, Gens A, Josa A. A constitutive model for partially
saturated soils. Geotechnique, 1990: 40 (3): 405–430.
[7] Bossart P, Meier P M, Moeri A, et al. Geological and hydraulic
characterization of the excavating disturbed zone in the Opalinus clay
of the Mont Terri rock laboratory. Engineering Geology, 2002, 66 (1–2):
19–38.
[8] Pearson F J, Arcos D, Bath A, et al. Mont Terri project: geochemistry
of water in the opalinus clay formation. Bern: [s. n.], 2003.
[9] Vaunat J, Gens A. Bond degradation and irreversible strains in soft
argillaceous rock. In: Cullighan P J, Einstein H H, Whittle A ed.
Proceedings of 12th Panamerican Conference on Soil Mechanics and
Geotechnical Engineering, , Boston: Pub. VGE, 2003: 479–484.
[10] Carol I, Rizzi E, Willam K. On the formulation of anisotropic elastic
degradation. I. theory based on a pseudo-logarithmic damage tensor
rate. International Journal of Solids and Structures, 2001, 38 (4):
491–518.
[11] Hoffmann C, Romero E, Alonso E E. Combining different controlled-
suction techniques to study expansive clays. In: Advanced Experi-
mental Unsaturated Soil Mechanics. Trento: [s. n.], 2005.
[12] Muñoz J, Alonso E E, Vaunat J. Development of damaged zones in the
vicinity of the barrier-rock interface. In: Proc. European Commission
CLUSTER Conference and Workshop on EDZ in Radioactive Waste
Geological Repositories. Luxembourg. [s. l.]: [s. n.], Nuclear Science
and Technology, EUR 21028 EN, 2004: 201–206.
[13] Alonso E E, Hoffmann C. Modeling the field behaviour of a granular
expansive barrier. In: the 2nd International Meeting on Clays and
Natural and Engineered Barriers for Radioactive Waste Confinement.
Tours: [s. n.], 2005.
[14] BGR. Engineered barrier emplacement in Opalinus clay: hydro-
geological Characterization of the EDZ. [S. l.]: [s. n.], 2003.
0 4 8 12 16 20 0
40
80
120
160
Swelling pressure (kg/cm2)
Suc
tion
(M
Pa)
PE5–WB23
PE6–WB24
Canister
0 4 8 12 160
100
200
300
400
500
Canister
Swelling pressure (kg/cm2)
Suc
tion
(M
Pa)
PE7–WB21
PE8–WB22
Section B2