Embed Size (px)
Citation preview
1
PEG-PGA Enveloped Octaarginine-Peptide Nanocomplexes: An Oral
Peptide Delivery Strategy
Zhigao Niu a#
, Eleni Samaridou a#
, Emilie Jaumain b, Julie Coëne
b, Gabriela Ullio
b, Neha Shrestha
c,
Josep Garcia d, Matilde Durán-Lobato
a, Sulay Tovar
e, Manuel J. Santander-Ortega
f,g, Mª Victoria
Lozano f,g
, Mª Mar Arroyo-Jiménez f,g
, Rocío Ramos-Membrive h, Iván Peñuelas
h, Aloïse Mabondzo
b,
Véronique Préat c, Meritxell Teixidó
d, Ernest Giralt
d, María José Alonso
a*
a Center for Research in Molecular Medicine and Chronic Diseases, IDIS research Institute, Department of
Pharmacy and Pharmaceutical Technology, School of Pharmacy, University of Santiago de Compostela, 15782,
Santiago de Compostela, Spain. b
Service de Pharmacologie et d’Immunoanalyse, IBITECS, CEA, Université Paris-Saclay, F-91191 Gif-sur-Yvette,
France c Louvain Drug Research Institute, Advanced Drug Delivery and Biomaterials, Université Catholique de Louvain,
B-1200, Brussels, Belgium d Institute for Research in Biomedicine (IRB Barcelona), Barcelona Institute for Science and Technology (BIST)
08028, Barcelona, Spain e Biomedical Research Group, Center for Research in Molecular Medicine and Chronic Diseases, University of
Santiago de Compostela, 15782 Santiago de Compostela, Spain f
Cellular Neuroanatomy and Molecular Chemistry of Central Nervous System Group, Faculty of Pharmacy,
University of Castilla-La Mancha, 02071 Albacete, Spain g Regional Centre of Biomedical Research (CRIB)- University of Castilla-La Mancha, Albacete (Spain)
h Radiopharmacy Unit, Department of Nuclear Medicine, Clínica Universidad de Navarra, University Clinic of
Navarra, 31008, Pamplona, Spain
* Corresponding author
Department of Pharmacy and Pharmaceutical Technology, Center for Research in Molecular Medicine and Chronic
Diseases, IDIS research Institute, University of Santiago de Compostela, 15782, Santiago de Compostela, Spain.
E-mail address: [email protected] (M.J. Alonso)
# These authors contributed equally to this work
Keywords: Cell Penetrating Peptide, Octaarginine, PEGylation, Nanocomplex, Oral Peptide/Protein
Delivery

2
Abstract
The objective of this work was the development of a new drug nanocarrier intended to overcome the
barriers associated to the oral modality of administration and to assess its value for the systemic or local
delivery of peptides. The nanocarrier was rationally designed taking into account the nature of the
intestinal barriers and was loaded with insulin, which was selected as a model peptide. The nanocarrier
consisted of a nanocomplex between insulin and a hydrophobically-modified cell penetrating peptide
(CPP), enveloped by a protecting polymer. The selected CPP was octaarginine (r8), chemically
conjugated with cholesterol (Chol) or lauric acid (C12), whereas the protecting polymer was poly
(glutamic acid)-poly (ethylene glycol) (PGA-PEG). This enveloping material was intended to preserve the
stability of the nanocomplex in the intestinal medium and facilitate its diffusion across the intestinal
mucus. The enveloped nanocomplexes (ENCPs) exhibited a number of key features, namely (i) a
unimodal size distribution with a mean size of 200 nm and a neutral zeta potential, (ii) the capacity to
associate insulin (~100% association efficiency) and protect it from degradation in simulated intestinal
fluids, (iii) the ability to diffuse through intestinal mucus and, most importantly, (iv) the capacity to
interact with the Caco-2 model epithelium, resulting in a massive insulin cell uptake (47.59 ± 5.79%).
This enhanced accumulation of insulin at the epithelial level was not translated into an enhanced insulin
transport. In fact, only 2% of insulin was transported across the monolayer, and this was correlated with a
moderate response of insulin following oral administration to healthy rats. Despite of this, the
accumulation of the insulin-loaded nanocarriers in the intestinal mucosa could be verified in vivo upon
their labeling with 99m
Tc. Overall, these data underline the capacity of the nanocarriers to overcome
substantial barriers associated to the oral modality of administration and to facilitate the accumulation of
the associated peptide at the intestinal level.

3
1. Introduction
The interest of pharmaceutical industry in developing therapeutic peptides and proteins has increased
significantly over the last decades [1, 2]. Unfortunately, the exploitation of these drugs has been limited
by their difficult access to the target tissues. In general, peptide drugs intended to treat systemic diseases
need to be administered by injection, a situation that hampers their utility in the case of a chronic
pathology. On the other hand, peptides intended to act locally in the intestinal mucosa cannot be
effectively used due to the difficulties for overcoming the stability and permeability barriers associated to
the gastro-intestinal tract [3, 4]. This situation has stimulated significant research in the drug delivery
field. However, the inconclusive results reported until now and the limited number of oral peptide
formulations in the market, or in clinical trials, have led to the conclusion that the development of oral
peptide formulations represents a great challenge. The main delivery strategies explored so far have relied
on the use of penetration enhancers or the association of the peptide to a nano-drug delivery carrier [5-7].
A particular category of penetration enhancers that has attracted significant attention is the so-called cell
penetrating peptides (CPP). For example, Morishita and co-workers have shown the capacity of these
molecules to promote the intestinal absorption of insulin [8, 9]. On the other hand, since the pioneering
work by Couvreur and co-workers [10, 11] showing the possibility to deliver insulin in rats using
polyacrylate nanocapsules, an array of nanocarriers including liposomes [12, 13] as well as nanoparticles
(NPs) made of chitosan [14-18], poly(lactic/glycolic) (PLGA) [19-21], acrylic polymers [22-24], and
solid lipids [25, 26] have been proposed for the oral administration of systemically acting peptide drugs.
Similarly, nano / microparticles mainly relying on PLGA, chitosan and acrylic / methacrylic acid
polymers (i.e. Eudragit®) have also been proposed for the oral administration of peptides/proteins acting
locally in the intestinal mucosa [27-29]. Overall, these nanocarriers have led to variable results in terms of
their capacity to enhance the systemic absorption of the associated peptide, or its retention at the level of
the intestinal mucosa, and their progress towards advanced preclinical development phase has been
scarcely reported. Indeed, currently there are only two oil-based nanoformulations, for the systemic
delivery of cyclosporine, available in the market, whereas a few nano-based technologies for systemically
acting peptide/protein drugs are under clinical development [6].
As a disruptive alternative to the technologies indicated above, here we present a new delivery strategy
that involves a combination of key components with the appropriate architectural organization. The

4
selection of the constituents and their organization was done in a rational manner, taking into account the
biological barriers to be overcome [30-32]. More precisely, the novelty of our approach relies on the
formation of nanocomplexes between the selected peptide and chemically modified CPPs, instead of their
simple co-administration or conjugation, and the subsequent envelopment of these nanocomplexes with
protective biopolymers. The selected model peptide was insulin, and the chosen CPP was r8 chemically
modified with hydrocarbon chains in order to promote its interaction with insulin through electrostatic
and hydrophobic forces. These nanocomplexes were enveloped with a biomaterial intended to prevent
their interaction with digestive enzymes, i.e. pancreatin, and their subsequent aggregation and/or peptide
degradation. For this purpose, we chose the copolymer polyglutamic acid-polyethylene glycol
(PGA-PEG), with the assumption that the carboxylic moieties of the polyglutamic chain would interact
with the cationic insulin-r8 complex, thereby protecting the nanocomplex and projecting the PEG
molecule towards the external phase [33]. This PEG surface was also supposed to facilitate the diffusion
of the complexed peptide across the intestinal mucus [34-36]. The nanostructures resulting from this
rational design, here named as enveloped nanocomplexes (ENCPs), were characterized in terms of (i)
their stability in simulated intestinal fluids (SIF), (ii) their ability to protect insulin from enzymatic
degradation (i.e. by pancreatin), (iii) their mechanism of interaction with the intestinal epithelium, (iv)
their ability to diffuse through intestinal mucus, (v) their biodistribution following oral administration and
(vi) their potential for the systemic delivery of insulin in rats.
2. Materials and methodology
2.1. Materials
Recombinant human insulin monomer (Apidra®, Mw 5823 Da) was kindly provided by Sanofi (Paris,
France). Fmoc-D-Arg(Pbf)-OH was purchased from Iris Biotech GmbH (Marktredwitz, Germany).
Branch ([PGA]100-m[PEG]6 Poly(L-glutamic acid gamma- (omega-methoxyhepta (ethylene glycol)))
sodium salt, 10-20 mol% mPEG substitution, MW=22.8 - 24.7 kDa, 14-27% PEG) was purchased from
Polypeptide Therapeutic Solutions (PTS, Valencia, Spain). Diblock (m[PEG]455-b-[PGA]10,
methoxy-poly(ethylene glycol)-block-poly(L-glutamic acid sodium salt), MW=22 kDa, 20 kDa PEG and
2 kDa PGA) was purchased from Alamanda Polymers (Huntsville, USA). Lauric acid, cholesteryl
chloroformate, pancreatin (8xUSP), monobasic potassium phosphate, maleic acid, sodium chloride and

5
sodium hydroxide were purchased from Sigma Aldrich (St. Louis, USA). Sodium taurocholate was
purchased from New Zealand Pharmaceuticals (Palmerston North, New Zealand). Soy lecithin was
purchased from Archer Daniels Midland (Chicaco, USA). Human colorectal adenocarcinoma Caco-2 cells
(ATCC® HTB37™) were purchased from American Type Culture Collection (Manassas, VA, USA). High
glucose Dulbecco’s modified eagle medium (DMEM) and non-essential amino acid (NEAA) solution
were purchased from Sigma Aldrich (St. Louis, USA), while heat inactivated fetal bovine serum (FBS),
penicillin-streptomycin solution, L-glutamine, phosphate-buffered saline (PBS), Dulbecco’s
phosphate-buffered saline with calcium and magnesium (DPBS) were purchased from Lonza (Basel,
Switzerland). Hank’s balanced salt solution (HBSS), Rhodamine Phalloidin, Hoechst® 33342 were
purchased from Life Technologies (USA). Phalloidin-iFluor 594 Reagent - CytoPainter (ab176757) was
purchased from Abcam, UK. Fresh porcine intestinal mucus was obtained from the local slaughterhouse.
99Mo-
99mTc generator (Drytec; GE Healthcare Bio-science, UK) was eluted with 0.9% NaCl following the
manufacturer’s instructions. SnCl2·2H2O was purchased from Panreac (Barcelona, Spain); 0.9% NaCl
was purchased from Braun. The anesthetic isoflurane (Isoflo™; Esteve, UK) and the euthanasic T-61
(Intevet, Spain) were used for the animals in biodistribution studies. Ultrapurified water was obtained
from Millipore Milli-Q Plus water purification system (Darmstadt, Germany). All other chemicals were of
analytical grade.
2.2. Synthesis of C12-r8 and cholesterol-r8
C12-r8 and Chol-r8 (Figure S1) were synthesized by solid-phase peptide synthesis (SPPS) following the
Fmoc/tBu strategy. In both cases, Fmoc-Rink amide ChemMatrix® resin was used to obtain an amide
group in the peptides C-terminus. TBTU and DIEA were used as coupling reagents for each amino acid
incorporation (all amino acids were in the D-form). Fmoc deprotection was performed by the addition of
20% piperidine in DMF. Lauric acid and cholesteryl chloroformate were coupled to the N-terminus using
the same strategy. Complete cleavage of both peptides from the resin and removal of the side-chain
protecting groups were achieved by using the following cleavage cocktail: TFA/H2O/TIS
(95%/2.5%/2.5%). In the case of the FITC labeled C12-r8, introduction of a D-lysine, orthogonally
protected, to the C-terminal of the peptides allowed the incorporation of 5(6)-Carboxyfluorescein (CF) to
the peptide sequence. Once the peptide was synthesized, C12 was coupled to the N-terminal. Then, the
Alloc protecting group was selectively removed from the D-lysine side chain by treatment with tetrakis

6
(triphenylphosphine) palladium (0) followed by incorporation of CF, using standard amino acid coupling
conditions. Both peptides were then purified by RP-HPLC at semi-preparative scale and characterized by
HPLC (Waters Alliance 2695, photodiode array detector 2998 Waters, Sunfire C18 column (100 x 4.6 mm
x 3.5 µm, 1 mL/min Acetonitrile (0.036 % TFA) and H2O (0.045 % TFA). MALDI spectrometry
(MALDI-TOF Applied Biosystem 4700, and 8-min linear gradients were used in all cases. All peptides
were obtained with a purity higher than 90%.
2.3. Preparation of r8-insulin nanocomplexes (NCPs)
C12-r8-insulin and Chol-r8-insulin NCPs were formed in aqueous solutions driven by both hydrophobic
and ionic interactions [37-39]. Briefly, C12-r8 or Chol-r8 were dissolved in water at a concentration of 1
mg/mL, whereas insulin (Apidra®, Mw 5823 Da, Sanofi, France) was dissolved at a concentration of 1
mg/mL in basic media with different pH (0.001N NaOH or 0.01N NaOH). The complexes were formed
instantly upon mixing the solutions under magnetic stirring at different r8: insulin ratios (1:1 to 8:1).
Blank controls were prepared by adding a NaOH solution to a C12-r8 or Chol-r8 solution to confirm the
absence of micelle formation. Additionally, a solution of non-hydrophobized r8 was used to form a
complex with insulin, as previously reported in the literature [8, 40]. The pH of all NCPs was finally
adjusted to 7 with HCl. In case of fluorescent NCPs, FITC-labeled C12-r8 was used instead of the
non-fluorescent formulations.
2.4. Preparation of PGA-PEG enveloped r8-insulin nanocomplexes (ENCPs)
The cationic NCPs were enveloped by different materials, i.e. negatively charged diblock or branch type
PGA-PEGs (Diblock: m[PEG]455-b-[PGA]10, methoxy-poly(ethylene glycol)-block-poly(L-glutamic
acid sodium salt), MW = 22 kDa, 20 kDa PEG and 2 kDa PGA, Alamanda Polymers, USA; Branched:
[PGA]100-m[PEG]6 Poly(L-glutamic acid gamma- (omega-methoxyhepta (ethylene glycol)) sodium salt,
10-20 mol% mPEG substitution, MW = 22.8 - 24.7 kDa, 14-27% PEG, PTS, Spain), at insulin:PGA-PEG
mass ratio 1:0.7 and 1:2 respectively, leading to the formation of ENCPs. Two different enveloping
strategies were studied, namely: i.) simple incubation by adding PGA-PEG solutions to NCP suspensions
and, ii.) the film hydration method. According to the second method, PGA-PEG polymers were dissolved
in water and then the water was evaporated in a round flask under reduced pressure at 37 ºC, leading to
7
the formation of a thin film, followed by the addition of NCPs to the same flask and 10 min rotation at
room temperature and atmospheric pressure. After the NCPs were enveloped with the film, the pH of the
final ENCPs suspension was adjusted to 7 with HCl.
2.5. Physicochemical characterization and morphology of nanocomplexes (NCPs and ENCPs)
Particle size and PDI were determined by Dynamic Light Scattering (DLS) using a Malvern Zeta-Sizer
(NanoZS, ZEN 3600, Malvern Instruments, Worcestershire, UK) fitted with a red laser light beam (λ =
632.8 nm). The Z-potential was calculated from the mean electrophoretic mobility values determined by
Laser Doppler Anemometry (LDA) using the same device. The morphological analysis of the NCPs and
ENCPs was carried out using transmission electron microscopy (TEM, CM12, Philips, Netherlands),
where samples were stained with phosphotungstic acid (2%, w/v) solution and placed on cupper grids
with Formvard® for TEM observation.
2.6. Determination of the association efficiency of insulin to the nanocomplexes (NCPs and ENCPs)
The association efficiency (AE) of insulin to NCPs and ENCPs was determined by both indirect and
direct method following separation of the complexes from suspension media by centrifugation (Hettich,
Universal 32R, Germany) at 15,000 g for 15 min at 15 °C and measuring the free insulin in the
suspension media or directly measuring the insulin involved in the NCPs. For the indirect method, the
aqueous supernatant was collected and the amount of free insulin in the supernatant was determined by
reverse phase HPLC (Agilent, 1100 Series, USA), using a C18 column (Superspher® RP-18 end-capped).
As mobile phases, a buffer of phosphoric acid and sodium perchlorate was mixed with acetonitrile at
different ratios (93:7 as phase A and 43:57 as phase B, both at pH 2.3). The AE of insulin in the
formulation was calculated taking into account the total insulin amount involved in the formulation, and
the free insulin found in the supernatant. For the direct measurement, 500 µL of 0.01N HCl and 100 µL of
DMSO were added successively to the sediment containing the NCPs, by vortexing (VELP Scientifica,
Italy). The solution was injected into the HPLC system and the AE was calculated dividing the insulin
amount determined in the ENCP sediment by the total insulin amount involved in the formulation. The
final loading was calculated by dividing the amount of insulin associated (AE x total insulin in the
formulation) by the theoretical amount of all the materials involved in the formulation.

8
2.7. Stability of nanocomplexes (NCPs and ENCPs) in simulated intestinal media
The colloidal stability of the NCPs and ENCPs was assessed upon incubation in simulated intestinal
medium (SIF, pH 6.8) and fasted-state simulated intestinal fluid (FaSSIF-V2, pH 6.5) [41, 42] for up to 6
h at 37 °C with a horizontal shaking of 300 rpm. At different times (0, 0.5, 1, 3 and 6 hours), a 50 µL
sample of the incubation medium was withdrawn in order to analyze the particle size, PDI and derived
Count Rate (dCR). The compositions of standard SIF and FaSSIF-V2 media are shown in Table S1 of the
supporting information. Stability in simulated gastric fluid was not assessed since the formulations were
to be enclosed in a gastro-resistant capsule before their oral administration.
2.8. Stability of PGA-PEG enveloped nanocomplexes (ENCPs) upon storage
The ENCP suspensions were stored at 4 °C, room temperature (around 20 °C) and 37 °C for up to 2
months. The measurements of the particle size, PDI and dCR were carried out as described above.
Additionally, a lyophilization study of the ENCPs was done to assess the possibility of processing the
ENCPs suspension as a powder. Trehalose (2%, w/v) was added to the ENCPs suspension (0.12%, w/v)
prior to freeze-drying (~50 h cycle) to facilitate the posterior re-suspension. The stability of the freeze
dried ENCPs under storage (at room temperature in a desiccator) and the stability in SIF was analyzed
measuring their particle size, polydispersity, Z-potential, and derived count rate after reconstitution, using
the methodologies described above. The insulin leakage in SIF was evaluated determining the free
peptide in the suspension medium.
2.9. Stability of ENCPs-entrapped insulin against pancreatic enzyme degradation
To assess the capacity of the ENCPs to protect insulin from enzymatic degradation in the intestinal
environment, a proteolysis study was performed by incubating ENCPs in SIF containing 1% (w/v)
pancreatin (Sigma Aldrich, USA). A volume of 250 µL of the diblock PGA-PEG enveloped ENCPs was
incubated with 250 µL of the proteolysis medium at 37 °C under 300 rpm horizontal shaking. At different
time points, samples were transferred to cold tubes, containing 300 µL of 0.1 N HCl to quench the
enzymatic proteolysis, and the insulin content was quantified by liquid chromatography-mass

9
spectrometry (LC-MS, (Shimadzu HPLC system LC 20AD, Japan; Thermo Triple quadrupole mass
spectrometer Quantum Ultra, USA). The study was done in 3 replicates, and, as control, plain insulin
solution instead of the ENCPs was treated with the same proteolysis medium. To exclude the interference
of the pancreatin in the LC-MS analysis, the proteolysis medium alone was also set as an additional
control.
2.10. In vitro release of insulin from nanocomplexes (NCPs and ENCPs)
The in vitro release study of C12-r8-insulin NCPs and the corresponding ENCPs was carried out in SIF,
FaSSIF-V2 or acetate buffer (pH 4.0, 100 mM) at 37 ºC. Briefly, the formulation was diluted in 10 mL of
the corresponding media to a final insulin concentration 0.05 mg/mL. The formulations were placed at
37 °C in an incubator with 300 rpm horizontal shaking for 6 hours, and during this time 500 µL samples
were withdrawn at predetermined time points (0, 0.5, 1, 2, 4 and 6 hours) and centrifuged at 15,000 g for
15 min at 15° C. The same volume of the corresponding medium was added to replenish the release
medium at each time point. The supernatant was collected for insulin determination by HPLC as
described above.
2.11. Transport of PGA-PEG enveloped nanocomplexes (ENCPs) in intestinal mucus
The ability of the PGA-PEG enveloped nanocomplexes to move through intestinal mucus was assessed
by particle tracking analysis as described elsewhere [43]. Fresh porcine intestinal mucus, obtained from
the local slaughterhouse, was used as model of the intestinal mucus. FITC labelled ENCPs were
employed throughout this study. Fluorescently labelled polystyrene NPs and PF-127 coated polystyrene
NPs were used as the mucoadhesive control and the mucodiffusive control, respectively. Briefly, 3 μL of
the FITC labelled ENCPs (1.2 mg/ml) or the fluorescently labelled control nanoparticles, previously
diluted in MQ water, were mixed with 100 μL of mucus. Ten microliters of each mucus-nanoparticle
mixture was placed between a microscope slide and a cover glass in a chamber created by a double-sided
adhesive sticker of 120 μm thickness in between. The Nikon microscope equipped with a sCMOS camera
and a PLAN APO 100X 1.4 oil-immersion objective was always focused at 10-15 μm above the
coverglass. For each sample, 20-30 movies of 800 frames were recorded at a frame rate of 100 fps,
obtaining more than 100 trajectories per movie. The diffusion coefficient of each particle was obtained
10
from the dependence of the mean square displacement (MSD), calculated as = [x(t+τ) – x(t)]2 + [y(t+τ) –
y(t)]2 [44], with the time scale (or time lag) as follows:
𝑀𝑆𝐷=4𝐷eff𝜏𝛼,
where Deff is the effective diffusion coefficient, 𝜏 the time lag and α is a parameter that provides
information about the nature of the diffusion of the nanoparticle in the mucus. The parameter α was
calculated as the slope of the MSD vs. τ plot; when the value of α is equal to1, it indicates a free diffusion,
whereas a decrease of this parameter down to 0.4 indicates that the diffusion is highly restricted [45-47].
2.12. Cytotoxicity on Caco-2 cells
Cytotoxicity was determined in Caco-2 cells (ATCC® HTB37™, American Type Culture Collection,
USA) using a MTS assay as an indicator of cell viability according to the manufacturer's instructions for
96-microwell plates. Cell viability was assessed after the co-incubation of 10,000 Caco-2 cells/well on a
96-well tissue cultured plate (Corning® Costar®, USA) with the tested samples. For the MTS test,
microplates were transferred to a humidified incubator at 37 °C with 5% CO2 for a 2 h incubation. The
supernatant of each well was then removed and the cells were rinsed with PBS and incubated with 100 µL
of 3-(4,5-dimethylthiazol-2-yl)-5-(3-carboxymethoxyphenyl)-2-(4-sulfophenyl)-2H-tetrazolium (MTS)
reagent at 37 °C for 2.5 h in a humidified atmosphere containing 5% CO2. Cellular supernatants were
then transferred into a new 96-well plate and the amount of soluble formazan produced by cellular
reduction of MTS was determined by recording absorbance at 490 nm with a Synergy 4 microplate reader
(BioTek Instruments, Inc., Winooski, USA).
2.13. Measurement of the transepithelial electrical resistance (TEER)
Caco-2 cell monolayers were cultured on the tissue-cultured-treated PET filter (diameter 1 µm, 1.1 cm2)
in Millipore Transwell® 12 wells/plates and were used for transport experiments 21 days after seeding.
The C12-r8 based NCPs, diblock PGA-PEG enveloped C12-r8 ENCPs and the physical mixture of r8 and
insulin were evaluated regarding their effect on the tightness of the cell monolayers, measuring the
change of TEER in Caco-2 cell monolayers with a Millicell-Electrical Resistance System (Endohm-12,
Millipore Corp). Monolayers with TEER values in the range of 800-1500 Ω/cm2
were used, and all the

11
groups were designed so as to have the same insulin concentration.
2.14. Quantitative cell uptake and transport of insulin
In parallel with the TEER measurement, the C12-r8 based NCPs, diblock PGA-PEG enveloped ENCPs
and a physical mixture of insulin and r8 were evaluated in respect of the cell uptake / transport efficiency
of insulin. After 2 hours’ incubation, on Caco-2 monolayer, samples were collected (500 µL) from the
receiver compartment and the apical compartment, and insulin concentrations were measured using liquid
chromatography - mass spectrometry. Cell monolayer was washed extensively in 0.9% NaCl and frozen
at -80°C for insulin quantification within the cells. Liquid chromatography with a 150 x 2.1 mm - 5µm -
300Å HPLC C8 column (Interchim, France) was used for elution of insulin in a gradient mode with
mobile phases A and B, where solvent A was H2O containing 0.1% formic acid and solvent B was
acetonitrile containing 0.1% formic acid; the flow rate was 0.6 mL/min to avoid pressure rise. An aliquot
(100 μL) of the sample was treated with 200 μL of chloroform / methanol / water at 1/ 1/ 0.3 and 100 μL
of 0.1M NaOH, and then 40 μL of analyte was injected onto the column placed in an oven at 60 °C. The
total run time was 13 min. Detection was done by tandem mass spectrometry (Quantum Ultra) in positive
electrospray mode. The limit of detection is 0.005 μg insulin. System control and data processing were
carried out using MassLynx software version 4.1. Spray voltage was 3.0 kV, and sheath and auxiliary gas
pressures were 50 and 15 (arbitrary units), respectively. The in-source CID energy was fixed at 12 V, and
capillary temperature was 350 °C. Tube lens and collision energy values were optimized for insulin.
Multiple reaction monitoring was used for the detection of the ion transitions. The multiple reaction
monitoring transitions for analytes were as follows: m/z insulin 890.56 > 984.55, m/z insulin 1284.73 >
1104.60. Analytes were quantified by means of calibration curves using insulin as internal standard. The
significance of differences in the mean values of different groups is evaluated using ANOVA between
treatment groups followed by Tuke’s multiple comparison post hoc test (SigmaPlot SyStat Software Inc,
San Joes, CA). The standard curves showed linearity for creatine over a range of 0.025 - 10 μg/mL for
insulin. The methodology for this assay involves reduction with dithiolthreitol 45 mM and alkylation with
100 mM of iodoacetamide 100 mM of intact insulin for measurement of the free B chain.
2.15. Interaction of PGA-PEG enveloped nanocomplexes (ENCPs) with Caco-2 cells

12
The interaction of a selected prototype consisting of C12-r8, insulin and diblock PGA-PEG with Caco-2
cells was studied by confocal laser scanning microscopy (CLSM), and the entrance of ENCPs into the
cells was quantified by flow cytometry (FACS) after confirming the colloidal stability of FITC-labeled
(λem = 519 nm) ENCPs and the absence of fluorescence leakage in relevant medium (HBSS). Caco-2 cells
were seeded in 24-well cell culture plates at a density of 5x10⁵ cells per well, allowed to adhere for 48 h
until confluency, and then incubated with 400 μL of FITC-labeled ENCP (0.2 mg/mL) suspension in
HBSS. After 2 h, cells were washed three times with PBS and detached from the plates by trypsinization.
After a 10-min centrifugation at 1500g (Eppendorf centrifuge 5804 R, Daigger scientific Inc., USA), the
supernatant was discarded, while the cells were resuspended in PBS and their FITC fluorescence
quantified using a BD FACSVerseTM
flow cytometer (Becton Dickinson Biosciences, San Jose, CA, US).
For the CLSM study, experiments were preformed according to two experimental protocols. In one of
them, the Transwell® inserts fixed in PFA 4% were gently washed in HBSS. Actin was stained with
200µL of rhodamine-phalloidine (1:50) in buffered HBSS+0.2% (v/v) Triton X-100 for 10 min in the dark
to reveal cell borders, cell nuclei was stained with DAPI (1:20). Subsequently, inserts were washed in
HBSS, cut and mounted on glass slides. Images were captured using a Zeiss™ confocal microscope
(LSM 150). Data were analyzed by the Axio Vision software (vs 4.8) to obtain y-z, x-z and x-y views of
the cells monolayers. In another experimental protocol, 200 μL of Caco-2 cells suspension were seeded at
a concentration of 2 × 10⁵ cells mL
−1 in μ-Slide 8 well (Ibidi, Germany), previously coated with
Poly-D-lysine hydrobromide (0.1 mg/ml), and allowed to adhere for 24 hours, before gently washed twice
in pre-warmed HBSS. Then, 200 μl of FITC-labeled ENCP suspension in HBSS at a concentration of 0.2
mg/mL were added to each chamber and incubated for 2 hours at 37ºC. Cells were fixed with PFA 4% in
HBSS for 20 minutes and washed twice with HBSS. Permeabilization step was performed adding
buffered HBSS+0.1% (v/v) Triton X-100 for 3 minutes and then washed with HBSS. Actin was stained
with Phalloidin-iFluor 594 Reagent - CytoPainter (ab176757) 1x in HBSS + 1% (w/v) BSA. Staining of
cell nuclei was carried out simultaneously using Hoechst® 33342 (1:4000) for 30 min in the dark. Images
were captured using a Leica TCS SP5 confocal microscope and data were analyzed by the Leica
Application Suite software.
2.16 Labeling of PGA-PEG enveloped nanocomplexes (ENCPs) with Technetium-99m
Diblock PGA-PEG-coated ENCPs were labelled with Technetium-99m (99m
Tc) by the stannous chloride

13
method [48], taking advantage of the functional groups on the surface of the carrier. As a first step,
technetium was reduced to the 5+ state with stannous chloride. The reduced
99mTc species formed then
ionic/coordination bonds with the carboxylic acid groups (–COO−) of the PGA and/or the hydroxylic (–
OH) groups of the PEG on the surface of the enveloped nanocomplexes. Briefly, 0.1 mL of previously
prepared diblock PGA-PEG coated ENCPs at a concentration of 13.5 mg/ml were mixed with 0.04 mL of
stannous chloride solution (0.05 mg/mL) in acidified water (pH adjusted to 4 with 0.1 N HCl), followed
by the addition of 1.5 mCi of freshly eluted 99m
Tc-Pertecnetate (99m
TcO4−) in 0.1 mL NaCl 0.9%, which
were then added to pre-reduced tin. The mixture was incubated at room temperature for 30 min with
occasional gentle stirring. The overall procedure was carried out in helium-purged vials using
helium-purged solutions to minimise oxygen content and avoid oxidation of pre-reduced tin. The
efficiency of the labelling process was then assessed by an instant paper chromatography system with
WhatmanTM
3MM paper (Cellulose 0.34 mm; General Electric, Boston, Massachusetts, United States).
The WhatmanTM
3MM strip was spotted with the labelled complex and developed using NaCl 0.9%.
Whatman 3MM strips were read using a MiniGita radiochromatographic system equipped with a 2×2 NaI
(Tl) detector and MiniGita software (Raytest GmbH, Dortmund, Germany). The particle size and
polydispersion of the labelled nanocomplexes were determined by photon correlation spectroscopy. Prior
to the in vivo biodistribution studies, the stability of the radiolabeled ENCPs as well as the release of the
radioisotope was evaluated in biorelevant media (Simulated gastric fluid (SGF, pH 4.0) and Simulated
intestinal fluid (SIF, pH 6.8) without enzymes) simulating the in vivo condition in fasted rats.
2.17. In vivo biodistribution of radiolabeled PGA-PEG enveloped nanocomplexes (ENCPs)
The biodistribution of 99m
Tc-ENCPs was studied in male Wistar rats (n=3) weighing 250–300 g that had
been fasted for 12 h. One single dose of radiolabeled ENCPs, corresponding to 50 IU insulin/kg and 1
mCis of radioactivity/kg, was administered to each animal by oral gavage. Free 99m
Tc was also
administered at the same dose (1 mCis/kg) as a control (n=3). The animals were then anaesthetized with
1.5% isoflurane gas (in 100% oxygen) and placed in supine position on the SPECT–CT (Symbia;
Siemens Medical System, USA). A high resolution low-energy parallel-hole collimator was used. SPECT
images were obtained at predetermined time points (1, 2, 4, 6, 8, 26 h after administration), over a 360°
arc, using 64 frames at 20 s per frame in a no circular orbit. The scan parameters for CT were 130 kV, 30
mA s, 1 mm slices and Flash 3D iterative reconstruction with a Gaussian filter with a full-width at half

14
maximum of 8.4. Animals remained anaesthetized for the duration of the study. For quantification, the
images were processed with the WorkflowEngine software and studies were exported to the PMOD
software (version 3.0; Adlisvil, Switzerland) and covert to analyze format. Volumes of interest (VOIs)
were drawn and evaluated in the SPECT-CT images to get the time-course evolution of the
biodistribution of the labelled nanoparticles.
2.18. In vivo response to insulin-loaded ENCPs
Male Sprague-Dawley rats (240-300 g) were provided by the Central Animals House of the University of
Santiago de Compostela. All animal experiments were reviewed and approved by the ethics committee of
the University of Santiago de Compostela (procedures Prof. Carlos diéguez, 1500AE / 12 / FUN01 / FIS02
/ CDG3) according to the European and Spanish regulations for the use of animals in animal studies;
performed therefore in compliance with the Directive 2010/63 / EU of the European Parliament and
Council of 22nd September 2010 on the protection of animals used for scientific purposes; Spain Royal
Decree 1201/2005, of October 10th, on the protection of animals used for experimental and other scientific
purposes and under the Royal Decree 296/2008 of Spain 30th December on the protection of animals used
for experimental and other scientific purposes including teaching. The animals were kept under 12 h
light/12 h dark cycles and were fed a standard laboratory rodent diet in pellets form (Panlab A04, Panlab
laboratories). They were fasted for 4h before experiments (free access to water), and maintained
conscious during the experiment. The animals’ glucose level was tested right before starting the
experiments and only those with blood glucose over 65 mg/dL were selected for the study. Oral
administration of the insulin-loaded ENCPs (dosage 50 IU/kg) was performed by using an enteric capsule
made of Eudragit® L100. As control, non-formulated insulin was incorporated into the enteric capsules
and administered to animals following the same procedure (50 IU/kg). Blood samples were collected
from the rat tail vein 30 min prior to the administration to establish the baseline blood glucose level. At
time point 1, 2, 3, 4, 5, 6, 7, 8, 9 10 and 11h after dosing, 0.1 mL of the blood samples were collected to
determine the glucose level change, using a glucometer (GlucocardTM
G+ meter, Arkray Factory, Japan).
The statistical analysis was carried out using a Student’s t test. Differences were considered statistically
significant at *p < 0.05.

15
3. Results and discussion
The main objective of this study was the rational design of a nanocarrier intended to help peptides to
overcome the biological barriers associated with the oral administration route. This design involved the
formation of core-shell nanoparticles, where the nanoparticles core contained a modified CPP complexed
to insulin and, the shell, made of PGA-PEG, had a protective role against the harsh intestinal environment.
Our selection of r8 was based on its reported capacity to enhance insulin absorption [40, 49]. However,
while in these previous studies, CPPs were simply mixed with insulin in solution [50], in this work we
formed well-defined and uniform nanometric r8-insulin complexes. For this purpose, we synthesized
hydrophobically modified r8, which would enable the formation of nanocomplexes through ionic and
hydrophobic forces. The selection of the protective envelope was based on the reported capacity of
PEGylated polymers to prevent nanoparticles aggregation [33] and enhance mucodiffusion [34]. Figure 1
summarizes the process of the rational design of our nanosystems.
Figure 1. Flow diagram showing the process for the rational design of ENCPs.
3.1. Development and physicochemical characterization of modified r8-insulin nanocomplexes
(NCPs)
Two different amphiphilic r8 derivatives, cholesterol-r8 and lauric acid-r8, were synthesized to form

16
insulin-CPP nanocomplexes (NCPs), with the idea of exploring the role of the hydrophobic moiety in the
formation of well-defined and stable nanocomplexes. The non-modified r8 was also used as a control. In a
first stage, and to favor the complexation, we dissolved insulin in basic media (0.001N or 0.01N NaOH)
and r8 in water, before mixing both components in a 1:1 molar ratio. As expected, the most basic pH
(0.01N NaOH), where the insulin molecules were negatively charged, led to the highest complexation
efficiency with the r8 molecules. In a second stage, we studied the effect the r8: insulin molar ratio on the
nanocomplexes properties (Figure 2). In the case of the non-modified r8, a r8: insulin molar ratio 1:1 (~
400 nm) resulted in a very low insulin association (~ 10%, Figure 2A), a result that suggests that the
number of r8 molecules available for the ionic complexation of insulin was insufficient. As expected, by
raising the r8: insulin molar ratio, the AE increased significantly and this led to the neutralization of the
Z-potential (2B). However, the size of the complexes becomes too large and highly variable (2C), a result
that could be attributed to the limited electrostatic repulsion between them (zeta potential close to 0).
On the other hand, as shown in Figure 2, the capacity of C12-r8 or cholesterol-r8 to complex insulin was
drastically different to that of the non-modified r8. At the r8: insulin molar ratio of 1:1, both NCP had a
nanometric size (200-500 nm), a negative surface charge and a modest insulin association efficiency (AE:
60-70%). As the amount of modified-r8 increased, a neutralization of Z-potential value was observed at
molar ratios between 2:1 to 3:1 for modified r8 and between 3:1 to 4:1 for non-modified r8 (2B). At these
ratios, almost all insulin molecules were complexed with the CPP (~ 100% insulin AE) (2A). However,
under these conditions, the lack of electrostatic repulsion between the particles, led to the formation of
large aggregates. Subsequently, after the threshold of modified r8: insulin molar ratio 4:1, the surface
charge of the NCPs became positive enough to prevent their aggregation [51], while the insulin AE
remained 100%. The Z-potential of Cholesterol-r8-insulin and C12-r8-insulin NCPs reached a plateau at
r8: insulin molar ratios of 5:1 and 8:1, respectively, indicating the saturation of the complexation process.
Hence, these molar ratios were selected for the subsequent engineering of the nanocarriers. Overall, these
results indicate that, as expected, the ionic interaction is not the only driving force in the complex
formation and that the hydrophobic interactions between C12 chain or Cholesterol and insulin also play a
significant role [52]. This situation is different from the one observed by other authors exploring the
interaction of modified r8 with polynucleotides, based either on their covalent conjugation, or their
complexation, solely driven by ionic forces [53-56]. Furthermore, these reported r8-polynucleotides

17
complexes were not designed to be enveloped by a protecting polymer shell, as described in the following
section.
Figure 2. (A) Association efficiency, (B) Z-potential, (C) particle size of non-coated C12-r8-insulin (black squares),
Chol-r8-insulin complexes (red circles) and r8-insulin controls (blue triangles) at r8: insulin molar ratio from 1:1 to
8:1. Data are expressed as mean ± SD, n=3
3.2. Development and physicochemical characterization of ENCPs
Based on the results described above, we selected specific nanocomplexes compositions for their
subsequent optimization. The optimization process was based on the premise that the positive surface
A B
C

18
charge of r8-insulin NCPs might have undesirable consequences, i.e. promote their interaction with
negatively charged pancreatic enzymes and hamper their mucodiffusion [35, 57]. In order to deal with
these barriers, our approach was to envelop the NCPs with PEG derivatives. Though PEG presents a
neutral charge, the steric hindrance provided by this polymer is well known for stability improvement [33,
58]. For this purpose, in a first stage, we explored different non-ionic stabilizers, i.e. poloxamers or PEG
stearate, as well as anionic derivatives, i.e. PGA-PEG. The analysis of the zeta potential values led us to
the conclusion that the non-ionic polymers could not be attached to the surface of the NCPs. In contrast,
when we used PGA-PEG, we observed the reversion of Z-potential of the NCPs from positive to negative,
a result that made evident the success of the enveloping process (Figure 3). We attributed the benefit of
this polymer to its negative charge, which enable an adequate interaction with the positively charged
nanocomplexes. In order to have a better understanding of the enveloping process, we used diblock
PGA-PEG and branched PGA-PEG (Figure 3) and applied two different methodologies: i) simple
incubation and ii) film hydration.
B
PGA-PEG
C
A
PGA-PEG
PGA-PEG
PGA-PEG
PGA-PEG
PGA-PEG
Non-enveloped NCP
D
Enveloped NCP

19
Figure 3. (A) Peptide association efficiency, (B) Z-potential and (C) particle size of the non-enveloped
C12-r8-insulin NCPs and those ENCPs coated by branched and diblock PGA-PEG polymers with different
methods, data are expressed as mean ± SD, n >10 for diblock PGA-PEG ENCPs, and n = 3 for the rest, and (D)
TEM images of non-enveloped and diblock PGA-PEG enveloped C12-r8-insulin ENCPs.
Figure 3 shows the characteristics of the ENCPs formed using the two methodologies and the two
enveloping polymers, the diblock or branched PGA-PEG (NCPs consisting of C12-r8: insulin molar ratio
8:1). The results obtained with the incubation method indicate that for the diblock PGA-PEG, the
association of insulin to the NCPs was maintained (Figure 3A) and the positive charge was reduced
(Figure 3B). In contrast, when the enveloping polymer was the branched PGA-PEG, an important
displacement of insulin (AE reduced from 100% to 15%), accompanied with an inversion of the zeta
potential was observed. The different behavior of these two enveloping materials was explained on the
basis of their chemical structure. The branched copolymer has an important negative charge attributed to
the PGA (100 monomer units) and small 0.3 kDa PEG chains pending, whereas the diblock copolymer
has 10 units of PGA, linked as a diblock to 20 kDa long PEG chains. Thus, the large negative branched
co-polymer molecules could have displaced insulin from the complexes, whereas the small PGA segment
of the diblock copolymer, could be better accommodated around the positive nanocomplexes.
Unlike the incubation method, the film hydration method allowed the efficient accommodation of both
types of PGA-PEG onto the surface of the cationic NCPs without impairing the AE of insulin (Figure 3A).
The surface charge of the NCPs changed from positive to neutral or negative values due to the attachment
of the diblock or branched PGA-PEG, respectively (Figure 3B). This could be attributed to the fact that
the film hydration method allows for a gradual and more effective envelopment of the NCPs with the
PGA-PEG molecules.
In order to confirm that the enveloping process did not alter the particle size and morphology of the
particles, both NCPs and ENCPs were observed by TEM. Figure 3D shows the images of C12-r8-insulin
NCPs and their diblock PGA-PEG enveloped ENCPs. In agreement with the data obtained by DLS, the
size and appearance of the nanocomplexes with or without envelope are very similar. Overall, the
physicochemical properties and insulin complexation capacity observed for the selected NCPs and
ENCPs are summarized in Table 1. To further assess the efficiency of the enveloping process, the stability

20
of the ENCPs was evaluated as described in the next section.
Table 1. Physicochemical properties, insulin association efficiency and final drug loading of non-enveloped
C12-r8-insulin / Chol-r8-insulin NCPs and those ENCPs enveloped by diblock or branched PGA-PEG polymers
using film hydration method. Data are expressed as mean ± SD, n >10 for NCP and ENCP with C12-r8-insulin core,
n = 3 for those with Chol-r8-insulin core.
NCP core ENCP shell Size (nm) PDI Z-pot
(mV)
AE
(%)
Loading
(%)
C12-r8-insulin
(r8: insulin 8:1)
Non-enveloped 176 ± 16 0.1 +20 ± 1 100 ± 0 33.3 ± 0
Branch PGA-PEG 220 ± 19 0.1 -44 ± 1 91 ± 6 18.2 ± 1.2
Diblock PGA-PEG 236 ± 27 0.1 +2 ± 2 99 ± 0 26.6 ± 0
Chol-r8-insulin
(r8:insulin 5:1)
Non-enveloped 171 ± 26 0.1 +29 ± 4 100 ± 0 40.8 ± 0
Branch PGA-PEG 202 ± 28 0.2 -43 ± 1 81 ± 4 18.2 ± 0.9
Diblock PGA-PEG 225 ± 10 0.2 +2 ± 3 92 ± 9 26.8 ± 2.6
3.3. Stability of ENCPs in simulated intestinal media
The colloidal stability of the nanocomplexes was tested in simulated intestinal media (SIF). As expected,
considering their positive charge, the stability studies revealed that the non-enveloped NCPs aggregated
massively. In contrast, the ENCPs enveloped with, either diblock or branch PGA-PEG exhibited an
adequate colloidal stability in SIF for up to at least 4 hours (see supporting information Figure S2). In
contrast, when the ENCPs were incubated in a complex intestinal medium, i.e. FaSSIF-V2 medium, they
showed a different behavior depending on the enveloping polymer. Indeed, while the diblock PGA-PEG
ENCPs formulations remained stable for at least 6 hours (Figure 4), those enveloped by the branched
PGA-PEG aggregated significantly. Based on the improved stability of the diblock PGA-PEG enveloped
ENCPs under bio-relevant conditions, this system was selected as the basis for most of the subsequent
studies described below.

21
Figure 4. The evolution of particle size of the diblock PGA-PEG enveloped C12-r8-insulin (black square) and
Cholesterol-r8-insulin (red circle) ENCPs in FaSSIF-V2, respectively.
3.4. Stability of ENCPs during storage and development of a freeze-dried formulation
The particle size of the C12-r8-insulin and Cholesterol-r8-insulin ENCPs formulated with diblock
PGA-PEG was analyzed upon storage at 4 ºC, at room temperature, and at 37 ºC for up to 60 days. The
C12-r8-insulin ENCPs presented the same characteristics after being stored for 2 months under the
conditions shown above, while a decrease in dCR, indicative of a alteration in the concentration of the
sample, was observed for the Chol-r8-insulin ENCPs at 4 ºC and 37 ºC after 30 days (see supporting
information Figure S3). In addition, the C12-r8-insulin enveloped with diblock PGA-PEG could be
freeze-dried (in the presence of 2% trehalose) and reconstituted without altering their physicochemical
properties (particle size and zeta potential, as well as the insulin AE, which remained to be 100%, leading
to a drug loading of 27% (w/v)). Moreover, the stability of this dried product was maintained for at least 2
months upon storage at room temperature. The reconstitution of the dried product led to a suspension of
ENCPs with a particle size of 210 nm (Figure S4), a low PDI below 0.1, and a Z-potential around +1 mV.
When exposed to SIF, the freeze-dried formulation (after up to 1-month storage) remained stable for at
least 4 h without a significant peptide leakage (< 10%). The evolution of particle size is shown in Figure
S5. The dCR remained stable for the duration of the study and the PDI was below 0.1 in all cases. This
possibility to convert the liquid suspension into a powder is particularly useful for the development of an
oral formulation. Based on these results, the diblock PGA-PEG C12-r8-insulin ENCPs was selected as an

22
adequate prototype for most of the subsequent studies described in the next sections.
3.5 Protection of insulin against enzymatic degradation
To assess the nanocarrier’s ability to protect insulin against enzymatic degradation in the GIT tract, a
proteolysis study of the diblock PGA-PEG enveloped C12-r8-insulin ENCPs was performed in SIF media
including 1% (w/v) pancreatin (8 USP). The results revealed that after 15 min incubation in this drastic
proteolysis medium, plain insulin was totally degraded. In contrast, the ENCPs efficiently protected the
entrapped insulin from degradation (75.6 ± 8.8% remaining), and a significant amount of insulin (25.3 ±
4.6%) was still active after a 2-hour incubation in the proteolytic medium (Figure 5). Taking into account
that pancreatin is mainly present in the duodenum region, and that the ENCPs are supposed to travel and
be retained in different parts of the intestine, these results suggest that insulin may survive in the harsh
intestinal ambient when is incorporated into the diblock PGA-PEG enveloped C12-r8-insulin ENCPs.
Figure 5. The proteolysis study of diblock PGA-PEG enveloped C12-r8-insulin ENCPs (black square) and plain
insulin solution (pink star) incubated in 1% (w/v) pancreatin (8 USP) supplemented SIF media. Data are expressed
as mean ± SD, n = 3.
3.4. In vitro release of insulin from NCPs and ENCPs
A frequent problem associated with the formulation of drug-polymer nanocomplexes is the uncontrolled
premature disassociation of the drug from the complexing polymer. In order to ensure the capacity of

23
ENCPs to efficiently transfer the therapeutic payload from the intestinal cavity into the intestinal
epithelium, we analyzed the behavior of the diblock PGA-PEG enveloped C12-r8-insulin formulation in
SIF (pH 6.8) and FaSSIF-V2 (pH 6.5). As a control, we also analyzed the behavior of the non-enveloped
NCPs, in order to elucidate the role of enveloping polymer in controlling the release of insulin. These two
release media were selected in order to mimic the conditions of the intestinal fluids at different times, and
to explore the effect of physiologically relevant bile salts and surfactants on the release profile of insulin
from the carriers. As shown in Figure 6, in the case of the non-enveloped NCPs, a certain amount of
insulin was immediately released upon dilution of the NC suspension in simulated intestinal media (about
25% in SIF and 14% in FaSSIF-V2), however this premature release was reduced (< 10%) and no
subsequent release was observed in the case of PGA-PEG enveloped ENCPs for up to 6 hours (data not
shown). We concluded that the enveloping polymer protected the ENCPs from a premature release upon
contact with the intestinal fluids. In a second step, in order to understand the mechanism of release, we
sought to simulate the release environment assuming that the ENCPs could enter the enterocytes via
endocytosis and release their content at that level. This assumption is based on the reported fact that
endocytosis is the predominant mechanism of uptake of nanoparticles with similar features (i.e.
PGA-PEG coating and/or CPP complexation), followed by the endosomal pathway [59, 60]. Along this
pathway, the pH drops sequentially, going from a pH of ~ 6.0 in early endosomes towards a more acidic
pH that may reach a pH as low as 4.0. To understand the influence of this pH decline on drug release, we
assessed the release of insulin from the C12-r8-insulin NCPs and the corresponding ENCPs in acetate
buffer (pH 4.0, 100 mM). The results shown in Figure 6 indicate that around 53% of the associated
insulin was immediately released from NCPs in this acidic medium, whereas the release from the ENCPs
was still very limited (<< 10%, data not shown). This pH-dependent release profile may be explained by
the insulin decomplexation from C12-r8 at the low pH values. At pH 4.0, both insulin and C12-r8 become
positively charged and, hence, electrostatically repulsed and released. Based on this in vitro release
behavior, we could speculate that following oral administration, the PGA-PEG coating could not only
preserve the stability of the ENCPs in the intestinal fluids, but also prevent the premature release of the
peptide. This interpretation should be taken with caution, given the differences that exist between the in
vitro conditions and the intracellular environment. In a realistic in vivo situation, it is possible that the
drug release from ENCPs could be triggered by more sophisticated mechanisms.

24
Figure 6. Release profile of insulin from the non-enveloped C12-r8-insulin NCPs in SIF pH 6.8, FaSSIF-V2 pH
6.5 and acetate buffer pH 4.0 up to 6 hours at 37 °C. Data are expressed as mean ± SD, n = 6.
3.10. Transport of PGA-PEG enveloped nanocomplexes (ENCPs) in intestinal mucus
Figure 7 displays the diffusion capacity of the diblock PGA-PEG enveloped ENCPs, expressed as the
effective diffusion coefficient in mucus (Dm) divided by D in water (Dm/Dw) as well as the α parameter at
a sample time of 1 second. Figure 7 also includes the results obtained with a mucoadhesive and a
mucodiffusive control. The results indicate that the diblock PGA-PEG ENCPs present a moderate
diffusion in mucus at 37 oC, with a mean α parameter value of 0.5 and a Dm/Dw ratio of 1.9 x 10
-2, which
is one order of magnitude lower than the one obtained for the mucodiffusive control. These
mucodiffusion values are in the same order of magnitude than those corresponding to the mucopenetrative
PEG-PLGA NPs, with particle sizes varying between 90 nm of 164 nm, or PEG-polystyrene nanoparticles
of 200 nm, when tested in human cervicovaginal mucus [61]. These acceptable mucodiffusive properties
of ENCPs are justified by their almost neutral surface charge due to the presence of PEG chains on the
ENCPs surface [35]. Overall, these results indicate the ability of the ENCPs to overcome the mucus
barrier.
0 1 2 3 4 5 60
20
40
60
80
100
Insu
lin
rel
ease
fro
m N
CP
s (%
)
Time (h)
SIF (pH 6.8)
FaSSIF-V2 (pH 6.5)
Acetate buffer (pH 4.0, 100 mM)

25
Figure 7. Calculated Dm/Dw coefficients and α parameter of the diblock PGA-PEG enveloped ENCPs in porcine
intestinal mucus at a time scale of 1 second (n 1000). Parameter α provides information about the nature of the
diffusion of the nanoparticle in the mucus; free diffusive (α~1); subdiffusive (α<0.9); immobile NPs (α<0.2)).
3.6. Cytotoxicity of ENCPs on Caco-2 cells
A concentration-dependent cytotoxicity profile (MTS assay) was observed for both, the diblock
PGA-PEG enveloped ENCPs and the C12-r8 control, upon incubation with Caco-2 cells for 2 hours;
while diblock PGA-PEG showed negligible cytotoxicity at the same concentration (Figure 8).
Interestingly, the formation of ENCPs reduced the inherent cytotoxicity of the C12-r8, most probably due
to the protective PGA-PEG shell. However, the reported toxicity studies of oligoarginines performed on
rat intestinal tissues showed no toxicity [8]. Bearing these results in mind and the known capacity of r8 to
enter the cells, it can be induced that the concentration-dependent cytotoxicity is directly associated to the
permeation enhancement effect of CPP derivatives [62]. In conclusion, these results clearly show the
positive contribution of the enveloping process in reducing the inherent toxicity of CPPs used as
penetration enhancers.

26
Figure 8. Cell viability of the Caco-2 cell line after a 2 h incubation with: diblock PGA-PEG coated C12-r8-insulin,
C12-r8, and diblock copolymer (Mean ± S.D., n = 9).
3.7. Effect on transepithelial electrical resistance (TEER) of Caco-2 cells
Although r8 is not supposed to affect the intercellular junctions, the limited information about the
interaction of the CPP hydrophobic derivatives with the intestinal epithelium led us to investigate the
potential interference of the C12 derivative with the intercellular junctions [62, 63]. For this, we evaluated
the TEER of the Caco-2 monolayer after exposure to the C12-r8- insulin nanocomplexes (NCPs) and the
PGA-PEG enveloped nanocomplexes (ENCPs), at different concentrations (0.01 mg/mL (non-toxic), 0.05
mg/mL (non-toxic) and 0.2 mg/mL (50% decrease in cell viability)). A physical mixture of r8 and insulin
was used as a control formulation. Simultaneously, Lucifer yellow (LY) was co-incubated with the
formulations to visualize their effect on the paracellular transport. The results presented in Figures 9A, B,
C indicated that the TEER values were unaffected by the nanocomplexes irrespective of their composition
and concentration. Similarly, no alteration in the monolayer was observed upon exposure to the physical
mixture. In agreement with this, we observed that the apparent permeability values (Papp) of LY across
the Caco-2 cell monolayer was not influenced by the previous exposure to the NCPs and ENCPs (Figure
9D). These results confirmed that, at the concentration tested, C12-r8 did not interfere with the
intercellular tight junctions.
A B

27
Figure 9. TEER values of Caco-2 cell monolayers after a 2-h and 24-h exposure times to non-enveloped NCPs and
diblock PGA-PEG ENCPs at different concentrations: (A) 0.01 mg/mL, (B) 0.05 mg/mL and (C) 0.2 mg/mL; and
(D) Lucifer Yellow transport across Caco-2 cell monolayers after a-2 h exposure to different concentrations of NCP
and ENCPs. Data is expressed as mean ± SD, n = 3, changes are considered statistically significant at p < 0.05.
3.8. Interaction of ENCPs with Caco-2 cells
In order to assess the possible value of the ENCPs technology as intracellular peptide delivery carriers,
we studied the mechanism of interaction of FITC-labeled nanocarriers (diblock PGA-PEG) (0.2 mg/mL)
with the Caco-2 cells for up to 2 hours. The graphic representation of the flow cytometry analysis (Figure
10A) shows a significant displacement of the fluorescence intensity peak corresponding to the cells
treated with ENCPs. This displacement, which indicates that the number of positive cells is higher than
99%, is a clear indication of the important interaction of the ENCPs with the Caco-2 cells. These results
were confirmed by confocal laser scanning microscopy (CLSM). The images presented in Figure 10B
show that FITC-labeled ENCPs (green) had a strong interaction with the Caco-2 monolayer and remained
associated to it rather than being transported across it. Whether the ENCPs crossed the membrane and
C D

28
remain retained near the inner side of membrane or were simply adsorbed onto the membrane could not
be discriminated from the visual observation of these images. To further clarify this behavior, we studied
the interaction of the ENCPs with individual Caco-2 cells. In this situation the high internalization of the
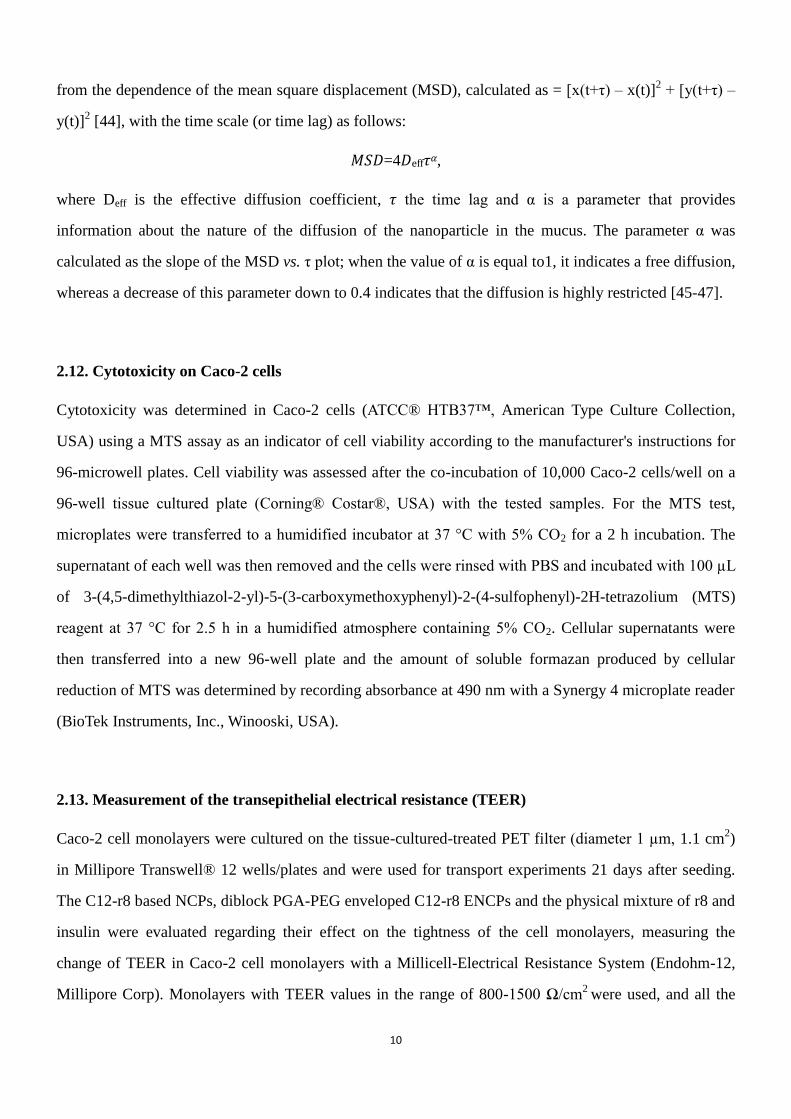
FITC-labeled ENCPs (green) could be easily visualized and presented in Figure 10C.
ENCP group
A
B
Control group ENCP group
B
Control group
C
29
Figure 10. (A) The Flow cytometry profile shows the fluorescence peaks corresponding to the Caco-2 cells that
internalized the fluorescent ENCPs (0.2 mg/mL) after a 2-hr incubation time (peak to the right) and the non-fluorescent
control cells (peak to the left), n=9. (B) CLSM images (y-z, x-y and x-z sections) of the cell membranes upon staining
with Rhodamine-phalloidine (red color, F-actin) and DAPI (blue color, cell nuclei). (C) CLSM images of the Caco-2
cells upon staining with Phalloidin-iFluor 594 Reagent - CytoPainter (red color, F-actin) Hoechst® 33342 (blue color,
cell nuclei). The FITC-labeled ENCPs are shown in green color (FITC).
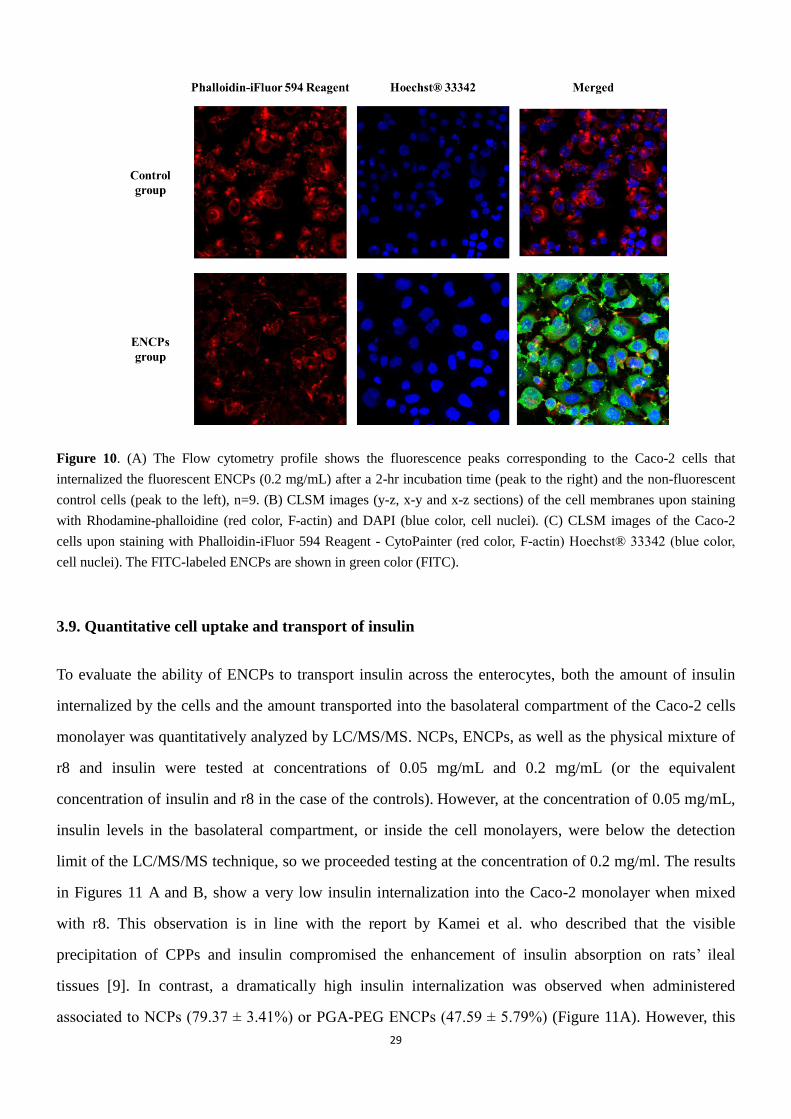
3.9. Quantitative cell uptake and transport of insulin
To evaluate the ability of ENCPs to transport insulin across the enterocytes, both the amount of insulin
internalized by the cells and the amount transported into the basolateral compartment of the Caco-2 cells
monolayer was quantitatively analyzed by LC/MS/MS. NCPs, ENCPs, as well as the physical mixture of
r8 and insulin were tested at concentrations of 0.05 mg/mL and 0.2 mg/mL (or the equivalent
concentration of insulin and r8 in the case of the controls). However, at the concentration of 0.05 mg/mL,
insulin levels in the basolateral compartment, or inside the cell monolayers, were below the detection
limit of the LC/MS/MS technique, so we proceeded testing at the concentration of 0.2 mg/ml. The results
in Figures 11 A and B, show a very low insulin internalization into the Caco-2 monolayer when mixed
with r8. This observation is in line with the report by Kamei et al. who described that the visible
precipitation of CPPs and insulin compromised the enhancement of insulin absorption on rats’ ileal
tissues [9]. In contrast, a dramatically high insulin internalization was observed when administered
associated to NCPs (79.37 ± 3.41%) or PGA-PEG ENCPs (47.59 ± 5.79%) (Figure 11A). However, this

30
high internalization was not translated into a subsequent insulin transport. In fact, the highest value,
which was observed for the ENCPs enveloped with diblock PGA-PEG (Figure 11B) was only 2.11 ±
0.33%. The greater insulin uptake achieved for the NCPs as compared to that of ENCPs could be simply
understood by the more important internalization capacity of cationic nanoparticles vs. the neutral
PEGylated ones. However, we should keep in mind that the NCPs are neither stable in the intestinal fluids
nor able to diffuse across the mucus and, therefore, their high internalization capacity would not be
translated in an in vivo situation, in the presence of enzymes and mucus. Irrespective of the differences
between the enveloped and non-enveloped nanocarriers, a clear conclusion from this study is that the
ENCPs are highly efficient as intracellular drug delivery carriers, reaching the highest intracellular
peptide delivery ever reported (47.59 %) in the Caco-2 model, however, their capacity to facilitate the
trans-epithelial transport appears to be limited.
Figure 11. (A) Cell uptake and (B) apical to basolateral transport of insulin across the Caco-2 cell monolayer with
0.2 mg/mL of ENCPs, NCPs or a physical mixture of r8 and insulin at 37 °C after a 2 h incubation. Data are
expressed as mean ± SD, n = 3. Changes are considered statistically significant at p < 0.05.
3.11. In vivo biodistribution of radiolabeled PGA-PEG enveloped nanocomplexes (ENCPs)
Diblock PGA-PEG coated ENCPs were successfully labelled with Technetium-99m (99m
Tc) (99%
labeling efficiency according to paper chromatography analysis) (Figure S6). The radiolabeled ENCPs
exhibited similar particle size as the non-labelled ENCPs and remained stable after incubation in SGF for
2 hours and in SIF for 4 hours (Figure S7). No significant release of the radioisotope was observed under
the same conditions. Figure 12A shows SPECT-CT images of the distribution of the radiolabeled ENCPs,
A B

31
following their oral administration to rats. The results indicate that the ENCPs travel along the gastric
cavity and small intestine (duodenum, jejunum and ileum) for 2 - 4 hours and they accumulated at the
cecum level for at least 11 hrs. Curiously, only a small amount was accumulated in the colonic region. On
the contrary, as observed in Figure 12B, the free radioisotope (control) was found mostly in the stomach
and was eliminated from the GIT more rapidly than the ENCPs (Figure 12D). Not unexpectedly, the
amount of radioactivity recovered in GIT for control group was between 60-80%, as a result of the fast
accumulation in the bladder and subsequent excretion of the radiomarker. In the case of ENCPs, over 90%
radioactivity recovery was observed with an accumulation in the bladder only at 11 h post-administration.
This retarded excretion of the marker was attributed to its attachment to the nanocarrier and its
accumulation at the intestinal level. Indeed, these results indicate that the ENCPs did not adhere to gastric
mucus but exhibited a significant and prolonged interaction with the intestinal mucosa, particularly high
at the cecum region. This specific accumulation at the cecum region has been previously reported by
other groups [18, 64, 65], and it has been attributed to the physiology of the rat intestine. In fact, the
cecum of rodent species is extremely large and adapted to their nutrition needs [66, 67]. Overall, these
data highlight the specific accumulation of the ENCPs in the intestinal mucosa, a result that is in
agreement with their high internalization by the Caco-2 monolayers.
A
B

32
Figure 12. SPECT-CT images following the oral biodistribution of (A) 99m
Tc-ENCPs and (B) the free 99m
Tc
(control) at 1, 2, 4, 8, 11 and 26 hours. Biodistribution of (C) 99m
Tc-ENCP and (D) free 99m
Tc (control) in Wistar rats
with time. (s = stomach; i = intestine (duodenum, jejunum and ileum); c = cecum; cl = colon; r = rectum; b =
bladder)
3.12. In vivo response to insulin-loaded ENCPs
Following the observed accumulation of ENCPs at the intestinal level, we assessed whether this would be
translated into an enhanced systemic absorption of the associated peptide. As a simple way to estimate the
absorption of insulin, we monitored the blood glucose levels after administration of the formulation in
healthy rats in a realistic condition, i.e. oral administration (50 IU/kg) of the freeze-dried ENCPs powder
introduced in an enteric mini-capsule. This enteric capsule, which starts dissolving at pH 6, was used to
facilitate the delivery of the ENCPs free at the intestinal level. Figure 13 indicates that, overall, with the
exception of one point (2 h), there are not statistically significant differences between the rat glucose
levels observed for the insulin and for the ENCP formulation. The comparison of these in vivo data with
those obtained in vitro (stability, mucodiffusion behavior and capacity to enter the Caco-2 cells) led us to
speculate about the potential reason behind the lack of correlation. Based on the extraordinary uptake of
the diblock PGA-PEG enveloped ENCPs by the Caco-2 cells and the very high insulin retention
(47.59 %), we have formulated the hypothesis that ENCPs were internalized in the intestinal epithelium
where they formed a depot reservoir from which insulin might be slowly released. In fact, the limited
insulin transport (2.11%), observed in the Caco-2 model would be in agreement with the mild systemic
drug effect. Restricted by the peptide drug model selected in this work, unfortunately, it was not possible
to visualize a potential benefit of the formulation for a local therapeutic effect. However, the high insulin
internalization by the enterocytes led us to speculate about the potential utility of the ENCPs for the
C D

33
intestinal delivery of locally acting peptides. Current studies are aimed at validating this hypothesis.
Figure 13. Standardized hypoglycemic effect in healthy rats following oral administration of insulin-loaded ENCPs
or plain insulin in enteric capsule (50 IU/kg). Data represents the mean ± S.E., n=8. Differences were considered
statistically significant at *p < 0.05.
Conclusion
Herein, we describe the development and characterization of a new oral peptide delivery system based on
the complexation of the peptide with hydrophobized CPPs (C12-r8) and subsequent envelopment by a
protective layer made of PEGylated polyaminoacids (PGA-PEG), named as ENPCs. The system was
stable in the intestinal fluids and provided adequate protection to the associated model peptide - insulin -
from degradation. In addition, the system showed a capacity to diffuse through intestinal mucus and
transport insulin into the Caco-2 monolayer in a very efficient manner, reaching the highest in vitro
insulin uptake ever reported (47.59 ± 5.79%). This important retention in the enterocytes, which was
corroborated in the in vivo biodistribution studies, was not, however, translated into an enhanced systemic
absorption. These results suggest the potential value of the ENCPs for the local delivery of peptide drugs
to the intestinal mucosa. Current studies are aimed to validate this hypothesis.
Acknowledgements
The work was supported by the European TRANS-INT Consortium, which received funding from the
European Union’s Seventh Framework Programme for research, technological development and
demonstration under grant agreement No. 281035.

34
References
[1] K. Fosgerau, T. Hoffmann, Peptide therapeutics: current status and future directions, Drug Discovery Today, 20 (2015)
122-128.
[2] M.L. Smythe, Orally Delivered Peptides for Treatment of Inflammatory Bowel Disease, in: Reference Module in Chemistry,
Molecular Sciences and Chemical Engineering, Elsevier, 2016.
[3] A. Beloqui, A. des Rieux, V. Préat, Mechanisms of transport of polymeric and lipidic nanoparticles across the intestinal
barrier, Advanced Drug Delivery Reviews, 106 (2016) 242-255.
[4] H. Malhaire, J.-C. Gimel, E. Roger, J.-P. Benoît, F. Lagarce, How to design the surface of peptide-loaded nanoparticles for
efficient oral bioavailability?, Advanced Drug Delivery Reviews, 106 (2016) 320-336.
[5] Z. Niu, I. Conejos-Sánchez, B.T. Griffin, C.M. O’Driscoll, M.J. Alonso, Lipid-based nanocarriers for oral peptide delivery,
Advanced Drug Delivery Reviews, 106 (2016) 337-354.
[6] T.A.S. Aguirre, D. Teijeiro-Osorio, M. Rosa, I.S. Coulter, M.J. Alonso, D.J. Brayden, Current status of selected oral peptide
technologies in advanced preclinical development and in clinical trials, Advanced Drug Delivery Reviews, 106 (2016) 223-241.
[7] M. Sánchez-Navarro, J. Garcia, E. Giralt, M. Teixidó, Using peptides to increase transport across the intestinal barrier,
Advanced Drug Delivery Reviews, 106 (2016) 355-366.
[8] M. Morishita, N. Kamei, J. Ehara, K. Isowa, K. Takayama, A novel approach using functional peptides for efficient intestinal
absorption of insulin, Journal of Controlled Release, 118 (2007) 177-184.
[9] N. Kamei, M. Morishita, Y. Eda, N. Ida, R. Nishio, K. Takayama, Usefulness of cell-penetrating peptides to improve intestinal
insulin absorption, Journal of Controlled Release, 132 (2008) 21-25.
[10] C. Damgé, C. Michel, M. Aprahamian, P. Couvreur, New Approach for Oral Administration of Insulin With
Polyalkylcyanoacrylate Nanocapsules as Drug Carrier, Diabetes, 37 (1988) 246-251.
[11] C. Damgé, C. Michel, M. Aprahamian, P. Couvreur, J.P. Devissaguet, Nanocapsules as carriers for oral peptide delivery,
Journal of Controlled Release, 13 (1990) 233-239.
[12] A.K. Agrawal, H. Harde, K. Thanki, S. Jain, Improved Stability and Antidiabetic Potential of Insulin Containing Folic Acid
Functionalized Polymer Stabilized Multilayered Liposomes Following Oral Administration, Biomacromolecules, 15 (2014)
350-360.
[13] H. Takeuchi, Y. Matsui, H. Yamamoto, Y. Kawashima, Mucoadhesive properties of carbopol or chitosan-coated liposomes
and their effectiveness in the oral administration of calcitonin to rats, Journal of Controlled Release, 86 (2003) 235-242.
[14] F. Araujo, N. Shrestha, M.A. Shahbazi, P. Fonte, E.M. Makila, J.J. Salonen, J.T. Hirvonen, P.L. Granja, H.A. Santos, B.
Sarmento, The impact of nanoparticles on the mucosal translocation and transport of GLP-1 across the intestinal epithelium,
Biomaterials, 35 (2014) 9199-9207.
[15] C. Prego, M. García, D. Torres, M.J. Alonso, Transmucosal macromolecular drug delivery, Journal of Controlled Release,
101 (2005) 151-162.
[16] C. Prego, M. Fabre, D. Torres, M. Alonso, Efficacy and Mechanism of Action of Chitosan Nanocapsules for Oral Peptide
Delivery, Pharmaceutical Research, 23 (2006) 549-556.
[17] E.-Y. Chuang, G.T.H. Nguyen, F.-Y. Su, K.-J. Lin, C.-T. Chen, F.-L. Mi, T.-C. Yen, J.-H. Juang, H.-W. Sung, Combination therapy
via oral co-administration of insulin- and exendin-4-loaded nanoparticles to treat type 2 diabetic rats undergoing OGTT,
Biomaterials, 34 (2013) 7994-8001.
[18] K. Sonaje, K.-J. Lin, S.-P. Wey, C.-K. Lin, T.-H. Yeh, H.-N. Nguyen, C.-W. Hsu, T.-C. Yen, J.-H. Juang, H.-W. Sung,
Biodistribution, pharmacodynamics and pharmacokinetics of insulin analogues in a rat model: Oral delivery using
pH-Responsive nanoparticles vs. subcutaneous injection, Biomaterials, 31 (2010) 6849-6858.
[19] S. Jain, V.V. Rathi, A.K. Jain, M. Das, C. Godugu, Folate-decorated PLGA nanoparticles as a rationally designed vehicle for
the oral delivery of insulin, Nanomedicine, 7 (2012) 1311-1337.
[20] M.J. Santander-Ortega, D. Bastos-González, J.L. Ortega-Vinuesa, M.J. Alonso, Insulin-Loaded PLGA Nanoparticles for Oral
Administration: An In Vitro Physico-Chemical Characterization, Journal of Biomedical Nanotechnology, 5 (2009) 45-53.
[21] F.-d. Cui, A.-j. Tao, D.-m. Cun, L.-q. Zhang, K. Shi, Preparation of insulin loaded PLGA-Hp55 nanoparticles for oral delivery,

35
Journal of Pharmaceutical Sciences, 96 (2007) 421-427.
[22] A.C. Foss, T. Goto, M. Morishita, N.A. Peppas, Development of acrylic-based copolymers for oral insulin delivery,
European Journal of Pharmaceutics and Biopharmaceutics, 57 (2004) 163-169.
[23] M. Morishita, T. Goto, N.A. Peppas, J.I. Joseph, M.C. Torjman, C. Munsick, K. Nakamura, T. Yamagata, K. Takayama, A.M.
Lowman, Mucosal insulin delivery systems based on complexation polymer hydrogels: effect of particle size on insulin enteral
absorption, Journal of Controlled Release, 97 (2004) 115-124.
[24] W. Leobandung, H. Ichikawa, Y. Fukumori, N.A. Peppas, Preparation of stable insulin-loaded nanospheres of
poly(ethylene glycol) macromers and N-isopropyl acrylamide, Journal of Controlled Release, 80 (2002) 357-363.
[25] C. Chen, T. Fan, Y. Jin, Z. Zhou, Y. Yang, X. Zhu, Z.-r. Zhang, Q. Zhang, Y. Huang, Orally delivered salmon calcitonin-loaded
solid lipid nanoparticles prepared by micelle–double emulsion method via the combined use of different solid lipids,
Nanomedicine, 8 (2012) 1085-1100.
[26] B. Sarmento, S. Martins, D. Ferreira, E.B. Souto, Oral insulin delivery by means of solid lipid nanoparticles, International
Journal of Nanomedicine, 2 (2007) 743-749.
[27] A. Viscido, A. Capannolo, G. Latella, R. Caprilli, G. Frieri, Nanotechnology in the treatment of inflammatory bowel
diseases, J Crohns Colitis, 8 (2014) 903-918.
[28] S. Hua, E. Marks, J.J. Schneider, S. Keely, Advances in oral nano-delivery systems for colon targeted drug delivery in
inflammatory bowel disease: selective targeting to diseased versus healthy tissue, Nanomedicine, 11 (2015) 1117-1132.
[29] A. Lamprecht, Nanomedicines in gastroenterology and hepatology, Nat Rev Gastroenterol Hepatol, 12 (2015) 195-204.
[30] G. Fuhrmann, J.-C. Leroux, Improving the Stability and Activity of Oral Therapeutic Enzymes—Recent Advances and
Perspectives, Pharmaceutical Research, 31 (2014) 1099-1105.
[31] A.N. Zelikin, C. Ehrhardt, A.M. Healy, Materials and methods for delivery of biological drugs, Nat Chem, 8 (2016)
997-1007.
[32] S. Mitragotri, P.A. Burke, R. Langer, Overcoming the challenges in administering biopharmaceuticals: formulation and
delivery strategies, Nat Rev Drug Discov, 13 (2014) 655-672.
[33] M. Tobio, A. Sanchez, I.S. A. Vila, C. Evora, J.L. Vila-Jato, M.J. Alonso, The role of PEG on the stability in digestive fluids and
in vivo fate of PEG-PLA nanoparticles following oral administration, Colloids and Surfaces B: Biointerfaces, 18 (2000) 315-323.
[34] L.M. Ensign, R. Cone, J. Hanes, Oral drug delivery with polymeric nanoparticles: the gastrointestinal mucus barriers, Adv
Drug Deliv Rev, 64 (2012) 557-570.
[35] K. Maisel, L. Ensign, M. Reddy, R. Cone, J. Hanes, Effect of surface chemistry on nanoparticle interaction with
gastrointestinal mucus and distribution in the gastrointestinal tract following oral and rectal administration in the mouse,
Journal of Controlled Release, 197 (2015) 48-57.
[36] S.K. Lai, D.E. O'Hanlon, S. Harrold, S.T. Man, Y.-Y. Wang, R. Cone, J. Hanes, Rapid transport of large polymeric
nanoparticles in fresh undiluted human mucus, Proceedings of the National Academy of Sciences, 104 (2007) 1482-1487.
[37] H.E. Lee, M.J. Lee, C.R. Park, A.Y. Kim, K.H. Chun, H.J. Hwang, D.H. Oh, S.O. Jeon, J.S. Kang, T.S. Jung, G.J. Choi, S. Lee,
Preparation and characterization of salmon calcitonin-sodium triphosphate ionic complex for oral delivery, Journal of
controlled release : official journal of the Controlled Release Society, 143 (2010) 251-257.
[38] S. Sun, N. Liang, H. Piao, H. Yamamoto, Y. Kawashima, F. Cui, Insulin-S.O (sodium oleate) complex-loaded PLGA
nanoparticles: formulation, characterization and in vivo evaluation, Journal of microencapsulation, 27 (2010) 471-478.
[39] M.J. Santander-Ortega, M. de la Fuente, M.V. Lozano, M.E. Bekheet, F. Progatzky, A. Elouzi, I.F. Uchegbu, A.G. Schatzlein,
Hydration forces as a tool for the optimization of core-shell nanoparticle vectors for cancer gene therapy, Soft Matter, 8 (2012)
12080-12092.
[40] N. Kamei, M. Morishita, Y. Kanayama, K. Hasegawa, M. Nishimura, E. Hayashinaka, Y. Wada, Y. Watanabe, K. Takayama,
Molecular imaging analysis of intestinal insulin absorption boosted by cell-penetrating peptides by using positron emission
tomography, Journal of controlled release : official journal of the Controlled Release Society, 146 (2010) 16-22.
[41] E. Jantratid, N. Janssen, C. Reppas, J.B. Dressman, Dissolution Media Simulating Conditions in the Proximal Human
Gastrointestinal Tract: An Update, Pharmaceutical Research, 25 (2008) 1663-1676.

36
[42] Z. Niu, E. Tedesco, F. Benetti, A. Mabondzo, I.M. Montagner, I. Marigo, D. Gonzalez-Touceda, S. Tovar, C. Diéguez, M.J.
Santander-Ortega, M.J. Alonso, Rational design of polyarginine nanocapsules intended to help peptides overcoming intestinal
barriers, Journal of Controlled Release, 263 (2017) 4-17.
[43] M.J. Santander-Ortega, M. Plaza-Oliver, V. Rodriguez-Robledo, L. Castro-Vazquez, N. Villaseca-Gonzalez, J.
Gonzalez-Fuentes, E.L. Cano, P. Marcos, M.V. Lozano, M.M. Arroyo-Jimenez, PEGylated Nanoemulsions for Oral Delivery: Role
of the Inner Core on the Final Fate of the Formulation, Langmuir, 33 (2017) 4269-4279.
[44] J. Suh, M. Dawson, J. Hanes, Real-time multiple-particle tracking: applications to drug and gene delivery, Adv Drug Deliv
Rev, 57 (2005) 63-78.
[45] E. Zagato, K. Forier, T. Martens, K. Neyts, J. Demeester, S. De Smedt, K. Remaut, K. Braeckmans, Single-particle tracking for
studying nanomaterial dynamics: applications and fundamentals in drug delivery, Nanomedicine, 9 (2014) 913-927.
[46] Y.Y. Wang, S.K. Lai, J.S. Suk, A. Pace, R. Cone, J. Hanes, Addressing the PEG mucoadhesivity paradox to engineer
nanoparticles that "slip" through the human mucus barrier, Angew Chem Int Ed Engl, 47 (2008) 9726-9729.
[47] T. Yu, Y.-Y. Wang, M. Yang, C. Schneider, W. Zhong, S. Pulicare, W.-J. Choi, O. Mert, J. Fu, S.K. Lai, J. Hanes, Biodegradable
mucus-penetrating nanoparticles composed of diblock copolymers of polyethylene glycol and poly(lactic-co-glycolic acid),
Drug Delivery and Translational Research, 2 (2012) 124-128.
[48] L. Inchaurraga, N. Martín-Arbella, V. Zabaleta, G. Quincoces, I. Peñuelas, J.M. Irache, In vivo study of the
mucus-permeating properties of PEG-coated nanoparticles following oral administration, European Journal of Pharmaceutics
and Biopharmaceutics, 97 (2015) 280-289.
[49] E.-S. Khafagy, N. Kamei, M. Takeda-Morishita, Cell-penetrating Peptide-biodrug Strategy for Oral and Nasal Delivery:
Review of Recent Findings, Journal of Experimental & Clinical Medicine, 4 (2012) 198-202.
[50] N. Kamei, M. Morishita, K. Takayama, Importance of intermolecular interaction on the improvement of intestinal
therapeutic peptide/protein absorption using cell-penetrating peptides, Journal of controlled release : official journal of the
Controlled Release Society, 136 (2009) 179-186.
[51] M.J. Santander-Ortega, M. de la Fuente, M.V. Lozano, M.L. Tsui, K. Bolton, I.F. Uchegbu, A.G. Schatzlein, Optimisation of
synthetic vector systems for cancer gene therapy - the role of the excess of cationic dendrimer under physiological conditions,
Current topics in medicinal chemistry, 14 (2014) 1172-1181.
[52] Z.-H. Zhang, Y.-L. Zhang, J.-P. Zhou, H.-X. Lv, Solid lipid nanoparticles modified with stearic acid-octaarginine for oral
administration of insulin, International Journal of Nanomedicine, 7 (2012) 3333-3339.
[53] U. Koppelhus, T. Shiraishi, V. Zachar, S. Pankratova, P.E. Nielsen, Improved Cellular Activity of Antisense Peptide Nucleic
Acids by Conjugation to a Cationic Peptide-Lipid (CatLip) Domain, Bioconjugate Chemistry, 19 (2008) 1526-1534.
[54] T. Shiraishi, P.E. Nielsen, Improved Cellular Uptake of Antisense Peptide Nucleic Acids by Conjugation to a Cell-Penetrating
Peptide and a Lipid Domain, in: S.S. Mark (Ed.) Bioconjugation Protocols: Strategies and Methods, Humana Press, Totowa, NJ,
2011, pp. 209-221.
[55] Y. Li, Y. Li, X. Wang, R.J. Lee, L. Teng, Fatty acid modified octa-arginine for delivery of siRNA, International journal of
pharmaceutics, 495 (2015) 527-535.
[56] L. Tonges, P. Lingor, R. Egle, G.P. Dietz, A. Fahr, M. Bahr, Stearylated octaarginine and artificial virus-like particles for
transfection of siRNA into primary rat neurons, RNA, 12 (2006) 1431-1438.
[57] M. Garcia-Fuentes, C. Prego, D. Torres, M.J. Alonso, A comparative study of the potential of solid triglyceride
nanostructures coated with chitosan or poly(ethylene glycol) as carriers for oral calcitonin delivery, European journal of
pharmaceutical sciences : official journal of the European Federation for Pharmaceutical Sciences, 25 (2005) 133-143.
[58] M.J. Santander-Ortega, N. Csaba, L. González, D. Bastos-González, J.L. Ortega-Vinuesa, M.J. Alonso, Protein-loaded PLGA–
PEO blend nanoparticles: encapsulation, release and degradation characteristics, Colloid and Polymer Science, 288 (2009)
141-150.
[59] B.R. Liu, S.-Y. Lo, C.-C. Liu, C.-L. Chyan, Y.-W. Huang, R.S. Aronstam, H.-J. Lee, Endocytic Trafficking of Nanoparticles
Delivered by Cell-penetrating Peptides Comprised of Nona-arginine and a Penetration Accelerating Sequence, PLOS ONE, 8
(2013) e67100.

37
[60] S. Lukasiewicz, K. Szczepanowicz, E. Blasiak, M. Dziedzicka-Wasylewska, Biocompatible Polymeric Nanoparticles as
Promising Candidates for Drug Delivery, Langmuir, 31 (2015) 6415-6425.
[61] Q. Xu, N.J. Boylan, S. Cai, B. Miao, H. Patel, J. Hanes, Scalable method to produce biodegradable nanoparticles that
rapidly penetrate human mucus, Journal of controlled release : official journal of the Controlled Release Society, 170 (2013)
279-286.
[62] D.R. Thakker, P.D. Ward, Compositions and methods for enhancing paracellular permeability across epithelial and
endothelial barriers, in, US Patent, 2010.
[63] K.I. Cumming, Z. Ramtoola, Solid oral dosage form containing an enhancer, in, US Patent, 2010.
[64] A.T. Florence, N. Hussain, Transcytosis of nanoparticle and dendrimer delivery systems: evolving vistas, Advanced Drug
Delivery Reviews, 50 (2001) S69-S89.
[65] F. Varga, Transit time changes with age in the gastrointestinal tract of the rat, Digestion, 14 (1976) 319-324.
[66] J.M. DeSesso, C.F. Jacobson, Anatomical and physiological parameters affecting gastrointestinal absorption in humans
and rats, Food and Chemical Toxicology, 39 (2001) 209-228.
[67] J.M. DeSesso, A.L. Williams, Contrasting the Gastrointestinal Tracts of Mammals: Factors that Influence Absorption, 43
(2008) 353-371.

38
Figure and table captions:
GRAPHICAL ABSTRACT
Figure 1. Flow diagram showing the process for the rational design of ENCPs.

39
Figure 2. (A) Association efficiency, (B) Z-potential, (C) particle size of non-coated C12-r8-insulin
(black squares), Chol-r8-insulin complexes (red circles) and r8-insulin controls (blue triangles) at r8:
insulin molar ratio from 1:1 to 8:1. Data are expressed as mean ± SD, n=3

40
Figure 3. (A) Peptide association efficiency, (B) Z-potential and (C) particle size of the non-enveloped
C12-r8-insulin NCPs and those ENCPs coated by branched and diblock PGA-PEG polymers with
different methods, data are expressed as mean ± SD, n >10 for diblock PGA-PEG ENCPs, and n = 3 for
the rest, and (D) TEM images of non-enveloped and diblock PGA-PEG enveloped C12-r8-insulin
ENCPs.
Figure 4. The evolution of particle size of the diblock PGA-PEG enveloped C12-r8-insulin (black square)
-
-
-
-
-
-
-

41
and Cholesterol-r8-insulin (red circle) ENCPs in FaSSIF-V2, respectively.
Figure 5. The proteolysis study of diblock PGA-PEG enveloped C12-r8-insulin ENCPs (black square)
and plain insulin solution (pink star) incubated in 1% (w/v) pancreatin (8 USP) supplemented SIF media.
Data are expressed as mean ± SD, n = 3.
Figure 6. Release profile of insulin from the non-enveloped C12-r8-insulin NCPs in SIF pH 6.8,
FaSSIF-V2 pH 6.5 and acetate buffer pH 4.0 up to 6 hours at 37 °C. Data are expressed as mean ± SD, n
= 6.

42
Figure 7. Calculated Dm/Dw coefficients and α parameter of the diblock PGA-PEG enveloped ENCPs in
porcine intestinal mucus at a time scale of 1 second (n 1000). Parameter α provides information about the
nature of the diffusion of the nanoparticle in the mucus; free diffusive (α~1); subdiffusive (α<0.9); immobile NPs
(α<0.2)).
Figure 8. Cell viability of the Caco-2 cell line after a 2 h incubation with: diblock PGA-PEG coated
C12-r8-insulin, C12-r8, and diblock copolymer (Mean ± S.D., n = 9).

43
Figure 9. TEER values of Caco-2 cell monolayers after a 2-h and 24-h exposure times to non-enveloped
NCPs and diblock PGA-PEG ENCPs at different concentrations: (A) 0.01 mg/mL, (B) 0.05 mg/mL and
(C) 0.2 mg/mL; and (D) Lucifer Yellow transport across Caco-2 cell monolayers after a-2 h exposure to
different concentrations of NCP and ENCPs. Data is expressed as mean ± SD, n = 3, changes are
considered statistically significant at p < 0.05.

44
45
Figure 10. (A) The Flow cytometry profile shows the fluorescence peaks corresponding to the Caco-2
cells that internalized the fluorescent ENCPs (0.2 mg/mL) after a 2-hr incubation time (peak to the right)
and the non-fluorescent control cells (peak to the left), n=9. (B) CLSM images (y-z, x-y and x-z sections)
of the cell membranes upon staining with Rhodamine-phalloidin (red color, F-actin) and DAPI (blue
color, cell nuclei). (C) CLSM images of the Caco-2 cells upon staining with Phalloidin-iFluor 594
Reagent - CytoPainter (red color, F-actin) Hoechst® 33342 (blue color, cell nuclei). The FITC-labeled
ENCPs are shown in green color (FITC).
Figure 11. (A) Cell uptake and (B) apical to basolateral transport of insulin across the Caco-2 cell
monolayer with 0.2 mg/mL of ENCPs, NCPs or a physical mixture of r8 and insulin at 37 °C after a 2 h
incubation. Data are expressed as mean ± SD, n = 3. Changes are considered statistically significant at p <
0.05.

46
Figure 12. SPECT-CT images following the oral biodistribution of (A) 99mTc-ENCPs and (B) the free
99mTc (control) at 1, 2, 4, 8, 11 and 26 hours. Biodistribution of (C) 99mTc-ENCP and (D) free 99mTc
(control) in Wistar rats with time. (s = stomach; i = intestine (duodenum, jejunum and ileum); c = cecum;
cl = colon; r = rectum; b = bladder)

47
Figure 13. Standardized hypoglycemic effect in healthy rats following oral administration of
insulin-loaded ENCPs or plain insulin in enteric capsule (50 IU/kg). Data represents the mean ± S.E., n=8.
Differences were considered statistically significant at *p < 0.05.
Table 1. Physicochemical properties, insulin association efficiency and final drug loading of
non-enveloped C12-r8-insulin / Chol-r8-insulin NCPs and those ENCPs enveloped by diblock or
branched PGA-PEG polymers using film hydration method. Data are expressed as mean ± SD, n >10 for
NCP and ENCP with C12-r8-insulin core, n = 3 for those with Chol-r8-insulin core.
NCP core ENCP shell Size (nm) PDI Z-pot
(mV)
AE
(%)
Loading
(%)
C12-r8-insulin
(r8: insulin 8:1)
Non-enveloped 176 ± 16 0.1 +20 ± 1 100 ± 0 33.3 ± 0
Branch PGA-PEG 220 ± 19 0.1 -44 ± 1 91 ± 6 18.2 ± 1.2
Diblock PGA-PEG 236 ± 27 0.1 +2 ± 2 99 ± 0 26.6 ± 0
Chol-r8-insulin
(r8:insulin 5:1)
Non-enveloped 171 ± 26 0.1 +29 ± 4 100 ± 0 40.8 ± 0
Branch PGA-PEG 202 ± 28 0.2 -43 ± 1 81 ± 4 18.2 ± 0.9
Diblock PGA-PEG 225 ± 10 0.2 +2 ± 3 92 ± 9 26.8 ± 2.6