Embed Size (px)
Citation preview
PEFA “LITE” Public Expenditure and Financial Accountability
Appraisal of the Financial Management
Performance on Uganda
31 March 2008
Office of the Auditor General Kampala-Uganda
Table of Contents Section 1. Introduction ................................................................................................... 1
1.1 Abbreviations and Acronyms ............................................................................... 1 1.2 Objectives of the appraisal ................................................................................... 2 1.3 Methodology ........................................................................................................ 3 1.4 Process of preparing the PEFA LITE ................................................................... 3
Section 2. Summary Assessment ................................................................................... 4
Section 3 Assessment of the PFM systems, processes and institutions ............................ 9 3.1 Budget Credibility ................................................................................................ 9 3.2 Comprehensiveness and Transparency .............................................................. 13
3.3 Policy-based Budgeting...................................................................................... 25 3.4 Predictability and control in budget execution ................................................... 30
3.5 Accounting, Recording and Reporting ............................................................... 44 3.6 External Scrutiny and Audit ............................................................................... 49
3.7 Donor Practices .................................................................................................. 54
Attachment 1: Performance Indication Summary ..................................................... 58
Attachment 2: Persons Consulted ........................................................................... 72
Attachment 3: Reference Documents ...................................................................... 73
Attachment 4 : Expenditures ................................................................................... 77
1
Section 1. Introduction
1.1 Abbreviations and Acronyms
GoU Government of Uganda HIPC Highly Indebted Poor Countries MDAs Ministries, Departments and Agencies MoFPED Ministry of Finance, Planning and Economic Development PEFA Public Expenditure and Financial Accountability PFAA Public Finance and Accountability Act SAI Supreme Audit Institutions URA Uganda Revenue Authority
2
1.2 Objectives of the appraisal
The Public Financial Management (PFM) performance measurement framework is an integrated monitoring framework that allows measurement of country PFM performance over time. The PEFA program was developed through concerted international effort. This performance measurement framework is a contribution to the collective efforts of many stakeholders to assess and develop essential PFM systems as part of the Strengthened Approach to supporting PFM reform. The Public Expenditure and Financial Accountability (PEFA) “Lite” analytical review of Uganda which has hereby been undertaken is a modification of certain aspects and procedures that would have been typically found in the PEFA PFM Performance measurement framework. The PEFA “Lite” has been prepared as an analytical tool to assist and contribute to the understanding of the PFM systems, processes and institutions of Uganda‟s central budgetary system. The emphasis therefore has been to use the set of high level indicators as a contribution to the audit planning process whereby an Auditor is required to obtain a reasonably detailed knowledge and understanding of the PFM environment he/she is auditing. The application of the “high level indicators” provide the Auditor with a broad picture (snap shot view) of the entire PFM environment and useful information which reflects those areas where weaknesses in the system may exist. The PEFA “Lite” analytical review has therefore scaled down, and in some instances deleted, rather than added procedures, to the traditional PFM performance framework. These calibrated high level indicators when lowly scored provide a useful guide of those areas of weaknesses in the PFM environment which the Auditor should focus on when generally considering as part of his overall risk assessment, the areas which pose a higher likelihood of a material misstatement being occasioned in the financial statements. When undertaking a regulatory or financial audit, the Auditor needs to ensure, in the planning process that those areas of higher risk of material misstatements occurring are suitably covered by an increased level of testing. The PEFA high level indicators will provide pointers where the Auditor should consider undertaking additional tests (analytical work). An open and orderly PFM system is a key ingredient in the implementation of government policies and the achievement of developmental objectives by supporting aggregate fiscal discipline, strategic allocation of resources and efficient service delivery i.e. attainment of the three levels of budgetary outcomes. The Performance Measurement Framework identifies the critical dimensions of performance of an open and orderly PFM system under six areas being:
(i) Credibility of the budget (ii) Comprehensiveness and transparency (iii) Policy based budgeting (iv) Predictability and control in budget execution (v) Accounting , recording and reporting (vi) External scrutiny and audit
3
The summary assessment in the next chapter has captured these critical dimensions.
1.3 Methodology
The overall assignment was undertaken by a team of Seven Staff of the Office of the Auditor General under the direct supervision of the Assistant Auditor General (AAG) and the Auditor General (AG).
The information gathered were ; those posted in the public domain (Print media, website, published reports, Pamphlets and Booklets), held by various government offices in files, other documents availed, high level interviews with responsible government officials, analysis and interpretation of the data collected.
1.4 Process of preparing the PEFA LITE
The process was undertaken over a period of five months from November 2007 to March 2008. The report covers the financial years of 2004/5; 2005/6 and 2006/7.
4
Section 2. Summary Assessment
Assessment of performance
i. Integrated assessment of PFM performance
1. Credibility of the budget For the three years under consideration (2005-2007), aggregate expenditure out-turn compared to original approved budget shows that in none of the last three years did actual expenditure deviate from budgeted expenditure by an amount greater than 10% in any of those years as per the Financial statement of the Accountant General, Auditor General‟s Report & Approved Government estimates; June 30, 2005-2007. While composition of expenditure out-turns compared to original approved budget indicated variance in percentage composition exceeded overall deviation in primary expenditure by 10 percentage points in no more than one of the last three years. In addition, the stock and monitoring of expenditure payment arrears showed the stocks of arrears exceed 10% of total expenditure. These scenarios cause concern on the credibility and practical implementation of the budget. More over, availability of data for monitoring the stock of expenditure payments reflect that data on stock of arrears is generated annually, but may not be complete for some identified expenditure categories or specified budget institutions for both Domestic and Foreign. The Domestic arrears which include pension arrears are subject to verification to establish their authenticity. Aggregate revenue out-turns compared to original approved budget showed actual domestic revenue collected was above budgeted domestic revenue estimates in all the last three years. However this should be seen in the context of the narrow tax base and inadequate estimation of the non tax revenues which are also not fully remitted to the consolidated fund.
2. Comprehensiveness and transparency
The annual budget and budget supporting documentation is comprehensive and allows a full picture of central government forecast whilst providing a generally transparent classification system for formulation, execution and reporting. The Ugandan public have access to this information which is made public and freely available on the Ministry of Finance website. This same degree and ease of obtaining other key government information is hampered by the fact that such information is not current and its usefulness therefore restricted. The in-year budget execution reports and financial statements whist being obtainable need to be requested for and may as a consequence be only feely available to government officials and certain stakeholders and not freely available to the public in general.
5
A small part of transfers from central government to sub-national governments is determined by clear transparent and rules based systems. The comprehensiveness of sub-national budgets are further undermined by untimely Information being issued to them by central government for budget since the information issued is late i.e. received after their Budgets have been finalized and if issued earlier the information is generally not reliable since the figures are not final till the budget is passed.
Oversight of aggregate fiscal risk from other public sector entities are significantly undermined since a good number of Autonomous Government Agencies (Statutory bodies) do not submit fiscal reports to central governments nor to the Auditor General for audit in a timely manner.
3 Policy-based budgeting
There is orderliness and participation in the annual budget process as evidenced by existence of and adherence to a fixed budget calendar which is clear, although some delays are often experienced in its implementation. The calendar allows Ministries Departments and Agencies reasonable time (at least four weeks from receipt of the budget circular) to enable them have ample time to complete their detailed estimates on time as per Budget Circular issued by MoFPED. There exist clarity/comprehensiveness and political involvement in the guidance on the preparation of budget submissions through the budget circular. The budget circular issued reflects ceilings approved by Cabinet prior to the Circular‟s distribution. The budgets are approved by the legislature after the start of the fiscal year. Whereas this is permissible within the law it compels the government in the interim operate on a “vote on account” which is not necessarily the most practical manner. This authority to operate the vote on account is set out in the Constitution under article 154 (4) which provides for the President to authorize money from the Consolidated Fund for meeting expenses up to 4 months into the fiscal year. Preparation of the multi-year fiscal forecasts and functional allocations shows forecasts of fiscal aggregates (on the basis of main categories of economic and functional/sector classification) are prepared for at least three years on a rolling annual basis. These have links between multi-year estimates and the subsequent settings of annual budget ceilings which are clear and differences are explained in the Annual budget circulars, Budget Speech and Background to the Budget. Debt sustainability analysis for external and domestic debt has been undertaken at least once during the last three years. There exist sector strategies with multi-year costing of recurrent and investment expenditure. These strategies exist for sectors representing at least 75% of primary expenditure with full costing of recurrent and investment expenditure. They are broadly consistent with fiscal forecasts as seen in the Public Sector Investment Plans, Sector Investment Strategic Plans and National Budget Performance Paper.
6
There are linkages between investment budgets and forward expenditure estimates. The majority of important investments are selected on the basis of relevant sector strategies and recurrent cost implications in accordance with sector allocations and included in forward budget estimates for the sector. Generally the budget prepared is effective and is policy based.
4 Predictability and control in budget execution
Generally, the budget is implemented in an orderly and predictable manner. There are also arrangements for the exercise of control and stewardship in the use of public funds.
The taxpayer obligations and liabilities are transparent and clear. There exists clear legislation and procedures for all major taxes with strict limited discretionary powers vested in the Minister of Finance. However, taxpayer access to information on tax liabilities and administrative procedures is mostly limited to those in the urban centres and some of the information provided by URA is not up-to-date.
The tax appeals mechanism is dogged with internal problems and these have undermined its effectiveness and credibility. It is currently not operating.
The taxpayer registration and tax assessment system is a stand alone system which needs to be linked to other registration systems in the country to enhance its credibility.
There exist penalties for non-compliance with registration and declaration obligations but there is need for firmer action to be taken to bring about better compliance.. The planning and monitoring of tax audit and fraud investigation programs are compromised by lack of audit programmes that are based on clear risk assessment criteria. The effectiveness in collection of tax payments is undermined by the absence of accurate information on arrears.
The transfer of tax collections to the Treasury by the revenue administration is effective and done weekly but is undermined by an absence of full accounts reconciliation between tax assessments, collections, arrears records and receipts by the Treasury.
Cash flow forecast are prepared for the whole fiscal year and updated and monitored at least quarterly on the basis of actual inflows and outflows. There is reliable periodic in-year information to MDAs on ceilings for expenditure commitment which is done by providing MDAs with information on commitment ceilings at least quarterly in advance.
Adjustments to budget allocations are done frequently and transparently. This information is decided at a level above management of MDAs. Although there are improvements, the quality of debt data recording and reporting is very poor with incompleteness and inaccuracies to a significant degree on domestic arrears especially regarding pensions and foreign bilateral debts.
7
Calculation and consolidation of government‟s cash balances takes place quarterly, but this leaves out some balances. Contracting of Central Government loans and issuance of guarantees require approval by Parliament. Whereas this is generally adhered to some instances were noted of the existence of loans which are obtained without evidence of going through those stipulated procedures. The integrity of the Gou payroll is undermined by the absence of an integration and reconciliation between personnel records and payroll data. This is exacerbated by the significant delays in processing changes to the payroll which may take longer than a year in the case of deletion of pensioners and six months for new recruits to access the payroll and between one to three months for changes to those in-service. The payroll integrity is further undermined by weak internal controls in effecting changes to the personnel records and payroll data. This scenario is further hampered by the absence of comprehensive payroll audits to assist in identifying control weaknesses and/ or ghost workers both at MDA and sub-national governments.
Expenditure commitment controls procedures exist though partially effective and lack comprehensiveness to cover all expenditures. There are a number of cases of violation. Even where rules exist, there are instances of lack of compliance which undermines its usefulness. The internal audit function operates in all the central government entities. Wheras some systems reviews are undertaken this is limited in scope and improvements are required to meet recognized professional standards. Their reports are issued regularly for most audited entities and distributed to the audited entity, and the Ministry of Finance. A report is not given to the Auditor General (SAI) unless if otherwise specifically requested for. Follow up on internal audit findings is generally undertaken by many department heads on major issues but often with some delays.
5. Accounting, recording and reporting Generally adequate records and information are produced, maintained and disseminated to meet decision-making control, management and reporting purposes as reflected below: Bank reconciliation are undertaken for most treasury managed bank accounts on a quarterly basis although it was noticed that some significant advance accounts remained unreconciled by the closure of the financial years. Information on resources received by service delivery units is also availed in respect of most common frontline service delivery units through quarterly and annual financial reports submitted by accounting officers to the Accountant General and line ministries. The classification of the data also allows direct comparison to the original budget which includes all items of budget estimates.
8
Units on IFMS system can generate reports instantly which satisfy the mandatory quarterly reporting requirement. . Whereas the quality of some of the information raises some concerns, it generally does not fundamentally undermine its basic usefulness. Consolidated government statements are submitted for external audit in a timely manner. The Financial Statements presented are generally consistent and have appropriate disclosure of accounting standards. 6. External scrutiny and audit
The audit undertaken covers over 90% of central government expenditures and autonomous government agencies. The Auditor General produces annual reports to parliament which highlight significant issues covering revenue, expenditure, assets and liabilities of Ministries, Agencies, Referral hospitals, Missions and projects.
The audit is carried out in accordance with International standards on auditing and Government of Uganda legislation. The audits undertaken are mostly financial and regulatory audits and special audits looking at specific expenditures in depth. Performance audits are also undertaken and it is expected that these should increase significantly in number during the coming years. Audit reports have been timely submitted to the legislature in the past although there was a slip up during the current year due to the absence of a substantial Auditor General. Although the formal response by accounting officers is also made in a timely manner there is little evidence of systematic follow up. Legislative scrutiny of external audit reports is significantly undermined by untimely examination of audit reports which take place more than 12 months to complete and worsened by backlogs. . The external scrutiny is further undermined by the slowness by the executive in implementing some of the recommendations. Donor practices The direct budget supports by donors are generally predictable and annual deviation of actual budget support from the forecast provided by donors did exceed more than 15% in one of the last three years. Disbursements are done based on Donor agreements which indicate annual releases not quarterly. The donor classifications are not consistent with the government budget classification and their reports do not necessarily provide a breakdown consistent with the government budget classification. Insufficient data was obtained to permit an accurate assessment of the extent to which aid funds are managed by use of the national procedures.
9
Section 3 Assessment of the PFM systems, processes and institutions
3.1 Budget Credibility
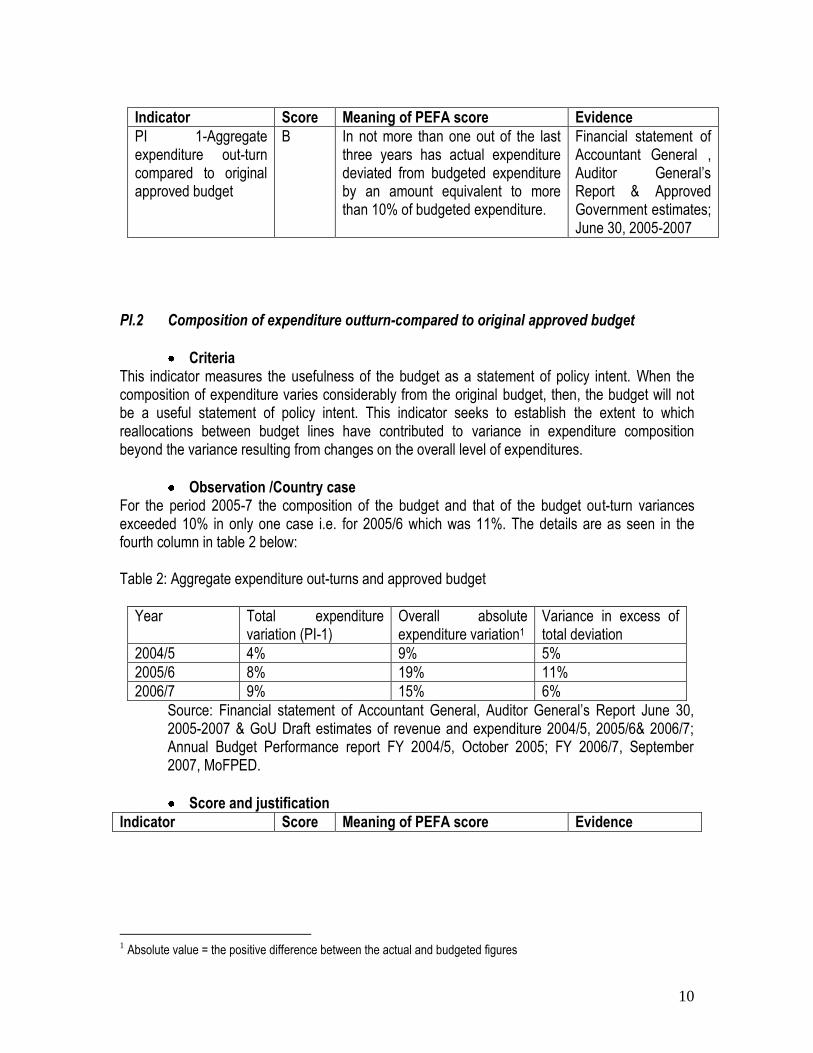
PI.1 Aggregate expenditure out-turn compared to original approved budget
Criteria This indicator assesses the governments‟ ability to implement the budgeted expenditure as an important factor in supporting the governments‟ ability to deliver required public services for the year expressed in policy statements. It uses the difference between actual primary expenditures and the original budgeted expenditures as a measure to establish governments‟ ability in the implementation of the budgeted expenditures. The expenditure used should exclude debt service payments and donor funded projects since government has little control over them.
Observation/Country case From the data availed for the periods 2004/5 to 2006/7 as extracted from Financial statement of Accountant General , Auditor General‟s Report & Approved Government estimates; the total expenditure outturn varied only by a maximum of 9% in the three years with the highest being in 2006/7 as reflected in the table 1 below: Table 1: Aggregate expenditure out-turns and approved budget
Year Total expenditure variation
2004/5 4%
2005/6 8%
2006/7 9%
Source: Financial statement of Accountant General, Auditor General June 30, 2005-2007 & GoU Draft estimates of revenue and expenditure 2004/5, 2005/6& 2006/7; Annual Budget Performance report FY 2004/5, October 2005; FY 2006/7, September 2007, MoFPED.
Score and justification
Indicator Score Meaning of PEFA score Evidence
10
Indicator Score Meaning of PEFA score Evidence
PI 1-Aggregate expenditure out-turn compared to original approved budget
B In not more than one out of the last three years has actual expenditure deviated from budgeted expenditure by an amount equivalent to more than 10% of budgeted expenditure.
Financial statement of Accountant General , Auditor General‟s Report & Approved Government estimates; June 30, 2005-2007
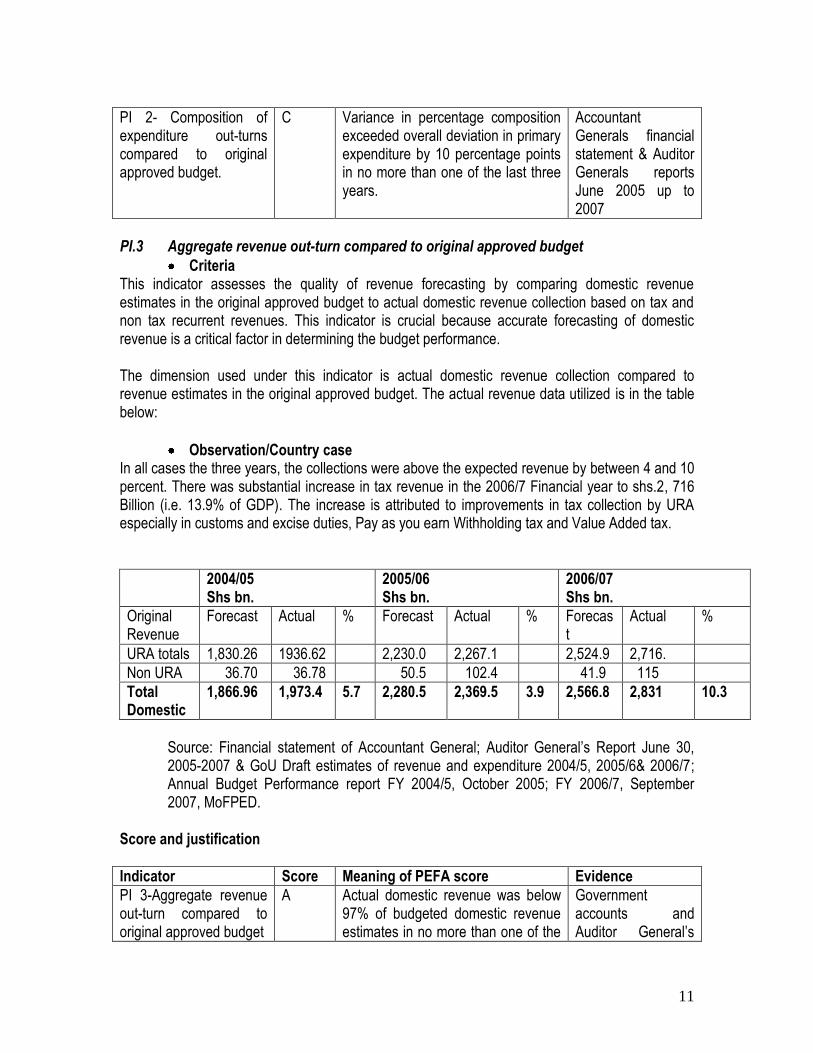
PI.2 Composition of expenditure outturn-compared to original approved budget
Criteria This indicator measures the usefulness of the budget as a statement of policy intent. When the composition of expenditure varies considerably from the original budget, then, the budget will not be a useful statement of policy intent. This indicator seeks to establish the extent to which reallocations between budget lines have contributed to variance in expenditure composition beyond the variance resulting from changes on the overall level of expenditures.
Observation /Country case For the period 2005-7 the composition of the budget and that of the budget out-turn variances exceeded 10% in only one case i.e. for 2005/6 which was 11%. The details are as seen in the fourth column in table 2 below: Table 2: Aggregate expenditure out-turns and approved budget
Year Total expenditure variation (PI-1)
Overall absolute expenditure variation1
Variance in excess of total deviation
2004/5 4% 9% 5%
2005/6 8% 19% 11%
2006/7 9% 15% 6%
Source: Financial statement of Accountant General, Auditor General‟s Report June 30, 2005-2007 & GoU Draft estimates of revenue and expenditure 2004/5, 2005/6& 2006/7; Annual Budget Performance report FY 2004/5, October 2005; FY 2006/7, September 2007, MoFPED.
Score and justification
Indicator Score Meaning of PEFA score Evidence
1 Absolute value = the positive difference between the actual and budgeted figures
11
PI 2- Composition of expenditure out-turns compared to original approved budget.
C Variance in percentage composition exceeded overall deviation in primary expenditure by 10 percentage points in no more than one of the last three years.
Accountant Generals financial statement & Auditor Generals reports June 2005 up to 2007
PI.3 Aggregate revenue out-turn compared to original approved budget
Criteria This indicator assesses the quality of revenue forecasting by comparing domestic revenue estimates in the original approved budget to actual domestic revenue collection based on tax and non tax recurrent revenues. This indicator is crucial because accurate forecasting of domestic revenue is a critical factor in determining the budget performance. The dimension used under this indicator is actual domestic revenue collection compared to revenue estimates in the original approved budget. The actual revenue data utilized is in the table below:
Observation/Country case In all cases the three years, the collections were above the expected revenue by between 4 and 10 percent. There was substantial increase in tax revenue in the 2006/7 Financial year to shs.2, 716 Billion (i.e. 13.9% of GDP). The increase is attributed to improvements in tax collection by URA especially in customs and excise duties, Pay as you earn Withholding tax and Value Added tax.
2004/05 Shs bn.
2005/06 Shs bn.
2006/07 Shs bn.
Original Revenue
Forecast Actual % Forecast Actual % Forecast
Actual %
URA totals 1,830.26 1936.62 2,230.0 2,267.1 2,524.9 2,716.
Non URA 36.70 36.78 50.5 102.4 41.9 115
Total Domestic
1,866.96 1,973.4 5.7 2,280.5 2,369.5 3.9 2,566.8 2,831 10.3
Source: Financial statement of Accountant General; Auditor General‟s Report June 30, 2005-2007 & GoU Draft estimates of revenue and expenditure 2004/5, 2005/6& 2006/7; Annual Budget Performance report FY 2004/5, October 2005; FY 2006/7, September 2007, MoFPED.
Score and justification
Indicator Score Meaning of PEFA score Evidence
PI 3-Aggregate revenue out-turn compared to original approved budget
A Actual domestic revenue was below 97% of budgeted domestic revenue estimates in no more than one of the
Government accounts and Auditor General‟s
12
Indicator Score Meaning of PEFA score Evidence
last three years. However in this case collections were all above the estimate.
report of 2004/5-06/07
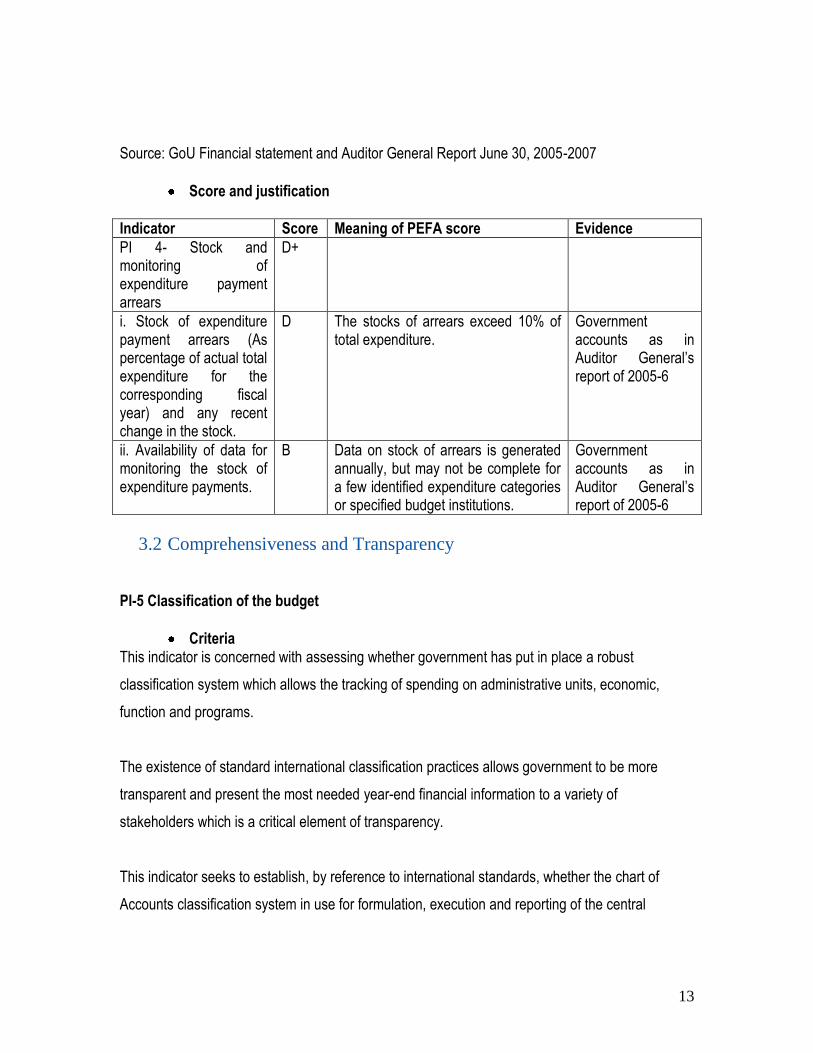
PI.4 Stock and monitoring of expenditure payment arrears
Criteria This indicator is concerned with measuring the extent to which there is a stock of arrears, and the extent to which the systemic problem is being brought under control and addressed. These arrears refer to expenditure obligations that have been incurred by government for which payment is overdue. Such payments could be to employees, suppliers, contractors or loan creditors. High levels of arrears often indicate a non transparent form of government financing in attempting to solve such problems as those that might be associated with inadequate budgeting for contracts or cash rationing. .
Observation/Country case The GoU records has no clear general indications as to when an unpaid claim become arrears but the obvious criteria is when it crosses to the next financial year. As for payroll, payment of arrears can result when salary is not paid within the month. But if paid within the year, it is not treated as arrears in the financial records. Below is the data for stock of arrears which are compiled annually. As can be seen, the arrears (Only Payables, Pension arrears and interests payable on treasury bills and bonds) are over 10% of the annual expenditures as seen in the table below It should be noted that arrears reduced significantly in 2006/7 partly because Uganda is one of the beneficiaries of the HIPC and MDRI debt relief. These arrears figures relates to central Government only. The situation at other semi-autonomous entities like Universities and tertiary institutions and local governments is not very clear. Although efforts are made annually to compile the stock of arrears especially at various Ministries, Departments and Agencies, it is still possible to have some information retained at those levels thus making the reported arrears figures incomplete. Analysis of GOU Public expenditure 30th June 2007 30th June 2006 30th June 2005
Total Expenditure 3,557,565,318,185 3,171,346,223,999 2,918,155,516,710
Domestic
Payables 224,153,055,757 279,099,230,293 266,546,109,048
Pension arrears 213,460,806,171 238,047,977,713 205,911,845,683
Interest- Treasury bills 20,680,498,700 30,105,125,265 25,914,789,725
Interest-Bonds 24,255,722,125 85,707,596,332 31,907,644,625
Net expenditure payment arrears
482,550,082,753 632,959,929,603 530,280,389,081
13.56% 19.96% 18.17%
13
Source: GoU Financial statement and Auditor General Report June 30, 2005-2007
Score and justification
Indicator Score Meaning of PEFA score Evidence
PI 4- Stock and monitoring of expenditure payment arrears
D+
i. Stock of expenditure payment arrears (As percentage of actual total expenditure for the corresponding fiscal year) and any recent change in the stock.
D The stocks of arrears exceed 10% of total expenditure.
Government accounts as in Auditor General‟s report of 2005-6
ii. Availability of data for monitoring the stock of expenditure payments.
B Data on stock of arrears is generated annually, but may not be complete for a few identified expenditure categories or specified budget institutions.
Government accounts as in Auditor General‟s report of 2005-6
3.2 Comprehensiveness and Transparency
PI-5 Classification of the budget
Criteria This indicator is concerned with assessing whether government has put in place a robust
classification system which allows the tracking of spending on administrative units, economic,
function and programs.
The existence of standard international classification practices allows government to be more
transparent and present the most needed year-end financial information to a variety of
stakeholders which is a critical element of transparency.
This indicator seeks to establish, by reference to international standards, whether the chart of
Accounts classification system in use for formulation, execution and reporting of the central
14
government‟s budgets can allow clear tracking of spending at the various levels of administrative
units, economic, function and programs by users of financial information.
Observation/Country case Government of Uganda is continuously upgrading its classification of Government Finance
Statistics (GFS) system to be in harmony with other macro-economic statistical systems. This is
being done to ensure that data from the GFS system can be combined with data from other
systems to assess general government or public sector developments in relation to the rest of the
economy. The latest changes being in July 2007 and October 2007.
However, classification of statutory authorities and state enterprises do not follow the GFS
guidelines. This is because they are independent of the mainstream budget. Matching to the
classification Functions of Government (COFOG) have also been provided through the IFMS
reporting capabilities.
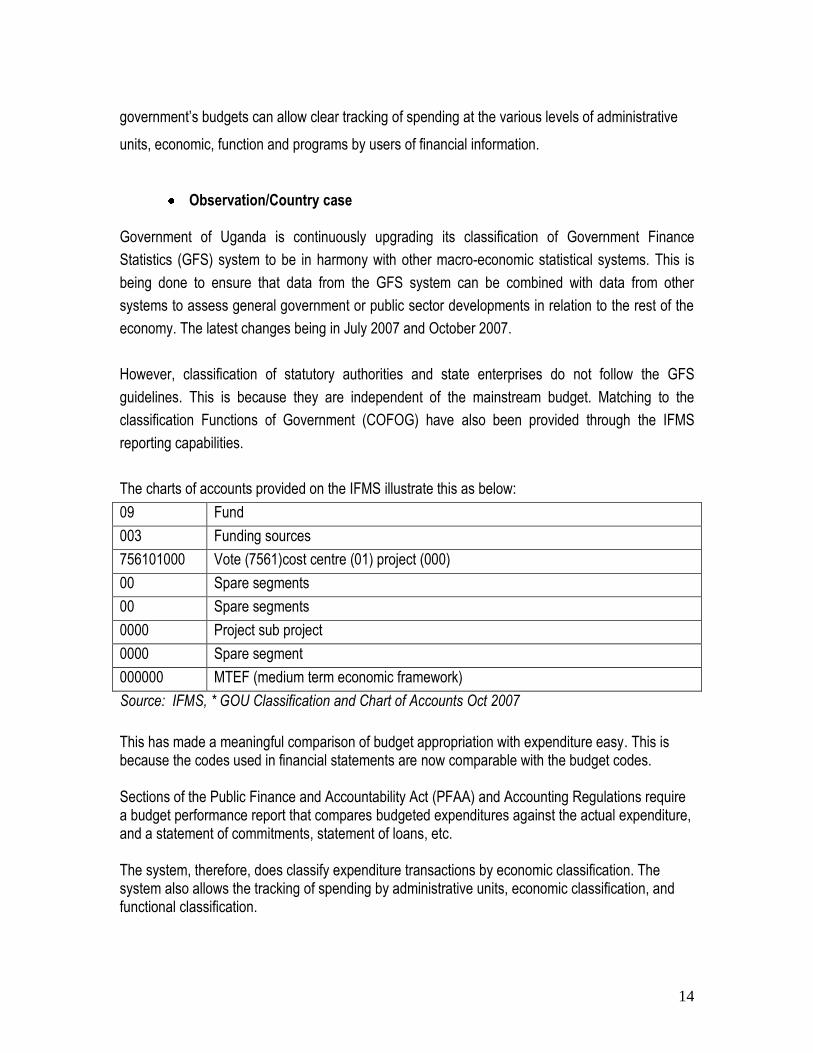
The charts of accounts provided on the IFMS illustrate this as below:
09 Fund
003 Funding sources
756101000 Vote (7561)cost centre (01) project (000)
00 Spare segments
00 Spare segments
0000 Project sub project
0000 Spare segment
000000 MTEF (medium term economic framework)
Source: IFMS, * GOU Classification and Chart of Accounts Oct 2007
This has made a meaningful comparison of budget appropriation with expenditure easy. This is because the codes used in financial statements are now comparable with the budget codes. Sections of the Public Finance and Accountability Act (PFAA) and Accounting Regulations require a budget performance report that compares budgeted expenditures against the actual expenditure, and a statement of commitments, statement of loans, etc. The system, therefore, does classify expenditure transactions by economic classification. The system also allows the tracking of spending by administrative units, economic classification, and functional classification.
15
Score and justification
Indicator Score Meaning of PEFA score Evidence
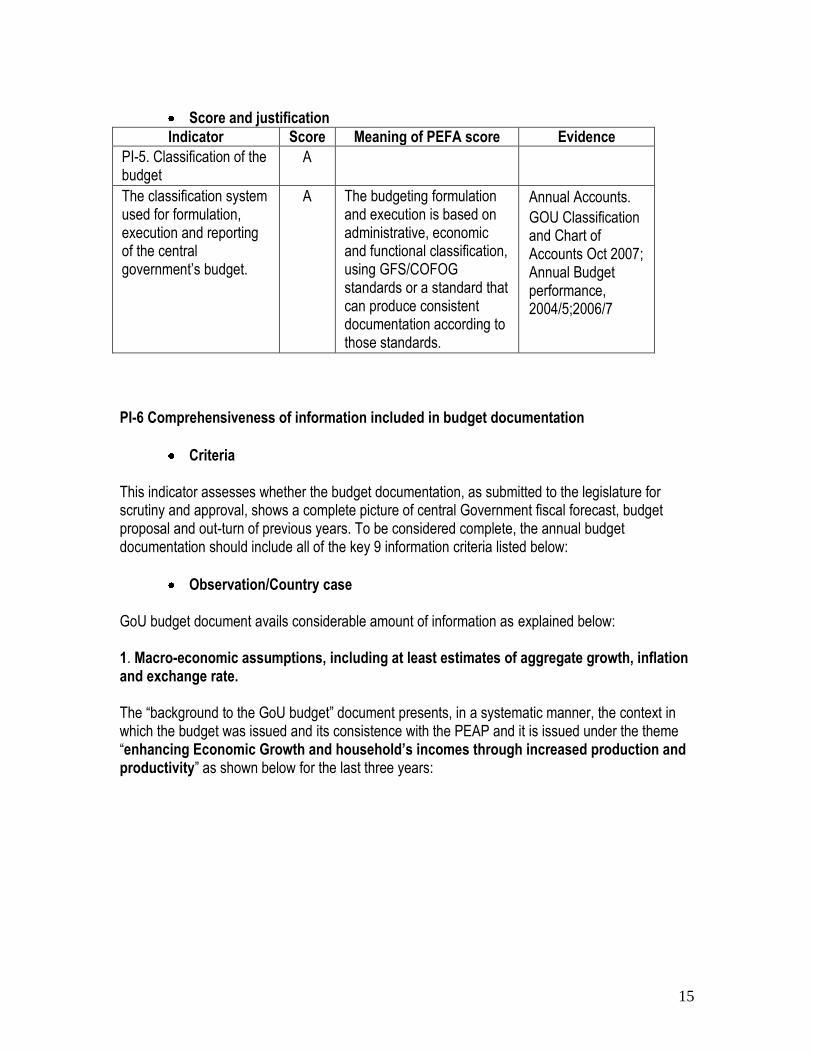
PI-5. Classification of the budget
A
The classification system used for formulation, execution and reporting of the central government‟s budget.
A The budgeting formulation and execution is based on administrative, economic and functional classification, using GFS/COFOG standards or a standard that can produce consistent documentation according to those standards.
Annual Accounts.
GOU Classification and Chart of Accounts Oct 2007; Annual Budget performance, 2004/5;2006/7
PI-6 Comprehensiveness of information included in budget documentation
Criteria This indicator assesses whether the budget documentation, as submitted to the legislature for scrutiny and approval, shows a complete picture of central Government fiscal forecast, budget proposal and out-turn of previous years. To be considered complete, the annual budget documentation should include all of the key 9 information criteria listed below:
Observation/Country case GoU budget document avails considerable amount of information as explained below: 1. Macro-economic assumptions, including at least estimates of aggregate growth, inflation and exchange rate. The “background to the GoU budget” document presents, in a systematic manner, the context in which the budget was issued and its consistence with the PEAP and it is issued under the theme “enhancing Economic Growth and household’s incomes through increased production and productivity” as shown below for the last three years:
16
Economic assumptions
2004/5 2005/6 2006/7 Regional
Inflation rates - 5.4%(average) 5% (projected) 11%
GDP 6.4% 5.1% 6.5% 6.75%
Real Growth rates 6.6% 5.3% 7%(target) 6.7%
Exchange rates *Depreciation of shillings against the dollar by 4.8% (Jun06-march 2007)
Source: Background to the Budget document and the budget framework paper for Financial Year 2006/07 June 2006-By Ministry of Finance and Economic Development. 2. Fiscal deficit, defined according to GFS or other internationally recognized standard. The fiscal deficit was defined (for this purpose only) as the difference between the anticipated revenue collections and the anticipated total expenditures. The GoU deficits for the year under review in billions for two years were:
2005/6 outturn Estimated 2006/7
Over all deficits (including grants) -351.5 -562.9
Overall deficit (excluding grants) -1456.2 -1681.8
Source: Table I Medium term framework 2005/6-2008/9-MoFPED This definition is not necessarily in strict conformity with the GFS definition 3. Deficit financing, describing anticipated composition. As indicated in the Background to the Budget by Ministry of Finance, Planning and Economic Development for Financial Year 2006/07, the deficit financing is expected to fall by 1.8% reductions in its fiscal deficit over the medium term. The Budget speech of 2006/7 highlighted that; approximately 59% of the budget was to be financed by the Domestic revenues and 41% by Donor partners. Below is the deficit financing describing the anticipated composition:
Deficit financing Outturn 2005/6 billions Projection of 2006/7 billions
External Financing (net)
Budget support loans 99..3 260.4
Project loans 566.1 482.2
Amortization -151..3 -171.1
Arrears 0 -3.7
Exceptional Financing -41.8 -44.9
Domestic financing
Bank financing -262.1 0
Non Bank Financing 141.3 40
Source: Table I Medium term framework 2005/6-2008/9-MoFPED
17
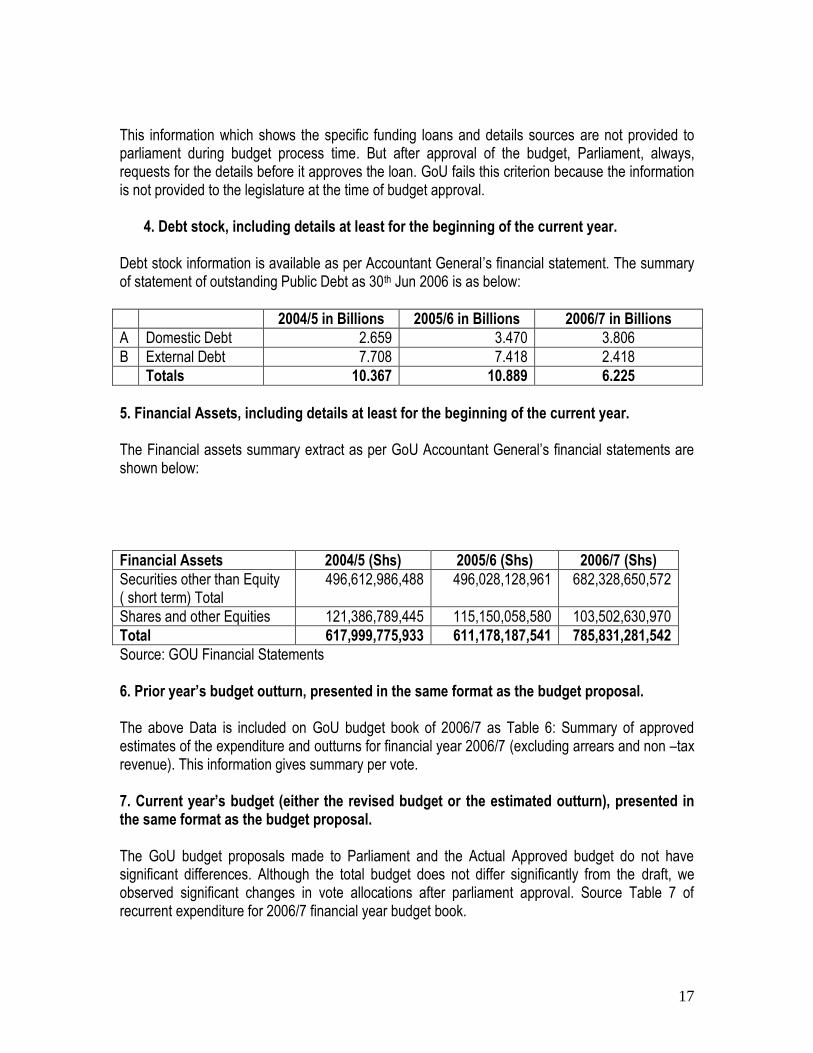
This information which shows the specific funding loans and details sources are not provided to parliament during budget process time. But after approval of the budget, Parliament, always, requests for the details before it approves the loan. GoU fails this criterion because the information is not provided to the legislature at the time of budget approval. 4. Debt stock, including details at least for the beginning of the current year. Debt stock information is available as per Accountant General‟s financial statement. The summary of statement of outstanding Public Debt as 30th Jun 2006 is as below:
2004/5 in Billions 2005/6 in Billions 2006/7 in Billions
A Domestic Debt 2.659 3.470 3.806
B External Debt 7.708 7.418 2.418
Totals 10.367 10.889 6.225
5. Financial Assets, including details at least for the beginning of the current year. The Financial assets summary extract as per GoU Accountant General‟s financial statements are shown below:
Financial Assets 2004/5 (Shs) 2005/6 (Shs) 2006/7 (Shs)
Securities other than Equity ( short term) Total
496,612,986,488 496,028,128,961 682,328,650,572
Shares and other Equities 121,386,789,445 115,150,058,580 103,502,630,970
Total 617,999,775,933 611,178,187,541 785,831,281,542
Source: GOU Financial Statements 6. Prior year’s budget outturn, presented in the same format as the budget proposal. The above Data is included on GoU budget book of 2006/7 as Table 6: Summary of approved estimates of the expenditure and outturns for financial year 2006/7 (excluding arrears and non –tax revenue). This information gives summary per vote. 7. Current year’s budget (either the revised budget or the estimated outturn), presented in the same format as the budget proposal. The GoU budget proposals made to Parliament and the Actual Approved budget do not have significant differences. Although the total budget does not differ significantly from the draft, we observed significant changes in vote allocations after parliament approval. Source Table 7 of recurrent expenditure for 2006/7 financial year budget book.
18
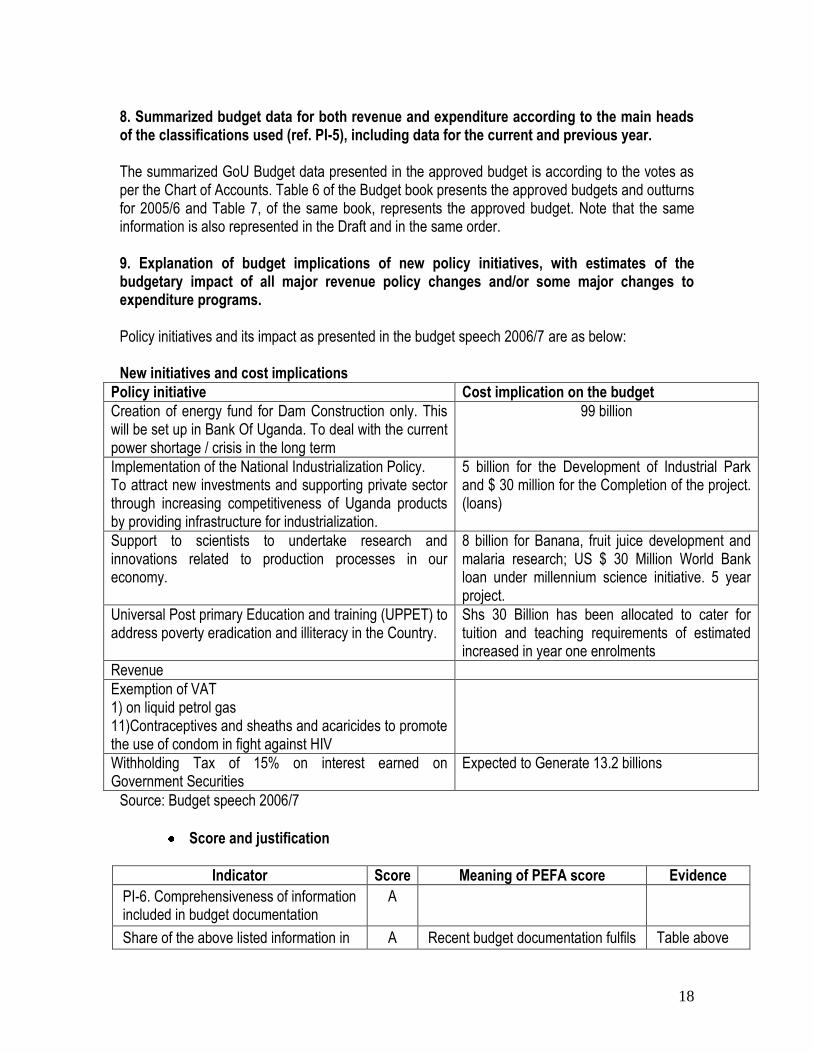
8. Summarized budget data for both revenue and expenditure according to the main heads of the classifications used (ref. PI-5), including data for the current and previous year. The summarized GoU Budget data presented in the approved budget is according to the votes as per the Chart of Accounts. Table 6 of the Budget book presents the approved budgets and outturns for 2005/6 and Table 7, of the same book, represents the approved budget. Note that the same information is also represented in the Draft and in the same order. 9. Explanation of budget implications of new policy initiatives, with estimates of the budgetary impact of all major revenue policy changes and/or some major changes to expenditure programs. Policy initiatives and its impact as presented in the budget speech 2006/7 are as below: New initiatives and cost implications
Policy initiative Cost implication on the budget
Creation of energy fund for Dam Construction only. This will be set up in Bank Of Uganda. To deal with the current power shortage / crisis in the long term
99 billion
Implementation of the National Industrialization Policy. To attract new investments and supporting private sector through increasing competitiveness of Uganda products by providing infrastructure for industrialization.
5 billion for the Development of Industrial Park and $ 30 million for the Completion of the project. (loans)
Support to scientists to undertake research and innovations related to production processes in our economy.
8 billion for Banana, fruit juice development and malaria research; US $ 30 Million World Bank loan under millennium science initiative. 5 year project.
Universal Post primary Education and training (UPPET) to address poverty eradication and illiteracy in the Country.
Shs 30 Billion has been allocated to cater for tuition and teaching requirements of estimated increased in year one enrolments
Revenue
Exemption of VAT 1) on liquid petrol gas 11)Contraceptives and sheaths and acaricides to promote the use of condom in fight against HIV
Withholding Tax of 15% on interest earned on Government Securities
Expected to Generate 13.2 billions
Source: Budget speech 2006/7
Score and justification
Indicator Score Meaning of PEFA score Evidence
PI-6. Comprehensiveness of information included in budget documentation
A
Share of the above listed information in A Recent budget documentation fulfils Table above
19
Indicator Score Meaning of PEFA score Evidence
the budget documentation most recently issued by the central government
7-9 of the 9 information benchmarks.
PI-7 Extent of unreported government operations
Criteria This indicator assesses the elements of government operations which affect the efficient allocation of resources as reflected by unreported government operations. The extent of unreported government operations is assessed against unreported extra-budgetary expenditure, and income /expenditure information on donor-funded projects which is included in fiscal reports.
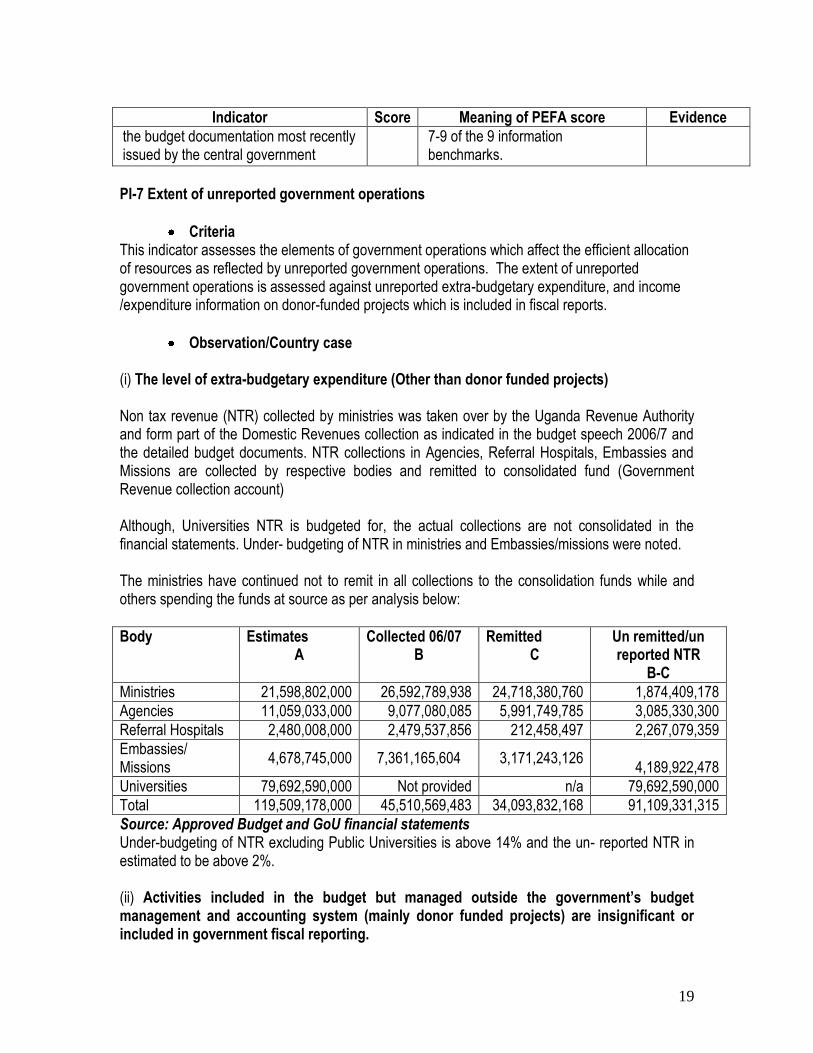
Observation/Country case (i) The level of extra-budgetary expenditure (Other than donor funded projects) Non tax revenue (NTR) collected by ministries was taken over by the Uganda Revenue Authority and form part of the Domestic Revenues collection as indicated in the budget speech 2006/7 and the detailed budget documents. NTR collections in Agencies, Referral Hospitals, Embassies and Missions are collected by respective bodies and remitted to consolidated fund (Government Revenue collection account) Although, Universities NTR is budgeted for, the actual collections are not consolidated in the financial statements. Under- budgeting of NTR in ministries and Embassies/missions were noted. The ministries have continued not to remit in all collections to the consolidation funds while and others spending the funds at source as per analysis below:
Body Estimates A
Collected 06/07 B
Remitted C
Un remitted/un reported NTR
B-C
Ministries 21,598,802,000 26,592,789,938 24,718,380,760 1,874,409,178
Agencies 11,059,033,000 9,077,080,085 5,991,749,785 3,085,330,300
Referral Hospitals 2,480,008,000 2,479,537,856 212,458,497 2,267,079,359
Embassies/ Missions
4,678,745,000 7,361,165,604 3,171,243,126 4,189,922,478
Universities 79,692,590,000 Not provided n/a 79,692,590,000
Total 119,509,178,000 45,510,569,483 34,093,832,168 91,109,331,315
Source: Approved Budget and GoU financial statements Under-budgeting of NTR excluding Public Universities is above 14% and the un- reported NTR in estimated to be above 2%. (ii) Activities included in the budget but managed outside the government’s budget management and accounting system (mainly donor funded projects) are insignificant or included in government fiscal reporting.
20
For financial year 2006/7, the budget support was shs. 664,263,100,081= of which project support was shs.122, 076,008,689=. This represents 84.48% of grants that are managed through the national procedures and are included in fiscal reports. However, there is no clear policy on consolidation of project financial statements.
Score and justification
Indicator Score Meaning of PEFA score Evidence
PI-7 Extent of unreported government operations
B+
(i) The level of extra-budgetary expenditure (other than donor funded projects) which is unreported i.e. not included in fiscal reports.
A The level of unreported extra-budgetary expenditure (other than donor funded projects) constitutes 1-5% of total expenditure.
Extract of budget performance table
(ii) Income/expenditure information on donor-funded projects which is included in fiscal reports
B Complete income/expenditure information is included in fiscal reports for all loan financed projects and at least 50% (by value) of grant financed projects.
Accountant General‟s Disbursement report 2006/7
PI.8 Transparency of inter-Governmental Fiscal relations
Criteria This indicator assesses: The transparency and rules based systems in the horizontal allocation among Sub-National (SN) governments of unconditional and conditional transfers from central government; Timeliness of reliable information to SN governments on their allocations from central government for the coming year; and the extent to which consolidated fiscal data (at least on revenue and expenditure) is collected and reported for general government according to sectoral categories.
Observation/Country case (i) Transparent and rules based systems in the horizontal allocation among Sub-
National(SN) governments of unconditional and conditional transfers from central government (both budgeted and actual allocations);
Although the Local government Commission formulated the Draft criteria in 2004 on allocation criteria, it has never been forwarded to Cabinet for approval. The Ministry of Local Government has not submitted the proposal. This proposal was funded by DANIDA in 2002.

21
The current grant allocation criterion tends to be in line with the PEAP to a greater extent. However there is insufficient/ absence of information on Local Governments. The funds allocated are determined each year for Local Governments Grants by a year on year basis guided by the Local Government Long term View of its Poverty alleviation strategy and sector Medium term Expenditure Frame work (MTEF) The major problem inherent in the effective allocation of Grants is the absence of District level poverty data aggregated for rural and local Governments for equitable allocation of resources. (ii) Timeliness of reliable information to SN governments on their allocations from central government for the coming year;
The Local Governments receive Indicative Planning Figures (IPF) at an early stage; they are not reliable until the national budget is read. The Government transfers are generally predictable as they generally benefit from “release protection” under the Poverty Action arrangements and the Constitution for the un-conditional grant. The releases for Poverty action Funds are done monthly and approved quarterly subject for submission of accountability of the previous quarter. Un-conditional grants are released unconditionally. However, the Graduated tax compensation releases have not been predictable and reliable. (iii) Extent to which consolidated fiscal data (at least on revenue and expenditure) is collected and reported for general government according to sectoral categories.
The Local Governments both, the Districts and Urban councils produce Financial statements and they are Audited (at least 50% by number within the statutory time frame) but are not consolidated into the national financial statements. They generate their incomes and appropriate through their own budget proposals to their Councils.
Score and justification
Indicator Score Meaning of PEFA score Evidence
PI.8 Transparency of inter-Governmental Fiscal relations
D+
(i) Transparency and objectivity in the horizontal allocation among SN governments
C The horizontal allocation of only a small part of transfers from central government (10-50%) is determined by transparent and rules based systems.
Draft report on fiscal decentralization strategy 2 on allocation principals & development of allocation formula for grants of December 2004 by Local Government finance commission.
22
Indicator Score Meaning of PEFA score Evidence
(ii) Timeliness of reliable information to SN governments on their allocations
D Reliable estimates on transfers are issued after sub-National Government Budgets have been finalized, or earlier issued estimates are not reliable.
IPF and Budget framework
(iii) Extent of consolidation of fiscal data for general government according to sectoral categories
D Fiscal information that is consistent with central government fiscal reporting is collected and consolidated for less than 60% (by value) of SN government expenditure OR if a higher proportion is covered, consolidation into annual reports takes place with more than 24 months delay, if at all.
Government of Uganda financial statement 2005/6
PI-9 Oversight of aggregate fiscal risk from other public sector entities
Criteria This indicator reflects the extent to which central government monitors fiscal position of autonomous government agencies and public enterprises and extent of central government monitoring of Sub National (Local Government councils i.e. Districts and Urban Councils) governments‟ fiscal position. (i) Extend of central Government monitoring of Autonomous Government Agencies (AGA) s and PEs A number of organizations (e.g. 5) have either failed to produce financial statements for Audit by the Auditor General and others (at least 23) have un- submitted backlog of financial statements. See details below:
Entity/ Organization Last Audited Report
1 Public libraries Board 30th June 1998
2 National Theatre 30th June 2001
3 Uganda Women Council 30th June 2001
4 Allied Health Professionals 30th June 2003
5 National Youth Council 30th June 2003
6 Uganda National Council of sports 30th June 2003
7 Uganda National Examinations Board 30th June 2003
8 Uganda Nurses and Midwifes Council 30th June 2003
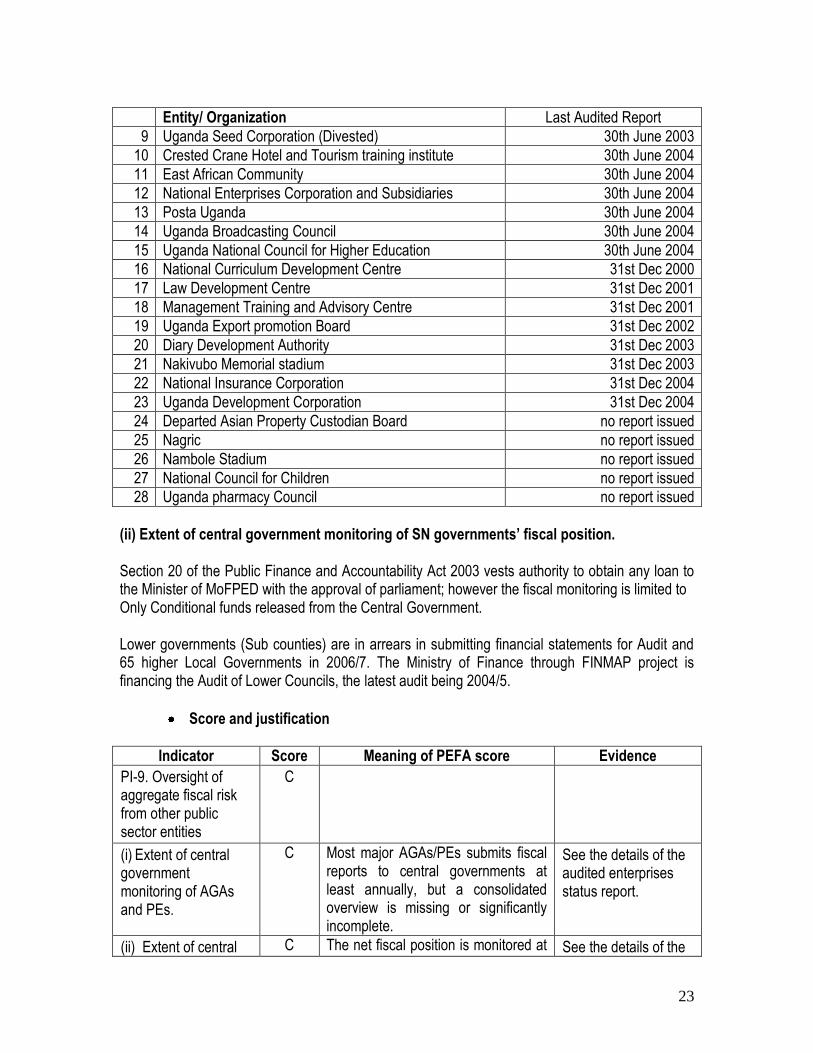
23
Entity/ Organization Last Audited Report
9 Uganda Seed Corporation (Divested) 30th June 2003
10 Crested Crane Hotel and Tourism training institute 30th June 2004
11 East African Community 30th June 2004
12 National Enterprises Corporation and Subsidiaries 30th June 2004
13 Posta Uganda 30th June 2004
14 Uganda Broadcasting Council 30th June 2004
15 Uganda National Council for Higher Education 30th June 2004
16 National Curriculum Development Centre 31st Dec 2000
17 Law Development Centre 31st Dec 2001
18 Management Training and Advisory Centre 31st Dec 2001
19 Uganda Export promotion Board 31st Dec 2002
20 Diary Development Authority 31st Dec 2003
21 Nakivubo Memorial stadium 31st Dec 2003
22 National Insurance Corporation 31st Dec 2004
23 Uganda Development Corporation 31st Dec 2004
24 Departed Asian Property Custodian Board no report issued
25 Nagric no report issued
26 Nambole Stadium no report issued
27 National Council for Children no report issued
28 Uganda pharmacy Council no report issued
(ii) Extent of central government monitoring of SN governments’ fiscal position. Section 20 of the Public Finance and Accountability Act 2003 vests authority to obtain any loan to the Minister of MoFPED with the approval of parliament; however the fiscal monitoring is limited to Only Conditional funds released from the Central Government. Lower governments (Sub counties) are in arrears in submitting financial statements for Audit and 65 higher Local Governments in 2006/7. The Ministry of Finance through FINMAP project is financing the Audit of Lower Councils, the latest audit being 2004/5.
Score and justification
Indicator Score Meaning of PEFA score Evidence
PI-9. Oversight of aggregate fiscal risk from other public sector entities
C
(i) Extent of central government monitoring of AGAs and PEs.
C Most major AGAs/PEs submits fiscal reports to central governments at least annually, but a consolidated overview is missing or significantly incomplete.
See the details of the audited enterprises status report.
(ii) Extent of central C The net fiscal position is monitored at See the details of the
24
Indicator Score Meaning of PEFA score Evidence
government monitoring of SN governments‟ fiscal position
least annually for the most important level of SN government, but a consolidated overview is missing or significantly incomplete
audited enterprises status report
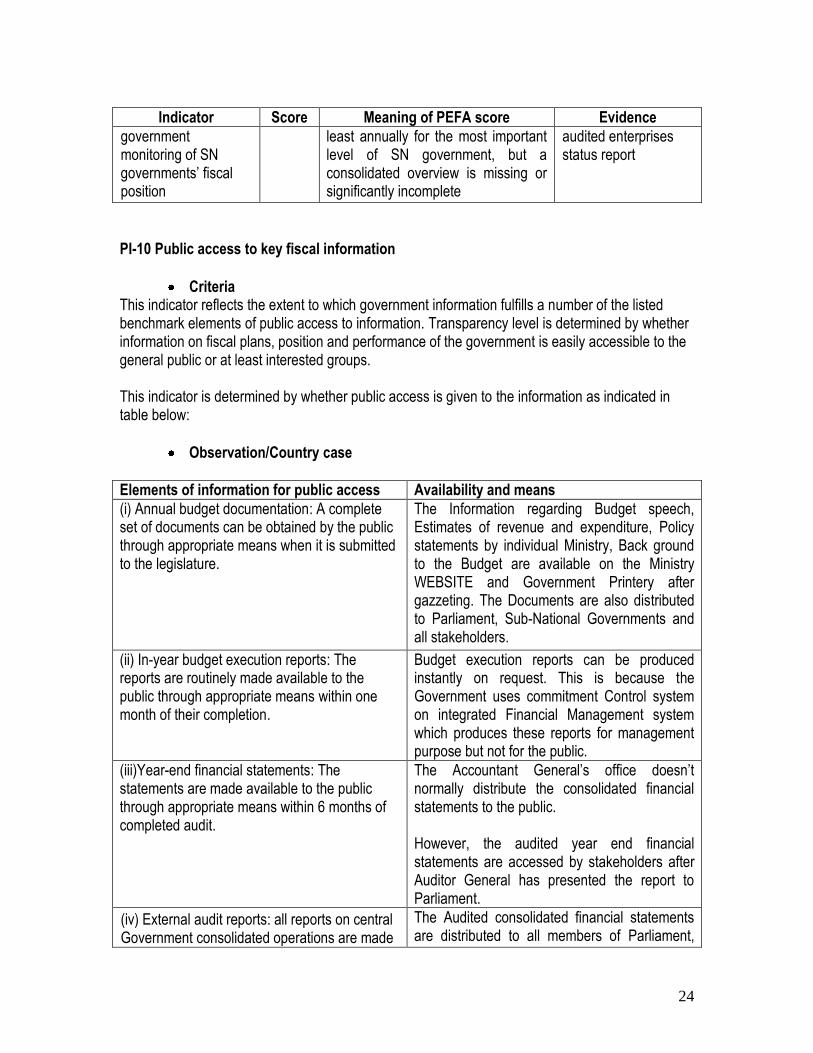
PI-10 Public access to key fiscal information
Criteria This indicator reflects the extent to which government information fulfills a number of the listed benchmark elements of public access to information. Transparency level is determined by whether information on fiscal plans, position and performance of the government is easily accessible to the general public or at least interested groups. This indicator is determined by whether public access is given to the information as indicated in table below:
Observation/Country case
Elements of information for public access Availability and means
(i) Annual budget documentation: A complete set of documents can be obtained by the public through appropriate means when it is submitted to the legislature.
The Information regarding Budget speech, Estimates of revenue and expenditure, Policy statements by individual Ministry, Back ground to the Budget are available on the Ministry WEBSITE and Government Printery after gazzeting. The Documents are also distributed to Parliament, Sub-National Governments and all stakeholders.
(ii) In-year budget execution reports: The reports are routinely made available to the public through appropriate means within one month of their completion.
Budget execution reports can be produced instantly on request. This is because the Government uses commitment Control system on integrated Financial Management system which produces these reports for management purpose but not for the public.
(iii)Year-end financial statements: The statements are made available to the public through appropriate means within 6 months of completed audit.
The Accountant General‟s office doesn‟t normally distribute the consolidated financial statements to the public. However, the audited year end financial statements are accessed by stakeholders after Auditor General has presented the report to Parliament.
(iv) External audit reports: all reports on central Government consolidated operations are made
The Audited consolidated financial statements are distributed to all members of Parliament,
25
Elements of information for public access Availability and means
available to the public through appropriate means within 6 months of completed audit.
and other key stake holders. The Public is informed through the press on the contentious issues during parliament discussion. However it should be noted that the Parliament does not discuss these reports in time.
(v) Contract awards: awards of all contracts with value approximately USD 100,000 equiv. is published at least quarterly through appropriate means.
Procurements reports are prepared monthly by the procuring entities and a copy submitted to the PPDA. PPDA Publishes the reports quarterly and annually. After publication of the reports, they are supposed to be posted on their website www.ppda.go.ug.
However by March 2008 only reports for 2004/5 were posted.
(vi) Resources available to primary service units: Information is publicized through appropriate means, at least annually, or available upon request, for primary service units with national coverage in at least two sectors (such as elementary schools or primary health clinics).
The Budget book gives details of the resource envelope to National Sub Governments and this information is on the Website of the Ministry of Finance; however Budget information is not Published in print Media. Additionally, all monthly releases are publicized monthly in print media detailing every budget component released to the District. The releases are also posted at all Service delivery units notice boards.
Score and justification
Indicator Score Meaning of PEFA score Evidence
PI-10. Public Access to key fiscal information
C
i) Number of the above listed elements of public access to information that is fulfilled (in order to count in the assessment, the full specification of the information benchmark must be met
C The government makes available to the public 1-2 of the 6 listed types of information
From MFOP, PPDA,
3.3 Policy-based Budgeting
26
PI.11 Orderliness and participation in the annual budget process
Criteria This indicator reflects the organization, clarity and comprehensiveness of the annual budget
process as well as participation of ministries, departments and agencies (MDA). It is assessed
against existence of and adherence to a fixed budget calendar, political involvement in the
guidance on the preparation of budget submissions and timely budget approval by the legislature.
While the Ministry of Finance, Planning and Economic Development is the driver of the annual
budget formulation process, effective participation in the budget formulation process by other
MDAs as well as political leadership, impacts the extent to which the budget will reflect macro-
economic, fiscal and sector policies. Full participation requires an integrated top-down and bottom-
up budgeting process, involving all parties in an orderly and timely manner, in accordance with a
pre-determined budget formulation calendar.
Observation/Country case
(i) Existence of and adherence to a fixed budget calendar
Ministry of Finance, Planning and Economic Development is the main driver of the annual budget
formulation process in Uganda Government budget process. MDAs and political leadership
effectively participate in the budget formulation process. The budget clearly reflects macro-
economic, fiscal and sector policies. This process involves full participation of all parties in an
integrated top-down and bottom-up budgeting process in a clear order and timely manner. The
process is done following stipulated budget formulation calendar.
(ii) Clarity/comprehensiveness of and political involvement in the guidance on the preparation of budget submissions (budget circular or equivalent);
Section 2 of GOU Budget Act 2001 prescribes the process that enables the identification of
measures for the efficient, allocation of expenditures among sectors to meet national objects. For
that purpose a budget circular is usually issued to:-
i. Request MDAs to prepare Sector Budget Framework Papers (BFPs) for the Financial
Year and the Medium Term;
27
ii. Re-emphasize policy and administrative guidelines for the development of the Budget
for the Financial Year; and
iii. Provide indicative three-year Medium Term Expenditure Framework (MFEF) ceilings,
the first year of which is the basis for allocations of the expenditure estimates for the
Financial Year
The GoU budget Circular clearly outlines the requirements and a timetable for preparation of
budget estimates. Cabinet determines priorities such as Rural and Industrial growth strategy as
defined in the previous budget. Almost 2 months are allowed for the preparation of line Ministry
estimates.
(iii) Timely budget approval by the legislature or similarly mandated body (within the last
three years);
The Parliament debates the draft estimates between July and September and approves the budget
in October. Internal regulations allow the Parliament to make recommendations for change or to
reject the budget.
The GoU budget appropriations have usually been approved within 4 months into the fiscal year.
For example, the budget for 2006/07 was approved on 26th October, 2006. However, the
Constitution under article 154 (4) provides for the President to authorize Money from Consolidated
Fund for meeting expenses up to 4 months into the fiscal year. The budgets are always approved
before the expiry of 4 months.
Score and justification
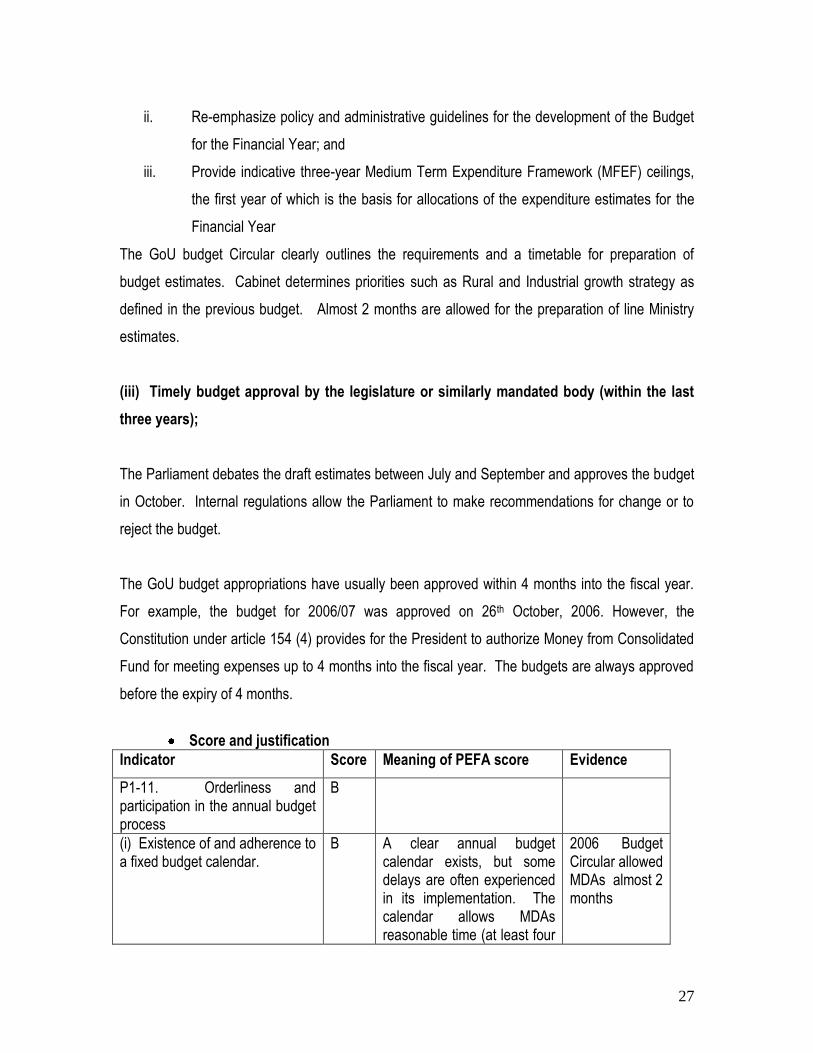
Indicator Score Meaning of PEFA score Evidence
P1-11. Orderliness and participation in the annual budget process
B
(i) Existence of and adherence to a fixed budget calendar.
B A clear annual budget calendar exists, but some delays are often experienced in its implementation. The calendar allows MDAs reasonable time (at least four
2006 Budget Circular allowed MDAs almost 2 months
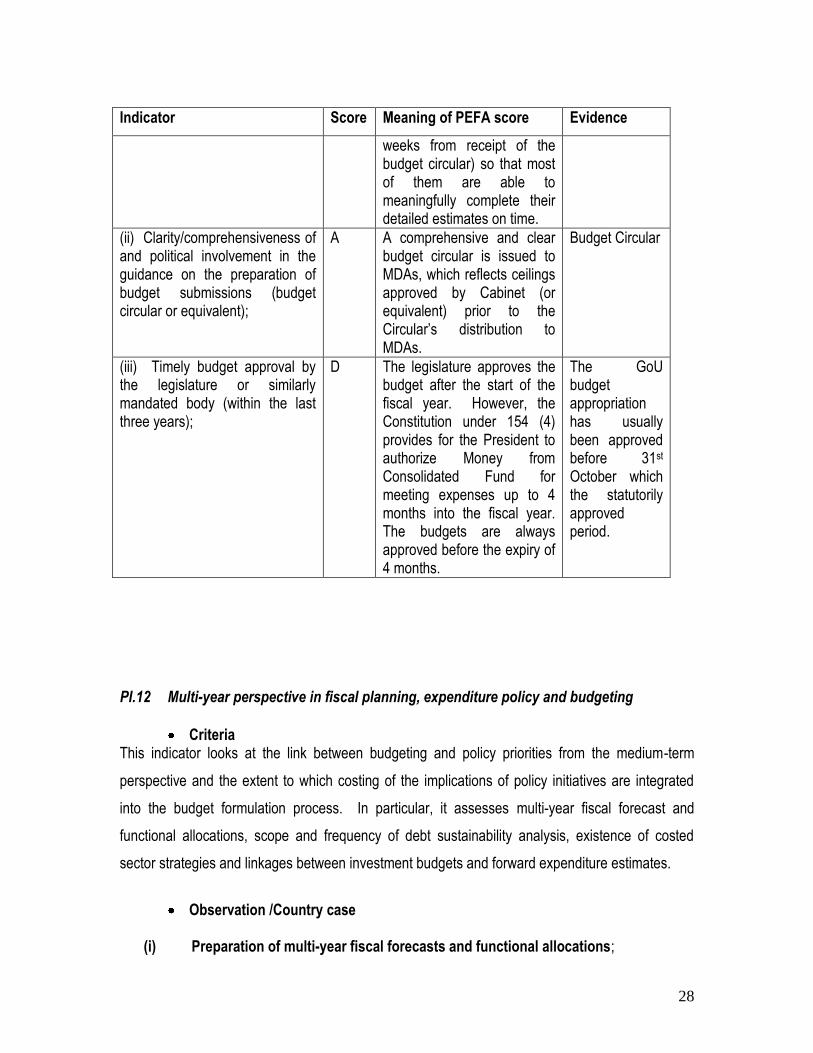
28
Indicator Score Meaning of PEFA score Evidence
weeks from receipt of the budget circular) so that most of them are able to meaningfully complete their detailed estimates on time.
(ii) Clarity/comprehensiveness of and political involvement in the guidance on the preparation of budget submissions (budget circular or equivalent);
A A comprehensive and clear budget circular is issued to MDAs, which reflects ceilings approved by Cabinet (or equivalent) prior to the Circular‟s distribution to MDAs.
Budget Circular
(iii) Timely budget approval by the legislature or similarly mandated body (within the last three years);
D The legislature approves the budget after the start of the fiscal year. However, the Constitution under 154 (4) provides for the President to authorize Money from Consolidated Fund for meeting expenses up to 4 months into the fiscal year. The budgets are always approved before the expiry of 4 months.
The GoU budget appropriation has usually been approved before 31st October which the statutorily approved period.
PI.12 Multi-year perspective in fiscal planning, expenditure policy and budgeting
Criteria This indicator looks at the link between budgeting and policy priorities from the medium-term
perspective and the extent to which costing of the implications of policy initiatives are integrated
into the budget formulation process. In particular, it assesses multi-year fiscal forecast and
functional allocations, scope and frequency of debt sustainability analysis, existence of costed
sector strategies and linkages between investment budgets and forward expenditure estimates.
Observation /Country case
(i) Preparation of multi-year fiscal forecasts and functional allocations;
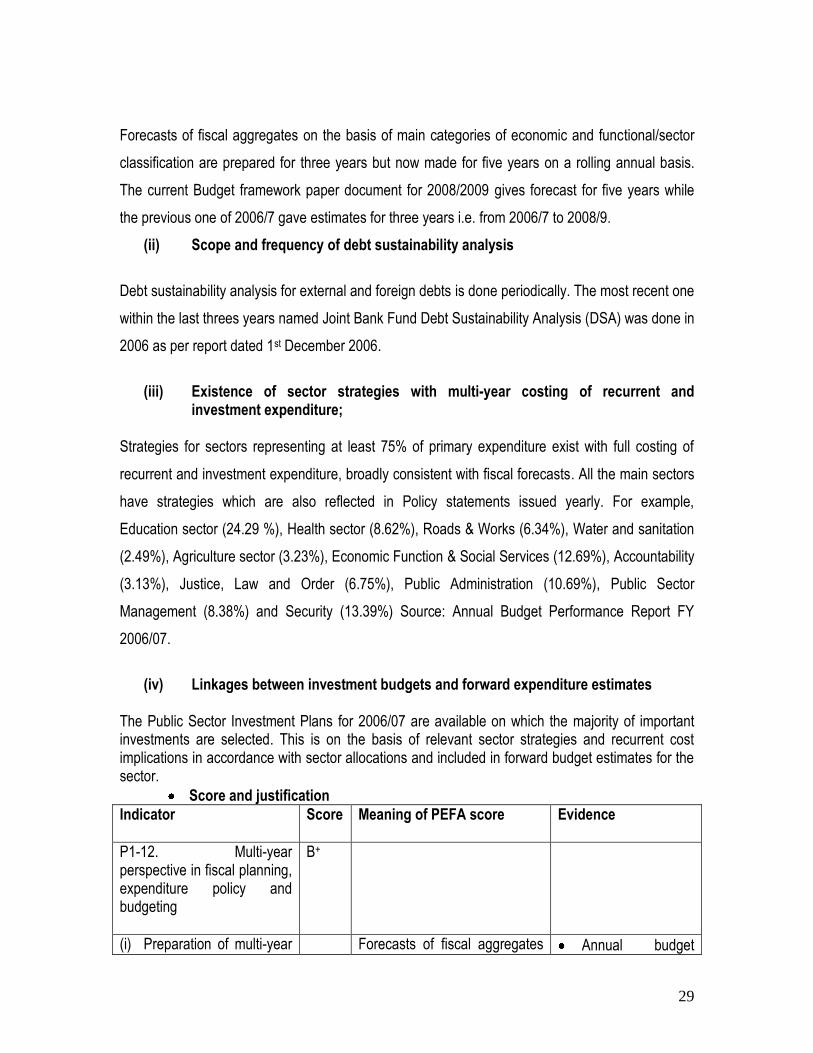
29
Forecasts of fiscal aggregates on the basis of main categories of economic and functional/sector
classification are prepared for three years but now made for five years on a rolling annual basis.
The current Budget framework paper document for 2008/2009 gives forecast for five years while
the previous one of 2006/7 gave estimates for three years i.e. from 2006/7 to 2008/9.
(ii) Scope and frequency of debt sustainability analysis
Debt sustainability analysis for external and foreign debts is done periodically. The most recent one
within the last threes years named Joint Bank Fund Debt Sustainability Analysis (DSA) was done in
2006 as per report dated 1st December 2006.
(iii) Existence of sector strategies with multi-year costing of recurrent and
investment expenditure; Strategies for sectors representing at least 75% of primary expenditure exist with full costing of
recurrent and investment expenditure, broadly consistent with fiscal forecasts. All the main sectors
have strategies which are also reflected in Policy statements issued yearly. For example,
Education sector (24.29 %), Health sector (8.62%), Roads & Works (6.34%), Water and sanitation
(2.49%), Agriculture sector (3.23%), Economic Function & Social Services (12.69%), Accountability
(3.13%), Justice, Law and Order (6.75%), Public Administration (10.69%), Public Sector
Management (8.38%) and Security (13.39%) Source: Annual Budget Performance Report FY
2006/07.
(iv) Linkages between investment budgets and forward expenditure estimates
The Public Sector Investment Plans for 2006/07 are available on which the majority of important investments are selected. This is on the basis of relevant sector strategies and recurrent cost implications in accordance with sector allocations and included in forward budget estimates for the sector.
Score and justification
Indicator
Score Meaning of PEFA score
Evidence
P1-12. Multi-year perspective in fiscal planning, expenditure policy and budgeting
B+
(i) Preparation of multi-year Forecasts of fiscal aggregates Annual budget
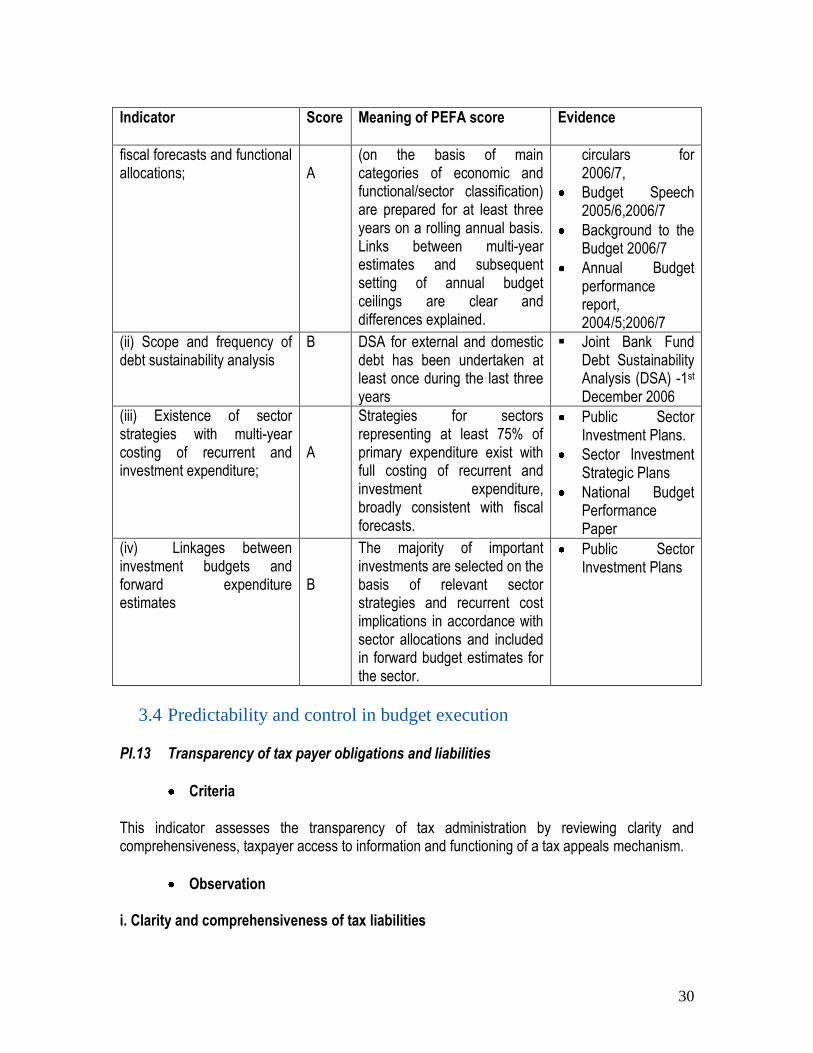
30
Indicator
Score Meaning of PEFA score
Evidence
fiscal forecasts and functional allocations;
A
(on the basis of main categories of economic and functional/sector classification) are prepared for at least three years on a rolling annual basis. Links between multi-year estimates and subsequent setting of annual budget ceilings are clear and differences explained.
circulars for 2006/7,
Budget Speech 2005/6,2006/7
Background to the Budget 2006/7
Annual Budget performance report, 2004/5;2006/7
(ii) Scope and frequency of debt sustainability analysis
B DSA for external and domestic debt has been undertaken at least once during the last three years
Joint Bank Fund Debt Sustainability Analysis (DSA) -1st December 2006
(iii) Existence of sector strategies with multi-year costing of recurrent and investment expenditure;
A
Strategies for sectors representing at least 75% of primary expenditure exist with full costing of recurrent and investment expenditure, broadly consistent with fiscal forecasts.
Public Sector Investment Plans.
Sector Investment Strategic Plans
National Budget Performance Paper
(iv) Linkages between investment budgets and forward expenditure estimates
B
The majority of important investments are selected on the basis of relevant sector strategies and recurrent cost implications in accordance with sector allocations and included in forward budget estimates for the sector.
Public Sector Investment Plans
3.4 Predictability and control in budget execution
PI.13 Transparency of tax payer obligations and liabilities
Criteria This indicator assesses the transparency of tax administration by reviewing clarity and comprehensiveness, taxpayer access to information and functioning of a tax appeals mechanism.
Observation i. Clarity and comprehensiveness of tax liabilities
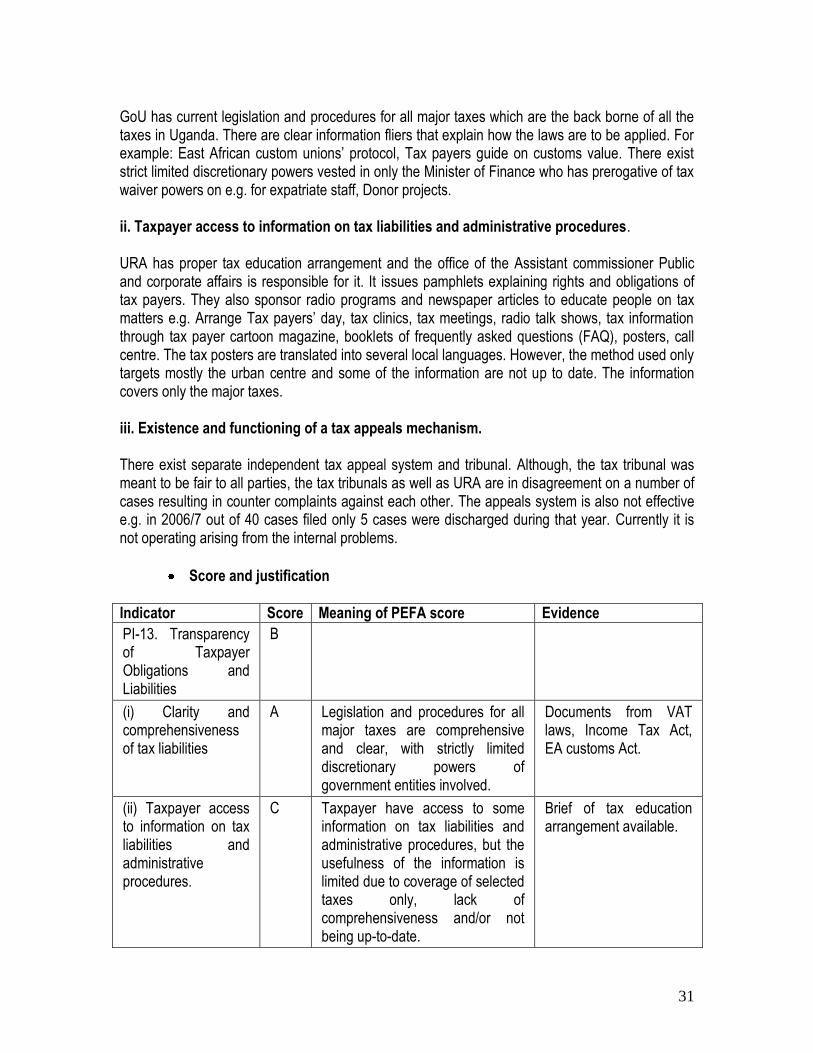
31
GoU has current legislation and procedures for all major taxes which are the back borne of all the taxes in Uganda. There are clear information fliers that explain how the laws are to be applied. For example: East African custom unions‟ protocol, Tax payers guide on customs value. There exist strict limited discretionary powers vested in only the Minister of Finance who has prerogative of tax waiver powers on e.g. for expatriate staff, Donor projects. ii. Taxpayer access to information on tax liabilities and administrative procedures. URA has proper tax education arrangement and the office of the Assistant commissioner Public and corporate affairs is responsible for it. It issues pamphlets explaining rights and obligations of tax payers. They also sponsor radio programs and newspaper articles to educate people on tax matters e.g. Arrange Tax payers‟ day, tax clinics, tax meetings, radio talk shows, tax information through tax payer cartoon magazine, booklets of frequently asked questions (FAQ), posters, call centre. The tax posters are translated into several local languages. However, the method used only targets mostly the urban centre and some of the information are not up to date. The information covers only the major taxes. iii. Existence and functioning of a tax appeals mechanism. There exist separate independent tax appeal system and tribunal. Although, the tax tribunal was meant to be fair to all parties, the tax tribunals as well as URA are in disagreement on a number of cases resulting in counter complaints against each other. The appeals system is also not effective e.g. in 2006/7 out of 40 cases filed only 5 cases were discharged during that year. Currently it is not operating arising from the internal problems.
Score and justification
Indicator Score Meaning of PEFA score Evidence
PI-13. Transparency of Taxpayer Obligations and Liabilities
B
(i) Clarity and comprehensiveness of tax liabilities
A Legislation and procedures for all major taxes are comprehensive and clear, with strictly limited discretionary powers of government entities involved.
Documents from VAT laws, Income Tax Act, EA customs Act.
(ii) Taxpayer access to information on tax liabilities and administrative procedures.
C Taxpayer have access to some information on tax liabilities and administrative procedures, but the usefulness of the information is limited due to coverage of selected taxes only, lack of comprehensiveness and/or not being up-to-date.
Brief of tax education arrangement available.
32
Indicator Score Meaning of PEFA score Evidence
(iii) Existence and functioning of a tax appeals mechanism.
C A tax appeals system of has been established, but needs substantial redesign to be fair, transparent and effective.
Tax appeal report from Commissioner legal services and board affairs department.
Auditor General‟s report June 2007.
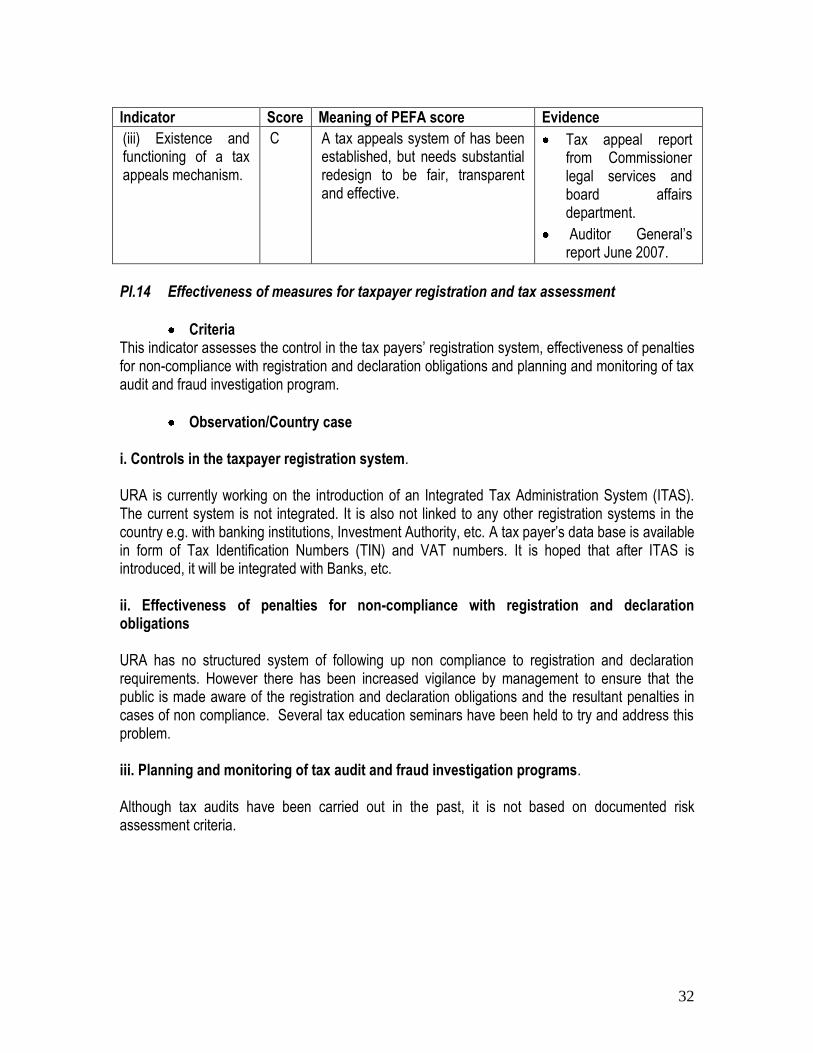
PI.14 Effectiveness of measures for taxpayer registration and tax assessment
Criteria This indicator assesses the control in the tax payers‟ registration system, effectiveness of penalties for non-compliance with registration and declaration obligations and planning and monitoring of tax audit and fraud investigation program.
Observation/Country case i. Controls in the taxpayer registration system. URA is currently working on the introduction of an Integrated Tax Administration System (ITAS). The current system is not integrated. It is also not linked to any other registration systems in the country e.g. with banking institutions, Investment Authority, etc. A tax payer‟s data base is available in form of Tax Identification Numbers (TIN) and VAT numbers. It is hoped that after ITAS is introduced, it will be integrated with Banks, etc. ii. Effectiveness of penalties for non-compliance with registration and declaration obligations URA has no structured system of following up non compliance to registration and declaration requirements. However there has been increased vigilance by management to ensure that the public is made aware of the registration and declaration obligations and the resultant penalties in cases of non compliance. Several tax education seminars have been held to try and address this problem. iii. Planning and monitoring of tax audit and fraud investigation programs. Although tax audits have been carried out in the past, it is not based on documented risk assessment criteria.
33
Score and justification
Indicator Score Meaning of PEFA score Evidence
PI-14. Effectiveness of measures for taxpayer registration and tax assessment
D+
(i) Controls in the taxpayer registration system.
D Tax payer registration is not subject to any effective controls or enforcement systems.
No tax payer registration monitoring report availed.
(ii) Effectiveness of penalties for non-compliance with registration and declaration obligations
C Penalties for non-compliance generally exist but substantial changes to their structure, levels, or administration are needed to give them real impact on compliance.
No monitoring report on compliance availed.
(iii) Planning and monitoring of tax audit and fraud investigation programs.
C There‟s a continuous program of tax audits and fraud investigations, but audit programmes are not based on clear risk assessment criteria.
No fraud investigation programs availed.
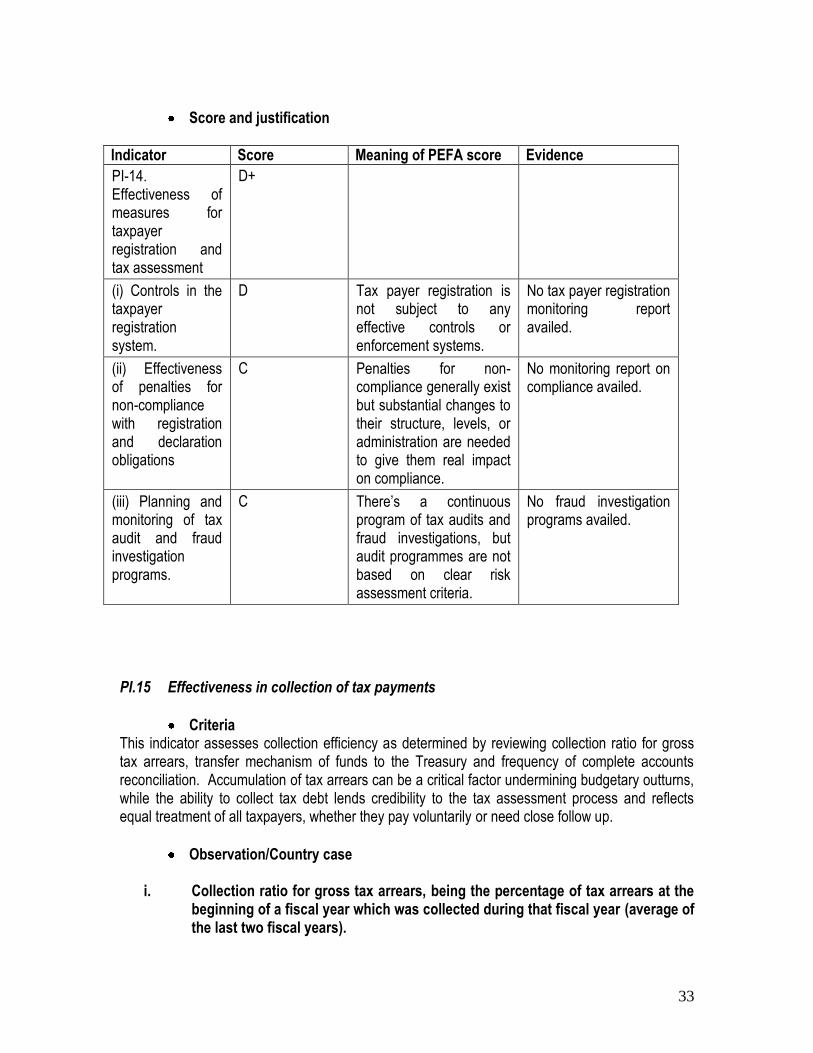
PI.15 Effectiveness in collection of tax payments
Criteria This indicator assesses collection efficiency as determined by reviewing collection ratio for gross tax arrears, transfer mechanism of funds to the Treasury and frequency of complete accounts reconciliation. Accumulation of tax arrears can be a critical factor undermining budgetary outturns, while the ability to collect tax debt lends credibility to the tax assessment process and reflects equal treatment of all taxpayers, whether they pay voluntarily or need close follow up.
Observation/Country case
i. Collection ratio for gross tax arrears, being the percentage of tax arrears at the beginning of a fiscal year which was collected during that fiscal year (average of the last two fiscal years).
34
There‟s no accurate information about tax arrears. This implies that the collection ratio can not be objectively computed. ii. Effectiveness of transfer of tax collections to the treasury by the revenue
administration Transfers are made weekly by URA to the consolidated fund account. iii. Frequency of complete accounts reconciliation between tax assessments,
collections, arrears records and receipts by the treasury No reconciliations have been carried out yet. URA only has planned to introduce them in future.
Indicator Score Meaning of PEFA score
Evidence
PI-15. Effectiveness in collection of tax payments
D+
(i) Collection ratio for gross tax arrears, being the percentage of tax arrears at the beginning of a fiscal year, which was collected during that fiscal year (average of the last two fiscal years).
D Debt collection ratio can not be calculated because there‟s no accurate information on arrears.
No report availed.
(ii) Effectiveness of transfer of tax collections to the Treasury by the revenue administration.
B Revenue collection are transferred to treasury weekly
Summary of weekly transfers by URA for 2006/7 is available.
(iii) Frequency of complete accounts reconciliation between tax assessments, collections, arrears records and receipts by the Treasury.
D Complete reconciliation of tax assessments, collections arrears, and transfers to treasury does not take place.
Letter from Ag. Asst. Commissioner confirming this position.
PI.16 Predictability in the availability of funds for commitment of expenditures
Criteria This indicator assesses budget execution effectiveness as evidenced by reasonable degree of predictability in the availability of funds. It uses the extent to which cash flows are forecast and monitored, reliability & horizon of periodic in-year information to MDAs on ceilings for expenditure
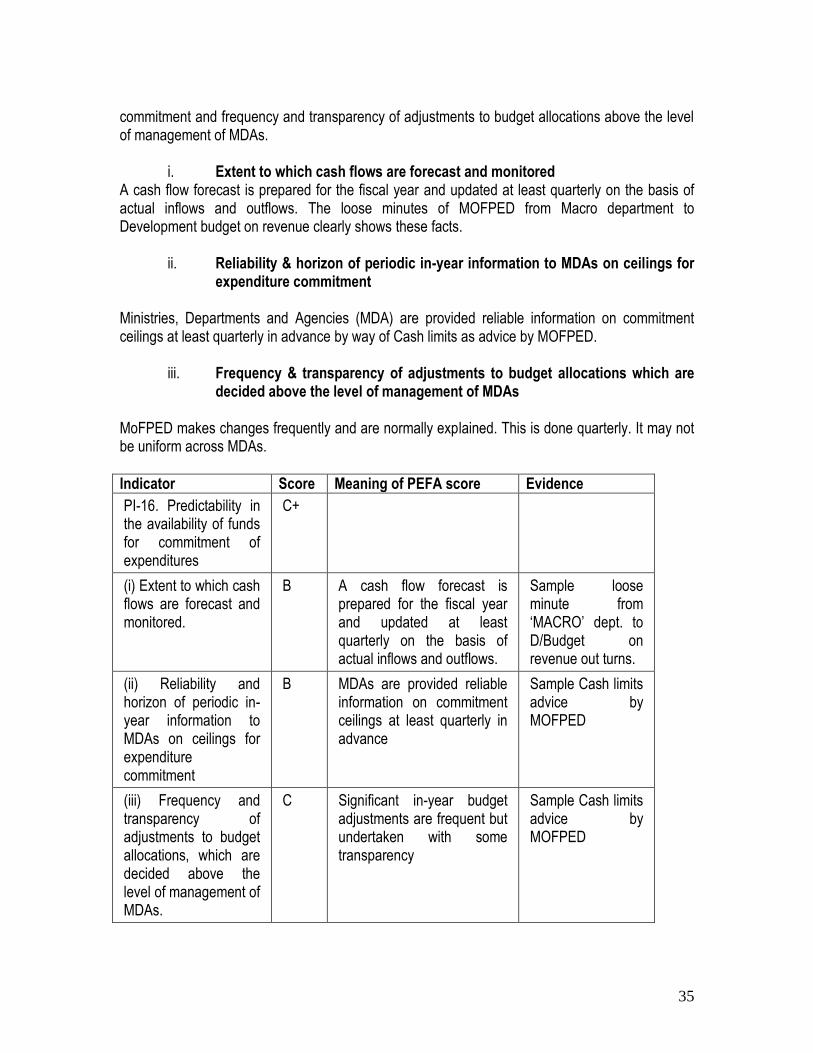
35
commitment and frequency and transparency of adjustments to budget allocations above the level of management of MDAs.
i. Extent to which cash flows are forecast and monitored A cash flow forecast is prepared for the fiscal year and updated at least quarterly on the basis of actual inflows and outflows. The loose minutes of MOFPED from Macro department to Development budget on revenue clearly shows these facts.
ii. Reliability & horizon of periodic in-year information to MDAs on ceilings for expenditure commitment
Ministries, Departments and Agencies (MDA) are provided reliable information on commitment ceilings at least quarterly in advance by way of Cash limits as advice by MOFPED.
iii. Frequency & transparency of adjustments to budget allocations which are decided above the level of management of MDAs
MoFPED makes changes frequently and are normally explained. This is done quarterly. It may not be uniform across MDAs.
Indicator Score Meaning of PEFA score Evidence
PI-16. Predictability in the availability of funds for commitment of expenditures
C+
(i) Extent to which cash flows are forecast and monitored.
B A cash flow forecast is prepared for the fiscal year and updated at least quarterly on the basis of actual inflows and outflows.
Sample loose minute from „MACRO‟ dept. to D/Budget on revenue out turns.
(ii) Reliability and horizon of periodic in-year information to MDAs on ceilings for expenditure commitment
B MDAs are provided reliable information on commitment ceilings at least quarterly in advance
Sample Cash limits advice by MOFPED
(iii) Frequency and transparency of adjustments to budget allocations, which are decided above the level of management of MDAs.
C Significant in-year budget adjustments are frequent but undertaken with some transparency
Sample Cash limits advice by MOFPED
36
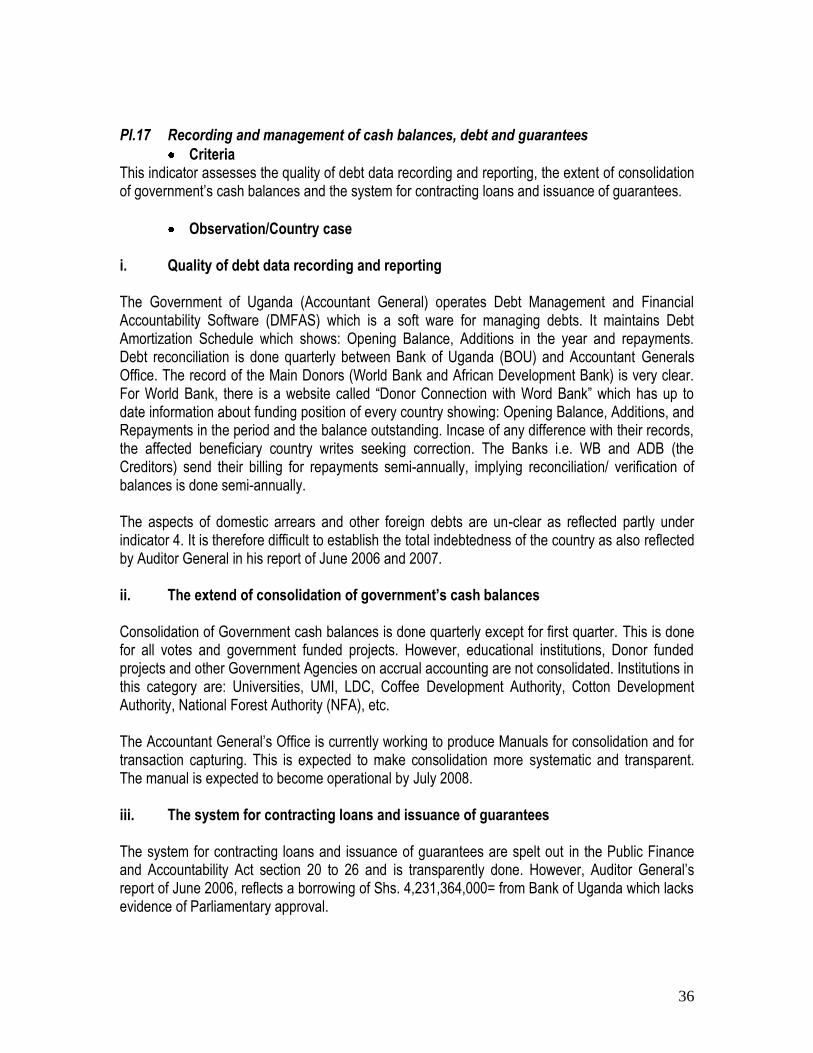
PI.17 Recording and management of cash balances, debt and guarantees
Criteria This indicator assesses the quality of debt data recording and reporting, the extent of consolidation of government‟s cash balances and the system for contracting loans and issuance of guarantees.
Observation/Country case i. Quality of debt data recording and reporting The Government of Uganda (Accountant General) operates Debt Management and Financial Accountability Software (DMFAS) which is a soft ware for managing debts. It maintains Debt Amortization Schedule which shows: Opening Balance, Additions in the year and repayments. Debt reconciliation is done quarterly between Bank of Uganda (BOU) and Accountant Generals Office. The record of the Main Donors (World Bank and African Development Bank) is very clear. For World Bank, there is a website called “Donor Connection with Word Bank” which has up to date information about funding position of every country showing: Opening Balance, Additions, and Repayments in the period and the balance outstanding. Incase of any difference with their records, the affected beneficiary country writes seeking correction. The Banks i.e. WB and ADB (the Creditors) send their billing for repayments semi-annually, implying reconciliation/ verification of balances is done semi-annually. The aspects of domestic arrears and other foreign debts are un-clear as reflected partly under indicator 4. It is therefore difficult to establish the total indebtedness of the country as also reflected by Auditor General in his report of June 2006 and 2007. ii. The extend of consolidation of government’s cash balances Consolidation of Government cash balances is done quarterly except for first quarter. This is done for all votes and government funded projects. However, educational institutions, Donor funded projects and other Government Agencies on accrual accounting are not consolidated. Institutions in this category are: Universities, UMI, LDC, Coffee Development Authority, Cotton Development Authority, National Forest Authority (NFA), etc. The Accountant General‟s Office is currently working to produce Manuals for consolidation and for transaction capturing. This is expected to make consolidation more systematic and transparent. The manual is expected to become operational by July 2008. iii. The system for contracting loans and issuance of guarantees The system for contracting loans and issuance of guarantees are spelt out in the Public Finance and Accountability Act section 20 to 26 and is transparently done. However, Auditor General‟s report of June 2006, reflects a borrowing of Shs. 4,231,364,000= from Bank of Uganda which lacks evidence of Parliamentary approval.
37
Score and justification
Indicator Score Meaning of PEFA score Evidence
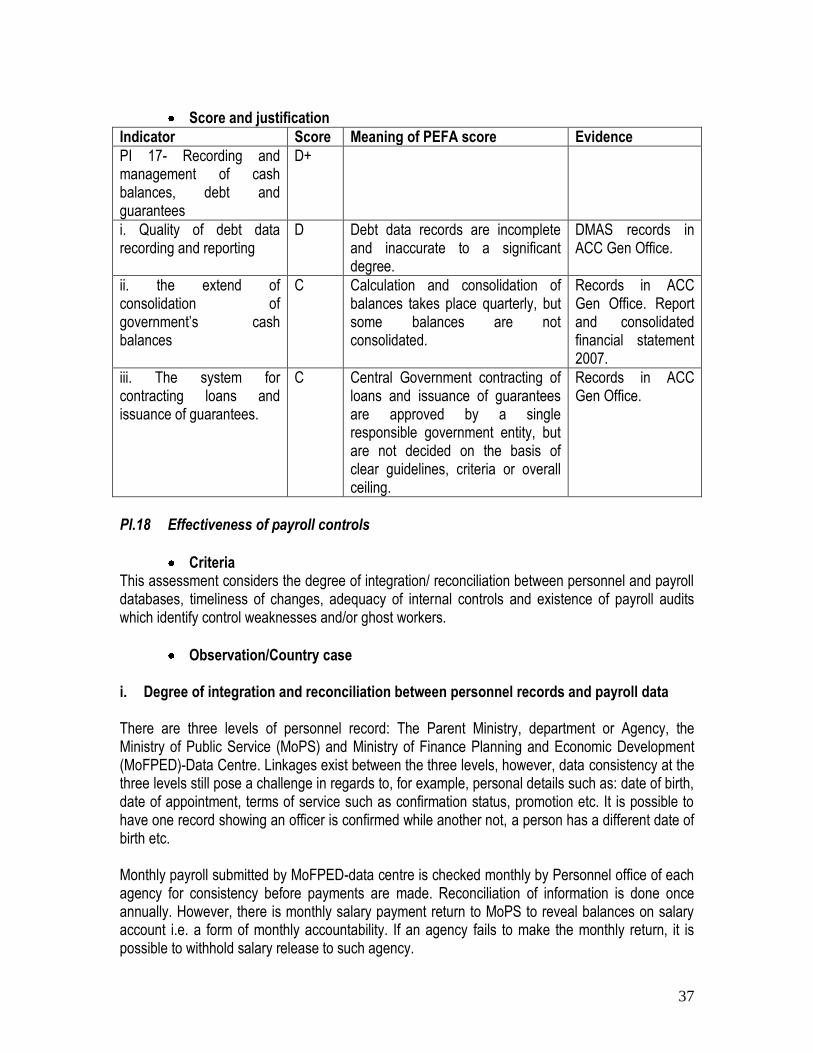
PI 17- Recording and management of cash balances, debt and guarantees
D+
i. Quality of debt data recording and reporting
D Debt data records are incomplete and inaccurate to a significant degree.
DMAS records in ACC Gen Office.
ii. the extend of consolidation of government‟s cash balances
C Calculation and consolidation of balances takes place quarterly, but some balances are not consolidated.
Records in ACC Gen Office. Report and consolidated financial statement 2007.
iii. The system for contracting loans and issuance of guarantees.
C Central Government contracting of loans and issuance of guarantees are approved by a single responsible government entity, but are not decided on the basis of clear guidelines, criteria or overall ceiling.
Records in ACC Gen Office.
PI.18 Effectiveness of payroll controls
Criteria This assessment considers the degree of integration/ reconciliation between personnel and payroll databases, timeliness of changes, adequacy of internal controls and existence of payroll audits which identify control weaknesses and/or ghost workers.
Observation/Country case
i. Degree of integration and reconciliation between personnel records and payroll data There are three levels of personnel record: The Parent Ministry, department or Agency, the Ministry of Public Service (MoPS) and Ministry of Finance Planning and Economic Development (MoFPED)-Data Centre. Linkages exist between the three levels, however, data consistency at the three levels still pose a challenge in regards to, for example, personal details such as: date of birth, date of appointment, terms of service such as confirmation status, promotion etc. It is possible to have one record showing an officer is confirmed while another not, a person has a different date of birth etc. Monthly payroll submitted by MoFPED-data centre is checked monthly by Personnel office of each agency for consistency before payments are made. Reconciliation of information is done once annually. However, there is monthly salary payment return to MoPS to reveal balances on salary account i.e. a form of monthly accountability. If an agency fails to make the monthly return, it is possible to withhold salary release to such agency.
38
Through this arrangement MoPS monitors salary payment performance. Each agency produces staff list annually and submits to MoPS. However, the integrity of the payroll is significantly undermined by inconsistencies in personnel records and personnel database. Special audit report in Ministry of Works by Auditor General revealed significant finding showing apparent loopholes in data integrity as reflected in iii below. ii. Timeliness of changes to personnel records and payroll The required changes to personnel records and payment take time depending on the nature of transaction and time of submission. When a pay change record is submitted before 15th of the month and no error is found with it, then the required changes can be updated in the following month i.e. it takes one month. However, if an error is found and the feed back report to the originating Ministry, Department or agency is received later than 15th then the required change in the payroll can be effected in the second month following the feedback. This implies such a personnel change can be updated on the payroll after three months from the date of initial submission. However, the reality on the ground reflects a slightly different picture. New entrants can take up to six months while pensioners can take years to exit the payroll; a situation which is very appalling. Reference to AG‟s report of June 2006 and special investigation in Ministry of works payroll, reveal situation of existence of overstay of names of employees who have long left Government service. iii. Internal controls of changes to personnel records and payroll Adequate control exist in the process of initiating changes to personnel records. All changes must be supported by third party documents such as appointment letters and minute of appointment of PSC to support including anyone on payroll. Promotion letter plus PSC minute are required to support salary increment or Duty allowance submission. Usually the affected staff initiates the process stating the concern for the need to change personnel records in the payroll. The Personnel office of each agency monthly verifies payroll submitted by MoFPED-data centre for consistency before payments are made as another internal control. The time given for the Personnel office to verify the monthly payroll records before payment is effected are not adequate for meaningful verification. For example payroll reaches the agency on 25th of the month but payment must be effected not later than 28th of the month. Additionally, pay slips are produced in three copies which must all be signed by a staff and 2 copies are returned and filed by the Department head and the other copy in the personal file of the employee as further internal control. Although enforcing the system is still not very strong to offer the desired control. This is because some employees do not receive all the three while others do not return the two copies yet other departmental heads do not file their copy believing it is personnel office work. A special audit in Ministry of works payroll by the Auditor General in September 2007, revealed significant findings such as illegal entry to payroll without due procedures, Leavers of service due to various reasons ranging from retirement, resignation and death take long to be deleted from the Ministry‟s payroll.
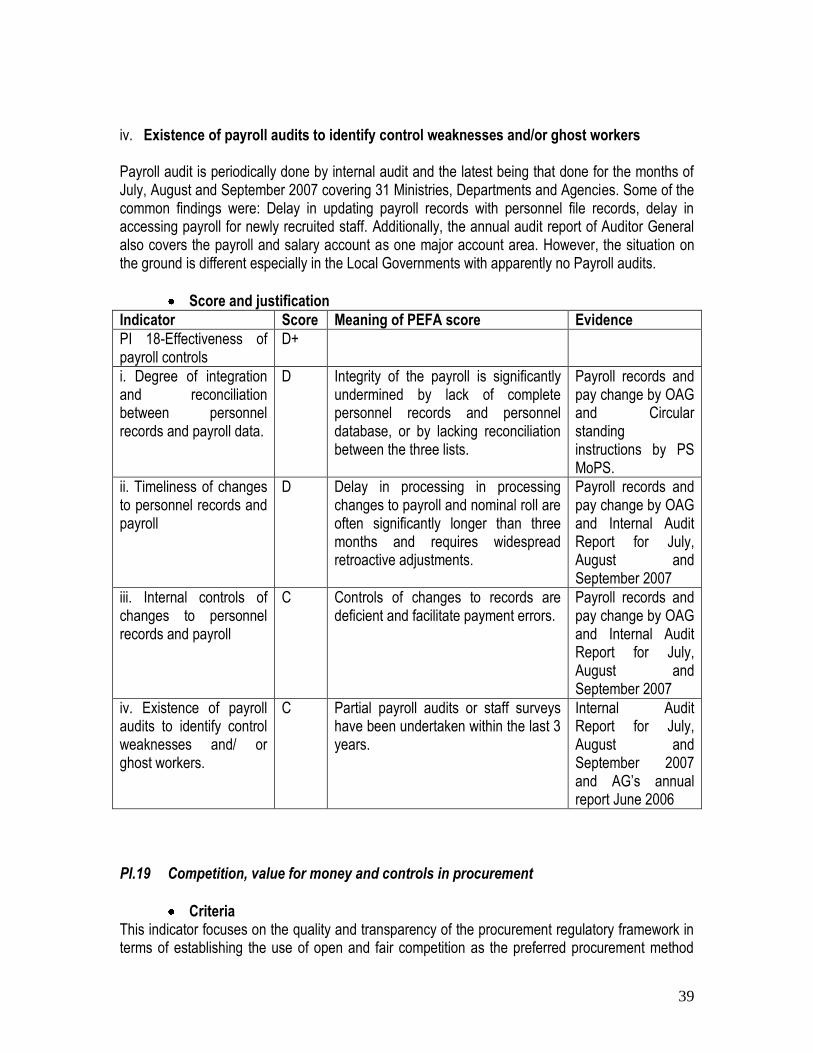
39
iv. Existence of payroll audits to identify control weaknesses and/or ghost workers Payroll audit is periodically done by internal audit and the latest being that done for the months of July, August and September 2007 covering 31 Ministries, Departments and Agencies. Some of the common findings were: Delay in updating payroll records with personnel file records, delay in accessing payroll for newly recruited staff. Additionally, the annual audit report of Auditor General also covers the payroll and salary account as one major account area. However, the situation on the ground is different especially in the Local Governments with apparently no Payroll audits.
Score and justification
Indicator Score Meaning of PEFA score Evidence
PI 18-Effectiveness of payroll controls
D+
i. Degree of integration and reconciliation between personnel records and payroll data.
D Integrity of the payroll is significantly undermined by lack of complete personnel records and personnel database, or by lacking reconciliation between the three lists.
Payroll records and pay change by OAG and Circular standing instructions by PS MoPS.
ii. Timeliness of changes to personnel records and payroll
D Delay in processing in processing changes to payroll and nominal roll are often significantly longer than three months and requires widespread retroactive adjustments.
Payroll records and pay change by OAG and Internal Audit Report for July, August and September 2007
iii. Internal controls of changes to personnel records and payroll
C Controls of changes to records are deficient and facilitate payment errors.
Payroll records and pay change by OAG and Internal Audit Report for July, August and September 2007
iv. Existence of payroll audits to identify control weaknesses and/ or ghost workers.
C Partial payroll audits or staff surveys have been undertaken within the last 3 years.
Internal Audit Report for July, August and September 2007 and AG‟s annual report June 2006
PI.19 Competition, value for money and controls in procurement
Criteria This indicator focuses on the quality and transparency of the procurement regulatory framework in terms of establishing the use of open and fair competition as the preferred procurement method
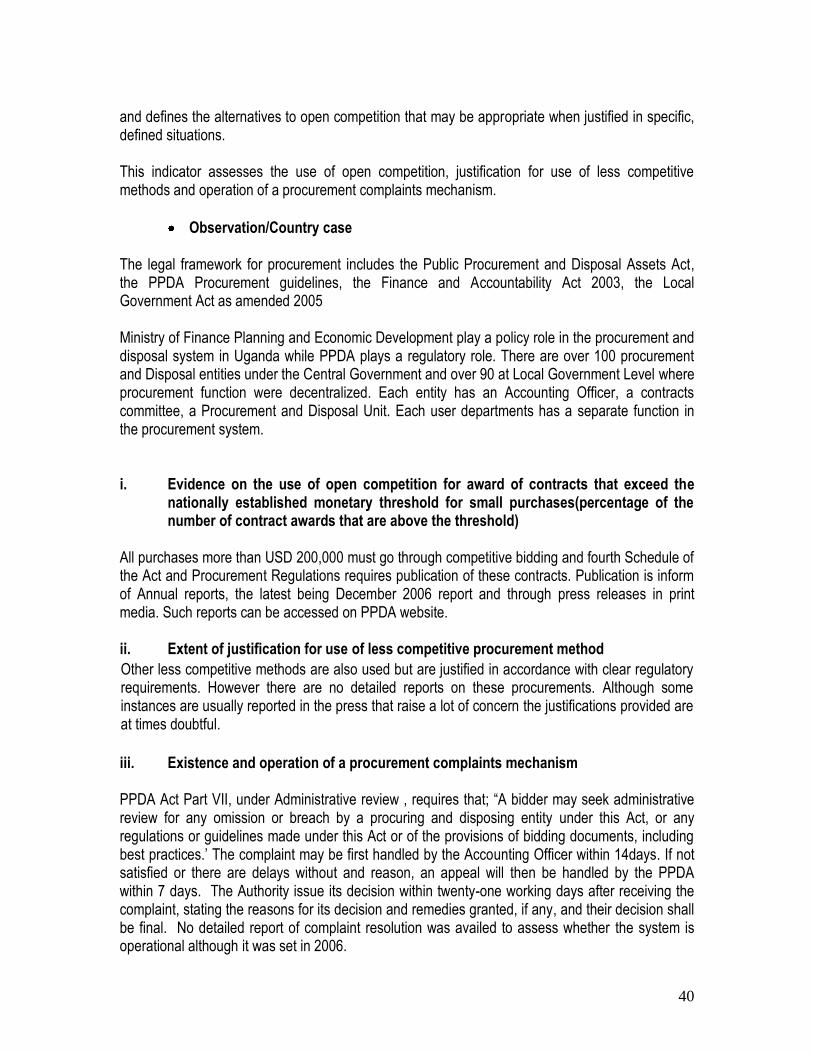
40
and defines the alternatives to open competition that may be appropriate when justified in specific, defined situations. This indicator assesses the use of open competition, justification for use of less competitive methods and operation of a procurement complaints mechanism.
Observation/Country case The legal framework for procurement includes the Public Procurement and Disposal Assets Act, the PPDA Procurement guidelines, the Finance and Accountability Act 2003, the Local Government Act as amended 2005 Ministry of Finance Planning and Economic Development play a policy role in the procurement and disposal system in Uganda while PPDA plays a regulatory role. There are over 100 procurement and Disposal entities under the Central Government and over 90 at Local Government Level where procurement function were decentralized. Each entity has an Accounting Officer, a contracts committee, a Procurement and Disposal Unit. Each user departments has a separate function in the procurement system. i. Evidence on the use of open competition for award of contracts that exceed the
nationally established monetary threshold for small purchases(percentage of the number of contract awards that are above the threshold)
All purchases more than USD 200,000 must go through competitive bidding and fourth Schedule of the Act and Procurement Regulations requires publication of these contracts. Publication is inform of Annual reports, the latest being December 2006 report and through press releases in print media. Such reports can be accessed on PPDA website. ii. Extent of justification for use of less competitive procurement method
Other less competitive methods are also used but are justified in accordance with clear regulatory requirements. However there are no detailed reports on these procurements. Although some instances are usually reported in the press that raise a lot of concern the justifications provided are at times doubtful.
iii. Existence and operation of a procurement complaints mechanism PPDA Act Part VII, under Administrative review , requires that; “A bidder may seek administrative review for any omission or breach by a procuring and disposing entity under this Act, or any regulations or guidelines made under this Act or of the provisions of bidding documents, including best practices.‟ The complaint may be first handled by the Accounting Officer within 14days. If not satisfied or there are delays without and reason, an appeal will then be handled by the PPDA within 7 days. The Authority issue its decision within twenty-one working days after receiving the complaint, stating the reasons for its decision and remedies granted, if any, and their decision shall be final. No detailed report of complaint resolution was availed to assess whether the system is operational although it was set in 2006.
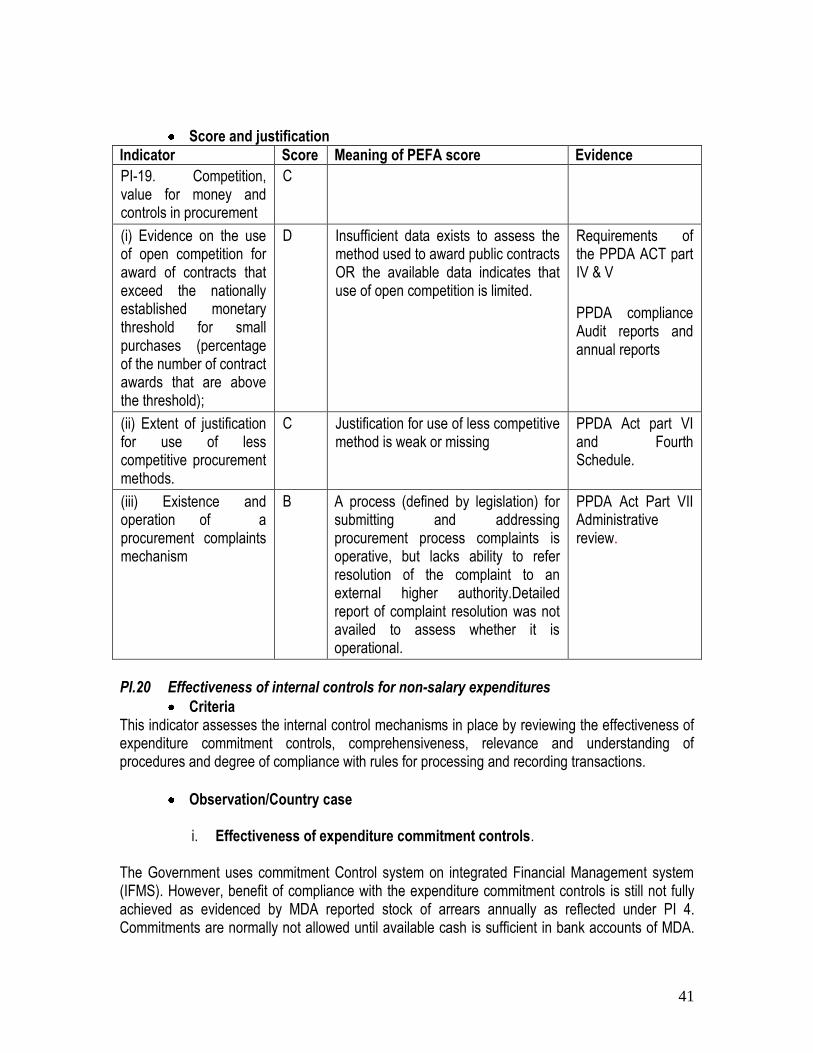
41
Score and justification
Indicator Score Meaning of PEFA score Evidence
PI-19. Competition, value for money and controls in procurement
C
(i) Evidence on the use of open competition for award of contracts that exceed the nationally established monetary threshold for small purchases (percentage of the number of contract awards that are above the threshold);
D Insufficient data exists to assess the method used to award public contracts OR the available data indicates that use of open competition is limited.
Requirements of the PPDA ACT part IV & V
PPDA compliance Audit reports and annual reports
(ii) Extent of justification for use of less competitive procurement methods.
C Justification for use of less competitive method is weak or missing
PPDA Act part VI and Fourth Schedule.
(iii) Existence and operation of a procurement complaints mechanism
B A process (defined by legislation) for submitting and addressing procurement process complaints is operative, but lacks ability to refer resolution of the complaint to an external higher authority.Detailed report of complaint resolution was not availed to assess whether it is operational.
PPDA Act Part VII Administrative review.
PI.20 Effectiveness of internal controls for non-salary expenditures
Criteria This indicator assesses the internal control mechanisms in place by reviewing the effectiveness of expenditure commitment controls, comprehensiveness, relevance and understanding of procedures and degree of compliance with rules for processing and recording transactions.
Observation/Country case
i. Effectiveness of expenditure commitment controls. The Government uses commitment Control system on integrated Financial Management system (IFMS). However, benefit of compliance with the expenditure commitment controls is still not fully achieved as evidenced by MDA reported stock of arrears annually as reflected under PI 4. Commitments are normally not allowed until available cash is sufficient in bank accounts of MDA.
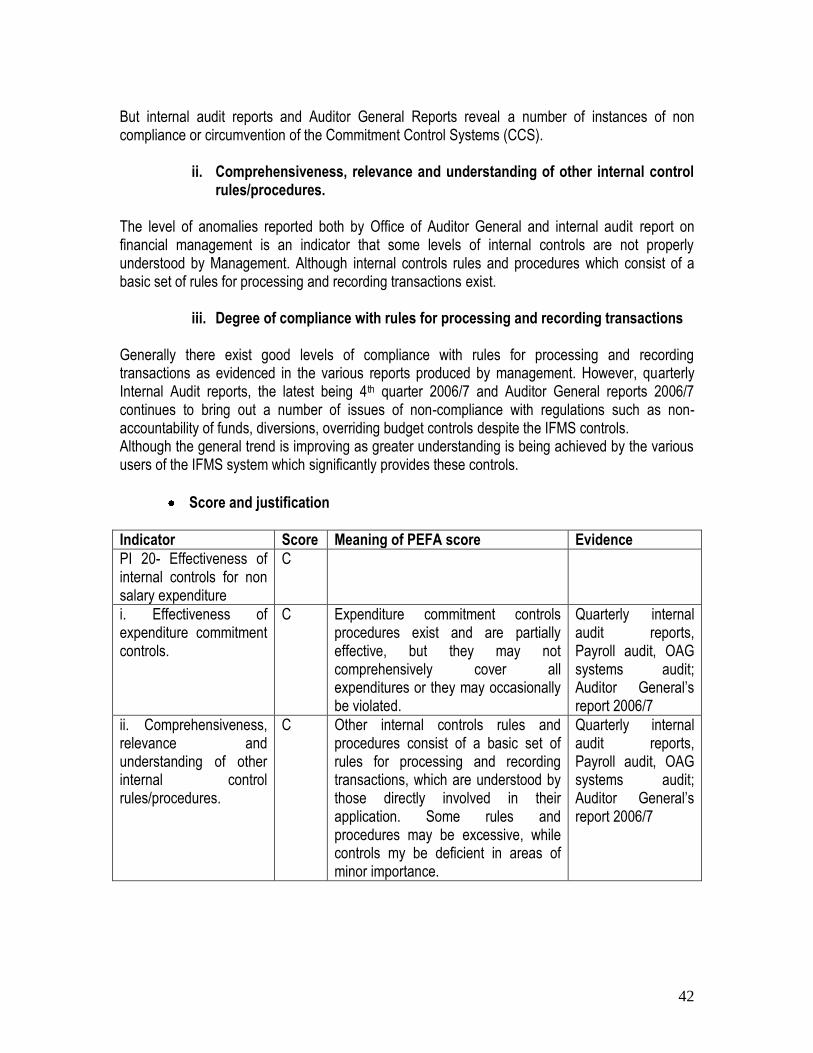
42
But internal audit reports and Auditor General Reports reveal a number of instances of non compliance or circumvention of the Commitment Control Systems (CCS).
ii. Comprehensiveness, relevance and understanding of other internal control rules/procedures.
The level of anomalies reported both by Office of Auditor General and internal audit report on financial management is an indicator that some levels of internal controls are not properly understood by Management. Although internal controls rules and procedures which consist of a basic set of rules for processing and recording transactions exist.
iii. Degree of compliance with rules for processing and recording transactions Generally there exist good levels of compliance with rules for processing and recording transactions as evidenced in the various reports produced by management. However, quarterly Internal Audit reports, the latest being 4th quarter 2006/7 and Auditor General reports 2006/7 continues to bring out a number of issues of non-compliance with regulations such as non-accountability of funds, diversions, overriding budget controls despite the IFMS controls. Although the general trend is improving as greater understanding is being achieved by the various users of the IFMS system which significantly provides these controls.
Score and justification
Indicator Score Meaning of PEFA score Evidence
PI 20- Effectiveness of internal controls for non salary expenditure
C
i. Effectiveness of expenditure commitment controls.
C Expenditure commitment controls procedures exist and are partially effective, but they may not comprehensively cover all expenditures or they may occasionally be violated.
Quarterly internal audit reports, Payroll audit, OAG systems audit; Auditor General‟s report 2006/7
ii. Comprehensiveness, relevance and understanding of other internal control rules/procedures.
C Other internal controls rules and procedures consist of a basic set of rules for processing and recording transactions, which are understood by those directly involved in their application. Some rules and procedures may be excessive, while controls my be deficient in areas of minor importance.
Quarterly internal audit reports, Payroll audit, OAG systems audit; Auditor General‟s report 2006/7
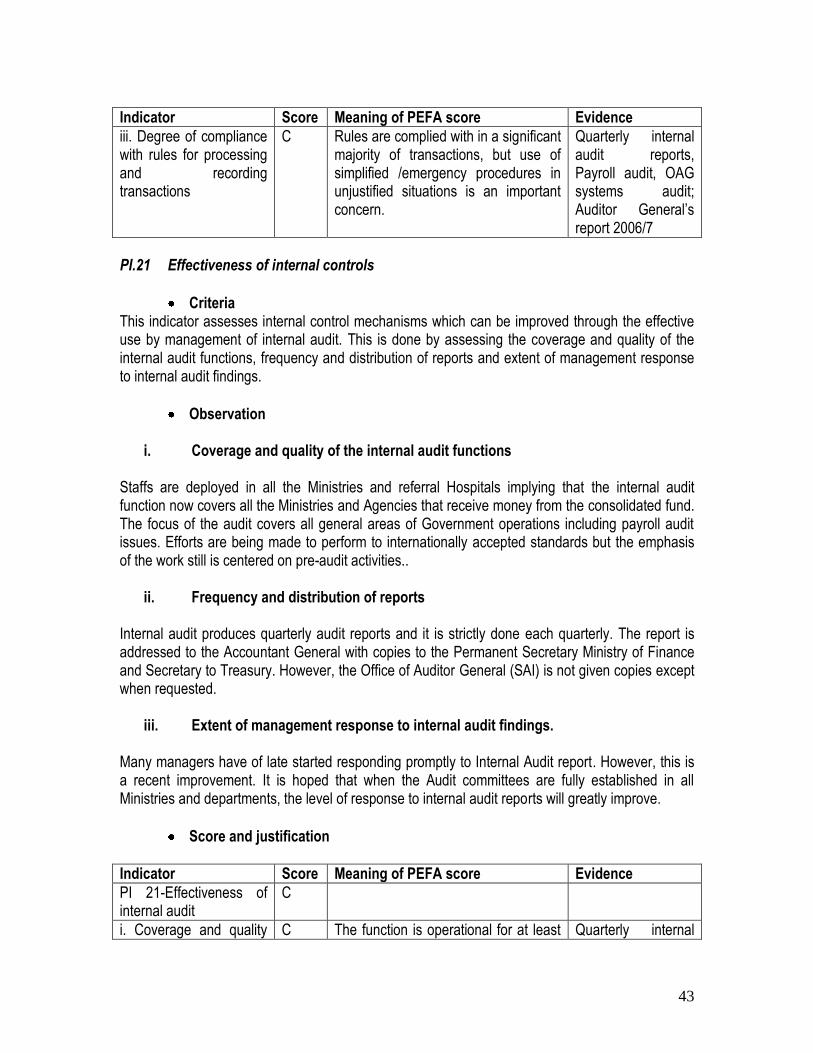
43
Indicator Score Meaning of PEFA score Evidence
iii. Degree of compliance with rules for processing and recording transactions
C Rules are complied with in a significant majority of transactions, but use of simplified /emergency procedures in unjustified situations is an important concern.
Quarterly internal audit reports, Payroll audit, OAG systems audit; Auditor General‟s report 2006/7
PI.21 Effectiveness of internal controls
Criteria This indicator assesses internal control mechanisms which can be improved through the effective use by management of internal audit. This is done by assessing the coverage and quality of the internal audit functions, frequency and distribution of reports and extent of management response to internal audit findings.
Observation
i. Coverage and quality of the internal audit functions
Staffs are deployed in all the Ministries and referral Hospitals implying that the internal audit function now covers all the Ministries and Agencies that receive money from the consolidated fund. The focus of the audit covers all general areas of Government operations including payroll audit issues. Efforts are being made to perform to internationally accepted standards but the emphasis of the work still is centered on pre-audit activities..
ii. Frequency and distribution of reports Internal audit produces quarterly audit reports and it is strictly done each quarterly. The report is addressed to the Accountant General with copies to the Permanent Secretary Ministry of Finance and Secretary to Treasury. However, the Office of Auditor General (SAI) is not given copies except when requested.
iii. Extent of management response to internal audit findings. Many managers have of late started responding promptly to Internal Audit report. However, this is a recent improvement. It is hoped that when the Audit committees are fully established in all Ministries and departments, the level of response to internal audit reports will greatly improve.
Score and justification
Indicator Score Meaning of PEFA score Evidence
PI 21-Effectiveness of internal audit
C
i. Coverage and quality C The function is operational for at least Quarterly internal
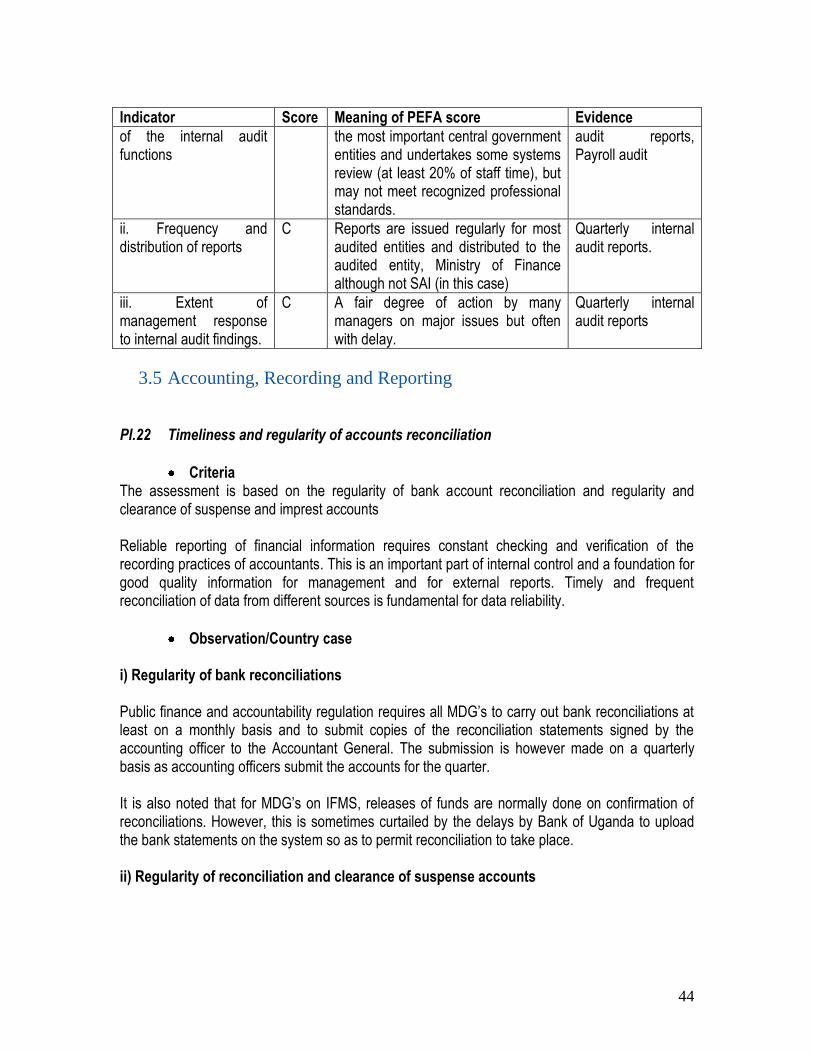
44
Indicator Score Meaning of PEFA score Evidence
of the internal audit functions
the most important central government entities and undertakes some systems review (at least 20% of staff time), but may not meet recognized professional standards.
audit reports, Payroll audit
ii. Frequency and distribution of reports
C Reports are issued regularly for most audited entities and distributed to the audited entity, Ministry of Finance although not SAI (in this case)
Quarterly internal audit reports.
iii. Extent of management response to internal audit findings.
C A fair degree of action by many managers on major issues but often with delay.
Quarterly internal audit reports
3.5 Accounting, Recording and Reporting
PI.22 Timeliness and regularity of accounts reconciliation
Criteria The assessment is based on the regularity of bank account reconciliation and regularity and clearance of suspense and imprest accounts Reliable reporting of financial information requires constant checking and verification of the recording practices of accountants. This is an important part of internal control and a foundation for good quality information for management and for external reports. Timely and frequent reconciliation of data from different sources is fundamental for data reliability.
Observation/Country case i) Regularity of bank reconciliations Public finance and accountability regulation requires all MDG‟s to carry out bank reconciliations at least on a monthly basis and to submit copies of the reconciliation statements signed by the accounting officer to the Accountant General. The submission is however made on a quarterly basis as accounting officers submit the accounts for the quarter. It is also noted that for MDG‟s on IFMS, releases of funds are normally done on confirmation of reconciliations. However, this is sometimes curtailed by the delays by Bank of Uganda to upload the bank statements on the system so as to permit reconciliation to take place. ii) Regularity of reconciliation and clearance of suspense accounts
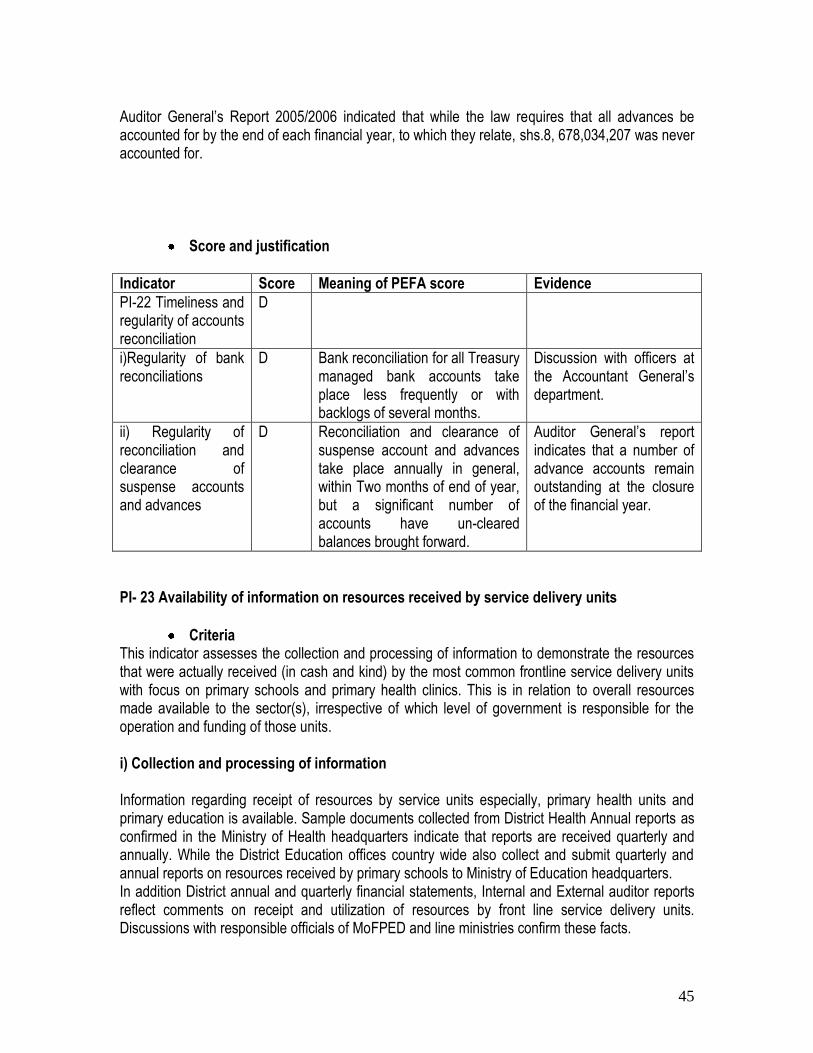
45
Auditor General‟s Report 2005/2006 indicated that while the law requires that all advances be accounted for by the end of each financial year, to which they relate, shs.8, 678,034,207 was never accounted for.
Score and justification
Indicator Score Meaning of PEFA score Evidence
PI-22 Timeliness and regularity of accounts reconciliation
D
i)Regularity of bank reconciliations
D Bank reconciliation for all Treasury managed bank accounts take place less frequently or with backlogs of several months.
Discussion with officers at the Accountant General‟s department.
ii) Regularity of reconciliation and clearance of suspense accounts and advances
D Reconciliation and clearance of suspense account and advances take place annually in general, within Two months of end of year, but a significant number of accounts have un-cleared balances brought forward.
Auditor General‟s report indicates that a number of advance accounts remain outstanding at the closure of the financial year.
PI- 23 Availability of information on resources received by service delivery units
Criteria This indicator assesses the collection and processing of information to demonstrate the resources that were actually received (in cash and kind) by the most common frontline service delivery units with focus on primary schools and primary health clinics. This is in relation to overall resources made available to the sector(s), irrespective of which level of government is responsible for the operation and funding of those units. i) Collection and processing of information Information regarding receipt of resources by service units especially, primary health units and primary education is available. Sample documents collected from District Health Annual reports as confirmed in the Ministry of Health headquarters indicate that reports are received quarterly and annually. While the District Education offices country wide also collect and submit quarterly and annual reports on resources received by primary schools to Ministry of Education headquarters. In addition District annual and quarterly financial statements, Internal and External auditor reports reflect comments on receipt and utilization of resources by front line service delivery units. Discussions with responsible officials of MoFPED and line ministries confirm these facts.
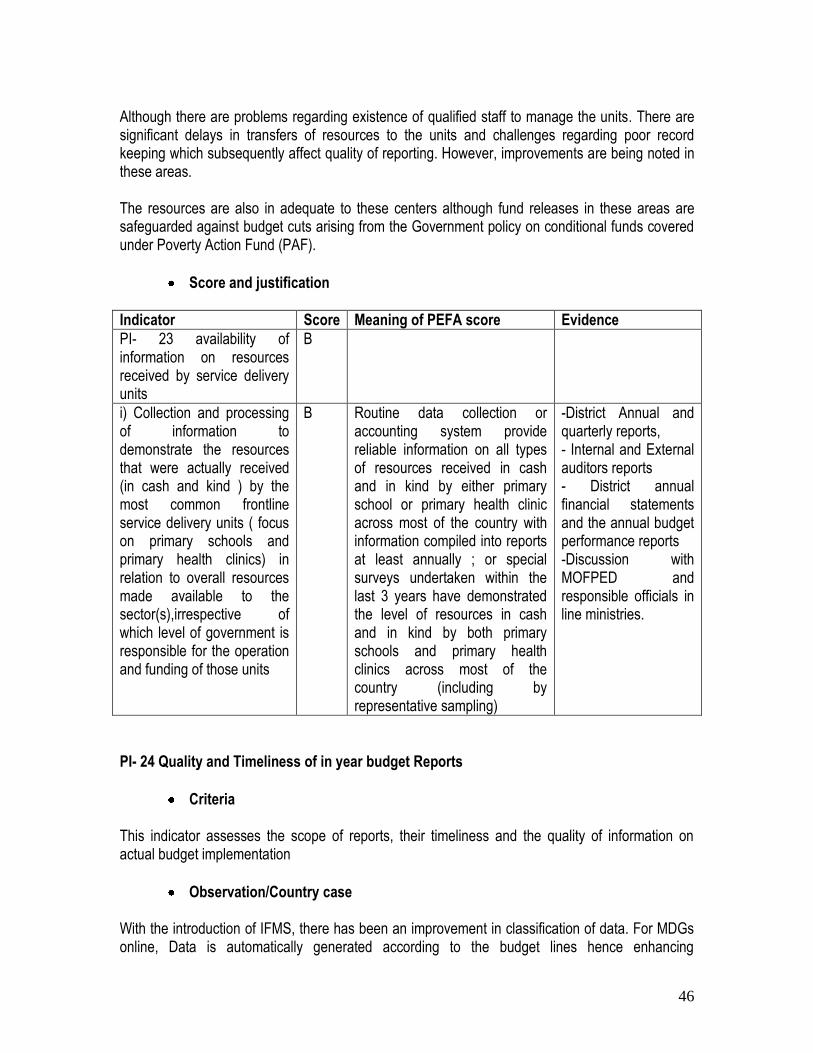
46
Although there are problems regarding existence of qualified staff to manage the units. There are significant delays in transfers of resources to the units and challenges regarding poor record keeping which subsequently affect quality of reporting. However, improvements are being noted in these areas. The resources are also in adequate to these centers although fund releases in these areas are safeguarded against budget cuts arising from the Government policy on conditional funds covered under Poverty Action Fund (PAF).
Score and justification
Indicator Score Meaning of PEFA score Evidence
PI- 23 availability of information on resources received by service delivery units
B
i) Collection and processing of information to demonstrate the resources that were actually received (in cash and kind ) by the most common frontline service delivery units ( focus on primary schools and primary health clinics) in relation to overall resources made available to the sector(s),irrespective of which level of government is responsible for the operation and funding of those units
B Routine data collection or accounting system provide reliable information on all types of resources received in cash and in kind by either primary school or primary health clinic across most of the country with information compiled into reports at least annually ; or special surveys undertaken within the last 3 years have demonstrated the level of resources in cash and in kind by both primary schools and primary health clinics across most of the country (including by representative sampling)
-District Annual and quarterly reports, - Internal and External auditors reports - District annual financial statements and the annual budget performance reports -Discussion with MOFPED and responsible officials in line ministries.
PI- 24 Quality and Timeliness of in year budget Reports
Criteria This indicator assesses the scope of reports, their timeliness and the quality of information on actual budget implementation
Observation/Country case With the introduction of IFMS, there has been an improvement in classification of data. For MDGs online, Data is automatically generated according to the budget lines hence enhancing
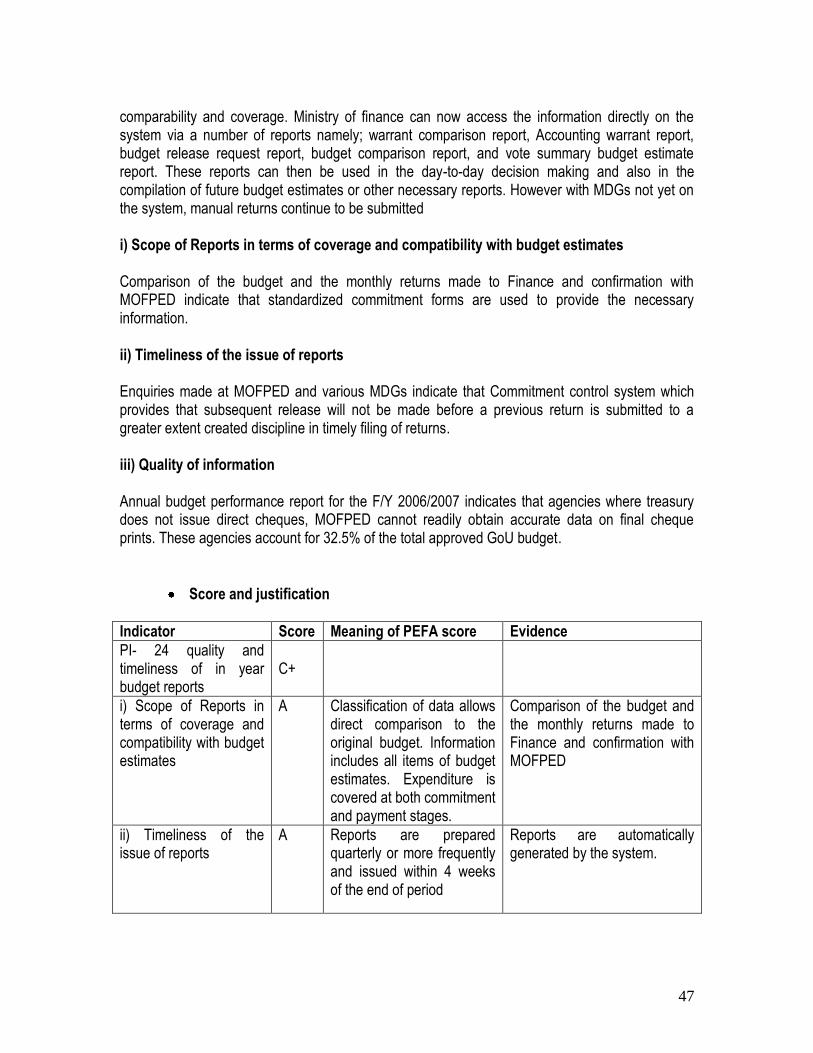
47
comparability and coverage. Ministry of finance can now access the information directly on the system via a number of reports namely; warrant comparison report, Accounting warrant report, budget release request report, budget comparison report, and vote summary budget estimate report. These reports can then be used in the day-to-day decision making and also in the compilation of future budget estimates or other necessary reports. However with MDGs not yet on the system, manual returns continue to be submitted i) Scope of Reports in terms of coverage and compatibility with budget estimates Comparison of the budget and the monthly returns made to Finance and confirmation with MOFPED indicate that standardized commitment forms are used to provide the necessary information. ii) Timeliness of the issue of reports Enquiries made at MOFPED and various MDGs indicate that Commitment control system which provides that subsequent release will not be made before a previous return is submitted to a greater extent created discipline in timely filing of returns. iii) Quality of information Annual budget performance report for the F/Y 2006/2007 indicates that agencies where treasury does not issue direct cheques, MOFPED cannot readily obtain accurate data on final cheque prints. These agencies account for 32.5% of the total approved GoU budget.
Score and justification
Indicator Score Meaning of PEFA score Evidence
PI- 24 quality and timeliness of in year budget reports
C+
i) Scope of Reports in terms of coverage and compatibility with budget estimates
A Classification of data allows direct comparison to the original budget. Information includes all items of budget estimates. Expenditure is covered at both commitment and payment stages.
Comparison of the budget and the monthly returns made to Finance and confirmation with MOFPED
ii) Timeliness of the issue of reports
A Reports are prepared quarterly or more frequently and issued within 4 weeks of the end of period
Reports are automatically generated by the system.
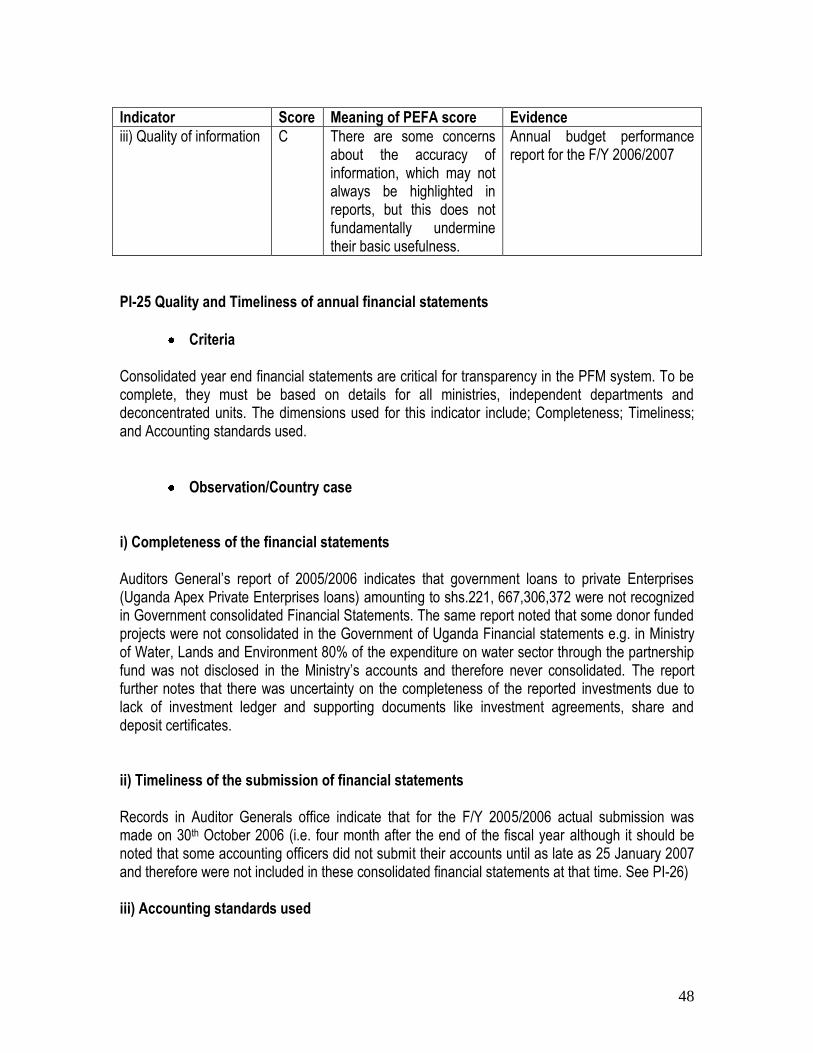
48
Indicator Score Meaning of PEFA score Evidence
iii) Quality of information
C There are some concerns about the accuracy of information, which may not always be highlighted in reports, but this does not fundamentally undermine their basic usefulness.
Annual budget performance report for the F/Y 2006/2007
PI-25 Quality and Timeliness of annual financial statements
Criteria Consolidated year end financial statements are critical for transparency in the PFM system. To be complete, they must be based on details for all ministries, independent departments and deconcentrated units. The dimensions used for this indicator include; Completeness; Timeliness; and Accounting standards used.
Observation/Country case i) Completeness of the financial statements Auditors General‟s report of 2005/2006 indicates that government loans to private Enterprises (Uganda Apex Private Enterprises loans) amounting to shs.221, 667,306,372 were not recognized in Government consolidated Financial Statements. The same report noted that some donor funded projects were not consolidated in the Government of Uganda Financial statements e.g. in Ministry of Water, Lands and Environment 80% of the expenditure on water sector through the partnership fund was not disclosed in the Ministry‟s accounts and therefore never consolidated. The report further notes that there was uncertainty on the completeness of the reported investments due to lack of investment ledger and supporting documents like investment agreements, share and deposit certificates. ii) Timeliness of the submission of financial statements Records in Auditor Generals office indicate that for the F/Y 2005/2006 actual submission was made on 30th October 2006 (i.e. four month after the end of the fiscal year although it should be noted that some accounting officers did not submit their accounts until as late as 25 January 2007 and therefore were not included in these consolidated financial statements at that time. See PI-26) iii) Accounting standards used
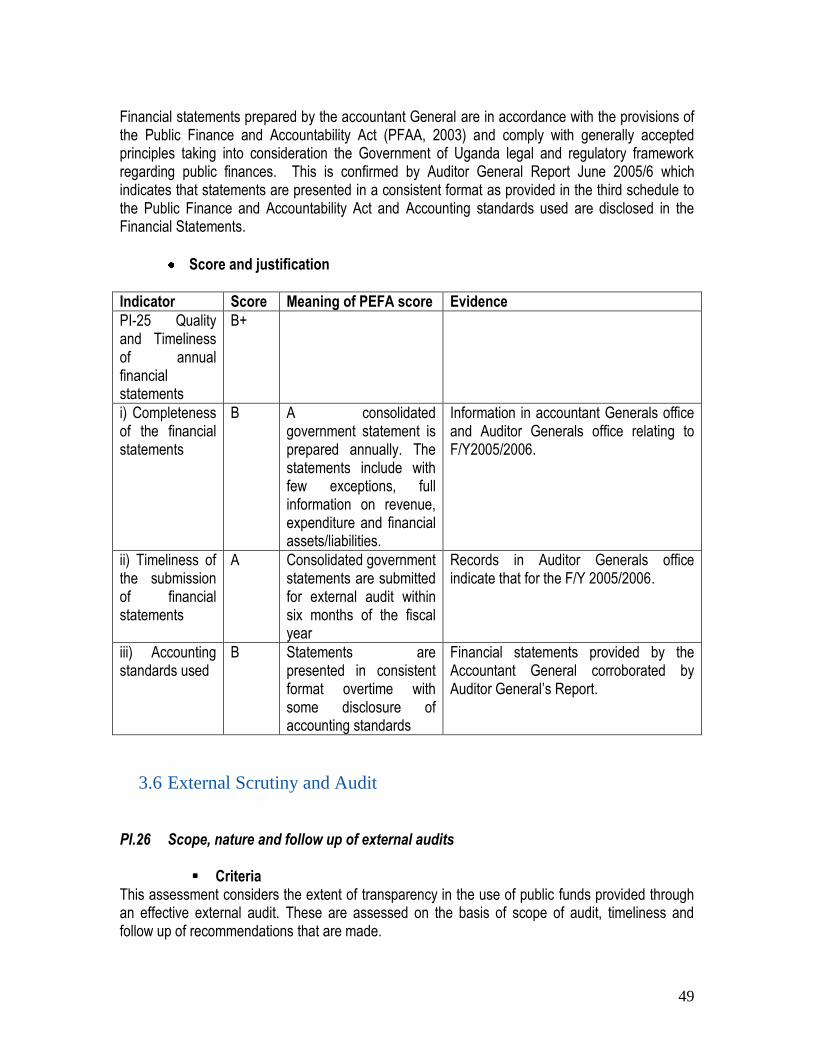
49
Financial statements prepared by the accountant General are in accordance with the provisions of the Public Finance and Accountability Act (PFAA, 2003) and comply with generally accepted principles taking into consideration the Government of Uganda legal and regulatory framework regarding public finances. This is confirmed by Auditor General Report June 2005/6 which indicates that statements are presented in a consistent format as provided in the third schedule to the Public Finance and Accountability Act and Accounting standards used are disclosed in the Financial Statements.
Score and justification
Indicator Score Meaning of PEFA score Evidence
PI-25 Quality and Timeliness of annual financial statements
B+
i) Completeness of the financial statements
B A consolidated government statement is prepared annually. The statements include with few exceptions, full information on revenue, expenditure and financial assets/liabilities.
Information in accountant Generals office and Auditor Generals office relating to F/Y2005/2006.
ii) Timeliness of the submission of financial statements
A Consolidated government statements are submitted for external audit within six months of the fiscal year
Records in Auditor Generals office indicate that for the F/Y 2005/2006.
iii) Accounting standards used
B Statements are presented in consistent format overtime with some disclosure of accounting standards
Financial statements provided by the Accountant General corroborated by Auditor General‟s Report.
3.6 External Scrutiny and Audit
PI.26 Scope, nature and follow up of external audits
Criteria
This assessment considers the extent of transparency in the use of public funds provided through an effective external audit. These are assessed on the basis of scope of audit, timeliness and follow up of recommendations that are made.
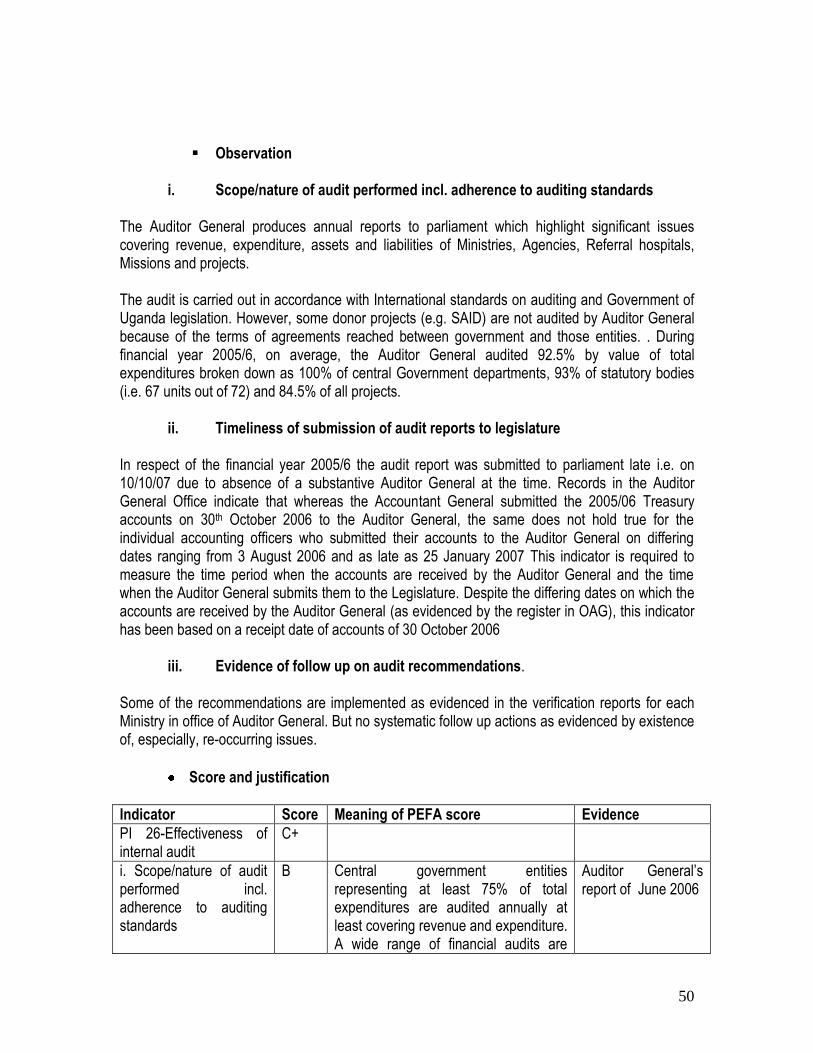
50
Observation i. Scope/nature of audit performed incl. adherence to auditing standards
The Auditor General produces annual reports to parliament which highlight significant issues covering revenue, expenditure, assets and liabilities of Ministries, Agencies, Referral hospitals, Missions and projects.
The audit is carried out in accordance with International standards on auditing and Government of Uganda legislation. However, some donor projects (e.g. SAID) are not audited by Auditor General because of the terms of agreements reached between government and those entities. . During financial year 2005/6, on average, the Auditor General audited 92.5% by value of total expenditures broken down as 100% of central Government departments, 93% of statutory bodies (i.e. 67 units out of 72) and 84.5% of all projects.
ii. Timeliness of submission of audit reports to legislature
In respect of the financial year 2005/6 the audit report was submitted to parliament late i.e. on 10/10/07 due to absence of a substantive Auditor General at the time. Records in the Auditor General Office indicate that whereas the Accountant General submitted the 2005/06 Treasury accounts on 30th October 2006 to the Auditor General, the same does not hold true for the individual accounting officers who submitted their accounts to the Auditor General on differing dates ranging from 3 August 2006 and as late as 25 January 2007 This indicator is required to measure the time period when the accounts are received by the Auditor General and the time when the Auditor General submits them to the Legislature. Despite the differing dates on which the accounts are received by the Auditor General (as evidenced by the register in OAG), this indicator has been based on a receipt date of accounts of 30 October 2006
iii. Evidence of follow up on audit recommendations.
Some of the recommendations are implemented as evidenced in the verification reports for each Ministry in office of Auditor General. But no systematic follow up actions as evidenced by existence of, especially, re-occurring issues.
Score and justification
Indicator Score Meaning of PEFA score Evidence
PI 26-Effectiveness of internal audit
C+
i. Scope/nature of audit performed incl. adherence to auditing standards
B Central government entities representing at least 75% of total expenditures are audited annually at least covering revenue and expenditure. A wide range of financial audits are
Auditor General‟s report of June 2006
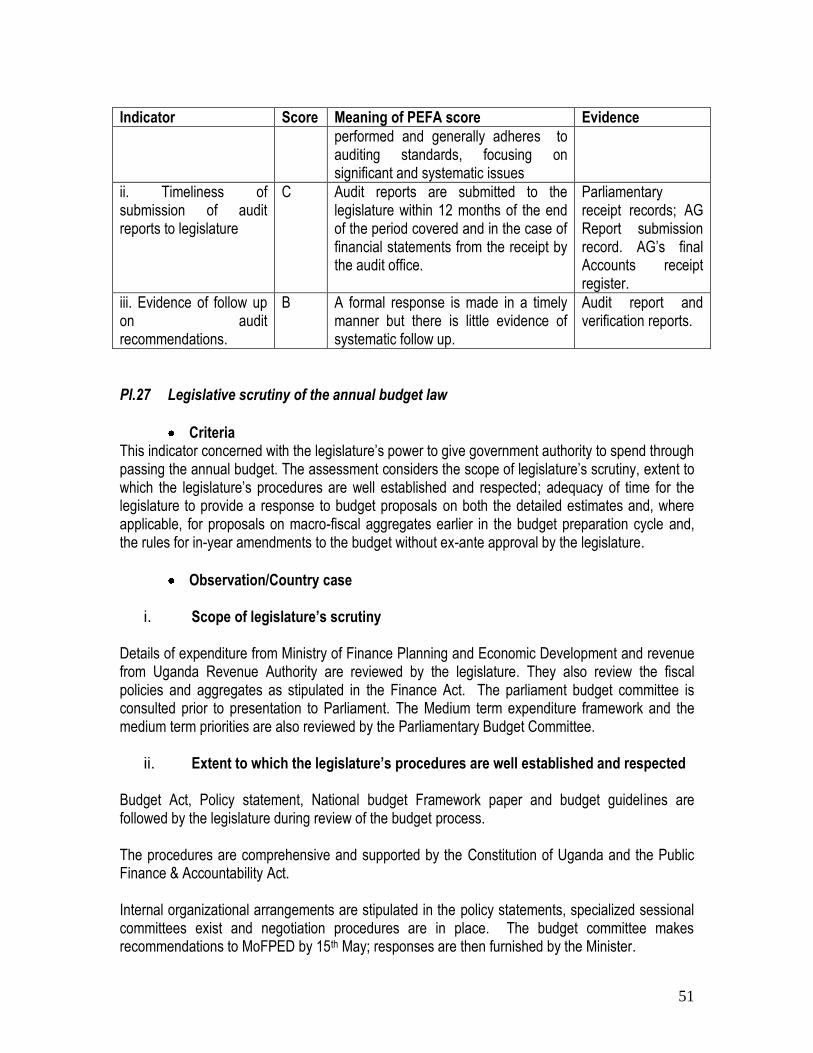
51
Indicator Score Meaning of PEFA score Evidence
performed and generally adheres to auditing standards, focusing on significant and systematic issues
ii. Timeliness of submission of audit reports to legislature
C Audit reports are submitted to the legislature within 12 months of the end of the period covered and in the case of financial statements from the receipt by the audit office.
Parliamentary receipt records; AG Report submission record. AG‟s final Accounts receipt register.
iii. Evidence of follow up on audit recommendations.
B A formal response is made in a timely manner but there is little evidence of systematic follow up.
Audit report and verification reports.
PI.27 Legislative scrutiny of the annual budget law
Criteria This indicator concerned with the legislature‟s power to give government authority to spend through passing the annual budget. The assessment considers the scope of legislature‟s scrutiny, extent to which the legislature‟s procedures are well established and respected; adequacy of time for the legislature to provide a response to budget proposals on both the detailed estimates and, where applicable, for proposals on macro-fiscal aggregates earlier in the budget preparation cycle and, the rules for in-year amendments to the budget without ex-ante approval by the legislature.
Observation/Country case
i. Scope of legislature’s scrutiny Details of expenditure from Ministry of Finance Planning and Economic Development and revenue from Uganda Revenue Authority are reviewed by the legislature. They also review the fiscal policies and aggregates as stipulated in the Finance Act. The parliament budget committee is consulted prior to presentation to Parliament. The Medium term expenditure framework and the medium term priorities are also reviewed by the Parliamentary Budget Committee.
ii. Extent to which the legislature’s procedures are well established and respected
Budget Act, Policy statement, National budget Framework paper and budget guidelines are followed by the legislature during review of the budget process.
The procedures are comprehensive and supported by the Constitution of Uganda and the Public Finance & Accountability Act.
Internal organizational arrangements are stipulated in the policy statements, specialized sessional committees exist and negotiation procedures are in place. The budget committee makes recommendations to MoFPED by 15th May; responses are then furnished by the Minister.
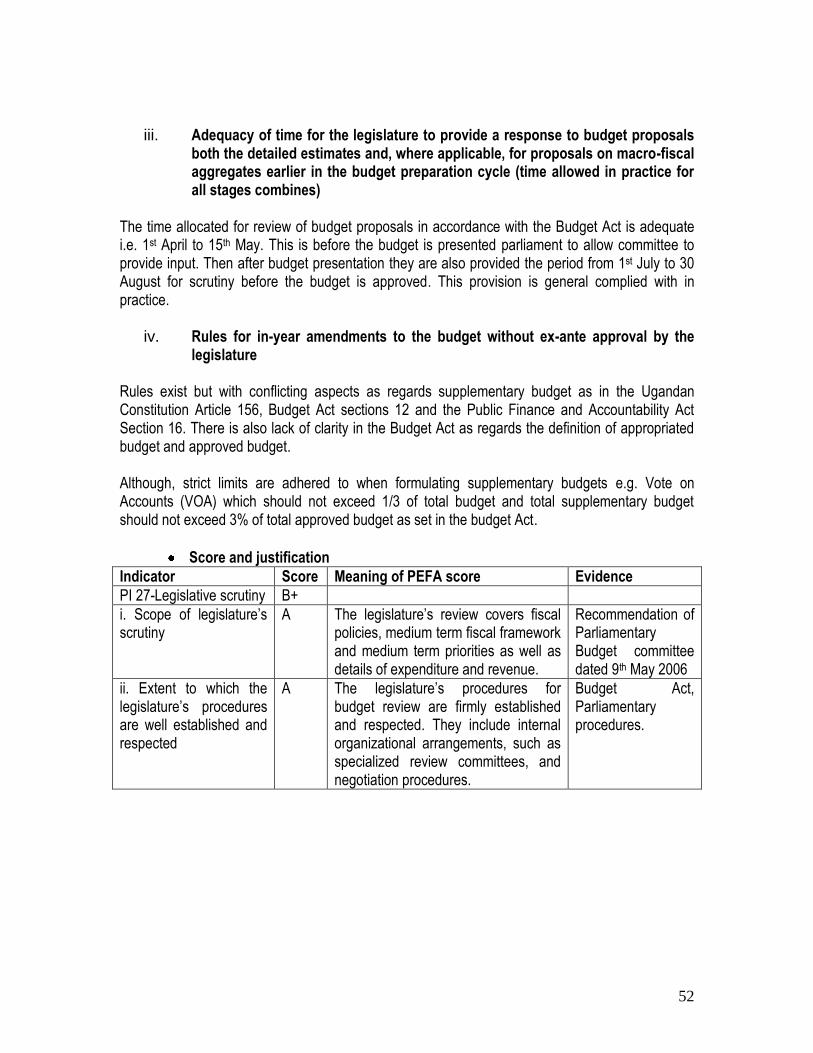
52
iii. Adequacy of time for the legislature to provide a response to budget proposals
both the detailed estimates and, where applicable, for proposals on macro-fiscal aggregates earlier in the budget preparation cycle (time allowed in practice for all stages combines)
The time allocated for review of budget proposals in accordance with the Budget Act is adequate i.e. 1st April to 15th May. This is before the budget is presented parliament to allow committee to provide input. Then after budget presentation they are also provided the period from 1st July to 30 August for scrutiny before the budget is approved. This provision is general complied with in practice.
iv. Rules for in-year amendments to the budget without ex-ante approval by the
legislature
Rules exist but with conflicting aspects as regards supplementary budget as in the Ugandan Constitution Article 156, Budget Act sections 12 and the Public Finance and Accountability Act Section 16. There is also lack of clarity in the Budget Act as regards the definition of appropriated budget and approved budget.
Although, strict limits are adhered to when formulating supplementary budgets e.g. Vote on Accounts (VOA) which should not exceed 1/3 of total budget and total supplementary budget should not exceed 3% of total approved budget as set in the budget Act.
Score and justification
Indicator Score Meaning of PEFA score Evidence
PI 27-Legislative scrutiny B+
i. Scope of legislature‟s scrutiny
A The legislature‟s review covers fiscal policies, medium term fiscal framework and medium term priorities as well as details of expenditure and revenue.
Recommendation of Parliamentary Budget committee dated 9th May 2006
ii. Extent to which the legislature‟s procedures are well established and respected
A The legislature‟s procedures for budget review are firmly established and respected. They include internal organizational arrangements, such as specialized review committees, and negotiation procedures.
Budget Act, Parliamentary procedures.
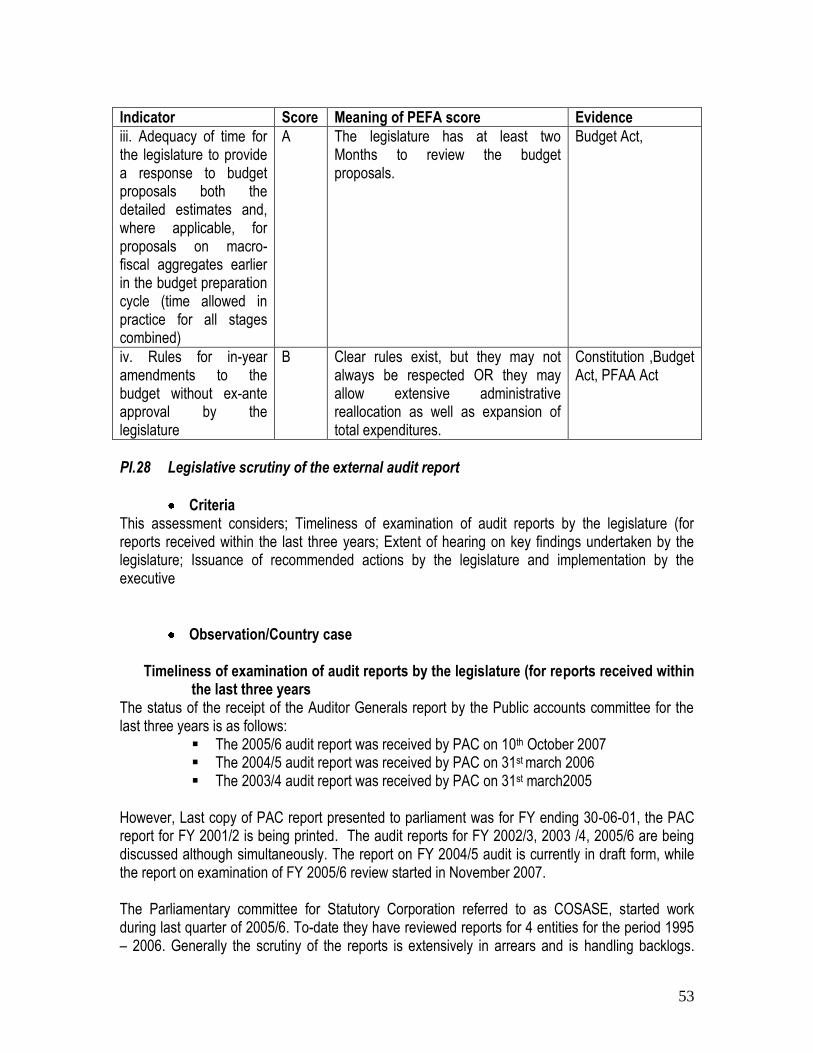
53
Indicator Score Meaning of PEFA score Evidence
iii. Adequacy of time for the legislature to provide a response to budget proposals both the detailed estimates and, where applicable, for proposals on macro-fiscal aggregates earlier in the budget preparation cycle (time allowed in practice for all stages combined)
A The legislature has at least two Months to review the budget proposals.
Budget Act,
iv. Rules for in-year amendments to the budget without ex-ante approval by the legislature
B Clear rules exist, but they may not always be respected OR they may allow extensive administrative reallocation as well as expansion of total expenditures.
Constitution ,Budget Act, PFAA Act
PI.28 Legislative scrutiny of the external audit report
Criteria This assessment considers; Timeliness of examination of audit reports by the legislature (for reports received within the last three years; Extent of hearing on key findings undertaken by the legislature; Issuance of recommended actions by the legislature and implementation by the executive
Observation/Country case
Timeliness of examination of audit reports by the legislature (for reports received within the last three years
The status of the receipt of the Auditor Generals report by the Public accounts committee for the last three years is as follows:
The 2005/6 audit report was received by PAC on 10th October 2007 The 2004/5 audit report was received by PAC on 31st march 2006 The 2003/4 audit report was received by PAC on 31st march2005
However, Last copy of PAC report presented to parliament was for FY ending 30-06-01, the PAC report for FY 2001/2 is being printed. The audit reports for FY 2002/3, 2003 /4, 2005/6 are being discussed although simultaneously. The report on FY 2004/5 audit is currently in draft form, while the report on examination of FY 2005/6 review started in November 2007. The Parliamentary committee for Statutory Corporation referred to as COSASE, started work during last quarter of 2005/6. To-date they have reviewed reports for 4 entities for the period 1995 – 2006. Generally the scrutiny of the reports is extensively in arrears and is handling backlogs.
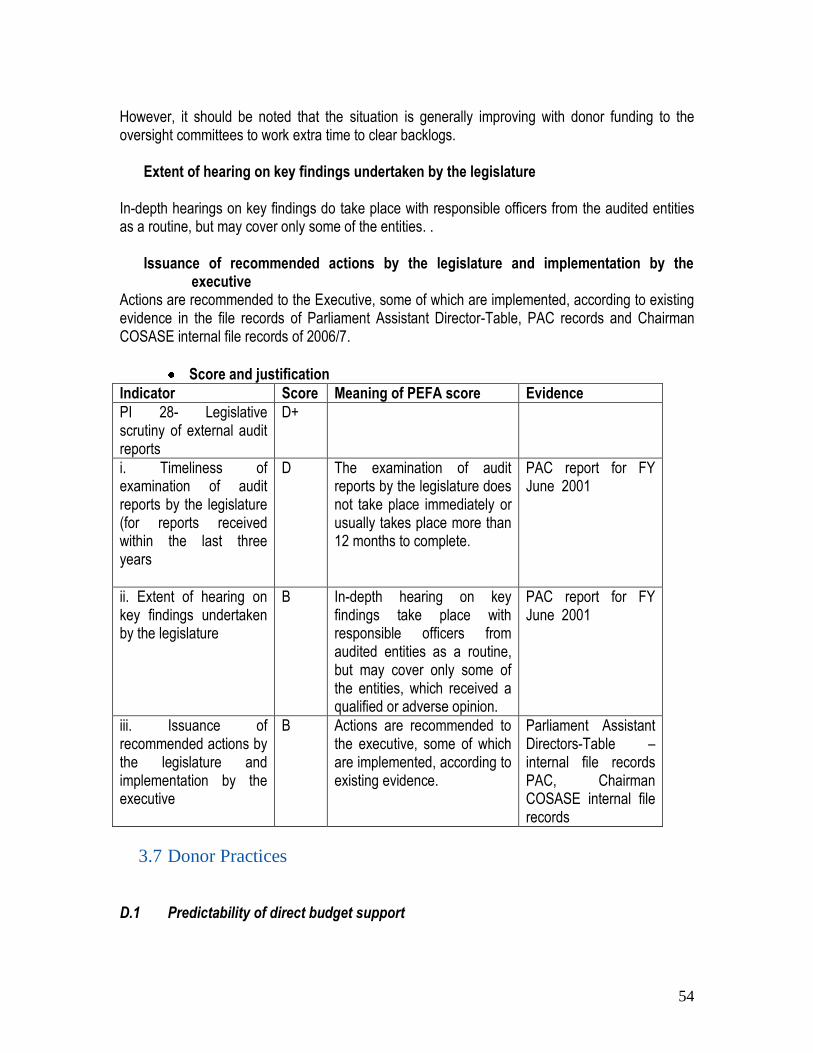
54
However, it should be noted that the situation is generally improving with donor funding to the oversight committees to work extra time to clear backlogs.
Extent of hearing on key findings undertaken by the legislature
In-depth hearings on key findings do take place with responsible officers from the audited entities as a routine, but may cover only some of the entities. .
Issuance of recommended actions by the legislature and implementation by the executive
Actions are recommended to the Executive, some of which are implemented, according to existing evidence in the file records of Parliament Assistant Director-Table, PAC records and Chairman COSASE internal file records of 2006/7.
Score and justification
Indicator Score Meaning of PEFA score Evidence
PI 28- Legislative scrutiny of external audit reports
D+
i. Timeliness of examination of audit reports by the legislature (for reports received within the last three years
D The examination of audit reports by the legislature does not take place immediately or usually takes place more than 12 months to complete.
PAC report for FY June 2001
ii. Extent of hearing on key findings undertaken by the legislature
B In-depth hearing on key findings take place with responsible officers from audited entities as a routine, but may cover only some of the entities, which received a qualified or adverse opinion.
PAC report for FY June 2001
iii. Issuance of recommended actions by the legislature and implementation by the executive
B Actions are recommended to the executive, some of which are implemented, according to existing evidence.
Parliament Assistant Directors-Table –internal file records PAC, Chairman COSASE internal file records
3.7 Donor Practices
D.1 Predictability of direct budget support
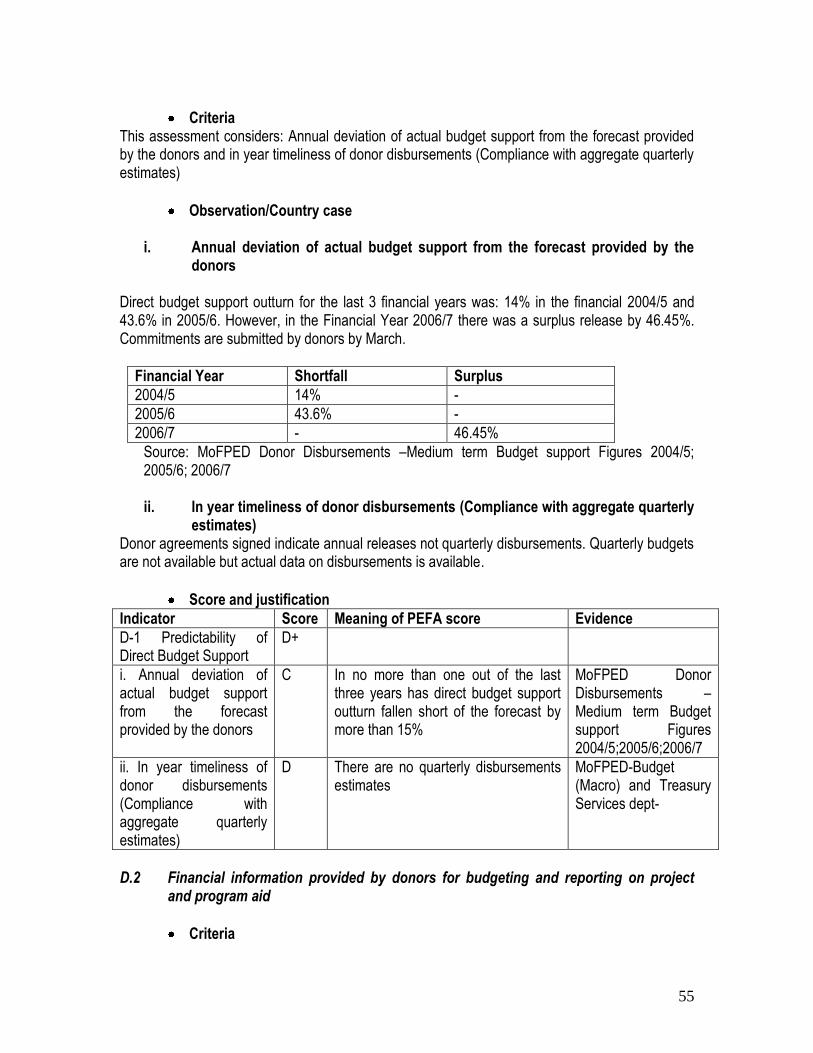
55
Criteria This assessment considers: Annual deviation of actual budget support from the forecast provided by the donors and in year timeliness of donor disbursements (Compliance with aggregate quarterly estimates)
Observation/Country case
i. Annual deviation of actual budget support from the forecast provided by the donors
Direct budget support outturn for the last 3 financial years was: 14% in the financial 2004/5 and 43.6% in 2005/6. However, in the Financial Year 2006/7 there was a surplus release by 46.45%. Commitments are submitted by donors by March.
Financial Year Shortfall Surplus
2004/5 14% -
2005/6 43.6% -
2006/7 - 46.45%
Source: MoFPED Donor Disbursements –Medium term Budget support Figures 2004/5; 2005/6; 2006/7 ii. In year timeliness of donor disbursements (Compliance with aggregate quarterly
estimates) Donor agreements signed indicate annual releases not quarterly disbursements. Quarterly budgets are not available but actual data on disbursements is available.
Score and justification
Indicator Score Meaning of PEFA score Evidence
D-1 Predictability of Direct Budget Support
D+
i. Annual deviation of actual budget support from the forecast provided by the donors
C
In no more than one out of the last three years has direct budget support outturn fallen short of the forecast by more than 15%
MoFPED Donor Disbursements –Medium term Budget support Figures 2004/5;2005/6;2006/7
ii. In year timeliness of donor disbursements (Compliance with aggregate quarterly estimates)
D
There are no quarterly disbursements estimates
MoFPED-Budget (Macro) and Treasury Services dept-
D.2 Financial information provided by donors for budgeting and reporting on project
and program aid
Criteria
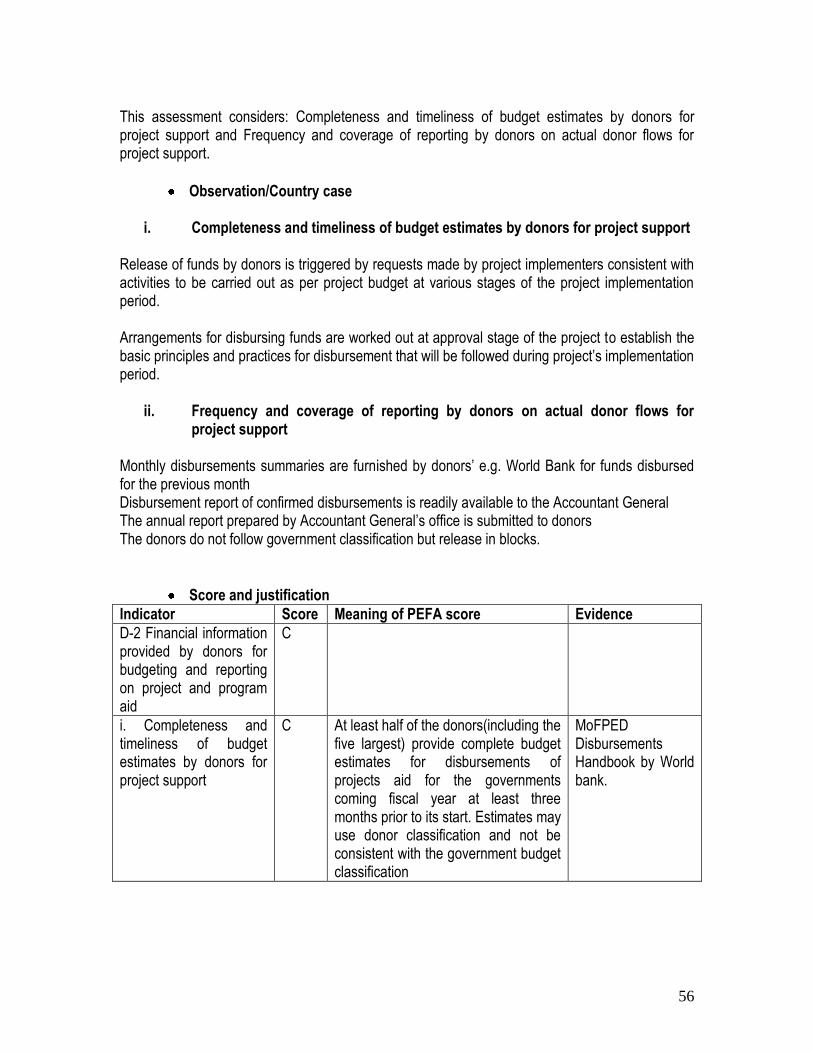
56
This assessment considers: Completeness and timeliness of budget estimates by donors for project support and Frequency and coverage of reporting by donors on actual donor flows for project support.
Observation/Country case
i. Completeness and timeliness of budget estimates by donors for project support Release of funds by donors is triggered by requests made by project implementers consistent with activities to be carried out as per project budget at various stages of the project implementation period. Arrangements for disbursing funds are worked out at approval stage of the project to establish the basic principles and practices for disbursement that will be followed during project‟s implementation period.
ii. Frequency and coverage of reporting by donors on actual donor flows for project support
Monthly disbursements summaries are furnished by donors‟ e.g. World Bank for funds disbursed for the previous month Disbursement report of confirmed disbursements is readily available to the Accountant General The annual report prepared by Accountant General‟s office is submitted to donors The donors do not follow government classification but release in blocks.
Score and justification
Indicator Score Meaning of PEFA score Evidence
D-2 Financial information provided by donors for budgeting and reporting on project and program aid
C
i. Completeness and timeliness of budget estimates by donors for project support
C
At least half of the donors(including the five largest) provide complete budget estimates for disbursements of projects aid for the governments coming fiscal year at least three months prior to its start. Estimates may use donor classification and not be consistent with the government budget classification
MoFPED Disbursements Handbook by World bank.
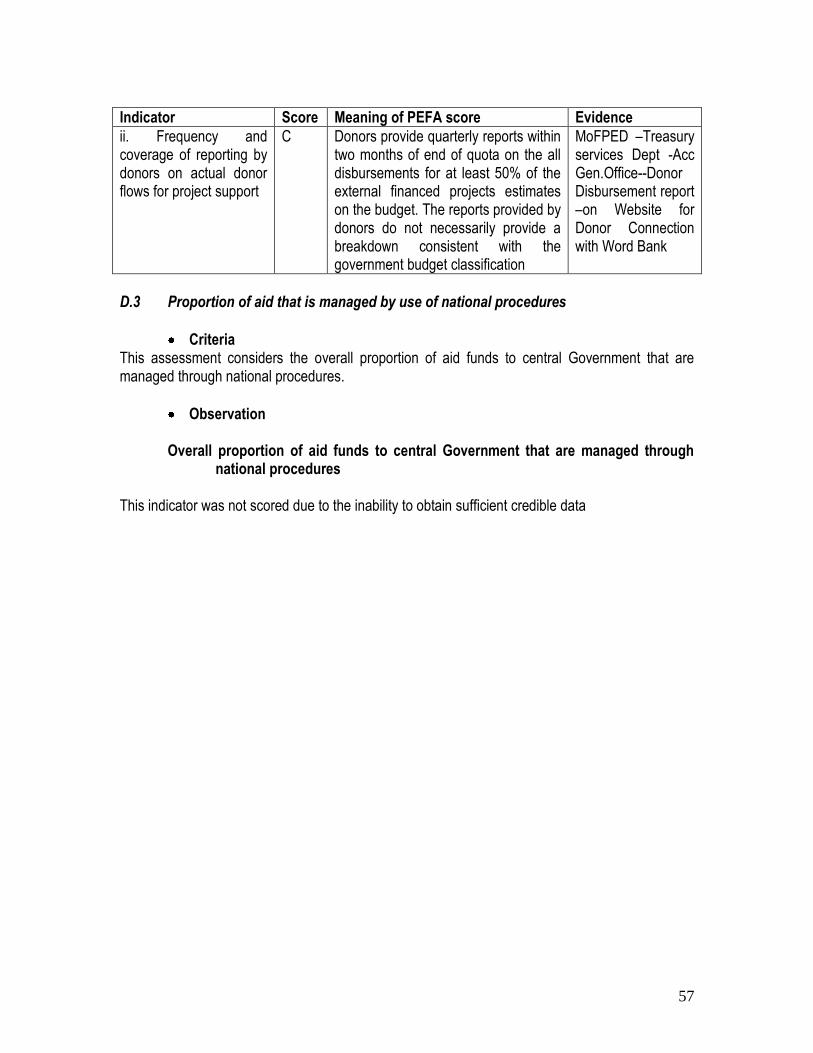
57
Indicator Score Meaning of PEFA score Evidence
ii. Frequency and coverage of reporting by donors on actual donor flows for project support
C
Donors provide quarterly reports within two months of end of quota on the all disbursements for at least 50% of the external financed projects estimates on the budget. The reports provided by donors do not necessarily provide a breakdown consistent with the government budget classification
MoFPED –Treasury services Dept -Acc Gen.Office--Donor Disbursement report –on Website for Donor Connection with Word Bank
D.3 Proportion of aid that is managed by use of national procedures
Criteria This assessment considers the overall proportion of aid funds to central Government that are managed through national procedures.
Observation Overall proportion of aid funds to central Government that are managed through
national procedures This indicator was not scored due to the inability to obtain sufficient credible data
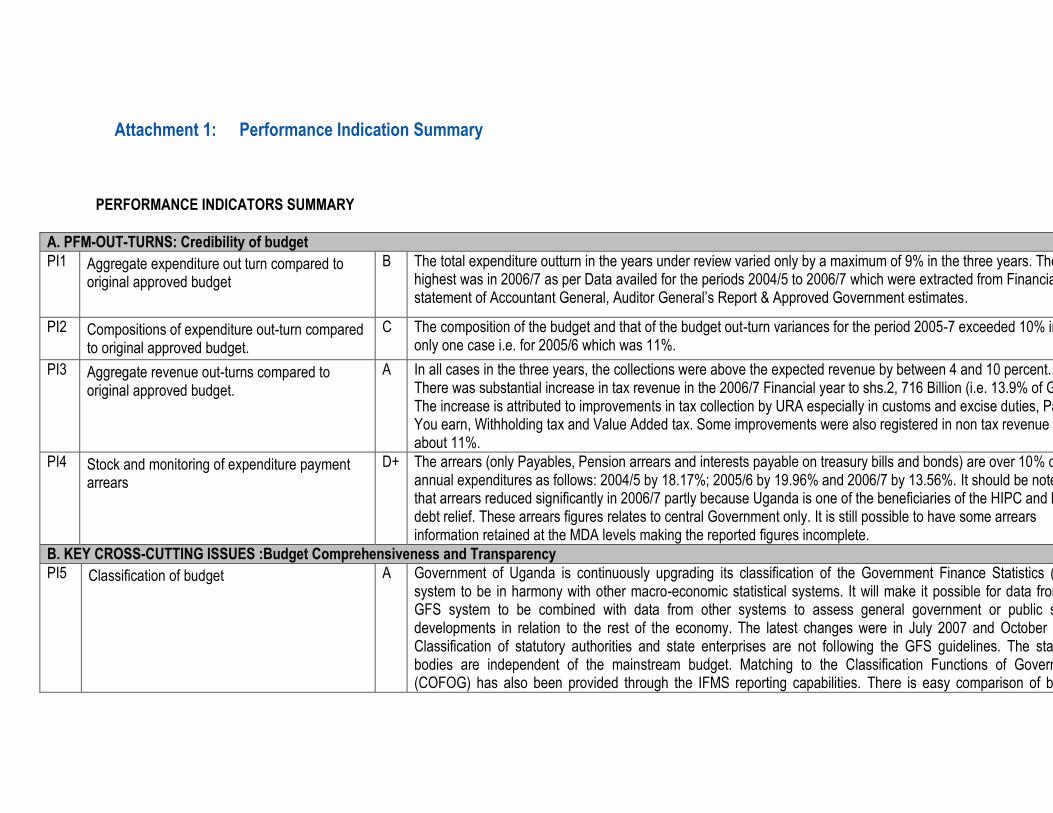
Attachment 1: Performance Indication Summary
PERFORMANCE INDICATORS SUMMARY
A. PFM-OUT-TURNS: Credibility of budget
PI1 Aggregate expenditure out turn compared to original approved budget
B The total expenditure outturn in the years under review varied only by a maximum of 9% in the three years. The highest was in 2006/7 as per Data availed for the periods 2004/5 to 2006/7 which were extracted from Financial statement of Accountant General, Auditor General‟s Report & Approved Government estimates.
PI2 Compositions of expenditure out-turn compared to original approved budget.
C The composition of the budget and that of the budget out-turn variances for the period 2005-7 exceeded 10% in only one case i.e. for 2005/6 which was 11%.
PI3 Aggregate revenue out-turns compared to original approved budget.
A In all cases in the three years, the collections were above the expected revenue by between 4 and 10 percent. There was substantial increase in tax revenue in the 2006/7 Financial year to shs.2, 716 Billion (i.e. 13.9% of GDP). The increase is attributed to improvements in tax collection by URA especially in customs and excise duties, Pay As You earn, Withholding tax and Value Added tax. Some improvements were also registered in non tax revenue by about 11%.
PI4 Stock and monitoring of expenditure payment arrears
D+ The arrears (only Payables, Pension arrears and interests payable on treasury bills and bonds) are over 10% of the annual expenditures as follows: 2004/5 by 18.17%; 2005/6 by 19.96% and 2006/7 by 13.56%. It should be noted that arrears reduced significantly in 2006/7 partly because Uganda is one of the beneficiaries of the HIPC and MDRI debt relief. These arrears figures relates to central Government only. It is still possible to have some arrears information retained at the MDA levels making the reported figures incomplete.
B. KEY CROSS-CUTTING ISSUES :Budget Comprehensiveness and Transparency
PI5 Classification of budget A Government of Uganda is continuously upgrading its classification of the Government Finance Statistics (GFS) system to be in harmony with other macro-economic statistical systems. It will make it possible for data from the GFS system to be combined with data from other systems to assess general government or public sector developments in relation to the rest of the economy. The latest changes were in July 2007 and October 2007. Classification of statutory authorities and state enterprises are not following the GFS guidelines. The statutory bodies are independent of the mainstream budget. Matching to the Classification Functions of Government (COFOG) has also been provided through the IFMS reporting capabilities. There is easy comparison of budget
59
appropriation with expenditure. The codes used in financial statements are now comparable with the budget codes. PFAA and Accounting Regulations require a budget performance report that compares with budgeted expenditures. The systems classify expenditure transactions by economic classification as well as tracking of spending by administrative units, economic classification, and functional classification.
PI6 Comprehensiveness of information included in budget
A The recent budget documentation fulfils 7-9 of the 9 information benchmarks i.e. Macro-economic assumptions, including at least estimates of aggregate growth, inflation and exchange rate; Debt stock, including details at least for the beginning of the current year; Financial Assets, including details at least for the beginning of the current year; Prior year‟s budget outturn, presented in the same format as the budget proposal; Current year‟s budget (either the revised; Summarized budget data for both revenue and expenditure according to the main heads of the classifications used (ref. PI-5), including data for the current and previous year; Explanation of budget implications of new policy initiatives, with estimates of the budgetary impact of all major revenue policy changes and/or some major changes to expenditure programs. While the following 2 criteria are not fulfilled: Fiscal deficit, defined according to GFS or other internationally recognized standard and; Deficit financing, describing anticipated composition.
PI7 Extent of unreported government operations. B+ Under reporting appears under Non tax revenue (NTR). Although previously collected by ministries and now taken over by the URA, it form part of the Domestic Revenues collection. Most NTR collections in Agencies, Referral Hospitals, Embassies and Missions are collected by respective bodies and remitted to consolidated fund. Although, Universities NTR is budgeted for, the actual collections are not consolidated in the financial statements. Under- budgeting of NTR in ministries and Embassies/missions were noted. While the ministries remit in all collections to the consolidation funds others spend at source. Under-budgeting of NTR excluding Public Universities is above 14% and the un- reported NTR in estimated to be above 2%. For financial year 2006/7, 84.48% of grants were managed through the national procedures. Clear policy on consolidation of project financial statements is lacking.
PI8 Transparency of Inter – Governmental Fiscal Relations
D+ Local government Commission formulated Draft criteria in 2004 on allocation criteria, but never forwarded to Cabinet for approval by Ministry of Local Government. The proposal was funded by DANIDA in 2002. Current grant allocation criterion is in line with the PEAP to a greater extent. The funds allocated to Local Governments as Grants are determined each year on a basis guided by the Local Government Long term View of its Poverty alleviation strategy and sector Medium term Expenditure Frame work (MTEF).The major problem inherent in the effective allocation of Grants is the absence of District level poverty data aggregated for rural and local Governments for
60
equitable allocation of resources. Local Governments Indicative Planning Figures (IPF) received at an early stage is not reliable until the national budget is read. Government transfers are generally predictable because of release protection” under the Poverty Action Fund and the Constitutional protection for the un-conditional grant. Poverty action Funds releases are monthly and approved quarterly subject to submission of accountability of the previous quarter.Un-conditional grants are released unconditionally. Graduated tax compensation releases have not been predictable and reliable. Districts and Urban councils produce Financial statements and at least 50% of the number are Audited within the statutory time frame but are not consolidated into the national financial statements. Their incomes are appropriated through their own budget proposals to their Councils.
PI9 Oversight of aggregate fiscal risk from other public sector entities
C A number of organizations (e.g. 5) have either failed to produce financial statements for Audit by the Auditor General and others (at least 23) have un- submitted backlog of financial statements. Section 20 of the Public Finance and Accountability Act 2003 vests authority to obtain any loan to the Minister of MoFPED with the approval of parliament; however the fiscal monitoring is limited to only Conditional funds released from the Central Government. Lower governments (Sub counties) are in arrears in submitting financial statements for Audit and 65 higher Local Governments in 2006/7. The Ministry of Finance through FINMAP project is financing the Audit of Lower Councils, the latest audit being 2004/5.
PI10 Public Access to Key fiscal information C The government makes available to the public 1-2 of the 6 listed types of information. The following are easily availed in the appropriate manner: External audit reports (The Audited consolidated financial statements are distributed to all members of Parliament, and other key stake holders. The Public is informed through the press on the contentious issues during parliament discussion. However, it should be noted that the Parliament does not discuss these reports in time) and; Resources available to primary service units (The Budget book gives details of the resource envelope to National Sub Governments and this information is on the Website of the Ministry of Finance; however Budget information is not Published in print Media. Additionally, all monthly releases are publicized monthly in print media detailing every budget component released to the District. The releases are also posted at all Service delivery units notice boards). While the following are not availed in the appropriate manner: Annual budget documentation, In year budget execution reports, Year-end financial statements and contract awards( of all contracts with a value approx. 100,000 published at least quarterly)
C. BUDGET CYCLE
C(i) Policy Based Budgeting
61
PI11 Orderliness and participation in the annual budget process
B MoFPED is the main driver of the annual budget formulation process in Uganda Government budget process. MDAs and political leadership effectively participate in the budget formulation process. The budget clearly reflects macro-economic, fiscal and sector policies. This process involves full participation of all parties in an integrated top-down and bottom-up budgeting process in a clear order and timely manner. The process is done following stipulated budget formulation calendar. Section 2 of GOU Budget Act 2001 prescribes the process that enables the identification of measures for the efficient allocation of expenditures among sectors to meet national objects. For that purpose a budget circular is usually issued to request MDAs to prepare Sector Budget Framework Papers (BFPs) for the Financial Year and the Medium Term; to re-emphasize policy and administrative guidelines for the development of the Budget for the Financial Year; and to provide indicative three-year Medium Term Expenditure Framework (MFEF) ceilings with the first year as the basis for allocations of the expenditure estimates for the Financial Year. The GoU budget Circular clearly outlines the requirements and a timetable for preparation of budget estimates. Cabinet determines priorities such as Rural and Industrial growth strategy as defined in the previous budgets. Almost 2 months are allowed for the preparation of line Ministry estimates. The Parliament yearly debates the draft estimates between July and September and approves the budget in October. There are Internal regulations which allow the Parliament to make recommendations for changes or to reject the budget. The GoU budget appropriations fort the three years have usually been approved within 4 months into the fiscal year. For example, the budget for 2006/07 was approved on 26th October, 2006. However, the Constitution under article 154 (4) provides for the President to authorize money from Consolidated Fund for meeting expenses up to 4 months into the fiscal year. The budgets are always approved before the expiry of 4 months.
PI12 Multi-year perspective in fiscal planning, expenditure policy and budgeting
B+ Forecasts of fiscal aggregates on the basis of main categories of economic and functional/sector classification are prepared for three years but now made for five years on a rolling annual basis. The current Budget framework paper document for 2008/2009 gives forecast for five years while the previous one of 2006/7 gave estimates for three years i.e. from 2006/7 to 2008/9. Debt sustainability analysis for external and foreign debts is done periodically. The most recent one within the last
62
threes years, named Joint Bank Fund Debt Sustainability Analysis (DSA), was done in 2006 as per report dated 1st December 2006. Strategies for sectors representing at least 75% of primary expenditure exist with full costing of recurrent and investment expenditure, broadly consistent with fiscal forecasts. All the main sectors have strategies which are also reflected in Policy statements issued yearly. For example, Education sector (24.29 %), Health sector (8.62%), Roads & Works (6.34%), Water and sanitation (2.49%), Agriculture sector (3.23%), Economic Function & Social Services (12.69%), Accountability (3.13%), Justice, Law and Order (6.75%), Public Administration (10.69%), Public Sector Management (8.38%) and Security (13.39%) as per annual budget performance report of FY 2006/07. Public Sector Investment Plans for 2006/07 are available on which majority of important investments are selected. This selection is on the basis of relevant sector strategies and recurrent cost implications in accordance with sector allocations and included in forward budget estimates for the sector.
C(ii) Predictability and Control in budget execution
PI13 Transparency of taxpayer obligations and liabilities
B GoU has current legislation and procedures for all major taxes which are the back borne of all the taxes in Uganda. Clear information fliers exist and explain how the laws are to be applied such as East African custom unions‟ protocol, Tax payers guide on customs value. Strict limited discretionary powers exist only in the Minister of Finance who has prerogative of tax waiver powers on e.g. for expatriate staff, Donor projects. URA has proper tax education arrangement and the responsible office is of the Assistant Commissioner Public and Corporate affairs. The office issues pamphlets explaining rights and obligations of tax payers, sponsor radio programs and newspaper articles to educate people on tax matters. This include activities such as arranging Tax payers‟ day, tax clinics, tax meetings, radio talk shows, tax information through tax payer cartoon magazine, booklets of frequently asked questions (FAQ), posters and call centre. There is also tax posters translated into several local languages although the method used only targets mostly the urban centre and some of the information are not up to date. The Information covers only the major taxes. A separate independent tax appeal system and tribunal exist. While the tax tribunal was meant to be fair to all parties and work in harmony, the tribunals as well as URA are in disagreement on a number of cases resulting in counter complaints against each other. The appeals system is also not effective e.g. in 2006/7 out of 40 cases filed
63
only 5 cases were discharged during that year. Currently it is even not operating due to the internal problems.
PI14 Effectiveness of measures for taxpayers registration and tax assessment
D+ URA existing system is not integrated and is currently working on the introduction of an Integrated Tax Administration System (ITAS). It is also not linked to any other registration systems in the country such as with banking institutions, Investment Authority, etc although tax payer‟s data base is available in form of Tax Identification Numbers (TIN) and VAT numbers. It is hoped that after ITAS is introduced, it will be integrated with Banks, etc. No structured system exists in URA for following up non compliance to registration and declaration requirements. However there has been increased vigilance by management to ensure that the public is made aware of the registration and declaration obligations and the resultant penalties in cases of non compliance. Several tax education seminars have been held to try and address this problem. Although planning and monitoring of tax audit and fraud investigation programs have been carried out in the past, it is not based on documented risk assessment criteria.
PI15 Effectiveness in collection of tax payments D+ Their is no accurate information about tax arrears to enable calculation of collection ratio for gross tax arrears as percentage of tax arrears at the beginning of a fiscal year collected during that fiscal year. Tax collection transfers to the treasury by URA are effective and are done to the consolidated fund account weekly. Complete accounts reconciliation between tax assessments, collections, arrears records and receipts by the treasury is not done. URA only has plans to introduce it in future.
PI16 Predictability in the availability of funds for the commitment of expenditures
C+ Cash flow forecast is prepared for the fiscal year, monitored and updated at least quarterly on the basis of actual inflows and outflows as reflected in the loose minutes of MOFPED from Macro department to Development budget on revenue. In-year information to MDAs on ceilings for expenditure commitment is provided at least quarterly in advance by way of Cash limits as adviced by MOFPED. The ministry also makes changes frequently but mostly quarterly about adjustments to budget allocations and is normally explained although it may not be uniform across MDAs.
PI17 Recording and management of cash balances, debt and guarantees
D+ The Government of Uganda (Accountant General) debt data recording and reporting is managed through Debt Management and Financial Accountability Software (DMFAS). This is a soft ware which maintains Debt Amortization Schedule showing: Opening Balance, Additions in the year and repayments. Debt reconciliation between Bank of Uganda (BOU) and Accountant Generals Office is done quarterly. The record of the Main Donors (World Bank and African Development Bank) is very clear. For World Bank, there is a website called “Donor Connection with Word Bank” with up to date information regarding funding position for
64
every country showing: Opening Balance, Additions, and Repayments in the period and the balance outstanding. Differences of records with the affected beneficiary country are cleared in writing. The Banks i.e. WB and ADB (the Creditors) send their billing for repayments semi-annually, implying reconciliation/ verification of balances is done semi-annually. Aspects of domestic arrears and other foreign debts are un-clear as reflected partly under indicator 4. It is therefore difficult to establish the total indebtedness of the country as also reflected by Auditor General in his report of June 2006 and 2007. Consolidation of Government cash balances is done quarterly except for first quarter. It is done for all votes and government funded projects. However, educational institutions, donor funded projects and other Government Agencies on accrual accounting are not consolidated. In this category are: Universities, UMI, LDC, Coffee Development Authority, Cotton Development Authority, National Forest Authority (NFA), etc. Currently the Accountant General‟s Office is working to produce Manuals for consolidation and transaction capturing expected to make consolidation more systematic and transparent and may become operational by July 2008. Although the system for contracting loans and issuance of guarantees are spelt out in the Public Finance and Accountability Act section 20 to 26 and is generally done transparently, Auditor General‟s report of June 2006, reflected a borrowing of Shs. 4,231,364,000= from Bank of Uganda which lacked evidence of Parliamentary approval.
PI18 Effectiveness of payroll controls D+ There is no integrated record reconciliation system between personnel records and payroll data at the three levels i.e. the Parent Ministry, Department or Agency, the Ministry of Public Service (MoPS) and MoFPED-Data Centre. Although some linkages exist between the three levels, the data consistency still pose a challenge in regards e.g. personal details such as date of birth, date of appointment, confirmation status, promotion etc and may be different in the various records in respect of the same person. Monthly payroll submitted by MoFPED-data centre is checked monthly by Personnel office of each agency for consistency before payments are made and reconciliation of information is done once annually. However, there is monthly salary payment return to MoPS to reveal balances on salary account i.e. a form of monthly accountability. Failure by an agency to make the monthly return may make it possible for such agency salary to be withheld. This arrangement provides MoPS to monitor salary payment performance. Despite these, the integrity of the payroll is significantly undermined by inconsistencies in personnel records and personnel database. Special audit report in
65
Ministry of Works by Auditor General and routine audit by Internal audit revealed significant finding showing apparent loopholes in data integrity The required changes to personnel records and payment take time ranging from three months to beyond a year especially regarding the pensions payroll. New entrants can take up to six months while pensioners can take years to exit salary and enter pension payroll; Reference to Auditor General‟s report of June 2006 and special investigation in Ministry of works payroll in addition to Internal audit reports reveal situation of existence of overstay of names of employees who have long left Government service. Control exist in the process of initiating changes to personnel records since all changes must be supported by documents such as appointment letters , minute of appointment of PSC to support including anyone on payroll etc. Usually the affected staff initiates the process stating the concern for the need to change personnel records in the payroll. The Personnel office of each agency also monthly verifies payroll submitted by MoFPED-data centre for consistency before payments are effected as another form of internal control but the time given for the Personnel office to verify the monthly payroll records before payment is not adequate for meaningful verification. Even audit reports on payroll revealed such findings as illegal entry to payroll; Leavers of service due to various reasons ranging from retirement, resignation and death take long to be deleted from the Ministry‟s payroll. Although payroll audit is periodically done by internal audit at ministry levels with the latest being for the months of July, August and September 2007 covering 31 MDAs and the annual audit report of Auditor General also covering the payroll and salary as one major account area, the situation especially in the Local Governments is different with apparently no reported Payroll audits.
PI19 Competition, value for money and controls in procurement
C According to PPDA Act, all purchases more than USD 200,000 must go through competitive bidding and requires publication inform of Annual reports and press releases in print media and also posted on PPDA website. However, the latest report done was in December 2006. There was, therefore, insufficient data to assess the methods used to award public contracts. No detailed reports to show the extent of justification for use of less competitive procurement method were availed. However, some instances of doubtful justifications for use of non competitive procurement method are reported in the press that raises a lot of concern.
66
The PPDA Act Part VII under Administrative reviews spells out procurement complaints mechanisms which states that: “A bidder may seek administrative review for any omission or breach by a procuring and disposing entity under this Act, or any regulations or guidelines made under this Act or of the provisions of bidding documents, including best practices.‟ The complaint may be first handled by the Accounting Officer within 14days. If not satisfied or there are delays without and reason, an appeal will then be handled by the PPDA within 7 days. The Authority issue its decision within twenty-one working days after receiving the complaint, stating the reasons for its decision and remedies granted, if any, and their decision shall be final. No detailed report of complaint resolution was availed to assess whether the system is operational although it was set in 2006.
PI20 Effectiveness of internal controls for non salary expenditure
C The Government uses commitment Control system on integrated Financial Management system (IFMS). However, benefit of compliance with the expenditure commitment controls is still not fully achieved as evidenced by MDA reported stock of arrears annually and reflected under PI 4. Commitments are normally not allowed until available cash is sufficient in bank accounts of MDA. But internal audit reports and Auditor General Reports reveal a number of instances of non compliance or circumvention of the Commitment Control Systems (CCS). The level of anomalies reported both by Office of Auditor General and internal audit report on financial management is an indicator that some levels of internal controls are not properly understood by Management. Despite existence of a set of basic internal controls rules and procedures for processing and recording transactions. Generally there a good degree of compliance with rules for processing and recording transactions exist as evidenced in the various reports produced by management. However, the quarterly Internal Audit reports, the latest being 4th quarter 2006/7 and Auditor General reports 2006/7 continues to bring out a number of issues of non-compliance with regulations such as non-accountability of funds, diversions, overriding budget controls despite the IFMS controls. Although the general trend is improving given the greater understanding being achieved by the various users of the IFMS system which significantly provides these controls.
PI21 Effectiveness of internal audit C Coverage of internal audit services now extends to all Ministries and referral Hospitals that receive money from the consolidated fund as evidenced by staffs deployed. The focus of the audit covers all general areas of Government operations including payroll audit issues. Efforts are also being made to raise the level of performance to internationally accepted standards although the emphasis of their work still is centered on pre-audits. Reports are produced quarterly which is strictly adhered to. The report is addressed to the Accountant General with copies to the Permanent Secretary Ministry of Finance and Secretary to Treasury. However, the Office of Auditor General
67
(SAI) is not served with copies except when requested. Many managers have of late started responding promptly to Internal Audit reports which is a recent improvement. It is hoped that when the Audit committees are fully established in all Ministries and departments, the level of response to internal audit reports will greatly improve.
C(iii) Accounting, Recording and Reporting
PI22 Timeliness and regularity of accounts reconciliation
D Although Public Finance and Accountability Regulation requires all MDA‟s to carry out bank reconciliations at least on a monthly basis and to submit copies of the reconciliation statements signed by the accounting officer to the Accountant General, however, accounting officers make the submissions on quarterly basis when they submit the accounts for the quarter. It is also noted that for MDA‟s on IFMS, fund releases are normally done on confirmation of reconciliations. This is sometimes curtailed by the delays by Bank of Uganda to upload the bank statements on the system so as to permit reconciliation to take place. Although the law requires all suspense accounts balanced off and advances accounted for by the end of each financial year Auditor General‟s Report 2005/2006 indicated that shs.8, 678,034,207 were never accounted for by year end.
PI23 Availability of information on resources received by service delivery units.
B Information regarding receipt of resources by service units especially, primary health units and primary education is available. Sample documents collected from District Health Annual reports and confirmed in the Ministry of Health headquarters indicate that reports are received quarterly and annually. District Education offices country wide as well collect and submit quarterly and annual reports on resources received by primary schools to Ministry of Education headquarters. District annual and quarterly financial statements, Internal and External auditor reports also reflect comments on receipt and utilization of resources by front line service delivery units. Discussions with responsible officials of MoFPED and line ministries confirm these facts. However, there are problems regarding existence of qualified staff to manage the units. There are also significant delays in transfers of resources to the units and challenges regarding poor record keeping which subsequently affect quality of reporting. But improvements are being noted in these areas. Resources are also inadequate to these centers although fund releases in these areas are safeguarded against budget cuts arising from the Government policy on conditional funds covered under Poverty Action Fund (PAF).
PI24 Quality and timeliness of in year budget reports C+ Comparison of the budget and the monthly returns made to Finance and confirmation with MOFPED indicate that standardized commitment forms are used to provide the necessary information. Enquiries made at MOFPED and
68
various MDAs indicate that Commitment control system which provides that subsequent release will not be made before a previous return is submitted is, to a greater extent, created discipline in timely filing of returns. Annual budget performance report for the F/Y 2006/2007 indicates that agencies where treasury does not issue direct cheques, MOFPED cannot readily obtain accurate data on final cheque prints. These agencies account for 32.5% of the total approved GoU budget.
PI25 Quality and timeliness of annual financial statements
B+ Regarding completeness of the financial statements, the Auditors General‟s report of 2005/2006 indicated that government loans to private Enterprises (Uganda Apex Private Enterprises loans) amounting to shs.221, 667,306,372 were not recognized in Government consolidated Financial Statements. The same report noted that some donor funded projects were not consolidated in the Government of Uganda Financial statements e.g. in Ministry of Water, Lands and Environment 80% of the expenditure on water sector through the partnership fund was not disclosed in the Ministry‟s accounts and therefore never consolidated. The report further notes that there was uncertainty on the completeness of the reported investments due to lack of investment ledger and supporting documents like investment agreements, share and deposit certificates. While on timeliness of the submission of financial statements, records in Auditor Generals office indicated that, for the F/Y 2005/2006 actual submission of the consolidated financial statements was on 30th October 2006 (i.e. four month after the end of the fiscal year although it should be noted that some accounting officers did not submit their accounts until as late as 25 January 2007 and therefore were actually not included in the consolidated financial statements at that time (See PI-26). Financial statements prepared by the Accountant General are in accordance with the provisions of the Public Finance and Accountability Act (PFAA, 2003) and comply with generally accepted accounting principles taking into consideration the Government of Uganda legal and regulatory framework regarding public finances. This is confirmed by Auditor General Report June 2005/6 which indicates that statements are presented in a consistent format as provided in the third schedule to the Public Finance and Accountability Act and Accounting standards used are disclosed in the Financial Statements.
C(iv) External scrutiny and follow up of external audits
PI26 The scope, nature and follow up of external audit C+ The Auditor General produces annual reports to parliament which highlight significant issues covering revenue, expenditure, assets and liabilities of Ministries, Agencies, Referral hospitals, Missions and projects. The audit is carried out in accordance with International standards on auditing and Government of Uganda legislation. However, some donor projects (e.g. USAID) are not audited by Auditor General because of the terms of
69
agreements reached between government and those entities. During financial year 2005/6, on average, the Auditor General audited 92.5% by value of total expenditures broken down as 100% of central Government departments, 93% of statutory bodies (i.e. 67 units out of 72) and 84.5% of all projects. Regarding timeliness of submission of audit reports to legislature, in respect of the financial year 2005/6 the audit report was submitted to parliament late i.e. on 10/10/07 due to absence of a substantive Auditor General at the time. Records in the Auditor General Office indicate that whereas the Accountant General submitted the 2005/06 Treasury accounts on 30th October 2006 to the Auditor General, the same does not hold true for the individual accounting officers who submitted their accounts to the Auditor General on differing dates ranging from 3 August 2006 and as late as 25 January 2007. This indicator is required to measure the time period when the accounts are received by the Auditor General and the time when the Auditor General submits them to the Legislature. Despite the differing dates on which the accounts are received by the Auditor General (as evidenced on the mail registers in OAG), this indicator has been based on a receipt date of accounts of 30 October 2006. In terms of follow up on audit recommendations, Some of the recommendations are implemented as evidenced in the verification reports for each Ministry in office of Auditor General. But no systematic follow up actions as evidenced by existence of, especially, re-occurring issues.
PI27 Legislative scrutiny of the annual budget law B+ Details of expenditure from Ministry of Finance Planning and Economic Development and revenue from Uganda Revenue Authority are reviewed by the legislature. They also review the fiscal policies and aggregates as stipulated in the Finance Act. The parliament budget committee is consulted prior to presentation to Parliament. The Medium term expenditure framework and the medium term priorities are also reviewed by the Parliamentary Budget Committee. Legislative procedures regarding budgets exist and are well established as evidenced by Budget Act, Policy statement, National budget Framework paper and budget guidelines which are followed by the legislature during review of the budget process. The procedures are comprehensive and supported by the Constitution of Uganda and the Public Finance & Accountability Act. Internal organizational arrangements are stipulated in the policy statements, specialized sessional committees exist and negotiation procedures are in place. The budget committee makes recommendations to MoFPED by 15th May; responses are then furnished by the Minister. Time allocated for review of budget proposals in accordance with the Budget Act is adequate i.e. 1st April to 15th
70
May. This is before the budget is presented to parliament and allows committee to provide input. After the budget presentation they are also provided the period from 1st July to 30 August for scrutiny before the budget is approved. This provision is general complied with in practice. There exist rules for in-year amendments to the budget but with conflicting aspects as regards supplementary budget as per the Ugandan Constitution Article 156, Budget Act sections 12 and the Public Finance and Accountability Act Section 16. There is also lack of clarity in the Budget Act as regards the definition of appropriated budget and approved budget. However, strict limits are adhered to when formulating supplementary budgets e.g. Vote on Accounts (VOA) which should not exceed 1/3 of total budget and total supplementary budget should not exceed 3% of total approved budget as set in the budget Act.
PI28 Legislative scrutiny of external audit reports. D+ The status of the receipt of the Auditor Generals report by the Public accounts committee for the last three years shows that for 2005/6 audit report was received by PAC on 10th October 2007, 2004/5 report was received on 31st
march 2006 while 2003/4 audit report was received by PAC on 31st march2005. However, Last PAC report presented to parliament was in respect of FY ending 30-06-01 while the PAC report for FY 2001/2 is being printed. The audit reports for FY 2002/3, 2003 /4, 2005/6 are being discussed although simultaneously. The report on FY 2004/5 audit is currently in draft form, while the report on examination of FY 2005/6 review started in November 2007. The Parliamentary committee for Statutory Corporation referred to as COSASE, started work during last quarter of 2005/6. To-date they have reviewed reports for 4 entities for the period 1995 – 2006. Generally the scrutiny of the reports is extensively in arrears and is handling backlogs. However, it should be noted that the situation is generally improving with donor funding to the oversight committees to work extra time to clear backlogs. In-depth hearings on key findings do take place with responsible officers from the audited entities as a routine, but may cover only some of the entities. Some actions recommended to the Executive are implemented as per existing evidence in the file records of Parliament Assistant Director-Table, PAC records and Chairman COSASE internal file records of 2006/7.
D. Donor Practices
D1 Predictability of Direct Budget Support. D+ Direct budget support outturn for the last 3 financial years was: 14% in the financial 2004/5 and 43.6% in 2005/6. However, in the Financial Year 2006/7 there was a surplus release by 46.45%. Commitments are submitted by donors by March. Donor agreements signed indicate annual releases not quarterly disbursements. Quarterly
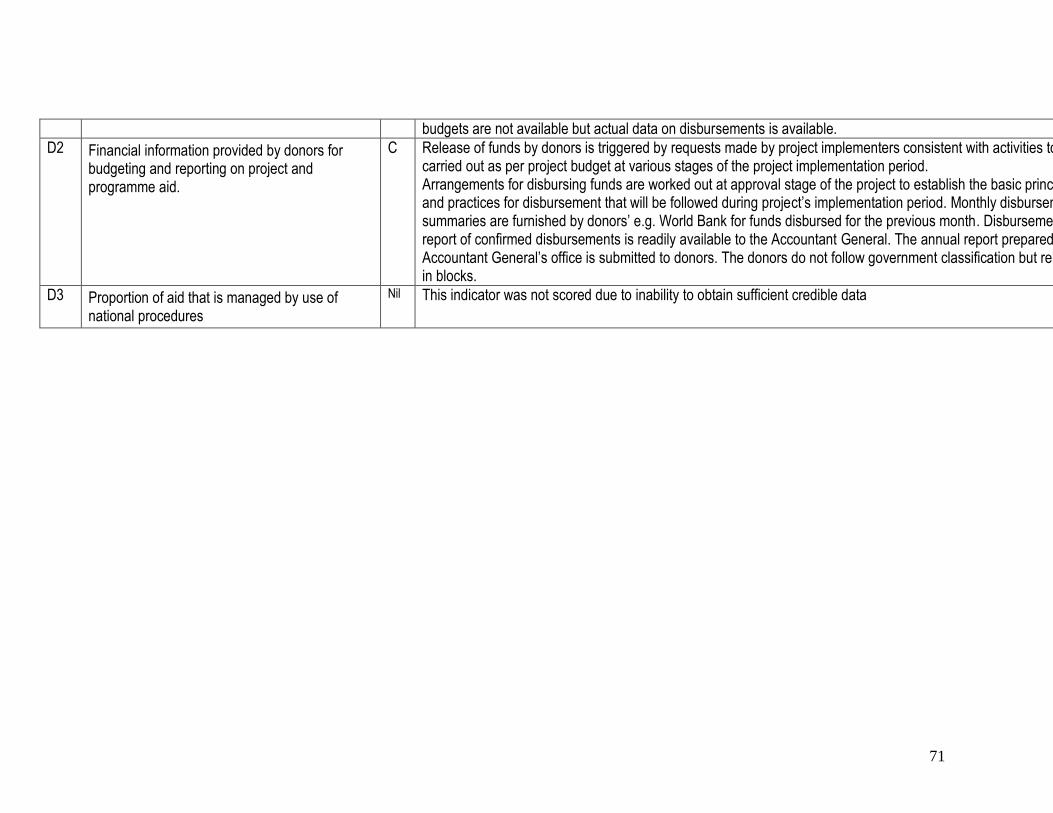
71
budgets are not available but actual data on disbursements is available.
D2 Financial information provided by donors for budgeting and reporting on project and programme aid.
C Release of funds by donors is triggered by requests made by project implementers consistent with activities to be carried out as per project budget at various stages of the project implementation period. Arrangements for disbursing funds are worked out at approval stage of the project to establish the basic principles and practices for disbursement that will be followed during project‟s implementation period. Monthly disbursements summaries are furnished by donors‟ e.g. World Bank for funds disbursed for the previous month. Disbursement report of confirmed disbursements is readily available to the Accountant General. The annual report prepared by Accountant General‟s office is submitted to donors. The donors do not follow government classification but release in blocks.
D3 Proportion of aid that is managed by use of national procedures
Nil This indicator was not scored due to inability to obtain sufficient credible data
Attachment 2: Persons Consulted
1. Mr. Dan Kyambadde, AG. Assistant Commissioner FINANCE, Uganda Revenue
Authority (URA)
2. Mr. Kagoro John, Assistant Commissioner, Internal Audit, Ministry of Finance,
Planning & Economic Development
3. Mr. Mutesigensi Johnson, Coordinator, FINMAP Ministry of Finance, Planning &
Economic Development
4. Mr. Okudi Robert Bellarmine, Principal Economist, Infrastructure & Social Services
Department, Ministry of Finance, Planning & Economic Development
5. Mr. Barigye Denis, Ministry of Finance, Planning & Economic Development
6. Mr.Lubega Yakubu, Ministry of Finance, Planning & Economic Development
7. Mr. Ssettala Aziz, Ministry of Finance, Planning & Economic Development
8. Mr. Wandera, Macro Department- Ministry of Finance, & Economic Development
9. Mr. Balaba Mathias, Personnel Officer, Office of the Auditor General
10. Mr. Mulera M. Julius, Director, Procurement Audit, Inspection & Investigation PPDA.
11. Mr. Etiang Joseph, Head of Internal Audit, PPDA.
12. Mr. Biateberaho Johnson, Chairman Local Government Finance Commission
13. Mr. Tumukwasibe Robert, Clerk, Budget Committee, Parliament of Uganda
14. Hon. Odit John, Chairperson, Parliamentary Committee for Statutory and state
Enterprises(COSASE), Parliament of Uganda
15. Mr. Emiku Samuel, Assistant Director, Table- Parliament of Uganda
16. Hon. Oketcha William, Chairperson, Parliamentary Budget Committee, Parliament
17. Mr. Bisase Tusuubira Moses, Assistant Director, Parliamentary Budget Office,
Parliament of Uganda
18. Mr. Magambe Kenneth –Director Budget - Ministry of Finance, Planning & Economic
Development
19. Mr. Gasasira Nestor-Principal Accountant –Ministry of Health
20. Mr. Beyamba Buzaare –Inspector of Schools –Wakiso District
21. Mr. Kabwire – Officer in charge PHC-Wakiso District
73
Attachment 3: Reference Documents
1. Accountability of Funds to the health unit ,December 16, 2005, Epicentre, Wakiso
Health Centre III , Busiro east Health Sub-District – Wakiso District
2. Annual Budget Performance FY 2004/5, October 2005, FY 2006/7, September
2007 Ministry of Finance, Planning & Economic Development
3. Background to the Budget financial years 2006/2007 and 2007/2008 by Ministry of
Finance, Planning and Economic Development.
4. Budget Act, 2001, the Republic of Uganda.
5. Cash limits release circular dated 2nd January 2008
6. Circular standing Instructions, no 1, of 2007, Ministry of Public Service
7. Consolidated PAF monitoring and Accountability Report for 1st Quarter 2006/7,
Treasury Inspection Department, Ministry of Finance, Planning & Economic
Development
8. Consolidated PAF monitoring and Accountability Report for 2nd Quarter 2005/6,
Treasury Inspection Department, Ministry of Finance, Planning & Economic
Development
9. Consolidated Payroll report for the Month of July, August and September , 2007,
Internal Audit Department, Ministry of Finance, Planning & Economic
Development
10. Constitution of the Republic of Uganda, 1995
11. Development Cooperation-Uganda, Access to quality education is essential for
social transformation and prosperity, 2005/06 Report, November 2006, Ministry of
Finance, Planning & Economic Development
12. Development Management system, summary of Donors Disbursements by Sector
for the Period 1 July 2004 to 30th June 2005.
13. Disbursement Handbook, the World Bank.
14. Draft report on Fiscal decentralization strategy 2 on allocation principles &
development of allocation formula for grants of December 2004 by Local
Government Finance commission.
74
15. Employment income, Income Tax Cap 340, edition 2006
16. Explanatory notes: Internal Audit and Tax investigations
17. Financial Year 2006/07 District Transfers for Health Services, July 2006, Ministry
of Health.
18. GATT Valuation , Tax payers guide second edition 2001
19. GoU Appropriation Act, 2006, Assent to the bill by the President, October 25, 2006
20. GoU Appropriation Act, 2006, Assent to the bill by the President, September 25,
2007
21. GoU Appropriation Act, 2006, Assent to the bill by the President, October 26, 2005
22. GoU Budget speech 2006/7
23. GoU Draft Estimates of Revenue and Expenditure (Recurrent and Development)
for 2004/5;2005/6 & 2006/7
24. Government of Uganda(GoU) Financial statement of Accountant General June 30,
2004,2005-2006 & 2007
25. Grants Received from 01.7.07.2006-30.06.2007, Donors and Project Details,
Accountant General‟s Office, Ministry of Finance, Planning & Economic
Development
26. IFMS, GOU Classification and Chart of Accounts Oct 2007
27. Internal Audit Report 4th 2006/7and 1st Quarter 2007/8, Ministry of Finance,
Planning & Economic Development
28. IPF and Budget framework 2006/2007.
29. Joint Bank Fund Debt Analysis Sustainability Analysis (DSA)-1st December 2006.
30. Loose Minute to Director Budget, from D/EA on cash limits
31. Medium Term Budget Support figures, 2006/7 performance, Ministry of Finance,
Planning & Economic Development
32. Medium term framework 2005/6-2008/9- Ministry of Finance, Planning and
Economic Development.
33. Ministry of Finance, Planning and Economic Development websites
34. Mukono District Financial Report FY 2006/7
35. Parliamentary mails receipt records, 2006
36. Pay Change Report for the month of march, 2008, Office of the Auditor General
75
37. PEFA, Public Financial Management Performance, Measurement, Frame work,
June 2005, Reprinted May 2006, PEFA secretariat World Bank, Washington DC,
USA.
38. Proposed work Plan for the Budget Committee FY 2008/09 (Budget Oversight
Function), Parliamentary Budget Office, Parliament of Uganda
39. Public finance and Accountability Act (PFAA) and Accounting Regulations.
40. Public Procurement and Disposal of Assets (PPDA) websites.
41. Public sector Investment Plans
42. Recommendations of the Parliamentary Budget committee on the three years
macroeconomic plan and programmes for economic and social development for
fiscal years 2006/7-2008/9 and the indicative preliminary revenue and expenditure
framework of the Government for FY 2006/07, Parliament of Uganda
43. Reconciliation of Tax Assessments, Collections and Arrears, internal memo of
28/1/08
44. Sector Investment strategic plans
45. Special investigation report in Ministry of Works Payroll, Office of Auditor General,
2007
46. Staff Report for the 2006, Request for three year Policy Support instrument,
African Department, International Monetary Fund-Uganda, and December 1, 2006.
47. Summary of weekly transfers by URA for 2006/7
48. Tax appeal report from commissioner legal services and board affairs department
49. Tax payers guide Income Tax Act 2997; Objections and Appeals (sections 100 –
103) 1st edition
50. Taxation of individual rental income, edition 2006
51. The Financial Management and Accountability Programme(FINMAP) Financial
Years, 2006/07 to 2010/11 Strategy Document, Ministry of Finance, Planning &
Economic Development
52. The Financial Management and Accountability Programme(FINMAP) Financial
Years, Quarterly Report October –December 2007, Ministry of Finance, Planning
& Economic Development
76
53. The Report and Opinion of the Auditor General to Parliament on the accounts of
the Republic of Uganda, for the years ended 30th June, 2004, 2005, 2006 & 2007.
54. The Republic of Uganda, Public Financial Management Performance report and
Update of CIFA Action Plan 2005, May 2006,
55. Wakiso District Audit of Poverty Action Fund Report FY 2005/6, Internal Audit
Department, February 27, 2007
56. Wakiso District Financial Report 2nd quarter, October, November and December
FY 2005/6, February 8, 2006
57. Wakiso District Health Annual Report FY 2005/6, September 8, 2006
58. Wakiso District Health Annual Report FY 2006/7, August 31, 2007.
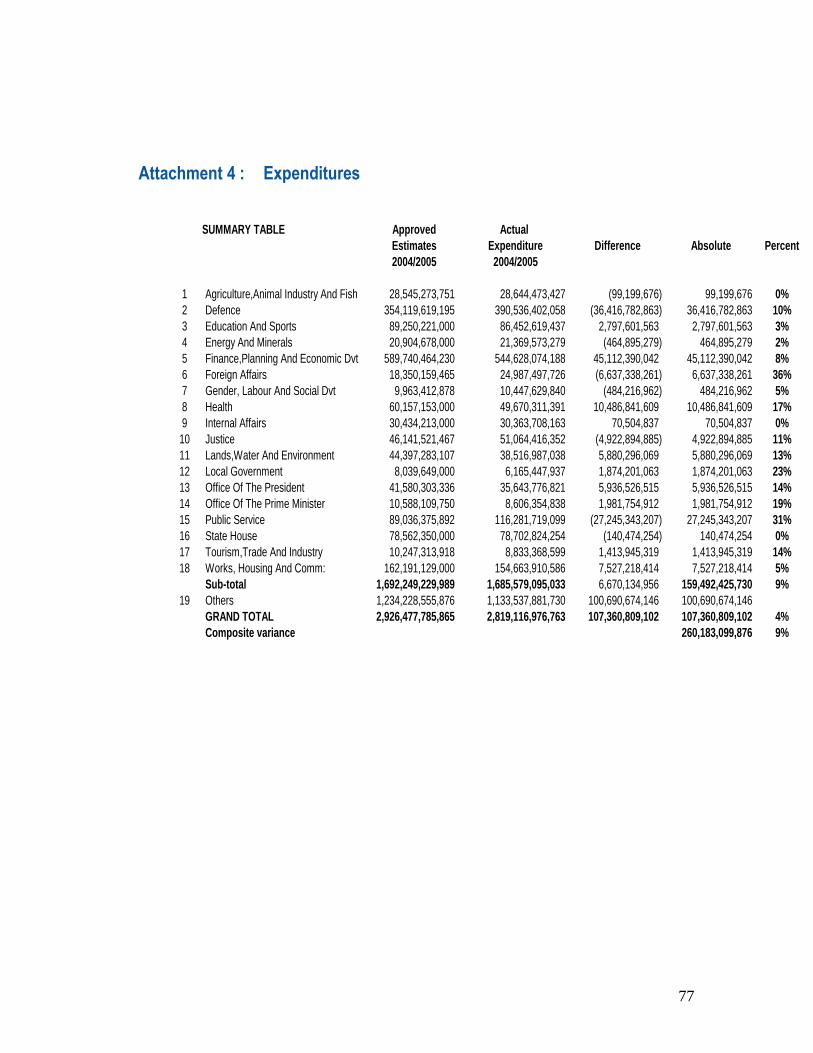
77
Attachment 4 : Expenditures
SUMMARY TABLE Approved Actual
Estimates Expenditure Difference Absolute Percent
2004/2005 2004/2005
1 Agriculture,Animal Industry And Fish 28,545,273,751 28,644,473,427 (99,199,676) 99,199,676 0%
2 Defence 354,119,619,195 390,536,402,058 (36,416,782,863) 36,416,782,863 10%
3 Education And Sports 89,250,221,000 86,452,619,437 2,797,601,563 2,797,601,563 3%
4 Energy And Minerals 20,904,678,000 21,369,573,279 (464,895,279) 464,895,279 2%
5 Finance,Planning And Economic Dvt 589,740,464,230 544,628,074,188 45,112,390,042 45,112,390,042 8%
6 Foreign Affairs 18,350,159,465 24,987,497,726 (6,637,338,261) 6,637,338,261 36%
7 Gender, Labour And Social Dvt 9,963,412,878 10,447,629,840 (484,216,962) 484,216,962 5%
8 Health 60,157,153,000 49,670,311,391 10,486,841,609 10,486,841,609 17%
9 Internal Affairs 30,434,213,000 30,363,708,163 70,504,837 70,504,837 0%
10 Justice 46,141,521,467 51,064,416,352 (4,922,894,885) 4,922,894,885 11%
11 Lands,Water And Environment 44,397,283,107 38,516,987,038 5,880,296,069 5,880,296,069 13%
12 Local Government 8,039,649,000 6,165,447,937 1,874,201,063 1,874,201,063 23%
13 Office Of The President 41,580,303,336 35,643,776,821 5,936,526,515 5,936,526,515 14%
14 Office Of The Prime Minister 10,588,109,750 8,606,354,838 1,981,754,912 1,981,754,912 19%
15 Public Service 89,036,375,892 116,281,719,099 (27,245,343,207) 27,245,343,207 31%
16 State House 78,562,350,000 78,702,824,254 (140,474,254) 140,474,254 0%
17 Tourism,Trade And Industry 10,247,313,918 8,833,368,599 1,413,945,319 1,413,945,319 14%
18 Works, Housing And Comm: 162,191,129,000 154,663,910,586 7,527,218,414 7,527,218,414 5%
Sub-total 1,692,249,229,989 1,685,579,095,033 6,670,134,956 159,492,425,730 9%
19 Others 1,234,228,555,876 1,133,537,881,730 100,690,674,146 100,690,674,146
GRAND TOTAL 2,926,477,785,865 2,819,116,976,763 107,360,809,102 107,360,809,102 4%
Composite variance 260,183,099,876 9%
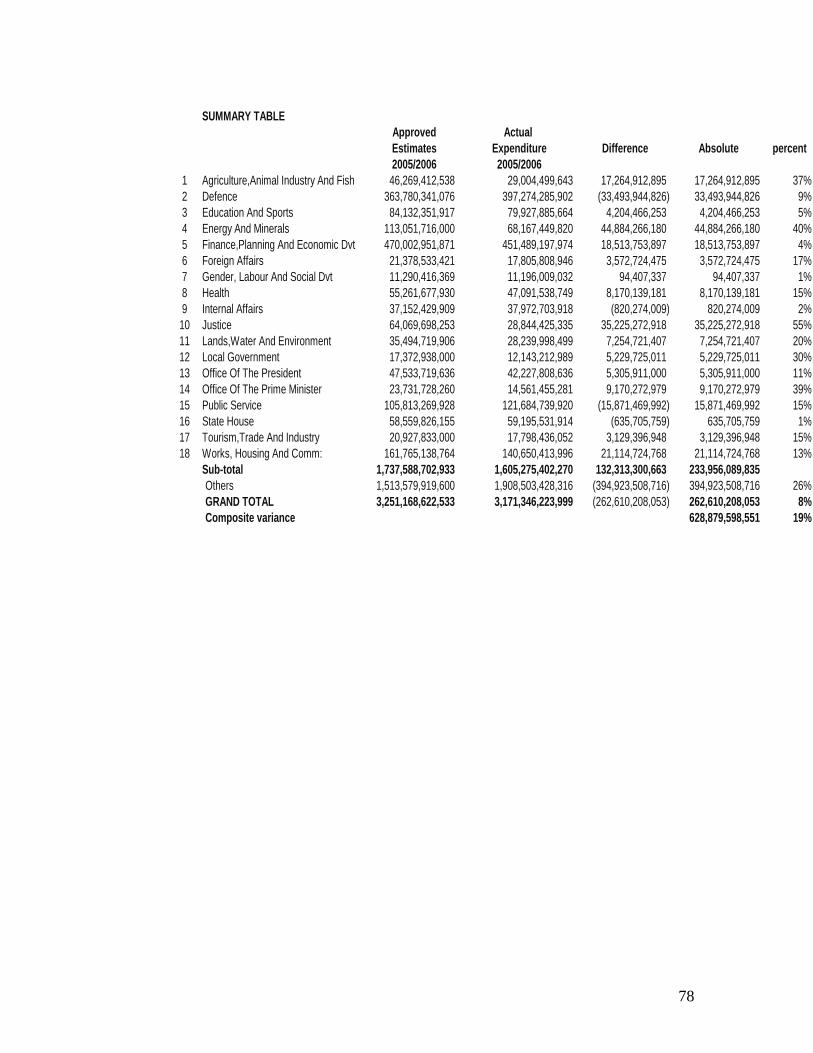
78
SUMMARY TABLE
Approved Actual
Estimates Expenditure Difference Absolute percent
2005/2006 2005/2006
1 Agriculture,Animal Industry And Fish 46,269,412,538 29,004,499,643 17,264,912,895 17,264,912,895 37%
2 Defence 363,780,341,076 397,274,285,902 (33,493,944,826) 33,493,944,826 9%
3 Education And Sports 84,132,351,917 79,927,885,664 4,204,466,253 4,204,466,253 5%
4 Energy And Minerals 113,051,716,000 68,167,449,820 44,884,266,180 44,884,266,180 40%
5 Finance,Planning And Economic Dvt 470,002,951,871 451,489,197,974 18,513,753,897 18,513,753,897 4%
6 Foreign Affairs 21,378,533,421 17,805,808,946 3,572,724,475 3,572,724,475 17%
7 Gender, Labour And Social Dvt 11,290,416,369 11,196,009,032 94,407,337 94,407,337 1%
8 Health 55,261,677,930 47,091,538,749 8,170,139,181 8,170,139,181 15%
9 Internal Affairs 37,152,429,909 37,972,703,918 (820,274,009) 820,274,009 2%
10 Justice 64,069,698,253 28,844,425,335 35,225,272,918 35,225,272,918 55%
11 Lands,Water And Environment 35,494,719,906 28,239,998,499 7,254,721,407 7,254,721,407 20%
12 Local Government 17,372,938,000 12,143,212,989 5,229,725,011 5,229,725,011 30%
13 Office Of The President 47,533,719,636 42,227,808,636 5,305,911,000 5,305,911,000 11%
14 Office Of The Prime Minister 23,731,728,260 14,561,455,281 9,170,272,979 9,170,272,979 39%
15 Public Service 105,813,269,928 121,684,739,920 (15,871,469,992) 15,871,469,992 15%
16 State House 58,559,826,155 59,195,531,914 (635,705,759) 635,705,759 1%
17 Tourism,Trade And Industry 20,927,833,000 17,798,436,052 3,129,396,948 3,129,396,948 15%
18 Works, Housing And Comm: 161,765,138,764 140,650,413,996 21,114,724,768 21,114,724,768 13%
Sub-total 1,737,588,702,933 1,605,275,402,270 132,313,300,663 233,956,089,835
Others 1,513,579,919,600 1,908,503,428,316 (394,923,508,716) 394,923,508,716 26%
GRAND TOTAL 3,251,168,622,533 3,171,346,223,999 (262,610,208,053) 262,610,208,053 8%
Composite variance 628,879,598,551 19%
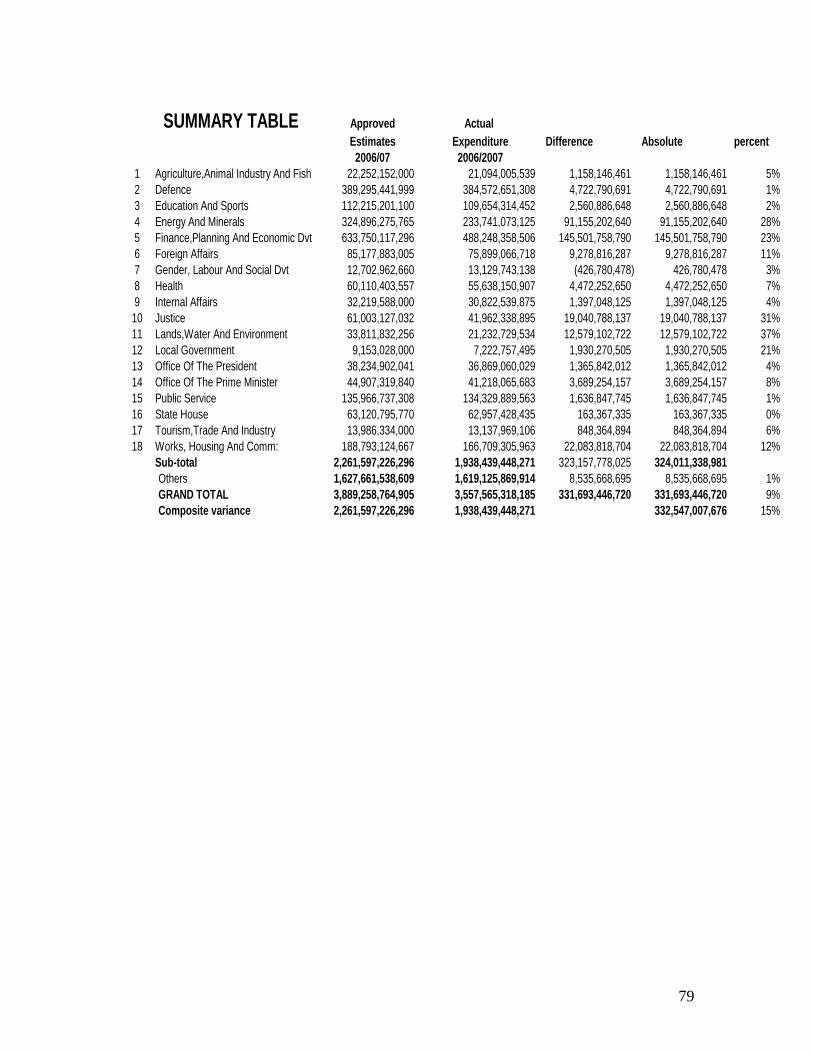
79
SUMMARY TABLE Approved Actual
Estimates Expenditure Difference Absolute percent
2006/07 2006/2007
1 Agriculture,Animal Industry And Fish 22,252,152,000 21,094,005,539 1,158,146,461 1,158,146,461 5%
2 Defence 389,295,441,999 384,572,651,308 4,722,790,691 4,722,790,691 1%
3 Education And Sports 112,215,201,100 109,654,314,452 2,560,886,648 2,560,886,648 2%
4 Energy And Minerals 324,896,275,765 233,741,073,125 91,155,202,640 91,155,202,640 28%
5 Finance,Planning And Economic Dvt 633,750,117,296 488,248,358,506 145,501,758,790 145,501,758,790 23%
6 Foreign Affairs 85,177,883,005 75,899,066,718 9,278,816,287 9,278,816,287 11%
7 Gender, Labour And Social Dvt 12,702,962,660 13,129,743,138 (426,780,478) 426,780,478 3%
8 Health 60,110,403,557 55,638,150,907 4,472,252,650 4,472,252,650 7%
9 Internal Affairs 32,219,588,000 30,822,539,875 1,397,048,125 1,397,048,125 4%
10 Justice 61,003,127,032 41,962,338,895 19,040,788,137 19,040,788,137 31%
11 Lands,Water And Environment 33,811,832,256 21,232,729,534 12,579,102,722 12,579,102,722 37%
12 Local Government 9,153,028,000 7,222,757,495 1,930,270,505 1,930,270,505 21%
13 Office Of The President 38,234,902,041 36,869,060,029 1,365,842,012 1,365,842,012 4%
14 Office Of The Prime Minister 44,907,319,840 41,218,065,683 3,689,254,157 3,689,254,157 8%
15 Public Service 135,966,737,308 134,329,889,563 1,636,847,745 1,636,847,745 1%
16 State House 63,120,795,770 62,957,428,435 163,367,335 163,367,335 0%
17 Tourism,Trade And Industry 13,986,334,000 13,137,969,106 848,364,894 848,364,894 6%
18 Works, Housing And Comm: 188,793,124,667 166,709,305,963 22,083,818,704 22,083,818,704 12%
Sub-total 2,261,597,226,296 1,938,439,448,271 323,157,778,025 324,011,338,981
Others 1,627,661,538,609 1,619,125,869,914 8,535,668,695 8,535,668,695 1%
GRAND TOTAL 3,889,258,764,905 3,557,565,318,185 331,693,446,720 331,693,446,720 9%
Composite variance 2,261,597,226,296 1,938,439,448,271 332,547,007,676 15%