Embed Size (px)
Citation preview
PEER Structural Performance Database
User’s Manual
(Version 1.0)
Michael Berry University of Washington
Myles Parrish University of Washington
Marc Eberhard University of Washington
Pacific Earthquake Engineering Research Center University of California, Berkeley
January 2004
i
Table of Contents LIST OF FIGURES ........................................................................................................................................ ii
LIST OF TABLES......................................................................................................................................... iii
ACKNOWLEDGEMENTS........................................................................................................................... iv
CHAPTER 1: INTRODUCTION.............................................................................................................. 1
CHAPTER 2: COLUMN PROPERTIES .................................................................................................. 3
2.1 MATERIAL PROPERTIES ................................................................................................................ 3 2.2 COLUMN GEOMETRY.................................................................................................................... 4 2.3 CONFINEMENT DETAILS ............................................................................................................... 6 2.4 TEST CONFIGURATION.................................................................................................................. 6
CHAPTER 3: TEST RESULTS................................................................................................................ 9
3.1 FAILURE CLASSIFICATION ............................................................................................................ 9 3.2 FORCE-DISPLACEMENT DATA .................................................................................................... 10 3.3 EFFECT OF AXIAL LOAD............................................................................................................. 11 3.4 OBSERVED DAMAGE .................................................................................................................. 14
CHAPTER 4: CHARACTERISTICS OF AVAILABLE DATA............................................................ 16
4.1 DISTRIBUTION OF KEY COLUMN PROPERTIES ............................................................................ 16 4.2 CALCULATED ACI NOMINAL FLEXURAL CAPACITY .................................................................. 20
REFERENCES ............................................................................................................................................. 21
APPENDIX A: SUMMARY OF TESTS OF RECTANGULAR-REINFORCED COLUMNS.................. 22
APPENDIX B: SUMMARY OF TESTS OF SPIRAL-REINFORCED COLUMNS .................................. 27
APPENDIX C: STRUCTURE OF XML DATA......................................................................................... 30
APPENDIX D: COLUMN TEST REFERENCES...................................................................................... 33
ii
List of Figures Figure 2.1: Confinement Types....................................................................................................... 7
Figure 2.2: Column Test Configurations......................................................................................... 8
Figure 3.1: Failure Classification Flowchart................................................................................. 10
Figure 3.3: Definition of Displacement Preceding Damage State ................................................ 14
Figure 4.1: Distribution of Column Depth .................................................................................... 17
Figure 4.2: Distribution of Column Aspect Ratio ......................................................................... 18
Figure 4.3: Distribution of Axial-Load Ratio................................................................................ 18
Figure 4.4: Distribution of Longitudinal-Reinforcement Ratio .................................................... 19
Figure 4.5: Distribution of Transverse-Reinforcement Ratio ....................................................... 20
iii
List of Tables Table 2.1: Material Properties......................................................................................................... 4
Table 2.2: Column Geometry.......................................................................................................... 5
Table 2.3: Cross-Section Classifications........................................................................................ 5
Table 2.4: Confinement Details ...................................................................................................... 6
Table 2.5: Confinement Details ...................................................................................................... 7
Table 3.1: Failure Mode Codes ....................................................................................................... 9
Table 4.1: Column Property Statistics........................................................................................... 17
Table 4.2: Summary of Calculated Flexural Capacities................................................................ 20
Table A.1: Summary of Tests of Rectangular-Reinforced Columns ............................................ 23
Table B.1: Summary of Tests of Spiral-Reinforced Columns ...................................................... 27
iv
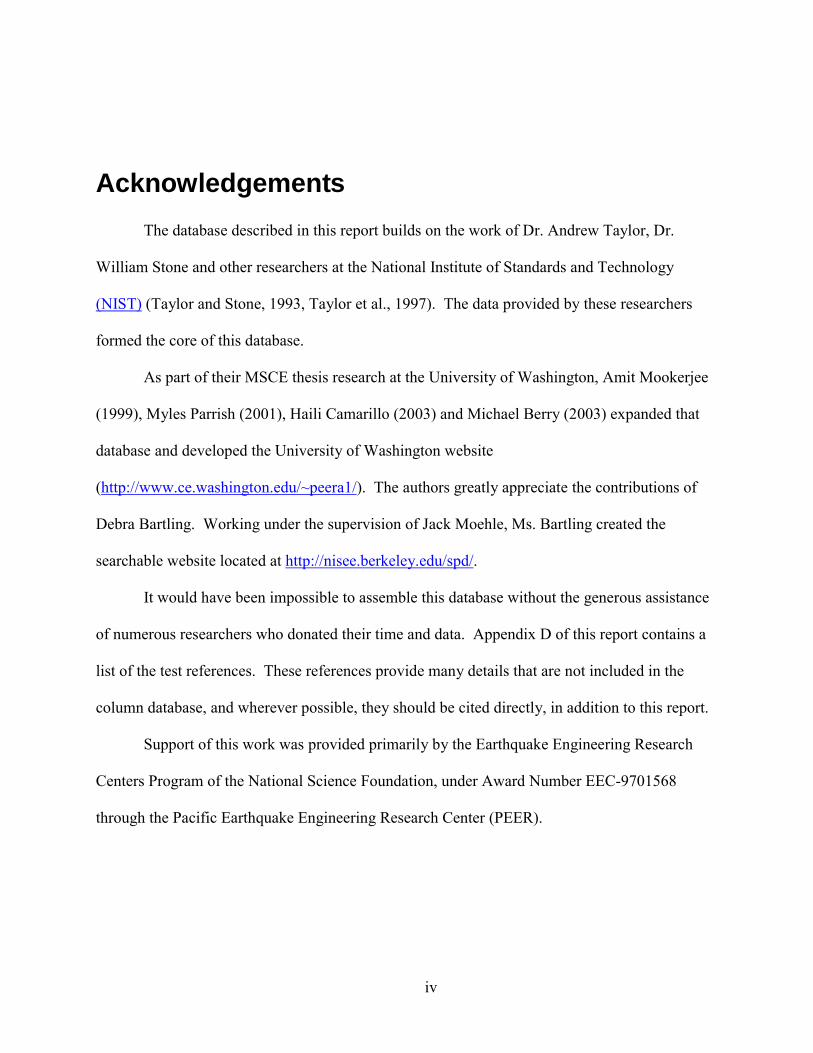
Acknowledgements The database described in this report builds on the work of Dr. Andrew Taylor, Dr.
William Stone and other researchers at the National Institute of Standards and Technology
(NIST) (Taylor and Stone, 1993, Taylor et al., 1997). The data provided by these researchers
formed the core of this database.
As part of their MSCE thesis research at the University of Washington, Amit Mookerjee
(1999), Myles Parrish (2001), Haili Camarillo (2003) and Michael Berry (2003) expanded that
database and developed the University of Washington website
(http://www.ce.washington.edu/~peera1/). The authors greatly appreciate the contributions of
Debra Bartling. Working under the supervision of Jack Moehle, Ms. Bartling created the
searchable website located at http://nisee.berkeley.edu/spd/.
It would have been impossible to assemble this database without the generous assistance
of numerous researchers who donated their time and data. Appendix D of this report contains a
list of the test references. These references provide many details that are not included in the
column database, and wherever possible, they should be cited directly, in addition to this report.
Support of this work was provided primarily by the Earthquake Engineering Research
Centers Program of the National Science Foundation, under Award Number EEC-9701568
through the Pacific Earthquake Engineering Research Center (PEER).
1
Chapter 1: Introduction The PEER Structural Performance Database has been assembled to provide researchers
with the data needed to evaluate and develop seismic performance models for reinforced
concrete columns. This database builds on previous work at the National Institute of Standards
and Technology (NIST). The original NIST database described 107 tests of rectangular-
reinforced columns and 92 tests of spiral-reinforced concrete columns. For each test, the NIST
database provided a reference, digital top force-displacement histories, key material properties,
as well as a description of the test geometry. The data was available from two reports and
accompanying floppy discs (Taylor and Stone 1993; Taylor et al. 1997).
With the support of the Pacific Earthquake Engineering Research Center (PEER),
University of Washington researchers added new tests to the database and expanded the
information available for each test. As of January 2004, the database describes 274 tests of
rectangular-reinforced columns and 160 tests of spiral-reinforced columns. The database now
provides additional details of the tests, including the P-∆ configuration and the maximum
column deflection imposed before reaching various damage states. The database is available on
the World Wide Web from the University of Washington
(http://www.ce.washington.edu/~peera1) and from PEER (http://nisee.berkeley.edu/spd/). The
PEER website allows users to search for column tests with particular ranges of attributes. In a
few cases, the PEER website provides additional information not available at the UW website,
such as drawings and photographs.
2
This report documents the database. Chapter 2 provides the definitions used to describe
the column material properties, geometry and reinforcing details, as well as the test
configuration. Chapter 3 documents the reporting of the test results, including the failure
classification, force-deflection histories, axial loads and observed damage. Chapter 4 provides a
list of the tests in the database, statistical distributions of key column characteristics, and
maximum recorded moments and shears. This chapter also provides statistics on the nominal
flexural moment capacities, as calculated by the procedures of the American Concrete Institute’s
Building Code Requirements for Structural Concrete (ACI 318-02).

3
Chapter 2: Column Properties Key test properties are available from the UW website in Lotus .wk1 format. The same
properties are available from the PEER website in tab-deliminated and xml formats. The column
properties provided in the database are defined in this chapter. The properties are organized in
terms of material properties (Section 2.1), column geometry (Section 2.2), confinement details
(Section 2.3) and test configuration (Section 2.4). For a few tests, the PEER website also
provides key drawings and pictures.
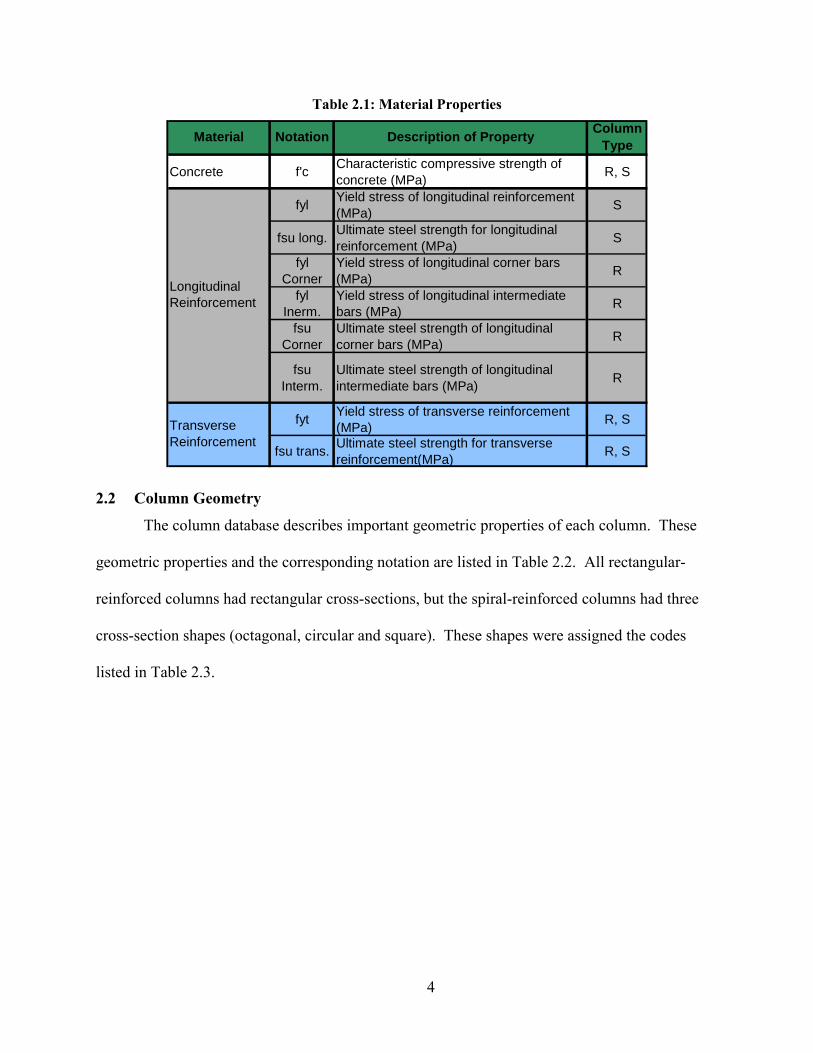
2.1 Material Properties
The material properties provided for each column test in the database are listed in Table
2.1. This table includes the notation used to designate the column properties. The column titled
Column Type in this table designates whether each property is provided only for the rectangular-
reinforced columns (R), only for the spiral-reinforced columns (S) or for both types of columns
(R, S).
4
Table 2.1: Material Properties
Concrete f'c Characteristic compressive strength of concrete (MPa) R, S
fyl Yield stress of longitudinal reinforcement (MPa) S
fsu long. Ultimate steel strength for longitudinal reinforcement (MPa) S
fyl Corner
Yield stress of longitudinal corner bars (MPa) R
fyl Inerm.
Yield stress of longitudinal intermediate bars (MPa) R
fsu Corner
Ultimate steel strength of longitudinal corner bars (MPa) R
fsu Interm.
Ultimate steel strength of longitudinal intermediate bars (MPa) R
fyt Yield stress of transverse reinforcement (MPa) R, S
fsu trans. Ultimate steel strength for transverse reinforcement(MPa) R, S
Column TypeDescription of Property
Longitudinal Reinforcement
Transverse Reinforcement
Material Notation
2.2 Column Geometry
The column database describes important geometric properties of each column. These
geometric properties and the corresponding notation are listed in Table 2.2. All rectangular-
reinforced columns had rectangular cross-sections, but the spiral-reinforced columns had three
cross-section shapes (octagonal, circular and square). These shapes were assigned the codes
listed in Table 2.3.

5
Table 2.2: Column Geometry
H or D Column Depth (mm) R, SB Column Width (mm) R
Area (Ag)Cross-sectional area of column (mm2)
R, S
L Length of equivalent cantilever (mm) R, S
Total # Bars Number of longitudinal reinforcing bars R, S
Bar Dia. Diameter of longitudinal reinforcement bars (mm) S
Bar Dia. Corner
Diameter of longitudinal corner bars (mm) R
Bar Dia. Interm.
Diameter of longitudinal intermediate bars (mm) R
Lsplice Length of longitudinal reinforcement splice R, S
Reinf. Ratio Longitudinal reinforcement ratio (calculated). R, S
Bar Dia. Diameter of transverse reinforcement (mm) R, S
Spacing Spacing of transverse reinforcement (mm) R, S
Vol. Trans Volumetric transverse reinforcement ratio (reported) R, S
Nv Number of transverse shear bars in cross section R, S
Clear Cover (Rect)
Distance from outer surface of column to outer edge of transverse reinforcement (mm)
R
Clear Cover (Spiral)
Distance from outer surface of column to center of transverse reinforcement (mm)
S
Column Type
Transverse Reinforcement
Longitudinal Reinforcement
Overall Column Dimensions
Notation Description
Table 2.3: Cross-Section Classifications
Notation Cross-Section
ShapeCode
O Octagonal 2C Circular 0S Square 3
6
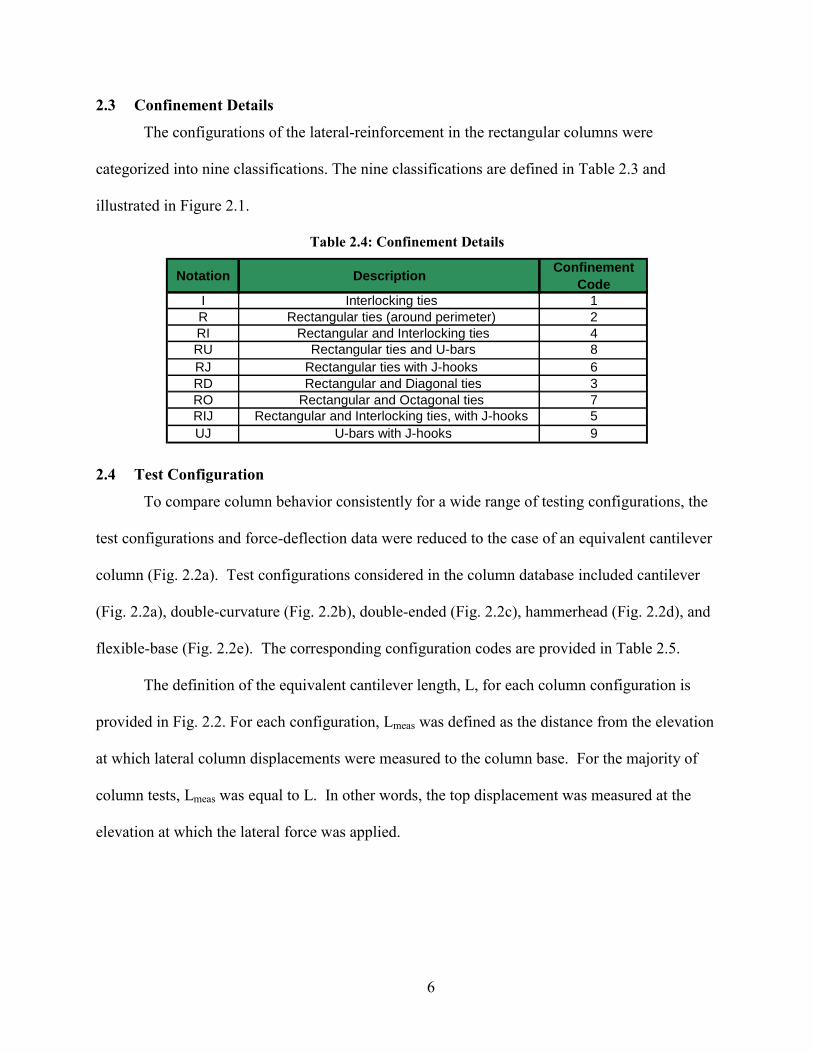
2.3 Confinement Details
The configurations of the lateral-reinforcement in the rectangular columns were
categorized into nine classifications. The nine classifications are defined in Table 2.3 and
illustrated in Figure 2.1.
Table 2.4: Confinement Details
Notation Description Confinement Code
I Interlocking ties 1R Rectangular ties (around perimeter) 2RI Rectangular and Interlocking ties 4RU Rectangular ties and U-bars 8RJ Rectangular ties with J-hooks 6RD Rectangular and Diagonal ties 3RO Rectangular and Octagonal ties 7RIJ Rectangular and Interlocking ties, with J-hooks 5UJ U-bars with J-hooks 9
2.4 Test Configuration
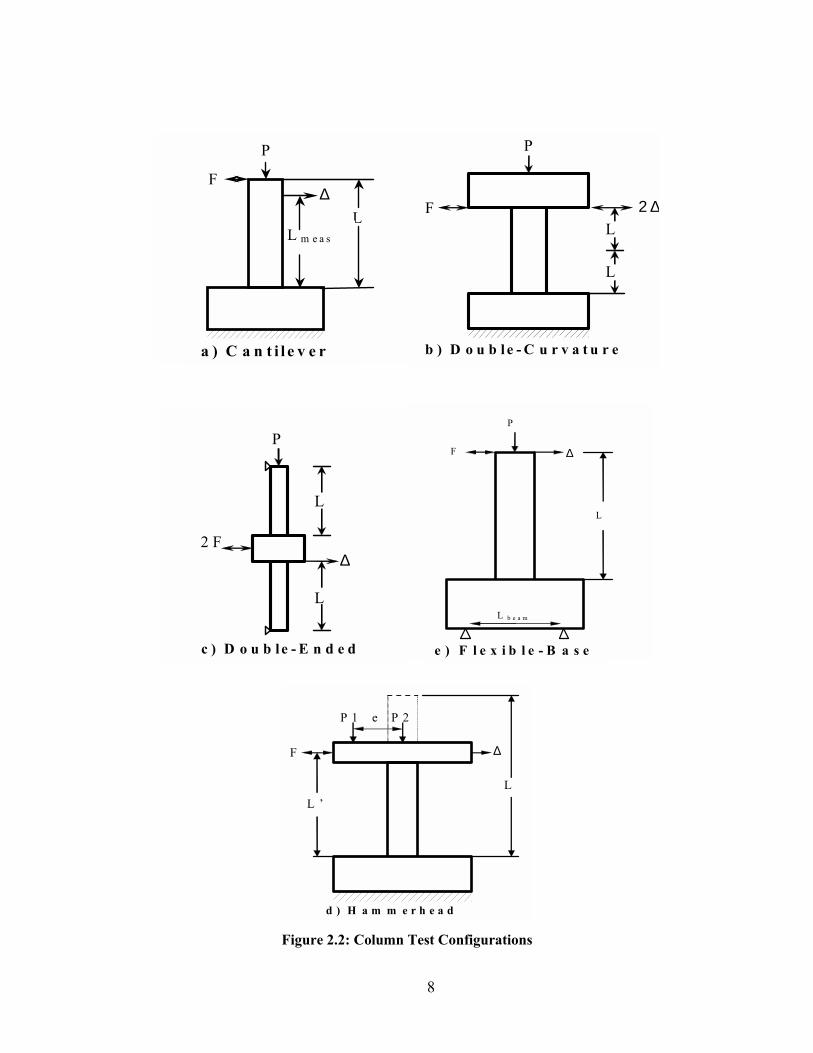
To compare column behavior consistently for a wide range of testing configurations, the
test configurations and force-deflection data were reduced to the case of an equivalent cantilever
column (Fig. 2.2a). Test configurations considered in the column database included cantilever
(Fig. 2.2a), double-curvature (Fig. 2.2b), double-ended (Fig. 2.2c), hammerhead (Fig. 2.2d), and
flexible-base (Fig. 2.2e). The corresponding configuration codes are provided in Table 2.5.
The definition of the equivalent cantilever length, L, for each column configuration is
provided in Fig. 2.2. For each configuration, Lmeas was defined as the distance from the elevation
at which lateral column displacements were measured to the column base. For the majority of
column tests, Lmeas was equal to L. In other words, the top displacement was measured at the
elevation at which the lateral force was applied.

7
Figure 2.1: Confinement Types
Table 2.5: Confinement Details
Description Confinement Code
Cantilever CDouble-Curvature DC
Double-Ended DEFlexible Base CFBHammerhead HH
8
P
F
LL m e a s
∆
a ) C a n t i l e v e r
F
P
L
L
2 ∆
b ) D o u b l e - C u r v a t u r e
2 F
P
L
L
∆
c ) D o u b le - E n d e d
L
P
F ∆
e ) F l e x i b l e - B a s e
L b e a m
L ’
F ∆
L
P 1 e P 2
d ) H a m m e r h e a d Figure 2.2: Column Test Configurations
9
Chapter 3: Test Results 3.1 Failure Classification
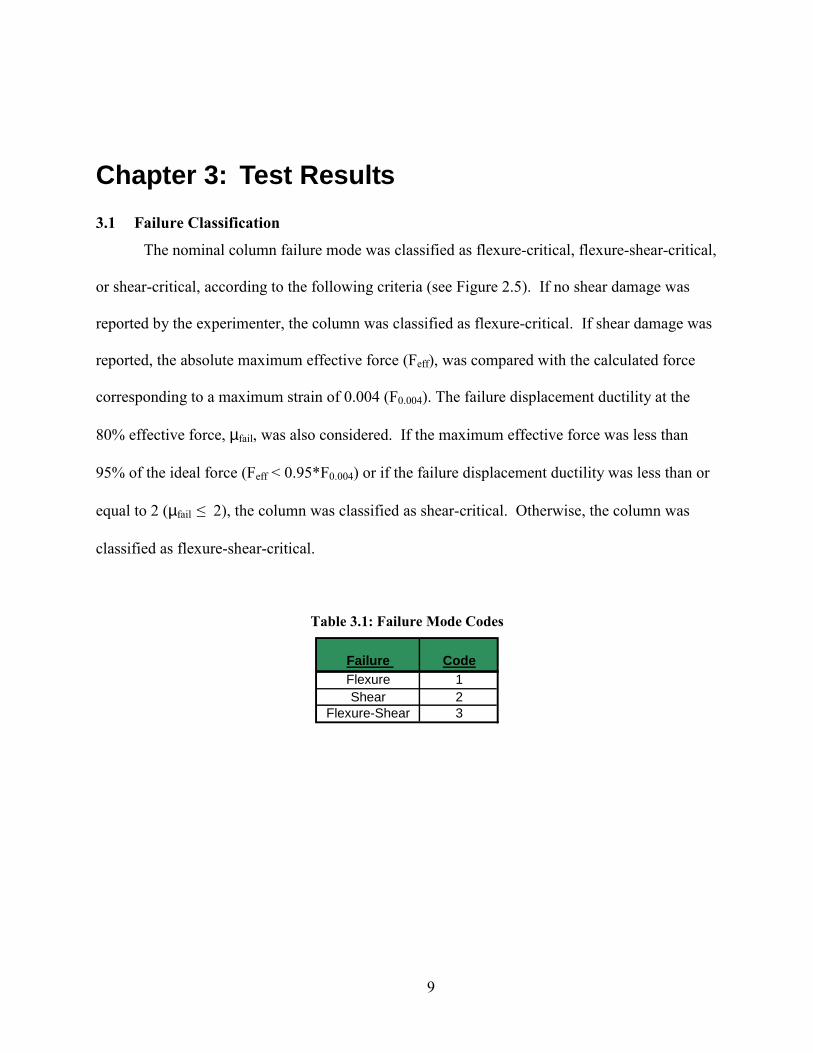
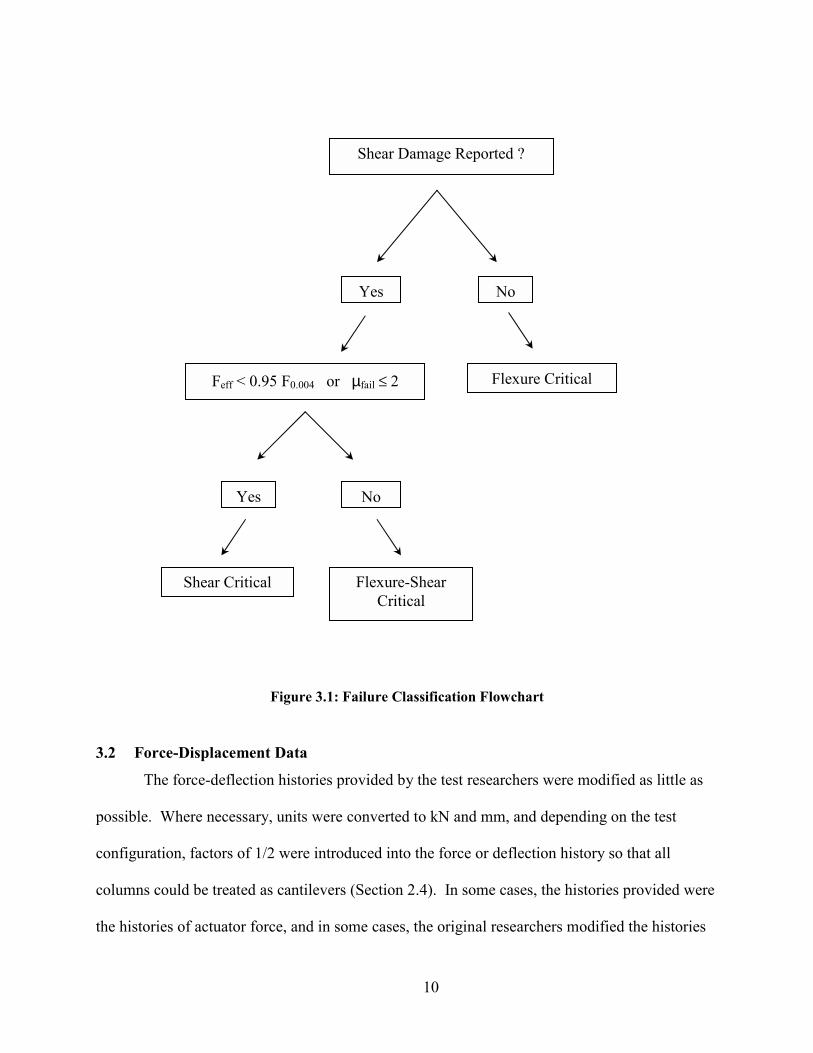
The nominal column failure mode was classified as flexure-critical, flexure-shear-critical,
or shear-critical, according to the following criteria (see Figure 2.5). If no shear damage was
reported by the experimenter, the column was classified as flexure-critical. If shear damage was
reported, the absolute maximum effective force (Feff), was compared with the calculated force
corresponding to a maximum strain of 0.004 (F0.004). The failure displacement ductility at the
80% effective force, µfail, was also considered. If the maximum effective force was less than
95% of the ideal force (Feff < 0.95*F0.004) or if the failure displacement ductility was less than or
equal to 2 (µfail ≤ 2), the column was classified as shear-critical. Otherwise, the column was
classified as flexure-shear-critical.
Table 3.1: Failure Mode Codes
Failure CodeFlexure 1Shear 2
Flexure-Shear 3
10
Figure 3.1: Failure Classification Flowchart
3.2 Force-Displacement Data
The force-deflection histories provided by the test researchers were modified as little as
possible. Where necessary, units were converted to kN and mm, and depending on the test
configuration, factors of 1/2 were introduced into the force or deflection history so that all
columns could be treated as cantilevers (Section 2.4). In some cases, the histories provided were
the histories of actuator force, and in some cases, the original researchers modified the histories
Shear Damage Reported ?
Flexure Critical Feff < 0.95 F0.004 or µfail ≤ 2
Flexure-Shear Critical
Shear Critical
Yes No
NoYes
11
to reflect P-∆ effects. These effects may be significant, particularly for tests with high axial
loads and large displacements.
The database provides force-displacement histories in tab-delimited (.txt) formats, which
can be imported into many applications. The first row of each lateral force-displacement file
contains the test name. The number of force-displacement data points is noted in the second
row. Subsequent rows contain top-displacement values (mm) in the first column, lateral-load
values (kN) in the second column, and where available, axial-load values in the third column
(kN). All transverse force-displacement histories are reported in terms of an equivalent
cantilever column, regardless of the test configuration (Section 2.4).
3.3 Effect of Axial Load
To account for P-∆ effects, column forces provided in the database need to be resolved
into their vertical and horizontal components. The vertical component can be approximated as P,
the axial load provided in the database. The horizontal component of the vertical actuator needs
to be added to (or subtracted from) the force applied by the horizontal actuator to obtain the net
horizontal force.
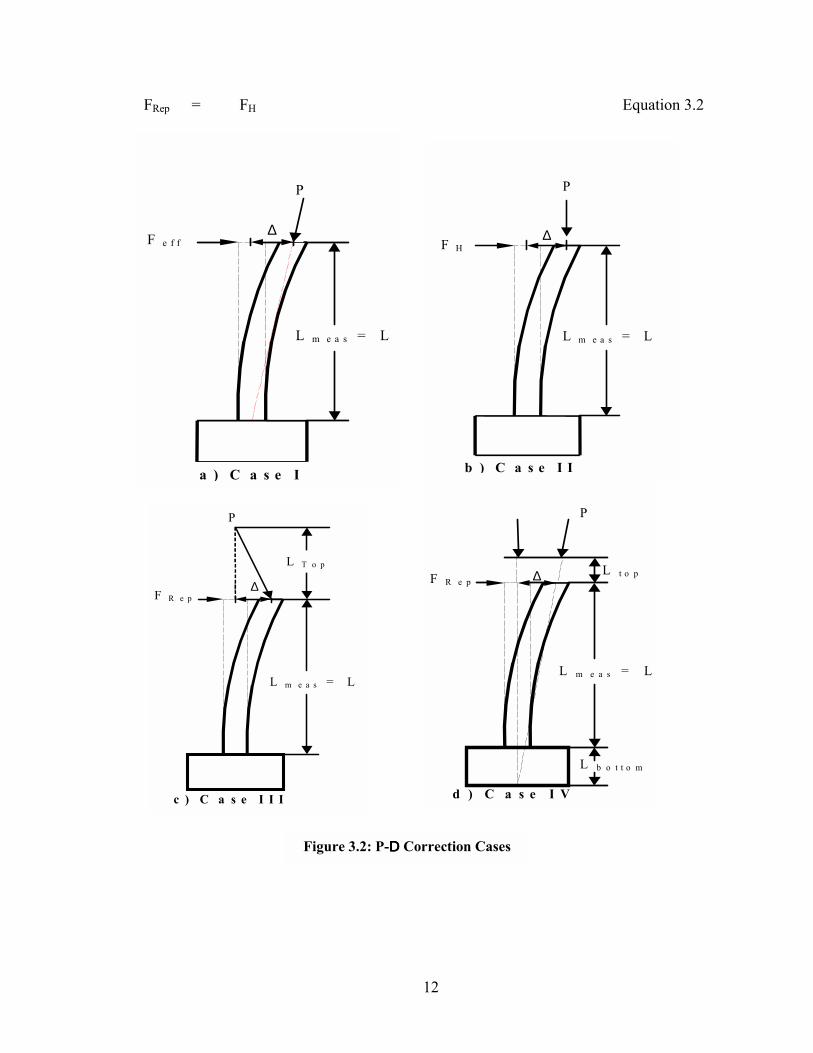
To allow researchers to take into account P-∆ effects, the database identifies four types of
lateral force-displacement histories (illustrated in Figure 3.2):
• Type I: Force-deflection data provided by the researcher was in the form of effective force
(Feff) versus deflection (∆) at Lmeas. In this case, the net horizontal force (FH) can be
determined according to the following equation:
FH = Feff - P ∆ / Lmeas Equation 3.1
• Type II: Force-deflection data was provided by the researcher in the form of net horizontal
force (FH) versus deflection (∆) at Lmeas.
12
FRep = FH Equation 3.2
P
F e f f ∆
L m e a s = L
a ) C a s e I
P
∆F H
L m e a s = L
b ) C a s e I I
P
F R e p ∆
L m e a s = L
L b o t t o m
L t o p
d ) C a s e I V
P
F R e p ∆
L m e a s = L
L T o p
c ) C a s e I I I
Figure 3.2: P-DDDD Correction Cases
13
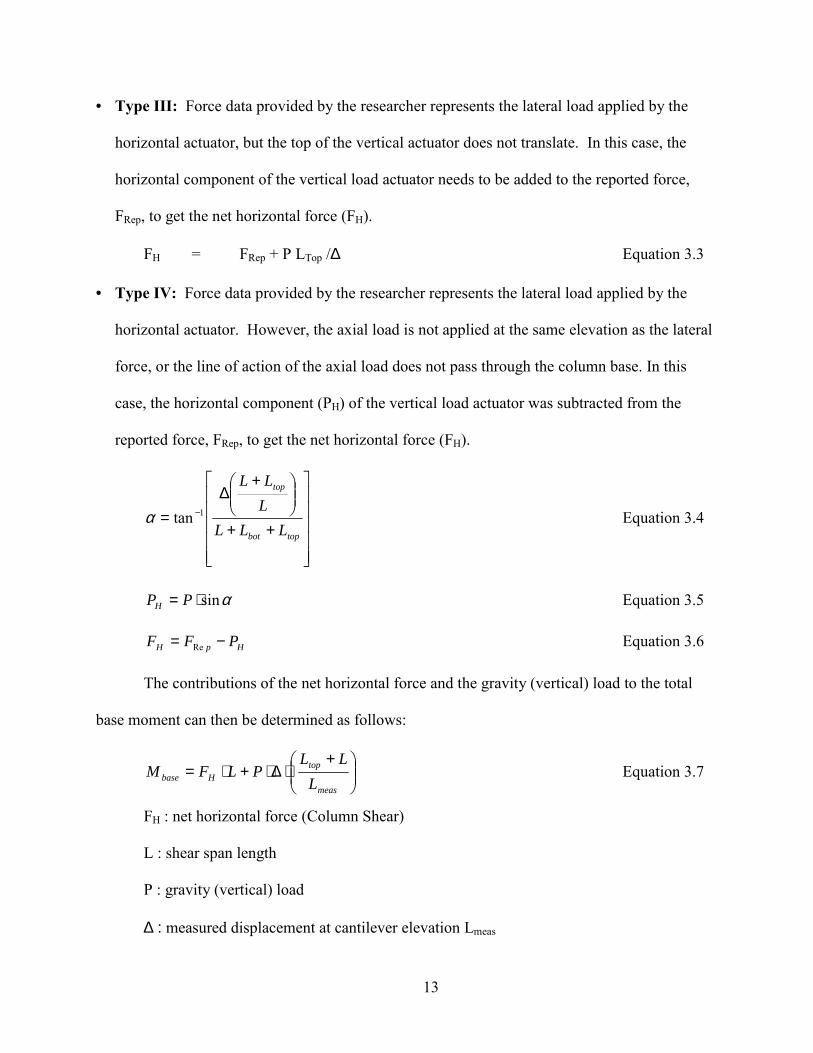
• Type III: Force data provided by the researcher represents the lateral load applied by the
horizontal actuator, but the top of the vertical actuator does not translate. In this case, the
horizontal component of the vertical load actuator needs to be added to the reported force,
FRep, to get the net horizontal force (FH).
FH = FRep + P LTop /∆ Equation 3.3
• Type IV: Force data provided by the researcher represents the lateral load applied by the
horizontal actuator. However, the axial load is not applied at the same elevation as the lateral
force, or the line of action of the axial load does not pass through the column base. In this
case, the horizontal component (PH) of the vertical load actuator was subtracted from the
reported force, FRep, to get the net horizontal force (FH).
++
+∆
= −
topbot
top
LLLLLL
1tanα Equation 3.4
αsin⋅= PPH Equation 3.5
HpH PFF −= Re Equation 3.6
The contributions of the net horizontal force and the gravity (vertical) load to the total
base moment can then be determined as follows:
+⋅∆⋅+⋅=
meas
topHbase L
LLPLFM Equation 3.7
FH : net horizontal force (Column Shear)
L : shear span length
P : gravity (vertical) load
∆ : measured displacement at cantilever elevation Lmeas
14
Ltop : distance from elevation at which lateral force was applied to elevation at which
gravity (vertical) load is applied.
Lmeas : elevation at which lateral column displacement was measured
The effective force can then be defined as:
Feff = Mbase /L Equation 3.8
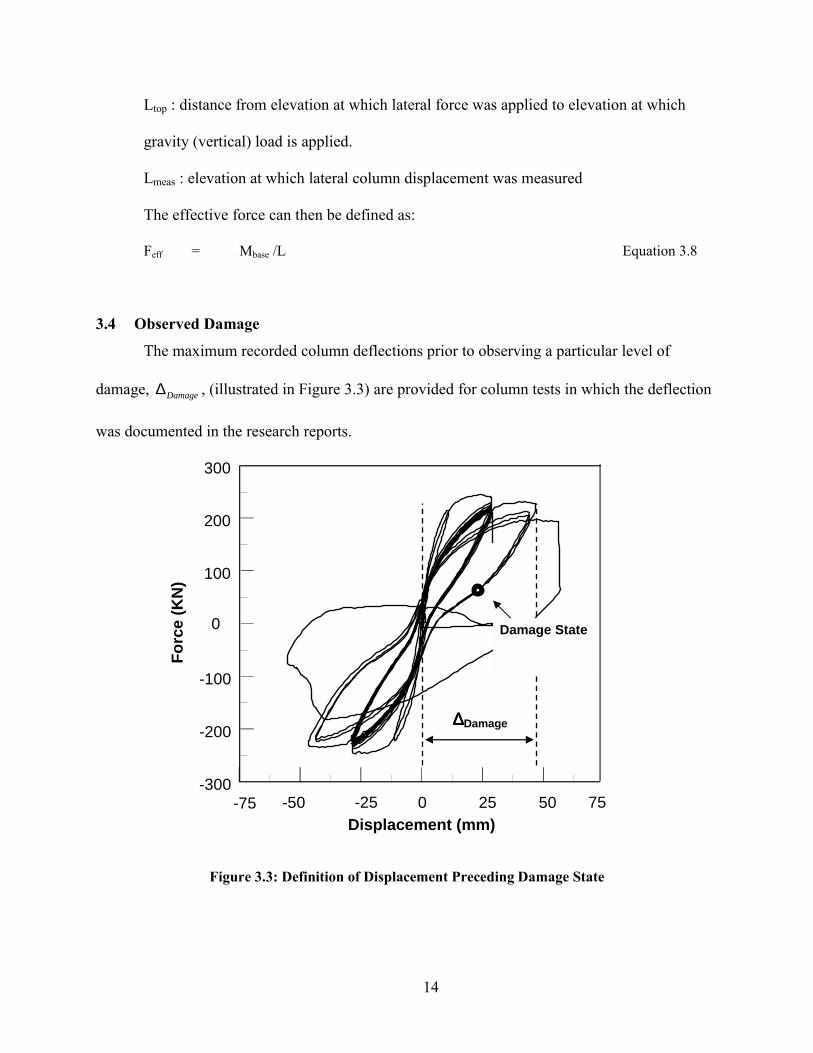
3.4 Observed Damage
The maximum recorded column deflections prior to observing a particular level of
damage, Damage∆ , (illustrated in Figure 3.3) are provided for column tests in which the deflection
was documented in the research reports.
Figure 3.3: Definition of Displacement Preceding Damage State
-75 -50 -25 0 25 50 75 -300
-200
-100
0
100
200
300
∆∆∆∆Damage
Damage State
Forc
e (K
N)
Displacement (mm)

15
The damage deformations, Damage∆ , are provided for the seven damage states defined
below. Not all damage levels were reported for each test.
• Onset of spalling, defined as the first observation of spalling.
• Onset of significant spalling, defined by the reported observation of “significant spalling”
or “considerable spalling.” Alternatively, if spall heights could be determined, significant
spalling was defined as a spall height equal to at least 10% of the cross-section depth.
• Onset of bar buckling, defined as the observation of the first sign of longitudinal bar
buckling.
• Longitudinal bar fracture, defined as the observation of the first sign of a longitudinal bar
fracturing.
• Transverse reinforcement fracture, defined as the observation of the first sign of the
transverse reinforcement fracturing, or becoming untied.
• Loss of axial-load capacity, defined as the observation of loss of axial-load carrying
capacity of the column.
• Column failure (reported for 49 tests), defined for the purpose of this database, as the first
occurrence of one of the following events: buckling of a longitudinal bar, fracture of
transverse reinforcement, fracture of a longitudinal bar, or loss of axial-load capacity.
16
Chapter 4: Characteristics of Available Data The data available in the PEER structural performance database is summarized in this
chapter. The distributions of key column properties (depth, aspect ratio, axial-load ratio,
longitudinal reinforcement ratio and transverse reinforcement ratio) are examined for both
rectangular-reinforced and spiral-reinforced columns. In addition, the chapter provides a list of
the 404 tests included in the database (as of January 2004), along with comments and key test
results (e.g., maximum moment and shear resisted by the column). The chapter also reports the
nominal moment capacity of the columns.
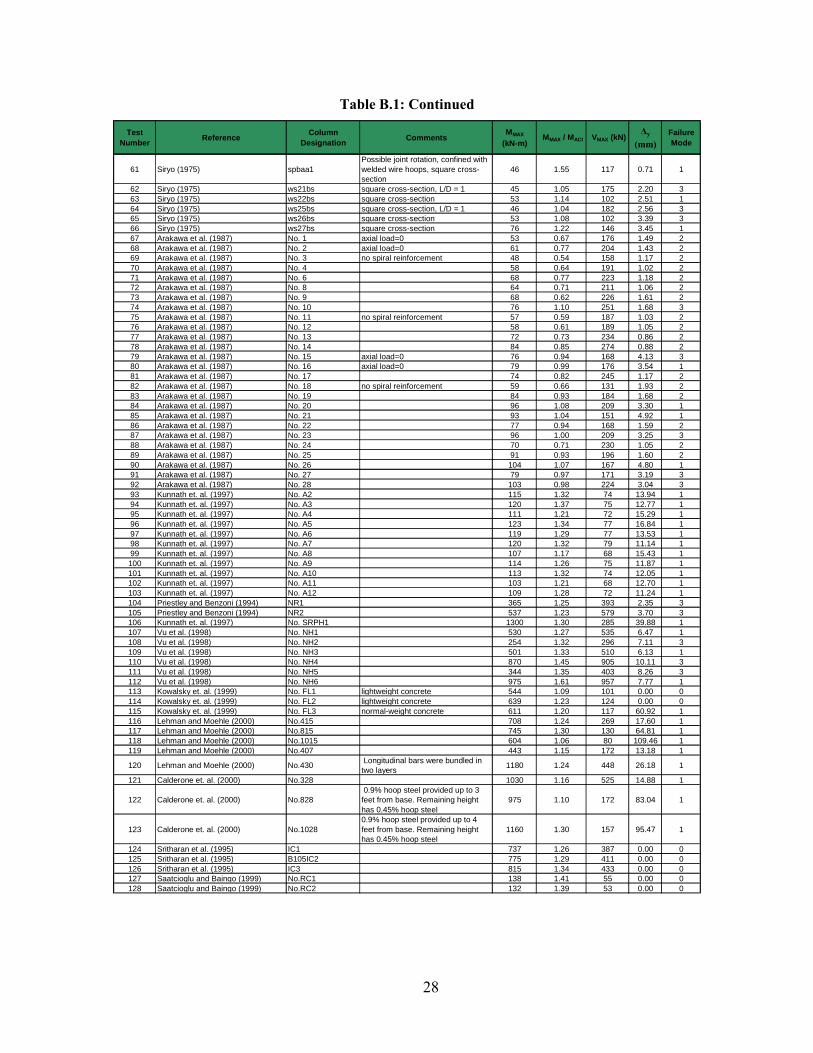
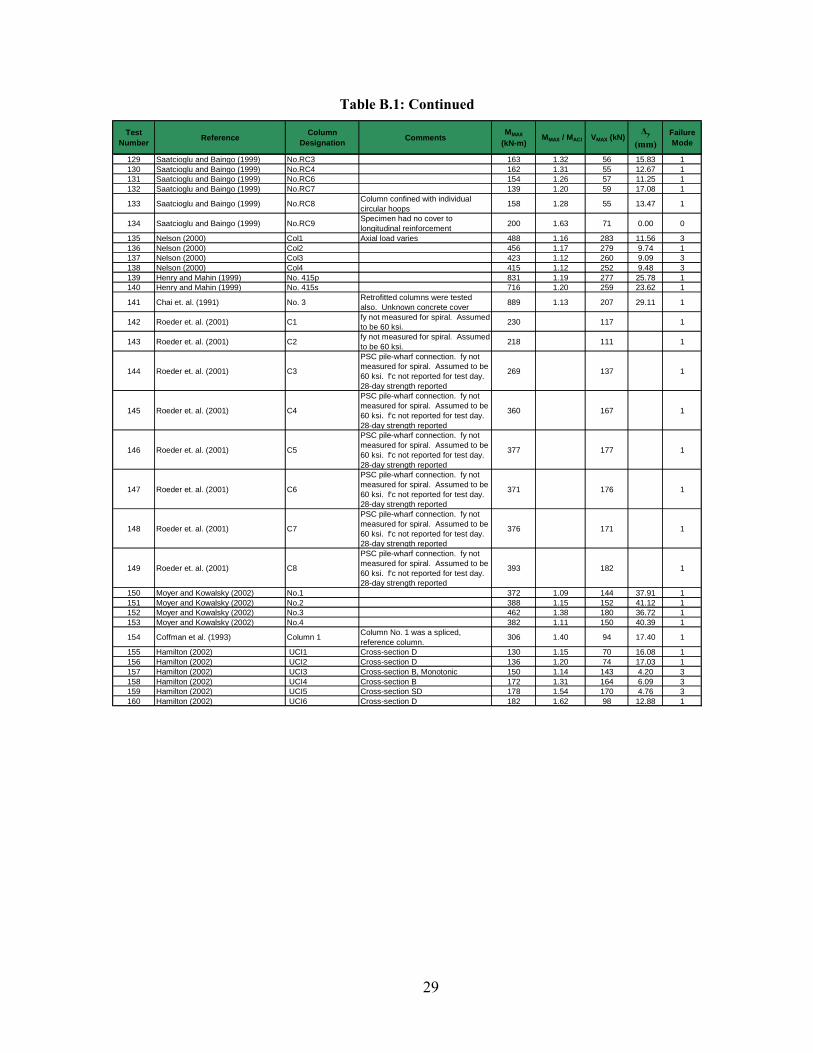
The tests included in the PEER database are listed in Appendices A and B. The
appendices also include (for each column test) comments about the data, the maximum moment
and shear resisted by the column, the ratio of measured maximum moment to the nominal ACI
moment (ACI 318-02), the ideal yield displacement as described by Berry (2003), and the failure
classification (Chapter 3.1). References for each column test are provided in Appendix D.
4.1 Distribution of Key Column Properties
Table 4.1 provides the means and coefficients of variations (CoV) of key column
properties for 274 rectangular-reinforced columns and 160 spiral-reinforced columns. Statistics
are provided for the column depth, aspect ratio, axial-load ratio, longitudinal reinforcement ratio
(ρl) and transverse reinforcement ratio (ρs).
17
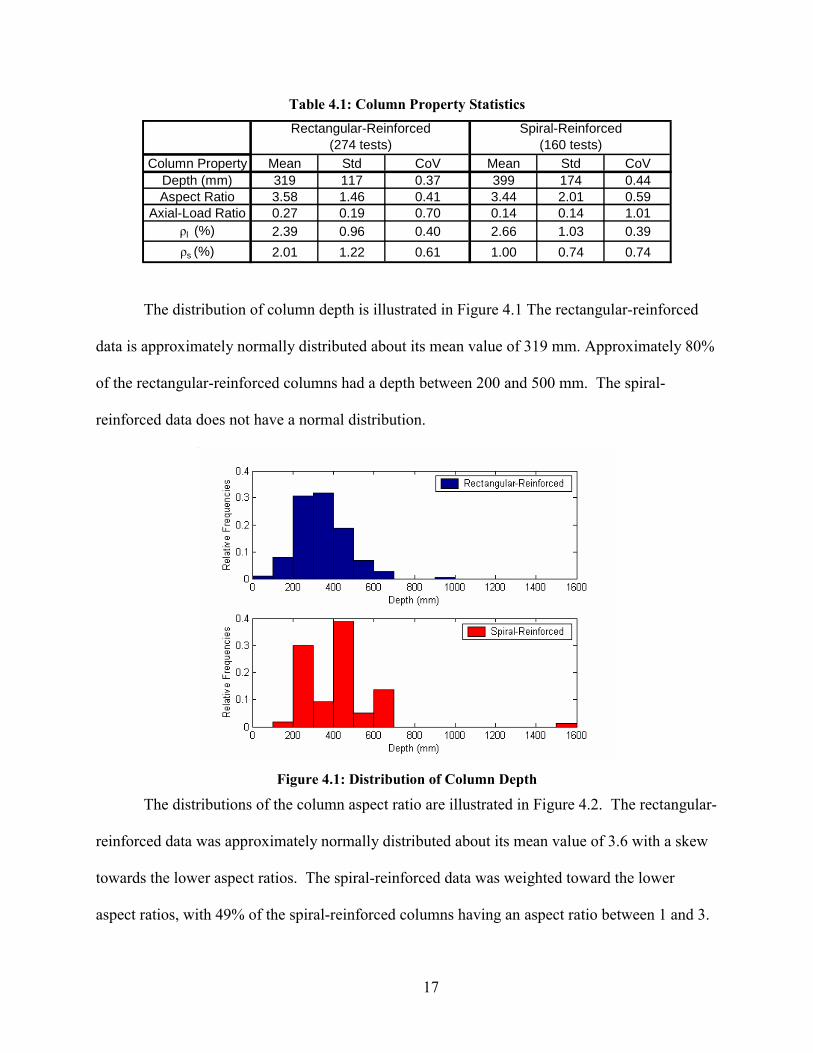
Table 4.1: Column Property Statistics
Column Property Mean Std CoV Mean Std CoVDepth (mm) 319 117 0.37 399 174 0.44Aspect Ratio 3.58 1.46 0.41 3.44 2.01 0.59
Axial-Load Ratio 0.27 0.19 0.70 0.14 0.14 1.01ρl (%) 2.39 0.96 0.40 2.66 1.03 0.39ρs (%) 2.01 1.22 0.61 1.00 0.74 0.74
Rectangular-Reinforced (274 tests)
Spiral-Reinforced (160 tests)
The distribution of column depth is illustrated in Figure 4.1 The rectangular-reinforced
data is approximately normally distributed about its mean value of 319 mm. Approximately 80%
of the rectangular-reinforced columns had a depth between 200 and 500 mm. The spiral-
reinforced data does not have a normal distribution.
Figure 4.1: Distribution of Column Depth
The distributions of the column aspect ratio are illustrated in Figure 4.2. The rectangular-
reinforced data was approximately normally distributed about its mean value of 3.6 with a skew
towards the lower aspect ratios. The spiral-reinforced data was weighted toward the lower
aspect ratios, with 49% of the spiral-reinforced columns having an aspect ratio between 1 and 3.

18
Figure 4.2: Distribution of Column Aspect Ratio
The distributions of the axial-load ratio are illustrated in Figure 4.3. Both the
rectangular-reinforced and spiral-reinforced columns had distributions weighted towards the
lower axial-loads ratios. In particular 65% of the rectangular-reinforced and 85% of the spiral-
reinforced columns had an axial load between 0 and 0.3.
Figure 4.3: Distribution of Axial-Load Ratio
19
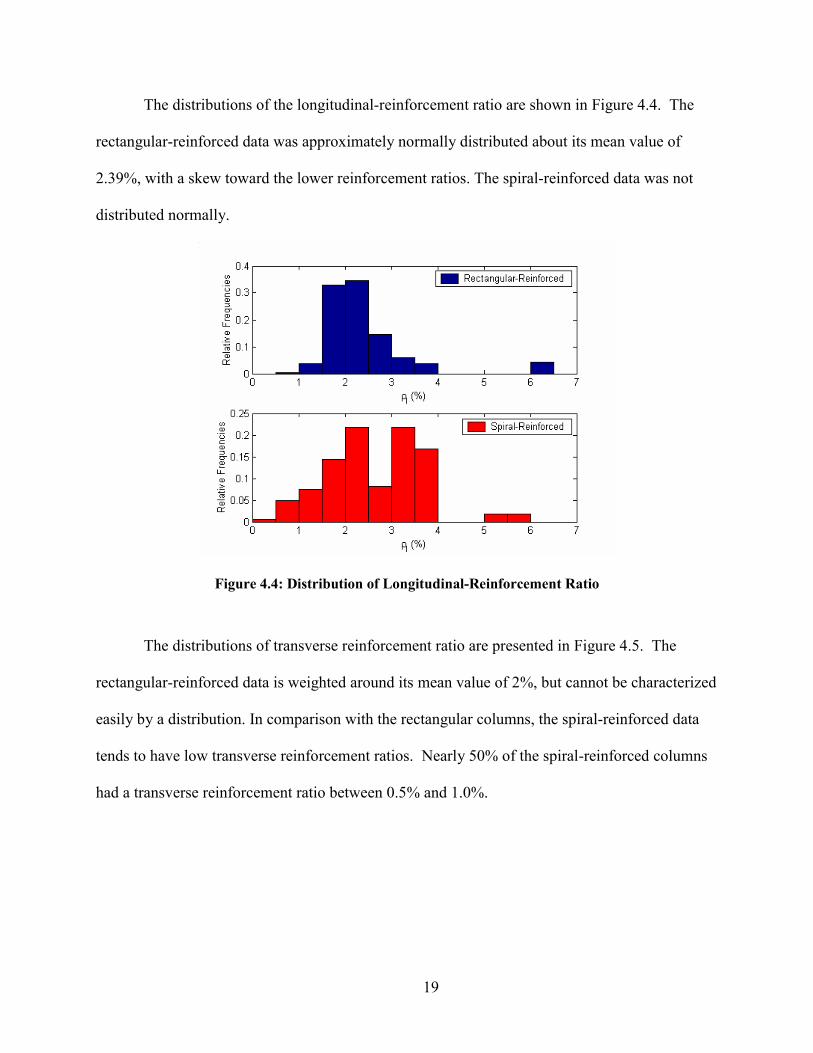
The distributions of the longitudinal-reinforcement ratio are shown in Figure 4.4. The
rectangular-reinforced data was approximately normally distributed about its mean value of
2.39%, with a skew toward the lower reinforcement ratios. The spiral-reinforced data was not
distributed normally.
Figure 4.4: Distribution of Longitudinal-Reinforcement Ratio
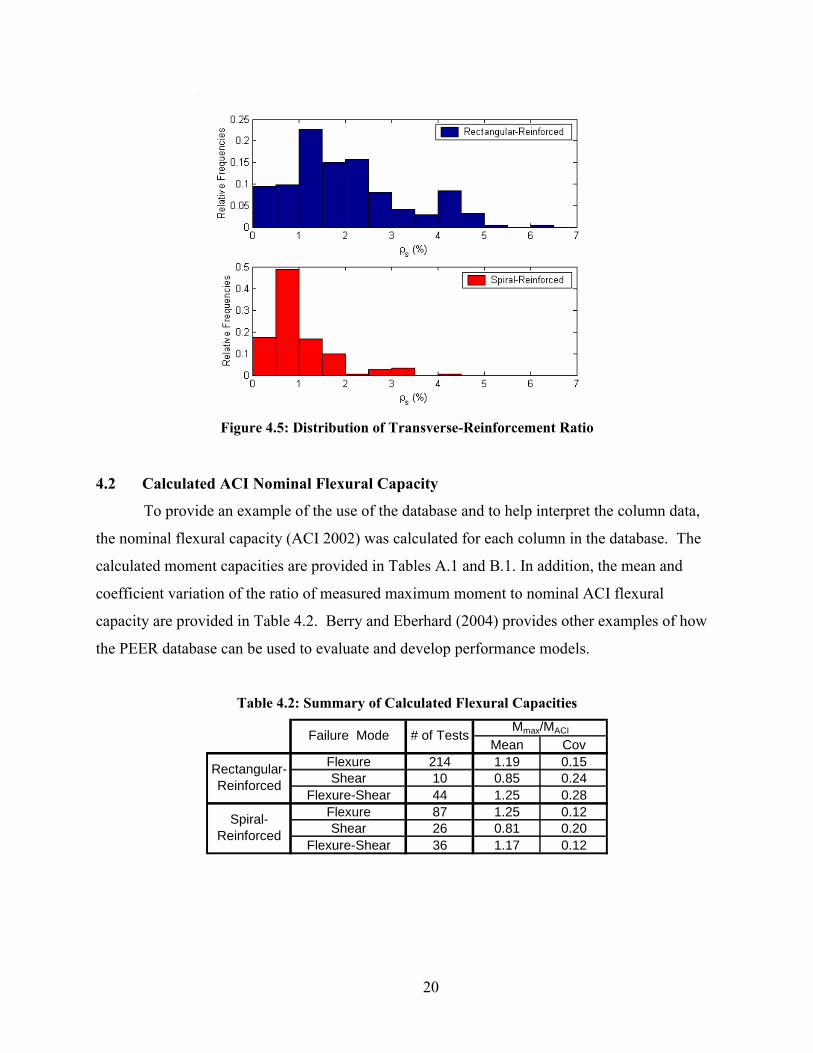
The distributions of transverse reinforcement ratio are presented in Figure 4.5. The
rectangular-reinforced data is weighted around its mean value of 2%, but cannot be characterized
easily by a distribution. In comparison with the rectangular columns, the spiral-reinforced data
tends to have low transverse reinforcement ratios. Nearly 50% of the spiral-reinforced columns
had a transverse reinforcement ratio between 0.5% and 1.0%.
20
Figure 4.5: Distribution of Transverse-Reinforcement Ratio
4.2 Calculated ACI Nominal Flexural Capacity
To provide an example of the use of the database and to help interpret the column data,
the nominal flexural capacity (ACI 2002) was calculated for each column in the database. The
calculated moment capacities are provided in Tables A.1 and B.1. In addition, the mean and
coefficient variation of the ratio of measured maximum moment to nominal ACI flexural
capacity are provided in Table 4.2. Berry and Eberhard (2004) provides other examples of how
the PEER database can be used to evaluate and develop performance models.
Table 4.2: Summary of Calculated Flexural Capacities
Mean CovFlexure 214 1.19 0.15Shear 10 0.85 0.24
Flexure-Shear 44 1.25 0.28Flexure 87 1.25 0.12Shear 26 0.81 0.20
Flexure-Shear 36 1.17 0.12
Mmax/MACI
Rectangular-Reinforced
Spiral-Reinforced
Failure Mode # of Tests
21
References American Concrete Institute (ACI 318-02), “Building Code Requirements for Structural
Concrete”, 2002.
Berry, M. P., and Eberhard, M. O. (2004). “A Practical Performance Model for Bar Buckling.” J. Struct. Eng., under review.
Berry, M. P., and Eberhard, M. O. (2003). “Performance Models for Flexural Damage in Reinforced Concrete Columns.” Pacific Earthquake Engineering Research Center Report 2003/??, University of California, Berkeley, California.
Camarillo, H. (2003). “Evaluation of Shear Strength Methodologies for Reinforced Concrete Columns.” Master’s Thesis, Dept. of Civil and Environmental Engineering, University of Washington, Seattle.
Mookerjee, A. (1999). “Reliability of Performance Estimates of Spiral and Hoop-Reinforced Concrete Columns.” Master’s Thesis, Dept. of Civil and Environmental Engineering, University of Washington, Seattle.
Parrish, M. (2001). “Accuracy of Seismic Performance Methodologies for Rectangular Reinforced Concrete Columns.” Master’s Thesis, Dept. of Civil and Environmental Engineering, University of Washington, Seattle.
Taylor, A.W., Kuo, C., Wellenius, K. and Chung, D. (1997). A Summary of Cyclic Lateral-Load Tests on Rectangular Reinforced Concrete Columns, National Institute of Standards and Technology, Report NISTIR 5984.
Taylor, A.W. and Stone, W.C. (1993). A Summary of Cyclic Lateral-Load Tests of Spiral Reinforced Concrete Columns, National Institute of Standards and Technology, Report NISTIR 5285.
22
Appendix A: Summary of Tests of Rectangular-Reinforced Columns
This appendix provides a brief summary of the reinforced concrete column tests
described by the PEER Structural Performance Database. The maximum column moment
(Mmax) listed in Tables A.1 and B.1, was computed from the test data, including P-∆ effects. The
ACI nominal flexural capacity (MACI) was calculated following the provisions of ACI’s Building
Code Requirements for Structural Concrete (ACI 318-02). The nominal displacement at yield
was computed following the procedure described by Berry and Eberhard (2003). The failure
mode was defined in Chapter 3.1 (Table 3.1).

23
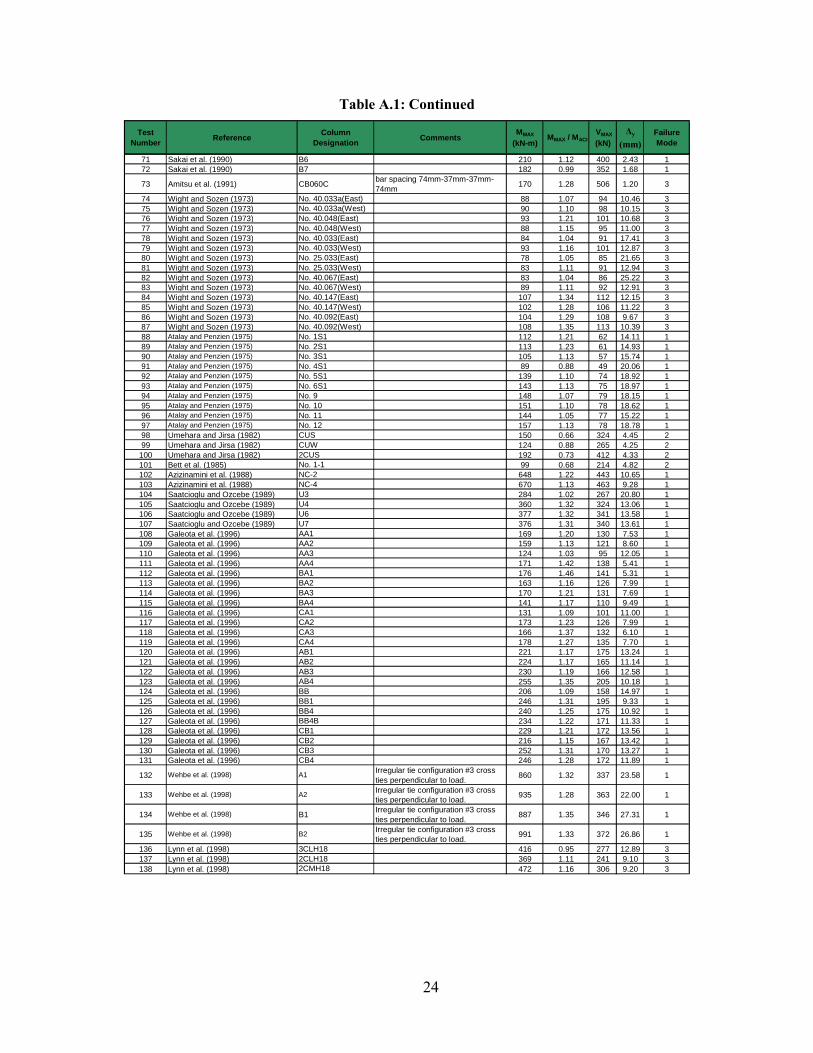
Table A.1: Summary of Tests of Rectangular-Reinforced Columns
Test Number Reference Column
Designation CommentsMMAX
(kN-m) MMAX / MACI
VMAX
(kN) ∆y
(mm)Failure Mode
1 Gill et al. (1979) No. 1 838 1.22 657 7.12 12 Gill et al. (1979) No. 2 953 1.05 764 7.13 13 Gill et al. (1979) No. 3 817 1.20 642 4.85 14 Gill et al. (1979) No. 4 903 1.44 697 4.09 15 Ghee et al. (1981) No. 3 bar spacing 120mm-75mm-120mm 337 1.24 192 9.61 16 Ghee et al. (1981) No. 4 bar spacing 120mm-75mm-120mm 298 1.14 169 12.19 17 Soesian. et al. (1986) No. 1 354 1.17 200 10.36 18 Soesian. et al. (1986) No. 2 481 1.18 279 9.16 19 Soesian. et al. (1986) No. 3 474 1.17 277 8.77 1
10 Soesian. et al. (1986) No. 4 457 1.19 265 9.59 111 Zahn et al. (1986) No. 7 398 1.35 213 11.88 112 Zahn et al. (1986) No. 8 554 1.44 269 10.27 113 Watson and Park (1989) No. 5 535 1.42 292 8.09 114 Watson and Park (1989) No. 6 528 1.41 295 6.19 115 Watson and Park (1989) No. 7 525 1.75 293 4.02 116 Watson and Park (1989) No. 8 523 1.81 295 4.16 117 Watson and Park (1989) No. 9 602 2.08 310 4.76 1
18 Tanaka and Park (1990) No. 1 Transverse reinforcement hoops were welded 290 1.14 167 13.81 1
19 Tanaka and Park (1990) No. 2 291 1.14 168 13.04 120 Tanaka and Park (1990) No. 3 302 1.18 175 11.37 121 Tanaka and Park (1990) No. 4 292 1.15 170 12.35 122 Tanaka and Park (1990) No. 5 704 1.15 386 13.55 123 Tanaka and Park (1990) No. 6 717 1.17 409 11.96 124 Tanaka and Park (1990) No. 7 1070 1.34 588 9.68 125 Tanaka and Park (1990) No. 8 1090 1.36 619 8.39 126 Park and Paulay (1990) No. 9 727 1.21 393 10.71 127 Arakawa et al. (1982) No. 102 flexible support 60 1.15 153 3.78 128 Nagasaka (1982) HPRC10-63 cover scaled from drawing 27 1.02 87 2.74 329 Nagasaka (1982) HPRC19-32 cover scaled from drawing 34 1.08 111 1.94 330 Ohno and Nishioka (1984) L1 cover scaled from drawing 201 1.30 119 9.49 131 Ohno and Nishioka (1984) L2 cover scaled from drawing 186 1.20 111 9.05 132 Ohno and Nishioka (1984) L3 cover scaled from drawing 172 1.11 104 9.79 1
33 Ohue et al. (1985) 2D16RS cover scaled from drawing, splitting-bond failure 41 1.08 98 4.55 3
34 Ohue et al. (1985) 4D13RS cover scaled from drawing, splitting-bond failure 44 1.01 108 4.59 3
35 Zhou et al. (1985) No. 806 L = 80mm, L/H = 1 3 1.18 27 2.15 336 Zhou et al. (1985) No. 1007 L = 80mm, L/H = 1 3 1.54 31 1.88 337 Zhou et al. (1985) No. 1309 L = 80mm, L/H = 1 2 2.78 23 1.19 338 Imai and Yamamoto (1986) No. 1 cover scaled from drawing 392 0.95 471 4.16 339 Zhou et al. (1987) No.104-08 13 1.15 79 0.84 240 Zhou et al. (1987) No. 114-08 rectangular spiraled ties 15 1.27 87 1.31 241 Zhou et al. (1987) No. 124-08 rectangular spiraled ties 18 1.59 108 1.88 342 Zhou et al. (1987) No. 204-08 21 1.79 65 0.71 343 Zhou et al. (1987) No. 214-08 rectangular spiraled ties 20 1.71 59 1.55 144 Zhou et al. (1987) No. 223-09 rectangular spiraled ties 22 2.22 59 1.39 345 Zhou et al. (1987) No. 302-07 25 1.55 48 1.68 346 Zhou et al. (1987) No. 312-07 rectangular spiraled ties 26 1.66 51 1.38 347 Zhou et al. (1987) No. 322-07 rectangular spiraled ties 25 1.57 48 2.61 348 Kanda et al. (1987) 85STC-1 60 1.20 76 4.38 149 Kanda et al. (1987) 85STC-2 62 1.26 80 3.74 150 Kanda et al. (1987) 85STC-3 60 1.20 76 4.38 151 Kanda et al. (1987) 85PDC-1 66 1.33 85 3.82 152 Kanda et al. (1987) 85PDC-2 59 1.19 75 4.02 153 Kanda et al. (1987) 85PDC-3 59 1.19 75 4.25 154 Arakawa et al. (1989) OA2 29 0.86 129 1.33 255 Arakawa et al. (1989) OA5 30 0.80 132 0.73 256 Muguruma et al. (1989) AL-1 132 1.35 239 2.51 157 Muguruma et al. (1989) AH-1 154 1.58 244 2.61 158 Muguruma et al. (1989) AL-2 137 1.63 242 1.92 159 Muguruma et al. (1989) AH-2 161 1.91 247 1.78 160 Muguruma et al. (1989) BL-1 136 1.16 241 2.89 161 Muguruma et al. (1989) BH-1 147 1.26 246 2.78 162 Muguruma et al. (1989) BL-2 161 1.32 283 2.36 163 Muguruma et al. (1989) BH-2 173 1.42 288 2.37 164 Ono et al. (1989) CA025C 40 1.13 130 2.13 365 Ono et al. (1989) CA060C 42 1.32 134 1.10 366 Sakai et al. (1990) B1 196 1.04 375 2.42 167 Sakai et al. (1990) B2 203 1.08 371 2.28 168 Sakai et al. (1990) B3 214 1.14 406 2.52 169 Sakai et al. (1990) B4 195 1.04 375 2.46 170 Sakai et al. (1990) B5 203 1.08 387 2.24 1
24
Table A.1: Continued
Test Number Reference Column
Designation CommentsMMAX
(kN-m) MMAX / MACI
VMAX
(kN) ∆y
(mm)Failure Mode
71 Sakai et al. (1990) B6 210 1.12 400 2.43 172 Sakai et al. (1990) B7 182 0.99 352 1.68 1
73 Amitsu et al. (1991) CB060C bar spacing 74mm-37mm-37mm-74mm 170 1.28 506 1.20 3
74 Wight and Sozen (1973) No. 40.033a(East) 88 1.07 94 10.46 375 Wight and Sozen (1973) No. 40.033a(West) 90 1.10 98 10.15 376 Wight and Sozen (1973) No. 40.048(East) 93 1.21 101 10.68 377 Wight and Sozen (1973) No. 40.048(West) 88 1.15 95 11.00 378 Wight and Sozen (1973) No. 40.033(East) 84 1.04 91 17.41 379 Wight and Sozen (1973) No. 40.033(West) 93 1.16 101 12.87 380 Wight and Sozen (1973) No. 25.033(East) 78 1.05 85 21.65 381 Wight and Sozen (1973) No. 25.033(West) 83 1.11 91 12.94 382 Wight and Sozen (1973) No. 40.067(East) 83 1.04 86 25.22 383 Wight and Sozen (1973) No. 40.067(West) 89 1.11 92 12.91 384 Wight and Sozen (1973) No. 40.147(East) 107 1.34 112 12.15 385 Wight and Sozen (1973) No. 40.147(West) 102 1.28 106 11.22 386 Wight and Sozen (1973) No. 40.092(East) 104 1.29 108 9.67 387 Wight and Sozen (1973) No. 40.092(West) 108 1.35 113 10.39 388 Atalay and Penzien (1975) No. 1S1 112 1.21 62 14.11 189 Atalay and Penzien (1975) No. 2S1 113 1.23 61 14.93 190 Atalay and Penzien (1975) No. 3S1 105 1.13 57 15.74 191 Atalay and Penzien (1975) No. 4S1 89 0.88 49 20.06 192 Atalay and Penzien (1975) No. 5S1 139 1.10 74 18.92 193 Atalay and Penzien (1975) No. 6S1 143 1.13 75 18.97 194 Atalay and Penzien (1975) No. 9 148 1.07 79 18.15 195 Atalay and Penzien (1975) No. 10 151 1.10 78 18.62 196 Atalay and Penzien (1975) No. 11 144 1.05 77 15.22 197 Atalay and Penzien (1975) No. 12 157 1.13 78 18.78 198 Umehara and Jirsa (1982) CUS 150 0.66 324 4.45 299 Umehara and Jirsa (1982) CUW 124 0.88 265 4.25 2
100 Umehara and Jirsa (1982) 2CUS 192 0.73 412 4.33 2101 Bett et al. (1985) No. 1-1 99 0.68 214 4.82 2102 Azizinamini et al. (1988) NC-2 648 1.22 443 10.65 1103 Azizinamini et al. (1988) NC-4 670 1.13 463 9.28 1104 Saatcioglu and Ozcebe (1989) U3 284 1.02 267 20.80 1105 Saatcioglu and Ozcebe (1989) U4 360 1.32 324 13.06 1106 Saatcioglu and Ozcebe (1989) U6 377 1.32 341 13.58 1107 Saatcioglu and Ozcebe (1989) U7 376 1.31 340 13.61 1108 Galeota et al. (1996) AA1 169 1.20 130 7.53 1109 Galeota et al. (1996) AA2 159 1.13 121 8.60 1110 Galeota et al. (1996) AA3 124 1.03 95 12.05 1111 Galeota et al. (1996) AA4 171 1.42 138 5.41 1112 Galeota et al. (1996) BA1 176 1.46 141 5.31 1113 Galeota et al. (1996) BA2 163 1.16 126 7.99 1114 Galeota et al. (1996) BA3 170 1.21 131 7.69 1115 Galeota et al. (1996) BA4 141 1.17 110 9.49 1116 Galeota et al. (1996) CA1 131 1.09 101 11.00 1117 Galeota et al. (1996) CA2 173 1.23 126 7.99 1118 Galeota et al. (1996) CA3 166 1.37 132 6.10 1119 Galeota et al. (1996) CA4 178 1.27 135 7.70 1120 Galeota et al. (1996) AB1 221 1.17 175 13.24 1121 Galeota et al. (1996) AB2 224 1.17 165 11.14 1122 Galeota et al. (1996) AB3 230 1.19 166 12.58 1123 Galeota et al. (1996) AB4 255 1.35 205 10.18 1124 Galeota et al. (1996) BB 206 1.09 158 14.97 1125 Galeota et al. (1996) BB1 246 1.31 195 9.33 1126 Galeota et al. (1996) BB4 240 1.25 175 10.92 1127 Galeota et al. (1996) BB4B 234 1.22 171 11.33 1128 Galeota et al. (1996) CB1 229 1.21 172 13.56 1129 Galeota et al. (1996) CB2 216 1.15 167 13.42 1130 Galeota et al. (1996) CB3 252 1.31 170 13.27 1131 Galeota et al. (1996) CB4 246 1.28 172 11.89 1
132 Wehbe et al. (1998) A1 Irregular tie configuration #3 cross ties perpendicular to load. 860 1.32 337 23.58 1
133 Wehbe et al. (1998) A2 Irregular tie configuration #3 cross ties perpendicular to load. 935 1.28 363 22.00 1
134 Wehbe et al. (1998) B1 Irregular tie configuration #3 cross ties perpendicular to load. 887 1.35 346 27.31 1
135 Wehbe et al. (1998) B2 Irregular tie configuration #3 cross ties perpendicular to load. 991 1.33 372 26.86 1
136 Lynn et al. (1998) 3CLH18 416 0.95 277 12.89 3137 Lynn et al. (1998) 2CLH18 369 1.11 241 9.10 3138 Lynn et al. (1998) 2CMH18 472 1.16 306 9.20 3

25
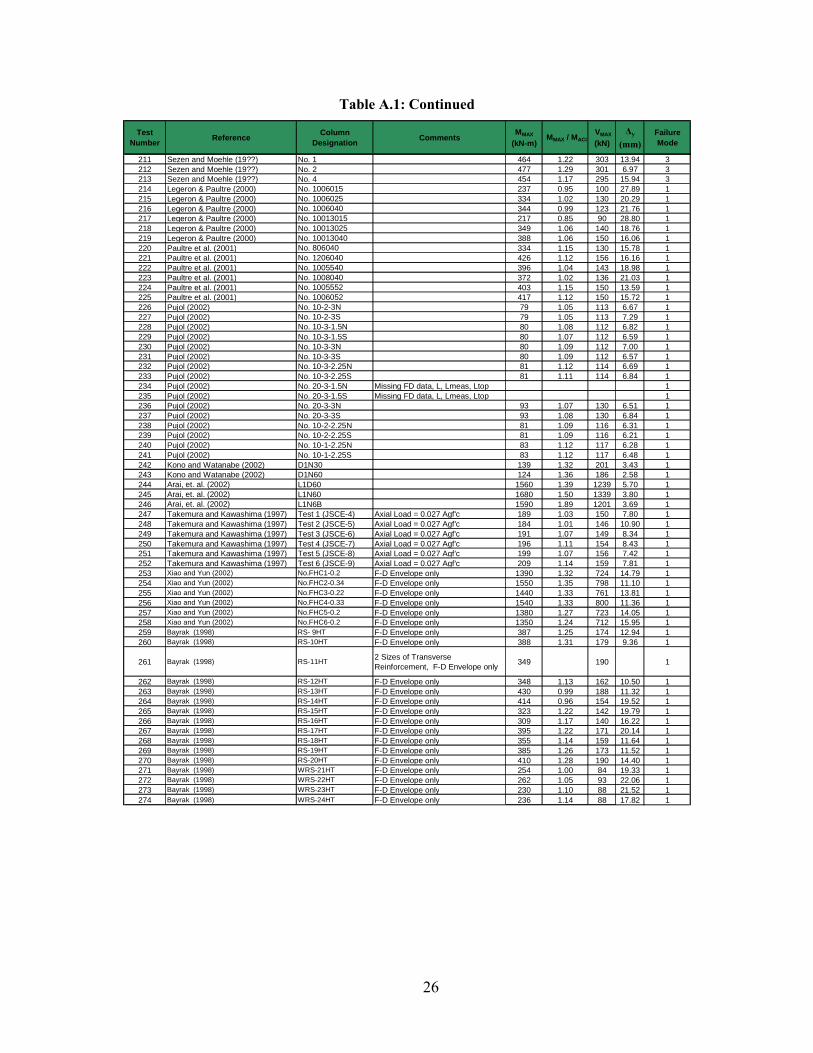
Table A.1: Continued
Test Number Reference Column
Designation CommentsMMAX
(kN-m) MMAX / MACI
VMAX
(kN) ∆y
(mm)Failure Mode
139 Lynn et al. (1998) 3CMH18 504 0.98 328 11.97 3140 Lynn et al. (1998) 3CMD12 547 1.06 355 13.17 3141 Lynn et al. (1998) 3SLH18 403 0.92 270 11.29 3142 Lynn et al. (1998) 2SLH18 345 1.04 229 9.16 3143 Lynn et al. (1998) 3SMD12 576 1.15 367 12.22 3144 Xiao and Martirossyan (1998) HC48L19T10-0.1P 179 1.16 324 6.22 1145 Xiao and Martirossyan (1998) HC48L19T10-0.2P 213 1.18 378 5.27 1146 Xiao and Martirossyan (1998) HC48L16T10-0.1P 147 1.07 276 5.18 1147 Xiao and Martirossyan (1998) HC48L16T10-0.2P 181 1.09 319 6.23 1148 Xiao and Martirossyan (1998) HC4-8L16-T6-0.1P 144 1.06 268 6.32 3149 Xiao and Martirossyan (1998) HC4-8L16-T6-0.2P 174 1.03 324 5.71 3150 Sugano (1996) UC10H cover scaled from sketch 161 1.17 334 1.34 1151 Sugano (1996) UC15H cover scaled from sketch 182 1.32 365 1.41 1152 Sugano (1996) UC20H cover scaled from sketch 198 1.43 392 1.46 1153 Sugano (1996) UC15L cover scaled from sketch 176 1.12 363 1.86 1154 Sugano (1996) UC20L cover scaled from sketch 179 1.14 370 1.84 1155 Nosho et al. 1996 No. 1 121 1.00 42 24.19 1156 Bayrak and Sheikh (1996) ES-1HT 290 1.07 124 6.62 1157 Bayrak and Sheikh (1996) AS-2HT 300 1.06 140 7.72 1158 Bayrak and Sheikh (1996) AS-3HT 296 1.09 135 6.48 1159 Bayrak and Sheikh (1996) AS-4HT 301 1.11 127 9.76 1160 Bayrak and Sheikh (1996) AS-5HT Twice as stiff as 6HT and 7HT 349 0.95 173 4.72 1161 Bayrak and Sheikh (1996) AS-6HT 341 0.94 154 9.97 1162 Bayrak and Sheikh (1996) AS-7HT 316 0.86 144 10.22 1163 Bayrak and Sheikh (1996) ES-8HT 349 0.96 166 6.77 1164 Saatcioglu and Grira (1999) BG-1 320 1.33 169 9.99 1165 Saatcioglu and Grira (1999) BG2 307 1.27 165 9.64 1166 Saatcioglu and Grira (1999) BG-3 270 1.22 148 15.40 1167 Saatcioglu and Grira (1999) BG4 335 1.22 171 11.01 1
168 Saatcioglu and Grira (1999) BG5 Welded grid transverse reinforcement 336 1.23 173 13.76 1
169 Saatcioglu and Grira (1999) BG-6Welded grid transverse reinforcement 364 1.32 188 11.31 1
170 Saatcioglu and Grira (1999)BG-7
Welded grid transverse reinforcement 344 1.24 178 11.97 1
171 Saatcioglu and Grira (1999) BG8 Welded grid transverse reinforcement 327 1.16 180 20.66 1
172 Saatcioglu and Grira (1999) BG9 Welded grid transverse reinforcement 361 1.26 185 12.41 1
173 Saatcioglu and Grira (1999)BG-10
Welded grid transverse reinforcement 344 1.21 177 13.62 1
174 Matamoros et al. (1999) C10-05N 45 0.99 70 10.65 1175 Matamoros et al. (1999) C10-05S 43 0.96 68 10.12 1176 Matamoros et al. (1999) C10-10N 63 1.12 96 8.95 1177 Matamoros et al. (1999) C10-10S 62 1.09 93 9.06 1178 Matamoros et al. (1999) C10-20N 76 1.03 108 10.29 1179 Matamoros et al. (1999) C10-20S 72 1.08 102 9.26 1180 Matamoros et al. (1999) C5-00N 36 1.05 59 11.80 1181 Matamoros et al. (1999) C5-00S 36 1.01 58 12.41 1182 Matamoros et al. (1999) C5-20N 48 0.98 71 10.54 1183 Matamoros et al. (1999) C5-20S 46 0.96 69 10.87 1184 Matamoros et al. (1999) C5-40N 59 1.13 85 8.24 1185 Matamoros et al. (1999) C5-40S 59 1.16 85 8.10 1186 Mo and Wang (2000) C1-1 356 1.20 243 14.95 1187 Mo and Wang (2000) C1-2 383 1.21 258 14.79 1188 Mo and Wang (2000) C1-3 440 1.36 291 14.87 1189 Mo and Wang (2000) C2-1 353 1.20 241 16.71 1190 Mo and Wang (2000) C2-2 375 1.18 250 15.62 1191 Mo and Wang (2000) C2-3 446 1.37 294 13.45 1
192 Mo and Wang (2000) C3-1 Atypical Transverse Reinforcement 334 1.12 228 17.91 1
193 Mo and Wang (2000) C3-2 Atypical Transverse Reinforcement 372 1.18 248 17.89 1
194 Mo and Wang (2000) C3-3 Atypical Transverse Reinforcement 432 1.32 286 15.43 1
195 Aboutaha and Machado (1999) ORC1 Missing key steel properties 472 258 1196 Aboutaha and Machado (1999) ORC2 Missing key steel properties 710 308 1197 Aboutaha and Machado (1999) ORC3 Missing key steel properties 775 423 1198 Aboutaha et al. (1999) SC3 496 0.82 407 9.49 2199 Aboutaha et al. (1999) SC9 737 0.68 605 9.52 2200 Thomsen and Wallace (1994) A1 26 1.35 44 6.12 1201 Thomsen and Wallace (1994) A3 44 1.20 67 3.53 1202 Thomsen and Wallace (1994) B1 19 1.13 32 5.68 1203 Thomsen and Wallace (1994) B2 31 1.13 48 4.56 1204 Thomsen and Wallace (1994) B3 38 1.05 58 3.96 1205 Thomsen and Wallace (1994) C1 22 1.28 37 6.68 1206 Thomsen and Wallace (1994) C2 28 1.06 44 4.78 1207 Thomsen and Wallace (1994) C3 33 0.96 50 5.59 1208 Thomsen and Wallace (1994) D1 34 1.02 52 4.56 1209 Thomsen and Wallace (1994) D2 35 0.98 55 5.12 1210 Thomsen and Wallace (1994) D3 32 1.01 48 5.62 1
26
Table A.1: Continued
Test Number Reference Column
Designation CommentsMMAX
(kN-m) MMAX / MACI
VMAX
(kN) ∆y
(mm)Failure Mode
211 Sezen and Moehle (19??) No. 1 464 1.22 303 13.94 3212 Sezen and Moehle (19??) No. 2 477 1.29 301 6.97 3213 Sezen and Moehle (19??) No. 4 454 1.17 295 15.94 3214 Legeron & Paultre (2000) No. 1006015 237 0.95 100 27.89 1215 Legeron & Paultre (2000) No. 1006025 334 1.02 130 20.29 1216 Legeron & Paultre (2000) No. 1006040 344 0.99 123 21.76 1217 Legeron & Paultre (2000) No. 10013015 217 0.85 90 28.80 1218 Legeron & Paultre (2000) No. 10013025 349 1.06 140 18.76 1219 Legeron & Paultre (2000) No. 10013040 388 1.06 150 16.06 1220 Paultre et al. (2001) No. 806040 334 1.15 130 15.78 1221 Paultre et al. (2001) No. 1206040 426 1.12 156 16.16 1222 Paultre et al. (2001) No. 1005540 396 1.04 143 18.98 1223 Paultre et al. (2001) No. 1008040 372 1.02 136 21.03 1224 Paultre et al. (2001) No. 1005552 403 1.15 150 13.59 1225 Paultre et al. (2001) No. 1006052 417 1.12 150 15.72 1226 Pujol (2002) No. 10-2-3N 79 1.05 113 6.67 1227 Pujol (2002) No. 10-2-3S 79 1.05 113 7.29 1228 Pujol (2002) No. 10-3-1.5N 80 1.08 112 6.82 1229 Pujol (2002) No. 10-3-1.5S 80 1.07 112 6.59 1230 Pujol (2002) No. 10-3-3N 80 1.09 112 7.00 1231 Pujol (2002) No. 10-3-3S 80 1.09 112 6.57 1232 Pujol (2002) No. 10-3-2.25N 81 1.12 114 6.69 1233 Pujol (2002) No. 10-3-2.25S 81 1.11 114 6.84 1234 Pujol (2002) No. 20-3-1.5N Missing FD data, L, Lmeas, Ltop 1235 Pujol (2002) No. 20-3-1.5S Missing FD data, L, Lmeas, Ltop 1236 Pujol (2002) No. 20-3-3N 93 1.07 130 6.51 1237 Pujol (2002) No. 20-3-3S 93 1.08 130 6.84 1238 Pujol (2002) No. 10-2-2.25N 81 1.09 116 6.31 1239 Pujol (2002) No. 10-2-2.25S 81 1.09 116 6.21 1240 Pujol (2002) No. 10-1-2.25N 83 1.12 117 6.28 1241 Pujol (2002) No. 10-1-2.25S 83 1.12 117 6.48 1242 Kono and Watanabe (2002) D1N30 139 1.32 201 3.43 1243 Kono and Watanabe (2002) D1N60 124 1.36 186 2.58 1244 Arai, et. al. (2002) L1D60 1560 1.39 1239 5.70 1245 Arai, et. al. (2002) L1N60 1680 1.50 1339 3.80 1246 Arai, et. al. (2002) L1N6B 1590 1.89 1201 3.69 1247 Takemura and Kawashima (1997) Test 1 (JSCE-4) Axial Load = 0.027 Agf'c 189 1.03 150 7.80 1248 Takemura and Kawashima (1997) Test 2 (JSCE-5) Axial Load = 0.027 Agf'c 184 1.01 146 10.90 1249 Takemura and Kawashima (1997) Test 3 (JSCE-6) Axial Load = 0.027 Agf'c 191 1.07 149 8.34 1250 Takemura and Kawashima (1997) Test 4 (JSCE-7) Axial Load = 0.027 Agf'c 196 1.11 154 8.43 1251 Takemura and Kawashima (1997) Test 5 (JSCE-8) Axial Load = 0.027 Agf'c 199 1.07 156 7.42 1252 Takemura and Kawashima (1997) Test 6 (JSCE-9) Axial Load = 0.027 Agf'c 209 1.14 159 7.81 1253 Xiao and Yun (2002) No.FHC1-0.2 F-D Envelope only 1390 1.32 724 14.79 1254 Xiao and Yun (2002) No.FHC2-0.34 F-D Envelope only 1550 1.35 798 11.10 1255 Xiao and Yun (2002) No.FHC3-0.22 F-D Envelope only 1440 1.33 761 13.81 1256 Xiao and Yun (2002) No.FHC4-0.33 F-D Envelope only 1540 1.33 800 11.36 1257 Xiao and Yun (2002) No.FHC5-0.2 F-D Envelope only 1380 1.27 723 14.05 1258 Xiao and Yun (2002) No.FHC6-0.2 F-D Envelope only 1350 1.24 712 15.95 1259 Bayrak (1998) RS- 9HT F-D Envelope only 387 1.25 174 12.94 1260 Bayrak (1998) RS-10HT F-D Envelope only 388 1.31 179 9.36 1
261 Bayrak (1998) RS-11HT 2 Sizes of Transverse Reinforcement, F-D Envelope only 349 190 1
262 Bayrak (1998) RS-12HT F-D Envelope only 348 1.13 162 10.50 1263 Bayrak (1998) RS-13HT F-D Envelope only 430 0.99 188 11.32 1264 Bayrak (1998) RS-14HT F-D Envelope only 414 0.96 154 19.52 1265 Bayrak (1998) RS-15HT F-D Envelope only 323 1.22 142 19.79 1266 Bayrak (1998) RS-16HT F-D Envelope only 309 1.17 140 16.22 1267 Bayrak (1998) RS-17HT F-D Envelope only 395 1.22 171 20.14 1268 Bayrak (1998) RS-18HT F-D Envelope only 355 1.14 159 11.64 1269 Bayrak (1998) RS-19HT F-D Envelope only 385 1.26 173 11.52 1270 Bayrak (1998) RS-20HT F-D Envelope only 410 1.28 190 14.40 1271 Bayrak (1998) WRS-21HT F-D Envelope only 254 1.00 84 19.33 1272 Bayrak (1998) WRS-22HT F-D Envelope only 262 1.05 93 22.06 1273 Bayrak (1998) WRS-23HT F-D Envelope only 230 1.10 88 21.52 1274 Bayrak (1998) WRS-24HT F-D Envelope only 236 1.14 88 17.82 1
27
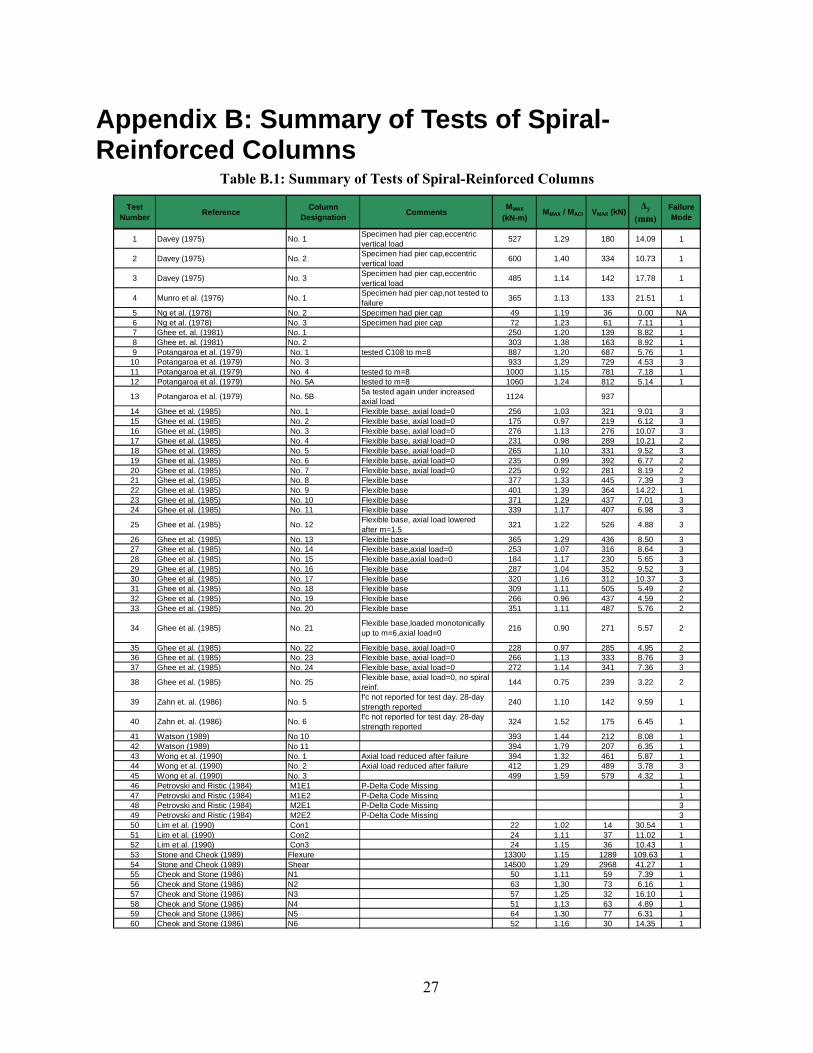
Appendix B: Summary of Tests of Spiral-Reinforced Columns
Table B.1: Summary of Tests of Spiral-Reinforced Columns
Test Number Reference Column
Designation CommentsMMAX
(kN-m) MMAX / MACI VMAX (kN)
∆y
(mm)Failure Mode
1 Davey (1975) No. 1 Specimen had pier cap,eccentric vertical load 527 1.29 180 14.09 1
2 Davey (1975) No. 2 Specimen had pier cap,eccentric vertical load 600 1.40 334 10.73 1
3 Davey (1975) No. 3 Specimen had pier cap,eccentric vertical load 485 1.14 142 17.78 1
4 Munro et al. (1976) No. 1 Specimen had pier cap,not tested to failure 365 1.13 133 21.51 1
5 Ng et al. (1978) No. 2 Specimen had pier cap 49 1.19 36 0.00 NA6 Ng et al. (1978) No. 3 Specimen had pier cap 72 1.23 61 7.11 17 Ghee et. al. (1981) No. 1 250 1.20 139 8.82 18 Ghee et. al. (1981) No. 2 303 1.38 163 8.92 19 Potangaroa et al. (1979) No. 1 tested C108 to m=8 887 1.20 687 5.76 1
10 Potangaroa et al. (1979) No. 3 933 1.29 729 4.53 311 Potangaroa et al. (1979) No. 4 tested to m=8 1000 1.15 781 7.18 112 Potangaroa et al. (1979) No. 5A tested to m=8 1060 1.24 812 5.14 1
13 Potangaroa et al. (1979) No. 5B 5a tested again under increased axial load 1124 937
14 Ghee et al. (1985) No. 1 Flexible base, axial load=0 256 1.03 321 9.01 315 Ghee et al. (1985) No. 2 Flexible base, axial load=0 175 0.97 219 6.12 316 Ghee et al. (1985) No. 3 Flexible base, axial load=0 276 1.13 276 10.07 317 Ghee et al. (1985) No. 4 Flexible base, axial load=0 231 0.98 289 10.21 218 Ghee et al. (1985) No. 5 Flexible base, axial load=0 265 1.10 331 9.52 319 Ghee et al. (1985) No. 6 Flexible base, axial load=0 235 0.99 392 6.77 220 Ghee et al. (1985) No. 7 Flexible base, axial load=0 225 0.92 281 8.19 221 Ghee et al. (1985) No. 8 Flexible base 377 1.33 445 7.39 322 Ghee et al. (1985) No. 9 Flexible base 401 1.39 364 14.22 123 Ghee et al. (1985) No. 10 Flexible base 371 1.29 437 7.01 324 Ghee et al. (1985) No. 11 Flexible base 339 1.17 407 6.98 3
25 Ghee et al. (1985) No. 12 Flexible base, axial load lowered after m=1.5 321 1.22 526 4.88 3
26 Ghee et al. (1985) No. 13 Flexible base 365 1.29 436 8.50 327 Ghee et al. (1985) No. 14 Flexible base,axial load=0 253 1.07 316 8.64 328 Ghee et al. (1985) No. 15 Flexible base,axial load=0 184 1.17 230 5.65 329 Ghee et al. (1985) No. 16 Flexible base 287 1.04 352 9.52 330 Ghee et al. (1985) No. 17 Flexible base 320 1.16 312 10.37 331 Ghee et al. (1985) No. 18 Flexible base 309 1.11 505 5.49 232 Ghee et al. (1985) No. 19 Flexible base 266 0.96 437 4.59 233 Ghee et al. (1985) No. 20 Flexible base 351 1.11 487 5.76 2
34 Ghee et al. (1985) No. 21 Flexible base,loaded monotonically up to m=6,axial load=0 216 0.90 271 5.57 2
35 Ghee et al. (1985) No. 22 Flexible base, axial load=0 228 0.97 285 4.95 236 Ghee et al. (1985) No. 23 Flexible base, axial load=0 266 1.13 333 8.76 337 Ghee et al. (1985) No. 24 Flexible base, axial load=0 272 1.14 341 7.36 3
38 Ghee et al. (1985) No. 25 Flexible base, axial load=0, no spiral reinf. 144 0.75 239 3.22 2
39 Zahn et. al. (1986) No. 5 f'c not reported for test day. 28-day strength reported 240 1.10 142 9.59 1
40 Zahn et. al. (1986) No. 6 f'c not reported for test day. 28-day strength reported 324 1.52 175 6.45 1
41 Watson (1989) No 10 393 1.44 212 8.08 142 Watson (1989) No 11 394 1.79 207 6.35 143 Wong et al. (1990) No. 1 Axial load reduced after failure 394 1.32 461 5.87 144 Wong et al. (1990) No. 2 Axial load reduced after failure 412 1.29 489 3.78 345 Wong et al. (1990) No. 3 499 1.59 579 4.32 146 Petrovski and Ristic (1984) M1E1 P-Delta Code Missing 147 Petrovski and Ristic (1984) M1E2 P-Delta Code Missing 148 Petrovski and Ristic (1984) M2E1 P-Delta Code Missing 349 Petrovski and Ristic (1984) M2E2 P-Delta Code Missing 350 Lim et al. (1990) Con1 22 1.02 14 30.54 151 Lim et al. (1990) Con2 24 1.11 37 11.02 152 Lim et al. (1990) Con3 24 1.15 36 10.43 153 Stone and Cheok (1989) Flexure 13300 1.15 1289 109.63 154 Stone and Cheok (1989) Shear 14500 1.29 2968 41.27 155 Cheok and Stone (1986) N1 50 1.11 59 7.39 156 Cheok and Stone (1986) N2 63 1.30 73 6.16 157 Cheok and Stone (1986) N3 57 1.25 32 16.10 158 Cheok and Stone (1986) N4 51 1.13 63 4.89 159 Cheok and Stone (1986) N5 64 1.30 77 6.31 160 Cheok and Stone (1986) N6 52 1.16 30 14.35 1
28
Table B.1: Continued
Test Number Reference Column
Designation CommentsMMAX
(kN-m) MMAX / MACI VMAX (kN)
∆y
(mm)Failure Mode
61 Siryo (1975) spbaa1Possible joint rotation, confined with welded wire hoops, square cross-section
46 1.55 117 0.71 1
62 Siryo (1975) ws21bs square cross-section, L/D = 1 45 1.05 175 2.20 363 Siryo (1975) ws22bs square cross-section 53 1.14 102 2.51 164 Siryo (1975) ws25bs square cross-section, L/D = 1 46 1.04 182 2.56 365 Siryo (1975) ws26bs square cross-section 53 1.08 102 3.39 366 Siryo (1975) ws27bs square cross-section 76 1.22 146 3.45 167 Arakawa et al. (1987) No. 1 axial load=0 53 0.67 176 1.49 268 Arakawa et al. (1987) No. 2 axial load=0 61 0.77 204 1.43 269 Arakawa et al. (1987) No. 3 no spiral reinforcement 48 0.54 158 1.17 270 Arakawa et al. (1987) No. 4 58 0.64 191 1.02 271 Arakawa et al. (1987) No. 6 68 0.77 223 1.18 272 Arakawa et al. (1987) No. 8 64 0.71 211 1.06 273 Arakawa et al. (1987) No. 9 68 0.62 226 1.61 274 Arakawa et al. (1987) No. 10 76 1.10 251 1.68 375 Arakawa et al. (1987) No. 11 no spiral reinforcement 57 0.59 187 1.03 276 Arakawa et al. (1987) No. 12 58 0.61 189 1.05 277 Arakawa et al. (1987) No. 13 72 0.73 234 0.86 278 Arakawa et al. (1987) No. 14 84 0.85 274 0.88 279 Arakawa et al. (1987) No. 15 axial load=0 76 0.94 168 4.13 380 Arakawa et al. (1987) No. 16 axial load=0 79 0.99 176 3.54 181 Arakawa et al. (1987) No. 17 74 0.82 245 1.17 282 Arakawa et al. (1987) No. 18 no spiral reinforcement 59 0.66 131 1.93 283 Arakawa et al. (1987) No. 19 84 0.93 184 1.68 284 Arakawa et al. (1987) No. 20 96 1.08 209 3.30 185 Arakawa et al. (1987) No. 21 93 1.04 151 4.92 186 Arakawa et al. (1987) No. 22 77 0.94 168 1.59 287 Arakawa et al. (1987) No. 23 96 1.00 209 3.25 388 Arakawa et al. (1987) No. 24 70 0.71 230 1.05 289 Arakawa et al. (1987) No. 25 91 0.93 196 1.60 290 Arakawa et al. (1987) No. 26 104 1.07 167 4.80 191 Arakawa et al. (1987) No. 27 79 0.97 171 3.19 392 Arakawa et al. (1987) No. 28 103 0.98 224 3.04 393 Kunnath et. al. (1997) No. A2 115 1.32 74 13.94 194 Kunnath et. al. (1997) No. A3 120 1.37 75 12.77 195 Kunnath et. al. (1997) No. A4 111 1.21 72 15.29 196 Kunnath et. al. (1997) No. A5 123 1.34 77 16.84 197 Kunnath et. al. (1997) No. A6 119 1.29 77 13.53 198 Kunnath et. al. (1997) No. A7 120 1.32 79 11.14 199 Kunnath et. al. (1997) No. A8 107 1.17 68 15.43 1100 Kunnath et. al. (1997) No. A9 114 1.26 75 11.87 1101 Kunnath et. al. (1997) No. A10 113 1.32 74 12.05 1102 Kunnath et. al. (1997) No. A11 103 1.21 68 12.70 1103 Kunnath et. al. (1997) No. A12 109 1.28 72 11.24 1104 Priestley and Benzoni (1994) NR1 365 1.25 393 2.35 3105 Priestley and Benzoni (1994) NR2 537 1.23 579 3.70 3106 Kunnath et. al. (1997) No. SRPH1 1300 1.30 285 39.88 1107 Vu et al. (1998) No. NH1 530 1.27 535 6.47 1108 Vu et al. (1998) No. NH2 254 1.32 296 7.11 3109 Vu et al. (1998) No. NH3 501 1.33 510 6.13 1110 Vu et al. (1998) No. NH4 870 1.45 905 10.11 3111 Vu et al. (1998) No. NH5 344 1.35 403 8.26 3112 Vu et al. (1998) No. NH6 975 1.61 957 7.77 1113 Kowalsky et. al. (1999) No. FL1 lightweight concrete 544 1.09 101 0.00 0114 Kowalsky et. al. (1999) No. FL2 lightweight concrete 639 1.23 124 0.00 0115 Kowalsky et. al. (1999) No. FL3 normal-weight concrete 611 1.20 117 60.92 1116 Lehman and Moehle (2000) No.415 708 1.24 269 17.60 1117 Lehman and Moehle (2000) No.815 745 1.30 130 64.81 1118 Lehman and Moehle (2000) No.1015 604 1.06 80 109.46 1119 Lehman and Moehle (2000) No.407 443 1.15 172 13.18 1
120 Lehman and Moehle (2000) No.430 Longitudinal bars were bundled in two layers 1180 1.24 448 26.18 1
121 Calderone et. al. (2000) No.328 1030 1.16 525 14.88 1
122 Calderone et. al. (2000) No.828 0.9% hoop steel provided up to 3 feet from base. Remaining height has 0.45% hoop steel
975 1.10 172 83.04 1
123 Calderone et. al. (2000) No.10280.9% hoop steel provided up to 4 feet from base. Remaining height has 0.45% hoop steel
1160 1.30 157 95.47 1
124 Sritharan et al. (1995) IC1 737 1.26 387 0.00 0125 Sritharan et al. (1995) B105IC2 775 1.29 411 0.00 0126 Sritharan et al. (1995) IC3 815 1.34 433 0.00 0127 Saatcioglu and Baingo (1999) No.RC1 138 1.41 55 0.00 0128 Saatcioglu and Baingo (1999) No.RC2 132 1.39 53 0.00 0
29
Table B.1: Continued
Test Number Reference Column
Designation CommentsMMAX
(kN-m) MMAX / MACI VMAX (kN)
∆y
(mm)Failure Mode
129 Saatcioglu and Baingo (1999) No.RC3 163 1.32 56 15.83 1130 Saatcioglu and Baingo (1999) No.RC4 162 1.31 55 12.67 1131 Saatcioglu and Baingo (1999) No.RC6 154 1.26 57 11.25 1132 Saatcioglu and Baingo (1999) No.RC7 139 1.20 59 17.08 1
133 Saatcioglu and Baingo (1999) No.RC8 Column confined with individual circular hoops 158 1.28 55 13.47 1
134 Saatcioglu and Baingo (1999) No.RC9 Specimen had no cover to longitudinal reinforcement 200 1.63 71 0.00 0
135 Nelson (2000) Col1 Axial load varies 488 1.16 283 11.56 3136 Nelson (2000) Col2 456 1.17 279 9.74 1137 Nelson (2000) Col3 423 1.12 260 9.09 3138 Nelson (2000) Col4 415 1.12 252 9.48 3139 Henry and Mahin (1999) No. 415p 831 1.19 277 25.78 1140 Henry and Mahin (1999) No. 415s 716 1.20 259 23.62 1
141 Chai et. al. (1991) No. 3 Retrofitted columns were tested also. Unknown concrete cover 889 1.13 207 29.11 1
142 Roeder et. al. (2001) C1 fy not measured for spiral. Assumed to be 60 ksi. 230 117 1
143 Roeder et. al. (2001) C2 fy not measured for spiral. Assumed to be 60 ksi. 218 111 1
144 Roeder et. al. (2001) C3
PSC pile-wharf connection. fy not measured for spiral. Assumed to be 60 ksi. f'c not reported for test day. 28-day strength reported
269 137 1
145 Roeder et. al. (2001) C4
PSC pile-wharf connection. fy not measured for spiral. Assumed to be 60 ksi. f'c not reported for test day. 28-day strength reported
360 167 1
146 Roeder et. al. (2001) C5
PSC pile-wharf connection. fy not measured for spiral. Assumed to be 60 ksi. f'c not reported for test day. 28-day strength reported
377 177 1
147 Roeder et. al. (2001) C6
PSC pile-wharf connection. fy not measured for spiral. Assumed to be 60 ksi. f'c not reported for test day. 28-day strength reported
371 176 1
148 Roeder et. al. (2001) C7
PSC pile-wharf connection. fy not measured for spiral. Assumed to be 60 ksi. f'c not reported for test day. 28-day strength reported
376 171 1
149 Roeder et. al. (2001) C8
PSC pile-wharf connection. fy not measured for spiral. Assumed to be 60 ksi. f'c not reported for test day. 28-day strength reported
393 182 1
150 Moyer and Kowalsky (2002) No.1 372 1.09 144 37.91 1151 Moyer and Kowalsky (2002) No.2 388 1.15 152 41.12 1152 Moyer and Kowalsky (2002) No.3 462 1.38 180 36.72 1153 Moyer and Kowalsky (2002) No.4 382 1.11 150 40.39 1
154 Coffman et al. (1993) Column 1 Column No. 1 was a spliced, reference column. 306 1.40 94 17.40 1
155 Hamilton (2002) UCI1 Cross-section D 130 1.15 70 16.08 1156 Hamilton (2002) UCI2 Cross-section D 136 1.20 74 17.03 1157 Hamilton (2002) UCI3 Cross-section B, Monotonic 150 1.14 143 4.20 3158 Hamilton (2002) UCI4 Cross-section B 172 1.31 164 6.09 3159 Hamilton (2002) UCI5 Cross-section SD 178 1.54 170 4.76 3160 Hamilton (2002) UCI6 Cross-section D 182 1.62 98 12.88 1
30
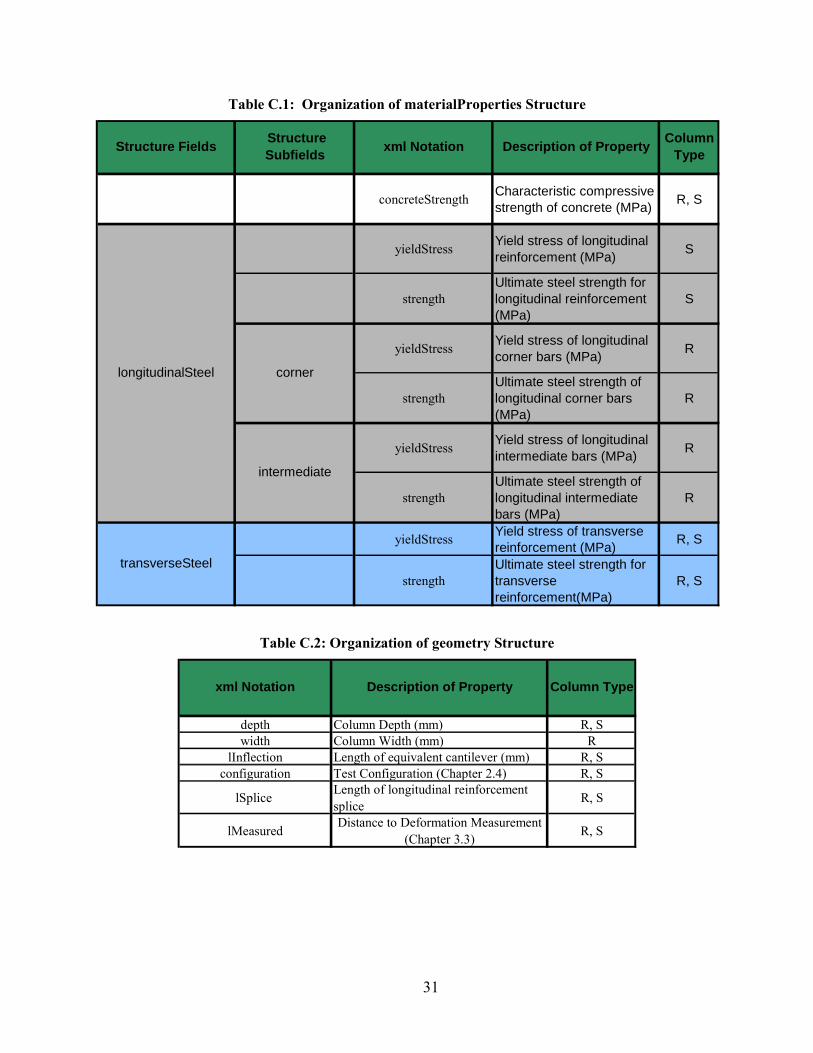
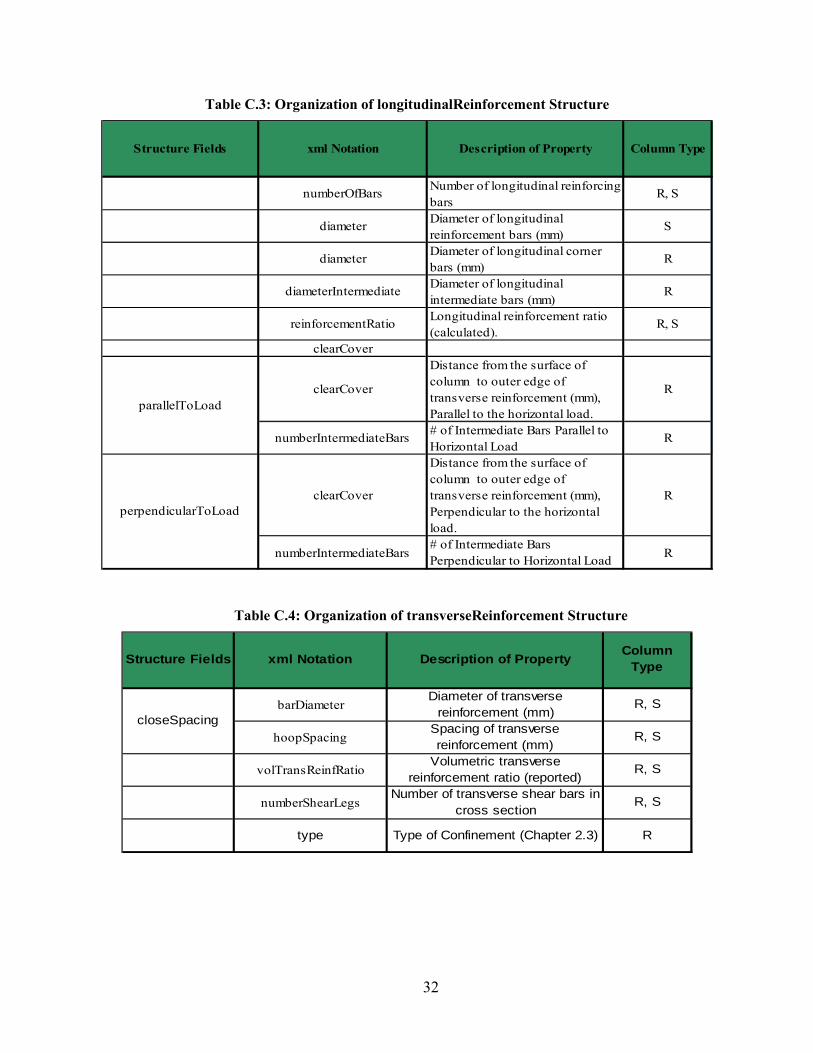
Appendix C: Structure of xml Data The structure of the xml files that describe each column test in the database
(http://nisee.berkeley.edu/spd) is discussed in this appendix. The column data in the xml file is
organized into 9 data structures (specimen, adminInfo, materialProperties, geometry, loading,
longitudinalReinforcement, transverseReinforcement, failureType, damage and links). The
organization of the key data structures (i.e., materialProperties, geometry,
longitudinalReinforcement and transverseReinforcement) are summarized in Tables C.1 to C.5.
31
Table C.1: Organization of materialProperties Structure
concreteStrength Characteristic compressive strength of concrete (MPa) R, S
yieldStress Yield stress of longitudinal reinforcement (MPa) S
strengthUltimate steel strength for longitudinal reinforcement (MPa)
S
yieldStress Yield stress of longitudinal corner bars (MPa) R
strengthUltimate steel strength of longitudinal corner bars (MPa)
R
yieldStress Yield stress of longitudinal intermediate bars (MPa) R
strengthUltimate steel strength of longitudinal intermediate bars (MPa)
R
yieldStress Yield stress of transverse reinforcement (MPa) R, S
strengthUltimate steel strength for transverse reinforcement(MPa)
R, S
xml Notation Column TypeDescription of Property
longitudinalSteel
transverseSteel
Structure Fields
corner
intermediate
Structure Subfields
Table C.2: Organization of geometry Structure
depth Column Depth (mm) R, Swidth Column Width (mm) R
lInflection Length of equivalent cantilever (mm) R, Sconfiguration Test Configuration (Chapter 2.4) R, S
lSplice Length of longitudinal reinforcement splice R, S
lMeasured Distance to Deformation Measurement (Chapter 3.3) R, S
Column Typexml Notation Description of Property
32
Table C.3: Organization of longitudinalReinforcement Structure
numberOfBars Number of longitudinal reinforcing bars
R, S
diameter Diameter of longitudinal reinforcement bars (mm)
S
diameter Diameter of longitudinal corner bars (mm)
R
diameterIntermediate Diameter of longitudinal intermediate bars (mm)
R
reinforcementRatio Longitudinal reinforcement ratio (calculated).
R, S
clearCover
clearCover
Distance from the surface of column to outer edge of transverse reinforcement (mm), Parallel to the horizontal load.
R
numberIntermediateBars # of Intermediate Bars Parallel to Horizontal Load
R
clearCover
Distance from the surface of column to outer edge of transverse reinforcement (mm), Perpendicular to the horizontal load.
R
numberIntermediateBars# of Intermediate Bars Perpendicular to Horizontal Load R
Column TypeStructure Fields xml Notation
parallelToLoad
perpendicularToLoad
Description of Property
Table C.4: Organization of transverseReinforcement Structure
barDiameterDiameter of transverse
reinforcement (mm)R, S
hoopSpacingSpacing of transverse reinforcement (mm)
R, S
volTransReinfRatioVolumetric transverse
reinforcement ratio (reported) R, S
numberShearLegsNumber of transverse shear bars in
cross section R, S
type Type of Confinement (Chapter 2.3) R
closeSpacing
Description of Property Column Typexml NotationStructure Fields
33
Appendix D: Column Test References Aboutaha, R.S., and Machado, R.I. (1999). "Seismic Resistance of Steel-Tubed High-Strength
Reinforced-Concrete Columns." J. Struct. Eng., 125(5), 485-494.
Aboutaha, R.S., Engelhardt, M.D., Jirsa, J.O.: and Kreger, M.E. (1999). “Rehabilitation of Shear Critical Concrete Columns by Use of Rectangular Steel Jackets.” ACI Struct. J., 96(1), 68-78.
Amitsu, S., Shirai, N., Adachi, H., and Ono, A. (1991). “Deformation of Reinforced Concrete Column with High or Fluctuating Axial Force.” Transactions of the Japan Concrete Institute, 13.
Arai, Y., Hakim, B., Kono, S., Watanabe, F. (2002). "Damage Assessment of Reinforced Concrete Columns Under High Axial Loading." Personal Contact.
Arakawa, T., Arai, Y., Egashira, K., and Fujita, Y. (1982). “Effects of the Rate of Cyclic Loading on the Load-Carrying Capacity and Inelastic Behavior of Reinforced Concrete Columns.” Transactions of the Japan Concrete Institute, 4.
Arakawa, T., Arai, Y., Mizoguchi, M., and Yoshida, M. (1989). “Shear Resisting Behavior of Short Reinforced Concrete Columns Under Biaxial Bending-Shear.” Transactions of the Japan Concrete Institute, 11.
Arakawa, T., He, M., Arai, Y., and Mizoguchi, M. (1998). "Shear Resisting Behavior of Reinforced Concrete Columns with Spiral Hoops." Transactions of the Japan Concrete Institute, 10.
Atalay, M.B., and Penzien, J. (1975). “The Seismic Behavior of Critical Regions of Reinforced Concrete Components as Influenced by Moment, Shear and Axial Force.” Report No. EERC 75-19, University of California, Berkeley, California.
Azizinamini, A., Johal, L. S., Hanson, N. W., Musser, D. W., and Corley, W. G. (1988). “Effects of Transverse Reinforcement on Seismic Performance of Columns – A Partial Parametric Investigation.” Project No. CR-9617, Construction Technology Laboratories, Skokie, Illinois.
Bayrak, O., and Sheikh, S. (1996). “Confinement Steel Requirements for High Strength Concrete Columns.” Proc. 11th World Conference on Earthquake Engineering, Aculpulco, Mexico, Paper No. 463.
Bayrak O. (1998). “Seismic Performance of Rectilinearly Confined High Strength Concrete Columns.” Doctoral Dissertation. Dept. of Civil Engineering, Univ. of Toronto, Canada.
Bett, B. J., Klingner, R. E., and Jirsa, J. O. (1985). “Behavior of Strengthened and Repaired Reinforced Concrete Columns Under Cyclic Deformations.” PMFSEL Report No. 85-3, Department of Civil Engineering, University of Texas at Austin.
Calderone, A.J., Lehman, D.E., and Moehle, J.P. (2000). "Behavior of Reinforced Concrete Bridge Columns Having Varying Aspect Ratios and Varying Lengths of Confinement."
34
Pacific Earthquake Engineering Research Center Report 2000/08, University of California, Berkeley, California.
Chai, Y., Priestley, M., and Seible, F. (1991). "Seismic Retrofit of Circular Bridge Columns for Enhanced Flexural Performance." ACI Struct. J., 88(5), 572-584.
Cheok, G.S., and Stone, W. C. (1986). “Behavior of 1/6-Scale Model Bridge Columns Subjected to Cycle Inelastic Loading.” NBSIR 86-3494, U.S. National Institute of Standards and Technology, Gaithersburg, Maryland.
Coffman, H. L., Marsh, M. L., Brown, C. B. (1993). "Seismic Durability of Retrofitted Reinforced-Concrete Columns." J. Struct. Eng., 119(5), 1643-1661.
Davey, B.E. (1975). "Reinforced Concrete Bridge Piers under Seismic Loading." Master of Engineering Report. Civil Engineering Department, University of Canterbury, Christchurch, New Zealand.
Galeota, D.: Giammatteo, M.M., Marino, R. (1996). "Seismic Resistance of High Strength Concrete Columns." Procedings of the Eleventh World Conference on Earthquake Engineering, Disc 3, Paper No. 1390.
Ghee, A. B., Priestley, M.J.N., and Park, R. (1981). “Ductility of Reinforced Concrete Bridge Piers under Seismic Loading.” Report 81-3, Department of Civil Engineering, University of Canterbury, Christchurch, New Zealand.
Ghee, A., Priestley, M.J.N., and Paulay, T. (1989). “Seismic Shear Strength of Circular Reinforced Concrete Columns.” ACI Struct. J., 86(1), 45-59.
Gill, W. D., Park, R., and Priestley, M.J.N. (1979). “Ductility of Rectangular Reinforced Concrete Columns With Axial Load.” Report 79-1, Department of Civil Engineering, University of Canterbury, Christchurch, New Zealand.
Henry, L., and Mahin, S. A. (1999). “Study of Buckling of Longitudinal Bars in Reinforced Concrete Bridge Columns.” Report to the California Department of Transportation.
Imai, H., and Yamamoto, Y. (1986). “A Study on Causes of Earthquake Damage of Izumi High School Due to Miyagi-Ken-Oki Earthquake in 1978.” Transactions of the Japan Concrete Institute, 8.
Kanda, M., Shirai, N., Adachi, H., and Sato, T. (1988). “Analytical Study on Elasto-Plastic Hysteretic Behaviors of Reinforced Concrete Members.” Transactions of the Japan Concrete Institute, 10.
Kono, S., and Watanabe, F. (2000). “Damage Evaluation of Reinforced Concrete Columns Under Multiaxial Cyclic Loadings.” The Second U.S.-Japan Workshop on Performance-Based Earthquake Engineering Methodology for Reinfoced Concrete Building Structures, Sapporo, Japan.
Kowalsky, M.J., Priestley, M.J.N., and Seible, F. (1999). “Shear and Flexural Behavior of Lightweight Concrete Bridge Columns in Seismic Regions.” ACI Struct. J., 96(1),136-148.
Kunnath, S., El-Bahy, A., Taylor, A., and Stone, W. (1997). “Cumulative Seismic Damage of Reinforced Concrete Bridge Piers.” Technical Report NCEER-97-0006, National Center for Earthquake Engineering Research, Buffalo, New York.
35
Legeron, F., and Paultre, P. (2000). “Behavior of High-Strength Concrete Columns under Cyclic Flexure and Constant Axial Load.” ACI Struct. J., 97(4), 591-601.
Lehman, D.E., and Moehle, J.P. (2000). "Seismic Performance of Well-Confined Concrete Bridge Columns." Pacific Earthquake Engineering Research Center Report 1998/01, University of California, Berkeley, California.
Lim, K. Y., McLean, D. I., and Henley, E. H. (1991). "Moment-Reducing Hinge Details for the Bases of Bridge Columns." Transportation Research Record, No. 1275, Transportation Research Board, Washington, D.C..
Lynn, A. (1999). “Seismic Evaluation of Existing Reinforced Concrete Building Colums.” Ph.D. Thesis, University of California at Berkeley.
Matamoros, A.B. (1999). “Study of Drift Limits for High-Strength Concrete Columns.” Department of Civil Engineering, University of Illinois at Urbana-Champaign.
Mo, Y.L., and Wang, S.J. (2000). “Seismic Behavior of RC Columns with Various Tie Configurations.” J. Struct. Eng., 126(10), 1122-1130.
Moyer, M., and Kowalsky, M. (2001). “Influence of Tension Strain on Buckling of Reinforcement in RC Bridge Columns.” Department of Civil Engineering, North Carolina State University, Raleigh, North Carolina.
Muguruma, H., Watanabe, F., and Komuro, T. (1989). “Applicability of High Strength Concrete to Reinforced Concrete Ductile Column.” Transactions of the Japan Concrete Institute, 11.
Munro, I.R.M., Park, R., and Priestley, M.J.N. (1976). “Seismic Behaviour of Reinforced Concrete Bridge Piers.” Report 76-9, Department of Civil Engineering, University of Canterbury, Christchurch, New Zealand.
Nagasaka, T. (1982). “Effectiveness of Steel Fiber as Web Reinforcement in Reinforced Concrete Columns.” Transactions of the Japan Concrete Institute, 4.
Ng K. H., Priestley, M.J.N., and Park, R. (1978). “Seismic Behaviour of Circular Reinforced Concrete Bridge Piers.” Report 78-14, Department of Civil Engineering, University of Canterbury, Christchurch, New Zealand.
Nosho, K., Stanton, J., and MacRae, G. (1996). “Retrofit of Rectangular Reinforced Concrete Columns using Tonen Forca Tow Sheet Carbon Fiber Wrapping.” Report No. SGEM 96-2, Department of Civil Engineering, University of Washington, Seattle.
Nelson, Jared M. (2000). "Damage Model Calibration for Reinforced Concrete Columns." Master's Thesis, Department of Civil and Environmental Engineering, University of Washington, Seattle.
Ohno, T., and Nishioka, T. (1984). “An Experimental Study on Energy Absorption Capacity of Columns in Reinforced Concrete Structures.” Proceedings of the JSCE, Structural Engineering/Earthquake Engineering, 1(2).
Ohue, M., Morimoto, H., Fujii, S., and Morita, S. (1985). “The Behavior of R.C. Short Columns Failing in Splitting Bond-Shear Under Dynamic Lateral Loading.” Transactions of the Japan Concrete Institute, 7.
36
Ono, A., Shirai, N., Adachi, H., and Sakamaki, Y. (1989). “Elasto-Plastic Behavior of Reinforced Concrete Column With Fluctuating Axial Force.” Transactions of the Japan Concrete Institute, 11.
Park, R., and Paulay, T. (1990). “Use of Interlocking Spirals for Transverse Reinforcement in Bridge Columns.” Strength and Ductility of Concrete Substructures of Bridges, RRU (Road Research Unit) Bulletin 84, 1, 77-92.
Paultre, P., Legeron, F., and Mongeau, D. (2001). “Influence of Concrete Strength and Transverse Reinforcement Yield Strength on Behavior of High-Strength Concrete Columns.” ACI Struct. J., 98(4), 490-501.
Petrovski, J., and Ristic, D. (1984). “Reversed Cyclic Loading Test of Bridge Column Models.” Report IZIIZ 84-164, Institute of Earthquake Engineering and Engineering Seismology.
Pontangaroa, R.T., Priestley, M.J.N., and Park, R. (1979). “Ductility of Spirally Reinforced Concrete Columns Under Seismic Loading.” Report 79-8, Department of Civil Engineering, University of Canterbury, Christchurch, New Zealand.
Priestley, M.J.N., and Benzoni, G. (1996). “Seismic Performance of Circular Columns with Low Longitudinal Reinforcement Ratios.” ACI Struct. J., 93(4), 474-485.
Roeder C., Soderstom, and Graph (2001). "Seismic Performance of Pile-Wharf Connections", Pacific Earthquake Engineering Research Center, PEER.
Pujol, S. (2002). "Drift Capacity of Reinforced Concrete Columns Subjected to Displacement Reversals." Thesis, Purdue University.
Saatcioglu, M., and Ozcebe, G. (1989). “Response of Reinforced Concrete Columns to Simulated Seismic Loading.” ACI Struct. J., 86(1), 3-12.
Saatcioglu, M., and Baingo, D. (1999). “Circular High-Strength Concrete Columns Under Simulated Seismic Loading.” J. Struct. Eng., 125(3), 272-280.
Saatcioglu, M., and Grira, M. (1999). “Confinement of Reinforced Concrete Columns with Welded Reinforcement Grids.” ACI Struct. J., 96(1), 29-39.
Sakai, Y., Hibi, J., Otani, S., and Aoyama, H. (1990). “Experimental Study on Flexural Behavior of Reinforced Concrete Columns Using High-Strength Concrete.” Transactions of the Japan Concrete Institute, 12.
Siryo K. K. (1975). "A seismic Analysis of Building Structural Members: a List of Experimental Results on Deformation Ability of Reinforced Concrete Columns Under Large Deflection (No.2)." Building Research Institute, Ministry of Construction, Japan.
Soesianawati, M.T., Park, R., and Priestley, M.J.N. (1986). “Limited Ductility Design of Reinforced Concrete Columns.” Report 86-10, Department of Civil Engineering, University of Canterbury, Christchurch, New Zealand.
Sritharan, S., Priestley, M.J.N., Seible F. (1996). "Seismic Response of Column/Cap Beam Tee Connections with Cap Beam Prestressing." Structural Systems Research Project, Report No. ssrp-96/09, University of California, San Diego.
37
Stone, W. C., and Cheok, G. S. (1989). “Inelastic Behavior of Full-Scale Bridge Columns Subjected to Cyclic Loading.” NIST Building Science Series 166, U.S. National Institute of Standards and Technology, Gaithersburg, Maryland.
Sugano, S. (1996). “Seismic Behavior of Reinforced Concrete Columns Which used Ultra-High-Strength Concrete.” Eleventh World Conference on Earthquake Engineering, Paper No. 1383.
Tanaka, H., and Park, R. (1990). “Effect of Lateral Confining Reinforcement on the Ductile Behavior of Reinforced Concrete Columns.” Report 90-2, Department of Civil Engineering, University of Canterbury, Christchurch, New Zealand.
Thomsen, J., and Wallace, J. (1994). “Lateral Load Behavior of Reinforced Concrete Columns Constructed Using High-Strength Materials.” ACI Struct. J., 91(5), 605-615.
Umehara, H., and Jirsa, J.O. (1982). “Shear Strength and Deterioration of Short Reinforced Concrete Columns Under Cyclic Deformations.” PMFSEL Report No. 82-3, Department of Civil Engineering, University of Texas at Austin.
Vu, Nganha D., Priestley, M.J.N., Seible, F., and Benzoni, G. (1998). “Seismic Response of Well Confined Circular Reinforced Concrete Columns with Low Aspect Ratios.” Proceedings of the 5th Caltrans Seismic Research Workshop, Sacramento, California.
Watson, S. (1989). “Design of Reinforced Concrete Frames of Limited Ductility.” Report 89-4, Department of Civil Engineering, University of Canterbury, Christchurch, New Zealand.
Watson, S., and Park, R. (1989). “Design of Reinforced Concrete Frames of Limited Ductility.” Report 89-4, Department of Civil Engineering, University of Canterbury, Christchurch, New Zealand.
Wehbe, N., and Saiidi, M.S., and Sanders, D. (1998). “Confinement of Rectangular Bridge Columns for Modrate Seismic Areas.” National Center for Earthquake Engineering Research (NCEER) Bulletin, 12(1).
Wight, J.K., and Sozen, M.A. (1973). “Shear Strength Decay in Reinforced Concrete Columns Subjected to Large Deflection Reversals.” Structural Research Series No. 403, Civil Engineering Studies, University of Illinois, Urbana-Champaign.
Wong, Y.L., Paulay, T., and Priestley, M.J.N. (1990). “Squat Circular Bridge Piers Under Multi-Directional Seismic Attack.” Report 90-4, Department of Civil Engineering, University of Canterbury, Christchurch, New Zealand.
Xiao, Y., and Martirossyan, A. (1998). “Seismic Performance of High-Strength Concrete Columns.” J. of Struct. Eng., 124(3), 241-251.
Xiao Y., and Yun., H. W. (2002). “Experimental Studies on Full-Scale High-Strength Concrete Columns.” ACI Struct. J., 99(2), 199-207.
Zahn, F.A., Park, R., and Priestley, M.J.N. (1986). “Design of Reinforced Bridge Columns for Strength and Ductility.” Report 86-7, Department of Civil Engineering, University of Canterbury, Christchurch, New Zealand.
Zhou, X., Higashi, Y., Jiang, W., and Shimizu, Y. (1985). “Behavior of Reinforced Concrete Column Under High Axial Load.” Transactions of the Japan Concrete Institute, 7.
38
Zhou, X., Satoh, T., Jiang, W., Ono, A., and Shimizo, Y. (1987). “Behavior of Reinforced Concrete Short Column Under High Axial Load.” Transactions of the Japan Concrete Institute, 9.