Embed Size (px)
Citation preview

PEER-REVIEWED ARTICLE bioresources.com
Luppold & Bumgardner (2014). “Hardwood trade,” BioResources 9(4), 7086-7098. 7086
Changes in the International Trade Balance of U.S. Hardwood Products from 1990 to 2013
William G. Luppold a,* and Matthew S. Bumgardner b
We examine U.S. exports and imports of hardwood products from 1990 to 2013. These products include logs, lumber, veneer, chips, molding, cooperage, plywood, and flooring. The values of hardwood products exported and imported have fluctuated over the years but have generally increased. More substantial changes have occurred with the countries and regions receiving U.S. exports, as well as with those importing into the United States. The primary region receiving U.S. hardwood log and lumber in 1990 was Western Europe, but today, China is the most important market. East Asia has been the most important source region for U.S. hardwood plywood imports, but the specific sources have shifted from Indonesia and Taiwan in 1990 to China today. The overall balance of U.S. hardwood product trade has remained positive for most of the years examined, with the United States having a comparative advantage in exporting logs and lumber. In contrast, the United States has a comparative disadvantage in hardwood plywood exports.
Keywords: U.S. hardwood exports; U.S. hardwood imports; International trade; Hardwood products
Contact information: a: Northern Research Station, U.S. Forest Service, 241 Mercer Springs Road,
Princeton, WV 24740 USA; b: Northern Research Station, U.S. Forest Service, 359 Main Road, Delaware,
OH 43015 USA; *Corresponding author: [email protected]
INTRODUCTION
The adoption of floating exchange rates in the early 1970s resulted in increased
exports of hardwood lumber and other primary hardwood products (Luppold and Araman
1988). While exports of hardwood products surged in the early and mid-1970s, assessing
changes in trade became difficult in the 1980s because of increased underreporting of
smaller hardwood product shipments between the U.S. and Canada (Luppold 1995). By
1990, these data problems were rectified, and thus the year 1990 is the earliest starting
point for this study. The complementary products to hardwood exports are hardwood
imports for consumption. U.S. hardwood exports and imports have increased in value since
1990, but the specific products exported and imported, as well as the source and destination
countries, have changed continuously.
Balance of trade, in simple terms, is expressed as the dollar value exported versus
the dollar value imported. This balance can be reported in arithmetic terms (value of
exports - value of imports) or as a ratio (value of exports/value of imports). The economic
theory that best explains the balance of trade of any product is the law of comparative
advantage. Bressler and King (1970) define the law of comparative advantage in general
terms, stating, “a producer (individual, region, or nation) will tend to specialize in the
production of a commodity in which it has the highest comparative advantage or the least
comparative disadvantage and to obtain by trade the commodities which it has the least
comparative advantage or the greatest comparative disadvantage.” For example, if country

PEER-REVIEWED ARTICLE bioresources.com
Luppold & Bumgardner (2014). “Hardwood trade,” BioResources 9(4), 7086-7098. 7087
A has an abundance of resource A and country B has an abundance of resource B, then
country A will specialize in the production of resource A and export this resource to
country B, while country B will do the opposite.
The objective of this study was to examine U.S. exports and imports of hardwood
products from 1990 to 2013, by determining: (1) the receiving countries and regions of
these exports, (2) the source countries and regions of these imports, (3) the overall balance
of U.S. hardwood product trade, and (4) the balance of trade for individual products and
product groups and the comparative advantages and disadvantages affecting trade. The
results of this study shed light on the competitiveness of the United States as an exporting
country, as well as the relative competitiveness of sources of imports into the country.
METHODS
This study focused only on products that are specifically classified as hardwood;
thus, products such as furniture that may contain an unknown softwood component were
excluded from analysis. The hardwood products examined in this study included hardwood
logs and primary products (lumber, chips, and veneer), milled secondary products
(cooperage, siding, and molding), and further-processed secondary products (plywood and
flooring). Logs, lumber, chips, and veneer are raw materials. Siding, cooperage (barrels
and barrel parts)1, and molding are considered milled secondary products because they are
made from lumber or barrel staves. Hardwood plywood is considered a further-processed
secondary product because it is made of glued-up veneer and normally has a face and back
material of a higher value species. Hardwood flooring is also considered a further-
processed secondary product because it can be constructed of glued-up material, have a
glued-on back material (such as fabric webbing), or be prefinished.
All import and export values analyzed in this paper were obtained from the U.S.
Department of Agriculture, Foreign Agricultural Service (USDA FAS 2014), and were
deflated to 1982 dollars. The specific deflator used was WPU00000000 – All Commodities
(USDL 2014). Although there is no ideal deflator given the broad range of products being
examined, the general All Commodities deflator allows the data to be adjusted for the 75%
increase in the price of raw commodities during the time period examined.
RESULTS AND DISCUSSION
U.S. Hardwood Product Exports Lumber
Lumber has been the most important hardwood product exported since 1990 (Table
1). In 1990, Canada was the largest export market for U.S. hardwood lumber, with a 25%
market share (Table 2), but Western Europe was the most important export region, with a
combined market share of 39% (USDA FAS 2014). Japan and Taiwan were the most
important East Asian markets for lumber in 1990, but the lumber shipped to Japan generally
remained in Japan, while lumber shipped to Taiwan often was transformed into furniture
1 New and used barrels accounted for a minimum of 55% of cooperage product exports for the period being
examined (USDA FAS 2014). In 2013, barrels accounted for more than 84% of exports. New and used
barrels accounted for more than 80% of the cooperage imported since 1990.

PEER-REVIEWED ARTICLE bioresources.com
Luppold & Bumgardner (2014). “Hardwood trade,” BioResources 9(4), 7086-7098. 7088
and other secondary products that were exported primarily to the United States (Luppold
and Bumgardner 2011; Luppold and Bumgardner 2013). In 2000, Canada remained the
most important country receiving U.S. hardwood lumber and Western Europe remained
the most important export region, but China2 was the most important East Asian market as
the wood furniture industry moved from Taiwan to mainland China (Luppold and
Bumgardner 2011). In 2013, 45% of U.S. hardwood lumber exports went to China, while
the export market share of both Canada and Western Europe declined to 14% each.
Vietnam also was a major market for U.S. hardwood lumber in 2013, but similar to China
and Taiwan, the lumber exported to Vietnam was processed into secondary products that
were eventually exported back to the U.S. and other furniture-importing countries (Luppold
and Bumgardner 2011).
Table 1. Market Share (by Value) of Specific Hardwood Products Exported by Year1 (USDA FAS 2014)
Product 1990 1995 2000 2006 2009 2013
--- % ---
Lumber 52.9 53.0 52.0 53.8 45.4 59.4
Logs 16.6 12.5 14.3 20.6 25.6 18.3
Veneer 12.9 13.7 14.6 14.2 12.2 8.9
Cooperage 2.2 1.1 3.8 2.7 6.5 4.5
Flooring 2.4 1.3 2.8 3.3 3.1 3.2
Plywood 2.2 2.9 2.2 2.6 3.7 3.0
Chips 9.9 14.8 9.3 1.8 2.0 1.0
Other2 0.9 0.7 1.0 1.0 1.4 1.8 1 May not add up to 100% due to rounding error 2 Other products included siding and molding
Logs
Logs generally have been the second-most important hardwood product exported
by the U.S. (Table 1). In 1990, Japan was the largest export market for U.S. hardwood logs
on a value basis (Table 2) and East Asia was the most important export region, with a 38%
combined market share (USDA FAS 2014). Other important markets for hardwood logs
were Canada, Germany, Italy, and South Korea. Canada, Germany, Japan, and Italy
remained major export markets for hardwood logs in 2000. By 2013, 45% of logs exported
by the United States were shipped to China and an additional 6% were exported to Vietnam.
The relatively high prices of logs exported to China in 2013 ($494 per cubic meter)
suggests that a high proportion of these logs were made into veneer that was used for face
ply for plywood or furniture veneer.
Veneer
Except for the mid- and late-1990s, veneer3 was the third-most important hardwood
product exported from the United States (Table 1). In 1990, 64% of the veneer exported
2 China as identified in this paper includes mainland China and the special administrative region of Hong
Kong. Direct exports to mainland China surpassed exports to Hong Kong in 2003; by 2013, 98% of the
exports to China and Hong Kong went directly to mainland China (USDA FAS 2014). 3 There are four broad categories of hardwood veneer, including sliced face veneer, rotary cut face veneer,
rotary cut core stock, and rotary cut industrial veneer (agricultural and other containers). Traditionally, the
export market has been for sliced face veneer, which is used in furniture, higher quality plywood, and panel
production.
PEER-REVIEWED ARTICLE bioresources.com
Luppold & Bumgardner (2014). “Hardwood trade,” BioResources 9(4), 7086-7098. 7089
went to Western Europe, with Germany and the United Kingdom (U.K.) being the most
important individual markets (Table 2). Other important markets for hardwood veneer in
1990 were Canada and Japan. Western Europe’s share of the veneer market declined to
45% in 2000, and Canada became the most important single market. In the mid-1990s and
early 2000s, Canada was a major source of furniture imported into the United States
(Luppold and Bumgardner 2011), and some of the U.S. veneer exports to this country likely
came back in the form of furniture.
Veneer exports peaked in 2007 and declined by nearly 47% between 2007 and
2013, with the largest declines occurring in Western Europe and China. The declining
exports to Western Europe appeared to be the result of slow population and economic
growth during this period (Bumgardner et al. 2014), while reduced exports to China
coincided with reduced furniture exports to the United States. Cooperage
Cooperage (new barrels, used barrels, and new and used barrel parts) is a relatively
minor hardwood product in terms of the amount of timber used in production, but
cooperage exports have been increasing (USDA FAS 2014). Most of the cooperage
produced in the United States is tight cooperage used in whisky and wine aging. The United
Kingdom has been the largest export market for U.S. cooperage, but the value exported to
this country varied between 1990 and 2006. Since 2006, exports to the United Kingdom
have increased six fold. Most of the cooperage exported to the United Kingdom has been
previously used barrels, suggesting its being used for the production of scotch (Ludford
2011). Other major export markets since 1990 include Canada, Australia, Japan, Spain, and
Ireland.
Chips
Hardwood chips are normally associated with pulp and paper production but also
can be used to flavor and age beer and wine. While hardwood chips are currently a minor
export, chips accounted for nearly 15% of wood products exports in 1995 (Table 1). Chip
exports increased by 128% between 1990 and 1996 and remained at high levels until the
early 2000s (USDA FAS 2014).
The increases in chip exports were primarily the result of shipments to Japan for
pulp and paper production. In the 2000s, Japan started to import hardwood chips from
Australia (ANU Forestry 2000; Honnold 2009). By 2013, chip exports to Japan represented
less than 1% of total chip exports and Canada was the most important export market for
chips (Table 2). Flooring, plywood, and other products
Hardwood flooring exports increased by more than 55% between 1990 and 2013,
and most of the flooring that is currently being exported is shipped to Canada (USDA FAS
2014). Hardwood plywood exports increased by 58% between 1990 and 2013, and more
than 80% of the shipments of this product are currently being shipped to Canada and
Mexico (Table 2). Hardwood molding exports in 2013 were $15 million, with the bulk of
the shipments of this product going to Canada and smaller amounts going to Mexico.
Hardwood siding exports reportedly increased in recent years and totaled $13 million in
2013 (USDA FAS 2014).
PEER-REVIEWED ARTICLE bioresources.com
Luppold & Bumgardner (2014). “Hardwood trade,” BioResources 9(4), 7086-7098. 7090
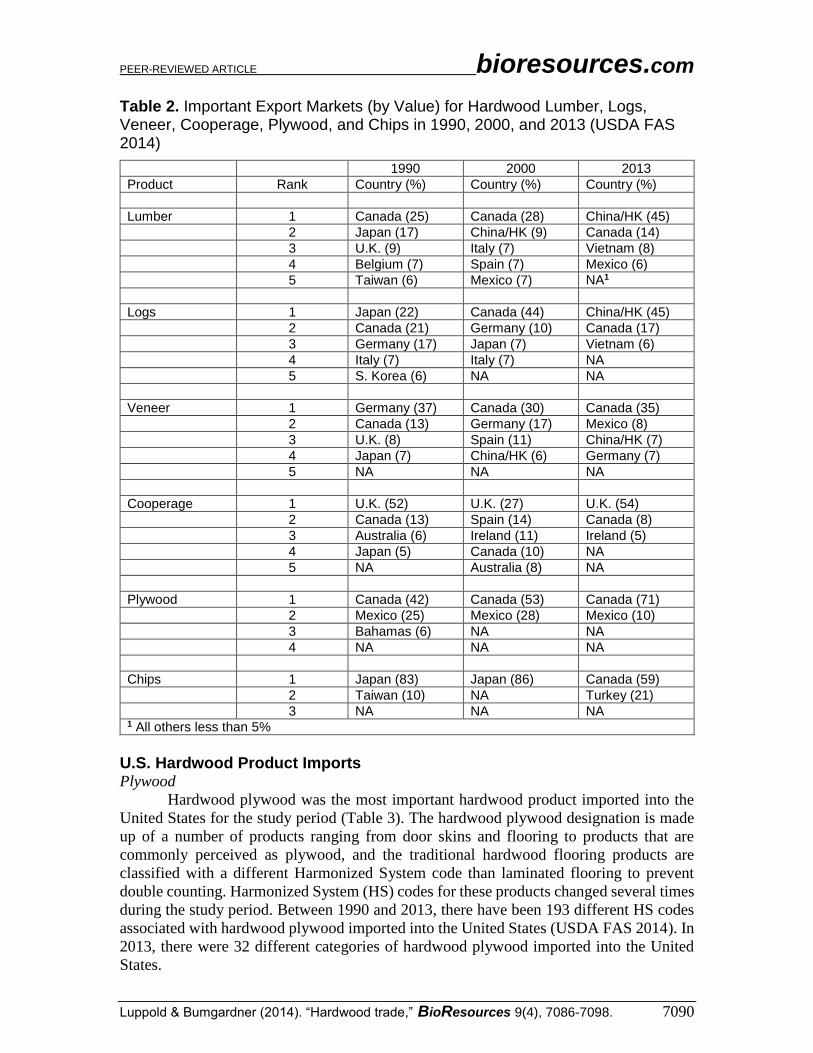
Table 2. Important Export Markets (by Value) for Hardwood Lumber, Logs, Veneer, Cooperage, Plywood, and Chips in 1990, 2000, and 2013 (USDA FAS 2014)
1990 2000 2013
Product Rank Country (%) Country (%) Country (%)
Lumber 1 Canada (25) Canada (28) China/HK (45)
2 Japan (17) China/HK (9) Canada (14)
3 U.K. (9) Italy (7) Vietnam (8)
4 Belgium (7) Spain (7) Mexico (6)
5 Taiwan (6) Mexico (7) NA1
Logs 1 Japan (22) Canada (44) China/HK (45)
2 Canada (21) Germany (10) Canada (17)
3 Germany (17) Japan (7) Vietnam (6)
4 Italy (7) Italy (7) NA
5 S. Korea (6) NA NA
Veneer 1 Germany (37) Canada (30) Canada (35)
2 Canada (13) Germany (17) Mexico (8)
3 U.K. (8) Spain (11) China/HK (7)
4 Japan (7) China/HK (6) Germany (7)
5 NA NA NA
Cooperage 1 U.K. (52) U.K. (27) U.K. (54)
2 Canada (13) Spain (14) Canada (8)
3 Australia (6) Ireland (11) Ireland (5)
4 Japan (5) Canada (10) NA
5 NA Australia (8) NA
Plywood 1 Canada (42) Canada (53) Canada (71)
2 Mexico (25) Mexico (28) Mexico (10)
3 Bahamas (6) NA NA
4 NA NA NA
Chips 1 Japan (83) Japan (86) Canada (59)
2 Taiwan (10) NA Turkey (21)
3 NA NA NA 1 All others less than 5%
U.S. Hardwood Product Imports Plywood
Hardwood plywood was the most important hardwood product imported into the
United States for the study period (Table 3). The hardwood plywood designation is made
up of a number of products ranging from door skins and flooring to products that are
commonly perceived as plywood, and the traditional hardwood flooring products are
classified with a different Harmonized System code than laminated flooring to prevent
double counting. Harmonized System (HS) codes for these products changed several times
during the study period. Between 1990 and 2013, there have been 193 different HS codes
associated with hardwood plywood imported into the United States (USDA FAS 2014). In
2013, there were 32 different categories of hardwood plywood imported into the United
States.

PEER-REVIEWED ARTICLE bioresources.com
Luppold & Bumgardner (2014). “Hardwood trade,” BioResources 9(4), 7086-7098. 7091
In 1990, nearly 55% of imported hardwood products were plywood; Indonesia was
the major source country for this product (Tables 3 and 4). East Asia was the source region
for more than 80% of plywood in 1990 (USDA FAS 2014). The majority of the plywood
imported from East Asia in 1990 appeared to be tropical, with the exception of products
from Taiwan, which primarily had face material of temperate species. While hardwood
plywood imports increased by 33% between 1990 and 2000, they declined proportionally
relative to other hardwood products because of large increases in the importation of lumber,
veneer, and flooring. While East Asia remained the most important source region in 2000,
there were large increases in temperate plywood imports from Canada and Russia between
1990 and 2000 (USDA FAS 2014).
The value of hardwood plywood imported by the United States peaked in 2006 at
over $1 billion but then decreased 47% between 2006 and 2009 (USDA FAS 204). The
decrease in hardwood plywood imports during this period coincided with the continued
reduction in domestic furniture production and the decline in U.S. home construction.
Hardwood plywood is used in the production of kitchen cabinets, laminated flooring, and
wood furniture. Plywood imports have increased since 2009 but have remained well below
the levels recorded in the mid-2000s. In 2013, 76% of hardwood plywood imports
originated in East Asia, with China being the most important source country and Indonesia
the second most important source (Table 4). Sixty-two percent of the plywood imports in
2013 had temperate face material. Another 19% of plywood imports was represented by
laminated flooring (HC 4412315125, 4412323125, and 4412943105), primarily imported
from China. Table 3. Percentage Market Share (based on value) of Hardwood Products Imported, by Year1 (USDA FAS 2014)
Product 1990 1995 2000 2006 2009 2013
--- Percent ---
Plywood 54.5 47.7 37.9 46.1 53.6 56.6
Lumber 14.6 20.5 23.4 19.0 15.2 17.5
Cooperage 3.2 4.0 5.6 5.0 9.2 9.0
Veneer 16.9 17.8 16.4 8.7 9.9 7.3
Molding 5.1 4.4 6.7 10.6 9.9 7.2
Flooring 4.6 4.1 7.7 8.9 1.3 1.3
Logs 1.1 1.4 2.1 0.9 0.8 0.9
Other2 0.0 0.2 0.2 0.7 0.1 0.2 1 May not add up to 100% due to rounding error 2 Other products include siding and chips
Lumber
Lumber accounted for nearly 15% of all hardwood product imported by the United
States in 1990 (Table 3). While Canada was the most important individual source (Table
4), South and Central America was the most important source region in 2013, at 31%
(USDA FAS 2014). Another 20% of hardwood lumber imported in 1990 was sourced from
multiple East Asian countries. Hardwood lumber imports increased by more than 200%
between 1990 and 2000, while imports of temperate lumber from Canada increased by
390%, making North America the most important source region in 2000 (Table 4).
Hardwood lumber imports increased another 23% between 2000 and 2005, with the
greatest increase being imports from South and Central America. Lumber imports declined
by 66% between 2005 and 2009 but increased by 39% between 2009 and 2013. In 2012,

PEER-REVIEWED ARTICLE bioresources.com
Luppold & Bumgardner (2014). “Hardwood trade,” BioResources 9(4), 7086-7098. 7092
lumber imports from Brazil were slightly higher than imports from Canada on a dollar
value basis, but Canada regained the leading market share in 2013. The most important
component of Brazilian imports is ipe (Tabebuia serratifolia), a species commonly used
for exterior purposes such as siding and decking, while maple (Acer spp.) and other
temperate species have been the mainstay of the imports from Canada. Cooperage
Similar to cooperage exports, cooperage imports also have been increasing over the
last 24 years (USDA FAS 2014). In 1990, nearly all the cooperage was imported from
Western Europe, with France being the largest single supplier (Table 4). In the late 1990s,
imports from Hungary started to increase but remained less than 5% of total imports. In
2013, fully assembled new barrels (casks) accounted for 86% of the cooperage products
imported from France, which remained the leading source (UDSA FAS 2014).
Veneer
In 1990, nearly 17% of the hardwood products imported by the United States was
veneer, and more than half of this veneer was imported from Canada (Tables 3 and 4).
Between 1990 and 2000, veneer imports increased at a similar level to overall wood
products, as indicated by the relatively stable market share (Table 3). Canada remained the
most important source of this product during this period and subsequent years. Veneer
imports declined by 65% between 2002 and 2011 and have remained at low levels since
then (USDA FAS 2014). Similar to plywood and lumber, the decline in veneer imports
coincided with declines in U.S. wood household furniture and cabinet production (Jones
2013). Molding
U.S. imports of hardwood molding have fluctuated over the years (USDA FAS
2014), and the major source countries continue to change (Table 4). Historically, East Asia
has been the most important source region for this product, but the major source countries
in this region have shifted from Malaysia and Indonesia to China. Canada was once a major
source for hardwood molding and was narrowly the most important source country in 2000.
Since 2005, China has become the most important source country for hardwood molding,
and in 2007, Brazil became the second most important source. Molding is primarily used
as trim work in homes and can be used in combination with kitchen cabinets. The peak
year for molding imports was 2006, but imports declined as U.S. home construction
declined. Flooring
The value of U.S. hardwood flooring imports increased by more than 580%
between 1990 and 2005, but most of this increase occurred between 2003 and 2005 (USDA
FAS 2014). While Table 4 indicates that Sweden and Indonesia were important sources of
imported flooring in 1990 and 2000, China was the most important source of flooring
during the peak year of 2005. It is believed that some of this flooring imported from China
was bamboo (technically not a hardwood tree but a grass), but there is no way to verify this
possibility, other than that 82% of the flooring imported in 2005 was classified as HS
4409202560—“HW floor other”. Hardwood flooring imports declined by more than 96%
between 2005 and 2010, and have subsequently remained low. Similar to other products

PEER-REVIEWED ARTICLE bioresources.com
Luppold & Bumgardner (2014). “Hardwood trade,” BioResources 9(4), 7086-7098. 7093
used in home construction, flooring imports declined sharply (92%) since the peak U.S.
home construction year of 2005. Table 4. Important Import Sources for Hardwood Plywood, Lumber, Cooperage, Veneer, Molding, and Flooring in 1990, 2000, and 2013 (USDA FAS 2014)
1990 2000 2013
Product Rank Country (%) Country (%) Country (%)
Plywood 1 Indonesia (61) Indonesia (29) China/HK (57)
2 Taiwan (13) Canada (22) Indonesia (11)
3 Canada (7) Malaysia (13) Russia (9)
4 Brazil (6) Russia (11) Canada (6)
5 NA1 Brazil (10) NA
Lumber 1 Canada (33) Canada (52) Canada(24)
2 Brazil (23) Brazil (14) Brazil (16)
3 Bolivia (12) Peru (7) Cameroon (7)
4 Malaysia (6) Malaysia (7) Germany (6)
5 Philippines (5) NA Ecuador (6)
Cooperage 1 France (97) France (93) France (92)
2 NA NA NA
Veneer 1 Canada (56) Canada (60) Canada (49)
2 Brazil (13) Italy (9) Italy (9)
3 Germany (6) Brazil (6) Germany (8)
4 NA NA China/HK (7)
5 NA NA NA
Molding 1 Malaysia (19) Canada (21) China/HK (33)
2 Canada (18) Indonesia (21) Brazil (25)
3 Taiwan (17) China/HK (12) Canada (10)
4 Indonesia (12) Brazil (12) Italy (7)
5 Mexico (7) Italy (10) Malaysia (7)
Flooring2 1 Sweden (30) Indonesia (17) Indonesia (34)
2 Malaysia (23) Sweden (15) Malaysia (21)
3 Canada (14) Malaysia (12) China/HK (17)3
4 Thailand (7) Spain (11) NA
5 Indonesia (5) Thailand (8) NA 1 All others less than 5% 2 The peak year for flooring imports was 2005. In that year, China was the source for 35% of imports 3 This figure most likely included bamboo flooring
Log and other products
While hardwood logs are an important U.S. export product, U.S. hardwood log
imports are minor (Table 3), and the vast majority of imports over the years have originated
from Canada (USDA FAS 2014). Hardwood chips are also a minor U.S. imported product,
and the major sources of chips have been Canada, Brazil, and Western Europe, depending
on which year is being examined. While chips originating from Canada and Brazil are most
likely used in pulp production, the increase in imports of chips from Western Europe is
PEER-REVIEWED ARTICLE bioresources.com
Luppold & Bumgardner (2014). “Hardwood trade,” BioResources 9(4), 7086-7098. 7094
most likely used for wine aging because aging wine with chips is less expensive than using
imported or domestically produced barrels (Yeamans 2007). Hardwood siding is an
extremely minor imported hardwood product, accounting for 0.1% or less of total imports
during the entire study period. Balance of U.S. Hardwood Product Trade
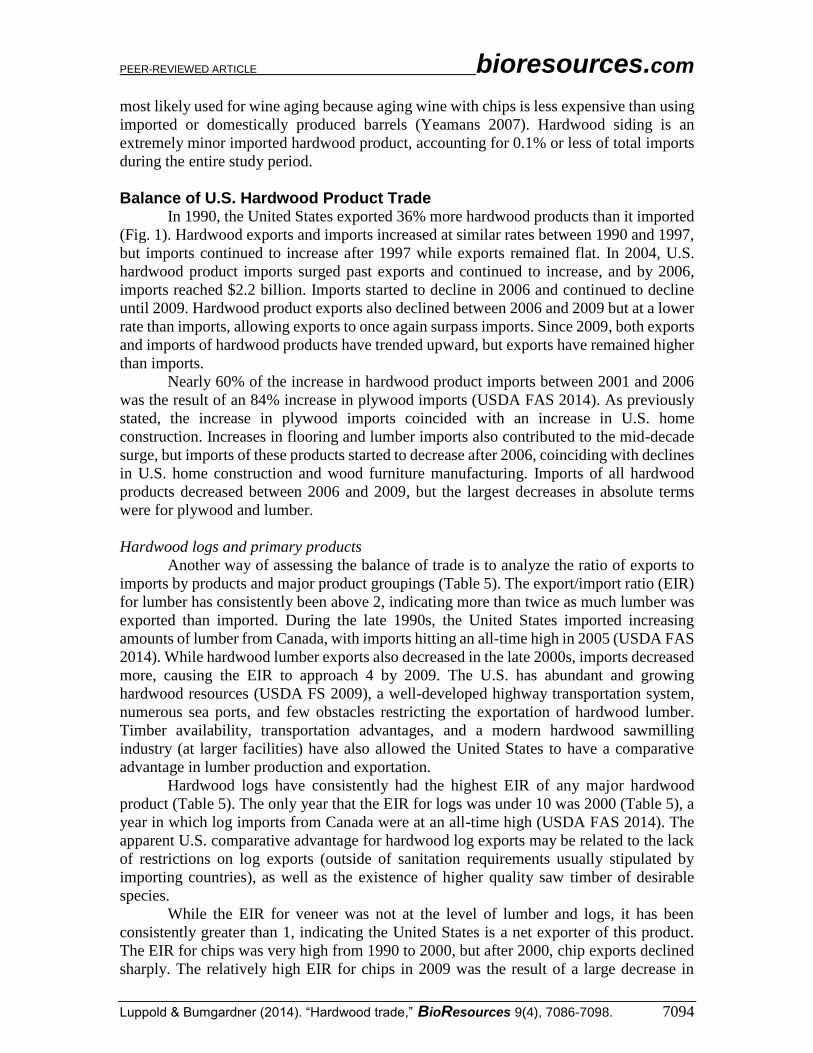
In 1990, the United States exported 36% more hardwood products than it imported
(Fig. 1). Hardwood exports and imports increased at similar rates between 1990 and 1997,
but imports continued to increase after 1997 while exports remained flat. In 2004, U.S.
hardwood product imports surged past exports and continued to increase, and by 2006,
imports reached $2.2 billion. Imports started to decline in 2006 and continued to decline
until 2009. Hardwood product exports also declined between 2006 and 2009 but at a lower
rate than imports, allowing exports to once again surpass imports. Since 2009, both exports
and imports of hardwood products have trended upward, but exports have remained higher
than imports.
Nearly 60% of the increase in hardwood product imports between 2001 and 2006
was the result of an 84% increase in plywood imports (USDA FAS 2014). As previously
stated, the increase in plywood imports coincided with an increase in U.S. home
construction. Increases in flooring and lumber imports also contributed to the mid-decade
surge, but imports of these products started to decrease after 2006, coinciding with declines
in U.S. home construction and wood furniture manufacturing. Imports of all hardwood
products decreased between 2006 and 2009, but the largest decreases in absolute terms
were for plywood and lumber. Hardwood logs and primary products
Another way of assessing the balance of trade is to analyze the ratio of exports to
imports by products and major product groupings (Table 5). The export/import ratio (EIR)
for lumber has consistently been above 2, indicating more than twice as much lumber was
exported than imported. During the late 1990s, the United States imported increasing
amounts of lumber from Canada, with imports hitting an all-time high in 2005 (USDA FAS
2014). While hardwood lumber exports also decreased in the late 2000s, imports decreased
more, causing the EIR to approach 4 by 2009. The U.S. has abundant and growing
hardwood resources (USDA FS 2009), a well-developed highway transportation system,
numerous sea ports, and few obstacles restricting the exportation of hardwood lumber.
Timber availability, transportation advantages, and a modern hardwood sawmilling
industry (at larger facilities) have also allowed the United States to have a comparative
advantage in lumber production and exportation.
Hardwood logs have consistently had the highest EIR of any major hardwood
product (Table 5). The only year that the EIR for logs was under 10 was 2000 (Table 5), a
year in which log imports from Canada were at an all-time high (USDA FAS 2014). The
apparent U.S. comparative advantage for hardwood log exports may be related to the lack
of restrictions on log exports (outside of sanitation requirements usually stipulated by
importing countries), as well as the existence of higher quality saw timber of desirable
species.
While the EIR for veneer was not at the level of lumber and logs, it has been
consistently greater than 1, indicating the United States is a net exporter of this product.
The EIR for chips was very high from 1990 to 2000, but after 2000, chip exports declined
sharply. The relatively high EIR for chips in 2009 was the result of a large decrease in

PEER-REVIEWED ARTICLE bioresources.com
Luppold & Bumgardner (2014). “Hardwood trade,” BioResources 9(4), 7086-7098. 7095
imports. The overall EIR for all hardwood logs and primary products has been consistently
over 2 for the period being examined.
Fig. 1. U.S. hardwood product exports and imports, 1990 to 2013, in 1982 dollars (USDA FAS 2014); includes hardwood logs, lumber, veneer, cooperage, molding, siding, plywood, and flooring
Milled secondary products
The EIR for cooperage was slightly higher than 1 in the early 1990s but has
consistently been lower than 1 since then (Table 5). The EIR for molding has consistently
been lower than 0.3, as imports from East Asia and Canada have exceeded exports to
Canada. The EIR for siding has sharply increased in recent years as a result of increased
exports. The overall EIR for all milled secondary products has consistently been 0.6 or less
for the period examined, with siding and cooperage being the most important products in
this group. Further-processed secondary products
The EIR for hardwood plywood is 0.1 for 1990, 1995, 2000, 2006, 2009, and 2013,
indicating that the United States imported 10 times more plywood in those years than what
was exported (Table 5). Given the recent finding on hardwood imports from China by the
International Trade Commission in late 2013 (US ITC 2013), stating in part that “The
Chinese product is typically manufactured utilizing more labor and less automation,
particularly for repairing defects, preparing veneers, and laying up veneer sheets for
pressing”, there likely will be no major increase in the EIR for plywood in the near future
because the United States will continue to have a comparative disadvantage in the
production of this product. From 1990 to the mid-2000s, the EIR for flooring was
consistently under 1. The increase in the EIR in the late-2000s was the result of decreased
imports, as exports have been relatively steady. The decline in flooring imports appears to
be highly correlated with the decline in home construction. Overall EIR for further-
500
700
900
1100
1300
1500
1700
1900
2100
2300
2500
1990
1991
1992
1993
1994
1995
1996
1997
1998
1999
2000
2001
2002
2003
2004
2005
2006
2007
2008
2009
2010
2011
2012
2013
Mill
ion
19
82
do
llars
Exports Imports

PEER-REVIEWED ARTICLE bioresources.com
Luppold & Bumgardner (2014). “Hardwood trade,” BioResources 9(4), 7086-7098. 7096
processed secondary products has been consistently less than 0.2 since 1990, largely as the
result of relatively high plywood imports. Table 5. Hardwood Product Export/import Ratios (EIR) for Logs and Primary Products, Milled Secondary Products, and Further-processed Secondary Products by Year (USDA FAS 2014)
Product Group and Product
1990
1995
2000
2006
2009
2013
--- Ratio ---
Logs and primary products
Lumber 5.7 4.2 2.9 2.3 3.4 4.2
Logs 24.1 14.4 9.0 17.8 36.0 24.4
Veneer 1.2 1.2 1.2 1.3 1.4 1.5
Chips 799.5 156.1 76.1 2.1 26.7 6.7
All products 4.5 3.8 2.8 2.5 3.7 4.1
Milled secondary products
Cooperage 1.1 0.4 0.9 0.4 0.8 0.6
Molding 0.3 0.3 0.2 0.1 0.1 0.2
Siding 0.4 1.1 1.3 4.4 7.3 25.2
All Products 0.6 0.4 0.5 0.2 0.5 0.5
Further-processed secondary products
Plywood 0.1 0.1 0.1 0.1 0.1 0.1
Flooring 0.8 0.5 0.5 0.3 2.7 3.0
All products 0.1 0.1 0.1 0.1 0.1 0.1
CONCLUSIONS
1. Hardwood lumber has remained the most important U.S. hardwood export product
through the study period. However, the destination markets for this product have
changed over time. In 1990, Western Europe, Canada, and Japan were the major
markets, but by 2013, the majority of the lumber exported went to East Asia, with
China/Hong Kong and Vietnam being the two most important markets in that region.
U.S. hardwood log exports have changed in a similar manner to lumber exports,
shifting from Western Europe, Japan, and Canada in 1990 to East Asia in 2013.
2. Of all the primary products, veneer exports have been the most consistent with respect
to receiving countries; Canada and Germany were the top two markets throughout the
study period. The EIR for veneer also has remained relatively stable, increasing slightly
through the study period. From the early 1990s to 2000, hardwood chips were a major
U.S. export product, but after Japan started to source chips from Australia, this market
declined rapidly.
3. Three other important U.S. hardwood export products are cooperage, flooring, and
plywood. The major market for cooperage is Western Europe, with the U.K. being the
most important individual market. Exports of hardwood flooring and plywood have
increased over the years, and the major receiving countries for these products remain
Canada and Mexico. Hardwood molding and siding are minor export products; in 2013,

PEER-REVIEWED ARTICLE bioresources.com
Luppold & Bumgardner (2014). “Hardwood trade,” BioResources 9(4), 7086-7098. 7097
Canada was the most important market for hardwood molding and Mexico was the
most important market for siding.
4. Plywood is by far the most important hardwood product imported by the United States.
Except for the late 1990s and early 2000s, between 50 and 80% of U.S. hardwood
plywood imports originated from East Asia. However, the most important source
country for U.S. hardwood plywood has shifted from Indonesia to China. Between the
late 1990s and early 2000s, approximately 20% of plywood imports came from Canada.
Traditionally, Canada also has been the most important source of U.S. hardwood
lumber imports, but Brazil temporarily displaced Canada for the top position in 2012.
Hardwood veneer imports have been in decline since 2005.
5. Three other important hardwood products that are imported into the United States are
cooperage, molding, and flooring. Cooperage imports have steadily increased over the
years, and France has remained the dominant source of this product. In contrast,
molding imports have been highly variable and the dominant source country changed
continually until 2005, when China became the most important supplier. Flooring
import levels and source countries have also fluctuated over time, but East Asia has
consistently been the most important source region overall.
6. While the overall balance of hardwood product trade has remained positive for most of
the years examined, the United States has an apparent comparative advantage in logs
and primary product markets but a comparative disadvantage in hardwood plywood
production. Given anticipated future changes in exchange rates and relative labor costs
in China and other East Asian countries, these comparative advantages and
disadvantages in international hardwood product trade are likely to continue, at least in
the near term.
REFERENCES CITED
Australian National University (ANU) Forestry. (2000). “Japanese woodchip import
market,” Market Report 14, Department of Forestry, Australian National University,
Canberra Australia, (http://fennerschool-
associated.anu.edu.au/marketreport/report14.pdf).
Bressler, R. G., and King, R. A. (1970). Markets, Prices, and Interregional Trade, John
Wiley and Sons, New York.
Bumgardner, M., Johnson, S., Luppold, W., Maplesden, F., and Pepke, E. (2014).
“Markets and market forces for lumber,” in: The Global Forest Sector: Changes,
Practices, and Prospects, E. Hansen, R. Panwar, and R. Vlosky (eds.), CRC Press,
Boca Raton, FL.
Honnold, V. (2009). “Developments in the sourcing of raw materials for the production
of paper,” Journal of International Commerce and Economics, August 2009,
(http://www.usitc.gov/publications/332/journals/sourcing_raw_materials.pdf).
Jones, M. (2013). Bulletin of Hardwood Market Statistics: 2012, Research Note NRS-
174, U.S. Forest Service, Northern Research Station, Newtown Square, PA.
Ludford, S. (2011). “Whiskey and wine share an essential element: Oak barrels,” Taylor
Eason.com, (http://www.tayloreason.com/corkscrew/archives/whiskey-and-wine-
share-an-essential-element-oak-barrels/).

PEER-REVIEWED ARTICLE bioresources.com
Luppold & Bumgardner (2014). “Hardwood trade,” BioResources 9(4), 7086-7098. 7098
Luppold, W., and Araman, P.A. (1988). Hardwood Trade Trends: U.S. Exports, Research
Paper NE-611, U.S. Department of Agriculture, Forest Service, Northeastern Forest
Experiment Station, Broomall, PA.
Luppold, W. (1995). “Causes and remedies for errors in international forest product trade
data, example from the hardwood trade statistics," Forest Science 41(2), 278-283.
Luppold, W., and Bumgardner, M. (2011). “Thirty-nine years of U.S. wood furniture
importing: Sources and products,” BioResources 6(4), 4895-4908.
Luppold, W., and Bumgardner, M. (2013). “Factors influencing changes in U.S.
hardwood log and lumber exports from 1990 to 2011,” BioResources 8(2), 1615-
1624.
United States Department of Agriculture, Foreign Agricultural Service (USDA FAS).
(2014). Global Agricultural Trade System, U.S. Department of Agriculture,
Washington, D.C., (http://www.fas.usda.gov/gats/default.aspx).
United States Department of Agriculture Forest Service (USDA FS). (2009). Forest
Resources of the United States, 2007. General Technical Report WO-78, U.S.
Department of Agriculture, Forest Service, Washington Office.
United States Department of Labor (USDL). (2014). Producer Price Index Commodity
Data, U.S. Department of Labor, Washington, D.C.,
(http://data.bls.gov/pdq/querytool.jsp?survey=wp).
United States International Trade Commission (US ITC). (2013). Investigation Nos. 701‐TA‐490 and 731‐TA‐1204 (Final), Hardwood Plywood from China, Publication 4434,
U.S. International Trade Commission, Washington D.C.,
(http://www.usitc.gov/publications/701_731/Pub4434.pdf).
Yeamans, B. (2007). “Oak barrels vs. oak chips: The showdown,” The Academic Wino,
(http://www.academicwino.com/2011/06/oak-barrels-vs-oak-chips-showdown.html/).
Article submitted: July 14, 2014; Peer review completed and article accepted: September
30, 2014; Published: October 8, 2014.


![Bioresources - Ofwat · Bioresources – New Directorate Group Relationship • Services market tested [and outsourced] (e.g. maintenance, IT, HR) • Sludge delivered under quality](https://img.pdfslide.us/doc/110x75/60197b1228b8ee67b2041c2e/bioresources-ofwat-bioresources-a-new-directorate-group-relationship-a-services.jpg)