Embed Size (px)
Citation preview

Pedestrian Safety – Left Turns at Signals B.Royce Page 1 of 16
Transportation Group New Zealand – ENZ TG Conference, Wellington, 3-6 March 2019
PEDESTRIAN SAFETY – LEFT TURNS AT SIGNALS RESEARCH STUDY
Author:
Bruno Royce – BScEng (Civil) (Hons), MBA, Eng(NZ), CPEng, IntPE(NZ), TGEng(NZ)
Director / Principal Traffic Engineer, Traffic Engineering Solutions Ltd (TES) Email: [email protected]
24 January 2019
ABSTRACT
The government’s enhanced focus on road safety should require proposed roading improvements to incorporate intersection design layouts that have a proven safety record, to ensure confidence in performance and economic value.
Post implementation crash monitoring can identify intersection design layouts that have a proven record of success at reducing road trauma. Pedestrians are vulnerable road users, and particularly important in relation to the government’s commitment to the Safe System principles of reducing Death and Serious Injury (DSI) crashes (Safer Journeys (2010)).
TES has completed an extensive ‘before and after’ research study of all reported pedestrian crashes at 585 signals and 1,679 left turn lanes in Auckland.
The study identifies the numbers and proportions of each type of left turn lane, and compares this to the proportion of pedestrian crashes occuring at those types of lanes:
The main result from the study was that slip lanes (c) have a greater proportion of pedestrian
crashes than their frequency on the network. However, the safety performance of all slip
lanes was distorted by slip lanes with pedestrian zebra crossings, which performed
significantly worse with respect to all crashes and DSI crashes.
Slip lane category (c) was further subdivided into slip lanes: (1) with or without pedestrian zebra crossings, (2) signalised crosswalks, (3) raised platforms, (4) short or long length lanes, and (5) low or high entry angle lanes, for which further conclusions were reached. In order to help reduce road trauma for vulnerable road users such as pedestrians, engineers in New Zealand should be aware of the pedestrian safety implications of alternative left turn lane treatments at signalised intersections, prior to changing existing intersection layouts, or designing new intersections. This paper succintly decribes the study findings, allowing practioners to digest and critique the results.
Pedestrian Safety – Left Turns at Signals B.Royce Page 2 of 16
Transportation Group New Zealand – ENZ TG Conference, Wellington, 3-6 March 2019
INTRODUCTION
BACKGROUND
As part of Auckland Transport’s Vision Zero mission to eliminate Death and Serious Injury (DSI) crashes in Auckland, Traffic Engineering Solutions Ltd (TES) was commissioned to study pedestrian and cycle crashes at left-turn lanes at traffic signals. Left-turn slip lanes are generally known to provide lower amenity for pedestrians, but their performance in terms of pedestrian safety has not been studied in Auckland recently. The results of the TES study should clarify the pedestrian safety implications of alternative left turn lane designs at signalised intersections. This knowledge should help to influence design and reduce left turn related pedestrian crashes at signalised intersections. STUDY CORDON
The study sample included all lanes that allow left turns at all signalised intersections in the Auckland Isthmus. In total, 580 signalised intersections were included in the study. Pedestrian and cycle (walking a bike) crash data was retrieved using the NZTA Crash database (NZTA. CAS Database). Signalised midblock pedestrian crossings and roundabout metering signals were not included as they do not include left turn lanes. Intersections signalised in the last 5 years (2013-2017) were excluded from the analysis, as the reported crash data over 5 years wouldn’t apply for the duration of the intersection. Also, left-turn lanes or junctions that were significantly upgraded over the last 5 years were excluded from the analysis, as the recent changes could bias the crash data. LEFT TURN LANES – ALTERNATIVE LAYOUTS
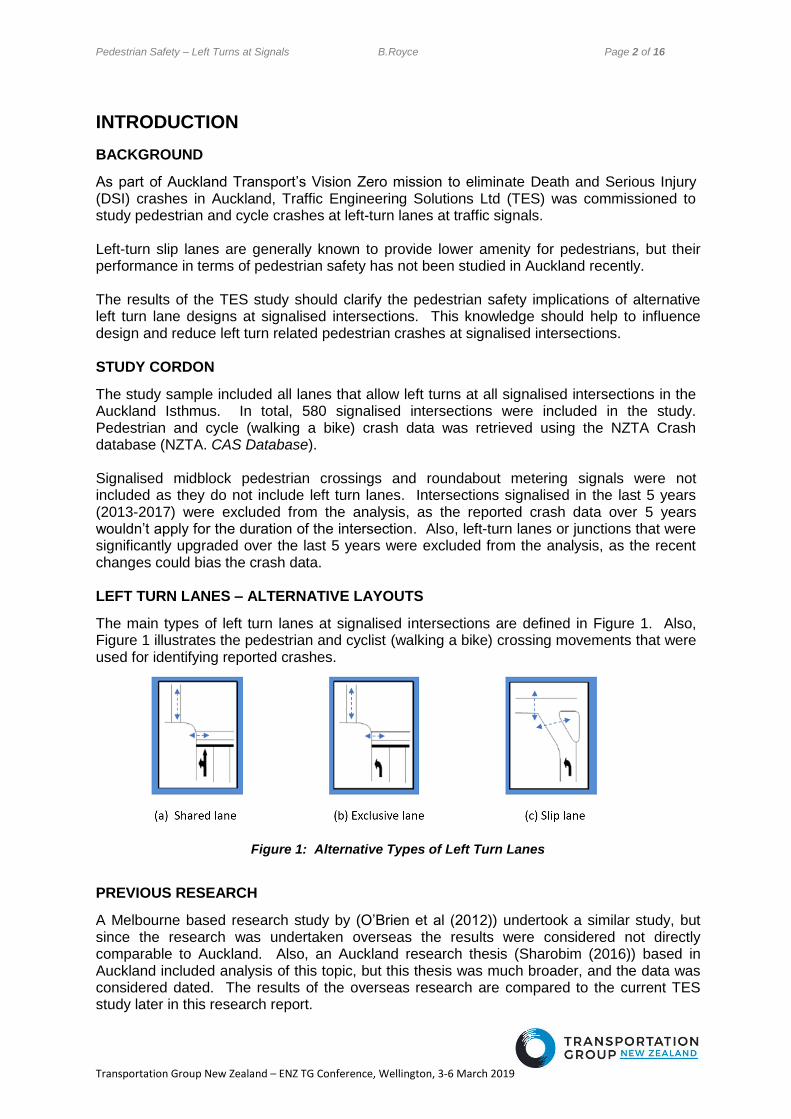
The main types of left turn lanes at signalised intersections are defined in Figure 1. Also, Figure 1 illustrates the pedestrian and cyclist (walking a bike) crossing movements that were used for identifying reported crashes.
Figure 1: Alternative Types of Left Turn Lanes
PREVIOUS RESEARCH
A Melbourne based research study by (O’Brien et al (2012)) undertook a similar study, but since the research was undertaken overseas the results were considered not directly comparable to Auckland. Also, an Auckland research thesis (Sharobim (2016)) based in Auckland included analysis of this topic, but this thesis was much broader, and the data was considered dated. The results of the overseas research are compared to the current TES study later in this research report.

Pedestrian Safety – Left Turns at Signals B.Royce Page 3 of 16
Transportation Group New Zealand – ENZ TG Conference, Wellington, 3-6 March 2019
LEFT TURN LANES – DISCUSSION
In general, shared (a) and exclusive (b) lanes are likely to operate relatively safely for pedestrians, if designed appropriately. Signalised crosswalks provide pedestrians with a high level of safety and amenity, particularly important if pedestrians include high proportions of children, elderly and/or vision/mobility impaired. Red signal arrow pedestrian protection of sufficient duration should enable pedestrians to cross the road safely. Motorists should have unobstructed visibility of pedestrians attempting to cross the road, or in the process of crossing the road, and should be clearly aware when pedestrians have priority. As compared to exclusive lanes (b), shared lanes (a) may reduce road safety and efficiency for traffic, depending upon the traffic signal phasing and sequencing. Rear-end crashes and vehicle delays can occur if left-turn and through motorists share one lane and obstruct each-other. Also, on a left-turn only signal arrow, ‘through’ motorists are sometimes misled into following a left-turn vehicle, while opposed by other traffic. For these reasons alone, exclusive lanes (b) can be preferable. In general, left turn slip lanes are provided at an intersection to improve intersection operational efficiency for traffic turning left and through. Also, slip lanes can ease left turn vehicle tracking, which is particularly useful for large vehicles. Furthermore, slip lanes with raised splitter islands allow primary signal lanterns to be placed closer to line of sight for approaching through traffic.
SLIP LANES – ALTERNATIVE LAYOUTS
Slip lanes (c) can be further sub-divided as shown in Figure 2:
Figure 2: Alternative Types of Slip Lanes

Pedestrian Safety – Left Turns at Signals B.Royce Page 4 of 16
Transportation Group New Zealand – ENZ TG Conference, Wellington, 3-6 March 2019
TABULATED RESULTS The analysis results are tabulated below, and the results are explained diagrammatically further in this research paper:
Treatment TES Study
Frequency 5 Year Crashes
No. of Sites No. of Crashes
a - Shared signalised 675 13
b - Exclusive Signalised 384 6
c - Left Turn Slip 637 25
Total 1,696 44
c1 – Slip standard 404 12
c2 – Slip + Ped Xing 147 13
c3 – Slip + Platform 3 0
c4 – Slip + Ped Xing Platform 1 0
c5 – Slip Signalised 54 0
c6 – Slip Free Flow 28 0
Total Slip Lanes 637 25
c7 – Slip Sharp Angle 121 3
c8 – Slip Gentle Angle 516 22
Total Slip Lanes 637 25
c9 – Slip Short Length 205 10
c10 – Slip Long Length 432 15
Total Slip Lanes 637 25
Table 1: Tabulated Results
Pedestrian Safety – Left Turns at Signals B.Royce Page 5 of 16
Transportation Group New Zealand – ENZ TG Conference, Wellington, 3-6 March 2019
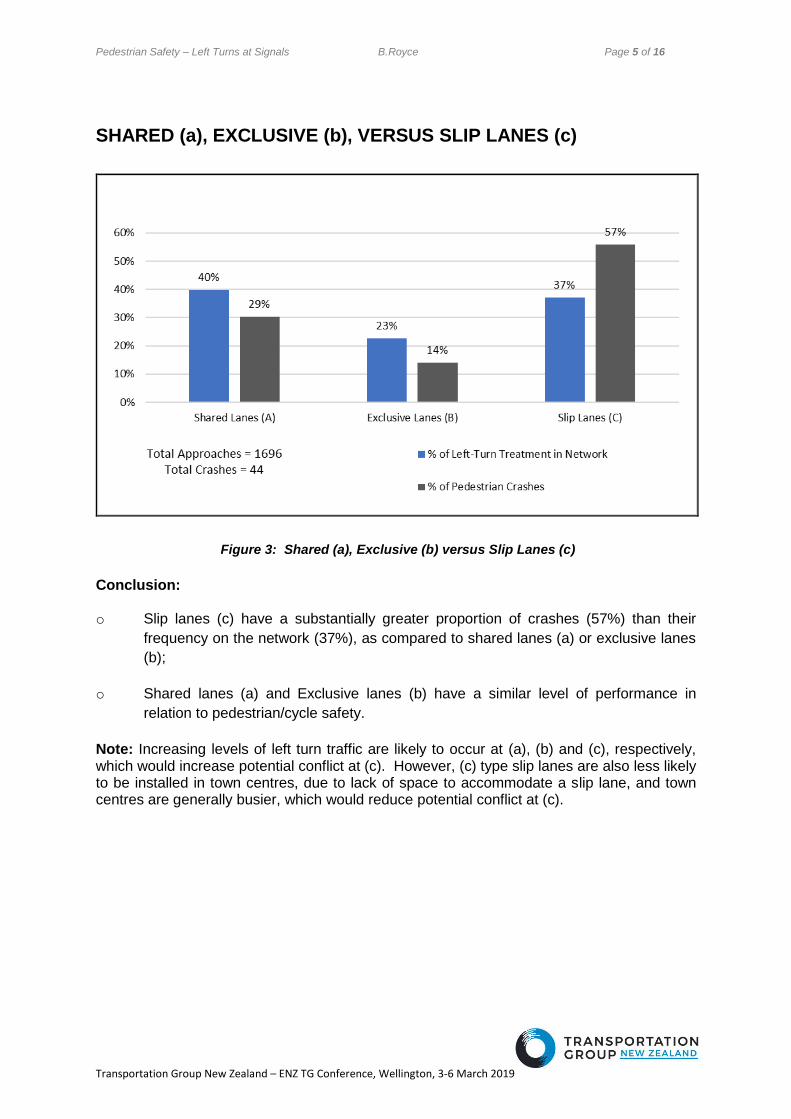
SHARED (a), EXCLUSIVE (b), VERSUS SLIP LANES (c)
Figure 3: Shared (a), Exclusive (b) versus Slip Lanes (c)
Conclusion: o Slip lanes (c) have a substantially greater proportion of crashes (57%) than their
frequency on the network (37%), as compared to shared lanes (a) or exclusive lanes
(b);
o Shared lanes (a) and Exclusive lanes (b) have a similar level of performance in
relation to pedestrian/cycle safety.
Note: Increasing levels of left turn traffic are likely to occur at (a), (b) and (c), respectively, which would increase potential conflict at (c). However, (c) type slip lanes are also less likely to be installed in town centres, due to lack of space to accommodate a slip lane, and town centres are generally busier, which would reduce potential conflict at (c).

Pedestrian Safety – Left Turns at Signals B.Royce Page 6 of 16
Transportation Group New Zealand – ENZ TG Conference, Wellington, 3-6 March 2019
STANDARD SLIP LANES (c1) VERSUS ZEBRA SLIP LANES (c2)
Figure 4: Standard Slip Lanes (c1) versus Zebra Slip Lanes (c2)
Conclusions: o Slip lanes (c2) with pedestrian crossings have a substantial (3 x) greater proportion
of crashes (32%) than their frequency on the network (9%). This result achieves chi-
squared significance of 99.9% (approximately);
o Slip lanes (c1) without pedestrian crossings have only a slightly greater proportion of
crashes (29%) than their frequency on the network (24%).
Note: Slip lanes with pedestrian zebra crossings (c2) are likely to have, on average, more pedestrians than slip lanes without zebra crossings, given the historical NZTA warrant policy. This would lead to higher pedestrian exposure on sites with zebra crossings. However, in more recent years lower priority has been placed on NZTA pedestrian crossing warrants when justifying new pedestrian crossings. Also, pedestrian crossings with very low pedestrian volumes are considered likely to operate less safely, as motorists have lower expectations of needing to give-way if a facility is rarely used. In order to determine if pedestrian numbers or traffic volumes have a significant bias in the crash statistics, it would be necessary to estimate or measure exposure at each site in the study sample.
Pedestrian Safety – Left Turns at Signals B.Royce Page 7 of 16
Transportation Group New Zealand – ENZ TG Conference, Wellington, 3-6 March 2019
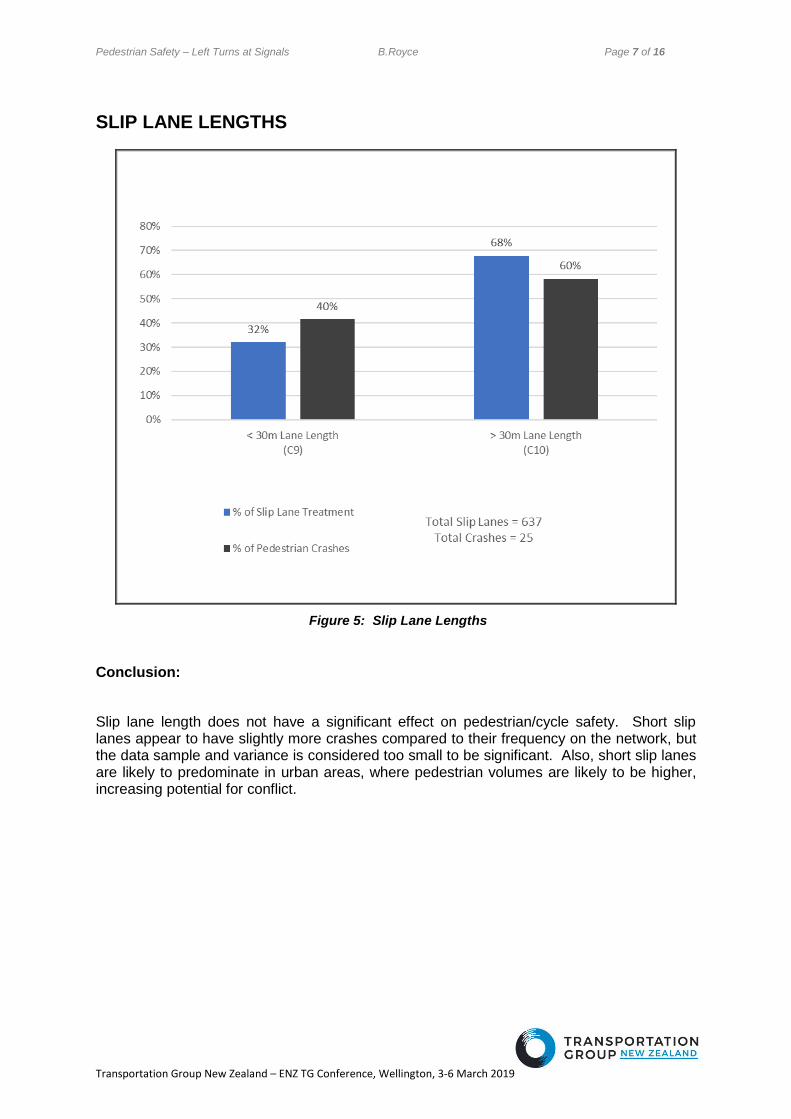
SLIP LANE LENGTHS
Figure 5: Slip Lane Lengths
Conclusion:
Slip lane length does not have a significant effect on pedestrian/cycle safety. Short slip lanes appear to have slightly more crashes compared to their frequency on the network, but the data sample and variance is considered too small to be significant. Also, short slip lanes are likely to predominate in urban areas, where pedestrian volumes are likely to be higher, increasing potential for conflict.
Pedestrian Safety – Left Turns at Signals B.Royce Page 8 of 16
Transportation Group New Zealand – ENZ TG Conference, Wellington, 3-6 March 2019
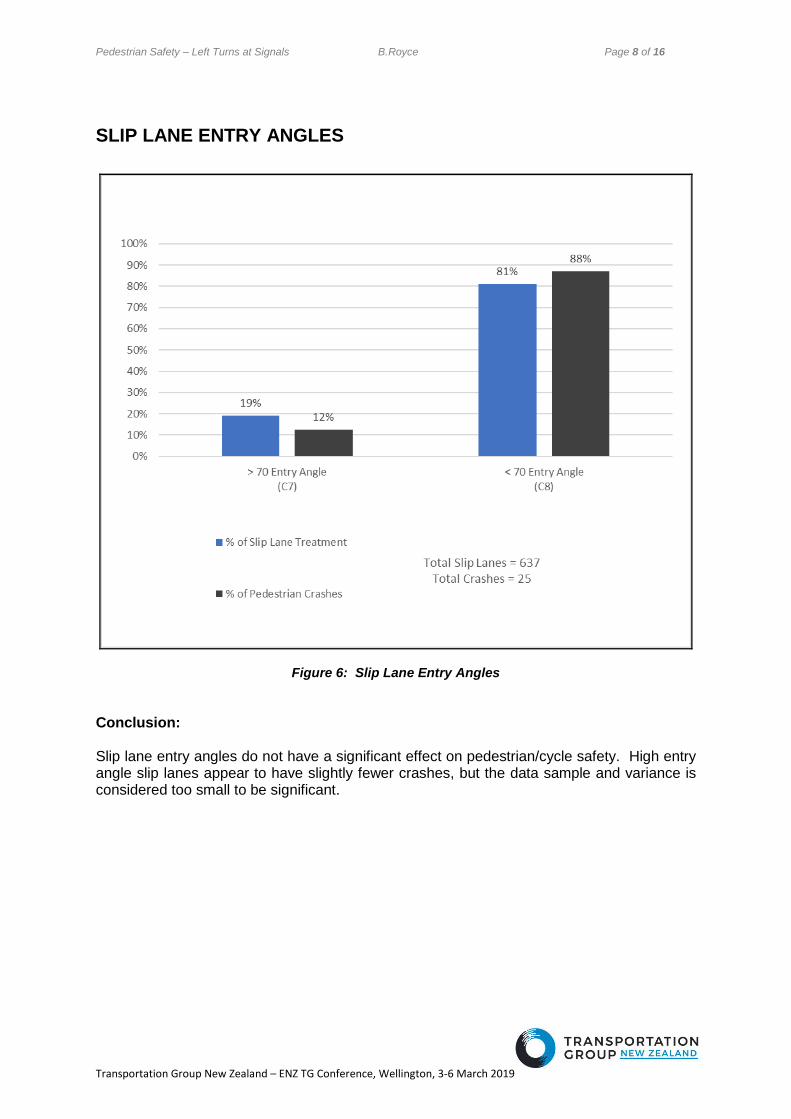
SLIP LANE ENTRY ANGLES
Figure 6: Slip Lane Entry Angles Conclusion: Slip lane entry angles do not have a significant effect on pedestrian/cycle safety. High entry angle slip lanes appear to have slightly fewer crashes, but the data sample and variance is considered too small to be significant.
Pedestrian Safety – Left Turns at Signals B.Royce Page 9 of 16
Transportation Group New Zealand – ENZ TG Conference, Wellington, 3-6 March 2019
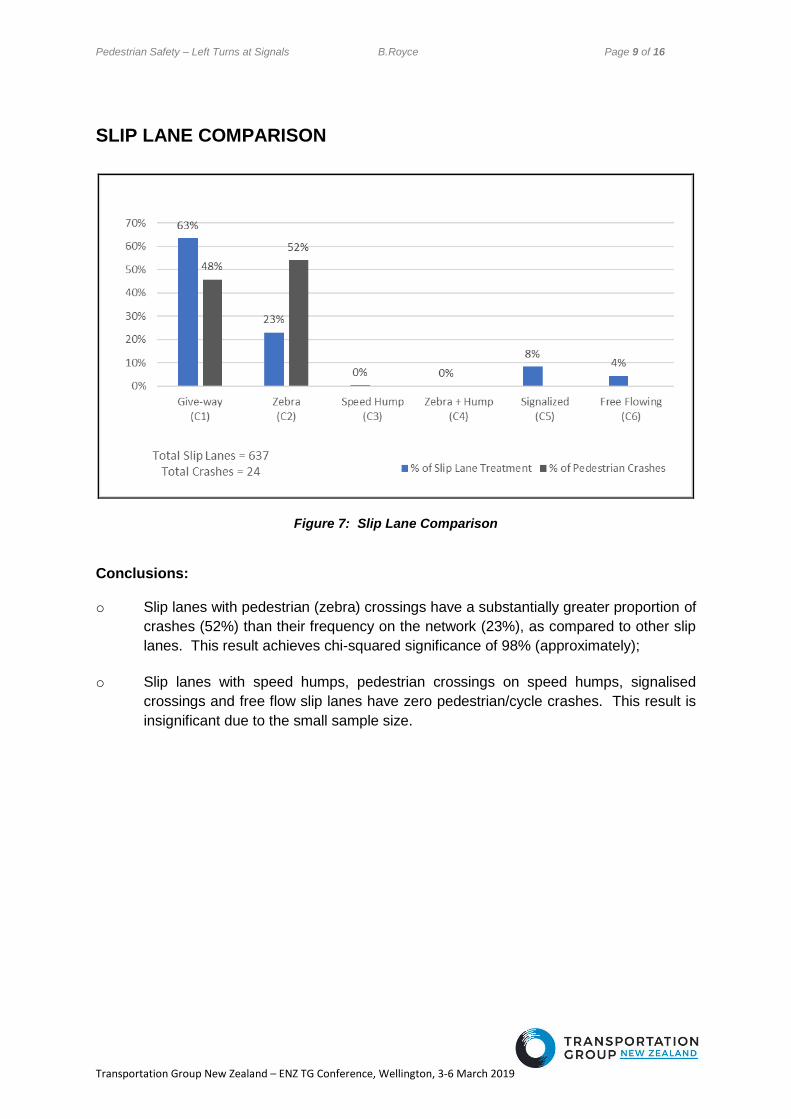
SLIP LANE COMPARISON
Figure 7: Slip Lane Comparison Conclusions: o Slip lanes with pedestrian (zebra) crossings have a substantially greater proportion of
crashes (52%) than their frequency on the network (23%), as compared to other slip
lanes. This result achieves chi-squared significance of 98% (approximately);
o Slip lanes with speed humps, pedestrian crossings on speed humps, signalised
crossings and free flow slip lanes have zero pedestrian/cycle crashes. This result is
insignificant due to the small sample size.
Pedestrian Safety – Left Turns at Signals B.Royce Page 10 of 16
Transportation Group New Zealand – ENZ TG Conference, Wellington, 3-6 March 2019
PEDESTRIAN DIRECTION
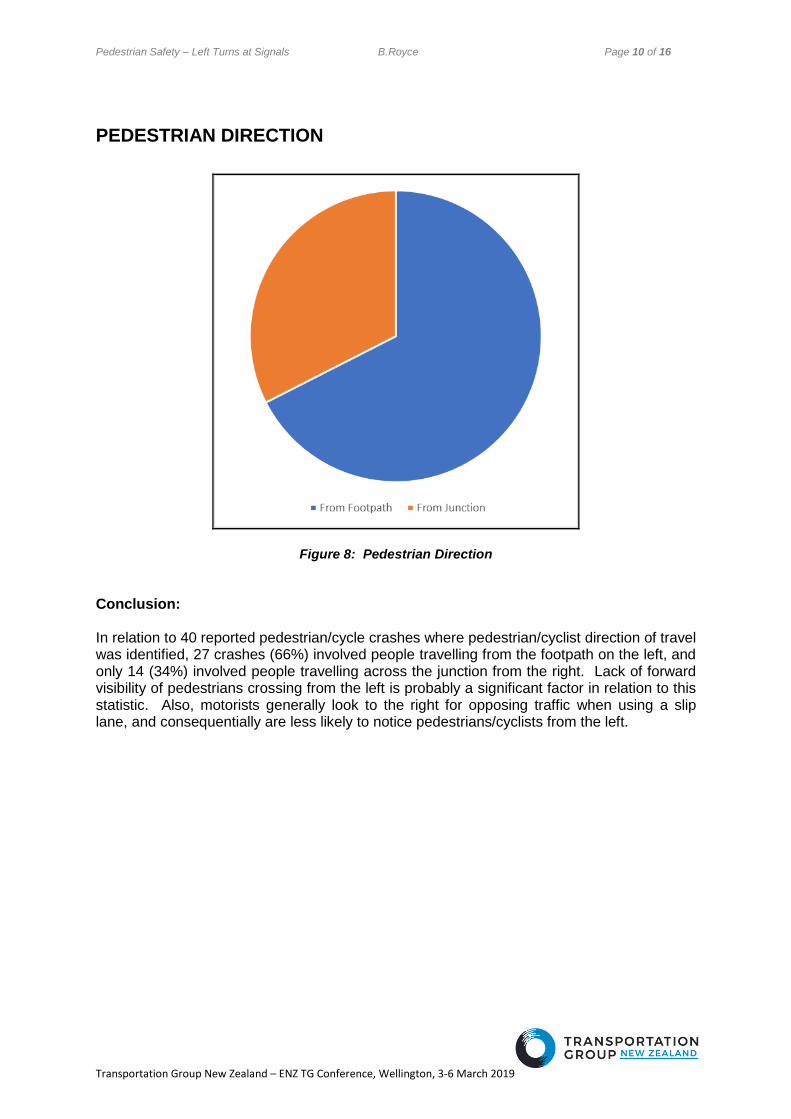
Figure 8: Pedestrian Direction Conclusion: In relation to 40 reported pedestrian/cycle crashes where pedestrian/cyclist direction of travel was identified, 27 crashes (66%) involved people travelling from the footpath on the left, and only 14 (34%) involved people travelling across the junction from the right. Lack of forward visibility of pedestrians crossing from the left is probably a significant factor in relation to this statistic. Also, motorists generally look to the right for opposing traffic when using a slip lane, and consequentially are less likely to notice pedestrians/cyclists from the left.

Pedestrian Safety – Left Turns at Signals B.Royce Page 11 of 16
Transportation Group New Zealand – ENZ TG Conference, Wellington, 3-6 March 2019
DSI TO TREATMENT TYPE
Figure 9: DSI to Treatment Type Conclusions: According to Safe System principles of design, priority should be given to addressing DSI crash types. The following is concluded:
• No fatal crashes, 4 serious injury pedestrian crashes, and 1 serious injury cyclist
crash (cyclist was walking a bike) have been reported involving left turn motorists at
traffic signals. The quantity of DSI pedestrian crashes are considered relatively low
in comparison to all other DSI crashes in Auckland;
• Slip lanes (c) have a substantially greater proportion of DSI pedestrian crashes
(80%) than their frequency on the network (37%). However, this result is not
significant due to the small sample size. Also, this result should be understood in
relation to the following:
o Slip lanes with pedestrian crossings (c2) have a substantially (6 x) greater
proportion of DSI crashes (60%) than their frequency on the network (9%);
o Slip lanes (c1) without pedestrian crossings have a similar proportion of DSI
crashes (20%) to their frequency on the network (24%).
Pedestrian Safety – Left Turns at Signals B.Royce Page 12 of 16
Transportation Group New Zealand – ENZ TG Conference, Wellington, 3-6 March 2019
PREVIOUS RESEARCH - MELBOURNE
The Melbourne based research study by O’Brien et al (2012) had two key conclusions:
Conclusion 1:
Slip lanes with pedestrian crossings appeared likely to operate less safely than slip lanes
without pedestrian crossings.
The TES report supports this conclusion. The TES report demonstrates that slip lanes with pedestrian crossings have a substantially greater proportion of pedestrian crashes (52%) than their frequency on the network (23%), as compared to other slip lane treatments. Thus, slip lanes with pedestrian crossings appeared likely to operate less safely. However, it is noted that slip lanes with pedestrian crossings may generally have higher average pedestrian volumes than slip lanes without pedestrian crossings, creating more potential for conflict.
The TES report also indicates that slip lanes without pedestrian crossings have a similar (slightly higher) proportion of pedestrian crashes (29%) than their frequency on the network (24%).
Conclusion 2:
The proportion of pedestrian crashes occuring in slip lanes (22%) was slightly lower than the
proportion of left-turn lanes that were designed as slip lanes (29%). Thus, in general, slip
lanes appeared slightly safer for pedestrians than other treatment types combined.
The TES study indicates that the proportion of pedestrian crashes occuring in slip lanes (57%) is substantially higher than the proportion of left-turn lanes that were designed as slip lanes (37%). Thus, in general, slip lanes appear less safe for pedestrians than other lane types (a) and (b). However, this result is biased by the poor pedestrian safety performance of slip lanes with pedestrian crossings. As mentioned above, slip lanes without pedestrian crossings have a similar performance to all other treatment types combined.

Pedestrian Safety – Left Turns at Signals B.Royce Page 13 of 16
Transportation Group New Zealand – ENZ TG Conference, Wellington, 3-6 March 2019
PREVIOUS RESEARCH – SHAROBIM THESIS
A research thesis undertaken by Sharobim (2016) was fairly recent and based in Auckland. Accordingly, it was considered useful to undertake a tabulated comparison:
Treatment
TES Study Sharobim Study
Frequency 5 Year
Crashes Frequency
5 Year Crashes
No % No % No % No %
a - Shared signalised 675 40% 13 30% 688 38% 18 39%
b - Exclusive Signalised
384 23% 6 14% 389 21% 8 17%
c - Left Turn Slip 637 37% 24 56% 741 41% 20 43%
Total 1,696 100% 43 100% 1818 100% 46 100%
c1 – Slip standard 404 63% 11 46% 460 25% 7 15%
c2 – Slip + Ped Xing 147 23% 13 54% 163 9% 12 26%
c3 – Slip + Platform 3 0% 0 0% NA NA NA NA
c4 – Slip + Ped Xing Platform
1 0% 0 0% 1 0% 0 0%
c5 – Slip Signalised 54 8% 0 0% 75 4% 1 2%
c6 – Slip Free Flow 28 4% 0 0% 42 2% 0 0%
Total Slip Lanes 637 100% 24 100% NA NA NA NA
c7 – Slip Sharp Angle 121 19% 3 13% NA NA NA NA
c8 – Slip Gentle Angle 516 81% 21 87% NA NA NA NA
Total Angled Slips 637 100% 24 100%
c9 – Slip Short Length 205 32% 10 42% NA NA NA NA
c10 – Slip Long Length 432 68% 14 58% NA NA NA NA
Total Length Slips 637 100% 24 100%
Table 2: Study Comparison
The TES study and thesis correlate with respect to slip lanes (c) having a greater proportion of pedestrian crashes than their frequency on the network. Also, the apparent poor performance of slip lanes (c) is predominantly due to slip lanes with pedestrian crossings. Furthermore, signalised slip lanes are relatively safe for pedestrians.
Minor differences in the data are attributed to the TES study being based on recent CAS crash data (2013-2017), as compared to the Sharobim thesis that used data that was three years older (2010-2014). Also, the TES study focussed on pedestrian and cyclist crashes only, and every Traffic Crash Report was reviewed. The Sharobim thesis was a much broader study, for which individual analysis of all Traffic Crash Reports was not feasible. Furthermore, the TES study excluded sites with recent changes or recently signalised, to avoid any potential bias in the data collected.
Pedestrian Safety – Left Turns at Signals B.Royce Page 14 of 16
Transportation Group New Zealand – ENZ TG Conference, Wellington, 3-6 March 2019
CONCLUSIONS The following key conclusions are reached:
• In total, 41 pedestrian crashes and 3 cyclist crashes were reported at left turn lanes
at 38 traffic signal sites;
• Slip lanes (c) have a considerably greater proportion of crashes (57%) than their
frequency on the network (37%). However, the apparent poor performance of slip
lanes (c) is predominantly due to slip lanes with pedestrian crossings, i.e:
o Slip lanes (c2) with pedestrian crossings have a substantially (3 x) greater
proportion of crashes (32%) than their frequency on the network (9%). This
result is considered significant;
o Slip lanes (c1) without pedestrian crossings have a similar proportion of
crashes (29%) to their frequency on the network (24%);
• Slip lane length and entry angle do not have a significant effect on pedestrian safety;
• Signalised slip lanes are safe for pedestrians, though the sample size was small;
• Slip lanes with pedestrian (zebra) crossings have a substantially greater (2 x)
proportion of crashes (52%) than their frequency as a slip lane (23%). This result is
considered significant;
• Slip lanes with speed humps, pedestrian crossings on speed humps, and free flow
slip lanes have zero pedestrian/cycle crashes. This result is insignificant due to the
small sample size;
• Most pedestrian/cycle crashes (66%) involve pedestrians walking from the footpath
on the left. This may relate to motorists generally looking for opposing traffic on the
right, and having reduced forward visibility of opposing pedestrians if they approach
from the left;
• Slip lanes with pedestrian crossings (c2) have a substantially greater (6 x) proportion
of DSI crashes (60%) than their frequency on the network (9%). However, this result
is not significant due to the small sample size. Also, the quantity of DSI crashes at
left turn lanes is relatively low (5 serious injury) in comparison to overall DSI in
Auckland;
• In order to determine if pedestrian numbers or traffic volumes have a significant bias
in the crash statistics, it would be necessary to estimate or measure exposure at
each site in the study sample. This could be the topic of on-going further research.
Pedestrian Safety – Left Turns at Signals B.Royce Page 15 of 16
Transportation Group New Zealand – ENZ TG Conference, Wellington, 3-6 March 2019
RECOMMENDATIONS
On the basis of the analysis results the following is recommended:
• Caution should be exercised if considering installation of a pedestrian zebra crossing
on a left turn slip lane, as pedestrian crossings on slip lanes appear to have a
relatively poor road safety performance record in comparison to all other left turn
treatment options;
• Pedestrian crossings on raised speed tables are likely to operate relatively safely,
though insufficient data was available in this study to reach any direct conclusions;
• If consideration is being given to installing a pedestrian crossing on a left turn slip
lane, and if it is not feasible to convert the slip lane into a signalised shared or
exclusive lane, then the following should be reviewed:
o Is the crossing warranted as per NZTA guidelines?
o Is the crossing justified by high proportions of children, elderly, vision/mobility
impaired pedestrians?
o Can it be installed on a raised speed table?
o Can the pedestrian crossing design fully comply with all relevant technical
and statutory requirements, particularly in relation to forward sight distance
visibility for approaching motorists of pedestrians from the left?
If the answer to any of the above is negative, then for pedestrian safety reasons a pedestrian crossing may be inadvisable;
• Converting a standard slip lane (c1) to a signalised shared or exclusive lane would
be unlikely to improve pedestrian safety unless a pedestrian crossing is warranted or
justified on the slip lane. This is because slip lanes without pedestrian crossings
operate relatively safely for pedestrians;
• It is important to ensure that motorists have clear visibility of any pedestrians
approaching a crossing point and/or in the process of starting to cross the road from
the left, as most pedestrian crashes (66%) involve pedestrians crossing from the left;
• Consideration should be given to undertaking further research to determine if
pedestrian numbers or traffic volumes have a significant bias in the crash statistics,
by evaluating exposure at each site in the study sample.

Pedestrian Safety – Left Turns at Signals Bruno Royce Page 16
IPENZ Transportation Group Conference, Hamilton, 29 – 31 March 2017
REFERENCES
NZTA. CAS Database, referenced 2018, <https://securecas.nzta.govt.nz/Citrix/AccessPlatform/auth/login.aspx> Safer Journeys (2010), The Safe System approach, viewed 2018, <http://www.saferjourneys.govt.nz/about-safer-journeys/the-safe-system-approach/> O’Brien, M., O’Brien, A., Liu, J., Michaux, G., & Nahlawi, H. (2012). – Pedestrian Safety at slip lanes and alternative turn lane treatments. Transportation Research Record: Journal of the Transportation Research Board (2299), 110-120. Sharobim R (2016) – The Effect of Left Turn Slip Lanes on Safety and Operational Performance of Signalised Intersections: University of Canterbury thesis.
ACKNOWLEDGEMENTS I would like to thank Irene Tse (Team Leader Road Safety Engineering (Urban), Auckland Transport) for taking the initiative to invest in this research, which should assist Auckland Transport in its Vision Zero mission to eliminate Death and Serious Injury (DSI) crashes in Auckland. Also, thanks go to Alan Shi (Traffic Engineer – TES) and Yunjian Shi (Traffic Engineer – TES) for technical research assistance.