Embed Size (px)
Citation preview

2017 Results
Friday 23 February 2018
Image by Mansour Bethoney

Forward-looking statementsExcept for the historical information contained herein, the matters discussed in this statement include
forward-looking statements. In particular, all statements that express forecasts, expectations and projections
with respect to future matters, including trends in results of operations, margins, growth rates, overall market
trends, the impact of interest or exchange rates, the availability of financing, anticipated costs savings and
synergies and the execution of Pearson's strategy, are forward-looking statements. By their nature, forward-
looking statements involve risks and uncertainties because they relate to events and depend on
circumstances that will occur in future. They are based on numerous assumptions regarding Pearson's
present and future business strategies and the environment in which it will operate in the future.
There are a number of factors which could cause actual results and developments to differ materially from
those expressed or implied by these forward-looking statements, including a number of factors outside
Pearson's control. These include international, national and local conditions, as well as competition. They also
include other risks detailed from time to time in Pearson's publicly-filed documents and you are advised to
read, in particular, the risk factors set out in Pearson's latest annual report and accounts, which can be found
on its website (www.pearson.com/corporate/investors.html).
Any forward-looking statements speak only as of the date they are made, and Pearson gives no undertaking
to update forward-looking statements to reflect any changes in its expectations with regard thereto or any
changes to events, conditions or circumstances on which any such statement is based. Readers are cautioned
not to place undue reliance on such forward-looking statements.

2017 financial highlights
(2)% underlying
£4,513m £576m
2016: £635m 2016: £663m
£669m
2016: 58.8p 2016: 52p
54.1p 17p £(432m)
2016: £(1,092)m
Revenue Adj. operating profit Operating cash flow
Adj. earnings per share Full year dividend Net debt
3

• 2017 operating profit at the top end of guidance
• Strong balance sheet• Sustained organic investment• Returning excess capital through £300m share buyback
• Simplifying the portfolio• US K12 courseware held for sale
• Guiding to underlying profit growth in 2018
• Good strategic progress; 2018 a pivotal year
4
Highlights

Financial Review and Outlook

Financial summary
6
£m 2017 2016Headline
growthCER
growthUnderlying
growth
Sales 4,513 4,552 (1)% (4)% (2)%
Adjusted operating profit
576 635 (9)% (13)% (9)%
Adjusted EPS 54.1p 58.8p (8)%
Deferred revenue* 839 883 (5)% 2% 5%
Operating cash flow 669 663 1%
Net debt (432) (1,092) 60%
Dividend 17p 52p (67)%
2
* Including businesses held for sale

£m 2017 2016CER
growthUnderlying
growth
North America 2,929 2,981 (4)% (4)%
Core 815 803 (1)% 0%
Growth 769 768 (4)% 0%
Total sales 4,513 4,552 (4)% (2)%
Sales
77

Operating profit
£m 2017 2016CER
growthUnderlying
growth
North America 394 420 (10)% (10)%
Core 50 57 (14)% (14)%
Growth 38 29 17% 3%
Penguin / PRH 94 129 (29)% (8)%
Total 576 635 (13)% (9)%
88

2017 profit movements
9
£635m (£24m)(£58m)
(£95m)
(£55m)
£150m£23m £576m (£22m)
(£44m)
£510m
2016 adjusted
operating
profit
Disposals Trading Other
operational
factors & staff
incentive
Inflation Restructuring
savings
FX 2017 adjusted
operating
profit
Year end FX
rates
Annualised
disposals
2017 adjusted
operating
profit adjusted
for disposals &
2018 FX

2017 revenue split
1010
School Courseware
9%
Student Assessments
8%
Clinical Assessment
3%
Virtual & Blended Schools
6%
Higher Education Services
(incl OPM)
5%
Higher Education &
English courseware
26%
Professional Certification
& English
7%
School Courseware
4%
Student Assessments &
Qualifications
7%
Higher Education
3%
Professional Certification
& English
5%
School
5%
Higher Education
2%
Professional Certification
& English
10%
North AmericaCoreGrowth

2017 contribution split
1111
School Courseware
8%
Student Assessments
8%
Clinical Assessment
4%
Virtual & Blended
Schools
6%
Higher Education
Services (incl OPM)
3%
Higher Education &
English courseware
28%
Professional
Certification & English
7%
School Courseware
4%
Student Assessments &
Qualifications
8%
Higher Education
3%
Professional
Certification & English
5%
School
5%
Higher Education
1%
Professional
Certification & English
11%
• Product and service contribution before allocation of central costs
• Lower margin businesses include: NA school courseware, NA HE services
• Higher margin businesses include: Clinical Assessment, Core assessments and NA HE courseware
North AmericaCoreGrowth

Adjusted EPS
£m 2017 2016 Var.
Operating profit 576 635 (59)
Interest (79) (59) (20)
Taxation (55) (95) 40
Tax rate 11.1% 16.5%
Profit after tax 442 481 (39)
Non controlling interest (2) (2) -
Adjusted earnings 440 479 (39)
Weighted average shares (m) 813.4 814.8
Adjusted EPS 54.1p 58.8p (4.7p)
1212

Statutory P&L
£m 2017 2016
Adjusted operating profit 576 635
Amortisation of intangibles (166) (221)
Other net gains and losses 128 (25)
Restructuring cost (79) (338)
Impairment - (2,548)
Impact of US tax reform (8) -
Operating profit/(loss) 451 (2,497)
Interest (79) (59)
Other net finance income/(costs) 49 (1)
Profit/(loss) before tax 421 (2,557)
Taxation (13) 222
Profit/(loss) after tax 408 (2,335)
Basic EPS 49.9p (286.8)p
1313

2018 guidance
Full Year 2018 GuidanceNew Guidance
Lower Upper
Adjusted operating profit £520m £560m
Finance charge c.£45m
Tax rate c.20%
Adjusted EPS† 49p 53p
• Adjusted operating profit excludes the expected restructuring cost of £90m associated with the £300m 2017-2019 cost efficiency programme• †based on 31 December 2017 exchange rates and portfolio
14
Capex
Balance sheet
Cash flow
Dividends Progressive and sustainable
Overall cash flow lower than 2017 but Cash Conversion > 90%
Net debt in line with 2017
Capital expenditure slightly lower than 2017
FX Sensitivity A 5c movement in the US Dollar has a c.2.0p- 2.5p impact on EPS

2018 bridge
15
£576m (£22m)(£44m)
£510m(£30m)
(£50m)£80m
2017 Adjusted
operating profit
FX Disposals
(PRH + GEDU)
2017 adjusted
operating profit
- adjusted for FX
and Portfolio
Trading Other
operational
factors & Staff
Incentive
Inflation Restructuring
savings
2018 Adjusted
operating profit
before
investment
£520 to £560m
£10m to £50m
Guidance range

2018 US Higher Education courseware assumptions
Underlying market pressure c.6%
-6.0%
-5.0%
-4.0%
-3.0%
-2.0%
-1.0%
0.0%
1.0%
2.0%
3.0%
4.0%
5.0%
6.0%
7.0%
8.0%
EnrolmentOER
Print declines due to
rental/used, initiatives etc
Digital & selling model
Inventory normalisation/lower returns
Pearson net
revenues0% to -5%
16
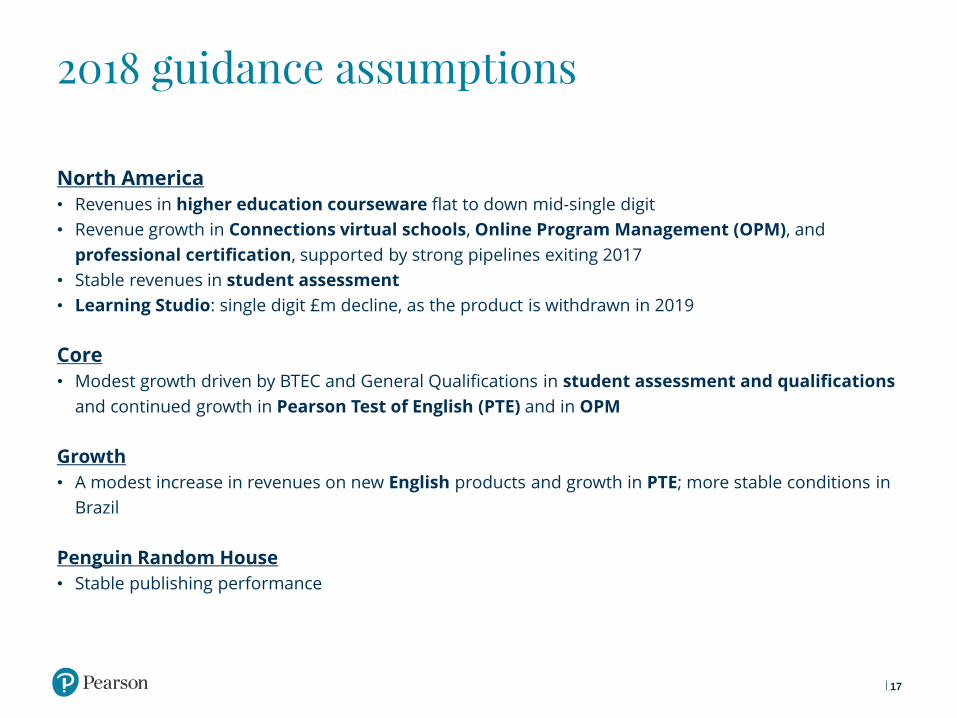
2018 guidance assumptions
North America
• Revenues in higher education courseware flat to down mid-single digit
• Revenue growth in Connections virtual schools, Online Program Management (OPM), and
professional certification, supported by strong pipelines exiting 2017
• Stable revenues in student assessment
• Learning Studio: single digit £m decline, as the product is withdrawn in 2019
Core
• Modest growth driven by BTEC and General Qualifications in student assessment and qualifications
and continued growth in Pearson Test of English (PTE) and in OPM
Growth
• A modest increase in revenues on new English products and growth in PTE; more stable conditions in
Brazil
Penguin Random House
• Stable publishing performance
17

Phasing of savings -updated
Restructuring costs1: £80m c.£90m c.£130m
2017 2018 2019 2020
Annual cumulative savings
c.£95m
c.£200m
c.£300m1
£15m
1 Phased plan first presented on August 4th 2017 based on at December 2016 exchange ratesNote: A significant part of these costs and savings are the US Dollar and other non-Sterling currencies and so subject to exchange rate movements over the implementation timeframe
18

Cash flow£m 2017 2016
Adjusted operating profit 576 635
Change in working capital (ex Pre-Pub) 182 126
Product Development (Pre-Pub) capitalisation (362) (395)
Product Development (Pre-Pub) amortisation 324 325
Net CapEx (237) (247)
Depreciation 162 150
Share based payments 33 22
Share of operating results of associates (114) (142)
Dividends from associates 146 131
Other movements (4) (11)
Exchange (37) 69
Operating cash flow 669 663
Cash conversion % 116% 104%
Restructuring costs paid (71) (167)
Net cash interest paid (69) (51)
Cash tax paid (75) (45)
Pension funding (227) (90)
Free cash flow 227 310
• Strong operating cash flow of
£669m with cash conversion of
116%, supporting continuing
investment in our digital
transformation and structural
growth opportunities
• Well funded UK Group pension
plan
− accounting surplus £545m
19

Further strengthening the balance sheet
20
0
200
400
600
800
1000
2018 2019 2020 2021 2022 2023 2024 2025
Bond maturities as at 1 January 2017 ($m)
0
200
400
600
800
1000
2018 2019 2020 2021 2022 2023 2024 2025
Bond maturities as at 1 February 2018 ($m)
No maturities until 2021 and reduced financing requirements in each year to reduce refinancing risk while we transform
• Strong balance sheet with net debt reduced to £432m helped by disposals, strong cash conversion and FX
with £151m of share buyback to complete;
• Good headroom on leverage metrics and funding facilities
• Reported net debt to EBITDA 0.6x
• Including leases of c.£1bn, adjusted net debt to adjusted EBIDTA c.2.1x at 31 December 2017
• Committed bank facility of $1.75bn (undrawn at year-end) to 2021
• Balance sheet debt primarily held in USD to protect leverage ratios and FX hedge - weakening of USD
resulted in net debt reduction of over £100m

Strategy

Pearson’s digital revenues 2017
2222
Non
digital,
41%3
of which
non-digital
services,
c.10%
Digitally
enabled, 27%
Digital,
32%
Percent of sales2
1 Includes GEDU, WSE and US K12 courseware2 Excludes GEDU, WSE and US K12 courseware3 for 2017 we are presenting the split between non-digital product and non-digital services to aid comparability with prior measures
31%
of which
non-digital
services,
c.10%
Digital &
services,
69%
Percent of sales (old basis)1

Pearson’s digital revenues 2017
2323
Pearson's products and services are becoming…
• More digital and personalised
• More affordable for students with better learning outcomes
• More subscription-based
Building a more…
• Predictable, growing, and profitable business, based around access, not ownership
Non
digital,
41%
Digitally
enabled, 27%
Digital,
32%
Examples• Digital: MyLab (total includes the digital portion of
textbook bundles pro rata by component list prices)• Digitally enabled: Pearson VUE (computer-based
testing in physical locations)• Non digital: textbooks (includes print portion of
bundles as above). Non-digital services
Percent of sales*
*Excludes GEDU, WSE and US K12 courseware

Our strategy
Powered by services and technology
More effective teaching and personalised
learning at scale
Content Assessment
Our Business
Our Strategic Priorities
Grow market share through digital transformation
Invest in structural growth markets
Become simpler and more efficient#1 #2 #3
24

1. Grow market share through digital transformation
Strategic priorities
2. Invest in growing market opportunities
3. Become simpler and more efficient
• Increase speed of product development and innovation
• Improve stability and provide better customer experiences
• Eliminate duplication, reduce cost and increase scalability
45% 33%2017 revenues* 2017 revenues*
US Higher Ed Courseware
Core Assessment & Qualification
US Student Assessment
Virtual Schools
Online Program Mgmt
Professional Certification
English
25
*Excludes GEDU, WSE and US K12 courseware

Moving to an access model
26
Customers value choice, affordability, and better outcomes
Institutions value student completion, data insights, and IT integration
Students value outcomes, customer experience, and affordability
Faculty value outcomes, real-timeinsights, support, and prepared students
Print rental, optimised eBook pricesFrom ownership to affordable access
Inclusive AccessThe right, affordable materials on day one
Adaptive, personalised digital coursewareBased on the global learning platform
More Subscription
2017 2020+
B2B B2C Third party
2017 2020+
B2B B2C Third party
More Direct
2017 2020+
Digital Print
2017 2020+
Digital Print
More Digital
#1. Grow market sharethrough digital transformation

Offering affordable choices
27
Student• Material for their course on day one • Improved learning outcomes• Convenience and value
Faculty• Students have the right content• Teaching and learning starts on day one• Fewer students fall behind
Institution• Meets goals on affordability
and access• Better outcomes and
increased retention
Pearson• Greater share of value - increased revenue• Increases usage• Improved adoption share
CONTRACT / IT INTEGRATION
Inclusive Access (Direct Digital Access)1m+ course enrolments and c.5% of Higher Ed courseware revenues in 2017
RentaleBook rentals• More affordable for customers• Pearson gains share from secondary/non-
consumption• Started with 2,000 titles in 2017; will expand to all
titles in 2018
Print rentals• Competitive pricing and print choices for customers• Reduce inventory in secondary market for Pearson• c. 130 titles in 2018
#1. Grow market sharethrough digital transformation

28
Offering learners better, moreaffordable choices
Expanded addressable market
Improving student outcomes
Share gains, i.e. more faculty and students using Pearson courseware
Global learning platform• Highly scalable, more
reliable, and allows us to innovate faster
• Supports customer integration and third-party interoperability
• Foundation for lifelong learning ecosystem
New services• Expanded Customer
Services teams• B2B analytic services• B2C lifelong learning
services
New product development• Authentic learning &
assessment for complex real-world tasks
• Personalised feedback using AI and machine learning
Supporting learning outcomesGrowth strategies in US Higher Ed courseware
#1. Grow market sharethrough digital transformation

US & Core SchoolAssessment & Qualifications
29
#1. Grow market sharethrough digital transformation
US School Assessment
• A stable $1.2bn+ market
• #1 with >35 % share
Market
Opportunity
Competitive Advantage
• Pioneering digital platforms
• Track record of delivery at scale
• Ability to leverage strong IP and reduce regulatory risk with more partnering
• Leveraging our digital leadership with Increased partnering
Core Assessment & Qualifications
• c.£0.7bn UK market, growing on demographics and rising demand for qualifications
• #1 overall; #2 within GCSE and A-Level ; #1 in vocational qualifications
Market
Opportunity
Competitive Advantage
• Pioneering digital platforms
• Track record of delivery at scale
• Strong brands and IP and new products
• After curriculum changes, greater stability in 2018 with benefit from new product investment coming through

Online Program Management& Virtual Schools
30
#2. Invest in structural growth markets
Online Program Management
• OPM global market $1.2bn, c10% annual growth
• #1 player globally
Market
Competitive Advantage
• Strong brand and track record
• Domain knowledge; end-to-end solution, and can leverage further strengths in content + assessment
• Proven enterprise / undergrad model
• Strong pipeline investment for longer-term growth
• Expansion of enterprise/undergrad models, global growth and employer education
Virtual Schools
• Full solution market >$1.5bn market across 34 authorised states, with 0.7% national penetration.
• #2 in US, but faster-growing than #1 K12 Inc.
Market
Opportunity
Competitive Advantage
• Strong brand, good learning outcomes, high parental satisfaction
• Domain knowledge; end-to-end solution, and canfurther leverage strengths in content and assessment
• Proven partner school model
• Strong pipeline of potential new schools (c. 2-5 per year)
• Grow addressable market with new partner schools, and scaling in existing states
Opportunity

Professional Certification
• A global market c$1.2bn growing on increasing demand for professional credentials and regulatory change
• #1 in market
Market
Competitive Advantage
• Digital delivery, 20,000 testing centres.
• Brand built on security and reliability
• Leading digital platforms
• Near-term growth from US MCAT
• Long-term growth through leveraging operational excellence and expertise
English
• 1.7bn English speakers, $5bn+ market in courseware, assessment, and adult school franchises
• #2 in courseware with 12% market share, #3 in English Academic/Visa Assessment with 6% market share
Market
Opportunity
Competitive Advantage
• Better customer experiences & outcomes
• Embedded, in-course assessment and analytics
• Aligns to Global Scale of English (consistency and scale)
• New product pipeline leverages strength in content and assessment
• PTE – leading digital offer with faster, more accurate results
Opportunity
#2. Invest in structural growth marketsProfessional Certification
& English
31
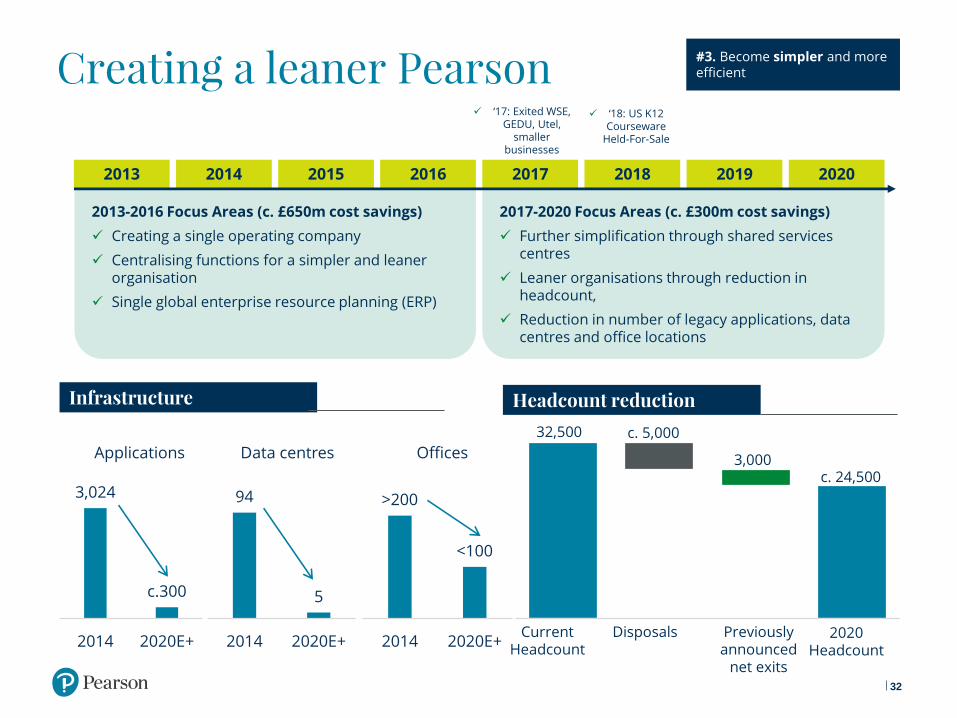
Creating a leaner Pearson
2013-2016 Focus Areas (c. £650m cost savings)
Creating a single operating company
Centralising functions for a simpler and leaner organisation
Single global enterprise resource planning (ERP)
2017-2020 Focus Areas (c. £300m cost savings)
Further simplification through shared services centres
Leaner organisations through reduction in headcount,
Reduction in number of legacy applications, data centres and office locations
2013 2014 2015 2016 2017 2018 2019 2020
2020 Headcount
Previously announced
net exits
Current Headcount
Disposals
c. 5,00032,500
3,000c. 24,500
Infrastructure Headcount reduction
‘18: US K12 Courseware
Held-For-Sale
‘17: Exited WSE, GEDU, Utel,
smaller businesses
#3. Become simpler and more efficient
32
3,024
c.300
2014 2020E+
Applications
94
5
2014 2020E+
Data centres
>200
<100
2014 2020E+
Offices

Better learningAnywhere, anytimeReal-time feedback

Q&A

Appendix 1: Additional
Disclosures

NA School Courseware
9%
NA HE & English
Courseware
26%
Core Courseware
7%
Growth Courseware
7%NA Student Assessment
8%
NA Clinical Assessments
3%
NA Professional
Certification
7%
Core Professional
Certification
3%
Core Assessments
7%
Growth Assessment
2%
NA School Services
6%
NA HE Services
6%
Growth Services
8%
Core Services
1%
2017 revenue split by product line
3636
CoursewareAssessmentsServices

NA School Courseware
8%
NA HE & English
Courseware
28%
Core Courseware
7%
Growth Courseware
6%
NA Student
Assessment
8%
NA Clinical
Assessments
4%
NA Professional
Certification
7%
Core Professional
Certification
3%
Core Assessments
8%
Growth Assessment
2%
NA School Services
6%
NA HE Services
3%
Growth Services
9%
Core Services
1%
2017 contribution split by product line
3737
CoursewareAssessmentsServices

North America – Sales detail
£m 2017 2016Underlying
growth
School Courseware 394 418 (8)%
HE & English Courseware 1,166 1,168 (3)%
Courseware 1,560 1,586 (4)%
School Assessment 355 378 (8)%
Clinical 146 143 (1)%
Professional Certification 341 333 0%
Assessment 842 854 (4)%
School Services 274 259 3%
HE Services 253 269 (9)%
English Services - 13 n/a
Services 527 541 (2)%
Total 2,929 2,981 (4)%
38

Core – Sales detail
£m 2017 2016Underlying
growth
School Courseware 171 173 (5)%
HE Courseware 93 92 (2)%
English Courseware 60 65 (11)%
Courseware 324 330 (5)%
School & HE Assessment 256 268 (5)%
Clinical 46 40 8%
Pearson Test of English 47 22
Professional Certification 91 90 0%
Assessment 440 420 3%
School Services 5 6 (17)%
HE Services 34 29 14%
English Services 12 18 10%
Services 51 53 9%
Total 815 803 0%
39

Growth – Sales detail
£m 2017 2016Underlying
growth
School Courseware 139 127 5%
HE Courseware 63 60 (2)%
English Courseware 102 97 4%
Courseware 304 284 3%
School & HE Assessment 23 21 10%
Pearson Test of English 18 11 64%
Professional Certification 42 38 8%
Assessment 83 70 17%
School Services 54 54 (7)%
HE Services 32 46 (37)%
English Services 296 314 0%
Services 382 414 (6)%
Total 769 768 0%
40

Balance sheet£m
2017 Excl HFS
2017 Held for Sale
2017 Reported
2016
Goodwill / intangible assets 3,145 (181) 2,964 3,442
Tangible fixed assets 297 (16) 281 343
Associates & JVs 398 - 398 1,247
Capitalised Product Development (Pre-Pub) 988 (247) 741 1,024
Deferred revenue (839) 517 (322) (883)
Traditional working capital 376 (52) 324 561
Other net liabilities (270) - (270) (192)
Held For Sale - 172 172
Net trading assets 4,095 193 4,288 5,542
Shareholders’ funds 4,013 - 4,013 4,344
Deferred tax 3 66 69 15
Pensions (441) - (441) (19)
Other provisions 80 - 80 106
Minorities 8 - 8 4
Net debt 432 127 559 1,092
Capital employed 4,095 193 4,288 5,542
Year end $/£ 1.35 1.35 1.35 1.23
4141

Return on Invested Capital
42
£m 2017 2016
Adjusted Operating Profit 576 635
Less: operating tax paid (75) (63)
Return 501 572
Total Invested Capital 11,568 11,464
Gross ROIC 4.3% 5.0%
Net Invested Capital8,126 7,906
Net ROIC 6.2% 7.2%
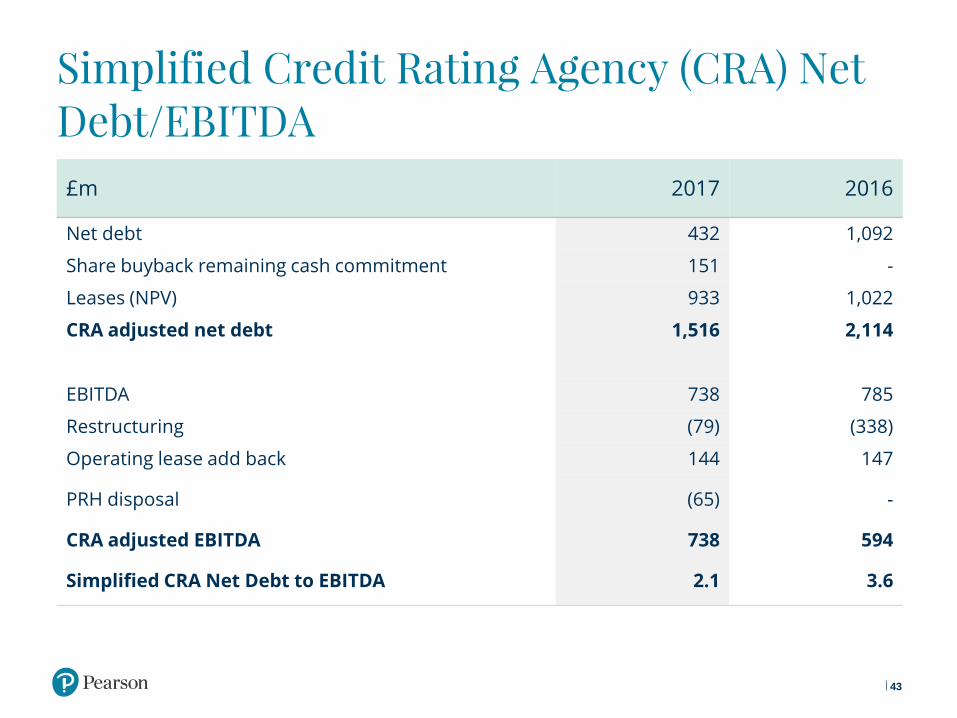
Simplified Credit Rating Agency (CRA) Net Debt/EBITDA
43
£m 2017 2016
Net debt 432 1,092
Share buyback remaining cash commitment 151 -
Leases (NPV) 933 1,022
CRA adjusted net debt 1,516 2,114
EBITDA 738 785
Restructuring (79) (338)
Operating lease add back 144 147
PRH disposal (65) -
CRA adjusted EBITDA 738 594
Simplified CRA Net Debt to EBITDA 2.1 3.6

Reconciliation: statutory to adjusted earnings 2017
4444
£m Statutory RestructuringOther net gains and
losses
Intangible charges
Other net
finance costs
Impact of US
tax reform
Tax amortisation
benefit
Adjusted earnings
Operating profit
451 79 (128) 166 - 8 - 576
Net finance costs
(30) - - - (49) - - (79)
Profit before tax
421 79 (128) 166 (49) 8 - 497
Income tax (13) (26) 20 (85) 9 1 39 (55)
Profit for the year
408 53 (108) 81 (40) 9 39 442
Minority interest
(2) - - - - - - (2)
Earnings 406 53 (108) 81 (40) 9 39 440

Reconciliation: statutory to adjusted earnings 2016
£m Statutory RestructuringOther net gains and
losses
Intangible charges
Other net finance
costs
Tax amortisation
benefit
Adjusted earnings
Operating profit (2,497) 338 25 2,769 - - 635
Net finance costs (60) - - - 1 - (59)
Profit before tax (2,557) 338 25 2,769 1 - 576
Income tax 222 (84) (14) (255) - 36 (95)
Profit for the year (2,335) 254 11 2,514 1 36 481
Minority interest (2) - - - - - (2)
Earnings (2,337) 254 11 2,514 1 36 479
4545

Reconciliation: pre-publication costs
£m 2017 2016
Opening balance 1,024 841
Exchange (60) 130
New spend capitalised 362 395
Acquisitions/disposals/transfers (net)
- 8
Amortisation (324) (325)
Restructuring charge (14) (25)
Closing balance* 988 1,024
4646
* Including businesses held for sale

Reconciliation: year end net debt
£m 2017 2016
Non current assets
Derivative financial instruments 140 171
Current assets
Marketable securities 8 10
Cash and cash equivalents 518 1,459
Non current liabilities
Borrowings (1,066) (2,424)
Derivative financial instruments (140) (264)
Current liabilities
Borrowings (19) (44)
Total (559) (1,092)
Cash & cash equivalents classified as held for sale 127 -
Net debt (432) (1,092)
4747

Retirement benefit obligations
£m 2017 2016
Income statement
Operating charge
Defined benefit schemes 19 16
Defined contribution schemes 57 67
Post retirement medical benefit schemes (1) (2)
75 81
Interest (3) (11)
Total 72 70
Balance sheet
UK pension scheme asset 545 158
Other pension scheme liabilities (26) (47)
Post retirement medical benefit liability (67) (77)
Other pension accruals (11) (15)
Total 441 19
4848

486
629
733
866
9591,024
1,126 1,0971,060
8.5%
10.6%11.3%
12.3%13.2%
14.0%
15.3%16.3%
17.8%
19.6%
-4.0%
1.0%
6.0%
11.0%
16.0%
21.0%
0
200
400
600
800
1000
1200
1400
1600
2008 2009 2010 2011 2012 2013 2014 2015 2016 2017
1,133
49
Deferred revenue*($m)
49
WSE and K12 Courseware deferred revenues $697m
% of Sales
*excludes GEDU, includes held for sale
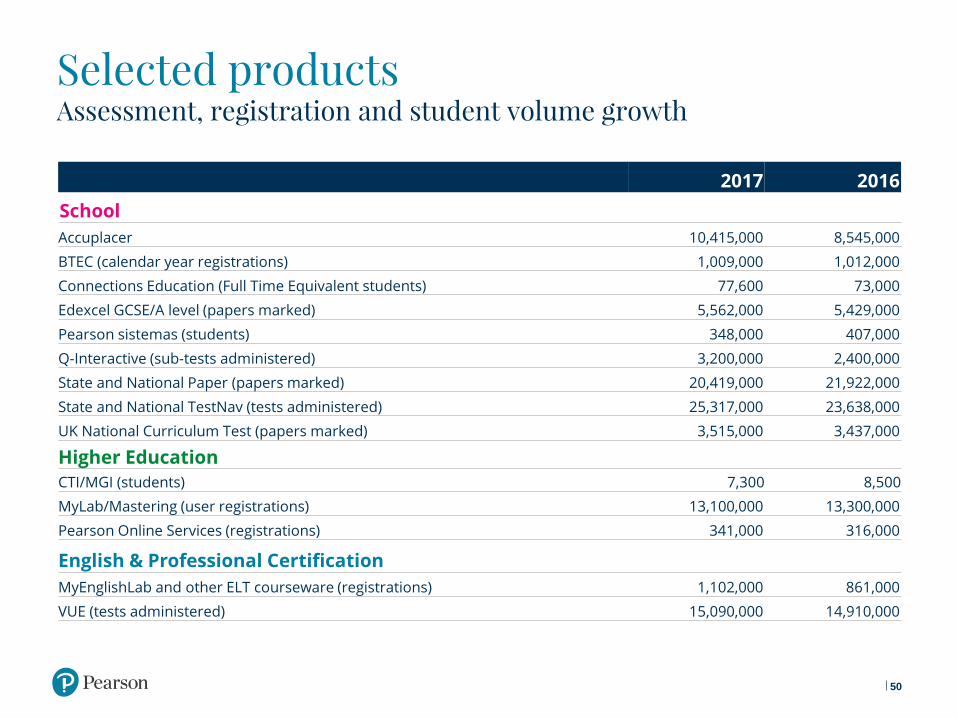
Selected products Assessment, registration and student volume growth
50
2017 2016
School
Accuplacer 10,415,000 8,545,000
BTEC (calendar year registrations) 1,009,000 1,012,000
Connections Education (Full Time Equivalent students) 77,600 73,000
Edexcel GCSE/A level (papers marked) 5,562,000 5,429,000
Pearson sistemas (students) 348,000 407,000
Q-Interactive (sub-tests administered) 3,200,000 2,400,000
State and National Paper (papers marked) 20,419,000 21,922,000
State and National TestNav (tests administered) 25,317,000 23,638,000
UK National Curriculum Test (papers marked) 3,515,000 3,437,000
Higher Education
CTI/MGI (students) 7,300 8,500
MyLab/Mastering (user registrations) 13,100,000 13,300,000
Pearson Online Services (registrations) 341,000 316,000
English & Professional Certification
MyEnglishLab and other ELT courseware (registrations) 1,102,000 861,000
VUE (tests administered) 15,090,000 14,910,000
50