Embed Size (px)
Citation preview
Sourcebook for Land uSe, Land-uSe change and foreStry ProjectS
2005
timothy Pearson, Sarah Walker and Sandra brown
With input from Bernhard Schlamadinger (Joanneum Research), Igino Emmer (Face Foundation), Wolfram Kägi (BSS) and Ian Noble, Benoit Bosquet and Lasse Ringius (World Bank)

SouRcEBooK FoR LaNd uSE, LaNd-uSE
chaNgE aNd FoREStRy PRoJEctS
timothy Pearson, Sarah Walker and Sandra brown
With input from Bernhard Schlamadinger, Igino Emmer, Wolfram Kägi, Ian Noble,
Benoit Bosquet and Lasse Ringius
S o u r c e b o o k f o r L a n d u S e , L a n d - u S e c h a n g e a n d f o r e S t r y P r o j e c t S i i S o u r c e b o o k f o r L a n d u S e , L a n d - u S e c h a n g e a n d f o r e S t r y P r o j e c t Si
1. PurPose and scoPe ......................................................................................................... 12. IntroductIon to the Kyoto Protocol and the clean develoPment
mechanIsm Project cycle ........................................................................................... 2 2.1. TheCleanDevelopmentMechanism...................................................................................... 23. IntroductIon to the BIocarBon Fund and the BIocarBon Fund cycle ...... 34. concePts oF addItIonalIty, BaselIne, leaKage and Permanence .................... 4 4.1. Additionality........................................................................................................................ 4 4.2. Baseline............................................................................................................................... 4 4.3. Leakage............................................................................................................................... 5 4.4. Permanence......................................................................................................................... 55. sPecIFIc consIderatIons For the Kyoto Protocol .............................................. 6 5.1. CurrentlyAcceptableLULUCFProjects.................................................................................. 6 5.2. TheEligibilityofLands......................................................................................................... 6 5.2.1.31December1989Rule.............................................................................................. 6 5.2.2.DefinitionsofForest.................................................................................................... 6 5.2.3.TheEligibilityTool...................................................................................................... 6 5.3.AdditionalityTests.................................................................................................................. 7 5.4.ChoiceofBaseline................................................................................................................... 8 5.5.Crediting................................................................................................................................ 9 5.6.SubmissionofNewAfforesation/ReforestationMethodology..................................................... 106. develoPIng a measurement Plan ............................................................................... 11 6.1. TheConceptsofAccuracy,PrecisionandBeingConservative................................................... 11 6.2. DefinetheProjectBoundaries.............................................................................................. 12 6.3. StratifytheProjectArea....................................................................................................... 12 6.4. DecideWhichCarbonPoolstoMeasure............................................................................... 12 6.5. DetermineType,NumberandLocationofMeasurementPlots................................................ 13 6.5.1.TypeofPlots............................................................................................................. 13 6.4.2.NumberofPlots........................................................................................................ 15 6.5.3.LocationofPlots....................................................................................................... 18 6.6.DetermineMeasurementFrequency........................................................................................ 187. FIeld measurements ....................................................................................................... 19 7.1. PreparationforFieldwork.................................................................................................... 19 7.2. Trees,PalmsandLianas....................................................................................................... 20 7.2.1.Trees........................................................................................................................ 20 7.2.2.Palms....................................................................................................................... 21 7.2.3.Lianas...................................................................................................................... 21 7.3.Non-TreeVegetation.............................................................................................................. 21
c o n t e n t S
7.4.DeadWood.......................................................................................................................... 22 7.4.1.StandingDeadWood................................................................................................. 22 7.4.2.DownedDeadWood................................................................................................. 22 7.5.ForestFloor(LitterLayer)...................................................................................................... 22 7.6.Soil..................................................................................................................................... 238. analysIs .............................................................................................................................. 24 8.1. LiveTreeBiomass............................................................................................................... 24 8.2. BelowgroundTreeBiomass.................................................................................................. 27 8.3. Non-TreeVegetation........................................................................................................... 28 8.4. StandingDeadWood.......................................................................................................... 28 8.5. DownedDeadWood.......................................................................................................... 28 8.6. ForestFloor(LitterLayer).................................................................................................... 29 8.7. Soil................................................................................................................................... 29 8.9. EstimatingNetChange....................................................................................................... 30 8.9.1Uncertainty............................................................................................................... 309. non-co2 gases ................................................................................................................... 33 9.1 TransportandMachinery.................................................................................................... 33 9.2. Fertilisation........................................................................................................................ 33 9.3. Fire................................................................................................................................... 3310. QualIty assurance and QualIty control ............................................................ 34 10.1.QA/QCforFieldMeasurements.......................................................................................... 34 10.2.QA/QCforSamplePreparationandLaboratoryMeasurements............................................... 34 10.3.QA/QCforDataEntry....................................................................................................... 34 10.4.QA/QCforDataArchiving................................................................................................. 3511. guIdance on leaKage .................................................................................................. 3612. reFerences ...................................................................................................................... 38
aPPendIX a: glossary....................................................................................................... 39aPPendIX B: creatIng BIomass regressIon eQuatIons ......................................... 40 Method1:DevelopingBiomassEquations..................................................................................... 40 MethodII:MeanTreeBiomassEstimate........................................................................................ 40aPPendIX c: PuBlIshed BIomass regressIon eQuatIons.........................................41 TemperateEquations:................................................................................................................... 41 TropicalEquations:...................................................................................................................... 43 AgroforestryEquations................................................................................................................. 44aPPendIX d: checKlIst For cdm aFForestatIon/reForestatIon Projects ..... 46
S o u r c e b o o k f o r L a n d u S e , L a n d - u S e c h a n g e a n d f o r e S t r y P r o j e c t S i i S o u r c e b o o k f o r L a n d u S e , L a n d - u S e c h a n g e a n d f o r e S t r y P r o j e c t Si

Content on new methodologies and reasons for failure in the first year of consideration were largely derived from comments by Martin Enderlin (chair of the A/R Working Group and member of Clean Development Mechanism Executive Board) during his presentation at the Winrock International side event at COP/MOP 1 in Montreal in 2005. The title of the side event was “Gaining approval for Land Use, Land-Use Change and Forestry projects and project methodologies under the Clean Development Mechanism: lessons learned”.
1. P u r P o S e a n d S co P e
This sourcebook is designed to be a guide for developing and imple-menting land use, land-use change and forestry (LULUCF) projects for the BioCarbon Fund of the World Bank that meet the requirements for the Clean Development Mechanism (CDM) of the Kyoto Protocol. Only project types and carbon pools that are eligible for credit under the CDM during the first commitment period (2008-2012) are covered.
With its user-friendly format, the sourcebook introduces readers to the CDM processes and requirements, and provides methods and procedures to produce accurate and precise estimates of changes in carbon stocks. The sourcebook is not designed as a primer on field measurement tech-niques, although guidance is given.
The sourcebook is intended as an addition to the IPCC Good Practice Guidance on Land Use, Land-Use Change and Forestry (2003), providing additional explanation, clarification and enhanced methodologies. It is designed to be used alongside the Good Practice Guidance.
S o u r c e b o o k f o r L a n d u S e , L a n d - u S e c h a n g e a n d f o r e S t r y P r o j e c t S 1
acknoWLedgementS
KenMacDicken,DavidShochandMattDelaneyplayedacentralroleindevelopingthemethodspresentedhere.Wealsowishtothanktheorganisationsandagenciesthathavefundedourworkoverthepast10years,whichmadepossibletheadvanceswehaveachieved–inparticular,TheNatureConservancy,USAgencyforInternationalDevelopment,USDAForestService,UnitedNationsDevelopmentProgrammeandWorldBank.Finally,wewouldliketoacknowledgeIanMonroeforcreatingtheillustrationonpage21.
S o u r c e b o o k f o r L a n d u S e , L a n d - u S e c h a n g e a n d f o r e S t r y P r o j e c t S � S o u r c e b o o k f o r L a n d u S e , L a n d - u S e c h a n g e a n d f o r e S t r y P r o j e c t S2
Carbonexistsineverythingthatislivingorhaseverlived.Thereisaperpetualcycleofcarbonbeingsequesteredonearthandemit-ted back into the atmosphere. Humankind increasingly influ-encesthiscarboncyclethroughtheburningofever-greaterquan-titiesofoil,gasolineandcoalandthecuttingdownofforests.Itisarguedthatthehuman-inducedaccumulationofcarbondiox-ide(CO2)andothergreenhousegasesintheatmosphereisdrivingclimatechange. It is likelythatcurrentatmosphericconcentra-tionsareata20-million-yearhighandthatcurrentratesofaccu-mulationareunprecedented[1].
The Kyoto Protocol of the United Nations Framework Convention on Climate Change (UNFCCC) was developed as an attempt to confront and begin to reverse the rising CO2 concentrations. In1997, 38 industrialised nations signed the Kyoto Protocol andagreedtocuttheiremissionsofgreenhousegasesbetween2008and2012tolevels5.2percentbelow1990levels.ByJune2005,150countrieshadratifiedtheKyotoProtocol,including34ofthe38 industrialised nations whose emissions account for 61.6 percentofallindustrializednations’emissions.
EmissionsofCO2fromlanduseandland-usechangerepresentupto20percentofcurrentCO2emissionsfromburningfossilfuels[2, 3]. Changes in land-use can positively impact atmosphericCO2concentrationsbyeither:i)decreasingemissionsthatwouldoccurwithoutintervention,orii)sequesteringCO2fromtheat-mosphereintovegetationandtheassociatedsoil.Preventingde-forestation, decreasing the impact of logging or preventing thedrainageofwetlandsorpeatlandsarepracticesthatdecreaseemis-sions.Incontrast,plantingtrees,changingagriculturaltillageorcroppingpractices,orre-establishinggrasslandssequestercarbon.
TheKyotoProtocolrecognisedtherolethatchangesintheuseoflandandforestshaveontheglobalcarboncycle. PartiestotheProtocolcanusecreditsgeneratedeitherbysequesteringcarbonorbyreducingcarbonemissionsfromlandusetohelpthemreachtheirreductiontargets. Carboncreditscanbeproducedwithintheemission-sourcecountryorinanalternativeindustrialisedna-tion(JointImplementation[JI],Article6).Inaddition,thePro-tocol includes a mechanism by which industrialised (Annex I)nationscanoffsetsomeoftheiremissionsbyinvestinginprojectsinnon-industrialised(non-AnnexI)nations(CDM,Article12).
2.1. the clean development mechanism
“The purpose of the clean development mechanism shall be to assist Parties not included in Annex I in achieving sustainable development and in contributing to the ultimate objective of the convention, and to assist parties included in Annex I in achieving compliance with their quantified limitation and reduction commitments.”
Article 12 of the Kyoto Protocol (1997)
The UNFCCC established a CDM Executive Board that ischargedwithapprovingorrejectingprojectdesignsandmethod-ologies,registeringandadministeringprojectauditors(designatedoperationalentities)andapprovingtheissuanceofcertifiedemis-sionreductions.
Foreachproject,aProjectDesignDocumentmustbesubmittedthat employs an approvedmethodology, includingbaseline andmonitoringmethods.Itisenvisagedthat,inthefuture,agroupofapproved methodologies will exist that can be applied to newprojects.Howeveratthetimeofwriting,onlyonemethodologyhadbeenaccepted.TheProjectDesignDocumentdescribestheproject,illustrateshowthemethodologywillbeapplied,estimatesthegreenhousegasesandenvironmentalandsocio-economicim-pacts of the project, including all baseline information, andpresentsamonitoringplan.
Forthefirstcommitmentperiod(2008-2012),AnnexIPartiesarelimitedintheextenttowhichtheycanuseoffsetsfromLULUCFtomeettheirreductioncommitments.ThetotaladditionstoanAnnex IParty’sassignedamount fromemissions thatcan resultfromLULUCFprojectactivitiesundertheCDMisconstrainedatonepercentofbaseyearemissionsofthatcountryperyearforthefiveyearsofthecommitmentperiod.
2. I n t r o d u c t I o n to t h e k yoto P r oto co L a n d t h e c L e a n d e v e Lo P m e n t m e c h a n I S m P r o j e c t c yc L e
�. I n t r o d u c t I o n to t h e b I o c a r b o n f u n d a n d t h e b I o c a r b o n f u n d c yc L e
TheWorldBank’sBioCarbonFundprovidescarbonfinancesforprojects that sequester or conserve greenhouse gases in forest,agro-andotherecosystems.TheBioCarbonFundaimsto“testanddemonstratehowlanduse,land-usechangeandforestryac-tivitiescangeneratehigh-qualityemissionreductionswithenvi-ronmental and livelihoodbenefits that canbemeasured,moni-toredandcertifiedandstandthetestoftime”.
BioCarbonFundprojectshavetofulfillcriteriatoensurethefundmeets itsowntargets intheareasofClimateandEnvironment;PovertyAlleviation;ProjectManagementandLearning;andPort-folioBalance.
Each BioCarbon Fund project is expected to deliver between400,000and800,000tonsofCO2equivalent(CO2e)overape-riodof10 to15years. In return, a typicalprojectwill receiveaboutUS$2-3millioninpayments($3-4pertonneCO2e).
ProspectiveprojectdeveloperssubmitaProjectIdeaNote.Ifbothpartiesagreetotaketheproposalfurther,moreformaldocumentsareprepared,includinganEmissionsReductionsPurchaseAgree-ment and aProjectDesignDocument that is submitted to theCDMExecutiveBoard.
As of spring 2005, 140 Project Idea Notes had been submitted to the BioCarbon Fund and the window of opportunities for submission closed. However, future windows of opportunities for submissions are envisaged.
Forinformation,gotocarbonfinance.org/biocarbon/home.cfm.
S o u r c e b o o k f o r L a n d u S e , L a n d - u S e c h a n g e a n d f o r e S t r y P r o j e c t S � S o u r c e b o o k f o r L a n d u S e , L a n d - u S e c h a n g e a n d f o r e S t r y P r o j e c t S2
S o u r c e b o o k f o r L a n d u S e , L a n d - u S e c h a n g e a n d f o r e S t r y P r o j e c t S 5 S o u r c e b o o k f o r L a n d u S e , L a n d - u S e c h a n g e a n d f o r e S t r y P r o j e c t S�
�.2. baseline
Asstatedabove,CDMafforestationandreforestationprojectsen-hancegreenhousegasremovalsinonecountrytopermitanequiv-alent quantity of greenhouse gas emissions in another country,without changing the global emission balance.Technically, theCDMisabaseline-and-credit trademechanism,notacap-and-trademechanism.Therefore,enhancementsofremovalsbyaffor-estationandreforestationprojectsmustcreate real,measureableandlong-termbenefitsrelatedtothemitigationofclimatechange(KyotoProtocol,Article12.5b),andmustbeadditional toanythatwouldoccur in the absence of the certifiedproject activity(KyotoProtocol,Article12.5c).The“intheabsence”scenarioisalsoreferredtoasthebaseline scenario.
TheMarrakechAccordsdefineabaselinescenarioasonethat“rea-sonablyrepresentsgreenhousegasemissionsthatwouldoccurintheabsenceoftheproposedprojectactivity”andisderivedusinganapprovedbaselinemethod.TheMarrackechAccordsalsostatethattheprojectbaselineshallbeestablished“inatransparentandconservativemannerregardingthechoicesofapproaches,assump-tions”andthatitshallbeestablished“onaproject-specificbasis”.Insummary,thebaselineisthemostlikelycourseofactionanddevelopmentovertime,intheabsenceofCDMfinancing.
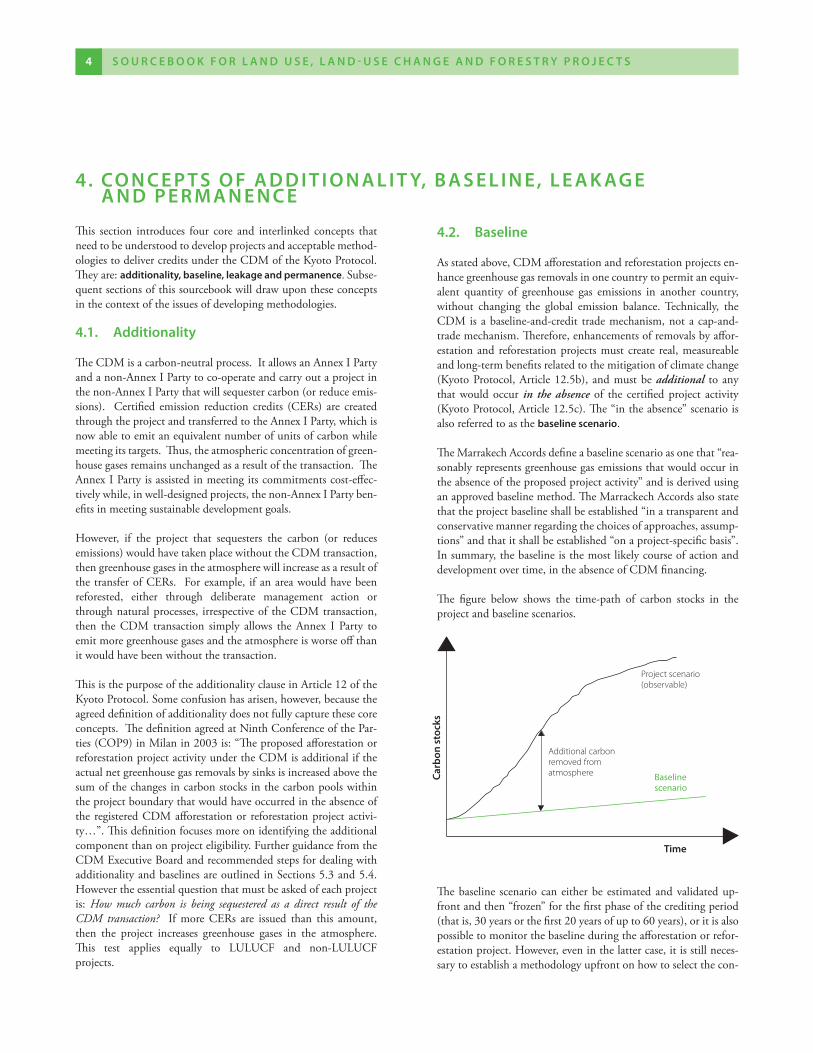
The figure below shows the time-path of carbon stocks in theprojectandbaselinescenarios.
Thebaseline scenariocaneitherbeestimatedandvalidatedup-frontandthen“frozen”forthefirstphaseofthecreditingperiod(thatis,30yearsorthefirst20yearsofupto60years),oritisalsopossibletomonitorthebaselineduringtheafforestationorrefor-estationproject.However,eveninthelattercase,itisstillneces-sarytoestablishamethodologyupfrontonhowtoselectthecon-
This section introduces four core and interlinked concepts thatneedtobeunderstoodtodevelopprojectsandacceptablemethod-ologiestodelivercreditsundertheCDMoftheKyotoProtocol.Theyare:additionality, baseline, leakage and permanence.Subse-quentsectionsofthissourcebookwilldrawupontheseconceptsinthecontextoftheissuesofdevelopingmethodologies.
�.1. additionality
TheCDMisacarbon-neutralprocess.ItallowsanAnnexIPartyandanon-AnnexIPartytoco-operateandcarryoutaprojectinthenon-AnnexIPartythatwillsequestercarbon(orreduceemis-sions). Certified emission reduction credits (CERs) are createdthroughtheprojectandtransferredtotheAnnexIParty,whichisnowabletoemitanequivalentnumberofunitsofcarbonwhilemeetingitstargets.Thus,theatmosphericconcentrationofgreen-housegasesremainsunchangedasaresultofthetransaction.TheAnnexIPartyisassistedinmeetingitscommitmentscost-effec-tivelywhile,inwell-designedprojects,thenon-AnnexIPartyben-efitsinmeetingsustainabledevelopmentgoals.
However, if the project that sequesters the carbon (or reducesemissions)wouldhavetakenplacewithouttheCDMtransaction,thengreenhousegasesintheatmospherewillincreaseasaresultofthetransferofCERs. Forexample, ifanareawouldhavebeenreforested, either through deliberate management action orthroughnaturalprocesses, irrespectiveof theCDMtransaction,then the CDM transaction simply allows the Annex I Party toemitmoregreenhousegasesandtheatmosphereisworseoffthanitwouldhavebeenwithoutthetransaction.
ThisisthepurposeoftheadditionalityclauseinArticle12oftheKyotoProtocol.Someconfusionhasarisen,however,becausetheagreeddefinitionofadditionalitydoesnotfullycapturethesecoreconcepts.ThedefinitionagreedatNinthConferenceofthePar-ties(COP9)inMilanin2003is:“TheproposedafforestationorreforestationprojectactivityundertheCDMisadditionaliftheactualnetgreenhousegasremovalsbysinksisincreasedabovethesumofthechangesincarbonstocksinthecarbonpoolswithintheprojectboundarythatwouldhaveoccurredintheabsenceofthe registeredCDMafforestationor reforestationprojectactivi-ty…”.Thisdefinitionfocusesmoreonidentifyingtheadditionalcomponentthanonprojecteligibility.FurtherguidancefromtheCDMExecutiveBoardandrecommendedstepsfordealingwithadditionalityandbaselinesareoutlinedinSections5.3and5.4.Howevertheessentialquestionthatmustbeaskedofeachprojectis: How much carbon is being sequestered as a direct result of the CDM transaction? If more CERs are issued than this amount,then the project increases greenhouse gases in the atmosphere.This test applies equally to LULUCF and non-LULUCFprojects.
�. co n c e P t S o f a d d I t I o n a L I t y, b a S e L I n e , L e a k ag e a n d P e r m a n e n c e
Additional carbon removed from atmosphere
Project scenario (observable)
Baseline scenario
carb
on s
tock
s
time
trolplotsandmonitorthem,andtoprovideanupfrontestimationofthebaseline,includingtheassociatedemissionsandremovalsofgreenhousegases(theupfrontestimationisforinformationonly–theresultsofthemonitoredbaselinewouldbeusedforcalculat-ingemissionreductions).Theadvantageofanupfrontestimatedand“frozen”baseline is that there is greater certaintyabout theemissionreductionsgeneratedbytheproject.Thisistheoptionthathasbeenusedbymostprojectstodate.
�.�. Leakage
Someprojectswillbesuccessfulinsequesteringmorecarbonwith-intheprojectarea,buttheprojectactivitiesmaychangeactivitiesorbehaviourselsewhere.Thesechangesmayleadtoreducedse-questrationorincreasedemissionsoutsidetheprojectboundary,negatingsomeofthebenefitsoftheproject.Thisiscalledleakage.Asimpleexampleisaprojectthatreforestsanareaofpoorqualitygrazingland,butleadstotheownersofthedisplacedlivestocktoclearlandoutsidetheprojectboundariestoestablishnewpastures.Thetypesofactivitiesthatmightresultinleakagevarywiththetypeofprojects,butbothLULUCFandnon-LULUCFprojectsaresubjecttoleakage.Leakagecanoftenbeminimisedbygoodprojectdesign–suchas intheexampleaboveby including im-proved pasture management around the plantation so that dis-placedlivestockcanbeaccommodatedwithoutfurtherclearing.Section11dealswithleakageinmoredetail.
�.�. Permanence
DuringthenegotiationsleadinguptotheKyotoProtocolandsub-sequently, therewas considerable concern that credits issued forcarbonsequestrationwouldbesubjecttoariskofre-emission,duetoeitherhumanactionornaturaleventssuchaswildfires.ThiswascalledthepermanenceriskanditisuniquetoLULUCFprojectsunder the Protocol. Eventually, Parties agreed that credits aris-ingfromCDMafforestationandreforestationprojectsshouldbetemporary,butcouldbere-issuedorrenewedeveryfiveyearsafteranindependentverificationtoconfirmsufficientcarbonwasstillsequesteredwithintheprojecttoaccountforallcreditsissued.
Thisdealseffectivelywiththepermanenceriskandguaranteesthatanylossesofsequesteredcarbonforwhichcreditshavebeenissuedwillhavetobemadeupthrougheitheradditionalsequestrationelsewhereorthroughcreditsderivedfromnon-LULUCFactivi-ties.Twotypesoftemporarycreditswereagreed:temporaryCERsand long-termCERs. Someaccounting issues relating to thesecreditsaredescribedinSection5.5.Thereareadditionalissuesinrelationtopricing,restrictionsonreplacement,etc,thatalsoneedtobetakenintoaccount.TheBioCarbonFundhasdocumenta-tiontoguideprojectmanagersontheseissues.
S o u r c e b o o k f o r L a n d u S e , L a n d - u S e c h a n g e a n d f o r e S t r y P r o j e c t S 5 S o u r c e b o o k f o r L a n d u S e , L a n d - u S e c h a n g e a n d f o r e S t r y P r o j e c t S�
S o u r c e b o o k f o r L a n d u S e , L a n d - u S e c h a n g e a n d f o r e S t r y P r o j e c t S � S o u r c e b o o k f o r L a n d u S e , L a n d - u S e c h a n g e a n d f o r e S t r y P r o j e c t S�
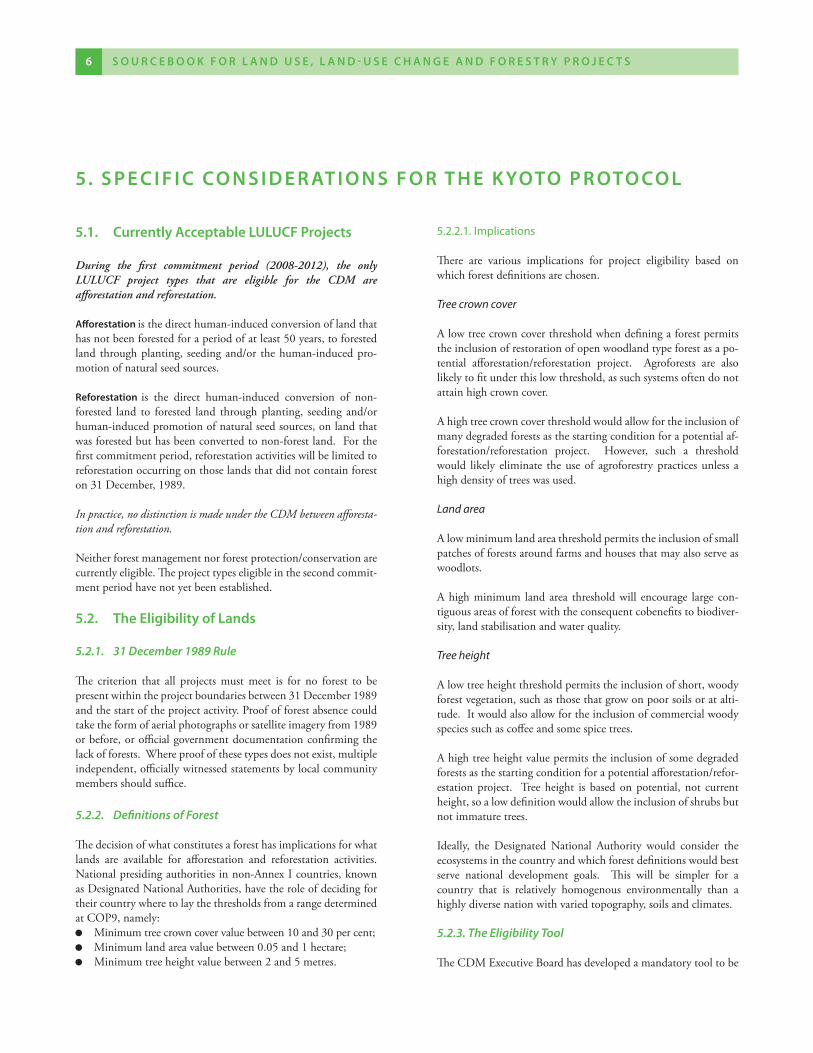
5.1. currently acceptable LuLucf Projects
During the first commitment period (2008-2012), the only LULUCF project types that are eligible for the CDM are afforestation and reforestation.
afforestation isthedirecthuman-inducedconversionoflandthathasnotbeenforestedforaperiodofatleast50years,toforestedland throughplanting, seedingand/or thehuman-inducedpro-motionofnaturalseedsources.
reforestation is the direct human-induced conversion of non-forested land to forested land throughplanting, seeding and/orhuman-inducedpromotionofnaturalseedsources,onlandthatwasforestedbuthasbeenconvertedtonon-forestland.Forthefirstcommitmentperiod,reforestationactivitieswillbelimitedtoreforestationoccurringonthoselandsthatdidnotcontainforeston31December,1989.
In practice, no distinction is made under the CDM between afforesta-tion and reforestation.
Neitherforestmanagementnorforestprotection/conservationarecurrentlyeligible.Theprojecttypeseligibleinthesecondcommit-mentperiodhavenotyetbeenestablished.
5.2. the eligibility of Lands
5.2.1. 31 December 1989 Rule
The criterion that all projects must meet is for no forest to bepresentwithintheprojectboundariesbetween31December1989andthestartoftheprojectactivity.Proofofforestabsencecouldtaketheformofaerialphotographsorsatelliteimageryfrom1989orbefore,orofficialgovernmentdocumentationconfirmingthelackofforests.Whereproofofthesetypesdoesnotexist,multipleindependent,officiallywitnessedstatementsbylocalcommunitymembersshouldsuffice.
5.2.2. Definitions of Forest
Thedecisionofwhatconstitutesaforesthasimplicationsforwhatlands are available for afforestation and reforestation activities.Nationalpresidingauthoritiesinnon-AnnexIcountries,knownasDesignatedNationalAuthorities,havetheroleofdecidingfortheircountrywheretolaythethresholdsfromarangedeterminedatCOP9,namely:
Minimumtreecrowncovervaluebetween10and30percent; Minimumlandareavaluebetween0.05and1hectare; Minimumtreeheightvaluebetween2and5metres.
5.2.2.1. Implications
There are various implications for project eligibility based onwhichforestdefinitionsarechosen.
Tree crown cover
Alowtreecrowncoverthresholdwhendefiningaforestpermitstheinclusionofrestorationofopenwoodlandtypeforestasapo-tential afforestation/reforestation project. Agroforests are alsolikelytofitunderthislowthreshold,assuchsystemsoftendonotattainhighcrowncover.
Ahightreecrowncoverthresholdwouldallowfortheinclusionofmanydegradedforestsasthestartingconditionforapotentialaf-forestation/reforestation project. However, such a thresholdwould likely eliminate theuseof agroforestrypracticesunless ahighdensityoftreeswasused.
Land area
Alowminimumlandareathresholdpermitstheinclusionofsmallpatchesofforestsaroundfarmsandhousesthatmayalsoserveaswoodlots.
Ahighminimum landarea thresholdwill encourage large con-tiguousareasofforestwiththeconsequentcobenefitstobiodiver-sity,landstabilisationandwaterquality.
Tree height
Alowtreeheightthresholdpermitstheinclusionofshort,woodyforestvegetation,suchasthosethatgrowonpoorsoilsoratalti-tude.Itwouldalsoallowfortheinclusionofcommercialwoodyspeciessuchascoffeeandsomespicetrees.
Ahightreeheightvaluepermitstheinclusionofsomedegradedforestsasthestartingconditionforapotentialafforestation/refor-estationproject. Treeheight is basedonpotential, not currentheight,soalowdefinitionwouldallowtheinclusionofshrubsbutnotimmaturetrees.
Ideally, the Designated National Authority would consider theecosystemsinthecountryandwhichforestdefinitionswouldbestserve national development goals. This will be simpler for acountry that is relatively homogenous environmentally than ahighlydiversenationwithvariedtopography,soilsandclimates.
5.2.3. The Eligibility Tool
TheCDMExecutiveBoardhasdevelopedamandatorytooltobe
5. S P e c I f I c co n S I d e r at I o n S f o r t h e k yoto P r oto co L
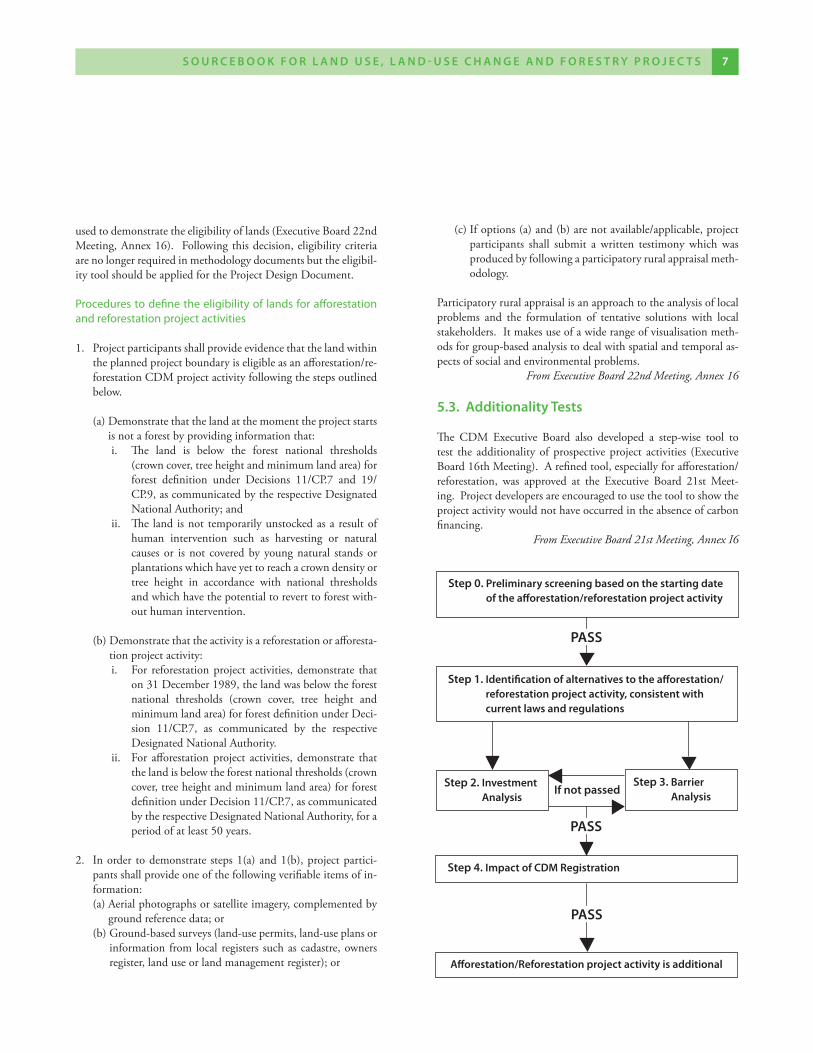
Step 1. Identification of alternatives to the afforestation/reforestation project activity, consistent with current laws and regulations
Step 2. Investment analysis
Step �. barrier analysi s
Step 0. Preliminary screening based on the starting date of the afforestation/reforestation project activity
PaSS
If not passed
Step �. Impact of cdm registration
PaSS
PaSS
afforestation/reforestation project activity is additional
usedtodemonstratetheeligibilityoflands(ExecutiveBoard22ndMeeting,Annex16). Followingthisdecision,eligibilitycriteriaarenolongerrequiredinmethodologydocumentsbuttheeligibil-itytoolshouldbeappliedfortheProjectDesignDocument.
Procedures to define the eligibility of lands for afforestation and reforestation project activities
1. Projectparticipantsshallprovideevidencethatthelandwithintheplannedprojectboundaryiseligibleasanafforestation/re-forestationCDMprojectactivityfollowingthestepsoutlinedbelow.
(a) Demonstratethatthelandatthemomenttheprojectstartsisnotaforestbyprovidinginformationthat:
i. The land is below the forest national thresholds(crowncover,treeheightandminimumlandarea)forforest definition under Decisions 11/CP.7 and 19/CP.9,ascommunicatedbytherespectiveDesignatedNationalAuthority;and
ii. Thelandisnottemporarilyunstockedasaresultofhuman intervention such as harvesting or naturalcausesor isnot coveredbyyoungnatural standsorplantationswhichhaveyettoreachacrowndensityortree height in accordance with national thresholdsandwhichhavethepotentialtoreverttoforestwith-outhumanintervention.
(b) Demonstratethattheactivityisareforestationorafforesta-tionprojectactivity:
i. For reforestationproject activities,demonstrate thaton31December1989,thelandwasbelowtheforestnational thresholds (crown cover, tree height andminimumlandarea)forforestdefinitionunderDeci-sion 11/CP.7, as communicated by the respectiveDesignatedNationalAuthority.
ii. For afforestationproject activities, demonstrate thatthelandisbelowtheforestnationalthresholds(crowncover,treeheightandminimumlandarea)forforestdefinitionunderDecision11/CP.7,ascommunicatedbytherespectiveDesignatedNationalAuthority,foraperiodofatleast50years.
2. Inorder todemonstratesteps1(a)and1(b),projectpartici-pantsshallprovideoneofthefollowingverifiableitemsofin-formation:
(a)Aerialphotographsorsatelliteimagery,complementedbygroundreferencedata;or
(b)Ground-basedsurveys(land-usepermits,land-useplansorinformationfromlocal registers suchascadastre,ownersregister,landuseorlandmanagementregister);or
(c)Ifoptions(a)and(b)arenotavailable/applicable,projectparticipants shall submit a written testimony which wasproducedbyfollowingaparticipatoryruralappraisalmeth-odology.
Participatoryruralappraisalisanapproachtotheanalysisoflocalproblems and the formulation of tentative solutions with localstakeholders.Itmakesuseofawiderangeofvisualisationmeth-odsforgroup-basedanalysistodealwithspatialandtemporalas-pectsofsocialandenvironmentalproblems.
From Executive Board 22nd Meeting, Annex 16
5.�. additionality tests
The CDM Executive Board also developed a step-wise tool totest the additionality of prospectiveproject activities (ExecutiveBoard16thMeeting).Arefinedtool,especiallyforafforestation/reforestation, was approved at the Executive Board 21st Meet-ing.Projectdevelopersareencouragedtousethetooltoshowtheprojectactivitywouldnothaveoccurredintheabsenceofcarbonfinancing.
From Executive Board 21st Meeting, Annex I6
S o u r c e b o o k f o r L a n d u S e , L a n d - u S e c h a n g e a n d f o r e S t r y P r o j e c t S � S o u r c e b o o k f o r L a n d u S e , L a n d - u S e c h a n g e a n d f o r e S t r y P r o j e c t S�
S o u r c e b o o k f o r L a n d u S e , L a n d - u S e c h a n g e a n d f o r e S t r y P r o j e c t S � S o u r c e b o o k f o r L a n d u S e , L a n d - u S e c h a n g e a n d f o r e S t r y P r o j e c t S�
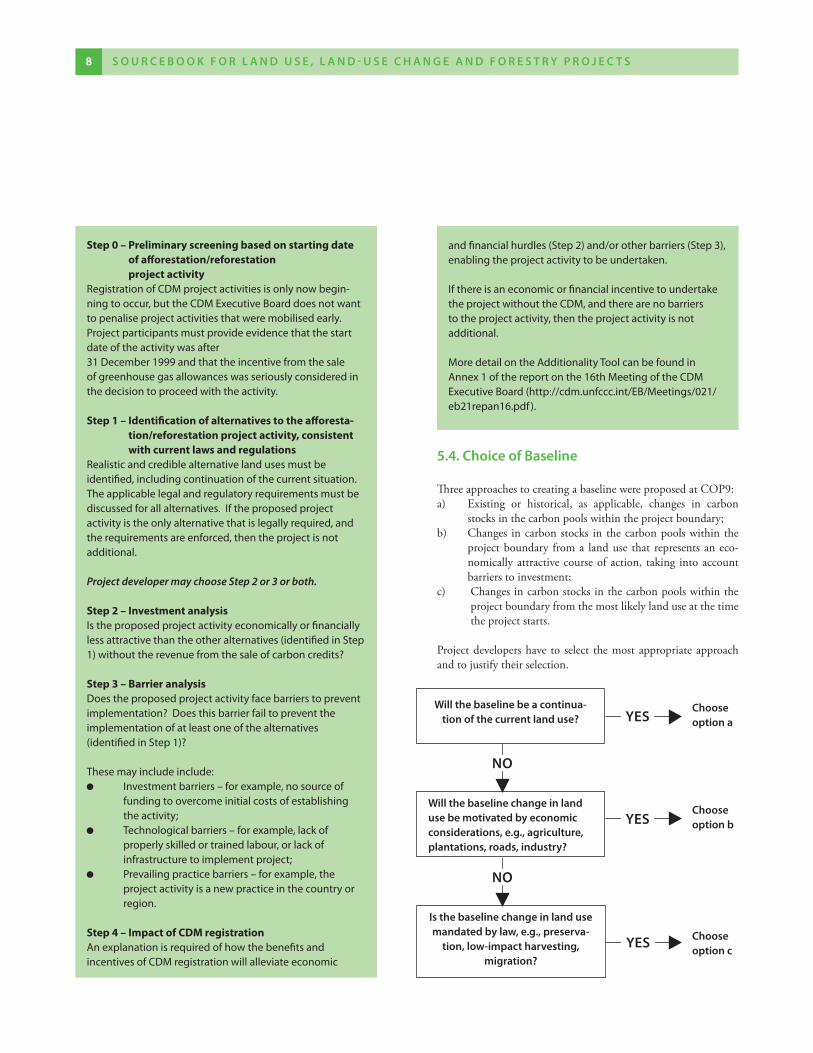
5.�. choice of baseline
ThreeapproachestocreatingabaselinewereproposedatCOP9:a) Existing or historical, as applicable, changes in carbon
stocksinthecarbonpoolswithintheprojectboundary;b) Changes incarbonstocks in thecarbonpoolswithin the
projectboundary froma landuse that representsaneco-nomicallyattractivecourseofaction, taking intoaccountbarrierstoinvestment;
c) Changesincarbonstocksinthecarbonpoolswithintheprojectboundaryfromthemostlikelylanduseatthetimetheprojectstarts.
Projectdevelopershave to select themostappropriateapproachandtojustifytheirselection.
Will the baseline be a continua-tion of the current land use?
no
Will the baseline change in land use be motivated by economic considerations, e.g., agriculture, plantations, roads, industry?
no
Is the baseline change in land use mandated by law, e.g., preserva-
tion, low-impact harvesting, migration?
choose option a
choose option b
choose option c
yeS
yeS
yeS
Step 0 – Preliminary screening based on starting date of afforestation/reforestation project activity
Registration of cdM project activities is only now begin-ning to occur, but the cdM Executive Board does not want to penalise project activities that were mobilised early. Project participants must provide evidence that the start date of the activity was after 31 december 1999 and that the incentive from the sale of greenhouse gas allowances was seriously considered in the decision to proceed with the activity.
Step 1 – Identification of alternatives to the afforesta-tion/reforestation project activity, consistent with current laws and regulations
Realistic and credible alternative land uses must be identified, including continuation of the current situation. the applicable legal and regulatory requirements must be discussed for all alternatives. If the proposed project activity is the only alternative that is legally required, and the requirements are enforced, then the project is not additional.
Project developer may choose Step 2 or 3 or both.
Step 2 – Investment analysisIs the proposed project activity economically or financially less attractive than the other alternatives (identified in Step 1) without the revenue from the sale of carbon credits?
Step 3 – Barrier analysisdoes the proposed project activity face barriers to prevent implementation? does this barrier fail to prevent the implementation of at least one of the alternatives (identified in Step 1)?
these may include include: Investment barriers – for example, no source of
funding to overcome initial costs of establishing the activity;
technological barriers – for example, lack of properly skilled or trained labour, or lack of infrastructure to implement project;
Prevailing practice barriers – for example, the project activity is a new practice in the country or region.
Step 4 – Impact of CDM registrationan explanation is required of how the benefits and incentives of cdM registration will alleviate economic
and financial hurdles (Step 2) and/or other barriers (Step 3), enabling the project activity to be undertaken.
If there is an economic or financial incentive to undertake the project without the cdM, and there are no barriers to the project activity, then the project activity is not additional.
More detail on the additionality tool can be found in annex 1 of the report on the 16th Meeting of the cdM Executive Board (http://cdm.unfccc.int/EB/Meetings/021/eb21repan16.pdf).
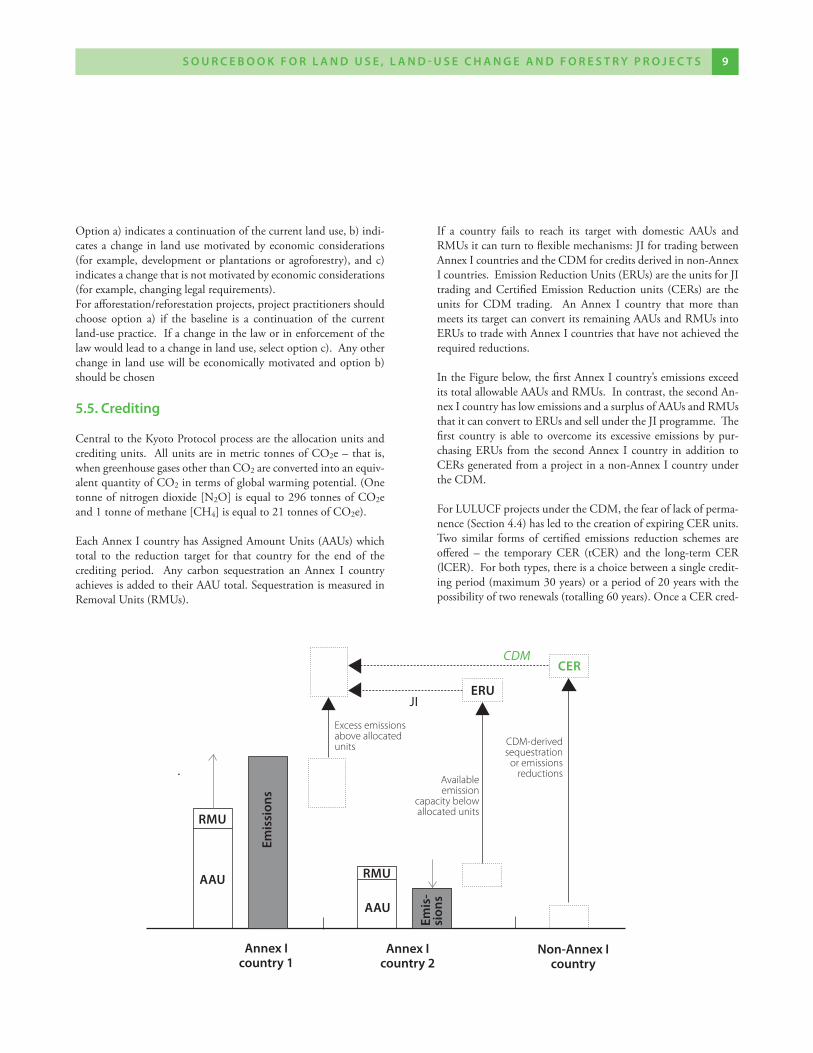
If a country fails to reach its target with domestic AAUs andRMUsitcanturntoflexiblemechanisms:JIfortradingbetweenAnnexIcountriesandtheCDMforcreditsderivedinnon-AnnexIcountries.EmissionReductionUnits(ERUs)aretheunitsforJItradingandCertifiedEmissionReductionunits (CERs)are theunits for CDM trading. An Annex I country that more thanmeetsitstargetcanconvertitsremainingAAUsandRMUsintoERUstotradewithAnnexIcountriesthathavenotachievedtherequiredreductions.
IntheFigurebelow,thefirstAnnexIcountry’semissionsexceeditstotalallowableAAUsandRMUs.Incontrast,thesecondAn-nexIcountryhaslowemissionsandasurplusofAAUsandRMUsthatitcanconverttoERUsandsellundertheJIprogramme.Thefirst country is able toovercome its excessive emissionsbypur-chasingERUs from the secondAnnex I country in addition toCERsgeneratedfromaprojectinanon-AnnexIcountryundertheCDM.
ForLULUCFprojectsundertheCDM,thefearoflackofperma-nence(Section4.4)hasledtothecreationofexpiringCERunits.Two similar forms of certified emissions reduction schemes areoffered – the temporary CER (tCER) and the long-term CER(lCER).Forbothtypes,thereisachoicebetweenasinglecredit-ingperiod(maximum30years)oraperiodof20yearswiththepossibilityoftworenewals(totalling60years).OnceaCERcred-
Optiona)indicatesacontinuationofthecurrentlanduse,b)indi-catesachange in landusemotivatedbyeconomicconsiderations(forexample,developmentorplantationsoragroforestry),andc)indicatesachangethatisnotmotivatedbyeconomicconsiderations(forexample,changinglegalrequirements).Forafforestation/reforestationprojects,projectpractitionersshouldchoose option a) if the baseline is a continuation of the currentland-usepractice.Ifachangeinthelaworinenforcementofthelawwouldleadtoachangeinlanduse,selectoptionc).Anyotherchangeinlandusewillbeeconomicallymotivatedandoptionb)shouldbechosen
5.5. crediting
CentraltotheKyotoProtocolprocessaretheallocationunitsandcreditingunits. Allunitsare inmetrictonnesofCO2e–that is,whengreenhousegasesotherthanCO2areconvertedintoanequiv-alentquantityofCO2intermsofglobalwarmingpotential.(Onetonneofnitrogendioxide[N2O]isequalto296tonnesofCO2eand1tonneofmethane[CH4]isequalto21tonnesofCO2e).
EachAnnexIcountryhasAssignedAmountUnits(AAUs)whichtotal to the reduction target for that country for the end of thecrediting period. Any carbon sequestration an Annex I countryachievesisaddedtotheirAAUtotal.SequestrationismeasuredinRemovalUnits(RMUs).
rmu
aau
emis
sion
s
annex I country 1
rmu
aau
emis
-si
ons
annex I country 2
non-annex I country
eru
cer
JI
cdm
Excess emissions above allocated units
Available emission
capacity below allocated units
CDM-derived sequestration
or emissions reductions
S o u r c e b o o k f o r L a n d u S e , L a n d - u S e c h a n g e a n d f o r e S t r y P r o j e c t S � S o u r c e b o o k f o r L a n d u S e , L a n d - u S e c h a n g e a n d f o r e S t r y P r o j e c t S�
itingperiodisover,theAnnexIcountrymustreplacethecarboneitherbypurchasinganotherCERorbyreplacingitwithanRMUorERU.
ThetCERslastforjustfiveyears,atwhichtimetheycanbereis-sued (ifverificationhasoccurred)or theAnnex Icountrymustreplace them. Whenaprojectdeveloper retires a tCERafter acreditingperiod isover (afterwhich,CDMregulationson thattCERwillcease),thedeveloperisthenfreetoharvestthetreesifdesired. Thefeesfor issuingtCERswill likelybechargedeveryfiveyearswhichcouldsignificantlyraisethecostofthisoption.Attheendofthecreditingperiod,alltCERsexpire.
Incontrast,lCERslastfortheentirelengthofthecreditingperi-od,butmustbereplacedeitherassoonasverificationshowsthecarbonstockhasdecreasedorifnoverificationhasoccurredforaperiodoffiveyears.Foralow-risklCER,thepricewillapproachthatofanenergyCERcredit[4].Attheendofthecreditingpe-riod,alllCERsalsoexpire.
The lCERs aremoredesirable for the project developer in thattheywillpossessahighervalue.YetapurchaserwillnotinvestinlCERsforaprojectinwhichthereissignificantrisk–inthissitu-ation,thefive-yearobligationoftCERsispreferable.Addition-ally,ifthepriceofCERsisexpectedtoincreaseovertime,aprojectdevelopermaywanttoselltCERsinthehopeofreceivinggreaterpaymentforfuturetCERs.
5.�. Submission of a new afforestation/reforestation methodology
AllprojectssubmittedtotheCDMExecutiveBoardmustincludeaProjectDesignDocumentinwhichanapprovedafforestation/reforestationmethodologyisapplied.Iftheproposedprojectdoesnotmeettheconditionsofanyoftheapprovedmethodologies,anew afforestation/reforestationmethodologymust be submittedforapprovalalongwiththeProjectDesignDocument,illustratinghowthenewmethodologycanbeapplied.Newmethodologiesare reviewedby theAfforestation/ReforestationWorkingGroupandexpertreviewersbeforebeingfinallyapprovedbytheCDMExecutiveBoard.
Allnewmethodologiesshouldbeuser-oriented,conciseandpro-videstep-by-steptools.Themethodologymustaddressallappli-cable issues,modalities, decisions by theCOPand rules of theExecutiveBoard. Theconditions for thenewmethodologyap-plicabilityandassumptionsmustbeclear,andexplainwhyanewmethodologyiswarranted.
Thesubmissionofnewmethodologieshasbeenalearningprocessfor all involved. During the first year, the primary issues thatcausednewmethodologies tobe rejected included improper orlackingexplanationregarding:
additionality; methodsfordeterminingtheprojectboundary; description of the baseline approach, justification for this
approachandland-usescenariodetermination; consideration and selection of carbon and non-CO2
greenhousegaspools; methods fordeterminingnetanthropogenicgreenhousegas
removalsbysinks;aswellas inadequacy in making recommended changes if the new
methodologywasbeingsubmittedforasecondtime.
Secondary issues that also caused new methodologies to failincludedimproperorlackingexplanationregarding:
methodsforcreatingabaselineofnetgreenhousegasremovalsbysinks;
methodsforestimatingactualnetgreenhousegasremovalsbysinks;
systemsforaddressingleakage; methodsforcompilingprojectemissions; improper or inadequate description of models, formulas,
algorithmsanddatasourcesused; methodsforaddressinguncertainties;aswellas theoverallquality,draftingandlanguage.
Careshouldbetakentoadequatelyaddressalloftheabovecon-cerns.Duetotheevolvingnatureofthenegotiations,theCDMwebsite(www.unfccc.int/CDM)shouldberegularlyconsulted.
S o u r c e b o o k f o r L a n d u S e , L a n d - u S e c h a n g e a n d f o r e S t r y P r o j e c t S 1 1 S o u r c e b o o k f o r L a n d u S e , L a n d - u S e c h a n g e a n d f o r e S t r y P r o j e c t S1 0
Theguidance givenhere is intended as additional to the IPCCGood Practice Guidance on Land Use, Land-Use Change and For-estry (2003), providing elaboration, clarification and enhancedmethodologies. The sourcebook should be used alongside theGoodPracticeGuidance.Itisalsoworthnotingthatthescienceofforestryhasbeenindevelopmentforhundredsofyears.Manytextbooksexistthatprovidemoredetailthanispossibletoincludeinthissourcebook–agoodexampleisForest Measurements[5].
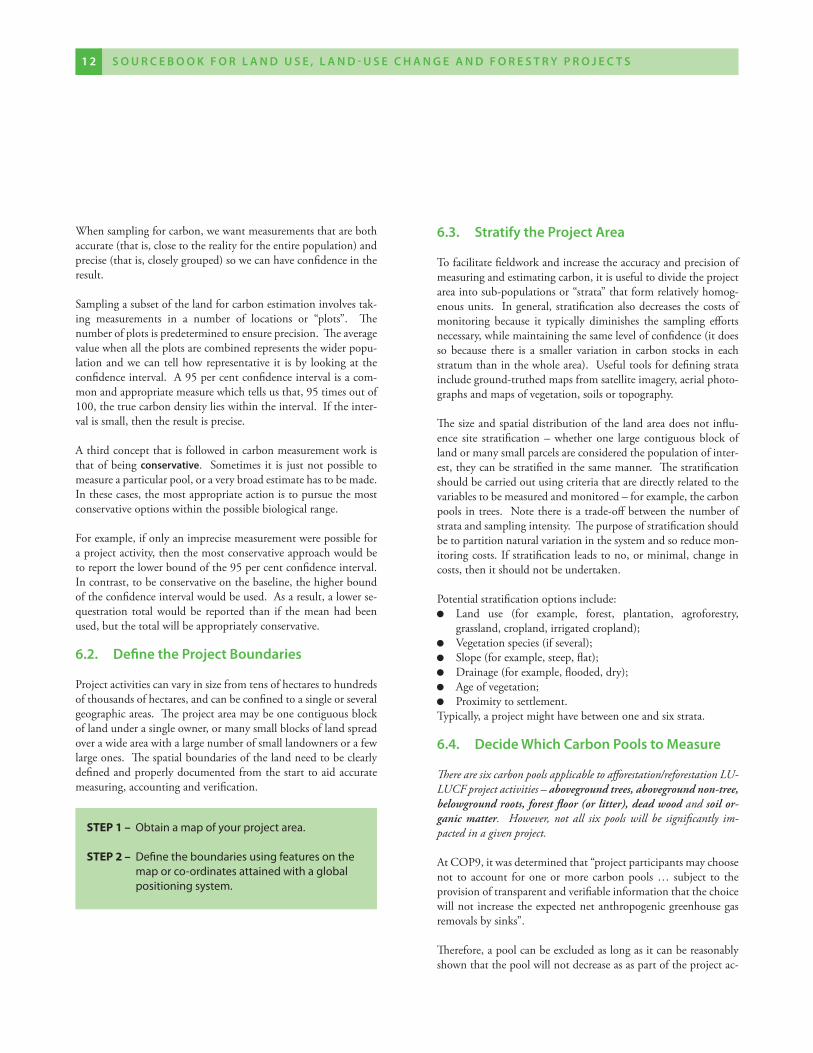
Thestepstopreparingarobustmeasuringplancanbesummarisedinthefollowingflowchart:
�.1. the concepts of accuracy, Precision and being conservative
Toestimatethecarbonstockontheland,onecouldmeasureeve-rything–everysingletreeforexample inthetens,hundredsorthousandsofhectaresoftheprojectarea.Completeenumerationsarealmostneverpossible,however,intermsoftimeorcost.Con-sequentlywemustsample.
Samplingistheprocessbywhichasubsetisstudiedinordertoallowgeneralisationstobemadeaboutthewholepopulationorareaofinterest.Thevaluesattainedfrommeasuringasampleareanestimationoftheequivalentvaluefortheentireareaorpopula-tion.Weneedtohavesomeideaofhowclosetheestimationistorealityandthisisprovidedbystatistics.
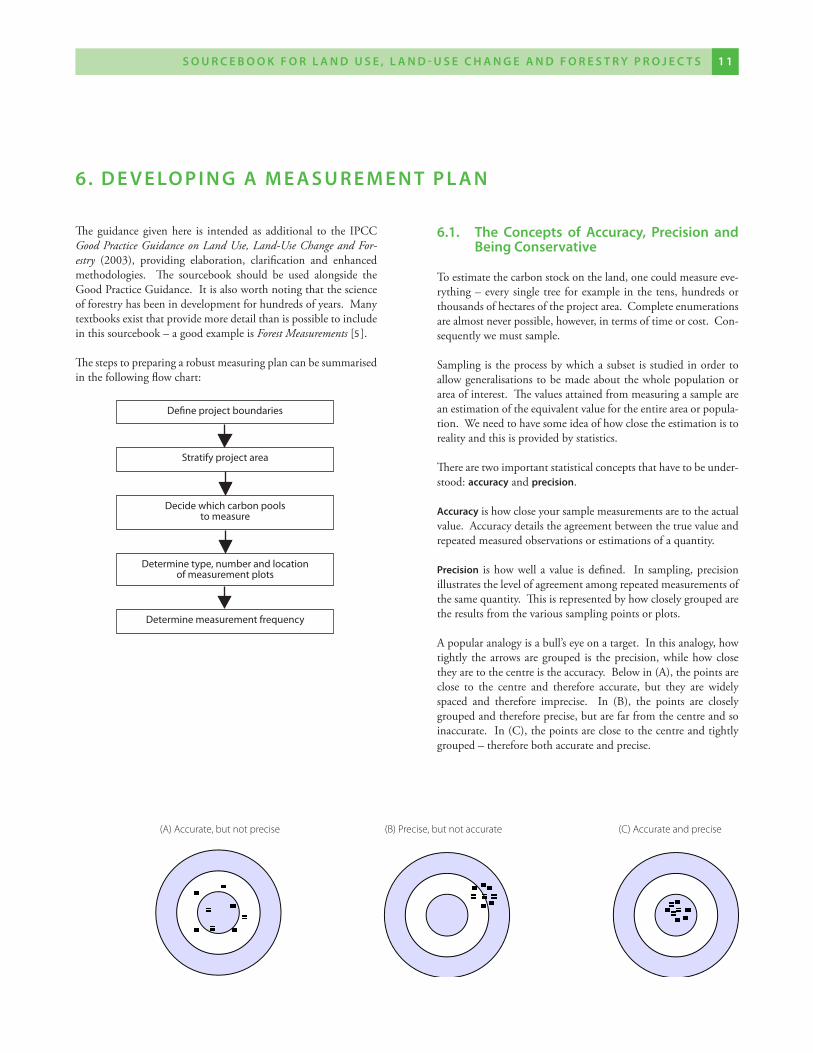
Therearetwoimportantstatisticalconceptsthathavetobeunder-stood:accuracyandprecision.
accuracyishowcloseyoursamplemeasurementsaretotheactualvalue.Accuracydetailstheagreementbetweenthetruevalueandrepeatedmeasuredobservationsorestimationsofaquantity.
Precision ishowwellavalue isdefined. Insampling,precisionillustratesthelevelofagreementamongrepeatedmeasurementsofthesamequantity.Thisisrepresentedbyhowcloselygroupedaretheresultsfromthevarioussamplingpointsorplots.
Apopularanalogyisabull’seyeonatarget.Inthisanalogy,howtightly thearrowsaregrouped is theprecision,whilehowclosetheyaretothecentreistheaccuracy.Belowin(A),thepointsareclose to the centre and therefore accurate, but they are widelyspaced and therefore imprecise. In (B), the points are closelygroupedandthereforeprecise,butarefarfromthecentreandsoinaccurate.In(C),thepointsareclosetothecentreandtightlygrouped–thereforebothaccurateandprecise.
�. d e v e Lo P I n g a m e a S u r e m e n t P L a n
define project boundaries
Stratify project area
decide which carbon pools to measure
determine type, number and location of measurement plots
determine measurement frequency
(A) Accurate, but not precise (B) Precise, but not accurate (C) Accurate and precise
1 1S o u r c e b o o k f o r L a n d u S e , L a n d - u S e c h a n g e a n d f o r e S t r y P r o j e c t S 1 1 S o u r c e b o o k f o r L a n d u S e , L a n d - u S e c h a n g e a n d f o r e S t r y P r o j e c t S1 0
Whensamplingforcarbon,wewantmeasurementsthatarebothaccurate(thatis,closetotherealityfortheentirepopulation)andprecise(thatis,closelygrouped)sowecanhaveconfidenceintheresult.
Samplingasubsetofthelandforcarbonestimationinvolvestak-ing measurements in a number of locations or “plots”. Thenumberofplotsispredeterminedtoensureprecision.Theaveragevaluewhenalltheplotsarecombinedrepresentsthewiderpopu-lationandwecantellhowrepresentative it isby lookingat theconfidenceinterval.A95percentconfidenceintervalisacom-monandappropriatemeasurewhichtellsusthat,95timesoutof100,thetruecarbondensitylieswithintheinterval.Iftheinter-valissmall,thentheresultisprecise.
Athirdconceptthatisfollowedincarbonmeasurementworkisthatofbeingconservative. Sometimesit is justnotpossibletomeasureaparticularpool,oraverybroadestimatehastobemade.Inthesecases,themostappropriateactionistopursuethemostconservativeoptionswithinthepossiblebiologicalrange.
Forexample,ifonlyanimprecisemeasurementwerepossibleforaprojectactivity,thenthemostconservativeapproachwouldbetoreportthelowerboundofthe95percentconfidenceinterval.Incontrast,tobeconservativeonthebaseline,thehigherboundoftheconfidenceintervalwouldbeused.Asaresult,alowerse-questration totalwouldbe reported than if themeanhadbeenused,butthetotalwillbeappropriatelyconservative.
�.2. define the Project boundaries
Projectactivitiescanvaryinsizefromtensofhectarestohundredsofthousandsofhectares,andcanbeconfinedtoasingleorseveralgeographicareas.Theprojectareamaybeonecontiguousblockoflandunderasingleowner,ormanysmallblocksoflandspreadoverawideareawithalargenumberofsmalllandownersorafewlargeones.Thespatialboundariesofthelandneedtobeclearlydefinedandproperlydocumentedfromthestarttoaidaccuratemeasuring,accountingandverification.
�.�. Stratify the Project area
Tofacilitatefieldworkandincreasetheaccuracyandprecisionofmeasuringandestimatingcarbon,itisusefultodividetheprojectareaintosub-populationsor“strata”thatformrelativelyhomog-enousunits. Ingeneral,stratificationalsodecreasesthecostsofmonitoring because it typically diminishes the sampling effortsnecessary,whilemaintainingthesamelevelofconfidence(itdoesso because there is a smaller variation in carbon stocks in eachstratumthaninthewholearea).Usefultoolsfordefiningstrataincludeground-truthedmapsfromsatelliteimagery,aerialphoto-graphsandmapsofvegetation,soilsortopography.
Thesizeandspatialdistributionofthelandareadoesnotinflu-ence site stratification–whether one large contiguousblockoflandormanysmallparcelsareconsideredthepopulationofinter-est,theycanbestratifiedinthesamemanner.Thestratificationshouldbecarriedoutusingcriteriathataredirectlyrelatedtothevariablestobemeasuredandmonitored–forexample,thecarbonpoolsintrees. Notethereisatrade-offbetweenthenumberofstrataandsamplingintensity.Thepurposeofstratificationshouldbetopartitionnaturalvariationinthesystemandsoreducemon-itoringcosts.Ifstratificationleadstono,orminimal,changeincosts,thenitshouldnotbeundertaken.
Potentialstratificationoptionsinclude: Land use (for example, forest, plantation, agroforestry,
grassland,cropland,irrigatedcropland); Vegetationspecies(ifseveral); Slope(forexample,steep,flat); Drainage(forexample,flooded,dry); Ageofvegetation; Proximitytosettlement.
Typically,aprojectmighthavebetweenoneandsixstrata.
�.�. decide Which carbon Pools to measure
There are six carbon pools applicable to afforestation/reforestation LU-LUCF project activities – aboveground trees, aboveground non-tree, belowground roots, forest floor (or litter), dead wood and soil or-ganic matter. However, not all six pools will be significantly im-pacted in a given project.
AtCOP9,itwasdeterminedthat“projectparticipantsmaychoosenot to account foroneormore carbonpools…subject to theprovisionoftransparentandverifiableinformationthatthechoicewillnotincreasetheexpectednetanthropogenicgreenhousegasremovalsbysinks”.
Therefore,apoolcanbeexcludedaslongasitcanbereasonablyshownthatthepoolwillnotdecreaseasaspartoftheprojectac-
STEP 1 – obtain a map of your project area.
STEP 2 – define the boundaries using features on the map or co-ordinates attained with a global positioning system.
S o u r c e b o o k f o r L a n d u S e , L a n d - u S e c h a n g e a n d f o r e S t r y P r o j e c t S 1 � S o u r c e b o o k f o r L a n d u S e , L a n d - u S e c h a n g e a n d f o r e S t r y P r o j e c t S1 2
tivityorwillnotincreaseaspartofthebaseline.
Beyond this stipulation, the selection of which pools to measure de-pends on several factors, including expected rate of change, magnitude and direction of change, availability and accuracy of methods to quantify change and the cost to measure. All pools that are expected to decrease as a result of activities should be measured and monitored. Pools that are expected to increase by only a small amount relative to the overall rate of change need not be measured or monitored.
Clearlyitmakessensetomeasureandestimatethecarbonpoolinlivetreesandtheirrootsforallprojectactivities–treesaresimpletomeasureandcontainsubstantialamountsofcarbon.
Abovegroundnon-treeorunderstorymayneedmeasuringifthisisasignificantcomponent,suchaswheretreesareonlypresentatlowdensities (for example, savanna).Butnon-treevegetation isgenerallynotasignificantbiomasscomponentinmatureforest.
Forestflooranddeadwoodalsotendtoonlybeasignificantcom-ponent in mature forests. Dead wood is composed of standingdeadtreesanddowneddeadwood,anditisunlikelythatsignifi-cantquantitieswillaccumulateinthe30to60yearsofanaffores-tation/reforestationproject.
Soilorganiccarbonis likelytochangeataslowrateandisalsolikelytobeanexpensivepooltomeasure.Howeveritshouldatleast be considered, as sequestration of carbon into the soil, orpreventionofemissionsofcarbonfromsoils,canbeimportant–especiallyingrazinglandandcroplandsystems–andomissionofsoilcarbonisanomissionofasourceofreductionsinatmospher-icgreenhousegases.Potentially,whereforestisplantedonlandthatwaspreviouslygrassland,alossinsoilcarboncanoccur(be-causeoftheveryhighsoilcarbonstocksinperennialgrasslands).
Asafforestation/reforestationprojectshaveamaximumtimeframeof60years,itmaymakesenseeconomicallyandintermsofeffi-ciencytoonlymeasurelivebiomassintrees,giventhatthispoolwilldominatethetotalbiomass.
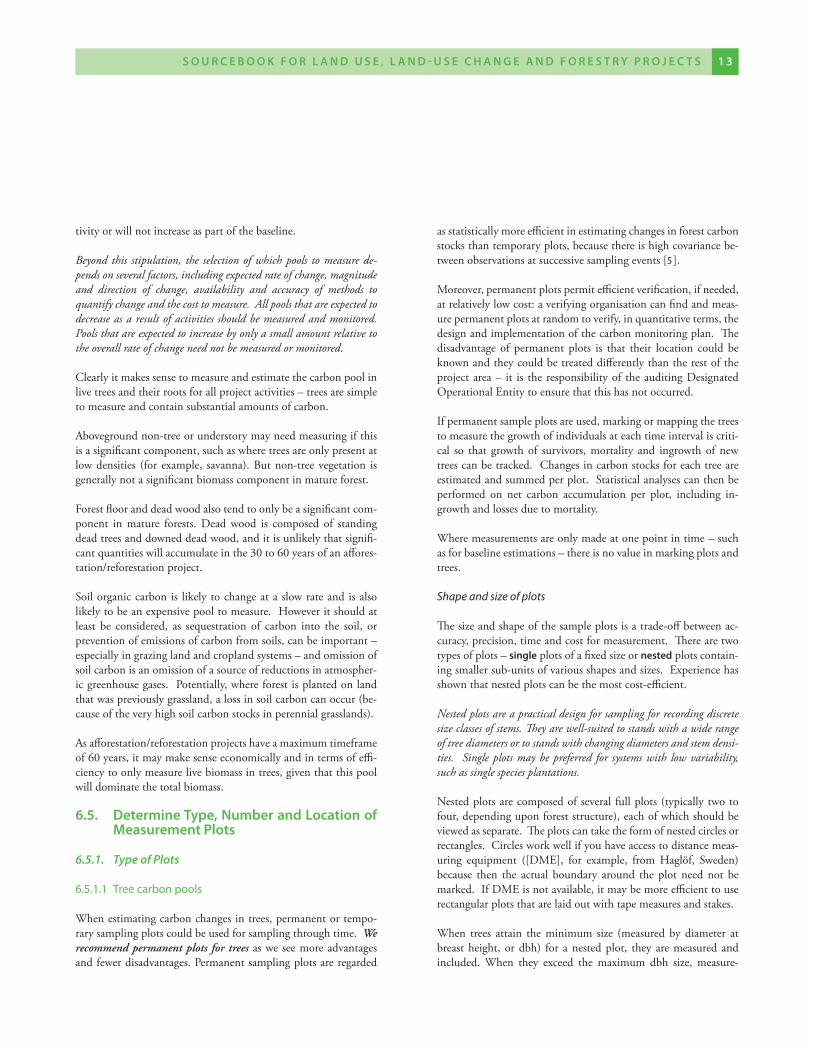
�.5. determine type, number and Location of measurement Plots
6.5.1. Type of Plots
6.5.1.1 tree carbon pools
Whenestimatingcarbonchangesintrees,permanentortempo-rarysamplingplotscouldbeusedforsamplingthroughtime.We recommend permanent plots for treesasweseemoreadvantagesandfewerdisadvantages.Permanentsamplingplotsareregarded
asstatisticallymoreefficientinestimatingchangesinforestcarbonstocksthantemporaryplots,becausethereishighcovariancebe-tweenobservationsatsuccessivesamplingevents[5].
Moreover,permanentplotspermitefficientverification,ifneeded,atrelativelylowcost:averifyingorganisationcanfindandmeas-urepermanentplotsatrandomtoverify,inquantitativeterms,thedesignandimplementationofthecarbonmonitoringplan.Thedisadvantage of permanent plots is that their location could beknownandtheycouldbetreateddifferentlythantherestoftheprojectarea– it is theresponsibilityof theauditingDesignatedOperationalEntitytoensurethatthishasnotoccurred.
Ifpermanentsampleplotsareused,markingormappingthetreestomeasurethegrowthofindividualsateachtimeintervaliscriti-cal so that growthof survivors,mortality and ingrowthofnewtreescanbetracked.Changesincarbonstocksforeachtreeareestimatedandsummedperplot.Statisticalanalysescanthenbeperformed on net carbon accumulation per plot, including in-growthandlossesduetomortality.
Wheremeasurementsareonlymadeatonepointintime–suchasforbaselineestimations–thereisnovalueinmarkingplotsandtrees.
Shape and size of plots
Thesizeandshapeofthesampleplotsisatrade-offbetweenac-curacy,precision,timeandcostformeasurement.Therearetwotypesofplots–singleplotsofafixedsizeornestedplotscontain-ingsmallersub-unitsofvariousshapesandsizes.Experiencehasshownthatnestedplotscanbethemostcost-efficient.
Nested plots are a practical design for sampling for recording discrete size classes of stems. They are well-suited to stands with a wide range of tree diameters or to stands with changing diameters and stem densi-ties. Single plots may be preferred for systems with low variability, such as single species plantations.
Nestedplotsarecomposedofseveralfullplots(typicallytwotofour,dependinguponforeststructure),eachofwhichshouldbeviewedasseparate.Theplotscantaketheformofnestedcirclesorrectangles.Circlesworkwellifyouhaveaccesstodistancemeas-uring equipment ([DME], for example, from Haglöf, Sweden)because then the actual boundary around theplotneednot bemarked.IfDMEisnotavailable,itmaybemoreefficienttouserectangularplotsthatarelaidoutwithtapemeasuresandstakes.
When trees attain theminimum size (measuredbydiameter atbreastheight,ordbh) for anestedplot, they aremeasuredandincluded. When they exceed the maximum dbh size, measure-
S o u r c e b o o k f o r L a n d u S e , L a n d - u S e c h a n g e a n d f o r e S t r y P r o j e c t S 1 � S o u r c e b o o k f o r L a n d u S e , L a n d - u S e c h a n g e a n d f o r e S t r y P r o j e c t S1 2
mentofthetreeinthatneststopsandbeginsinthenextlargernest.Howtotrackandanalysedatafromnestedplotsisdescribed,withexamples,inSection8.1.
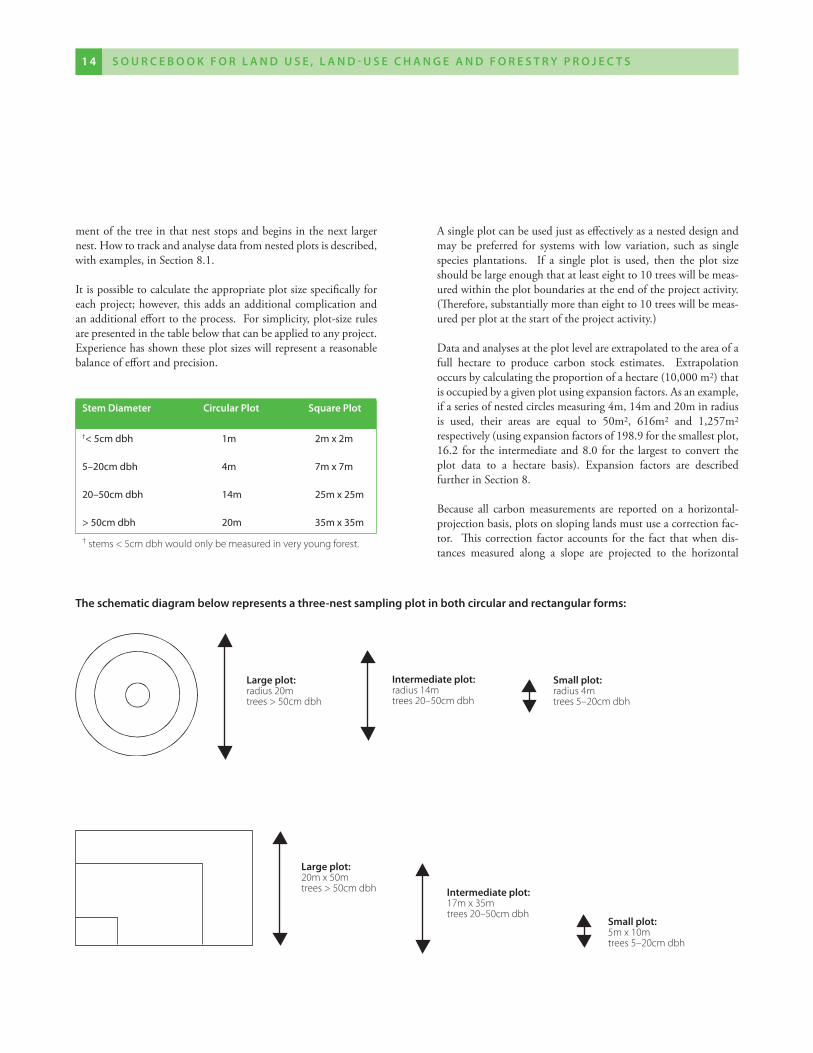
Itispossibletocalculatetheappropriateplotsizespecificallyforeachproject;however,thisaddsanadditionalcomplicationandanadditionalefforttotheprocess.Forsimplicity,plot-sizerulesarepresentedinthetablebelowthatcanbeappliedtoanyproject.Experiencehasshowntheseplotsizeswillrepresentareasonablebalanceofeffortandprecision.
Asingleplotcanbeusedjustaseffectivelyasanesteddesignandmay be preferred for systems with low variation, such as singlespecies plantations. If a single plot is used, then the plot sizeshouldbelargeenoughthatatleasteightto10treeswillbemeas-uredwithintheplotboundariesattheendoftheprojectactivity.(Therefore,substantiallymorethaneightto10treeswillbemeas-uredperplotatthestartoftheprojectactivity.)
Dataandanalysesattheplotlevelareextrapolatedtotheareaofafull hectare to produce carbon stock estimates. Extrapolationoccursbycalculatingtheproportionofahectare(10,000m2)thatisoccupiedbyagivenplotusingexpansionfactors.Asanexample,ifaseriesofnestedcirclesmeasuring4m,14mand20minradiusis used, their areas are equal to 50m2, 616m2 and 1,257m2respectively(usingexpansionfactorsof198.9forthesmallestplot,16.2 for the intermediateand8.0 for the largest toconvert theplot data to a hectare basis). Expansion factors are describedfurtherinSection8.
Because all carbon measurements are reported on a horizontal-projectionbasis,plotsonslopinglandsmustuseacorrectionfac-tor. This correction factor accounts for the fact thatwhendis-tances measured along a slope are projected to the horizontal
Stem diameter circular Plot Square Plot
†< 5cm dbh 1m 2m x 2m
5–20cm dbh 4m 7m x 7m
20–50cm dbh 14m 25m x 25m
> 50cm dbh 20m 35m x 35m
† stems < 5cm dbh would only be measured in very young forest.
the schematic diagram below represents a three-nest sampling plot in both circular and rectangular forms:
Large plot: radius 20m trees > 50cm dbh
Intermediate plot: radius 14m trees 20–50cm dbh
Small plot: radius 4m trees 5–20cm dbh
Large plot: 20m x 50m trees > 50cm dbh Intermediate plot:
17m x 35m trees 20–50cm dbh
Small plot: 5m x 10m trees 5–20cm dbh
S o u r c e b o o k f o r L a n d u S e , L a n d - u S e c h a n g e a n d f o r e S t r y P r o j e c t S 1 5 S o u r c e b o o k f o r L a n d u S e , L a n d - u S e c h a n g e a n d f o r e S t r y P r o j e c t S1 �
plane,theyaresmaller.Iftheplotissplitbetweenlevelandslopingground,itissimplertomovetheplotsothatitiseitherentirelylevelorsloping.Iftheplotfallsonaslope,thentheslopeangleshouldbemeasuredusingaclinometer.Wheretheplotislocatedona slope that isgreater than10percent, the slope shouldbequantifiedsothatanadjustmentcanbemadetotheplotareaatthetimeofanalysis.DetailsonthiscalculationaregiveninSec-tion8.
6.5.1.2. Non-tree carbon pools
Non-treecarbonpoolsdifferfromtreesinthatitisnotphysicallypossibletomeasuretheidenticalsampleattwoperiodsintime.Withnon-treevegetation,forestfloorandsoil,thisisbecausetheprocessofmeasuringthesampledestroysthesample–it iscol-lected,weighedanddriedinanoven.Withdowneddeadwoodthesampleisnotnecessarilydestroyed,buttrackingpiecesofdeadwoodbetweentwoperiodsoftimeislogisticallyverychallenging.Consequently,foreachofthesepools,thesamplesaretemporary.Tomaintainstatisticalindependence(anabstractconceptthatisimportanttoguaranteerepresentativeresults),thesamplingloca-tionshouldbemovedateachcensus.
For the destructively sampled components, the size of the plotshouldbelargeenoughtocaptureasufficientlylargesamplewhilestillmaintainingahighlevelofsamplingefficiency.Typically,forherbaceousvegetationandforestfloor,asmallsub-plotofbetween0.25m2and0.5m2 isused.For shrubs, a largerplotofperhaps1m2 could be used. For soil, typically four 30cm soil cores arepooledtocreateasinglesampleforcarbonconcentrationwithanadditional core for bulkdensity. Sections7.3 to7.6havemoreinformationoncarryingoutthesemeasurements.
6.5.2. Number of Plots
Itisimportantthatsamplingiscarriedoutwithstatisticalrigour,asitislikelythiswillbearequirementoftheDesignatedOperat-ingEntity.Inemployingthisrigour,thefirststepisidentifyingthenumberofplotsrequiredtoreachthedesiredprecisionintheresults.
An online tool for calculating number of plots is available at:http://www.winrock.org/Ecosystems/tools.asp.
Tousethetool,inputthedesiredprecisionandthenumber,area,meancarbondensityandco-efficientofvariationforeachstrata.Withthisinformation,thetoolcalculatestherequirednumberofplots.
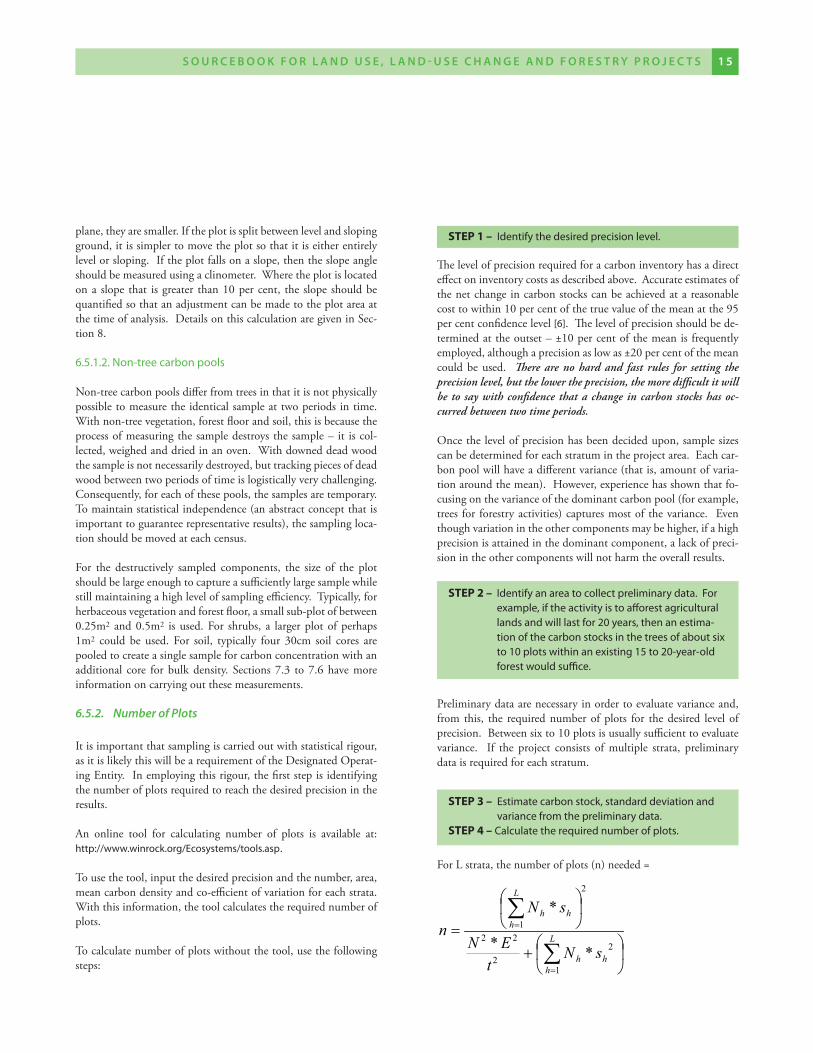
Tocalculatenumberofplotswithoutthetool,usethefollowingsteps:
Thelevelofprecisionrequiredforacarboninventoryhasadirecteffectoninventorycostsasdescribedabove.Accurateestimatesofthenetchangeincarbonstockscanbeachievedatareasonablecosttowithin10percentofthetruevalueofthemeanatthe95percentconfidencelevel[6].Thelevelofprecisionshouldbede-terminedattheoutset–±10percentofthemeanisfrequentlyemployed,althoughaprecisionaslowas±20percentofthemeancouldbeused. There are no hard and fast rules for setting the precision level, but the lower the precision, the more difficult it will be to say with confidence that a change in carbon stocks has oc-curred between two time periods.
Oncethelevelofprecisionhasbeendecidedupon,samplesizescanbedeterminedforeachstratumintheprojectarea.Eachcar-bonpoolwillhaveadifferentvariance(thatis,amountofvaria-tionaroundthemean).However,experiencehasshownthatfo-cusingonthevarianceofthedominantcarbonpool(forexample,trees for forestryactivities)capturesmostof thevariance. Eventhoughvariationintheothercomponentsmaybehigher,ifahighprecisionisattainedinthedominantcomponent,alackofpreci-sionintheothercomponentswillnotharmtheoverallresults.
Preliminarydataarenecessaryinordertoevaluatevarianceand,from this, the requirednumberofplots for thedesired levelofprecision.Betweensixto10plotsisusuallysufficienttoevaluatevariance. If the project consists of multiple strata, preliminarydataisrequiredforeachstratum.
ForLstrata,thenumberofplots(n)needed=
STEP 1 – Identify the desired precision level.
STEP 2 – Identify an area to collect preliminary data. For example, if the activity is to afforest agricultural lands and will last for 20 years, then an estima-tion of the carbon stocks in the trees of about six to 10 plots within an existing 15 to 20-year-old forest would suffice.
STEP 3 – Estimate carbon stock, standard deviation and variance from the preliminary data.
STEP 4 – calculate the required number of plots.
+
=
∑
∑
=
=L
hhh
L
hhh
sNt
EN
sNn
1
22
22
2
1
**
*
S o u r c e b o o k f o r L a n d u S e , L a n d - u S e c h a n g e a n d f o r e S t r y P r o j e c t S 1 5 S o u r c e b o o k f o r L a n d u S e , L a n d - u S e c h a n g e a n d f o r e S t r y P r o j e c t S1 �
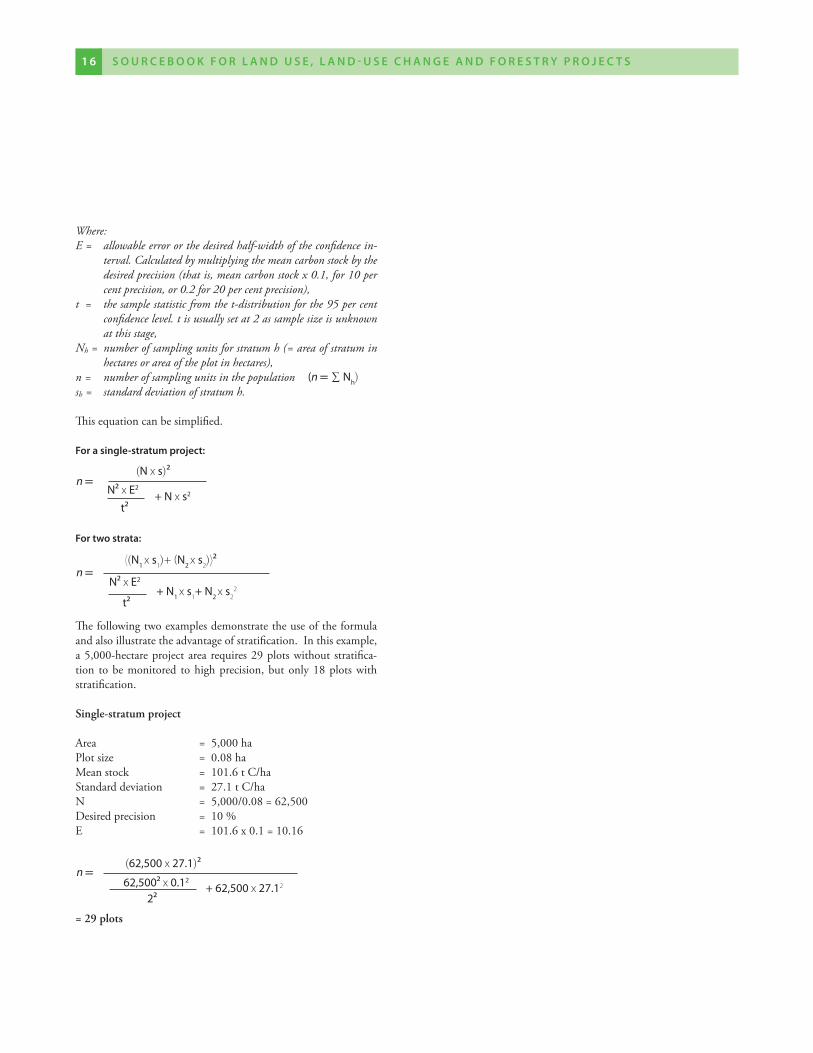
Where:E = allowable error or the desired half-width of the confidence in-
terval. Calculated by multiplying the mean carbon stock by the desired precision (that is, mean carbon stock x 0.1, for 10 per cent precision, or 0.2 for 20 per cent precision),
t = the sample statistic from the t-distribution for the 95 per cent confidence level. t is usually set at 2 as sample size is unknown at this stage,
Nh = number of sampling units for stratum h (= area of stratum in hectares or area of the plot in hectares),
n = number of sampling units in the populationsh = standard deviation of stratum h.
Thisequationcanbesimplified.
for a single-stratum project:
for two strata:
Thefollowingtwoexamplesdemonstratetheuseoftheformulaandalsoillustratetheadvantageofstratification.Inthisexample,a5,000-hectareprojectarearequires29plotswithoutstratifica-tion tobemonitored tohighprecision,butonly18plotswithstratification.
Single-stratum project
Area =5,000haPlotsize =0.08haMeanstock =101.6tC/haStandarddeviation =27.1tC/haN =5,000/0.08=62,500Desiredprecision =10%E =101.6x0.1=10.16
= 29 plots
S o u r c e b o o k f o r L a n d u S e , L a n d - u S e c h a n g e a n d f o r e S t r y P r o j e c t S 1 � S o u r c e b o o k f o r L a n d u S e , L a n d - u S e c h a n g e a n d f o r e S t r y P r o j e c t S1 �
G@N1 x s1#+ (N2 x s2#F²n O
N² x E2
t²+ N1 x s1+ N2 x s2
2
(n O ∑Nh#
@62,500 x 27.1#²n O
62,500² x 0.12
2²+ 62,500 x 27.12
n O@N x s#²
N² x E2
t²+ N x s2
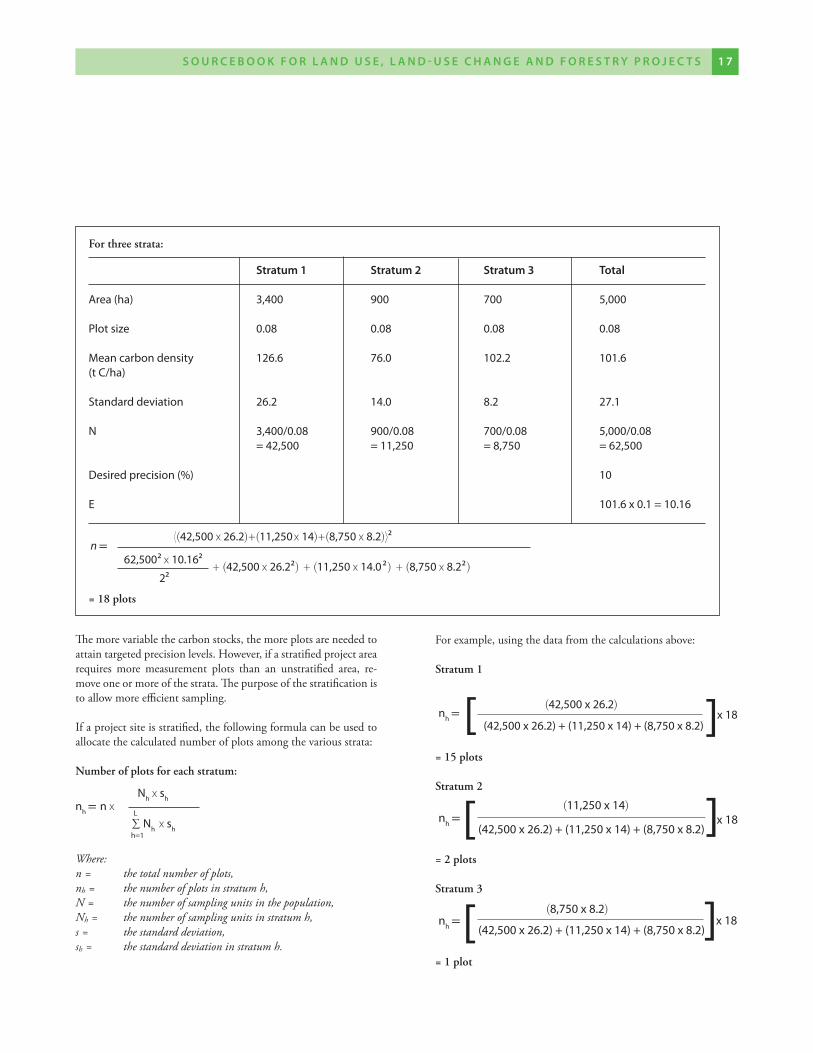
Forexample,usingthedatafromthecalculationsabove:
Stratum 1
= 15 plots
Stratum 2
= 2 plots
Stratum 3
= 1 plot
@42,500 x 26.2#nh O
(42,500 x 26.2) + (11,250 x 14) + (8,750 x 8.2)[ ]x 18
@11,250 x 14#nh O
(42,500 x 26.2) + (11,250 x 14) + (8,750 x 8.2)[ ]x 18
@8,750 x 8.2#nh O
(42,500 x 26.2) + (11,250 x 14) + (8,750 x 8.2)[ ]x 18
For three strata:
Stratum 1 Stratum 2 Stratum � total
area (ha) 3,400 900 700 5,000
Plot size 0.08 0.08 0.08 0.08
Mean carbon density 126.6 76.0 102.2 101.6(t c/ha)
Standard deviation 26.2 14.0 8.2 27.1
N 3,400/0.08 900/0.08 700/0.08 5,000/0.08 = 42,500 = 11,250 = 8,750 = 62,500 desired precision (%) 10
E 101.6 x 0.1 = 10.16
Themorevariablethecarbonstocks,themoreplotsareneededtoattaintargetedprecisionlevels.However,ifastratifiedprojectarearequires more measurement plots than an unstratified area, re-moveoneormoreofthestrata.Thepurposeofthestratificationistoallowmoreefficientsampling.
Ifaprojectsiteisstratified,thefollowingformulacanbeusedtoallocatethecalculatednumberofplotsamongthevariousstrata:
Number of plots for each stratum:
Where:n = the total number of plots,nh = the number of plots in stratum h,N = the number of sampling units in the population,Nh = the number of sampling units in stratum h,s = the standard deviation,sh = the standard deviation in stratum h.
62,500² x 10.16²
= 18 plots
G@42,500 x 26.2#+@11,250 x 14#+@8,750 x 8.2#F²n O
2²+ @42,500 x 26.2²# + @11,250 x 14.0 ² # + @8,750 x 8.2² #
nh O n xNh x sh
∑Nh x shh=1
L
S o u r c e b o o k f o r L a n d u S e , L a n d - u S e c h a n g e a n d f o r e S t r y P r o j e c t S 1 � S o u r c e b o o k f o r L a n d u S e , L a n d - u S e c h a n g e a n d f o r e S t r y P r o j e c t S1 �
Theformulasabovecanequallybeusedwithnon-treecarbonpoolsor soil. Such plots will be temporary and new random locationsshouldbechosenateachmeasurementperiod.
However, since tree biomass will dominate total biomass (andthereforewillalsodominatethesummedvariancefortheproject),itispracticaltoestimatethenumberofplotsneededfortheothercarbonpoolsbasedlooselyonthenumberofplotsforthedominantbiomasscomponent.Forexample,asingle100mlineintersect(fordowneddeadwood,seeSection7.4.2), fourclipplots forherba-ceousvegetationandtheforestfloor,andfoursoilsampleswouldbesufficientpertreeplot.
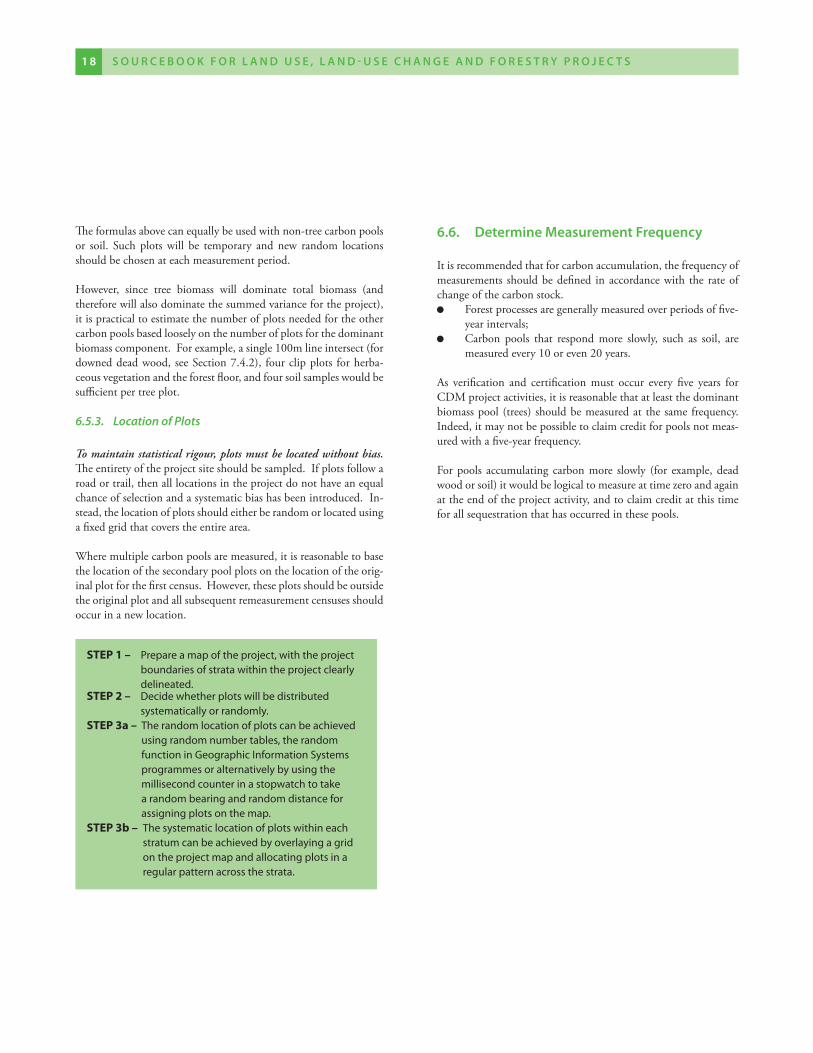
6.5.3. Location of Plots
To maintain statistical rigour, plots must be located without bias. Theentiretyoftheprojectsiteshouldbesampled.Ifplotsfollowaroadortrail,thenalllocationsintheprojectdonothaveanequalchanceofselectionandasystematicbiashasbeenintroduced.In-stead,thelocationofplotsshouldeitherberandomorlocatedusingafixedgridthatcoverstheentirearea.
Wheremultiplecarbonpoolsaremeasured,itisreasonabletobasethelocationofthesecondarypoolplotsonthelocationoftheorig-inalplotforthefirstcensus.However,theseplotsshouldbeoutsidetheoriginalplotandallsubsequentremeasurementcensusesshouldoccurinanewlocation.
�.�. determine measurement frequency
Itisrecommendedthatforcarbonaccumulation,thefrequencyofmeasurements shouldbedefined inaccordancewith the rateofchangeofthecarbonstock.
Forestprocessesaregenerallymeasuredoverperiodsoffive-yearintervals;
Carbon pools that respond more slowly, such as soil, aremeasuredevery10oreven20years.
As verification and certification must occur every five years forCDMprojectactivities,itisreasonablethatatleastthedominantbiomasspool(trees) shouldbemeasuredat thesamefrequency.Indeed,itmaynotbepossibletoclaimcreditforpoolsnotmeas-uredwithafive-yearfrequency.
Forpools accumulating carbonmore slowly (for example,deadwoodorsoil)itwouldbelogicaltomeasureattimezeroandagainattheendoftheprojectactivity,andtoclaimcreditatthistimeforallsequestrationthathasoccurredinthesepools.
STEP 1 – Prepare a map of the project, with the project boundaries of strata within the project clearly delineated.
STEP 2 – decide whether plots will be distributed systematically or randomly.
STEP 3a – the random location of plots can be achieved using random number tables, the random function in geographic Information Systems programmes or alternatively by using the millisecond counter in a stopwatch to take a random bearing and random distance for assigning plots on the map.
STEP 3b – the systematic location of plots within each stratum can be achieved by overlaying a grid on the project map and allocating plots in a regular pattern across the strata.
S o u r c e b o o k f o r L a n d u S e , L a n d - u S e c h a n g e a n d f o r e S t r y P r o j e c t S 1 � S o u r c e b o o k f o r L a n d u S e , L a n d - u S e c h a n g e a n d f o r e S t r y P r o j e c t S1 �
�.1. Preparation for fieldwork
Efficientplanningforfieldworkisessentialtoreduceunnecessarylabour costs, avoid safety risks and ensure reliable carbon esti-mates.
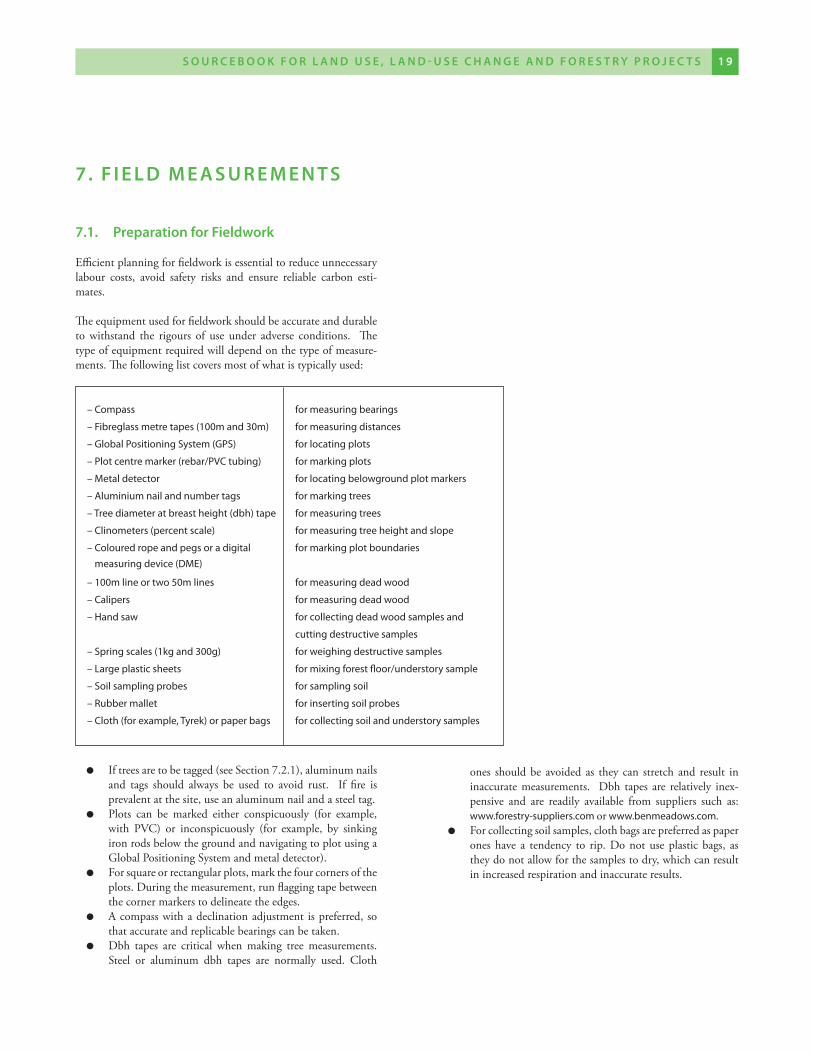
Theequipmentusedforfieldworkshouldbeaccurateanddurableto withstand the rigours of use under adverse conditions. Thetypeofequipmentrequiredwilldependonthetypeofmeasure-ments.Thefollowinglistcoversmostofwhatistypicallyused:
Iftreesaretobetagged(seeSection7.2.1),aluminumnailsand tags should always be used to avoid rust. If fire isprevalentatthesite,useanaluminumnailandasteeltag.
Plots can be marked either conspicuously (for example,with PVC) or inconspicuously (for example, by sinkingironrodsbelowthegroundandnavigatingtoplotusingaGlobalPositioningSystemandmetaldetector).
Forsquareorrectangularplots,markthefourcornersoftheplots.Duringthemeasurement,runflaggingtapebetweenthecornermarkerstodelineatetheedges.
Acompasswithadeclinationadjustment ispreferred,sothataccurateandreplicablebearingscanbetaken.
Dbh tapes are critical when making tree measurements.Steel or aluminum dbh tapes are normally used. Cloth
�. f I e L d m e a S u r e m e n t S
– compass for measuring bearings
– Fibreglass metre tapes (100m and 30m) for measuring distances
– global Positioning System (gPS) for locating plots
– Plot centre marker (rebar/PVc tubing) for marking plots
– Metal detector for locating belowground plot markers
– aluminium nail and number tags for marking trees
– tree diameter at breast height (dbh) tape for measuring trees
– clinometers (percent scale) for measuring tree height and slope
– coloured rope and pegs or a digital for marking plot boundaries measuring device (dME)
– 100m line or two 50m lines for measuring dead wood
– calipers for measuring dead wood
– hand saw for collecting dead wood samples and
cutting destructive samples
– Spring scales (1kg and 300g) for weighing destructive samples
– Large plastic sheets for mixing forest floor/understory sample
– Soil sampling probes for sampling soil
– Rubber mallet for inserting soil probes
– cloth (for example, tyrek) or paper bags for collecting soil and understory samples
ones shouldbe avoidedas they can stretch and result ininaccuratemeasurements. Dbh tapes are relatively inex-pensive and are readily available from suppliers such as:www.forestry-suppliers.com or www.benmeadows.com.
Forcollectingsoilsamples,clothbagsarepreferredaspaperoneshave a tendency to rip.Donotuseplasticbags, astheydonotallowforthesamplestodry,whichcanresultinincreasedrespirationandinaccurateresults.
S o u r c e b o o k f o r L a n d u S e , L a n d - u S e c h a n g e a n d f o r e S t r y P r o j e c t S 1 � S o u r c e b o o k f o r L a n d u S e , L a n d - u S e c h a n g e a n d f o r e S t r y P r o j e c t S1 �
�.2. trees, Palms and Lianas
7.2.1. Trees
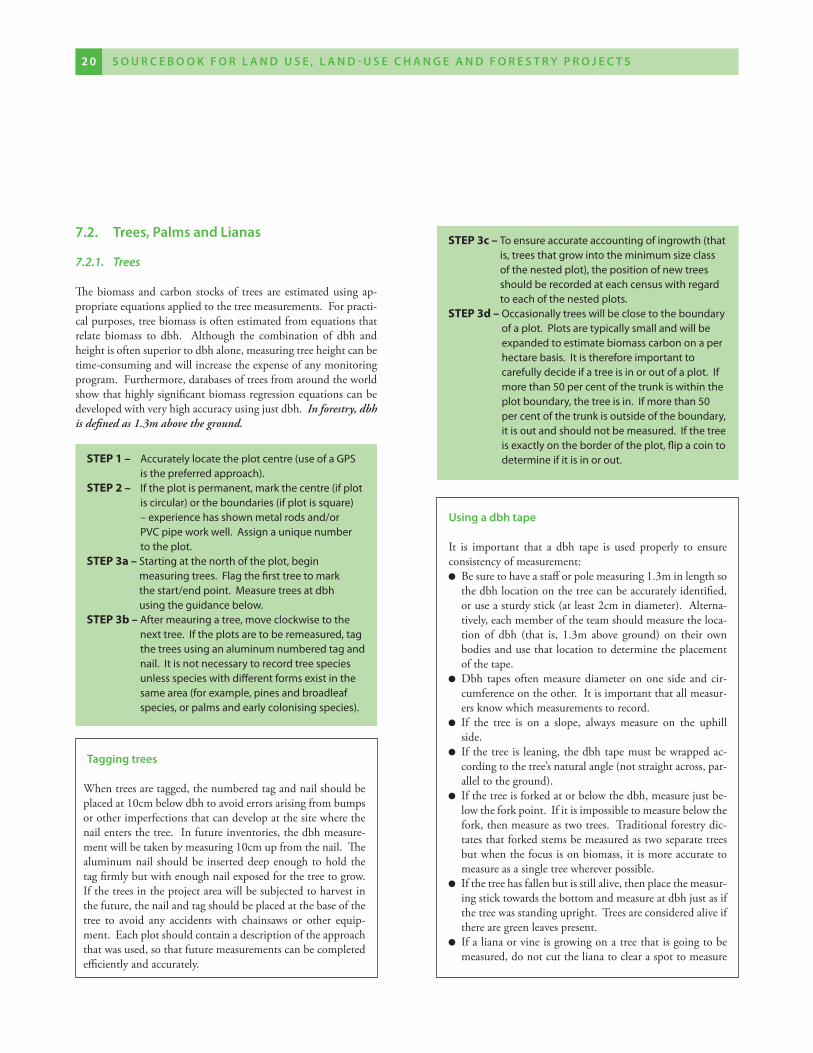
Thebiomass andcarbon stocksof trees are estimatedusing ap-propriateequationsappliedtothetreemeasurements.Forpracti-calpurposes,treebiomassisoftenestimatedfromequationsthatrelate biomass to dbh. Although the combination of dbh andheightisoftensuperiortodbhalone,measuringtreeheightcanbetime-consumingandwillincreasetheexpenseofanymonitoringprogram.Furthermore,databasesoftreesfromaroundtheworldshowthathighlysignificantbiomassregressionequationscanbedevelopedwithveryhighaccuracyusingjustdbh.In forestry, dbh is defined as 1.3m above the ground.
using a dbh tape
It is important that a dbh tape is used properly to ensureconsistencyofmeasurement:
Besuretohaveastafforpolemeasuring1.3minlengthsothedbhlocationonthetreecanbeaccuratelyidentified,oruseasturdystick(atleast2cmindiameter).Alterna-tively,eachmemberoftheteamshouldmeasuretheloca-tion of dbh (that is, 1.3m above ground) on their ownbodiesandusethatlocationtodeterminetheplacementofthetape.
Dbh tapesoftenmeasurediameteronone side andcir-cumferenceontheother.Itisimportantthatallmeasur-ersknowwhichmeasurementstorecord.
If the tree is on a slope, always measure on the uphillside.
Ifthetreeis leaning,thedbhtapemustbewrappedac-cordingtothetree’snaturalangle(notstraightacross,par-alleltotheground).
Ifthetreeisforkedatorbelowthedbh,measurejustbe-lowtheforkpoint.Ifitisimpossibletomeasurebelowthefork,thenmeasureastwotrees.Traditionalforestrydic-tatesthatforkedstemsbemeasuredastwoseparatetreesbutwhenthefocusisonbiomass,itismoreaccuratetomeasureasasingletreewhereverpossible.
Ifthetreehasfallenbutisstillalive,thenplacethemeasur-ingsticktowardsthebottomandmeasureatdbhjustasifthetreewasstandingupright.Treesareconsideredaliveiftherearegreenleavespresent.
Ifalianaorvineisgrowingonatreethatisgoingtobemeasured,donotcutthelianatoclearaspottomeasure
STEP 1 – accurately locate the plot centre (use of a gPS is the preferr ed approach).
STEP 2 – If the plot is permanent, mark the centre (if plot is circular) or the boundaries (if plot is square) – experience has shown metal rods and/or PVc pipe work well. assign a unique number to the plot.
STEP 3a – Starting at the north of the plot, begin measuring trees. Flag the first tree to mark the start/end point. Measure trees at dbh using the guidance below.
STEP 3b – after meauring a tree, move clockwise to the next tree. If the plots are to be remeasured, tag the trees using an aluminum numbered tag and nail. It is not necessary to record tree species unless species with different forms exist in the same area (for example, pines and broadleaf species, or palms and early colonising species).
tagging trees
Whentreesaretagged,thenumberedtagandnailshouldbeplacedat10cmbelowdbhtoavoiderrorsarisingfrombumpsorotherimperfectionsthatcandevelopatthesitewherethenailentersthetree.Infutureinventories,thedbhmeasure-mentwillbetakenbymeasuring10cmupfromthenail.Thealuminumnail shouldbe inserteddeepenoughtoholdthetagfirmlybutwithenoughnailexposedforthetreetogrow.Ifthetreesintheprojectareawillbesubjectedtoharvestinthefuture,thenailandtagshouldbeplacedatthebaseofthetree to avoid any accidents with chainsaws or other equip-ment.Eachplotshouldcontainadescriptionoftheapproachthatwasused,sothatfuturemeasurementscanbecompletedefficientlyandaccurately.
STEP 3c – to ensure accurate accounting of ingrowth (that is, trees that grow into the minimum size class of the nested plot), the position of new trees should be recorded at each census with regard to each of the nested plots.
STEP 3d – occasionally trees will be close to the boundary of a plot. Plots are typically small and will be expanded to estimate biomass carbon on a per hectare basis. It is therefore important to carefully decide if a tree is in or out of a plot. If more than 50 per cent of the trunk is within the plot boundary, the tree is in. If more than 50 per cent of the trunk is outside of the boundary, it is out and should not be measured. If the tree is exactly on the border of the plot, flip a coin to determine if it is in or out.
S o u r c e b o o k f o r L a n d u S e , L a n d - u S e c h a n g e a n d f o r e S t r y P r o j e c t S 2 1 S o u r c e b o o k f o r L a n d u S e , L a n d - u S e c h a n g e a n d f o r e S t r y P r o j e c t S2 0
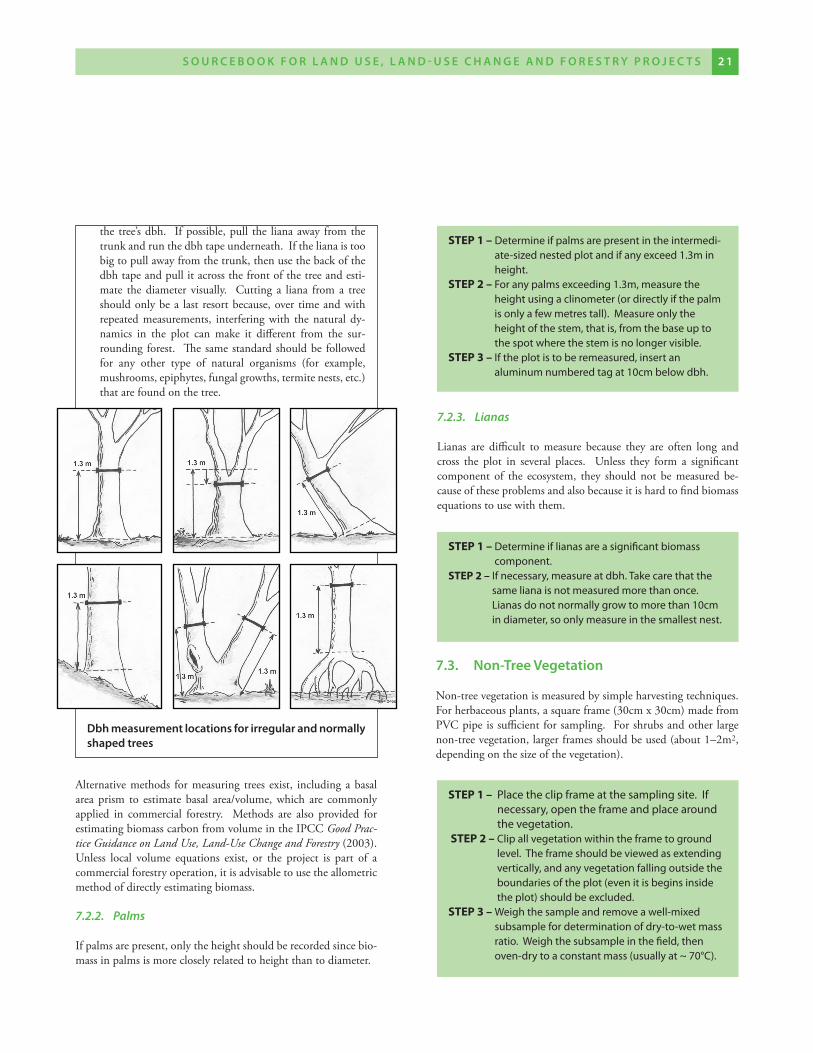
the tree’sdbh. Ifpossible,pull the lianaaway fromthetrunkandrunthedbhtapeunderneath.Ifthelianaistoobigtopullawayfromthetrunk,thenusethebackofthedbhtapeandpullitacrossthefrontofthetreeandesti-mate thediameter visually. Cutting a liana froma treeshouldonlybea lastresortbecause,overtimeandwithrepeatedmeasurements, interferingwith thenaturaldy-namics in the plot can make it different from the sur-rounding forest. Thesamestandardshouldbe followedfor any other type of natural organisms (for example,mushrooms,epiphytes,fungalgrowths,termitenests,etc.)thatarefoundonthetree.
dbh measurement locations for irregular and normally shaped trees
Alternativemethods formeasuring trees exist, includingabasalarea prism to estimate basal area/volume, which are commonlyapplied in commercial forestry. Methods are also provided forestimatingbiomasscarbonfromvolumeintheIPCCGood Prac-tice Guidance on Land Use, Land-Use Change and Forestry (2003).Unless local volume equations exist, or the project is part of acommercialforestryoperation,itisadvisabletousetheallometricmethodofdirectlyestimatingbiomass.
7.2.2. Palms Ifpalmsarepresent,onlytheheightshouldberecordedsincebio-massinpalmsismorecloselyrelatedtoheightthantodiameter.
STEP 1 – determine if palms are present in the intermedi-ate-sized nested plot and if any exceed 1.3m in height.
STEP 2 – For any palms exceeding 1.3m, measure the height using a clinometer (or directly if the palm is only a few metres tall). Measure only the height of the stem, that is, from the base up to the spot where the stem is no longer visible.
STEP 3 – If the plot is to be remeasured, insert an aluminum numbered tag at 10cm below dbh.
7.2.3. Lianas
Lianas are difficult to measure because they are often long andcross the plot in several places. Unless they form a significantcomponent of the ecosystem, they shouldnotbemeasuredbe-causeoftheseproblemsandalsobecauseitishardtofindbiomassequationstousewiththem.
�.�. non-tree vegetation
Non-treevegetationismeasuredbysimpleharvestingtechniques.Forherbaceousplants,asquareframe(30cmx30cm)madefromPVCpipeissufficientforsampling. Forshrubsandotherlargenon-treevegetation,largerframesshouldbeused(about1–2m2,dependingonthesizeofthevegetation).
STEP 1 – determine if lianas are a significant biomass component.
STEP 2 – If necessary, measure at dbh. take care that the same liana is not measured more than once. Lianas do not normally grow to more than 10cm in diameter, so only measure in the smallest nest.
STEP 1 – Place the clip frame at the sampling site. If necessary, open the frame and place around the vegetation.
STEP 2 – clip all vegetation within the frame to ground level. the frame should be viewed as extending vertically, and any vegetation falling outside the boundaries of the plot (even it is begins inside the plot) should be excluded.
STEP 3 – Weigh the sample and remove a well-mixed subsample for determination of dry-to-wet mass ratio. Weigh the subsample in the field, then oven-dry to a constant mass (usually at ~ 70°c).
S o u r c e b o o k f o r L a n d u S e , L a n d - u S e c h a n g e a n d f o r e S t r y P r o j e c t S 2 1 S o u r c e b o o k f o r L a n d u S e , L a n d - u S e c h a n g e a n d f o r e S t r y P r o j e c t S2 0
�.�. dead Wood
7.4.1. Standing dead wood
Withinplotsdelineatedforlivetrees,standingdeadtreesshouldalsobemeasured.Thedbhanddecompositionstateofthedeadtreeshouldberecorded.Decompositionclassesforstandingdeadwoodaredefinedpracticallyasfollows:
1.Treewithbranchesandtwigsandresemblesalivetree(exceptforleaves);
2.Treewithnotwig,butwithpersistentsmallandlargebranches;
3.Treewithlargebranchesonly; 4.Bole(trunk)only,nobranches.
Forclasses2,3and4,theheightofthetreeandthediameteratground level should be measured and the diameter at the topshouldbeestimated.Heightcanbemeasuredusingaclinometer.
Topdiametercanbeestimatedusingarelascopeorthroughtheuseofatransparentmeasuringruler.Holdtherulerapproximate-ly10–20cmfromyoureyeandrecordtheapparentdiameterofthetopofthetree.Thetruediameteristhenequalto:
Distancecanalsobeeffectivelymeasuredwithalaserrangefinder.
7.4.2. Downed dead wood
Lyingdeadwoodismostefficientlymeasuredusingtheline-inter-sectmethod[7, 8].Onlycoarsedeadwood(woodwithadiameter>10cm)ismeasuredwiththismethod–deadwoodwithasmall-erdiameterismeasuredwithlitter.
STEP 1 – Lay out two lines of 50m either in a single line or at right angles.
STEP 2 – along the length of the lines, measure the diameter of each intersecting piece of coarse dead wood (> 10cm diameter). calipers work best for measuring the diameter. a piece of dead wood should only be measured if: (a) more than 50 per cent of the log is aboveground and (b) the sampling line crosses through at least 50 per cent of the diameter of the piece. If the log is hollow at the intersection point, measure the diameter of the hollow; the hollow portion in the volume estimates is excluded.
STEP 3 – assign each piece of dead wood to one of three density classes – sound, intermediate or rotten. to determine what density class a piece of dead wood fits into, each piece should be struck with a saw or machete. If the blade does not sink into the piece (that is, it bounces off), it is classified as sound. If it sinks partly into the piece and there has been some wood loss, it is classified as intermediate. If the blade sinks into the piece, there is more extensive wood loss and the piece is crumbly, it is classified as rotten.
STEP 4 – Representative dead wood samples of the three density classes, representing the range of species present, should be collected for density (dry weight per green volume) determination. using a chainsaw or a hand saw, cut a complete disc from the selected piece of dead wood. the average diameter and thickness of the disc should be measured to estimate volume. the fresh weight of the disc does not have to be recorded. the disc should be oven-dried to a constant weight.
�.5. forest floor (Litter Layer)
Theforestfloor,orlitterlayer,isdefinedasalldeadorganicsurfacematerialontopofthemineralsoil.Someofthismaterialwillstillberecognisable(forexample,deadleaves,twigs,deadgrassesandsmallbranches)andsomewillbeunidentifiabledecomposedfrag-mentsoforganicmaterial.Notethatdeadwoodwithadiameteroflessthan10cmisincludedinthelitterlayer.
Littershouldbesampledattheidenticaltimeofyearateachcen-sustoeliminateseasonaleffects.Asquareframe(30cmx30cm)madefromPVCpipeissuitableforsampling.
STEP 1 – Place the sampling frame at the sample site. STEP 2 - collect all the litter inside the frame. a knife can
be used to cut pieces that fall on the border of the frame. Place all the litter on a tarpaulin beside the frame.
STEP 3a – Weigh the sample on-site, then oven-dry to a constant weight.
STEP 3b – Where sample bulk is excessive, the fresh weight of the total sample should be recorded in the field, and a subsample of manageable size (approximately 80–100g) taken for moisture content determination, from which the total dry mass can be calculated.
S o u r c e b o o k f o r L a n d u S e , L a n d - u S e c h a n g e a n d f o r e S t r y P r o j e c t S 2 � S o u r c e b o o k f o r L a n d u S e , L a n d - u S e c h a n g e a n d f o r e S t r y P r o j e c t S2 2
true diameter (m) Odistance eye to tree (m)
distance eye to ruler (m) x Ruler measurement (m)
�.�. Soil
Toobtainanaccurateinventoryoforganiccarbonstocksinmin-eralororganicsoil,threetypesofvariablesmustbemeasured:(1)depth,(2)bulkdensity(calculatedfromtheoven-driedweightofsoilfromaknownvolumeofsampledmaterial),and(3)thecon-centrationsoforganiccarbonwithinthesample.Forconvenienceand cost-efficiency, it is advised to sample to a constant depth,maintainingaconstantsamplevolumeratherthanmass.A30cmprobeisaneffectivemeasurementtool.
STEP 1 – Steadily insert the soil probe to a 30cm depth. If the soil is compacted, use a rubber mallet to fully insert. If the probe will not penetrate to the full depth, do not force it as it is likely a stone is blocking its route and, if forced, the probe will be damaged. Instead, withdraw the probe, clean out any collected soil and insert in a new location.
STEP 2 – carefully extract the probe and place the sample into a cloth bag. Because the carbon concentra-tion of organic materials is much higher than that of the mineral soil, including even a small amount of surface material can result in a serious overestimation of soil carbon stocks.
STEP 3 – to reduce variability, aggregate four samples from each collection point for carbon concentra-tion analysis.
STEP 4 – at each sampling point, take two additional aggregated cores for determination of bulk density. When taking cores for measurements of bulk density, care should be taken to avoid any loss of soil from the cores.
STEP 5 - Soil samples can be sent to a professional laboratory for analysis. commercial laboratories exist throughout the world and routinely analyse plant and soil samples using standard techniques. It is recommended the selected laboratory be checked to ensure they follow commonly accepted standard procedures with respect to sample preparation (for example, mixing and sieving), drying temperatures and carbon analysis methods.
For bulk density determination, ensure the laboratory dries the samples in an oven at 105°c for a minimum of 48 hours. If the soil contains coarse, rocky fragments, the coarse fragments must be retained and weighed. For soil carbon determination, the material is sieved through a 2mm sieve
and then thoroughly mixed. the well-mixed sample should not be oven-dried for the carbon analysis, but only air-dried; however, the carbon concentration does need to be expressed on an oven dry basis at 105°c. the dry combus-tion method using a controlled-temperature furnace (for example, a LEco chN-2000 or equivalent) is the recom-mended method for determining total soil carbon [9] but the Walkley-Black method is also commonly used.
S o u r c e b o o k f o r L a n d u S e , L a n d - u S e c h a n g e a n d f o r e S t r y P r o j e c t S 2 � S o u r c e b o o k f o r L a n d u S e , L a n d - u S e c h a n g e a n d f o r e S t r y P r o j e c t S2 2
Mostcalculationsdeterminevaluesforthebiomassofaparticularcarbonpool (except for soil,whichusuallymeasurescarbondi-rectly). It iscommonpracticetoconvertbiomasstocarbonbydividingbytwo:
However,iflocalvaluesforthecarboncontentareavailable,usetheseinstead.TheCDMExecutiveBoardmay,inthefuture,re-quirelocalmeasurementsofmeancarboncontent.
Extrapolatingcarbonstocksfromaperplotbasistoaperhectarebasisrequirestheuseofexpansionfactors,whichindicatetheareaeachsamplerepresents. Thisstandardisation is requiredso thatresultscanbeeasilyinterpretedandalsocomparedtootherstud-ies.Thefirststepistocorrectforslopesothatallcarbonvaluesarereportedonahorizontalprojection.
Truehorizontalradiusiscalculatedusingtheformula:
Where:L = the true horizontal plot radius, Ls = the standard radius measured in the field along the slope, S = the slope in degrees, and cos = the cosine of the angle.
Correctingforslopeafterreturningfromthefieldresultsinaplotofarea:
Circular Plot: Area=πxstandardradius(Ls)xslopeplotradius(L)
Rectangular Plot: Area=Plotwidthxcalculatedtrueplotlength(L)
�. a n a LyS I S
�.1. Live tree biomass
Biomassequationsrelatedbhtobiomass.Equationsmaybeforindividual species or groups of species, but this literature isinconsistentandincomplete.Beforeapplyingabiomassequation,consideritsoriginallocation,becausetreesinasimilarfunctionalgroupcandiffergreatlyintheirgrowthformbetweengeographicareas.
Whenmakingbiomasscalculations,thegivenmaximumdiameterfortheequationshouldbecarefullyobserved.Usingequationsfortreesthatexceedthemaximumdiameterscanleadtosubstantialerror(see[10]forideasonhowtoaddresstheproblemoftreesthatexceedthesizelimitofthedatabase).
Thebiomassequationshouldbeverifiedfortheprojectsite.Thiscanbedone simplisticallyby estimating thevolumeof the treestem(seeSections7.4.1and8.4),usingastandardfactorof1.2toincludethevolumeofbranches,andmultiplyingbywooddensityto attainbiomass. Wooddensity values formost commerciallyimportantspeciesaregenerallyavailable(see[10])ordensitycanbemeasuredsimply.Thebiomassequationcanbeverifiedthroughcomparisonwithestimationsfromarangeoftreesizes.
Theimportanceofselectinganappropriateequationcanbeseenfromthefollowingexample.InAppendixC,twobiomassequa-tionsarelistedforpinesintheUSA–oneforpinesinthewestandoneforpinesintheeast.Fora50cmdbhtree,thewesternequa-tionproducesabiomassestimateof1.1tonnes,whiletheeasternequationestimates1.6tonnes.A1cmincrementfrom50cmto51cmdbhresultsinabiomassincrementof54kgforthewesternequationand77kgfortheeasternequation.
STEP 1 – Search for a suitable biomass equation. Either use equations presented here (see appendix c), search the literature for equations, consult with experts (perhaps in local universities or govern-ment forestry departments) or create new equations (see appendix B).
STEP 2 – For each tree, calculate biomass using the chosen equation.
S o u r c e b o o k f o r L a n d u S e , L a n d - u S e c h a n g e a n d f o r e S t r y P r o j e c t S 2 5 S o u r c e b o o k f o r L a n d u S e , L a n d - u S e c h a n g e a n d f o r e S t r y P r o j e c t S2 �
carbon OBiomass
2
L = Ls x cos S
Expansion factor O10,000m2
area of plot, frame or soil core (m2)
Forexample,fora20mradiusplotonaslopeof25degrees:Ls=20x0.91or18.1m(0.91=cos25).Thus,theplotarea=3.142x20x18.1=0.11ha.
Fora25msquareplotonaslopeof15degrees:Ls=25x0.97or24.1m(0.97=cos15).Thus,theareaoftheplot=25x24.1=0.06ha.
Allexpansionfactorsreferredtofromthispointonareassumedtouse the slope-correctedareaof theplot.Theexpansion factor iscalculatedastheareaofahectareinsquaremetresdividedbytheareaofthesampleinsquaremetres,thatis:
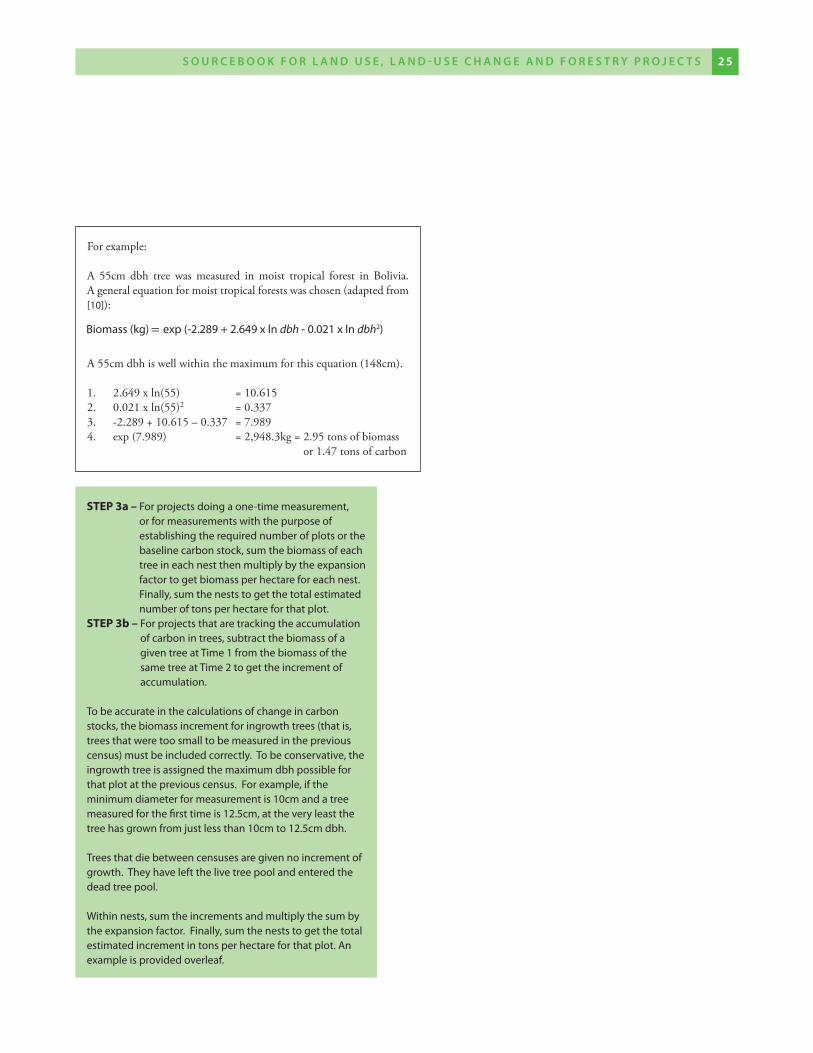
Forexample:
A 55cm dbh tree was measured in moist tropical forest in Bolivia. Ageneralequationformoisttropicalforestswaschosen(adaptedfrom[10]):
A55cmdbhiswellwithinthemaximumforthisequation(148cm).
1. 2.649xln(55) =10.6152. 0.021xln(55)2 =0.3373. -2.289+10.615–0.337 =7.9894. exp(7.989) =2,948.3kg=2.95tonsofbiomass
or1.47tonsofcarbon
STEP 3a – For projects doing a one-time measurement, or for measurements with the purpose of establishing the required number of plots or the baseline carbon stock, sum the biomass of each tree in each nest then multiply by the expansion factor to get biomass per hectare for each nest. Finally, sum the nests to get the total estimated number of tons per hectare for that plot.
STEP 3b – For projects that are tracking the accumulation of carbon in trees, subtract the biomass of a given tree at time 1 from the biomass of the same tree at time 2 to get the increment of accumulation.
to be accurate in the calculations of change in carbon stocks, the biomass increment for ingrowth trees (that is, trees that were too small to be measured in the previous census) must be included correctly. to be conservative, the ingrowth tree is assigned the maximum dbh possible for that plot at the previous census. For example, if the minimum diameter for measurement is 10cm and a tree measured for the first time is 12.5cm, at the very least the tree has grown from just less than 10cm to 12.5cm dbh.
trees that die between censuses are given no increment of growth. they have left the live tree pool and entered the dead tree pool.
Within nests, sum the increments and multiply the sum by the expansion factor. Finally, sum the nests to get the total estimated increment in tons per hectare for that plot. an example is provided overleaf.
Biomass (kg) O exp (-2.289 + 2.649 x ln dbh - 0.021 x ln dbh2)
S o u r c e b o o k f o r L a n d u S e , L a n d - u S e c h a n g e a n d f o r e S t r y P r o j e c t S 2 5 S o u r c e b o o k f o r L a n d u S e , L a n d - u S e c h a n g e a n d f o r e S t r y P r o j e c t S2 �
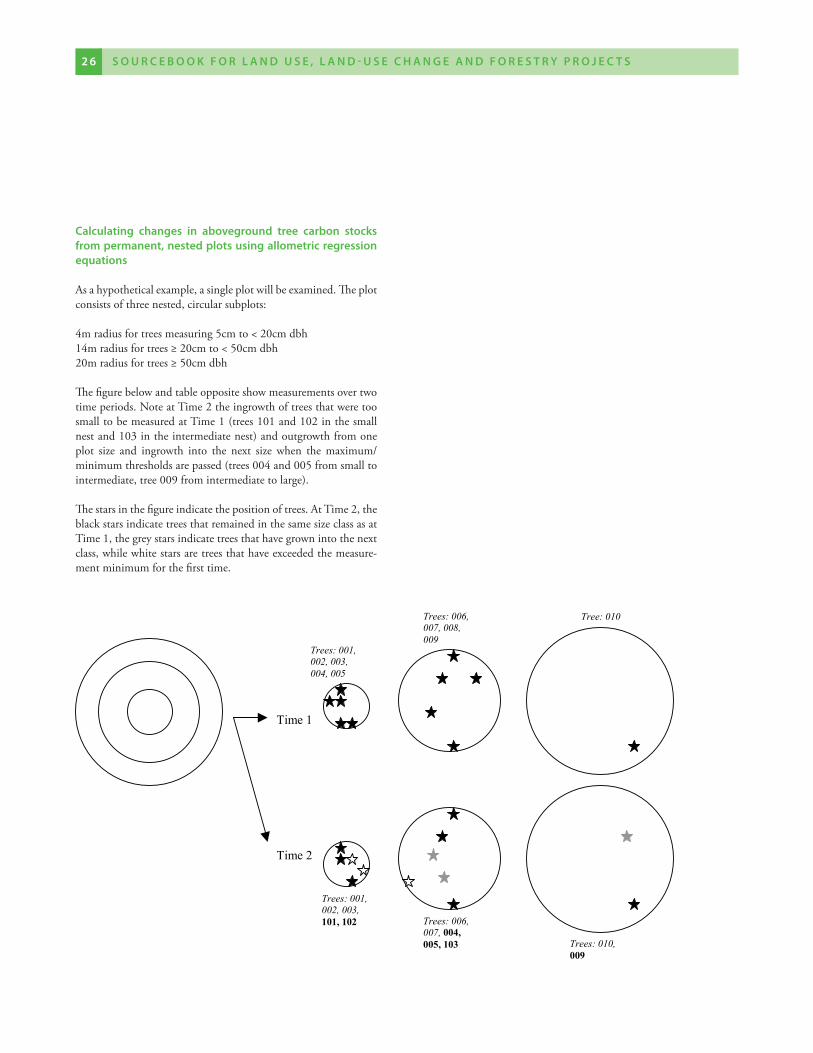
calculating changes in aboveground tree carbon stocks from permanent, nested plots using allometric regression equations
Asahypotheticalexample,asingleplotwillbeexamined.Theplotconsistsofthreenested,circularsubplots:
4mradiusfortreesmeasuring5cmto<20cmdbh14mradiusfortrees≥20cmto<50cmdbh20mradiusfortrees≥50cmdbh
Thefigurebelowandtableoppositeshowmeasurementsovertwotimeperiods.NoteatTime2theingrowthoftreesthatweretoosmalltobemeasuredatTime1(trees101and102inthesmallnestand103intheintermediatenest)andoutgrowthfromoneplot size and ingrowth into the next size when the maximum/minimumthresholdsarepassed(trees004and005fromsmalltointermediate,tree009fromintermediatetolarge).
Thestarsinthefigureindicatethepositionoftrees.AtTime2,theblackstarsindicatetreesthatremainedinthesamesizeclassasatTime1,thegreystarsindicatetreesthathavegrownintothenextclass,whilewhitestarsaretreesthathaveexceededthemeasure-mentminimumforthefirsttime.
Trees: 001, 002, 003, 004, 005
Trees: 006, 007, 008, 009
Tree: 010
Time 1
Time 2
Trees: 001, 002, 003, 101, 102 Trees: 006,
007, 004, 005, 103 Trees: 010,
009
S o u r c e b o o k f o r L a n d u S e , L a n d - u S e c h a n g e a n d f o r e S t r y P r o j e c t S 2 � S o u r c e b o o k f o r L a n d u S e , L a n d - u S e c h a n g e a n d f o r e S t r y P r o j e c t S2 �
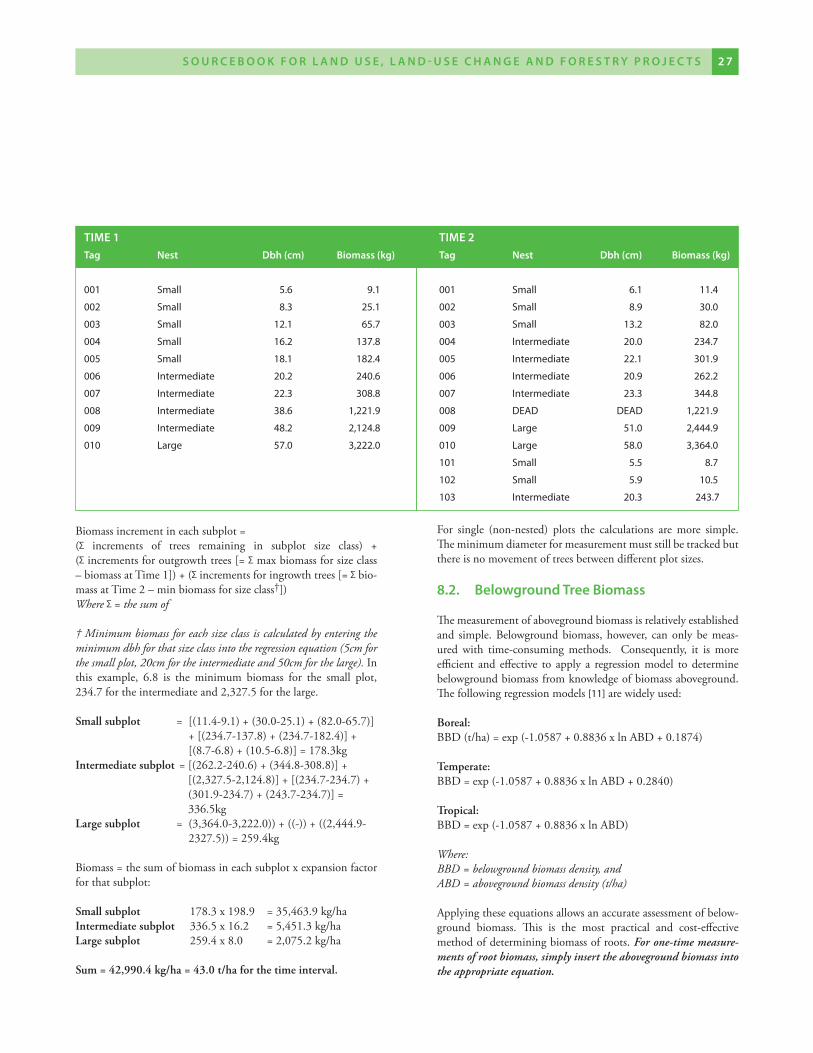
Biomassincrementineachsubplot=( increments of trees remaining in subplot size class) +( incrementsforoutgrowthtrees[= maxbiomassforsizeclass–biomassatTime1])+( incrementsforingrowthtrees[= bio-massatTime2–minbiomassforsizeclass†])Where = the sum of
† Minimum biomass for each size class is calculated by entering the minimum dbh for that size class into the regression equation (5cm for the small plot, 20cm for the intermediate and 50cm for the large). Inthis example, 6.8 is the minimum biomass for the small plot,234.7fortheintermediateand2,327.5forthelarge.
Small subplot =[(11.4-9.1)+(30.0-25.1)+(82.0-65.7)]+[(234.7-137.8)+(234.7-182.4)]+[(8.7-6.8)+(10.5-6.8)]=178.3kg
Intermediate subplot=[(262.2-240.6)+(344.8-308.8)]+[(2,327.5-2,124.8)]+[(234.7-234.7)+(301.9-234.7)+(243.7-234.7)]=336.5kg
Large subplot =(3,364.0-3,222.0))+((-))+((2,444.9-2327.5))=259.4kg
Biomass=thesumofbiomassineachsubplotxexpansionfactorforthatsubplot:
Small subplot 178.3x198.9 =35,463.9kg/haIntermediate subplot 336.5x16.2 =5,451.3kg/haLarge subplot 259.4x8.0 =2,075.2kg/ha
Sum = 42,990.4 kg/ha = 43.0 t/ha for the time interval.
For single (non-nested) plots the calculations are more simple.Theminimumdiameterformeasurementmuststillbetrackedbutthereisnomovementoftreesbetweendifferentplotsizes.
�.2. belowground tree biomass
Themeasurementofabovegroundbiomassisrelativelyestablishedand simple.Belowgroundbiomass,however, canonlybemeas-ured with time-consuming methods. Consequently, it is moreefficient and effective to apply a regressionmodel todeterminebelowgroundbiomassfromknowledgeofbiomassaboveground.Thefollowingregressionmodels[11]arewidelyused:
Boreal:BBD(t/ha)=exp(-1.0587+0.8836xlnABD+0.1874)
Temperate:BBD=exp(-1.0587+0.8836xlnABD+0.2840)
Tropical:BBD=exp(-1.0587+0.8836xlnABD)
Where: BBD = belowground biomass density, and ABD = aboveground biomass density (t/ha)
Applyingtheseequationsallowsanaccurateassessmentofbelow-ground biomass. This is the most practical and cost-effectivemethodofdeterminingbiomassofroots.For one-time measure-ments of root biomass, simply insert the aboveground biomass into the appropriate equation.
tIme 1 tIme 2
tag nest dbh (cm) biomass (kg) tag nest dbh (cm) biomass (kg)
001 Small 5.6 9.1 001 Small 6.1 11.4
002 Small 8.3 25.1 002 Small 8.9 30.0
003 Small 12.1 65.7 003 Small 13.2 82.0
004 Small 16.2 137.8 004 Intermediate 20.0 234.7
005 Small 18.1 182.4 005 Intermediate 22.1 301.9
006 Intermediate 20.2 240.6 006 Intermediate 20.9 262.2
007 Intermediate 22.3 308.8 007 Intermediate 23.3 344.8
008 Intermediate 38.6 1,221.9 008 dEad dEad 1,221.9
009 Intermediate 48.2 2,124.8 009 Large 51.0 2,444.9
010 Large 57.0 3,222.0 010 Large 58.0 3,364.0
101 Small 5.5 8.7
102 Small 5.9 10.5
103 Intermediate 20.3 243.7
S o u r c e b o o k f o r L a n d u S e , L a n d - u S e c h a n g e a n d f o r e S t r y P r o j e c t S 2 � S o u r c e b o o k f o r L a n d u S e , L a n d - u S e c h a n g e a n d f o r e S t r y P r o j e c t S2 �
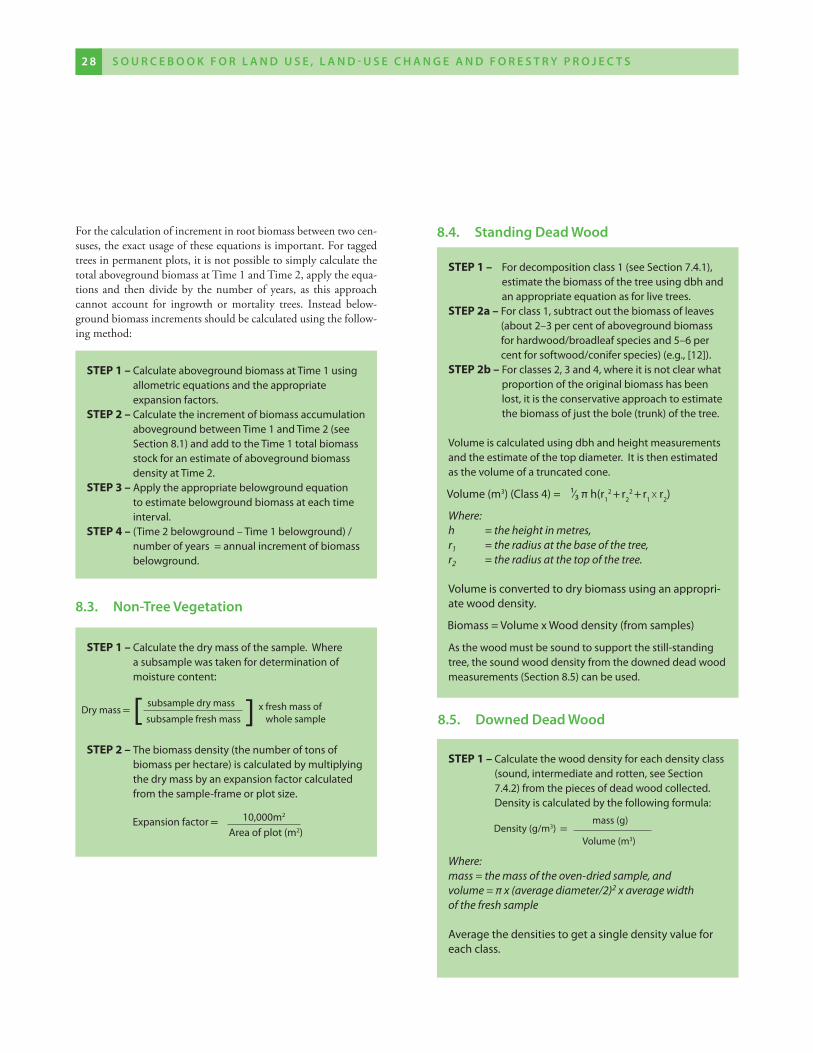
Forthecalculationofincrementinrootbiomassbetweentwocen-suses,theexactusageoftheseequationsisimportant.Fortaggedtreesinpermanentplots,itisnotpossibletosimplycalculatethetotalabovegroundbiomassatTime1andTime2,applytheequa-tions and thendivideby thenumberofyears, as this approachcannot account for ingrowth or mortality trees. Instead below-groundbiomassincrementsshouldbecalculatedusingthefollow-ingmethod:
STEP 1 – calculate aboveground biomass at time 1 using allometric equations and the appropriate expansion factors.
STEP 2 – calculate the increment of biomass accumulation aboveground between time 1 and time 2 (see Section 8.1) and add to the time 1 total biomass stock for an estimate of aboveground biomass density at time 2.
STEP 3 – apply the appropriate belowground equation to estimate belowground biomass at each time interval.
STEP 4 – (time 2 belowground – time 1 belowground) / number of years = annual increment of biomass belowground.
�.�. non-tree vegetation
�.�. Standing dead Wood
STEP 1 – For decomposition class 1 (see Section 7.4.1), estimate the biomass of the tree using dbh and an appropriate equation as for live trees.
STEP 2a – For class 1, subtract out the biomass of leaves (about 2–3 per cent of aboveground biomass for hardwood/broadleaf species and 5–6 per cent for softwood/conifer species) (e.g., [12]).
STEP 2b – For classes 2, 3 and 4, where it is not clear what proportion of the original biomass has been lost, it is the conservative approach to estimate the biomass of just the bole (trunk) of the tree.
Volume is calculated using dbh and height measurements and the estimate of the top diameter. It is then estimated as the volume of a truncated cone.
Where:h = the height in metres, r1 = the radius at the base of the tree,r2 = the radius at the top of the tree.
Volume is converted to dry biomass using an appropri-ate wood density.
as the wood must be sound to support the still-standing tree, the sound wood density from the downed dead wood measurements (Section 8.5) can be used.
�.5. downed dead Wood
STEP 1 – calculate the wood density for each density class (sound, intermediate and rotten, see Section 7.4.2) from the pieces of dead wood collected. density is calculated by the following formula:
Where: mass = the mass of the oven-dried sample, and volume = π x (average diameter/2)2 x average width of the fresh sample
average the densities to get a single density value for each class.
S o u r c e b o o k f o r L a n d u S e , L a n d - u S e c h a n g e a n d f o r e S t r y P r o j e c t S 2 � S o u r c e b o o k f o r L a n d u S e , L a n d - u S e c h a n g e a n d f o r e S t r y P r o j e c t S2 �
STEP 1 – calculate the dry mass of the sample. Where a subsample was taken for determination of moisture content:
STEP 2 – the biomass density (the number of tons of biomass per hectare) is calculated by multiplying the dry mass by an expansion factor calculated from the sample-frame or plot size.
dry mass Osubsample dry mass
subsample fresh massx fresh mass of
whole sample[ ]
Expansion factor O 10,000m2
area of plot (m2)
Volume (m3) (class 4) = ¹⁄₃ π h(r12 + r2
2 + r1 x r2)
Biomass = Volume x Wood density (from samples)
density (g/m3) Omass (g)
Volume (m3)
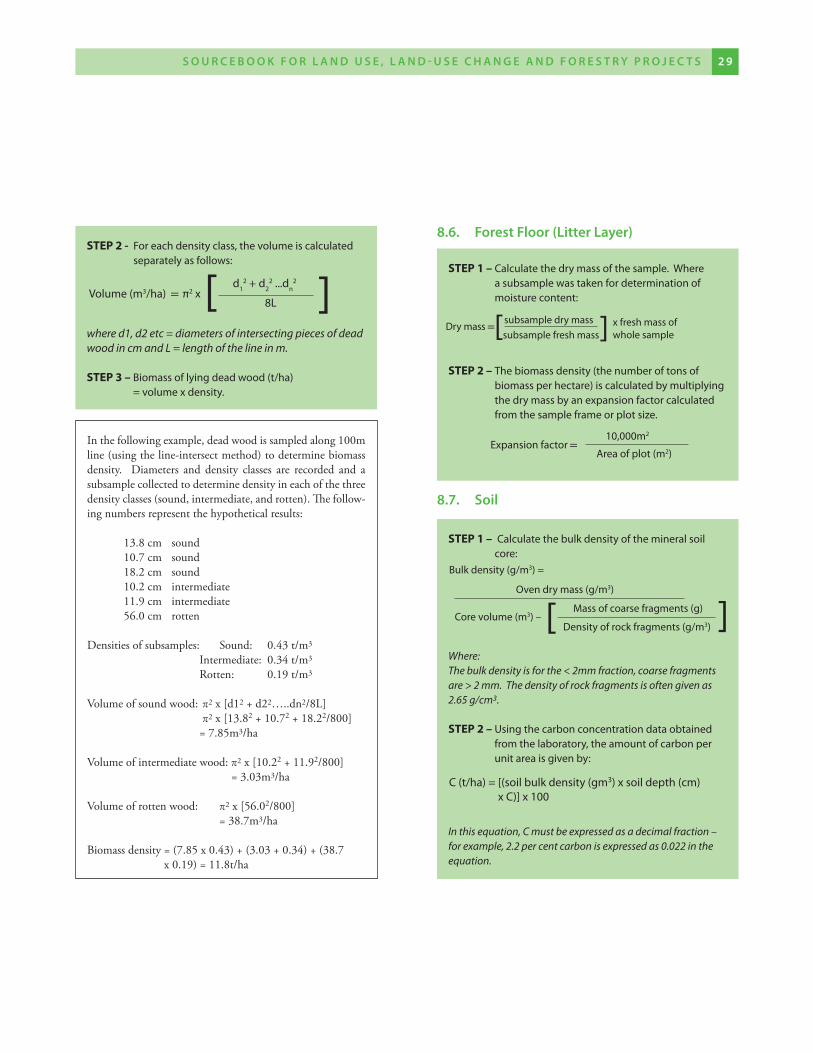
STEP 2 - For each density class, the volume is calculated separately as follows:
where d1, d2 etc = diameters of intersecting pieces of dead wood in cm and L = length of the line in m.
STEP 3 – Biomass of lying dead wood (t/ha) = volume x density.
Inthefollowingexample,deadwoodissampledalong100mline(usingtheline-intersectmethod)todeterminebiomassdensity. Diameters and density classes are recorded and asubsamplecollectedtodeterminedensityineachofthethreedensityclasses(sound,intermediate,androtten).Thefollow-ingnumbersrepresentthehypotheticalresults:
13.8cm sound 10.7cm sound 18.2cm sound 10.2cm intermediate 11.9cm intermediate 56.0cm rotten
Densitiesofsubsamples: Sound: 0.43t/m3 Intermediate: 0.34t/m3 Rotten: 0.19t/m3
Volumeofsoundwood:π2x[d12+d22…..dn2/8L] π2x[13.82+10.72+18.22/800] =7.85m3/ha
Volumeofintermediatewood:π2x[10.22+11.92/800] =3.03m3/ha
Volumeofrottenwood: π2x[56.02/800] =38.7m3/ha
Biomassdensity=(7.85x0.43)+(3.03+0.34)+(38.7x0.19)=11.8t/ha
�.�. forest floor (Litter Layer)
STEP 1 – calculate the dry mass of the sample. Where a subsample was taken for determination of moisture content:
STEP 2 – the biomass density (the number of tons of
biomass per hectare) is calculated by multiplying the dry mass by an expansion factor calculated from the sample frame or plot size.
�.�. Soil
STEP 1 – calculate the bulk density of the mineral soil core:
Where: The bulk density is for the < 2mm fraction, coarse fragments are > 2 mm. The density of rock fragments is often given as 2.65 g/cm3.
STEP 2 – using the carbon concentration data obtained from the laboratory, the amount of carbon per unit area is given by:
In this equation, c must be expressed as a decimal fraction – for example, 2.2 per cent carbon is expressed as 0.022 in the equation.
Volume (m3/ha) O π2 x d1
2 + d22 ...dn
2
8L[ ]dry mass O
subsample dry masssubsample fresh mass
x fresh mass of whole sample[ ]
Expansion factor O10,000m2
area of plot (m2)
Bulk density (g/m3) =
oven dry mass (g/m3)
core volume (m3) –Mass of coarse fragments (g)
density of rock fragments (g/m3)[ ]
c (t/ha) = [(soil bulk density (gm3) x soil depth (cm) x c)] x 100
S o u r c e b o o k f o r L a n d u S e , L a n d - u S e c h a n g e a n d f o r e S t r y P r o j e c t S 2 � S o u r c e b o o k f o r L a n d u S e , L a n d - u S e c h a n g e a n d f o r e S t r y P r o j e c t S2 �
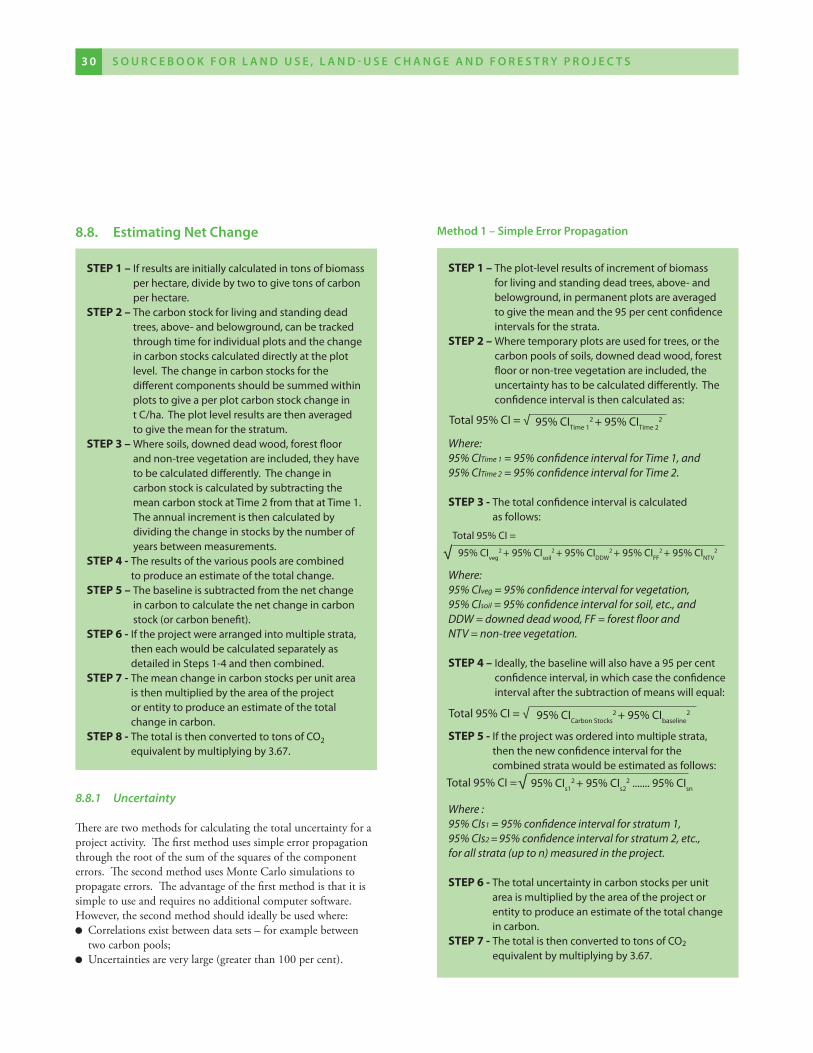
�.�. estimating net change
STEP 1 – If results are initially calculated in tons of biomass per hectare, divide by two to give tons of carbon per hectare.
STEP 2 – the carbon stock for living and standing dead trees, above- and belowground, can be tracked through time for individual plots and the change in carbon stocks calculated directly at the plot level. the change in carbon stocks for the different components should be summed within plots to give a per plot carbon stock change in t c/ha. the plot level results are then averaged to give the mean for the stratum.
STEP 3 – Where soils, downed dead wood, forest floor and non-tree vegetation are included, they have to be calculated differently. the change in carbon stock is calculated by subtracting the mean carbon stock at time 2 from that at time 1. the annual increment is then calculated by dividing the change in stocks by the number of years between measurements.
STEP 4 - the results of the various pools are combined to produce an estimate of the total change.
STEP 5 – the baseline is subtracted from the net change in carbon to calculate the net change in carbon stock (or carbon benefit).
STEP 6 - If the project were arranged into multiple strata, then each would be calculated separately as detailed in Steps 1-4 and then combined.
STEP 7 - the mean change in carbon stocks per unit area is then multiplied by the area of the project or entity to produce an estimate of the total change in carbon.
STEP 8 - the total is then converted to tons of co2 equivalent by multiplying by 3.67.
method 1 – Simple error Propagation
STEP 1 – the plot-level results of increment of biomass for living and standing dead trees, above- and belowground, in permanent plots are averaged to give the mean and the 95 per cent confidence intervals for the strata.
STEP 2 – Where temporary plots are used for trees, or the carbon pools of soils, downed dead wood, forest floor or non-tree vegetation are included, the uncertainty has to be calculated differently. the confidence interval is then calculated as:
Where:95% cITime 1 = 95% confidence interval for Time 1, and 95% cITime 2 = 95% confidence interval for Time 2.
STEP 3 - the total confidence interval is calculated as follows:
Where:95% cIveg = 95% confidence interval for vegetation, 95% cIsoil = 95% confidence interval for soil, etc., and ddW = downed dead wood, FF = forest floor and NTV = non-tree vegetation.
STEP 4 – Ideally, the baseline will also have a 95 per cent confidence interval, in which case the confidence interval after the subtraction of means will equal:
STEP 5 - If the project was ordered into multiple strata, then the new confidence interval for the combined strata would be estimated as follows:
Where :95% cIs1 = 95% confidence interval for stratum 1, 95% cIs2 = 95% confidence interval for stratum 2, etc., for all strata (up to n) measured in the project.
STEP 6 - the total uncertainty in carbon stocks per unit area is multiplied by the area of the project or entity to produce an estimate of the total change in carbon.
STEP 7 - the total is then converted to tons of co2 equivalent by multiplying by 3.67.
S o u r c e b o o k f o r L a n d u S e , L a n d - u S e c h a n g e a n d f o r e S t r y P r o j e c t S � 1 S o u r c e b o o k f o r L a n d u S e , L a n d - u S e c h a n g e a n d f o r e S t r y P r o j e c t S� 0
√
total 95% cI = √ 95% cItime 12 + 95% cItime 2
2
total 95% cI =
95% cIveg2 + 95% cIsoil
2 + 95% cIddW2 + 95% cIFF
2 + 95% cINtV2
total 95% cI = √ 95% cIcarbon Stocks2 + 95% cIbaseline
2
total 95% cI = 95% cIs12 + 95% cIs2
2 ....... 95% cIsn√8.8.1 Uncertainty
Therearetwomethodsforcalculatingthetotaluncertaintyforaprojectactivity.Thefirstmethodusessimpleerrorpropagationthroughtherootofthesumofthesquaresofthecomponenterrors.ThesecondmethodusesMonteCarlosimulationstopropagateerrors.Theadvantageofthefirstmethodisthatitissimpletouseandrequiresnoadditionalcomputersoftware.However,thesecondmethodshouldideallybeusedwhere:
Correlationsexistbetweendatasets–forexamplebetweentwocarbonpools;
Uncertaintiesareverylarge(greaterthan100percent).
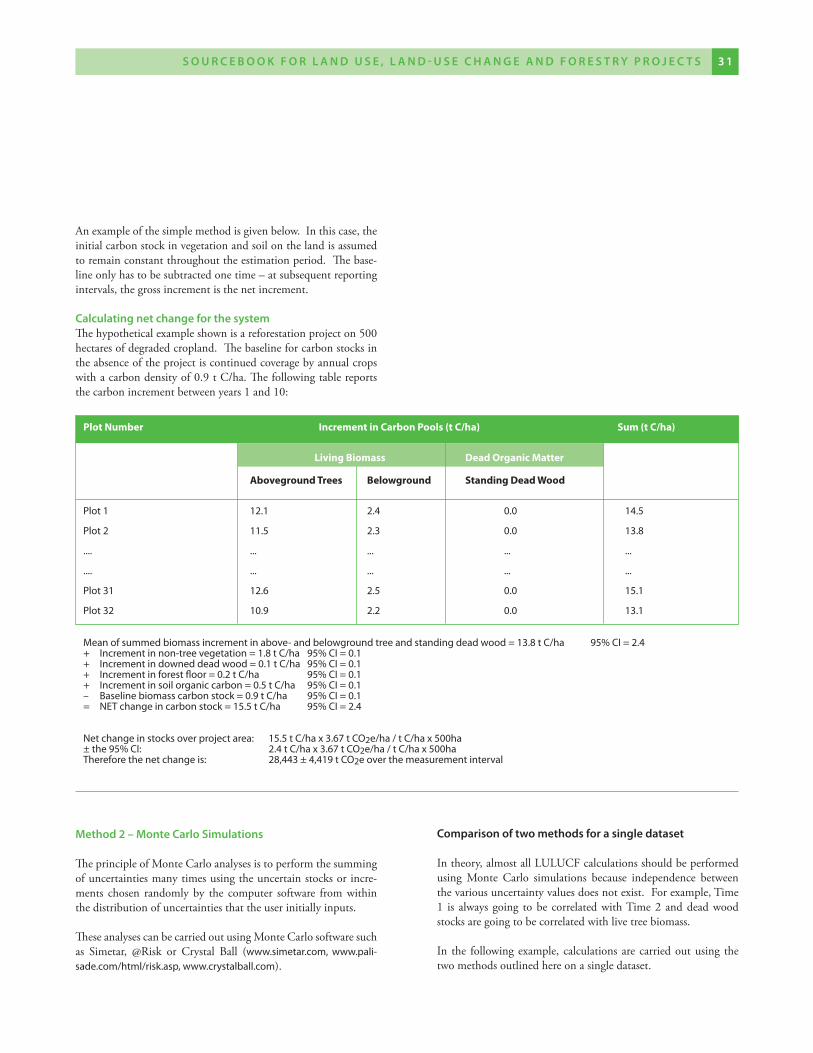
Anexampleofthesimplemethodisgivenbelow.Inthiscase,theinitialcarbonstockinvegetationandsoilonthelandisassumedtoremainconstantthroughouttheestimationperiod.Thebase-lineonlyhastobesubtractedonetime–atsubsequentreportingintervals,thegrossincrementisthenetincrement.
calculating net change for the systemThehypotheticalexampleshownisareforestationprojecton500hectaresofdegradedcropland.Thebaselineforcarbonstocksintheabsenceoftheprojectiscontinuedcoveragebyannualcropswithacarbondensityof0.9tC/ha.Thefollowingtablereportsthecarbonincrementbetweenyears1and10:
S o u r c e b o o k f o r L a n d u S e , L a n d - u S e c h a n g e a n d f o r e S t r y P r o j e c t S � 1 S o u r c e b o o k f o r L a n d u S e , L a n d - u S e c h a n g e a n d f o r e S t r y P r o j e c t S� 0
method 2 – monte carlo Simulations
TheprincipleofMonteCarloanalysesistoperformthesummingofuncertaintiesmanytimesusingtheuncertainstocksorincre-ments chosen randomly by the computer software from withinthedistributionofuncertaintiesthattheuserinitiallyinputs.
TheseanalysescanbecarriedoutusingMonteCarlosoftwaresuchas Simetar, @Risk or Crystal Ball (www.simetar.com, www.pali-sade.com/html/risk.asp, www.crystalball.com).
comparison of two methods for a single dataset
Intheory,almostallLULUCFcalculationsshouldbeperformedusing Monte Carlo simulations because independence betweenthevariousuncertaintyvaluesdoesnotexist.Forexample,Time1 is alwaysgoing tobe correlatedwithTime2 anddeadwoodstocksaregoingtobecorrelatedwithlivetreebiomass.
In the followingexample, calculationsare carriedoutusing thetwomethodsoutlinedhereonasingledataset.
Plot Number Increment in Carbon Pools (t C/ha) Sum (t C/ha)
Living Biomass Dead Organic Matter Aboveground Trees Belowground Standing Dead Wood
Plot 1 12.1 2.4 0.0 14.5
Plot 2 11.5 2.3 0.0 13.8
.... ... ... ... ...
.... ... ... ... ...
Plot 31 12.6 2.5 0.0 15.1
Plot 32 10.9 2.2 0.0 13.1
Mean of summed biomass increment in above- and belowground tree and standing dead wood = 13.8 t c/ha 95% cI = 2.4+ Increment in non-tree vegetation = 1.8 t c/ha 95% cI = 0.1+ Increment in downed dead wood = 0.1 t c/ha 95% cI = 0.1+ Increment in forest floor = 0.2 t c/ha 95% cI = 0.1+ Increment in soil organic carbon = 0.5 t c/ha 95% cI = 0.1– Baseline biomass carbon stock = 0.9 t c/ha 95% cI = 0.1= NEt change in carbon stock = 15.5 t c/ha 95% cI = 2.4
Net change in stocks over project area: 15.5 t c/ha x 3.67 t co2e/ha / t c/ha x 500ha± the 95% cI: 2.4 t c/ha x 3.67 t co2e/ha / t c/ha x 500hatherefore the net change is: 28,443 ± 4,419 t co2e over the measurement interval
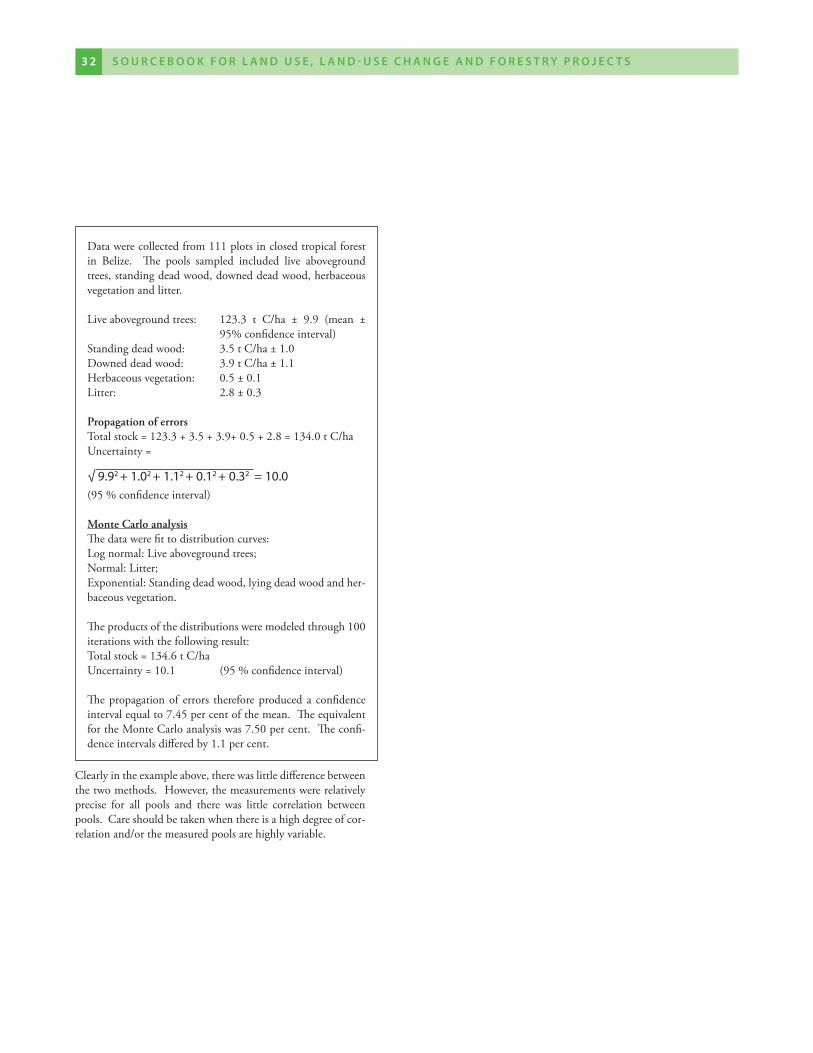
S o u r c e b o o k f o r L a n d u S e , L a n d - u S e c h a n g e a n d f o r e S t r y P r o j e c t S � � S o u r c e b o o k f o r L a n d u S e , L a n d - u S e c h a n g e a n d f o r e S t r y P r o j e c t S� 2
Clearlyintheexampleabove,therewaslittledifferencebetweenthetwomethods.However,themeasurementswererelativelyprecise for all pools and there was little correlation betweenpools.Careshouldbetakenwhenthereisahighdegreeofcor-relationand/orthemeasuredpoolsarehighlyvariable.
√ 9.92 + 1.02 + 1.12 + 0.12 + 0.32 = 10.0
Datawerecollectedfrom111plotsinclosedtropicalforestin Belize. The pools sampled included live abovegroundtrees,standingdeadwood,downeddeadwood,herbaceousvegetationandlitter.
Liveabovegroundtrees: 123.3 t C/ha ± 9.9 (mean ±95%confidenceinterval)
Standingdeadwood: 3.5tC/ha±1.0Downeddeadwood: 3.9tC/ha±1.1Herbaceousvegetation: 0.5±0.1Litter: 2.8±0.3
Propagation of errorsTotalstock=123.3+3.5+3.9+0.5+2.8=134.0tC/haUncertainty=
(95%confidenceinterval)
Monte Carlo analysisThedatawerefittodistributioncurves:Lognormal:Liveabovegroundtrees;Normal:Litter;Exponential:Standingdeadwood,lyingdeadwoodandher-baceousvegetation.
Theproductsofthedistributionsweremodeledthrough100iterationswiththefollowingresult:Totalstock=134.6tC/haUncertainty=10.1 (95%confidenceinterval)
Thepropagationof errors thereforeproduceda confidenceintervalequalto7.45percentofthemean.TheequivalentfortheMonteCarloanalysiswas7.50percent.Theconfi-denceintervalsdifferedby1.1percent.
Other gases influence climate change as directly as CO2. Twogasesrelatedtoland-usechangeactivitiesaremethane(CH4)andnitrousoxide(N2O).Althoughthesegasesareproducedinsmall-er quantities than CO2, their effect for a given mass on globalwarming is greater. This is illustrated by the calculated globalwarmingpotential.Overa100-yearperiod,CH4isexpectedtohaveaglobalwarmingpotentialequal to21times thatofCO2andN2Ohasapotentialequalto310timesthatofCO2[1].Con-sequently,thesegasesneedonlybeproducedinquantitiesequalto4percentand0.3percentrespectivelyofthemassofCO2emit-tedtohaveanequaleffectwithrespecttoclimatechangeover100years.
CH4andN2Oareproducedmainlyastheresultofanthropogenicactivities,suchastheuseofmachinery,fires,thedrainingofwet-landregionsandthefertilisationofland[1].
Methodsforestimatingthesenon-CO2greenhousegasemissionsareprovided in theIPCCGood Practice Guidance for Land Use, Land-Use Change and Forestry [13] and the IPCC Revised 1996 Guidelines for National Greenhouse Gas Inventories [14]. Tier 1methods(themostsimpleones)arepresentedhere–ifanysourc-esarefoundtobesignificant(thatis,morethan1percentofthetotal), then theusers should return consider aTier 2 orTier 3methodology.
�.1 transport and machinery
Methods exist for calculating emissions even underTier 1, butrequirecomplex,variedinputs.Ifgasolineordieselareconsumedheavilyaspartofprojectactivities,thenusersshouldconsultthemethodologyintheIPCCRevised 1996 Guidelines[14].
�.2. fertilisation
Iffertilisersareusedtoenhancetreegrowth,thenN2Oemissionsshouldbeconsidered.
DirectN2Oemissionsfromfertilisation=(FSNxEF1)xCO2EFN
Where:FSN = Annual amount of synthetic fertiliser nitrogen applied
to soilsEF1 = Emission factor for N2O emissions from fertilisation in
unit of N (default value = 1.25 per cent)CO2EFN = CO2 equivalent factor of 310
�. n o n - co 2 g a S e S
�.�. fire
Biomassburningisthegreatestnatural(orsemi-natural)sourceofnon-CO2gasproduction[13].Thequantityreleasedcanbeesti-matedusingemissionfactorsbasedonthequantityofCreleased[13].Fireemissionswouldhavetobeconsideredifsiteprepara-tionforplantinginvolvedprescribedburns.
CH4emissions =Carbonreleasedx0.016xCO2EFMWhere CO2EFM = CO2 equivalent factor of 21
N2Oemissions =Carbonreleasedx0.00011xCO2EFNWhere CO2EFN = CO2 equivalent factor of 310
S o u r c e b o o k f o r L a n d u S e , L a n d - u S e c h a n g e a n d f o r e S t r y P r o j e c t S � � S o u r c e b o o k f o r L a n d u S e , L a n d - u S e c h a n g e a n d f o r e S t r y P r o j e c t S� 2
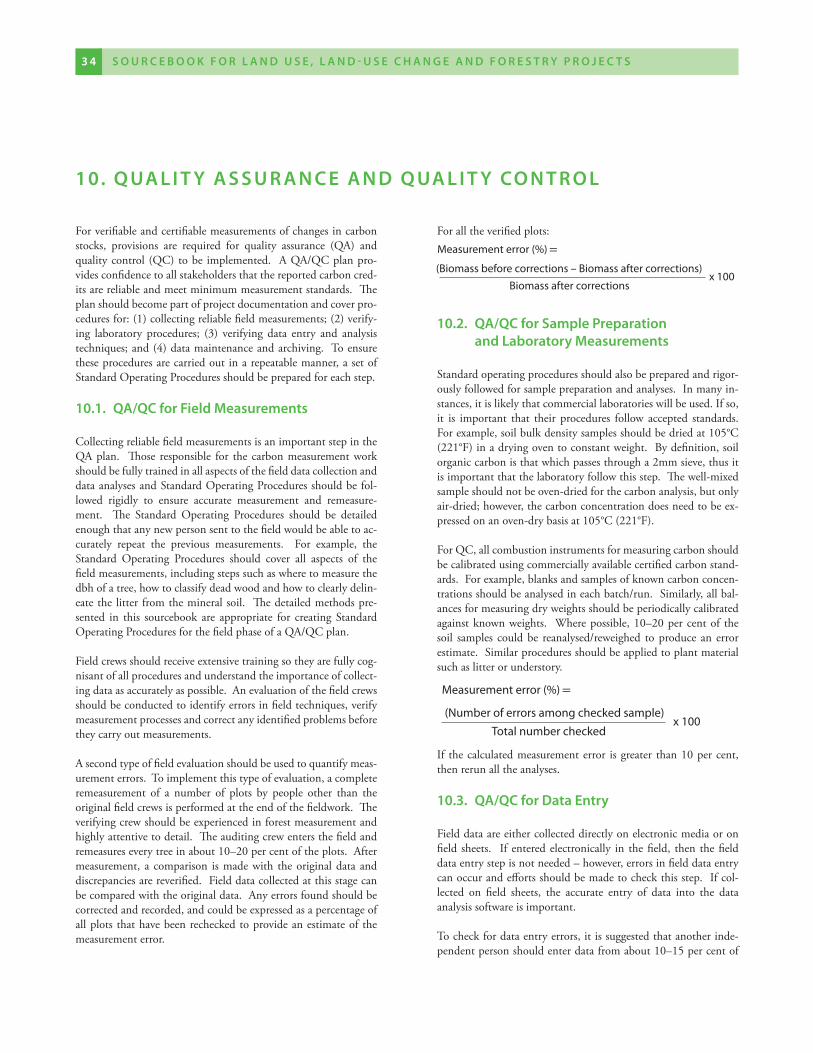
Forverifiableandcertifiablemeasurementsofchangesincarbonstocks, provisions are required for quality assurance (QA) andqualitycontrol (QC)tobe implemented. AQA/QCplanpro-videsconfidencetoallstakeholdersthatthereportedcarboncred-itsarereliableandmeetminimummeasurementstandards.Theplanshouldbecomepartofprojectdocumentationandcoverpro-ceduresfor:(1)collectingreliablefieldmeasurements;(2)verify-ing laboratory procedures; (3) verifying data entry and analysistechniques;and(4)datamaintenanceandarchiving. Toensuretheseproceduresarecarriedoutinarepeatablemanner,asetofStandardOperatingProceduresshouldbepreparedforeachstep.
10.1. Qa/Qc for field measurements
CollectingreliablefieldmeasurementsisanimportantstepintheQAplan. Those responsible for the carbonmeasurementworkshouldbefullytrainedinallaspectsofthefielddatacollectionanddataanalysesandStandardOperatingProceduresshouldbefol-lowed rigidly to ensure accurate measurement and remeasure-ment. The Standard Operating Procedures should be detailedenoughthatanynewpersonsenttothefieldwouldbeabletoac-curately repeat the previous measurements. For example, theStandard Operating Procedures should cover all aspects of thefieldmeasurements,includingstepssuchaswheretomeasurethedbhofatree,howtoclassifydeadwoodandhowtoclearlydelin-eatethelitterfromthemineralsoil. Thedetailedmethodspre-sented in this sourcebook are appropriate for creating StandardOperatingProceduresforthefieldphaseofaQA/QCplan.
Fieldcrewsshouldreceiveextensivetrainingsotheyarefullycog-nisantofallproceduresandunderstandtheimportanceofcollect-ingdataasaccuratelyaspossible.Anevaluationofthefieldcrewsshouldbeconductedtoidentifyerrorsinfieldtechniques,verifymeasurementprocessesandcorrectanyidentifiedproblemsbeforetheycarryoutmeasurements.
Asecondtypeoffieldevaluationshouldbeusedtoquantifymeas-urementerrors.Toimplementthistypeofevaluation,acompleteremeasurement of a number of plots by people other than theoriginalfieldcrewsisperformedattheendofthefieldwork.Theverifyingcrewshouldbeexperiencedinforestmeasurementandhighlyattentivetodetail.Theauditingcrewentersthefieldandremeasureseverytreeinabout10–20percentoftheplots.Aftermeasurement, a comparison ismadewith theoriginaldata anddiscrepanciesarereverified.Fielddatacollectedatthisstagecanbecomparedwiththeoriginaldata.Anyerrorsfoundshouldbecorrectedandrecorded,andcouldbeexpressedasapercentageofallplotsthathavebeenrecheckedtoprovideanestimateofthemeasurementerror.
Foralltheverifiedplots:
10.2. Qa/Qc for Sample Preparation and Laboratory measurements
Standardoperatingproceduresshouldalsobepreparedandrigor-ouslyfollowedforsamplepreparationandanalyses.Inmanyin-stances,itislikelythatcommerciallaboratorieswillbeused.Ifso,it is important that their procedures follow accepted standards.Forexample,soilbulkdensitysamplesshouldbedriedat105°C(221°F)inadryingoventoconstantweight.Bydefinition,soilorganiccarbonisthatwhichpassesthrougha2mmsieve,thusitisimportantthatthelaboratoryfollowthisstep.Thewell-mixedsampleshouldnotbeoven-driedforthecarbonanalysis,butonlyair-dried;however,thecarbonconcentrationdoesneedtobeex-pressedonanoven-drybasisat105°C(221°F).
ForQC,allcombustioninstrumentsformeasuringcarbonshouldbecalibratedusingcommerciallyavailablecertifiedcarbonstand-ards.Forexample,blanksandsamplesofknowncarbonconcen-trationsshouldbeanalysedineachbatch/run.Similarly,allbal-ancesformeasuringdryweightsshouldbeperiodicallycalibratedagainstknownweights. Wherepossible,10–20percentof thesoil samples couldbe reanalysed/reweighed toproduce an errorestimate.Similarproceduresshouldbeappliedtoplantmaterialsuchaslitterorunderstory.
If thecalculatedmeasurementerror isgreater than10percent,thenrerunalltheanalyses.
10.�. Qa/Qc for data entry
Fielddataareeithercollecteddirectlyonelectronicmediaoronfield sheets. If enteredelectronically in thefield, then thefielddataentrystepisnotneeded–however,errorsinfielddataentrycanoccurandeffortsshouldbemadetocheckthisstep.Ifcol-lected on field sheets, the accurate entry of data into the dataanalysissoftwareisimportant.
Tocheckfordataentryerrors,itissuggestedthatanotherinde-pendentpersonshouldenterdatafromabout10–15percentof
10. Q ua L I t y a S S u r a n c e a n d Q ua L I t y co n t r o L
S o u r c e b o o k f o r L a n d u S e , L a n d - u S e c h a n g e a n d f o r e S t r y P r o j e c t S � 5 S o u r c e b o o k f o r L a n d u S e , L a n d - u S e c h a n g e a n d f o r e S t r y P r o j e c t S� �
Measurement error (%) O
(Biomass before corrections – Biomass after corrections)Biomass after corrections
x 100
Measurement error (%) O
(Number of errors among checked sample)total number checked
x 100
thefieldsheetsintothedataanalysissoftware.Thesetwodatasetscan thenbecompared tocheck forerrors. Anyerrorsdetectedshouldbecorrectedinthemasterfile.
If thecalculatedmeasurementerror isgreater than10percent,re-enterthedata.
Data analysis software couldbedeveloped so that ithas checksbuiltintoittohighlightpotentialerrorsindataentry.Forexam-ple, such checks could include tests to check that the diameterlimitsforagivennestedplot(ifused)iswithinthelimitssetbythefieldwork.
Commonsenseshouldbeusedwhenreviewingtheresultsofthedataanalysis,tomakesuretheresultsfitwithintherealmofreal-ity.Errorscanbereducediftheentereddataarereviewedusingexpertjudgmentand,ifnecessary,throughcomparisonwithinde-pendentdata.Allpersonnelinvolvedinmeasuringandanalysingdatashouldcommunicatecloselytoresolveanyapparentanoma-liesbeforefinalanalysisofthemonitoringdataiscompleted.
10.�. Qa/Qc for data archiving
Because of the relatively long-term nature of forestry activities,data archiving (maintenance and storage) will be an importantcomponentofaproject.Copiesofalldataanalysesandmodels,thefinalestimateoftheamountofcarbonsequestered,anyGISproducts and copies of all measuring and monitoring reportsshouldallbestoredinadedicatedandsafeplace.
Giventhetimeframeoverwhichaprojectmaytakeplace,andthepaceofproductionofupdatedversionsofsoftwareandnewhard-wareforstoringdata,electroniccopiesofdataandreportsshouldbeperiodicallyupdatedorconvertedtoaformatthatcanbeac-cessedbyanyfuturesoftwareapplications.
Measurement error (%) O
(Number of errors among checked sample)total number checked
x 100
S o u r c e b o o k f o r L a n d u S e , L a n d - u S e c h a n g e a n d f o r e S t r y P r o j e c t S � 5 S o u r c e b o o k f o r L a n d u S e , L a n d - u S e c h a n g e a n d f o r e S t r y P r o j e c t S� �
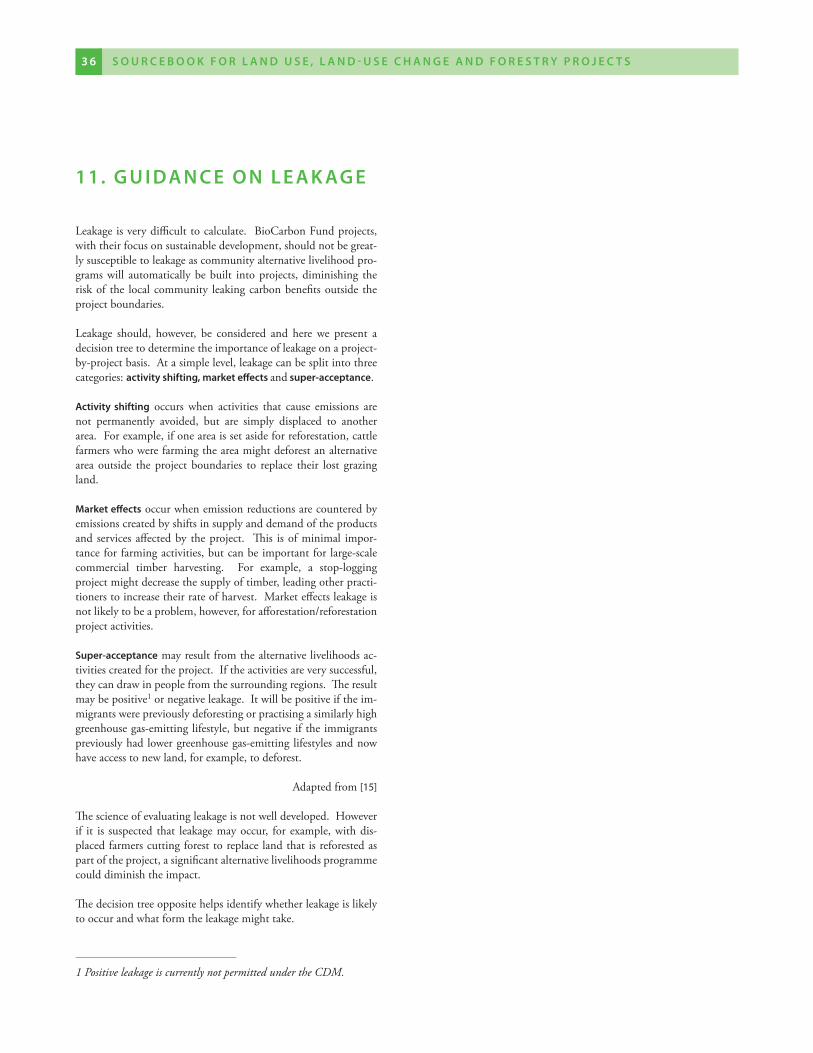
Leakageisverydifficulttocalculate.BioCarbonFundprojects,withtheirfocusonsustainabledevelopment,shouldnotbegreat-lysusceptibletoleakageascommunityalternativelivelihoodpro-gramswill automaticallybebuilt intoprojects,diminishing theriskof the localcommunity leakingcarbonbenefitsoutside theprojectboundaries.
Leakage should, however, be considered and here we present adecisiontreetodeterminetheimportanceofleakageonaproject-by-projectbasis.Atasimplelevel,leakagecanbesplitintothreecategories:activity shifting, market effects and super-acceptance.
activity shifting occurs when activities that cause emissions arenot permanently avoided, but are simply displaced to anotherarea.Forexample,ifoneareaissetasideforreforestation,cattlefarmerswhowerefarmingtheareamightdeforestanalternativeareaoutside theprojectboundaries to replace their lost grazingland.
market effectsoccurwhenemissionreductionsarecounteredbyemissionscreatedbyshiftsinsupplyanddemandoftheproductsand servicesaffectedby theproject. This isofminimal impor-tanceforfarmingactivities,butcanbeimportantforlarge-scalecommercial timber harvesting. For example, a stop-loggingprojectmightdecreasethesupplyoftimber,leadingotherpracti-tionerstoincreasetheirrateofharvest.Marketeffectsleakageisnotlikelytobeaproblem,however,forafforestation/reforestationprojectactivities.
Super-acceptancemayresultfromthealternativelivelihoodsac-tivitiescreatedfortheproject.Iftheactivitiesareverysuccessful,theycandrawinpeoplefromthesurroundingregions.Theresultmaybepositive1ornegativeleakage.Itwillbepositiveiftheim-migrantswerepreviouslydeforestingorpractisingasimilarlyhighgreenhousegas-emittinglifestyle,butnegativeiftheimmigrantspreviouslyhadlowergreenhousegas-emittinglifestylesandnowhaveaccesstonewland,forexample,todeforest.
Adaptedfrom[15]
Thescienceofevaluatingleakageisnotwelldeveloped.Howeverif it is suspected that leakagemayoccur, forexample,withdis-placedfarmerscuttingforesttoreplacelandthatisreforestedaspartoftheproject,asignificantalternativelivelihoodsprogrammecoulddiminishtheimpact.
Thedecisiontreeoppositehelpsidentifywhetherleakageislikelytooccurandwhatformtheleakagemighttake.
11. g u I d a n c e o n L e a k ag e
1 Positive leakage is currently not permitted under the CDM.
S o u r c e b o o k f o r L a n d u S e , L a n d - u S e c h a n g e a n d f o r e S t r y P r o j e c t S � � S o u r c e b o o k f o r L a n d u S e , L a n d - u S e c h a n g e a n d f o r e S t r y P r o j e c t S� �
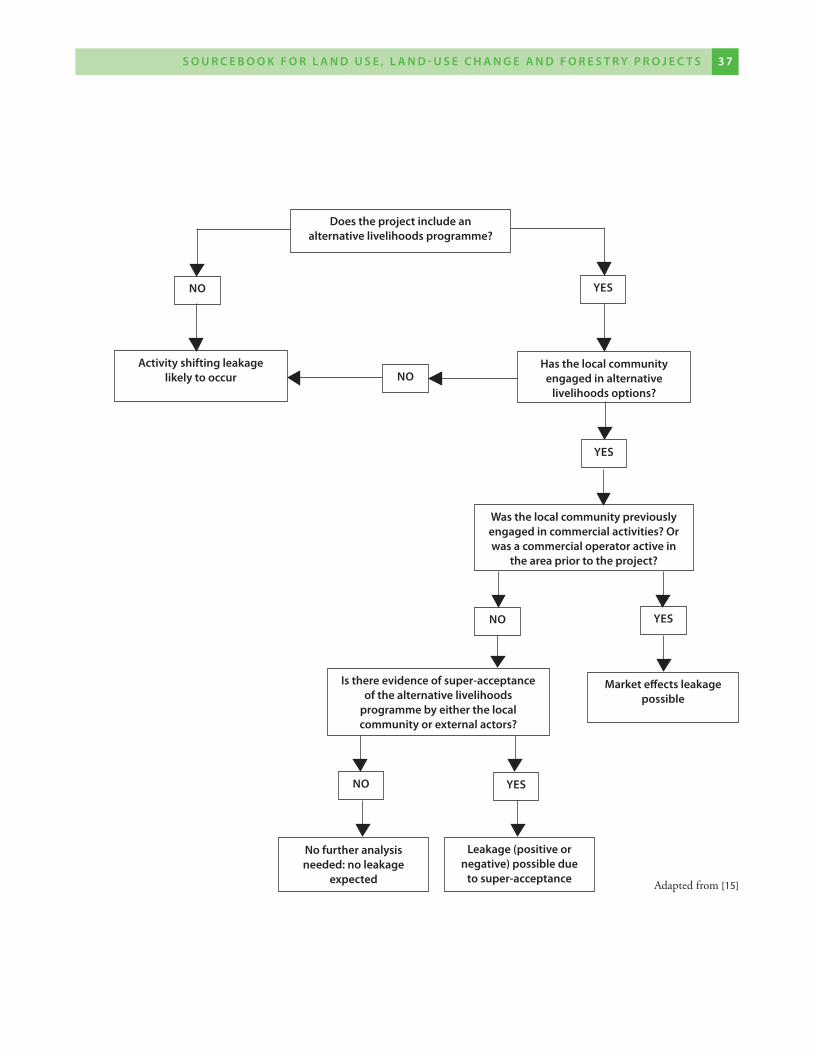
Adaptedfrom[15]
does the project include an alternative livelihoods programme?
no yeS
yeS
yeS
no
no
yeSno
activity shifting leakage likely to occur
Was the local community previously engaged in commercial activities? or was a commercial operator active in
the area prior to the project?
Is there evidence of super-acceptance of the alternative livelihoods
programme by either the local community or external actors?
market effects leakage possible
has the local community engaged in alternative
livelihoods options?
no further analysis needed: no leakage
expected
Leakage (positive or negative) possible due
to super-acceptance
S o u r c e b o o k f o r L a n d u S e , L a n d - u S e c h a n g e a n d f o r e S t r y P r o j e c t S � � S o u r c e b o o k f o r L a n d u S e , L a n d - u S e c h a n g e a n d f o r e S t r y P r o j e c t S� �
[1] houghton, j.t., y. ding, d.j. griggs, m. noguer, P.j. van der Linden, X. dai, k. maskell and c.a. johnson(eds).2001.ClimateChange2001:TheScientificBasis.ContributiontotheThirdAssessmentReportoftheIntergovernmentalPanelonClimateChange.CambridgeUniversityPress,Cambridge,UK,andNewYork,USA.881pp.
[2] dixon, r. k., S. brown, r. a. houghton, a. m. Solomon, m. c. trexler, and j. Wisniewski.1994.Carbonpoolsandfluxofglobalforestecosystems.Science263:185-190.
[3] brown, S., j. Sathaye, m. cannell, and P. kauppi. 1996.Managementofforestsformitigationofgreenhousegasemissions.Chapter24inr. t. Watson, m.c. Zinyowera, and r.h. moss(eds.),ClimateChange1995:Impacts,Adapta-tionsandMitigationofClimateChange:Scientific-TechnicalAnalyses.ContributionofWorkingGroupIItotheSecondAssessmentReportoftheIntergovernmentalPanelonClimateChange,CambridgeUniversityPress,Cambridge,UK,andNewYork,USA.
[4] dutschke, m, b. Schlamadiner, j. Wong and m. rumsberg. 2004.ValueandrisksofexpiringcarboncreditsfromCDMafforestationandreforestation.HWWADiscussionPaper290.34pp.
[5] avery t.e. and h.e. burkhart (eds.).1994.ForestMeasure-ments,4thedition.McGraw-Hill,NewYork.
[6] brown, S.2002.Measuring,monitoring,andverificationofcarbonbenefitsforforest-basedprojects.Phil.TransR.Soc.Lond.A360:1669-1683.
[7] brown, j. k.1974.Handbookforinventoryingdownedwoodymaterial.GeneralTechnicalReportINT-16.Ogden,Utah:USDAForestServiceIntermountainForestandRangeExperimentStation.
[8] harmon, m. e. and j. Sexton.1996.GuidelinesforMeasure-mentsofWoodyDetritusinForestEcosystems.USLTERPublicationNo.20.USLTERNetworkOffice,UniversityofWashington,Seattle,USA.
[9] nelson, d.W., and L.e. Sommers.1996.Totalcarbon,organiccarbon,andorganicmatter.p.961-1010.In:d.L. Sparks et al.(eds.)Methodsofsoilanalysis.Part3.Chemicalmethods.SSSA,Madison,USA.
[10]brown, S.1997.EstimatingBiomassandBiomassChangeofTropicalForests:APrimer.UNFAOForestryPaper134,Rome.55pp.
[11]cairns, m. a., S. brown, e. h. helmer, and g. a. baumgardner.1997.Rootbiomassallocationintheworld’suplandforests.Oecologia111:1-11
[12]jenkins, j.c., d.c. chojnacky, L.S. heath, and r.a. birdsey.2003.National-scalebiomassestimationforUnitedStatestreespecies.Forest Science49:12-35.
[13] namburs, g-j, n.h. ravindranath, k. Paustian, a. freibauer, W. hohenstein and W. makundi(eds).2004.Chapter3:LUCFSectorGoodPracticeGuidance.In:Penman, j, m. gytarsky, t. hiraishi, t. krug, d. kruger, r. Pipatti, L. buendia, k. miwa, t. ngara, k. tanabe and f. Wagner.GoodPracticeGuidanceforLandUse,Land-UseChangeandForestry,IPCCNationalGreenhouseGasInventoriesProgramme,IntergovernmentalPanelonClimateChange.
[14] Intergovernmental Panel on climate change.1996.Revised1996IPCCGuidelinesforNationalGreenhouseGasInventories,Volumes1,2and3.IntergovernmentalPanelonClimateChangeSecretariat,Geneva,Switzerland.
[15] aukland, L., P. moura costa and S. brown.2003.Aconcep-tualframeworkanditsapplicationforaddressingleakageonavoideddeforestationprojects.Climate Policy3:123-136.
12. r e f e r e n c e S
S o u r c e b o o k f o r L a n d u S e , L a n d - u S e c h a n g e a n d f o r e S t r y P r o j e c t S � � S o u r c e b o o k f o r L a n d u S e , L a n d - u S e c h a n g e a n d f o r e S t r y P r o j e c t S� �
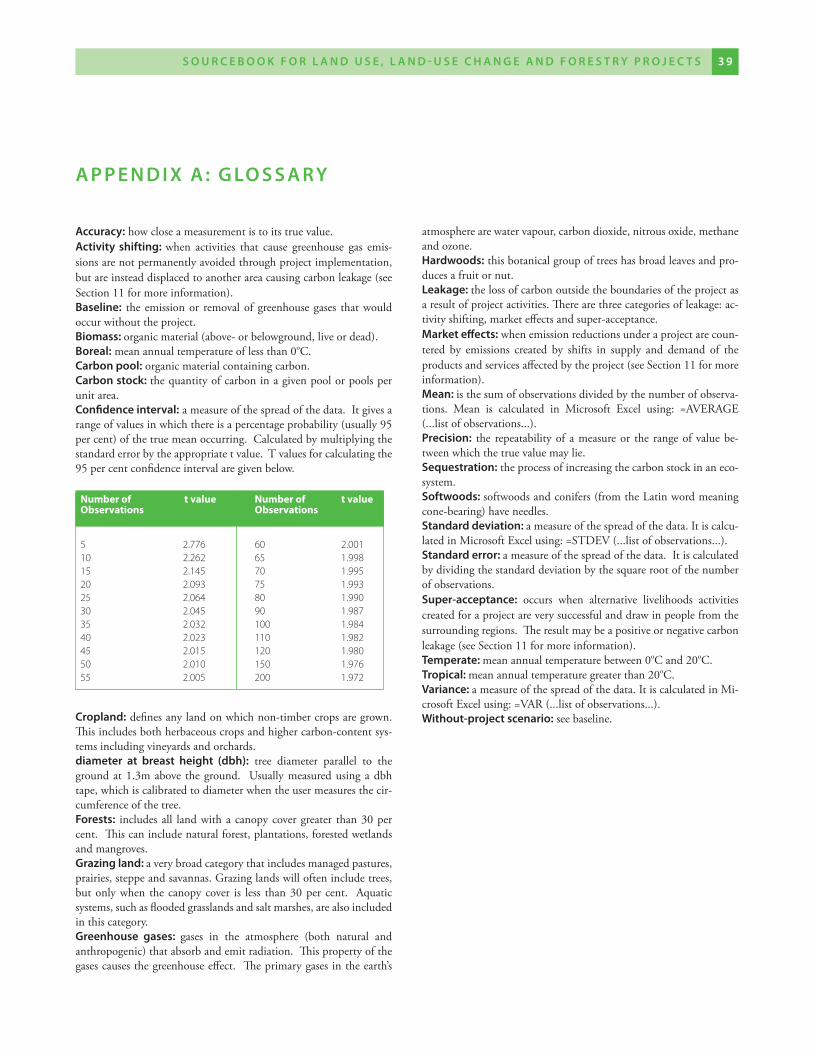
atmospherearewatervapour,carbondioxide,nitrousoxide,methaneandozone.hardwoods:thisbotanicalgroupoftreeshasbroadleavesandpro-ducesafruitornut.Leakage: thelossofcarbonoutsidetheboundariesoftheprojectasaresultofprojectactivities.Therearethreecategoriesofleakage:ac-tivityshifting,marketeffectsandsuper-acceptance.market effects:whenemissionreductionsunderaprojectarecoun-tered by emissions created by shifts in supply and demand of theproductsandservicesaffectedbytheproject(seeSection11formoreinformation).mean: isthesumofobservationsdividedbythenumberofobserva-tions. Mean is calculated in Microsoft Excel using: =AVERAGE(...listofobservations...).Precision: the repeatabilityofameasureor the rangeofvaluebe-tweenwhichthetruevaluemaylie.Sequestration:theprocessofincreasingthecarbonstockinaneco-system.Softwoods: softwoodsandconifers(fromtheLatinwordmeaningcone-bearing)haveneedles.Standard deviation: ameasureofthespreadofthedata.Itiscalcu-latedinMicrosoftExcelusing:=STDEV(...listofobservations...).Standard error: ameasureofthespreadofthedata.Itiscalculatedbydividingthestandarddeviationbythesquarerootofthenumberofobservations.Super-acceptance: occurs when alternative livelihoods activitiescreatedforaprojectareverysuccessfulanddrawinpeoplefromthesurroundingregions.Theresultmaybeapositiveornegativecarbonleakage(seeSection11formoreinformation).temperate: meanannualtemperaturebetween0oCand20oC.tropical: meanannualtemperaturegreaterthan20oC.variance: ameasureofthespreadofthedata.ItiscalculatedinMi-crosoftExcelusing:=VAR(...listofobservations...).Without-project scenario:seebaseline.
accuracy:howcloseameasurementistoitstruevalue.activity shifting: when activities that cause greenhouse gas emis-sionsarenotpermanentlyavoidedthroughprojectimplementation,butareinsteaddisplacedtoanotherareacausingcarbonleakage(seeSection11formoreinformation).baseline: the emissionor removalofgreenhousegases thatwouldoccurwithouttheproject.biomass: organicmaterial(above-orbelowground,liveordead).boreal:meanannualtemperatureoflessthan0oC.carbon pool:organicmaterialcontainingcarbon.carbon stock: thequantityofcarboninagivenpoolorpoolsperunitarea.confidence interval:ameasureofthespreadofthedata.Itgivesarangeofvaluesinwhichthereisapercentageprobability(usually95percent)ofthetruemeanoccurring.Calculatedbymultiplyingthestandarderrorbytheappropriatetvalue.Tvaluesforcalculatingthe95percentconfidenceintervalaregivenbelow.
cropland:definesanylandonwhichnon-timbercropsaregrown.Thisincludesbothherbaceouscropsandhighercarbon-contentsys-temsincludingvineyardsandorchards.diameter at breast height (dbh): tree diameter parallel to thegroundat1.3mabove theground. Usuallymeasuredusingadbhtape,whichiscalibratedtodiameterwhentheusermeasuresthecir-cumferenceofthetree.forests: includesall landwithacanopycovergreater than30percent.Thiscanincludenaturalforest,plantations,forestedwetlandsandmangroves.grazing land: averybroadcategorythatincludesmanagedpastures,prairies,steppeandsavannas.Grazinglandswilloftenincludetrees,butonlywhen thecanopycover is less than30percent. Aquaticsystems,suchasfloodedgrasslandsandsaltmarshes,arealsoincludedinthiscategory.greenhouse gases: gases in the atmosphere (both natural andanthropogenic)thatabsorbandemitradiation.Thispropertyofthegasescausesthegreenhouseeffect.Theprimarygasesintheearth’s
Number of t value Number of t value Observations Observations 5 2.776 60 2.00110 2.262 65 1.99815 2.145 70 1.99520 2.093 75 1.99325 2.064 80 1.99030 2.045 90 1.98735 2.032 100 1.98440 2.023 110 1.98245 2.015 120 1.98050 2.010 150 1.97655 2.005 200 1.972
a P P e n d I X a : g Lo S S a r y
S o u r c e b o o k f o r L a n d u S e , L a n d - u S e c h a n g e a n d f o r e S t r y P r o j e c t S � � S o u r c e b o o k f o r L a n d u S e , L a n d - u S e c h a n g e a n d f o r e S t r y P r o j e c t S� �
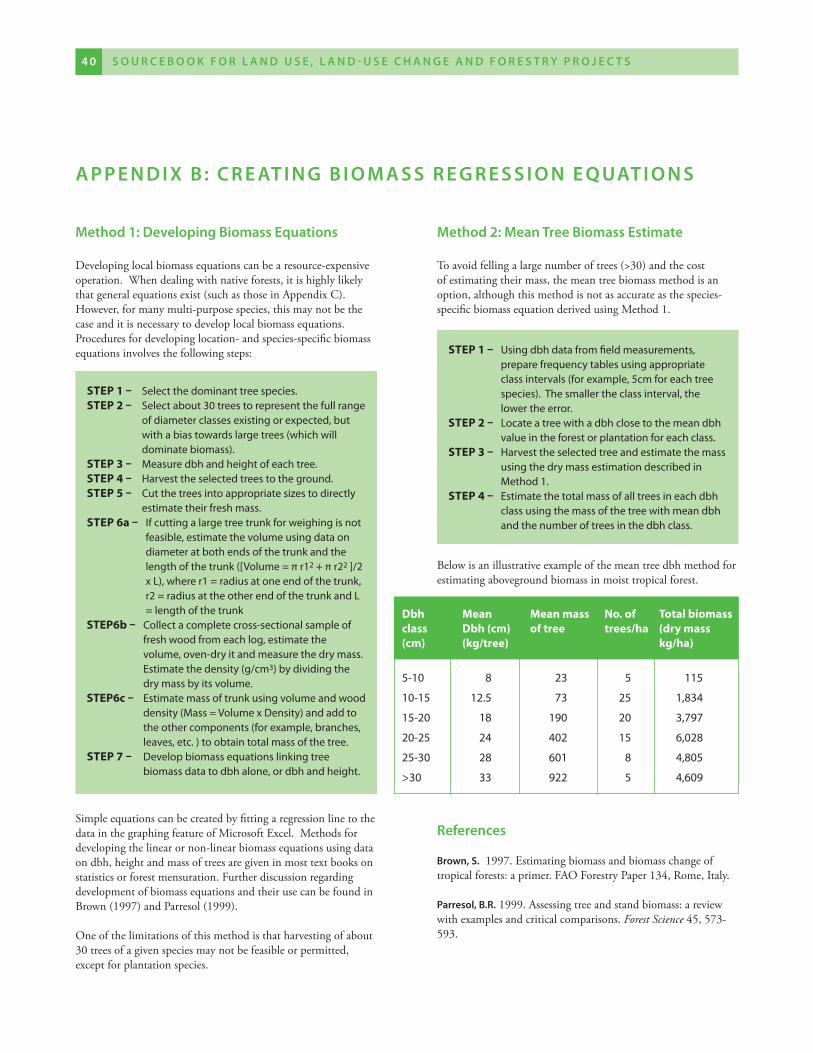
Dbh Mean Mean mass No. of Total biomass class Dbh (cm) of tree trees/ha (dry mass(cm) (kg/tree) kg/ha)
5-10 8 23 5 115
10-15 12.5 73 25 1,834
15-20 18 190 20 3,797
20-25 24 402 15 6,028
25-30 28 601 8 4,805
>30 33 922 5 4,609
method 1: developing biomass equations
Developinglocalbiomassequationscanbearesource-expensiveoperation.Whendealingwithnativeforests,itishighlylikelythatgeneralequationsexist(suchasthoseinAppendixC).However,formanymulti-purposespecies,thismaynotbethecaseanditisnecessarytodeveloplocalbiomassequations.Proceduresfordevelopinglocation-andspecies-specificbiomassequationsinvolvesthefollowingsteps:
method 2: mean tree biomass estimate
Toavoidfellingalargenumberoftrees(>30)andthecostofestimatingtheirmass,themeantreebiomassmethodisanoption,althoughthismethodisnotasaccurateasthespecies-specificbiomassequationderivedusingMethod1.
a P P e n d I X b : c r e at I n g b I o m a S S r e g r e S S I o n e Q uat I o n S
STEP 1 – Select the dominant tree species. STEP 2 – Select about 30 trees to represent the full range
of diameter classes existing or expected, but with a bias towards large trees (which will dominate biomass).
STEP 3 – Measure dbh and height of each tree.STEP 4 – harvest the selected trees to the ground.STEP 5 – cut the trees into appropriate sizes to directly
estimate their fresh mass.STEP 6a – If cutting a large tree trunk for weighing is not
feasible, estimate the volume using data on diameter at both ends of the trunk and the length of the trunk ([Volume = π r12 + π r22 ]/2 x L), where r1 = radius at one end of the trunk, r2 = radius at the other end of the trunk and L = length of the trunk
STEP6b – collect a complete cross-sectional sample of fresh wood from each log, estimate the volume, oven-dry it and measure the dry mass. Estimate the density (g/cm3) by dividing the dry mass by its volume.
STEP6c – Estimate mass of trunk using volume and wood density (Mass = Volume x density) and add to the other components (for example, branches, leaves, etc. ) to obtain total mass of the tree.
STEP 7 – develop biomass equations linking tree biomass data to dbh alone, or dbh and height.
SimpleequationscanbecreatedbyfittingaregressionlinetothedatainthegraphingfeatureofMicrosoftExcel.Methodsfordevelopingthelinearornon-linearbiomassequationsusingdataondbh,heightandmassoftreesaregiveninmosttextbooksonstatisticsorforestmensuration.FurtherdiscussionregardingdevelopmentofbiomassequationsandtheirusecanbefoundinBrown(1997)andParresol(1999).
Oneofthelimitationsofthismethodisthatharvestingofabout30treesofagivenspeciesmaynotbefeasibleorpermitted,exceptforplantationspecies.
STEP 1 – using dbh data from field measurements, prepare frequency tables using appropriate class intervals (for example, 5cm for each tree species). the smaller the class interval, the lower the error.
STEP 2 – Locate a tree with a dbh close to the mean dbh value in the forest or plantation for each class.
STEP 3 – harvest the selected tree and estimate the mass using the dry mass estimation described in Method 1.
STEP 4 – Estimate the total mass of all trees in each dbh class using the mass of the tree with mean dbh and the number of trees in the dbh class.
Belowisanillustrativeexampleofthemeantreedbhmethodforestimatingabovegroundbiomassinmoisttropicalforest.
references
brown, S.1997.Estimatingbiomassandbiomasschangeoftropicalforests:aprimer.FAOForestryPaper134,Rome,Italy.
Parresol, b.r.1999.Assessingtreeandstandbiomass:areviewwithexamplesandcriticalcomparisons.Forest Science45,573-593.
S o u r c e b o o k f o r L a n d u S e , L a n d - u S e c h a n g e a n d f o r e S t r y P r o j e c t S � 1 S o u r c e b o o k f o r L a n d u S e , L a n d - u S e c h a n g e a n d f o r e S t r y P r o j e c t S� 0
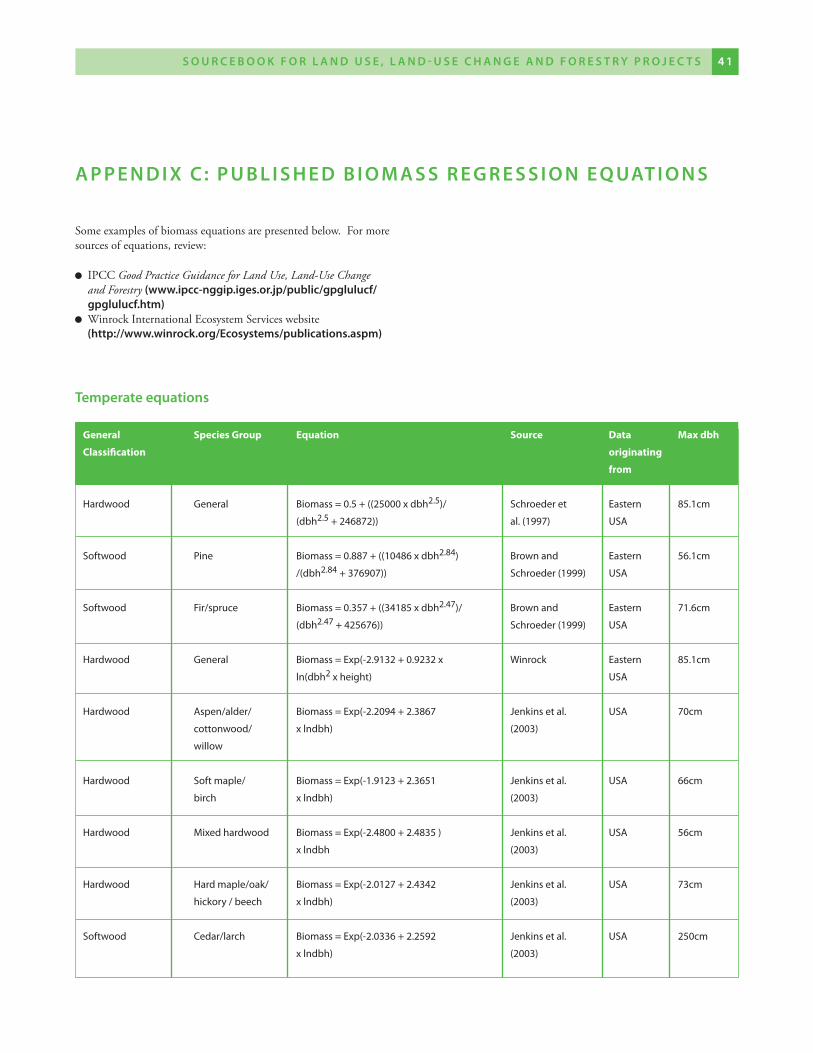
Someexamplesofbiomassequationsarepresentedbelow.Formoresourcesofequations,review:
IPCCGood Practice Guidance for Land Use, Land-Use Change and Forestry(www.ipcc-nggip.iges.or.jp/public/gpglulucf/gpglulucf.htm)
WinrockInternationalEcosystemServiceswebsite(http://www.winrock.org/ecosystems/publications.aspm)
temperate equations
a P P e n d I X c : P u b L I S h e d b I o m a S S r e g r e S S I o n e Q uat I o n S
General Species Group Equation Source Data Max dbh
Classification originating
from
hardwood general Biomass = 0.5 + ((25000 x dbh2.5)/ Schroeder et Eastern 85.1cm
(dbh2.5 + 246872)) al. (1997) uSa
Softwood Pine Biomass = 0.887 + ((10486 x dbh2.84) Brown and Eastern 56.1cm
/(dbh2.84 + 376907)) Schroeder (1999) uSa
Softwood Fir/spruce Biomass = 0.357 + ((34185 x dbh2.47)/ Brown and Eastern 71.6cm
(dbh2.47 + 425676)) Schroeder (1999) uSa
hardwood general Biomass = Exp(-2.9132 + 0.9232 x Winrock Eastern 85.1cm
ln(dbh2 x height) uSa
hardwood aspen/alder/ Biomass = Exp(-2.2094 + 2.3867 Jenkins et al. uSa 70cm
cottonwood/ x lndbh) (2003)
willow
hardwood Soft maple/ Biomass = Exp(-1.9123 + 2.3651 Jenkins et al. uSa 66cm
birch x lndbh) (2003)
hardwood Mixed hardwood Biomass = Exp(-2.4800 + 2.4835 ) Jenkins et al. uSa 56cm
x lndbh (2003)
hardwood hard maple/oak/ Biomass = Exp(-2.0127 + 2.4342 Jenkins et al. uSa 73cm
hickory / beech x lndbh) (2003)
Softwood cedar/larch Biomass = Exp(-2.0336 + 2.2592 Jenkins et al. uSa 250cm
x lndbh) (2003)
S o u r c e b o o k f o r L a n d u S e , L a n d - u S e c h a n g e a n d f o r e S t r y P r o j e c t S � 1 S o u r c e b o o k f o r L a n d u S e , L a n d - u S e c h a n g e a n d f o r e S t r y P r o j e c t S� 0
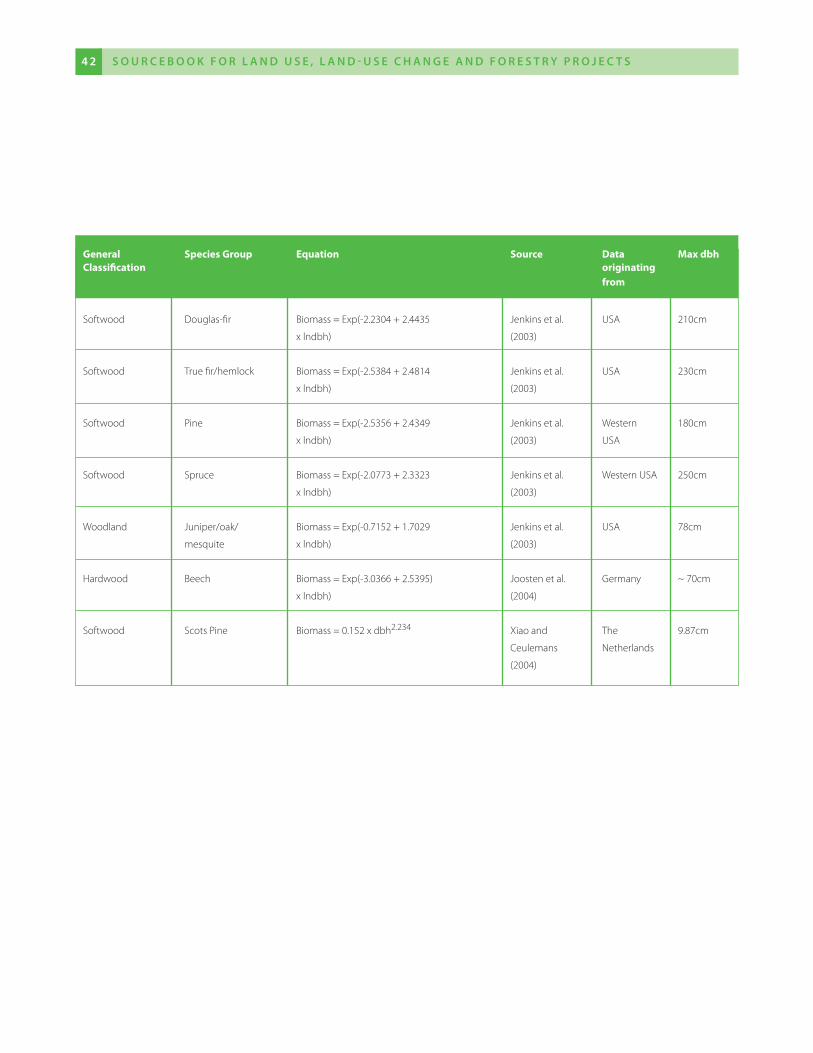
General Species Group Equation Source Data Max dbhClassification originating
from
Softwood Douglas-fir Biomass = Exp(-2.2304 + 2.4435 Jenkins et al. USA 210cm
x lndbh) (2003)
Softwood True fir/hemlock Biomass = Exp(-2.5384 + 2.4814 Jenkins et al. USA 230cm
x lndbh) (2003)
Softwood Pine Biomass = Exp(-2.5356 + 2.4349 Jenkins et al. Western 180cm
x lndbh) (2003) USA
Softwood Spruce Biomass = Exp(-2.0773 + 2.3323 Jenkins et al. Western USA 250cm
x lndbh) (2003)
Woodland Juniper/oak/ Biomass = Exp(-0.7152 + 1.7029 Jenkins et al. USA 78cm
mesquite x lndbh) (2003)
Hardwood Beech Biomass = Exp(-3.0366 + 2.5395) Joosten et al. Germany ~ 70cm
x lndbh) (2004)
Softwood Scots Pine Biomass = 0.152 x dbh2.234 Xiao and The 9.87cm
Ceulemans Netherlands
(2004)
S o u r c e b o o k f o r L a n d u S e , L a n d - u S e c h a n g e a n d f o r e S t r y P r o j e c t S � � S o u r c e b o o k f o r L a n d u S e , L a n d - u S e c h a n g e a n d f o r e S t r y P r o j e c t S� 2
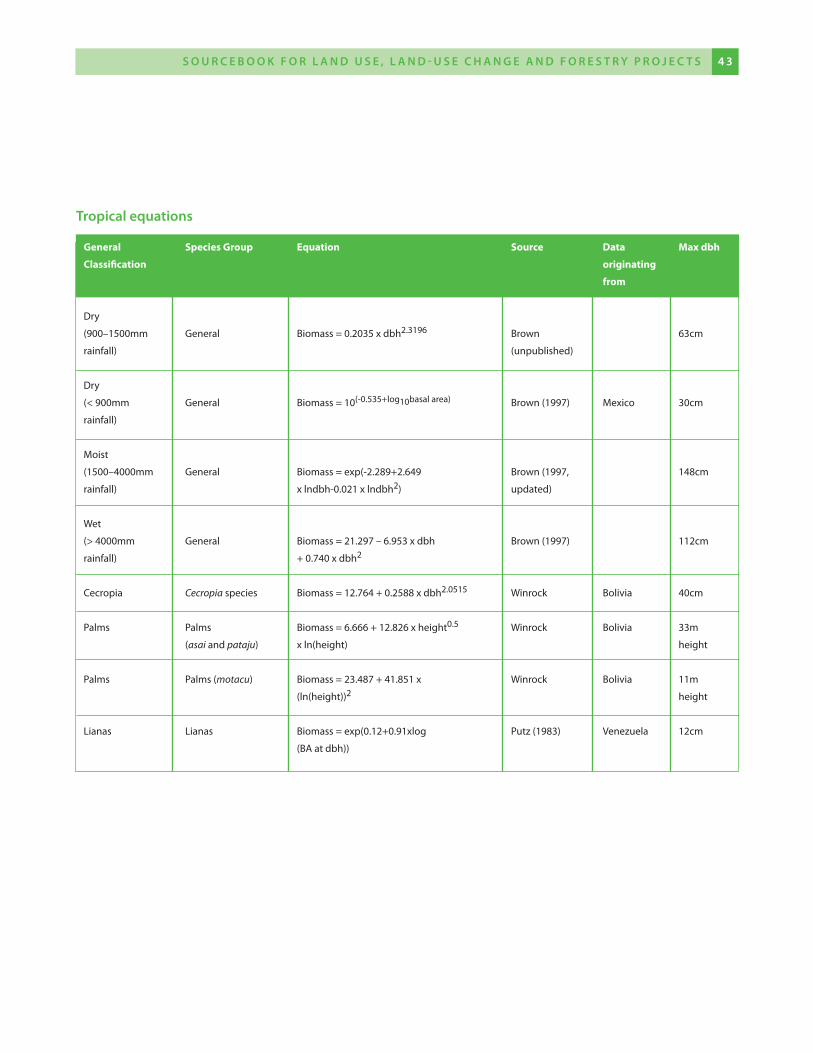
General Species Group Equation Source Data Max dbh
Classification originating
from
dry
(900–1500mm general Biomass = 0.2035 x dbh2.3196 Brown 63cm
rainfall) (unpublished)
dry
(< 900mm general Biomass = 10(-0.535+log10basal area) Brown (1997) Mexico 30cm
rainfall)
Moist
(1500–4000mm general Biomass = exp(-2.289+2.649 Brown (1997, 148cm
rainfall) x lndbh-0.021 x lndbh2) updated)
Wet
(> 4000mm general Biomass = 21.297 – 6.953 x dbh Brown (1997) 112cm
rainfall) + 0.740 x dbh2
cecropia cecropia species Biomass = 12.764 + 0.2588 x dbh2.0515 Winrock Bolivia 40cm
Palms Palms Biomass = 6.666 + 12.826 x height0.5 Winrock Bolivia 33m
(asai and pataju) x ln(height) height
Palms Palms (motacu) Biomass = 23.487 + 41.851 x Winrock Bolivia 11m
(ln(height))2 height
Lianas Lianas Biomass = exp(0.12+0.91xlog Putz (1983) Venezuela 12cm
(Ba at dbh))
tropical equations
S o u r c e b o o k f o r L a n d u S e , L a n d - u S e c h a n g e a n d f o r e S t r y P r o j e c t S � � S o u r c e b o o k f o r L a n d u S e , L a n d - u S e c h a n g e a n d f o r e S t r y P r o j e c t S� 2
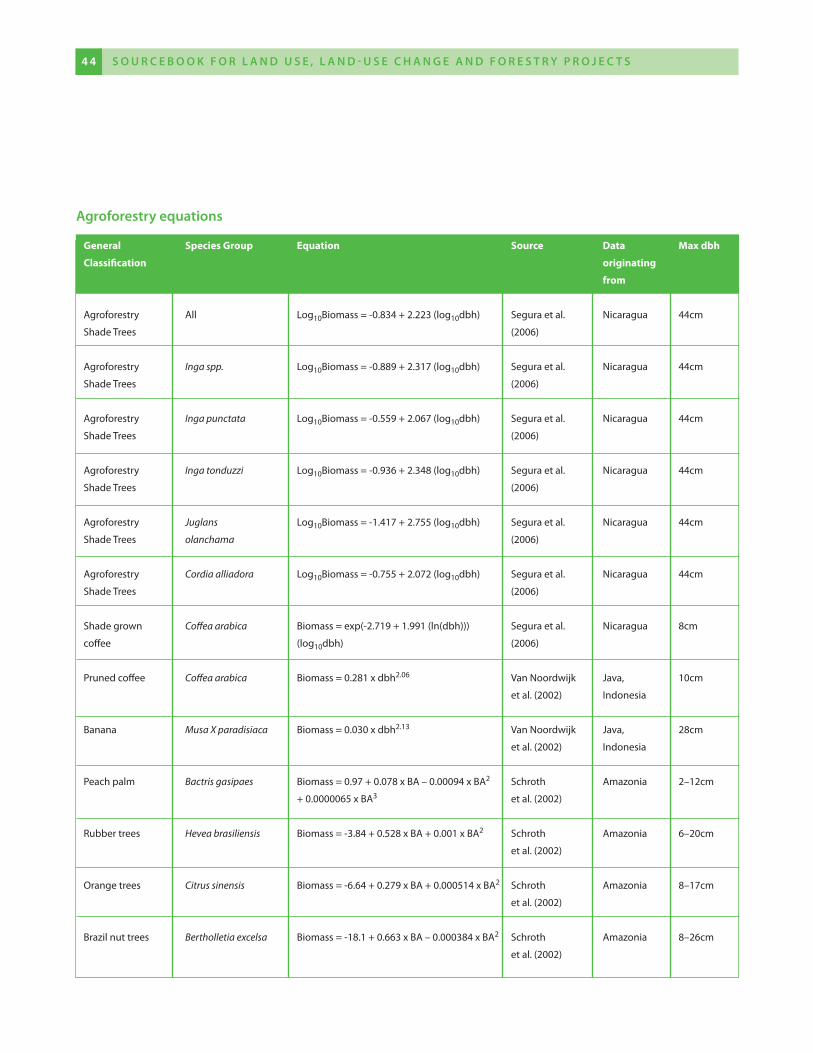
General Species Group Equation Source Data Max dbh
Classification originating
from
agroforestry all Log10Biomass = -0.834 + 2.223 (log10dbh) Segura et al. Nicaragua 44cm
Shade trees (2006)
agroforestry Inga spp. Log10Biomass = -0.889 + 2.317 (log10dbh) Segura et al. Nicaragua 44cm
Shade trees (2006)
agroforestry Inga punctata Log10Biomass = -0.559 + 2.067 (log10dbh) Segura et al. Nicaragua 44cm
Shade trees (2006)
agroforestry Inga tonduzzi Log10Biomass = -0.936 + 2.348 (log10dbh) Segura et al. Nicaragua 44cm
Shade trees (2006)
agroforestry Juglans Log10Biomass = -1.417 + 2.755 (log10dbh) Segura et al. Nicaragua 44cm
Shade trees olanchama (2006)
agroforestry cordia alliadora Log10Biomass = -0.755 + 2.072 (log10dbh) Segura et al. Nicaragua 44cm
Shade trees (2006)
Shade grown coffea arabica Biomass = exp(-2.719 + 1.991 (ln(dbh))) Segura et al. Nicaragua 8cm
coffee (log10dbh) (2006)
Pruned coffee coffea arabica Biomass = 0.281 x dbh2.06 Van Noordwijk Java, 10cm
et al. (2002) Indonesia
Banana musa X paradisiaca Biomass = 0.030 x dbh2.13 Van Noordwijk Java, 28cm
et al. (2002) Indonesia
Peach palm Bactris gasipaes Biomass = 0.97 + 0.078 x Ba – 0.00094 x Ba2 Schroth amazonia 2–12cm
+ 0.0000065 x Ba3 et al. (2002)
Rubber trees Hevea brasiliensis Biomass = -3.84 + 0.528 x Ba + 0.001 x Ba2 Schroth amazonia 6–20cm
et al. (2002)
orange trees citrus sinensis Biomass = -6.64 + 0.279 x Ba + 0.000514 x Ba2 Schroth amazonia 8–17cm
et al. (2002)
Brazil nut trees Bertholletia excelsa Biomass = -18.1 + 0.663 x Ba – 0.000384 x Ba2 Schroth amazonia 8–26cm
et al. (2002)
agroforestry equations
S o u r c e b o o k f o r L a n d u S e , L a n d - u S e c h a n g e a n d f o r e S t r y P r o j e c t S � 5 S o u r c e b o o k f o r L a n d u S e , L a n d - u S e c h a n g e a n d f o r e S t r y P r o j e c t S� �
references
brown, S.1997.Estimatingbiomassandbiomasschangeoftropicalforests:aprimer.FAOForestryPaper134,Rome,Italy.
brown, S.L.and P.e. Schroeder.1999.SpatialpatternsofabovegroundproductionandmortalityofwoodybiomassforeasternUSforests.Ecological Applications9:968-980.(errata:Brown,S.L.,Schroeder,P.E.2000.Ecological Applications10:937).
jenkins, j.c., d.c. chojnacky, L.S. heath, and r.a. birdsey.2003.National-scalebiomassestimationforUnitedStatestreespecies.Forest Science49:12-35.
joosten, r., j. Schumacher, c. Wirth and a. Schulte.2004.Evaluatingtreecarbonpredictionsforbeech(FagussylvaticaL.)inwesternGermany.Forest Ecology and Management189:87-96.
van noordwijk, m., S. rahayu, k. hairiah, y.c. Wulan, a. farida and b. verbist.2002.Carbonstockassessmentforaforest-to-coffeeconversionlandscapeinSumber-Jaya(Lampung,Indonesia):fromallometricequationstolanduseanalysis.Science in ChinaC45suppl:75-86.Availableat:http://www.globalcarbonproject.org/PRODUCTS/Table_of_contents_land_use%20(Canadell_Zhou_Noble2003)/Noordwijk_yc0075.pdf.
Putz, f.e. 1983.Lianabiomassandleafareaofa‘TierraFirme’forestintheRioNegroBasin,Venezuela.Biotropica15:185-189
Schroeder, P., S. brown, j. mo, r, birdsey and c. cieszewski.1997.BiomassestimationfortemperatebroadleafforestsoftheUnitedStatesusinginventorydata.Forest Science43:424-434.
Schroth, g., S.a. d’angelo, W.g. teixeira, d. haag and r. Lieberei. 2002.ConversionofsecondaryforesttoagroforestryandmonocultureplantationsinAmazonia:consequencesforbiomass,litterandsoilcarbonstockafter7years.Forest Ecology and Manage-ment163:131-150.
Segura, m., m. kanninen and d. Suárez. 2006.AllometricmodelsforestimatingabovegroundbiomassofshadetreesandcoffeplantsinagroforestrysystemsinMatagalpa,Nicaragua.SubmittedtoAgroforestry Systems. Xiao, c-W and r. ceulemans.2004.Allometricrelationshipsforbelow-andabovegroundbiomassofyoungScotspine.Forest Ecology and Management203:177-186.
S o u r c e b o o k f o r L a n d u S e , L a n d - u S e c h a n g e a n d f o r e S t r y P r o j e c t S � 5 S o u r c e b o o k f o r L a n d u S e , L a n d - u S e c h a n g e a n d f o r e S t r y P r o j e c t S� �
S o u r c e b o o k f o r L a n d u S e , L a n d - u S e c h a n g e a n d f o r e S t r y P r o j e c t S � � S o u r c e b o o k f o r L a n d u S e , L a n d - u S e c h a n g e a n d f o r e S t r y P r o j e c t S� �
Author:IginoM.EmmerwithsupportfromWolframKägi(BSS)
ThischecklistcanbeusedduringbothProjectIdeaNoteandProjectDesignDocumentwritingstagesforeithersmall-scaleornormal-sizedafforestation/reforestationCDMprojectactivities.IssuesandactivitiesfortheProjectIdeaNoteareindicatedwithanasterix;thoseforsmall-scaleornormalprojectactivitiesareindicatedwithan“S”or“N”respectively.
Informationsources,formatstobeusedandissuestobeaddressedordemonstratedarealsoidentifiedinthecommentscolumn.Incertaincases,topicsareelaboratedinmoredetailinadedicatedtextbox.
Whilethischecklistgivesgeneralguidancetodevelopingafforestation/reforestationCDMprojectactivities,inspecificareasmoredetailedinformationisprovided,basedonthegrowingexperiencewiththeapprovalprocedureforbaselineandmonitoringmethodologies.BynomeansdoesthischecklistintendtocoverallaspectsofCDMafforestation/reforestationprojectdevelopment.
AbasicknowledgeoftheUNFCCCandtheCDMisassumed,althoughreferencestoessentialdocumentationarealsoprovided.
main themes
1. Capacity–knowledgeoftheprocess2. Participationrequirements3. Baselinemethodology4. Monitoringmethodologyandmonitoringplan5. ProjectDesignDocument6. Legalissues
a P P e n d I X d : c h e c k L I S t f o r c d m a f f o r e S tat I o n / r e f o r e S tat I o n P r o j e c t S
aE applicant EntityaR or a/R afforestation or reforestationcdM clean development MechanismcdM aR Wg cdM Working group for a/RcdM-aR-NMB cdM a/R New Baseline
Methodology formcdM-aR-NMM cdM a/R New Monitoring
Methodology formcdM-aR-Pdd cdM a/R Pdd formcdM-SSc-aR-Pdd cdM Small-Scale a/R Pdd formcER certified Emission ReductioncoP conference of the Parties to the
uNFcccdNa designated National authoritydoE designated operational EntityEB Executive BoardEB21 21st meeting of the Executive Boardghg greenhouse gasgPg good Practice guidanceIPcc Intergovernmental Panel on climate
changelcER Long-term cERMa Marrakech accordsMoP Meeting of the Parties (to the Kyoto
Protocol)NM New methodologyNMB New baseline methodologyNMM New monitoring methodologyoda official development assistancePdd Project design documentPIN Project Idea NoteSSc Small scaletcER temporary cERuNFccc united Nations Framework
convention on climate changeVER Verified Emission Reduction
glossary of terms
coP decisions from the checklist
11/CP.7:http://unfccc.int/resource/docs/cop7/13a01.pdf#page=54(Landuse,land-usechange,andforestry)
17/CP.7:http://unfccc.int/resource/docs/cop7/13a02.pdf#page=20(ModalitiesandproceduresforaCleanDevelopmentMecha-nismasdefinedinArticle12oftheKyotoProtocol)
18/CP.9:http://unfccc.int/resource/docs/cop9/06a02.pdf#page=5(GuidancetotheExecutiveBoardoftheCleanDevelopmentMechanism)
19/CP.9:http://unfccc.int/resource/docs/cop9/06a02.pdf#page=13(ModalitiesandproceduresforafforestationandreforestationprojectactivitiesundertheCleanDevelopmentMechanisminthefirstcommitmentperiodoftheKyotoProtocol)
14/CP.10:http://unfccc.int/resource/docs/cop10/10a02.pdf#page=26(Simplifiedmodalitiesandproceduresforsmall-scaleafforesta-tionandreforestationprojectactivitiesunderthecleandevelop-mentmechanisminthefirstcommitmentperiodoftheKyotoProtocolandmeasurestofacilitatetheirimplementation)
S o u r c e b o o k f o r L a n d u S e , L a n d - u S e c h a n g e a n d f o r e S t r y P r o j e c t S � � S o u r c e b o o k f o r L a n d u S e , L a n d - u S e c h a n g e a n d f o r e S t r y P r o j e c t S� �
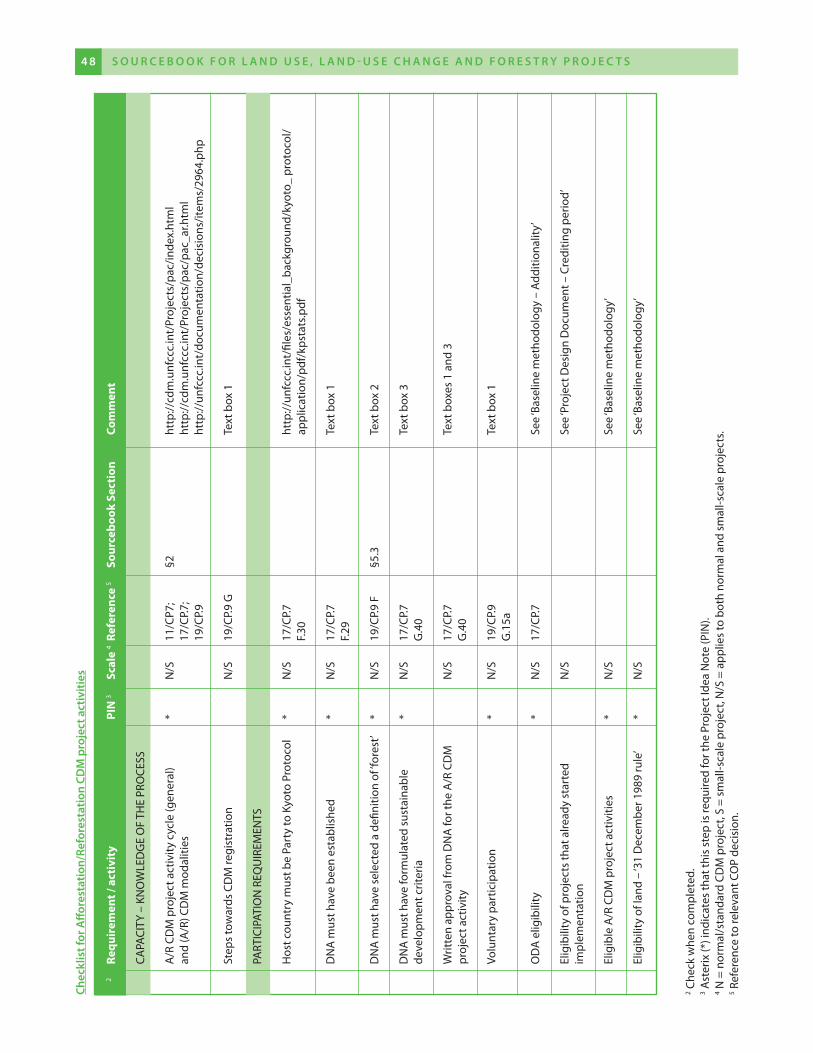
S o u r c e b o o k f o r L a n d u S e , L a n d - u S e c h a n g e a n d f o r e S t r y P r o j e c t S � � S o u r c e b o o k f o r L a n d u S e , L a n d - u S e c h a n g e a n d f o r e S t r y P r o j e c t S� �
chec
klis
t for
affo
rest
atio
n/re
fore
stat
ion
cdm
pro
ject
act
iviti
es
2 Re
quir
emen
t / a
ctiv
ity
PIN
3 Sc
ale
4 Ref
eren
ce 5
Sour
cebo
ok S
ecti
on
Com
men
t
caPa
cIty
– K
No
WLE
dg
E o
F th
E PR
ocE
SS
a
/R c
dM
pro
ject
act
ivity
cyc
le (g
ener
al)
* N
/S
11/c
P7;
§2
http
://cd
m.u
nfcc
c.in
t/Pr
ojec
ts/p
ac/in
dex.
htm
l
and
(a/R
) cd
M m
odal
ities
17
/cP.7
;
http
://cd
m.u
nfcc
c.in
t/Pr
ojec
ts/p
ac/p
ac_a
r.htm
l
19/c
P.9
ht
tp://
unfc
cc.in
t/do
cum
enta
tion/
deci
sion
s/ite
ms/
2964
.php
St
eps
tow
ards
cd
M re
gist
ratio
n
N/S
19
/cP.9
g
te
xt b
ox 1
Pa
RtIc
IPat
IoN
REQ
uIR
EMEN
tS
h
ost c
ount
ry m
ust b
e Pa
rty
to K
yoto
Pro
toco
l *
N/S
17
/cP.7
http
://un
fccc
.int/
files
/ess
entia
l_ba
ckgr
ound
/kyo
to_
prot
ocol
/
F.30
ap
plic
atio
n/pd
f/kp
stat
s.pdf
d
Na
mus
t hav
e be
en e
stab
lishe
d *
N/S
17
/cP.7
text
box
1
F.2
9
d
Na
mus
t hav
e se
lect
ed a
defi
nitio
n of
‘for
est’
* N
/S
19/c
P.9 F
§5
.3
text
box
2
dN
a m
ust h
ave
form
ulat
ed s
usta
inab
le
* N
/S
17/c
P.7
te
xt b
ox 3
de
velo
pmen
t crit
eria
g
.40
W
ritte
n ap
prov
al fr
om d
Na
for t
he a
/R c
dM
N/S
17
/cP.7
text
box
es 1
and
3
proj
ect a
ctiv
ity
g.4
0
Vo
lunt
ary
part
icip
atio
n *
N/S
19
/cP.9
text
box
1
g
.15a
o
da
elig
ibili
ty
* N
/S
17/c
P.7
Se
e ‘B
asel
ine
met
hodo
logy
– a
dditi
onal
ity’
El
igib
ility
of p
roje
cts
that
alre
ady
star
ted
N
/S
See
‘Pro
ject
des
ign
doc
umen
t – c
redi
ting
perio
d’
impl
emen
tatio
n
El
igib
le a
/R c
dM
pro
ject
act
iviti
es
* N
/S
See
‘Bas
elin
e m
etho
dolo
gy’
El
igib
ility
of l
and
– ‘3
1 d
ecem
ber 1
989
rule
’ *
N/S
Se
e ‘B
asel
ine
met
hodo
logy
’
2 che
ck w
hen
com
plet
ed.
3 ast
erix
(*) i
ndic
ates
that
this
ste
p is
requ
ired
for t
he P
roje
ct Id
ea N
ote
(PIN
).4 N
= n
orm
al/s
tand
ard
cdM
pro
ject
, S =
sm
all-s
cale
pro
ject
, N/S
= a
pplie
s to
bot
h no
rmal
and
sm
all-s
cale
pro
ject
s.5 R
efer
ence
to re
leva
nt c
oP
deci
sion
.
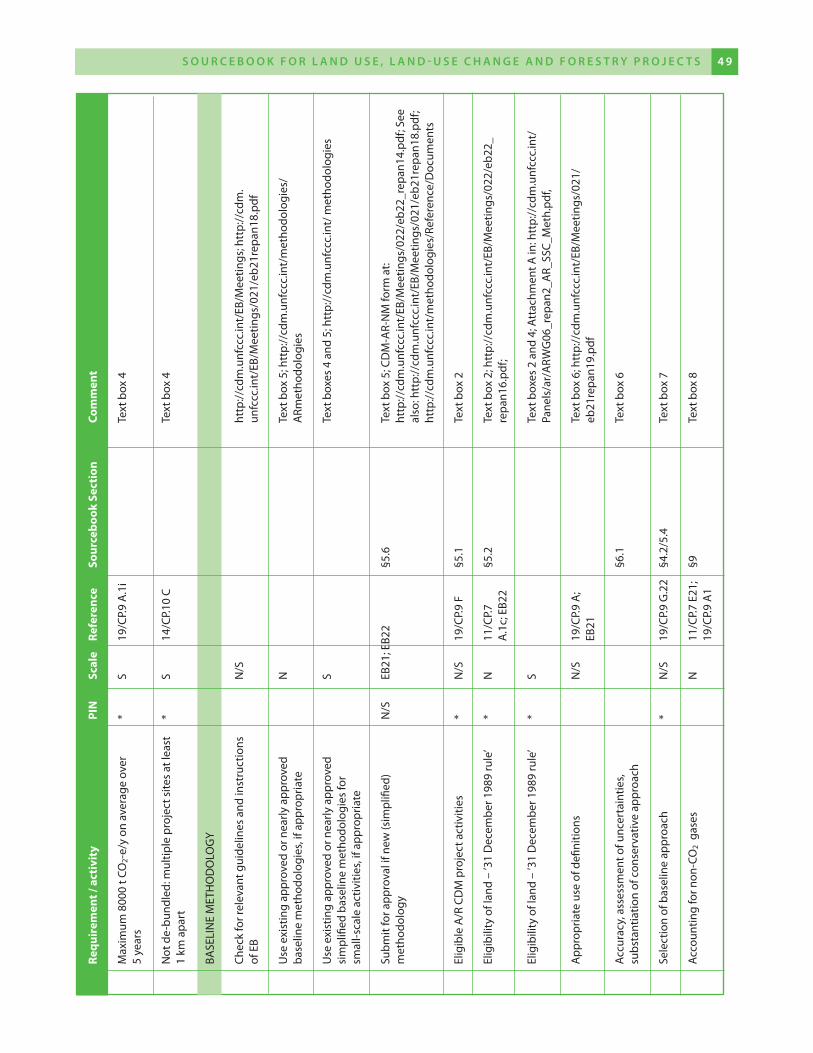
Re
quir
emen
t / a
ctiv
ity
PIN
Sc
ale
Re
fere
nce
So
urce
book
Sec
tion
Co
mm
ent
M
axim
um 8
000
t co
2-e/
y on
ave
rage
ove
r *
S 19
/cP.9
a.1
i
text
box
4
5 ye
ars
N
ot d
e-bu
ndle
d: m
ultip
le p
roje
ct s
ites
at le
ast
* S
14/c
P.10
c
text
box
4
1 km
apa
rt
Ba
SELI
NE
MEt
ho
do
Log
y
ch
eck
for r
elev
ant g
uide
lines
and
inst
ruct
ions
N/S
ht
tp://
cdm
.unf
ccc.
int/
EB/M
eetin
gs; h
ttp:
//cd
m.
of E
B
un
fccc
.int/
EB/M
eetin
gs/0
21/e
b21r
epan
18.p
df
u
se e
xist
ing
appr
oved
or n
early
app
rove
d
N
text
box
5; h
ttp:
//cd
m.u
nfcc
c.in
t/m
etho
dolo
gies
/
base
line
met
hodo
logi
es, i
f app
ropr
iate
a
Rmet
hodo
logi
es
u
se e
xist
ing
appr
oved
or n
early
app
rove
d
S
te
xt b
oxes
4 a
nd 5
; htt
p://
cdm
.unf
ccc.
int/
met
hodo
logi
es
si
mpl
ified
bas
elin
e m
etho
dolo
gies
for
sm
all-s
cale
act
iviti
es, i
f app
ropr
iate
Su
bmit
for a
ppro
val i
f new
(sim
plifi
ed)
N/S
EB
21; E
B22
§5.6
te
xt b
ox 5
; cd
M-a
R-N
M fo
rm a
t:
met
hodo
logy
ht
tp://
cdm
.unf
ccc.
int/
EB/M
eetin
gs/0
22/e
b22_
repa
n14.
pdf;
See
al
so: h
ttp:
//cd
m.u
nfcc
c.in
t/EB
/Mee
tings
/021
/eb2
1rep
an18
;
ht
tp://
cdm
.unf
ccc.
int/
met
hodo
logi
es/R
efer
ence
/doc
umen
ts
El
igib
le a
/R c
dM
pro
ject
act
iviti
es
* N
/S
19/c
P.9 F
§5
.1
text
box
2
El
igib
ility
of l
and
– ’3
1 d
ecem
ber 1
989
rule
’ *
N
11/c
P.7
§5.2
te
xt b
ox 2
; htt
p://
cdm
.unf
ccc.
int/
EB/M
eetin
gs/0
22/e
b22_
a.1
c; E
B22
repa
n16.
pdf;
El
igib
ility
of l
and
– ’3
1 d
ecem
ber 1
989
rule
’ *
S
te
xt b
oxes
2 a
nd 4
; att
achm
ent a
in: h
ttp:
//cd
m.u
nfcc
c.in
t/
Pa
nels
/ar/
aRW
g06
_rep
an2_
aR_
SSc_
Met
h.pd
f,
a
ppro
pria
te u
se o
f defi
nitio
ns
N
/S
19/c
P.9 a
;
text
box
6; h
ttp:
//cd
m.u
nfcc
c.in
t/EB
/Mee
tings
/021
/
EB21
eb21
repa
n19.
ac
cura
cy, a
sses
smen
t of u
ncer
tain
ties,
§6.1
te
xt b
ox 6
su
bsta
ntia
tion
of c
onse
rvat
ive
appr
oach
Se
lect
ion
of b
asel
ine
appr
oach
*
N/S
19
/cP.9
g.2
2 §4
.2/5
.4
text
box
7
ac
coun
ting
for n
on-c
o2
gase
s
N
11/c
P.7 E
21;
§9
text
box
8
19
/cP.9
a1
S o u r c e b o o k f o r L a n d u S e , L a n d - u S e c h a n g e a n d f o r e S t r y P r o j e c t S � � S o u r c e b o o k f o r L a n d u S e , L a n d - u S e c h a n g e a n d f o r e S t r y P r o j e c t S� �
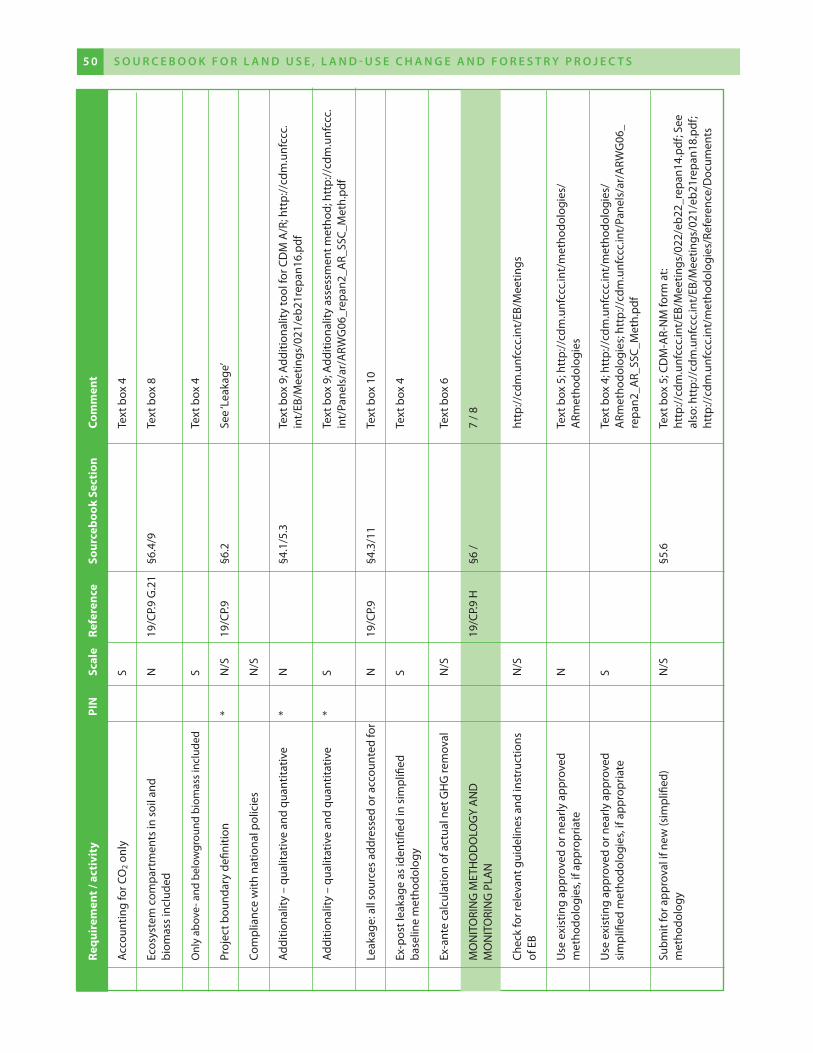
S o u r c e b o o k f o r L a n d u S e , L a n d - u S e c h a n g e a n d f o r e S t r y P r o j e c t S 5 1 S o u r c e b o o k f o r L a n d u S e , L a n d - u S e c h a n g e a n d f o r e S t r y P r o j e c t S5 0
Re
quir
emen
t / a
ctiv
ity
PIN
Sc
ale
Re
fere
nce
So
urce
book
Sec
tion
Co
mm
ent
ac
coun
ting
for c
o2 o
nly
S
text
box
4
Ec
osys
tem
com
part
men
ts in
soi
l and
N
19/c
P.9 g
.21
§6.4
/9
text
box
8
biom
ass
incl
uded
o
nly
abov
e- a
nd b
elow
grou
nd b
iom
ass
incl
uded
S
te
xt b
ox 4
Pr
ojec
t bou
ndar
y de
finiti
on
* N
/S
19/c
P.9
§6.2
Se
e ‘L
eaka
ge’
co
mpl
ianc
e w
ith n
atio
nal p
olic
ies
N
/S
ad
ditio
nalit
y –
qual
itativ
e an
d qu
antit
ativ
e *
N
§4
.1/5
.3
text
box
9; a
dditi
onal
ity to
ol fo
r cd
M a
/R; h
ttp:
//cd
m.u
nfcc
c.
in
t/EB
/Mee
tings
/021
/eb2
1rep
an16
ad
ditio
nalit
y –
qual
itativ
e an
d qu
antit
ativ
e *
S
te
xt b
ox 9
; add
ition
ality
ass
essm
ent m
etho
d; h
ttp:
//cd
m.u
nfcc
c.
int/
Pane
ls/a
r/a
RWg
06_r
epan
2_a
R_SS
c_M
eth.
Le
akag
e: a
ll so
urce
s ad
dres
sed
or a
ccou
nted
for
N
19
/cP.9
§4
.3/1
1 te
xt b
ox 1
0
Ex
-pos
t lea
kage
as
iden
tified
in s
impl
ified
S
te
xt b
ox 4
ba
selin
e m
etho
dolo
gy
Ex
-ant
e ca
lcul
atio
n of
act
ual n
et g
hg
rem
oval
N/S
te
xt b
ox 6
M
oN
Ito
RIN
g M
Eth
od
oLo
gy
aN
d
19/c
P.9 h
§6
/
7 / 8
M
oN
Ito
RIN
g P
LaN
ch
eck
for r
elev
ant g
uide
lines
and
inst
ruct
ions
N/S
ht
tp://
cdm
.unf
ccc.
int/
EB/M
eetin
gs
of
EB
u
se e
xist
ing
appr
oved
or n
early
app
rove
d
N
text
box
5; h
ttp:
//cd
m.u
nfcc
c.in
t/m
etho
dolo
gies
/
met
hodo
logi
es, i
f app
ropr
iate
a
Rmet
hodo
logi
es
u
se e
xist
ing
appr
oved
or n
early
app
rove
d
S
te
xt b
ox 4
; htt
p://
cdm
.unf
ccc.
int/
met
hodo
logi
es/
si
mpl
ified
met
hodo
logi
es, i
f app
ropr
iate
a
Rmet
hodo
logi
es; h
ttp:
//cd
m.u
nfcc
c.in
t/Pa
nels
/ar/
aRW
g06
_
re
pan2
_aR_
SSc_
Met
h.pd
f
Su
bmit
for a
ppro
val i
f new
(sim
plifi
ed)
N
/S
§5
.6
text
box
5; c
dM
-aR-
NM
form
at:
m
etho
dolo
gy
http
://cd
m.u
nfcc
c.in
t/EB
/Mee
tings
/022
/eb2
2_re
pan1
4.pd
f; Se
e
also
: htt
p://
cdm
.unf
ccc.
int/
EB/M
eetin
gs/0
21/e
b21r
epan
18.p
df;
http
://cd
m.u
nfcc
c.in
t/m
etho
dolo
gies
/Ref
eren
ce/d
ocum
ents
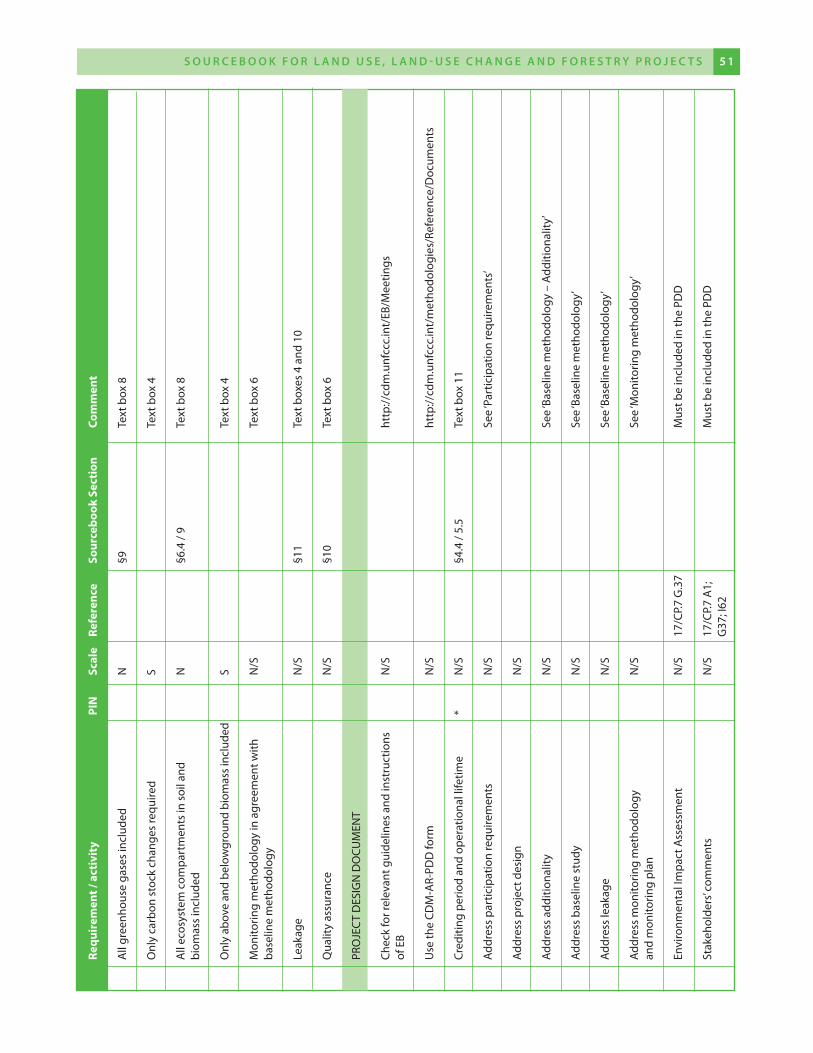
Re
quir
emen
t / a
ctiv
ity
PIN
Sc
ale
Re
fere
nce
So
urce
book
Sec
tion
Co
mm
ent
a
ll gr
eenh
ouse
gas
es in
clud
ed
N
§9
text
box
8
onl
y ca
rbon
sto
ck c
hang
es re
quire
d
S
te
xt b
ox 4
a
ll ec
osys
tem
com
part
men
ts in
soi
l and
N
§6
.4 /
9 te
xt b
ox 8
bi
omas
s in
clud
ed
o
nly
abov
e an
d be
low
grou
nd b
iom
ass
incl
uded
S
te
xt b
ox 4
M
onito
ring
met
hodo
logy
in a
gree
men
t with
N/S
te
xt b
ox 6
ba
selin
e m
etho
dolo
gy
Le
akag
e
N/S
§11
text
box
es 4
and
10
Q
ualit
y as
sura
nce
N
/S
§1
0 te
xt b
ox 6
PR
oJE
ct
dES
IgN
do
cuM
ENt
ch
eck
for r
elev
ant g
uide
lines
and
inst
ruct
ions
N/S
ht
tp://
cdm
.unf
ccc.
int/
EB/M
eetin
gs
of
EB
u
se th
e cd
M-a
R-Pd
d fo
rm
N
/S
http
://cd
m.u
nfcc
c.in
t/m
etho
dolo
gies
/Ref
eren
ce/d
ocum
ents
cr
editi
ng p
erio
d an
d op
erat
iona
l life
time
* N
/S
§4
.4 /
5.5
text
box
11
ad
dres
s pa
rtic
ipat
ion
requ
irem
ents
N/S
Se
e ‘P
artic
ipat
ion
requ
irem
ents
’
ad
dres
s pr
ojec
t des
ign
N
/S
ad
dres
s ad
ditio
nalit
y
N/S
Se
e ‘B
asel
ine
met
hodo
logy
– a
dditi
onal
ity’
ad
dres
s ba
selin
e st
udy
N
/S
See
‘Bas
elin
e m
etho
dolo
gy’
ad
dres
s le
akag
e
N/S
Se
e ‘B
asel
ine
met
hodo
logy
’
ad
dres
s m
onito
ring
met
hodo
logy
N/S
Se
e ‘M
onito
ring
met
hodo
logy
’
and
mon
itorin
g pl
an
Envi
ronm
enta
l Im
pact
ass
essm
ent
N
/S
17/c
P.7 g
.37
M
ust b
e in
clud
ed in
the
Pdd
St
akeh
olde
rs’ c
omm
ents
N/S
17
/cP.7
a1;
Mus
t be
incl
uded
in th
e Pd
d
g
37; I
62
S o u r c e b o o k f o r L a n d u S e , L a n d - u S e c h a n g e a n d f o r e S t r y P r o j e c t S 5 1 S o u r c e b o o k f o r L a n d u S e , L a n d - u S e c h a n g e a n d f o r e S t r y P r o j e c t S5 0
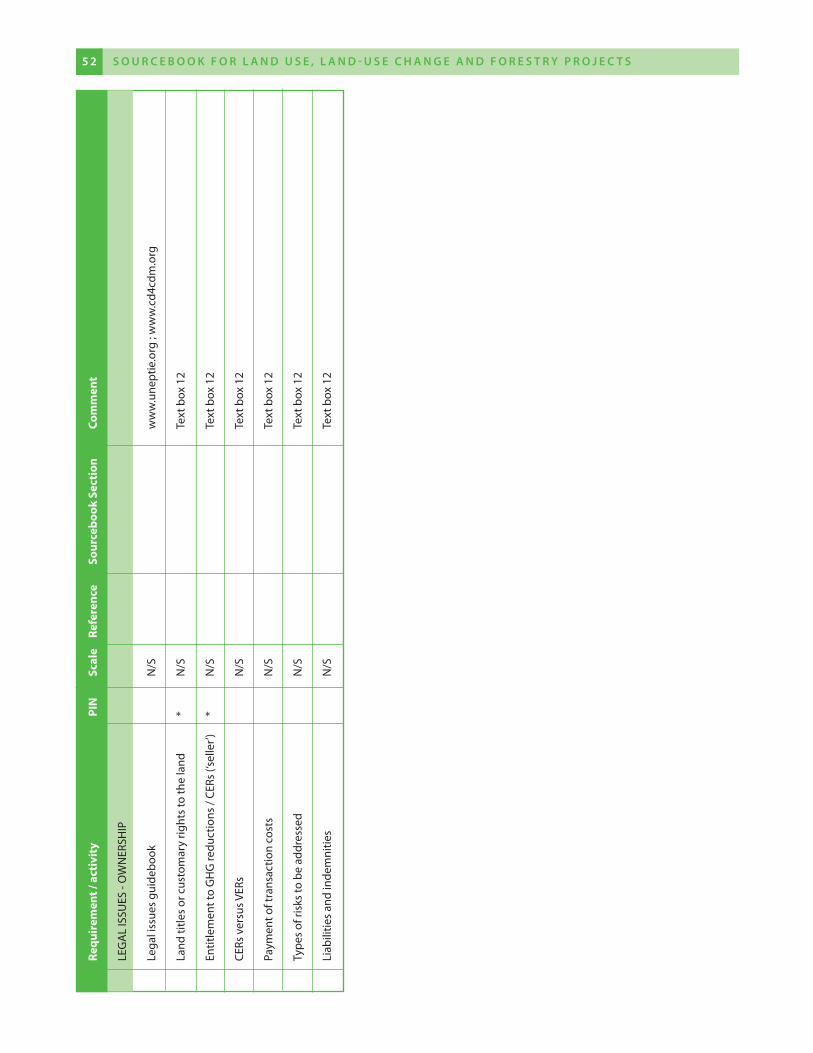
S o u r c e b o o k f o r L a n d u S e , L a n d - u S e c h a n g e a n d f o r e S t r y P r o j e c t S 5 � S o u r c e b o o k f o r L a n d u S e , L a n d - u S e c h a n g e a n d f o r e S t r y P r o j e c t S5 2
Re
quir
emen
t / a
ctiv
ity
PIN
Sc
ale
Re
fere
nce
So
urce
book
Sec
tion
Co
mm
ent
LE
ga
L IS
SuES
- o
WN
ERSh
IP
Le
gal i
ssue
s gu
ideb
ook
N
/S
ww
w.u
nept
ie.o
rg ;
ww
w.c
d4cd
m.o
rg
La
nd ti
tles
or c
usto
mar
y rig
hts
to th
e la
nd
* N
/S
text
box
12
En
title
men
t to
gh
g re
duct
ions
/ cE
Rs (‘
selle
r’)
* N
/S
text
box
12
cE
Rs v
ersu
s VER
s
N/S
te
xt b
ox 1
2
Pa
ymen
t of t
rans
actio
n co
sts
N
/S
text
box
12
ty
pes
of ri
sks
to b
e ad
dres
sed
N
/S
text
box
12
Li
abili
ties
and
inde
mni
ties
N
/S
text
box
12
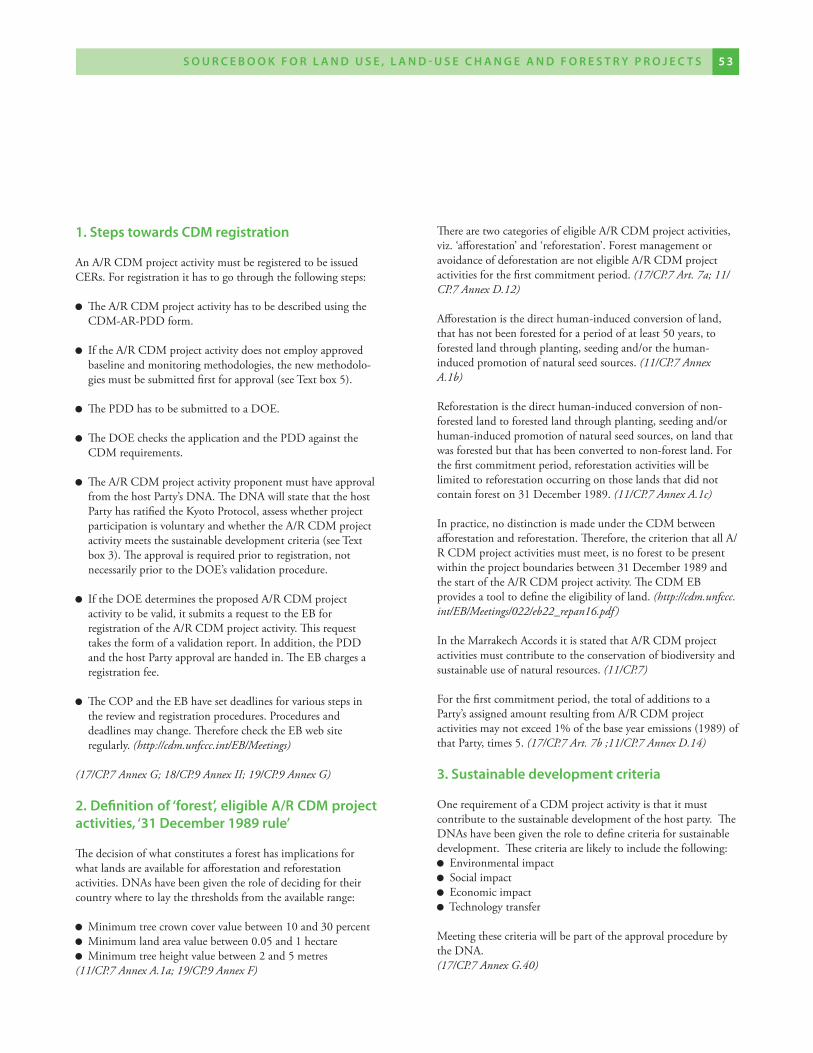
1. Steps towards cdm registration
AnA/RCDMprojectactivitymustberegisteredtobeissuedCERs.Forregistrationithastogothroughthefollowingsteps:
TheA/RCDMprojectactivityhastobedescribedusingtheCDM-AR-PDDform.
IftheA/RCDMprojectactivitydoesnotemployapprovedbaselineandmonitoringmethodologies,thenewmethodolo-giesmustbesubmittedfirstforapproval(seeTextbox5).
ThePDDhastobesubmittedtoaDOE.
TheDOEcheckstheapplicationandthePDDagainsttheCDMrequirements.
TheA/RCDMprojectactivityproponentmusthaveapprovalfromthehostParty’sDNA.TheDNAwillstatethatthehostPartyhasratifiedtheKyotoProtocol,assesswhetherprojectparticipationisvoluntaryandwhethertheA/RCDMprojectactivitymeetsthesustainabledevelopmentcriteria(seeTextbox3).Theapprovalisrequiredpriortoregistration,notnecessarilypriortotheDOE’svalidationprocedure.
IftheDOEdeterminestheproposedA/RCDMprojectactivitytobevalid,itsubmitsarequesttotheEBforregistrationoftheA/RCDMprojectactivity.Thisrequesttakestheformofavalidationreport.Inaddition,thePDDandthehostPartyapprovalarehandedin.TheEBchargesaregistrationfee.
TheCOPandtheEBhavesetdeadlinesforvariousstepsinthereviewandregistrationprocedures.Proceduresanddeadlinesmaychange.ThereforechecktheEBwebsiteregularly.(http://cdm.unfccc.int/EB/Meetings)
(17/CP.7 Annex G; 18/CP.9 Annex II; 19/CP.9 Annex G)
2. definition of ‘forest’, eligible a/r cdm project activities, ‘�1 december 1��� rule’
Thedecisionofwhatconstitutesaforesthasimplicationsforwhatlandsareavailableforafforestationandreforestationactivities.DNAshavebeengiventheroleofdecidingfortheircountrywheretolaythethresholdsfromtheavailablerange:
Minimumtreecrowncovervaluebetween10and30percentMinimumlandareavaluebetween0.05and1hectareMinimumtreeheightvaluebetween2and5metres
(11/CP.7 Annex A.1a; 19/CP.9 Annex F)
TherearetwocategoriesofeligibleA/RCDMprojectactivities,viz.‘afforestation’and‘reforestation’.ForestmanagementoravoidanceofdeforestationarenoteligibleA/RCDMprojectactivitiesforthefirstcommitmentperiod.(17/CP.7 Art. 7a; 11/CP.7 Annex D.12)
Afforestationisthedirecthuman-inducedconversionofland,thathasnotbeenforestedforaperiodofatleast50years,toforestedlandthroughplanting,seedingand/orthehuman-inducedpromotionofnaturalseedsources.(11/CP.7 Annex A.1b)
Reforestationisthedirecthuman-inducedconversionofnon-forestedlandtoforestedlandthroughplanting,seedingand/orhuman-inducedpromotionofnaturalseedsources,onlandthatwasforestedbutthathasbeenconvertedtonon-forestland.Forthefirstcommitmentperiod,reforestationactivitieswillbelimitedtoreforestationoccurringonthoselandsthatdidnotcontainforeston31December1989.(11/CP.7 Annex A.1c)
Inpractice,nodistinctionismadeundertheCDMbetweenafforestationandreforestation.Therefore,thecriterionthatallA/RCDMprojectactivitiesmustmeet,isnoforesttobepresentwithintheprojectboundariesbetween31December1989andthestartoftheA/RCDMprojectactivity.TheCDMEBprovidesatooltodefinetheeligibilityofland.(http://cdm.unfccc.int/EB/Meetings/022/eb22_repan16.pdf )
IntheMarrakechAccordsitisstatedthatA/RCDMprojectactivitiesmustcontributetotheconservationofbiodiversityandsustainableuseofnaturalresources.(11/CP.7)
Forthefirstcommitmentperiod,thetotalofadditionstoaParty’sassignedamountresultingfromA/RCDMprojectactivitiesmaynotexceed1%ofthebaseyearemissions(1989)ofthatParty,times5.(17/CP.7 Art. 7b ;11/CP.7 Annex D.14)
�. Sustainable development criteria
OnerequirementofaCDMprojectactivityisthatitmustcontributetothesustainabledevelopmentofthehostparty.TheDNAshavebeengiventheroletodefinecriteriaforsustainabledevelopment.Thesecriteriaarelikelytoincludethefollowing:
EnvironmentalimpactSocialimpactEconomicimpactTechnologytransfer
MeetingthesecriteriawillbepartoftheapprovalprocedurebytheDNA.(17/CP.7 Annex G.40)
S o u r c e b o o k f o r L a n d u S e , L a n d - u S e c h a n g e a n d f o r e S t r y P r o j e c t S 5 � S o u r c e b o o k f o r L a n d u S e , L a n d - u S e c h a n g e a n d f o r e S t r y P r o j e c t S5 2
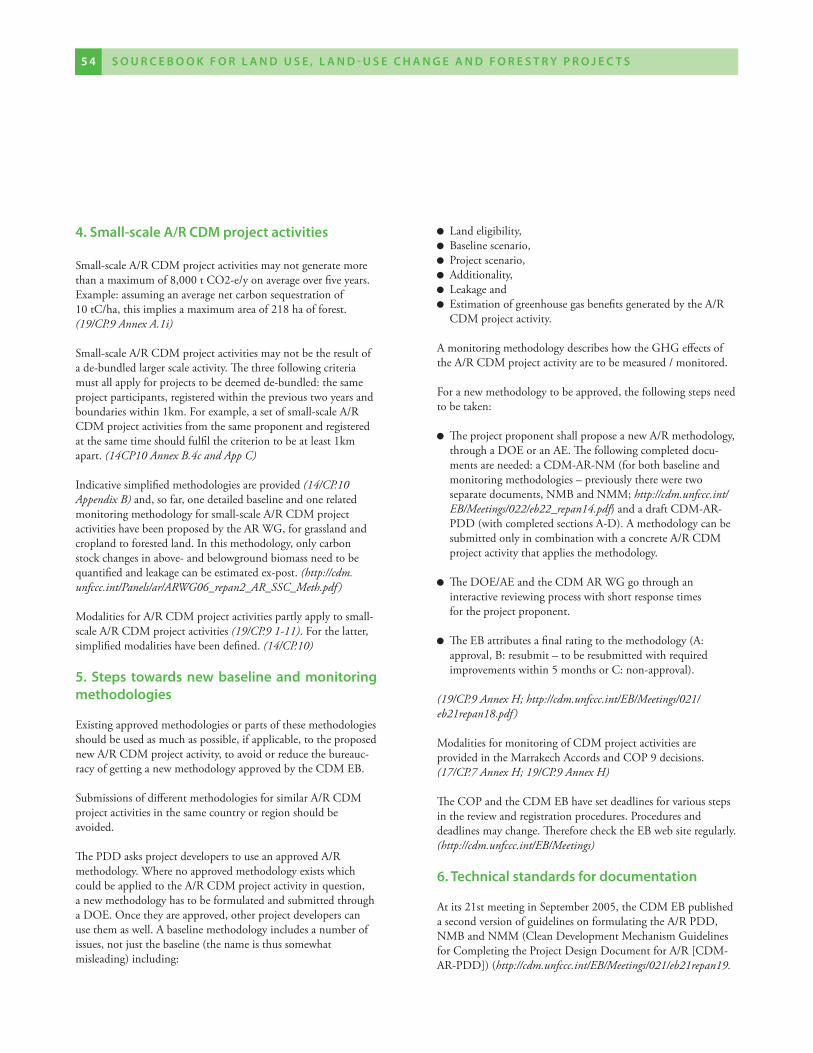
S o u r c e b o o k f o r L a n d u S e , L a n d - u S e c h a n g e a n d f o r e S t r y P r o j e c t S 5 5 S o u r c e b o o k f o r L a n d u S e , L a n d - u S e c h a n g e a n d f o r e S t r y P r o j e c t S5 �
�. Small-scale a/r cdm project activities
Small-scaleA/RCDMprojectactivitiesmaynotgeneratemorethanamaximumof8,000tCO2-e/yonaverageoverfiveyears.Example:assuminganaveragenetcarbonsequestrationof10tC/ha,thisimpliesamaximumareaof218haofforest.(19/CP.9 Annex A.1i)
Small-scaleA/RCDMprojectactivitiesmaynotbetheresultofade-bundledlargerscaleactivity.Thethreefollowingcriteriamustallapplyforprojectstobedeemedde-bundled:thesameprojectparticipants,registeredwithintheprevioustwoyearsandboundarieswithin1km.Forexample,asetofsmall-scaleA/RCDMprojectactivitiesfromthesameproponentandregisteredatthesametimeshouldfulfilthecriteriontobeatleast1kmapart.(14CP10 Annex B.4c and App C)
Indicativesimplifiedmethodologiesareprovided(14/CP.10 Appendix B)and,sofar,onedetailedbaselineandonerelatedmonitoringmethodologyforsmall-scaleA/RCDMprojectactivitieshavebeenproposedbytheARWG,forgrasslandandcroplandtoforestedland.Inthismethodology,onlycarbonstockchangesinabove-andbelowgroundbiomassneedtobequantifiedandleakagecanbeestimatedex-post.(http://cdm.unfccc.int/Panels/ar/ARWG06_repan2_AR_SSC_Meth.pdf )
ModalitiesforA/RCDMprojectactivitiespartlyapplytosmall-scaleA/RCDMprojectactivities(19/CP.9 1-11).Forthelatter,simplifiedmodalitieshavebeendefined.(14/CP.10)
5. Steps towards new baseline and monitoring methodologies
Existingapprovedmethodologiesorpartsofthesemethodologiesshouldbeusedasmuchaspossible,ifapplicable,totheproposednewA/RCDMprojectactivity,toavoidorreducethebureauc-racyofgettinganewmethodologyapprovedbytheCDMEB.
SubmissionsofdifferentmethodologiesforsimilarA/RCDMprojectactivitiesinthesamecountryorregionshouldbeavoided.
ThePDDasksprojectdeveloperstouseanapprovedA/Rmethodology.WherenoapprovedmethodologyexistswhichcouldbeappliedtotheA/RCDMprojectactivityinquestion,anewmethodologyhastobeformulatedandsubmittedthroughaDOE.Oncetheyareapproved,otherprojectdeveloperscanusethemaswell.Abaselinemethodologyincludesanumberofissues,notjustthebaseline(thenameisthussomewhatmisleading)including:
Landeligibility,Baselinescenario,Projectscenario,Additionality,LeakageandEstimationofgreenhousegasbenefitsgeneratedbytheA/RCDMprojectactivity.
AmonitoringmethodologydescribeshowtheGHGeffectsoftheA/RCDMprojectactivityaretobemeasured/monitored.
Foranewmethodologytobeapproved,thefollowingstepsneedtobetaken:
TheprojectproponentshallproposeanewA/Rmethodology,throughaDOEoranAE.Thefollowingcompleteddocu-mentsareneeded:aCDM-AR-NM(forbothbaselineandmonitoringmethodologies–previouslythereweretwoseparatedocuments,NMBandNMM;http://cdm.unfccc.int/EB/Meetings/022/eb22_repan14.pdf)andadraftCDM-AR-PDD(withcompletedsectionsA-D).AmethodologycanbesubmittedonlyincombinationwithaconcreteA/RCDMprojectactivitythatappliesthemethodology.
TheDOE/AEandtheCDMARWGgothroughaninteractivereviewingprocesswithshortresponsetimesfortheprojectproponent.
TheEBattributesafinalratingtothemethodology(A:approval,B:resubmit–toberesubmittedwithrequiredimprovementswithin5monthsorC:non-approval).
(19/CP.9 Annex H; http://cdm.unfccc.int/EB/Meetings/021/eb21repan18.pdf )
ModalitiesformonitoringofCDMprojectactivitiesareprovidedintheMarrakechAccordsandCOP9decisions.(17/CP.7 Annex H; 19/CP.9 Annex H)
TheCOPandtheCDMEBhavesetdeadlinesforvariousstepsinthereviewandregistrationprocedures.Proceduresanddeadlinesmaychange.ThereforechecktheEBwebsiteregularly.(http://cdm.unfccc.int/EB/Meetings)
�. technical standards for documentation
Atits21stmeetinginSeptember2005,theCDMEBpublishedasecondversionofguidelinesonformulatingtheA/RPDD,NMBandNMM(CleanDevelopmentMechanismGuidelinesforCompletingtheProjectDesignDocumentforA/R[CDM-AR-PDD])(http://cdm.unfccc.int/EB/Meetings/021/eb21repan19.
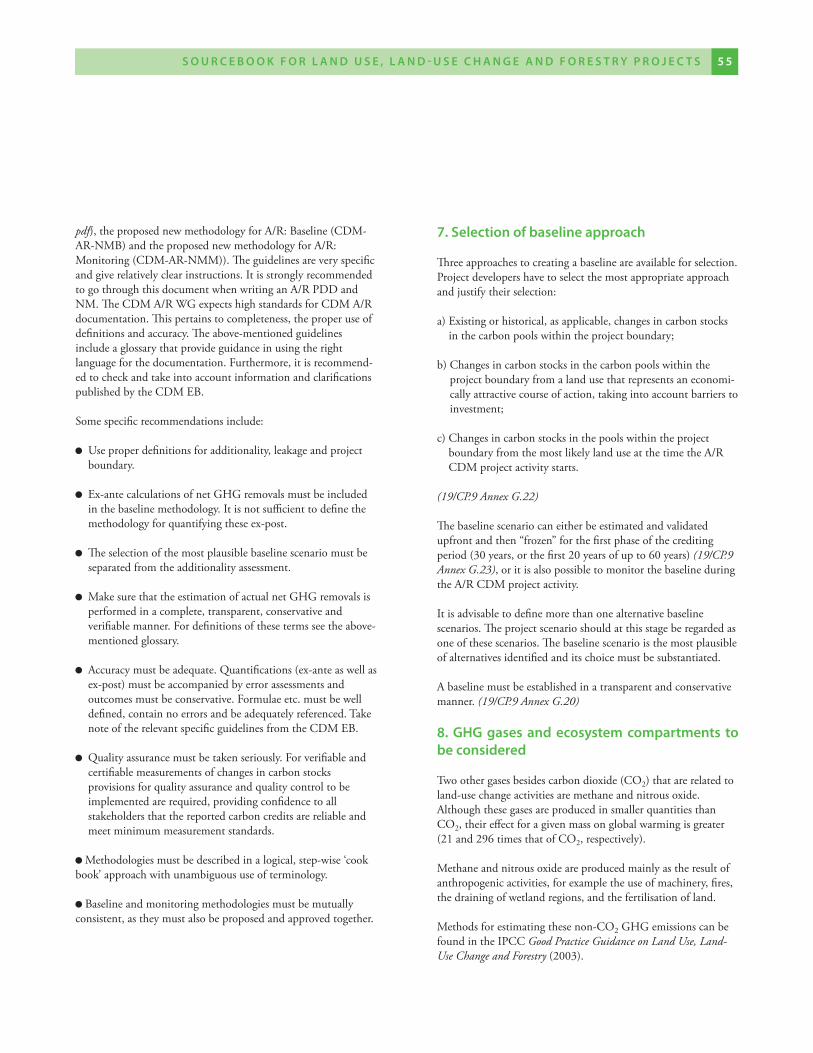
pdf),theproposednewmethodologyforA/R:Baseline(CDM-AR-NMB)andtheproposednewmethodologyforA/R:Monitoring(CDM-AR-NMM)).Theguidelinesareveryspecificandgiverelativelyclearinstructions.ItisstronglyrecommendedtogothroughthisdocumentwhenwritinganA/RPDDandNM.TheCDMA/RWGexpectshighstandardsforCDMA/Rdocumentation.Thispertainstocompleteness,theproperuseofdefinitionsandaccuracy.Theabove-mentionedguidelinesincludeaglossarythatprovideguidanceinusingtherightlanguageforthedocumentation.Furthermore,itisrecommend-edtocheckandtakeintoaccountinformationandclarificationspublishedbytheCDMEB.
Somespecificrecommendationsinclude:
Useproperdefinitionsforadditionality,leakageandprojectboundary.
Ex-antecalculationsofnetGHGremovalsmustbeincludedinthebaselinemethodology.Itisnotsufficienttodefinethemethodologyforquantifyingtheseex-post.
Theselectionofthemostplausiblebaselinescenariomustbeseparatedfromtheadditionalityassessment.
MakesurethattheestimationofactualnetGHGremovalsisperformedinacomplete,transparent,conservativeandverifiablemanner.Fordefinitionsofthesetermsseetheabove-mentionedglossary.
Accuracymustbeadequate.Quantifications(ex-anteaswellasex-post)mustbeaccompaniedbyerrorassessmentsandoutcomesmustbeconservative.Formulaeetc.mustbewelldefined,containnoerrorsandbeadequatelyreferenced.TakenoteoftherelevantspecificguidelinesfromtheCDMEB.
Qualityassurancemustbetakenseriously.Forverifiableandcertifiablemeasurementsofchangesincarbonstocksprovisionsforqualityassuranceandqualitycontroltobeimplementedarerequired,providingconfidencetoallstakeholdersthatthereportedcarboncreditsarereliableandmeetminimummeasurementstandards.
Methodologiesmustbedescribedinalogical,step-wise‘cookbook’approachwithunambiguoususeofterminology.
Baselineandmonitoringmethodologiesmustbemutuallyconsistent,astheymustalsobeproposedandapprovedtogether.
�. Selection of baseline approach
Threeapproachestocreatingabaselineareavailableforselection.Projectdevelopershavetoselectthemostappropriateapproachandjustifytheirselection:
a)Existingorhistorical,asapplicable,changesincarbonstocksinthecarbonpoolswithintheprojectboundary;
b)Changesincarbonstocksinthecarbonpoolswithintheprojectboundaryfromalandusethatrepresentsaneconomi-callyattractivecourseofaction,takingintoaccountbarrierstoinvestment;
c)ChangesincarbonstocksinthepoolswithintheprojectboundaryfromthemostlikelylanduseatthetimetheA/RCDMprojectactivitystarts.
(19/CP.9 Annex G.22)
Thebaselinescenariocaneitherbeestimatedandvalidatedupfrontandthen“frozen”forthefirstphaseofthecreditingperiod(30years,orthefirst20yearsofupto60years)(19/CP.9 Annex G.23),oritisalsopossibletomonitorthebaselineduringtheA/RCDMprojectactivity.
Itisadvisabletodefinemorethanonealternativebaselinescenarios.Theprojectscenarioshouldatthisstageberegardedasoneofthesescenarios.Thebaselinescenarioisthemostplausibleofalternativesidentifiedanditschoicemustbesubstantiated.
Abaselinemustbeestablishedinatransparentandconservativemanner.(19/CP.9 Annex G.20)
�. ghg gases and ecosystem compartments to be considered
Twoothergasesbesidescarbondioxide(CO2)thatarerelatedtoland-usechangeactivitiesaremethaneandnitrousoxide.AlthoughthesegasesareproducedinsmallerquantitiesthanCO2,theireffectforagivenmassonglobalwarmingisgreater(21and296timesthatofCO2,respectively).
Methaneandnitrousoxideareproducedmainlyastheresultofanthropogenicactivities,forexampletheuseofmachinery,fires,thedrainingofwetlandregions,andthefertilisationofland.
Methodsforestimatingthesenon-CO2GHGemissionscanbefoundintheIPCCGood Practice Guidance on Land Use, Land-Use Change and Forestry (2003).
S o u r c e b o o k f o r L a n d u S e , L a n d - u S e c h a n g e a n d f o r e S t r y P r o j e c t S 5 5 S o u r c e b o o k f o r L a n d u S e , L a n d - u S e c h a n g e a n d f o r e S t r y P r o j e c t S5 �
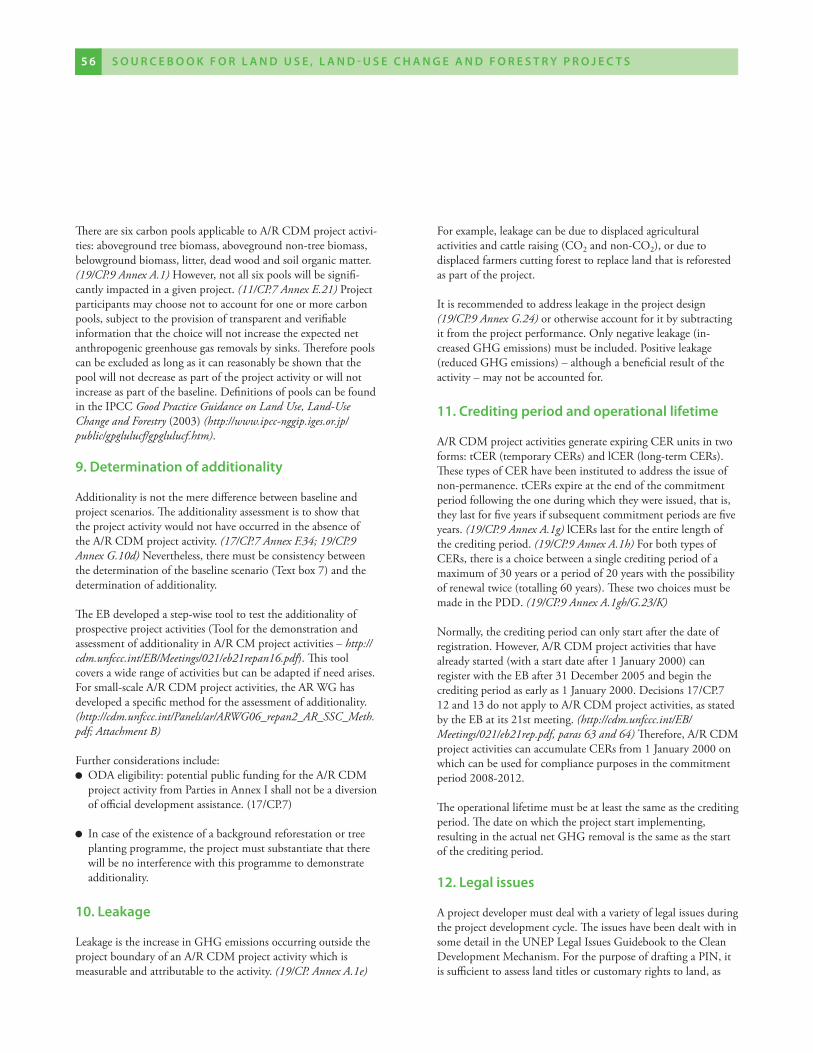
S o u r c e b o o k f o r L a n d u S e , L a n d - u S e c h a n g e a n d f o r e S t r y P r o j e c t S 5 � S o u r c e b o o k f o r L a n d u S e , L a n d - u S e c h a n g e a n d f o r e S t r y P r o j e c t S5 �
TherearesixcarbonpoolsapplicabletoA/RCDMprojectactivi-ties:abovegroundtreebiomass,abovegroundnon-treebiomass,belowgroundbiomass,litter,deadwoodandsoilorganicmatter.(19/CP.9 Annex A.1)However,notallsixpoolswillbesignifi-cantlyimpactedinagivenproject.(11/CP.7 Annex E.21)Projectparticipantsmaychoosenottoaccountforoneormorecarbonpools,subjecttotheprovisionoftransparentandverifiableinformationthatthechoicewillnotincreasetheexpectednetanthropogenicgreenhousegasremovalsbysinks.Thereforepoolscanbeexcludedaslongasitcanreasonablybeshownthatthepoolwillnotdecreaseaspartoftheprojectactivityorwillnotincreaseaspartofthebaseline.DefinitionsofpoolscanbefoundintheIPCCGood Practice Guidance on Land Use, Land-Use Change and Forestry (2003)(http://www.ipcc-nggip.iges.or.jp/public/gpglulucf/gpglulucf.htm).
�. determination of additionality
Additionalityisnotthemeredifferencebetweenbaselineandprojectscenarios.TheadditionalityassessmentistoshowthattheprojectactivitywouldnothaveoccurredintheabsenceoftheA/RCDMprojectactivity.(17/CP.7 Annex F.34; 19/CP.9 Annex G.10d) Nevertheless,theremustbeconsistencybetweenthedeterminationofthebaselinescenario(Textbox7)andthedeterminationofadditionality.
TheEBdevelopedastep-wisetooltotesttheadditionalityofprospectiveprojectactivities(ToolforthedemonstrationandassessmentofadditionalityinA/RCMprojectactivities–http://cdm.unfccc.int/EB/Meetings/021/eb21repan16.pdf).Thistoolcoversawiderangeofactivitiesbutcanbeadaptedifneedarises.Forsmall-scaleA/RCDMprojectactivities,theARWGhasdevelopedaspecificmethodfortheassessmentofadditionality.(http://cdm.unfccc.int/Panels/ar/ARWG06_repan2_AR_SSC_Meth.pdf; Attachment B)
Furtherconsiderationsinclude:ODAeligibility:potentialpublicfundingfortheA/RCDMprojectactivityfromPartiesinAnnexIshallnotbeadiversionofofficialdevelopmentassistance.(17/CP.7)
Incaseoftheexistenceofabackgroundreforestationortreeplantingprogramme,theprojectmustsubstantiatethattherewillbenointerferencewiththisprogrammetodemonstrateadditionality.
10. Leakage
LeakageistheincreaseinGHGemissionsoccurringoutsidetheprojectboundaryofanA/RCDMprojectactivitywhichismeasurableandattributabletotheactivity.(19/CP. Annex A.1e)
Forexample,leakagecanbeduetodisplacedagriculturalactivitiesandcattleraising(CO2andnon-CO2),orduetodisplacedfarmerscuttingforesttoreplacelandthatisreforestedaspartoftheproject.
Itisrecommendedtoaddressleakageintheprojectdesign(19/CP.9 Annex G.24)orotherwiseaccountforitbysubtractingitfromtheprojectperformance.Onlynegativeleakage(in-creasedGHGemissions)mustbeincluded.Positiveleakage(reducedGHGemissions)–althoughabeneficialresultoftheactivity–maynotbeaccountedfor.
11. crediting period and operational lifetime
A/RCDMprojectactivitiesgenerateexpiringCERunitsintwoforms:tCER(temporaryCERs)andlCER(long-termCERs).ThesetypesofCERhavebeeninstitutedtoaddresstheissueofnon-permanence.tCERsexpireattheendofthecommitmentperiodfollowingtheoneduringwhichtheywereissued,thatis,theylastforfiveyearsifsubsequentcommitmentperiodsarefiveyears.(19/CP.9 Annex A.1g)lCERslastfortheentirelengthofthecreditingperiod.(19/CP.9 Annex A.1h) ForbothtypesofCERs,thereisachoicebetweenasinglecreditingperiodofamaximumof30yearsoraperiodof20yearswiththepossibilityofrenewaltwice(totalling60years).ThesetwochoicesmustbemadeinthePDD.(19/CP.9 Annex A.1gh/G.23/K)
Normally,thecreditingperiodcanonlystartafterthedateofregistration.However,A/RCDMprojectactivitiesthathavealreadystarted(withastartdateafter1January2000)canregisterwiththeEBafter31December2005andbeginthecreditingperiodasearlyas1January2000.Decisions17/CP.712and13donotapplytoA/RCDMprojectactivities,asstatedbytheEBatits21stmeeting.(http://cdm.unfccc.int/EB/Meetings/021/eb21rep.pdf, paras 63 and 64)Therefore,A/RCDMprojectactivitiescanaccumulateCERsfrom1January2000onwhichcanbeusedforcompliancepurposesinthecommitmentperiod2008-2012.
Theoperationallifetimemustbeatleastthesameasthecreditingperiod.Thedateonwhichtheprojectstartimplementing,resultingintheactualnetGHGremovalisthesameasthestartofthecreditingperiod.
12. Legal issues
Aprojectdevelopermustdealwithavarietyoflegalissuesduringtheprojectdevelopmentcycle.TheissueshavebeendealtwithinsomedetailintheUNEPLegalIssuesGuidebooktotheCleanDevelopmentMechanism.ForthepurposeofdraftingaPIN,itissufficienttoassesslandtitlesorcustomaryrightstoland,as
thishasabearingonwhowillhaveownershipoftheproductsoftheCDMA/Rprojectactivity,dependingonlocallegislation.
InparticularthefollowingissuesmustnotbeoverlookedinthePDDwritingstage:
EntitlementtoGHGreductions/CERs:Checklocallegislationtoassessifthehostcountrygovernmenthaspre-existingrightsonCERsoriflandownersalsoowntheCERsgeneratedontheirland.EstablishwhoexactlyistheselleroftheCERs.
CERsversusVERs:Establishthenatureoftherightsbeingsold.CERsarenotgeneratediftheprojectfails,butinthatcaseVERsmaystillbeasecondoption.
Paymentoftransactioncosts:ItmustbeclearwhowillpayforthecostofcreatingCERs,includinghiringaDOE,registra-tionandmonitoringandverification.IfthesecostsarenotpartoftheCER’sprice,theymustbeallocatedtoeitherthebuyerortheseller.
Typesofriskstobeaddressed:Policyrisk(politicalandregulatoryuncertaintiesindevelopingcountries)andA/RCDMprojectactivityrisk(occurringinanykindofproject)canbedealtwithincontractsandareusuallyreflectedinthepurchasingpriceoftheCERs.Forexample,EuropeancompaniesbuyemissionreductionsfromtheEuropeanEmissionTradingsystem(lowrisk)atahigherpricethanCERsfromCDMprojects(higherrisk).KyotoProtocolrisksarespecifictothislegalframeworkandinclude,amongstothers,unexpectedchangesininternationalagreements,oppositionofNGOs,CERmarketrisks,failingcompliancewithKyotoProtocolandrelatedrules,etc.Theserisksmustbecontractu-allyassigned.
Liabilitiesandindemnities:Ensurethatnoliabilitiesexistthatarebeyondthecontroloftheprojectdeveloper.
(www.uneptie.org/energy/publications/pdfs/CDMLegalIssuesguide-book.pdf orwww.cd4cdm.org/Publications/CDM%20Legal%20Issues%20Guidebook.pdf )
S o u r c e b o o k f o r L a n d u S e , L a n d - u S e c h a n g e a n d f o r e S t r y P r o j e c t S 5 � S o u r c e b o o k f o r L a n d u S e , L a n d - u S e c h a n g e a n d f o r e S t r y P r o j e c t S5 �