Embed Size (px)
Citation preview

Romanian Reports in Physics, Vol. 64, No. 2, P. 555–570, 2012
PEAK GROUND ACCELERATION, VELOCITY AND DISPLACEMENT FROM MODERATE MAGNITUDE
UNDERCRUSTAL EARTHQUAKES OF VRANCEA REGION
L. ARDELEANU, B. GRECU, V. RAILEANU
National Institute for Earth Physic, P.O.Box MG-2, RO-077125 Bucharest-Magurele, Romania, E-mail: [email protected]
Received June 10, 2011
Abstract. The goal of the study is to analyze the distributions of peak ground acceleration, velocity and displacement from 18 moderate size undercrustal earthquakes (Mw 4.0-5.0), which occurred in the Vrancea region during the period 2008–2010. The patterns of the investigated ground motion parameters keep the general features observed for the strong Vrancea earthquakes – a rapid decrease of the ground shaking in SE-NW direction, and a prominent asymmetry of the isolines. The variability noticed among the individual distributions appears as a result of the combined effects of the hypocenter location within the seismogenic zone (focal depth and epicenter position) and diversity of the focal mechanisms.
Key words: Moderate size Vrancea undercrustal earthquakes, ground acceleration, ground velocity, ground displacement, local effects.
1. INTRODUCTION
Vrancea seismic region is well known by its undercrustal earthquakes with magnitude Mw > 7.0, that are felt within a wide area but with catastrophic effects only in the Extra-Carpathian zone. Fortunately the strong earthquakes are relatively rare, about 2–4 events/century. The in-between seismic activity may be characterized as low-to-moderate; observational data during the last decades indicate a few Mw > 4 events per year, while the occurrence rate of an event with Mw ≥ 5 is less than one per year. The seismological network of the National Institute for Earth Physics (NIEP-SN) covers the territory of Romania with several types of seismic instruments. All the stations are equipped with accelerometers (2gEpi sensors); in addition, broadband (CMG3ESP, CMG40T, KS2000, KS54000, STS2) or short period (SH-1, S13, MP) velocity sensors are installed in most locations. The largest density of instruments is concentrated around Vrancea seismogenic area and in front of SE Carpathians where the strong effects of the intermediate-depth events were observed.

L. Ardeleanu, B. Grecu, V. Raileanu 2 556
Taking advantage of the considerable amount of high quality data available we analyze the ground motion generated by 18 moderate size (4.0 ≤ Mw ≤ 5.0) undercrustal earthquakes of Vrancea, occurred in the interval 2008–2010, with the aim of revealing peculiarities of the distributions of peak ground acceleration, velocity and displacement.
2. SEISMIC EVENTS
The study events occurred from January 1, 2008 to August 30, 2010. Our selection comprises earthquakes with Mw ≥ 4.0, displaying records with high signal-to-noise ratio for at least 9 stations, a total number of 18 events (Fig. 1). Their basic parameters are listed in Table 1. The depths of foci range from 89 to 158 km and the epicenters are located within an area of 20×60 km2. The statistics of the earthquakes is shown in Fig. 2.
Fig. 1 – The stations of NIEP-SN (triangles) and the epicenters of the studied events (stars); the
background – the topography map.
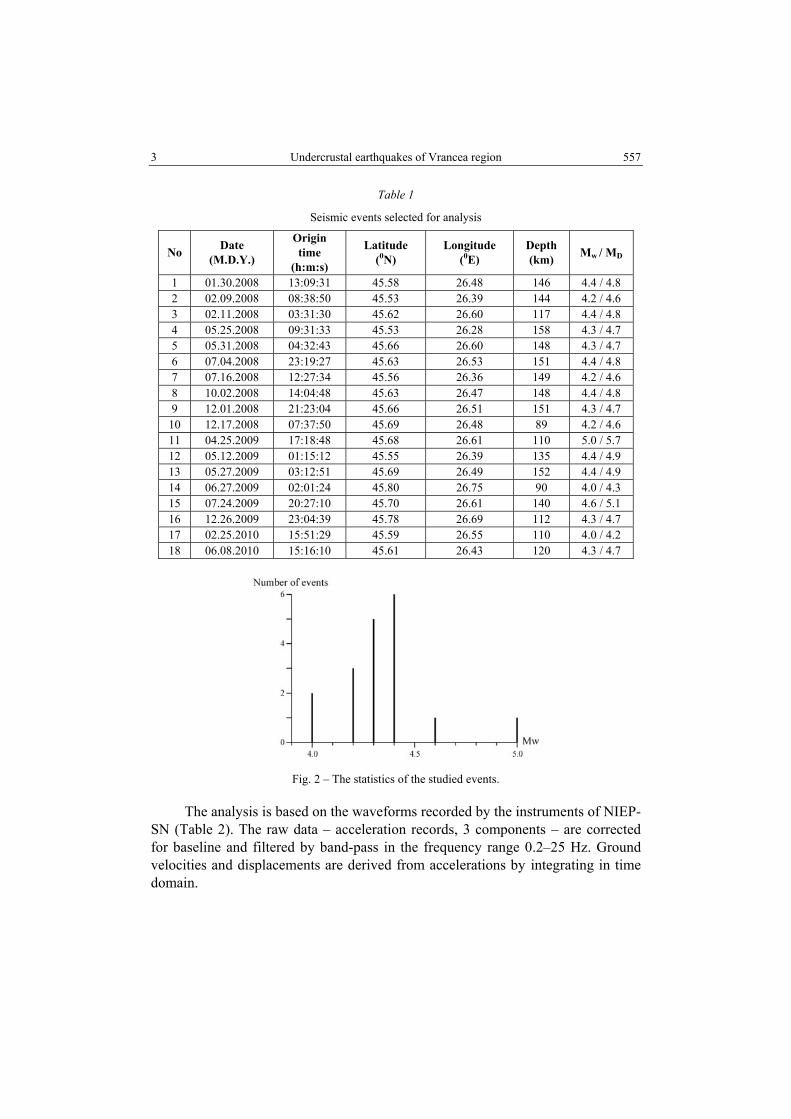
3 Undercrustal earthquakes of Vrancea region 557
Table 1
Seismic events selected for analysis
No Date (M.D.Y.)
Origin time
(h:m:s)
Latitude (0N)
Longitude (0E)
Depth (km) Mw / MD
1 01.30.2008 13:09:31 45.58 26.48 146 4.4 / 4.8 2 02.09.2008 08:38:50 45.53 26.39 144 4.2 / 4.6 3 02.11.2008 03:31:30 45.62 26.60 117 4.4 / 4.8 4 05.25.2008 09:31:33 45.53 26.28 158 4.3 / 4.7 5 05.31.2008 04:32:43 45.66 26.60 148 4.3 / 4.7 6 07.04.2008 23:19:27 45.63 26.53 151 4.4 / 4.8 7 07.16.2008 12:27:34 45.56 26.36 149 4.2 / 4.6 8 10.02.2008 14:04:48 45.63 26.47 148 4.4 / 4.8 9 12.01.2008 21:23:04 45.66 26.51 151 4.3 / 4.7
10 12.17.2008 07:37:50 45.69 26.48 89 4.2 / 4.6 11 04.25.2009 17:18:48 45.68 26.61 110 5.0 / 5.7 12 05.12.2009 01:15:12 45.55 26.39 135 4.4 / 4.9 13 05.27.2009 03:12:51 45.69 26.49 152 4.4 / 4.9 14 06.27.2009 02:01:24 45.80 26.75 90 4.0 / 4.3 15 07.24.2009 20:27:10 45.70 26.61 140 4.6 / 5.1 16 12.26.2009 23:04:39 45.78 26.69 112 4.3 / 4.7 17 02.25.2010 15:51:29 45.59 26.55 110 4.0 / 4.2 18 06.08.2010 15:16:10 45.61 26.43 120 4.3 / 4.7
Fig. 2 – The statistics of the studied events.
The analysis is based on the waveforms recorded by the instruments of NIEP-SN (Table 2). The raw data – acceleration records, 3 components – are corrected for baseline and filtered by band-pass in the frequency range 0.2–25 Hz. Ground velocities and displacements are derived from accelerations by integrating in time domain.

L. Ardeleanu, B. Grecu, V. Raileanu 4 558
Table 2
Location of the stations of NIEP Seismic Network (NIEP-SN)
Code Longitude (0E) Latitude (0N) Elevation (m) Locality/zone ARCR 24.35 47.09 356 Arcalia – Bistrita Nasaud ARR 24.63 45.37 924 Vidraru AMRR 27.34 44.61 86 Amara BANR 21.14 45.38 159 Banloc BAPR 26.12 44.41 103 Bucuresti – Parcul Copiilor BMR 23.50 47.67 227 Baia Mare BSTR 26.10 44.45 125 Bucuresti – COS BTMR 26.11 44.44 142 Bucuresti – GEOTEC BUC 26.09 44.41 95 Bucuresti – Cutitul de Argint BUC1 26.03 44.35 120 Bucuresti – Magurele BURAR 25.20 47.64 1217 Bucovina Array BVCR 26.10 44.43 109 Bucuresti – Curtea Veche BZS 21.64 45.62 260 Buzias CFR 28.14 45.18 57 Carcaliu CIOR 25.88 44.45 135 Ciorogarla CJR 23.60 46.71 750 Cluj CNCR 26.26 44.44 105 Cernica CRAR 23.80 44.33 125 Craiova CVD 28.04 44.35 153 Cernavoda DEV 22.90 45.89 249 Deva DOPR 25.39 45.97 544 Dopca DRGR 22.71 46.79 923 Valea Draganului EFOR 28.63 44.08 103 Eforie GRER 26.97 45.38 287 Greabanu GHRR 27.41 46.06 209 Gohor GOLR 24.98 44.84 300 Golesti GZR 22.78 45.39 850 Gura Zlata HARR 27.93 44.69 123 Harsova HUMR 24.98 44.53 247 Humele IAS 27.55 47.19 195 Iasi INCR 26.16 44.44 145 Bucuresti – INCERC ISR 26.54 45.12 791 Istrita LOT 23.77 45.45 1361 Lotru MANR 28.59 43.82 72 Mangalia MDB 24.38 46.15 423 Medias MLR 25.95 45.49 1392 Muntele Rosu MSAB 27.83 44.09 124 Manastirea Sfantul Andrei MTUR 25.07 45.23 1083 Matau ODBI 27.06 45.76 226 Odobesti PETR 27.23 45.72 85 Petresti PGOR 26.98 44.92 102 Pogoanele

5 Undercrustal earthquakes of Vrancea region 559
Table 2 (continued)
PLAR 26.03 44.91 212 Ploiesti Astra PLOR 26.65 45.85 680 Plostina Array PRAR 26.23 47.36 451 Petru Rares RMGR 22.69 44.66 119 Halanga RMVG 24.28 45.04 264 Ramnicu Valcea SECR 26.07 45.04 420 Seciu SIRR 21.66 46.27 544 Siria SIBR 24.18 45.81 463 Sibiu SRE 23.20 44.66 386 Strehaia SULR 26.25 44.68 129 Surlari TESR 26.65 46.51 375 Tescani TIM 21.22 45.74 134 Timisoara TLB 28.04 44.59 101 Topalu TIRR 28.41 44.46 77 Targusor TLCR 28.81 45.19 74 Tulcea VOIR 25.05 45.44 966 Voina VRI 26.73 45.87 475 Vrancioaia ZIMR 25.37 43.66 88 Zimnicea
3. RESULTS
Table 3 summarizes the highest values of the ground motion observed for each event. The maximum horizontal accelerations, velocities and displacements belong preponderantly to the S-wave train, which carries the most part of the seismic energy, while the maximum vertical values occur equally in the S- and P-wave trains.
Table 3
Peak ground acceleration, velocity and displacement for the studied events. M.D.Y. = month, day, year
Peak ground acceleration PGA [cm/s2]
Peak ground velocity PGV [mm/s]
Peak ground displacement PGD [µm]
M.D.Y. Mw/ depth [km]
horizontal*) vertical horizontal*) vertical horizontal*) Vertical
01.30.2008 4.4/146
1.19-ODBI 0.76-CVD
2.38-ODBI+
1.44-CVD+ 0.35-ODBI 0.19-BUC1
0.32-ODBI+
0.24-CVD+ 13-ODBI 4-CVD
8-CVD+
8-ODBI+
02.09.2008 4.2/144
0.39-ODBI 0.33-VRI
0.47-ODBI 0.18-CVD
0.12-VRI 0.09-ODBI
0.06-ODBI 0.04-CVD
5-CVD 3-ODBI
2-CVD 1-ODBI
02.11.2008 4.4/117
1.98-IAS 1.49-ODBI
1.54-IAS 0.78-ODBI
0.65-VRI 0.54-BUC
0.28-IAS 0.21-CVD+
24-BUC 20-ODBI
7-IAS 7-ODBI
05.25.2008 4.3/158
0.36-CFR 0.26-BUC1
0.63-PETR+
0.14-AMRR 0.13-BUC1 0.10-CFR
0.08-PETR+
0.04-CFR 4-AMRR
4-CVD 2-CFR 2-CVD
05.31.2008 4.3/148
1.36-ODBI+
0.68-CFR 1.81-ODBI+
0.40-AMRR+ 0.22-ODBI+
0.13-BUC1 0.25-ODBI+
0.09-CVD+ 9-ODBI+
5-AMRR 5-ODBI+
4-CVD+

L. Ardeleanu, B. Grecu, V. Raileanu 6 560
Table 3 (continued)
07.04.2008 4.4/151
1.56-PETR 1.46-CFR
1.99-ODBI+
1.07-PETR+ 0.61-PETR 0.35-ODBI
0.41-ODBI+
0.17-PETR+30-PETR 15-GRER
10-ODBI+
5-PETR 07.16.2008 4.2/149
0.74-PETR 0.51-ODBI
1.16-ODBI+
0.61-PETR+ 0.19-PETR 0.09-BUC1
0.21-ODBI+
0.10-PETR+ 5-SULR 4-CVD
4-ODBI 2-CVD
10.02.2008 4.4/148
1.18-SECR 0.80-ODBI
0.90-ODBI+ 0.59-CVD+
0.37-SECR 0.28-ODBI
0.30-ODBI+
0.14-SECR 23-SECR 16-GRER
10-ODBI+
5-SECR 12.01.2008 4.3/151
0.59-ODBI+
0.38-SECR 1.43-ODBI+
1.04-PETR+ 0.21-SECR 0.17-HUMR
0.23-ODBI+
0.15-PETR+ 13-SULR 13-HUMR
7-ODBI+
3-SULR 12.17.2008 4.2/89
3.62-SECR 3.09-CNCR
1.92-PGOR 1.86-SURL+
1.43-SECR 0.87-PGOR
0.41-SECR 0.38-SULR+
94-SECR 60-PGOR
15-SECR 13-SULR+
04.25.2009 5.0/110
55.10-SECR
28.68-SULR 30.05-ODBI+
27.93-PETR+ 23.94-SECR19.06-SULR
6.76-ODBI+
5.74-SECR+3570-SECR
2204-SULR 508-SECR 470-ODBI+
05.12.2009 4.4/135
2.08-PETR 1.74-ODBI
1.74-PGOR 1.51-PETR
0.68-GRER 0.64-PETR
0.27-PETR 0.22-GRER
40-GRER 35-VRI
8-PETR 8-GRER
05.27.2009 4.4/152
4.15-CNCR 4.13-BUC1
7.53-PETR+
4.57-PGOR+ 1.76-BUC1 1.46-PLAR
1.18-PETR+
1.03-ODBI+ 87-BUC1 78-PLAR
30-ODBI+
23-PETR+ 06.27.2009 4.0/90
1.31-PETR 1.21-SECR
0.97-PETR 0.95-IAS
0.46-SECR 0.35-PETR
0.18-IAS 0.16-PETR
25-SECR 17-PETR
5-VRI+
3-SECR 07.24.2009 4.6/140
5.20-CNCR 3.70-PETR
4.21-ODBI 2.76-PETR
1.42-CNCR 0.84-VRI
0.62-ODBI 0.43-PETR
63-ODBI 43-CVD
15-ODBI 15-TIRR
12.26.2009 4.3/112
7.25-SECR
4.67-SULR 2.59-SECR 2.04-GRER+
2.11-SECR
1.55-GHRR0.50-SECR 0.37-SULR
115-SECR
79-GHRR 18-SECR 14-GHRR
02.25.2010 4.0/110
2.73-CNRC 2.27-SECR
2.18-CNRC 1.90-PGOR
0.87-SECR 0.44-CNCR
0.32-PGOR+
0.31-CNCR 51-SECR 24-SULR
10-SECR 7-SULR
06.08.2010 4.3/119
10.60-SECR
5.01-CIOR 4.27-SULR
3.04-SECR 3.84-SECR
1.98-CIOR 0.78-SULR 0.77-SECR
146-SECR
134-SULR 38-AMRR+ 31-SECR
*) maximum value of two horizontal components; + maximum value observed in the P-wave train.
Depending on the amount of good quality data available, gross or detailed pictures of the space distribution of peak ground acceleration, velocity, and displacement were obtained for each of the study earthquakes.
Generally, the amplitude of ground shaking generated by earthquakes at a particular site is determined by the characteristics of the seismic source (earthquake size, focal mechanism), the seismic wave propagation from the source to the site (focal distance, physical properties of the medium along the ray path), and the local site effects (local geology).
The attenuation laws used in the assessment of the seismic hazard relate, by different functional forms, the predicted values of the ground motion parameters (peak acceleration, velocity, displacement) to the earthquake size, generally quantified by the magnitude, and the relative position of the site and seismic source (hypocentral distance, or epicentral distance and focal depth).
Besides the earthquake magnitude and the focus-to-site distance, important contributions to the spatial distribution of ground motion parameters have the focal

7 Undercrustal earthquakes of Vrancea region 561
mechanism – especially in the case of large events, with finite source – and the attenuation properties of the seismic waves along the travel path due to elastic scattering on inhomogeneities and inelasticity of rocks – effects incorporated in the parameter Q, the quality factor of the medium.
Finally, the local geology may also play a major role in the level of ground shaking at a specific site, as it can favor the increasing of seismic wave amplitudes up to a few times comparatively to the values at the top of the basement; significant amplification of seismic vibrations may take place in certain situations, for properly related values of seismic wavelengths, thickness of layers, wave velocity and density within the shallow sedimentary pack.
Detailed studies of the strong Vrancea earthquakes (Mw > 6.5) occurred during the second half of the XXth century – performed using both macroseismic and instrumental data (e.g. [1–7]) – revealed some common features of the ground motion caused by these large events, irrespective of the focal depth (in the upper or lower part of the undercrustal seismogenic region) or particularities of the source mechanism: (i) large values of ground motion parameters observed over wide areas orientated predominantly NE-SW; (ii) strong, abnormal attenuation of the seismic waves propagating towards the Intra-Carpathian zone.
The observed PGAs, PGVs and PGDs from the investigated moderate size earthquakes comply with this pattern.
The values of ground motion parameters observed in the Transylvanian region are lower then those recorded in the Extra-Carpathian area (at comparable epicentral distances), by at least one order of magnitude generally.
The strongest seismic motion does not occur at the sites located in the epicentral zone – in the mountain area –, but at stations situated at tens of km apart from the epicenter, indicating that the level of ground shaking is strongly controlled by the local and regional geological conditions. Large amplitudes are pointed out in the Focşani Basin (at the seismic stations ODBI and PETR), as well as in several locations in the Moesian Platform (the stations SECR, PLAR, PGOR, SULR, CNCR, CIOR, BTMR, BAPR, BUC1, HUMR), Scythian Platform (CFR, GHRR stations) and Moldavian Platform (IAS station).
Differences in the patterns of PGA, PGV and PGD displayed by individual earthquakes are caused by differences in the focal mechanisms and/or ray paths from source to recording points.
An example is shown in Fig. 3, two events with focal mechanisms and hypocenter locations differing significantly. For the event #15, the maximum horizontal acceleration was recorded at CNCR station, situated in the eastern part of the Wallachian sector of the Moesian Platform, but significantly large values were also observed at the stations from the Focşani Depression: PETR and ODBI, as well as at CFR station, in the North Dobrogea Orogen. In the case of the event

L. Ardeleanu, B. Grecu, V. Raileanu 8 562
#18, the highest horizontal accelerations were recorded SW of the epicenter, at SECR station in Carpathians foredeep, and at SULR and CIOR stations in the Moesian Platform.
To reduce the pattern variation related to the variation of the propagation paths, we compared near events, situated only few km apart each other. Fig. 4 shows two earthquakes localized in the deepest segment of the seismogenic zone, 4 km apart one another, and Fig. 5 presents two shallower events with the hypocenters spaced apart by 11 km. In both cases, the noticeable differences in the pattern of the ground shaking should be attributed to a great extent to the contribution of the focal mechanisms, which differ considerably.
The source location within the seismogenic region has also an important effect on the ground motion field. Fig. 6 displays the distribution of the PGAs for two events with similar mechanisms, located in the same depth range, 24 km apart one another. The fault plane solutions of the events #9 (Fig. 4, up) and #11 (Fig. 5, up) are almost identical; their sources are situated at different depths, and are separated by 42 km. The events #13 (Fig. 4, down) and #18 (Fig. 3, down) have also quite similar focal mechanisms; they occurred at different depths and are spaced by 34 km. All three pairs of events exhibit appreciable differences in the distribution of ground shaking.
We notice that all the studied events are moderate sized (14 out of 18 having Mw magnitude between 4.2 and 4.4), hence significant differences in their source spectral content, leading to notable variations of the local amplifications, are very unlikely.
The collected records at SECR station (accelerograms available for 8 events) display repeatedly the highest observed values of PGA, or amplitudes close to the highest ones (up to an order of magnitude larger than those observed at the neighboring stations PLAR and ISR). SECR station is situated SW of the seismogenic zone in the Carpathians foredeep, at epicentral distance in the range 70 to 100 km; it is located on top of a complex structure of tectonised soft and hard sediments on the Moesian basement. The large amplifications here suggest a considerable (and spatially limited) effect of the peculiar local conditions.
Data analysis reveals also relatively high values of the peak vertical acceleration, velocity and displacement. Vertical accelerations exceeding the horizontal ones by a factor greater than 2 (amounting to 5) were recorded at the stations TESR, PGOR, PETR, AMRR, ODBI, CVD, INCR, HARR, BUC1, BANR, EFOR. Actually, vertical ground motion amplitudes slightly higher or comparable to the horizontal motions were observed at the majority of seismic stations.

9 Undercrustal earthquakes of Vrancea region 563
Fig. 3 – Distribution of peak horizontal acceleration (cm/s2) – maximum value of two horizontal components – for two events occurred about 26 km apart one another, and having considerably
different focal mechanisms.
The strongest event of the data set has Mw magnitude 5.0; it occurred on April 25, 2009 in the shallower zone of the Vrancea undercrustal seismogenic volume, at 110 km depth. The highest values of the ground motion parameters were recorded

L. Ardeleanu, B. Grecu, V. Raileanu 10 564
at SECR station: PGA = 55.1 cm/s2, PGV = 23.94 mm/s and PGD = 3.57 mm (see Table 3). Large horizontal accelerations were also observed at the stations SULR (epicentral distance ∆ = 155 km) – 28.7 cm/s2, BAPR (∆ = 147 km ) – 25.3 cm/s2, IAS (∆ = 183 km ) – 24.9 cm/s2.
Fig. 4 – Distribution of peak horizontal acceleration (cm/s2) – maximum value of two horizontal components –
for two events occurred in the deepest part of the seismogenic region, 4 km apart one another.
The large number of high quality records of this earthquake allowed us to build up the maps of PGA, PGV and PGD for the territory of Romania. Fig. 7 displays the map of peak horizontal acceleration (maximum value of two

11 Undercrustal earthquakes of Vrancea region 565
horizontal components) obtained using a special interpolation algorithm and the plotting tools provided by the Generic Mapping Tools (GMT) [8]. It should be stressed that data are collected only from national seismic stations, therefore the map is reliable only for the area inside the Romanian borders. The pattern of the recorded peak ground acceleration – with maxima in the Carpathians foredeep close to Ploieşti city, and in the Moldavian Platform – is remarkably similar to the distribution observed in the case of the 6.0 Mw magnitude earthquake of October 27, 2004 (e.g. [9]), the largest intermediate depth event since the two strong seisms of May 30, and May 31, 1990 (Mw = 6.9 and 6.4, respectively). The event of October 27, 2004 occurred about 15 km to NE from our study event, at 99 km depth.
Fig. 5 – Distribution of peak horizontal acceleration [cm/s2] – maximum value of two horizontal components –
for two events occurred in the shallower part of the seismogenic region, 11 km apart one another.

L. Ardeleanu, B. Grecu, V. Raileanu 12 566
On the basis of several hundred weak, moderate and strong-motion records of Vrancea intermediate depth events (about 100 earthquakes with Mw magnitude less than 5.5 occurred during the period 1996–2004, and five shocks with Mw in the range 6.0 to 7.4, occurred between 1977 and 2004), and taking also into account the geological and geomorphological characteristics on the territory of Romania, Sokolov et al. [10] proposed a zonation consisting in eight distinctive regions – namely (1) North, (2) East, (3) Focşani, (4) Vrancea, (5) South, (6) Southwest, (7) Rock (Mountain), and (8) Transylvania – and derived empirical region-specific (azimuth-dependent) attenuation relations for the peak ground acceleration and peak ground velocity. The relationships have the functional form (1):
Fig. 6 – Distribution of peak horizontal acceleration [cm/s2] – maximum value of two horizontal
components – for two events with similar focal mechanisms.

13 Undercrustal earthquakes of Vrancea region 567
( )1 2 3 4 5ln ln exp ln ,X a a M a a h R a h= + − + + (1)
where X is the ground motion parameter (PGA [cm/s2], or PGV [cm/s]), M is the moment magnitude, h is the source depth (km), and R is the epicentral distance (km). The coefficients a1 – a5 were determined for each of the eight regions separately, by fitting the ground motion simulated by a stochastic technique [11] using the regional Fourier amplitude spectra (FAS); regional FAS were estimated by considering source scaling factors and attenuation models appropriate for Vrancea earthquakes, and generalized amplification functions evaluated for each zone. Equations (1) were developed for M values ranging from 5 to 8, focal depths h in the range 60 to 160 km, and epicentral distances R up to 500 km.
Fig. 7 – Map of peak horizontal acceleration [cm/s2] – maximum value of two horizontal components
– for the April 25, 2009 Vrancea earthquake, Mw = 5.0. Epicenter is marked by a star.
The peak ground accelerations recorded during the Mw = 5.0 event of April 25, 2009 were compared with the values predicted by the relation (1), by considering both estimations – based on the mean and the mean plus one standard deviation of the generalized amplification functions [12, 10].
The observed data from the regions (2) East, (4) Vrancea, (7) Rock (Mountain), and (8) Transylvania are fairly well reproduced by the ground motion values calculated using the mean generalized amplification functions; for the other zones – (1) North, (3) Focşani, (5) South, and (6) Southwest – the estimates based

L. Ardeleanu, B. Grecu, V. Raileanu 14 568
on the mean plus one standard deviation of the generalized amplification functions match better the observations.
A few sites exhibit significantly higher amplitudes than the predicted ones (larger by a factor between 2 and 3): IAS station in region (1) and SECR and ZIMR stations in region (6); smaller deviations from the predicted values (PGA larger by a factor between 1.5 and 2) were also observed at several stations in region (6) – SULR, CNCR, BAPR, CIOR and HUMR.
Obviously, equation (1), as any attenuation relationship, predicts only the general features of the ground shaking, not the peculiarities of particular earthquakes. Since the region-specific coefficients a1 – a5 were determined by using generalized source parameters (seismic moment and stress parameter) and simple models of source scaling and inelastic attenuation, we expect that the predicted PGA values reflect average source characteristics of Vrancea intermediate depth events, together with average site effects in different regions.
For SECR location the significant amplifications pointed out throughout the investigated data set indicate a dominant local effect. We note that the largest horizontal acceleration recorded at SECR station during the 6.0 Mw magnitude event of October 27, 2004 was 265 cm/s2, close to the largest values observed during the strong earthquakes of 1977, 1986 and 1990.
In the case of the remaining stations (IAS and ZIMR), it seems reasonable to assume that the high values of the observed ground motion reflect also a significant effect of the source mechanism.
4. DISCUSSION
A study of the ground shaking produced by 18 Vrancea moderate size undercrustal earthquakes, occurred during the period 2008–2010, is performed using the records of the seismic network of the National Institute for Earth Physics.
The strongest event of the data set has Mw magnitude 5.0; it occurred on April 25, 2009, at 110 km depth. The largest PGA was recorded at SECR station, 55 cm/s2 on North component; the highest values of PGV and PGD reached 24 mm/s and 3.6 mm, respectively (see Table 3).
For the remaining events (with Mw magnitudes from 4.0 to 4.6, and depths in the range 89 – 158 km), the observed PGAs did not exceed 10 cm/s2, while the levels of the PGVs and PGDs were below 4 mm/s and 0.15 mm, respectively (see also Table 3).
We summarize below, for comparison, the largest values of the PGA recorded during the major earthquakes occurred at the end of the XXth century; we note the small number of strong-motion records available for these events, due to the poor seismic instrumentation. – The earthquake of March 4, 1977, Mw = 7.4: recorded at one single site in Bucharest city (at INCERC). PGA on the North component was 195 cm/s2, and on the East component 163 cm/s2.

15 Undercrustal earthquakes of Vrancea region 569
– The earhquake of August 30, 1986, Mw = 7.1: recorded at 20 sites, 5 of them in or around Bucharest city. The highest PGA values were observed at Focşani: 288 cm/s2 on the North component, and 207 cm/s2 on the East component. Other large peak horizontal accelerations (maximum value of two horizontal components) were recorded at Văleni – 191 cm/s2 , Râmnicu Sărat – 165 cm/s2, Bucharest (Exhibition site) – 161 cm/s2, Oneşti – 156 cm/s2, Bucharest-Măgurele – 135 cm/s2. – The earthquake of May 30, 1990, Mw = 6.9: recorded at 32 sites. The largest peak horizontal accelerations (maximum value of two horizontal components) were observed at: Oneşti – 232 cm/s2, Periş – 224 cm/s2, Bolintin Vale – 209 cm/s2, Râmnicu Sărat – 159 cm/s2 and Vrâncioaia – 157 cm/s2. – The earthquake of May 31, 1990, Mw 6.4: recorded at 24 sites. The highest values of the peak horizontal acceleration were observed at Focşani – 173 cm/s2, Oneşti – 108 cm/s2, Vrâncioaia – 102 cm/s2. A major difference between the ground shaking caused by the strong Vrancea earthquakes (Mw > 7.0), and the one induced by the moderate size seisms (Mw around 5.0) consists in the dominating frequency of the vibrations: the large events usually produce low-frequency ground accelerations (below 1 Hz), while the moderate events produce mostly ground accelerations in the middle-to-high frequency range (above 2 Hz). The ground acceleration amplitude spectra obtained for the Mw = 5.0 event of April 25, 2009, at stations located in all zones, exhibit maxima at frequencies ranging from 2 to 9 Hz.
With regard to the distributions of PGAs, PGVs and PGDs recorded during the study events, they comply with the overall pattern displayed by the strong earthquakes of Vrancea [13, 14], which is characterized by a rapid decrease of the observed ground motion parameters in SE-NW direction, and a prominent asymmetry of the isolines. Although keeping the general trend determined by the regional geological conditions, the individual patterns show a noticeable variability, which may be attributed to the diversity of the focal mechanisms and hypocenter position within the seismogenic zone, the effects of the source and wave propagation path at the site being combined. The analysis points out a location which displays large amplifications of the seismic waves with frequencies in the middle-to-high range (greater than 2 Hz) produced by the moderate size undercrustal events of Vrancea. The high peak ground accelerations, velocities and displacements observed constantly at SECR station point to a dominant effect of the particular local conditions at this site.
Acknowledgments. The authors thank the anonymous referee, whose observations and
suggestions contributed to improving the manuscript. The research was supported by the National Authority for Scientific Research, Contract CNMP-31-018/2007, Contract CNMP-32157/2008, Contract 31N/ 23.01.2006, Project PN 06-31 01 03 and Contract PN09 30, Project PN09- 01 03. Partial support came from CNCSIS-UEFISCDI, project number PN II-RU 120/2010.

L. Ardeleanu, B. Grecu, V. Raileanu 16 570
REFERENCES
1. N. Mândrescu, Geological hazard evaluation in Romania, Eng. Geol., 20, 39–47, 1984. 2. C. Radu, A. Utale and V. Winter, The August 30, 1986 Vrancea earthquake. The distribution of the
seismic intensity (in Romanian), Centre of Earth Physics and Seismology Report 30.86.3/1987, II, A-3, Bucharest, 1987.
3. C. Radu and A. Utale, A new version of the March 4, 1977 Vrancea earthquake (in Romanian), Centre of Earth Physics and Seismology Report 30.86.3/1989, II, A4, 31–32, Bucharest, 1989.
4. C. Radu and A. Utale, The Vrancea earthquake of May 30, 1990. Intensity distribution (in Romanian), Centre of Earth Physics Report 30.86.3/1990, IV, A2, Bucharest, 1990.
5. C. Radu, D. Rădulescu and H. Sandi, Some data and considerations on recent strong earthquakes of Romania, Cahier Technique, 3, AFPS, Paris, 1990, pp. 19–31.
6. M.C. Oncescu, K.-P. Bonjer and M. Rizescu, Weak and strong ground motion of intermediate depth earthquakes from the Vrancea region, in: eds. F. Wenzel, D. Lungu, and O. Novak, Vrancea Earthquakes: Tectonics, Hazard and Risk Mitigation, Kluwer Academic Publishers, Dordrecht, The Netherlands, 1999, pp. 27–42.
7. N. Mândrescu and M. Radulian, Macroseismic field of the Romania intermediate depth earthquakes, in: F. Wenzel, D. Lungu, and O. Novak eds., Vrancea Earthquakes: Tectonics, Hazard and Risk Mitigation, pp. 163–174, Kluwer Academic Publishers, Dordrecht, The Netherlands, 1999.
8. P. Wessel and W. H. F. Smith, Free software helps map and display data, EOS Trans. Am. Geophys. Union, 72, 444–446, 1991.
9. K.-P. Bonjer, C. Ionescu, V. Sokolov, M. Radulian, B. Grecu, M. Popa and E. Popescu, Ground motion patterns of intermediate-depth Vrancea earthquakes: the October 27, 2004 event, in: A. Zaicenko, I. Craifaleanu and I. Paskaleva eds. Harmonization of Seismic Hazard in Vrancea Zone, Springer, Dordrecht, The Netherlands, 2008, pp. 47–62.
10. V. Sokolov, K.-P. Bonjer, F. Wenzel, B. Grecu and M. Radulian, Ground-motion prediction equations for the intermediate depth Vrancea (Romania) earthquakes, Bull. Earthquake Eng., 6, 367–388, 2008.
11. D. M. Boore, Simulation of ground motion using the stochastic method, Pure Appl. Geophys., 160, 635–676, 2003.
12. V. Sokolov, K.-P. Bonjer and F. Wenzel, Accounting for site effect in probabilistic assessment of seismic hazard for Romania and Bucharest: a case of deep seismicity in Vrancea zone, Soil Dyn. Earthq. Eng., 24, 927–947, 2004.
13. G. Marmureanu, C.O. Cioflan, A. Marmureanu, Intensity seismic hazard ap of Romania by probabilistic and (neo)deterministic approaches, linear and nonlinear analyses, Rom.Rep.Phys., 63, 1, 226–239, 2011.
14. A. Pantea, A.P. Constantin, Reevaluated macroseismic map of Vrancea (Romania) earthquake occurred on November 10, 1940, Rom. Journ. Phys., 56, 3–4, 578–589, 2011.
![THREE-DIMENSIONAL GINZBURG-LANDAU SOLITONS: …rrp.infim.ro/2009_61_2/art01Mihalache.pdf3 Three-dimensional Ginzburg-Landau solitons 177 [37]. Unique properties are also featured by](https://img.pdfslide.us/doc/110x75/5e8059e0521fd176f93a139b/three-dimensional-ginzburg-landau-solitons-rrpinfimro2009612-3-three-dimensional.jpg)