Embed Size (px)
Citation preview
PEACE AREA PROJECT - WELL SELECTION FOR TESTING GEOLOGICAL MODEL BASED ON GAMMA AND AIRBORNE ELECTROMAGNETIC
(AEM) STUDIES
GEOSCIENCE BC REPORT 2016-18
OCTOBER 2016
BEMEX CONSULTING INTERNATIONAL
and
QUATERNARY GEOSCIENCES INC.
2
TABLE OF CONTENTS
INTRODUCTION ........................................................................................................................................ 3
LOCATION OF AARHUS' SURVEY BLOCKS .................................................................................... 4
GEOLOGY AND RESISTIVITY OF THE PEACE PROJECT BLOCK .................................................... 5
WELL LOCATIONS AND DESCRIPTIONS ............................................................................................. 5
Sikanni block - Areas 2 and 3 ................................................................................................................. 10
Geology ............................................................................................................................................... 10
AEM inversions: Areas 2 and 3 .......................................................................................................... 13
DOIG BLOCK – Area 5 ......................................................................................................................... 16
Geology ............................................................................................................................................... 16
AEM inversions .................................................................................................................................. 17
SW PEACE NORTH BLOCK - Areas 6, 6a and 7 ................................................................................ 19
Geology ............................................................................................................................................... 19
AEM inversions .................................................................................................................................. 22
SW PEACE SOUTH BLOCK - Areas 8, 10a, and 10b .......................................................................... 26
Geology ............................................................................................................................................... 26
AEM inversion .................................................................................................................................... 29
CHARLIE LAKE BLOCK - Areas 11 and 12 ........................................................................................ 33
Geology ............................................................................................................................................... 33
AEM inversions .................................................................................................................................. 36
SUMMARY AND DISCUSSION OF SITE PRIORITY ........................................................................... 39
REFERENCES ........................................................................................................................................... 41

3
INTRODUCTION The Peace Project is a collaborative effort involving Geoscience BC1, the Ministry of Forests, Lands and Natural Resource Operations, the Ministry of Environment, the BC Oil and Gas Commission, the Ministry of Natural Gas Development, Progress Energy Canada Ltd., ConocoPhillips Canada, Northern Development Initiative Trust, and the BC Oil & Gas Research and Innovation Society, with additional support from the Peace River Regional District and the Canadian Association of Petroleum Producers.
The objective of Geoscience BC's Peace project north of Fort Saint John is to provide a regional overview of the Quaternary and shallow bedrock geology of the area. A secondary objective is to locate potential aquifers within the study area. To this end two large regional surveys were carried out during 2015.
More than 1200 petroleum wells were corrected for casing and cement effects. The corrected gamma logs were then used to provide an interpretation of the Quaternary/bedrock contact and the location of potential sands and gravel aquifers within the Quaternary section (Levson, 2014; Petrel Roberson/Quaternary Geosciences Inc., 2015). In addition water wells were used, when the data quality was sufficient, to provide additional information on depth to bedrock. These results were overlain on a surficial geology map of the region.
A 21,000 line-km SkyTEM airborne electromagnetic (AEM) survey was carried out in the area with traverse line spacing of 600 m (traverse line direction was approximately ENE-WSW) and tie line spacing of 2400 m (Brown et al., 2016). The time-domain AEM data were then processed using Aarhus workbench to generate laterally constrained inversions (LCI) (Auken et al., 2002; Auken et al., 2005). The final products were resistivity cross sections and depth slices over the entire area.
The SkyTEM inversions provided a quick look at the regional resistivity structure of the Peace project area. However their objective was to provide high quality EM data and not to provide a detailed interpretation of the data volume. In early 2016, Aarhus Geophysics Apps of Denmark was awarded a contract to reprocess and interpret 5 areas (Sikanni, Doig, Conoco, Charlie Lake, and SW Peace) contained within the larger SkyTEM survey boundary. The areas were selected based on the results of the gamma study, input from local communities, First Nations, and petroleum companies, and areas expected to have higher probability for locating aquifers (i.e. away from areas with shallow, glacial till).
Aarhus Geophysics provided more detailed editing of the SkyTEM data set to remove cultural effects and to correct for tree cover when estimating the height of the EM system above the ground. Laterally constrained inversions (LCI) and spatially constrained inversions (SCI) were carried out as well. Where possible they compared their SCI inversions with the results of the gamma study for depth to bedrock, bedrock formation and Quaternary geology (Aarhus Geophysics 2016a, 2016b, 2016c, 2116d, 2016e).
This project's objective is to test the validity of the geological models generated as a result of the Aarhus and Petrel Robertson/QGI studies. To accomplish this, several well locations have been selected within the 5 blocks listed above. The locations of the wells were determined from the surficial geology map of QGI,
1 Geoscience BC is an independent, non-profit organization that generates earth science in collaboration with First Nations, local communities, government, academia and the resource sector. Our independent earth science enables informed resource management decisions and attracts investment and jobs. Geoscience BC gratefully acknowledges the financial support of the Province of British Columbia.
4
the resistivity depth maps and sections generated by Aarhus, and road accessibility. The locations of the test wells are placed close to existing petroleum and water wells whenever possible to provide calibration.
The objective of this study is to test the validity of the geological model; not to locate shallow Quaternary and/or bedrock aquifers. The report provides a rationale why each area was selected. The locations of wells are overlain on resistivity depth slices and sections from the Peace project area. A well prognosis provides the information on resistivity values and geological formations versus depth for each of the proposed locations.
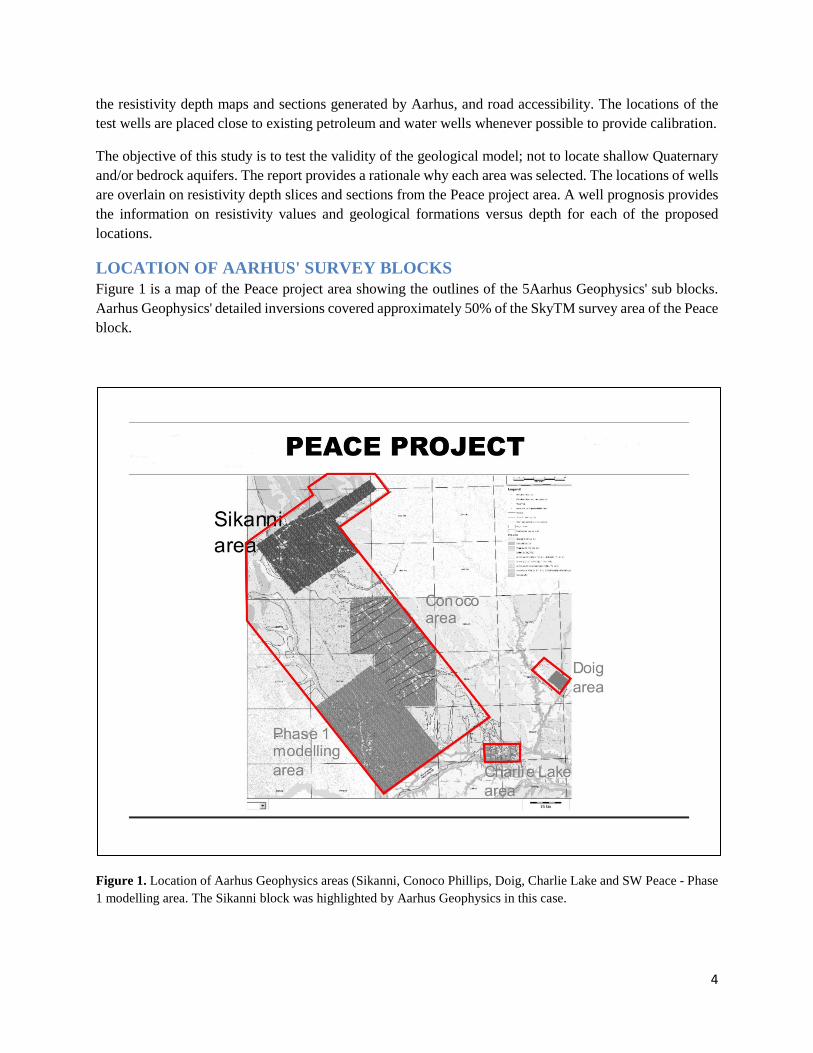
LOCATION OF AARHUS' SURVEY BLOCKS Figure 1 is a map of the Peace project area showing the outlines of the 5Aarhus Geophysics' sub blocks. Aarhus Geophysics' detailed inversions covered approximately 50% of the SkyTM survey area of the Peace block.
Figure 1. Location of Aarhus Geophysics areas (Sikanni, Conoco Phillips, Doig, Charlie Lake and SW Peace - Phase 1 modelling area. The Sikanni block was highlighted by Aarhus Geophysics in this case.

5
GEOLOGY AND RESISTIVITY OF THE PEACE PROJECT BLOCK Geological interpretations for each selected area were based on interpretations of gamma logs from gas wells and from water well records where available. It is important to note that the quality of public water well records is generally poor and they should always be used with caution. Likewise interpretations of single geophysical logs, such as gamma logs, are fraught with problems because there are always multiple alternative interpretations for any single log sequence. In addition, the locations of the gas and water wells are invariably distant from the proposed drill sites, so significant variations from the inferred geology at these sites are expected.
The geological interpretations presented in this report are largely based on inference using general knowledge of the Quaternary stratigraphy of the region and public surficial geology data. All such interpretations by nature are speculative and need to be confirmed with field or drilling data. The geology prognosis for each proposed drill site was inferred mainly from the resistivity values obtained from the Aarhus resistivity cross-sections. These ranges provided in Table 1 were used in conjunction with general knowledge of bedrock and glacial sequences to provide the bedrock and Quaternary geology interpretations.
Table 1. Relationship between resistivity values and Quaternary/bedrock geology.
RESISTIVITY GEOLOGY (ohm-m) QUATERNARY BEDROCK
< 15 Clay Shale 15-30 Till Shale/siltstone 30- 50 Till/sand/silt Siltstone 50-90 Sand Sandstone
90-150 Sand/gravel Sandstone/conglomerate > 150 Sand and gravel Sandstone/conglomerate
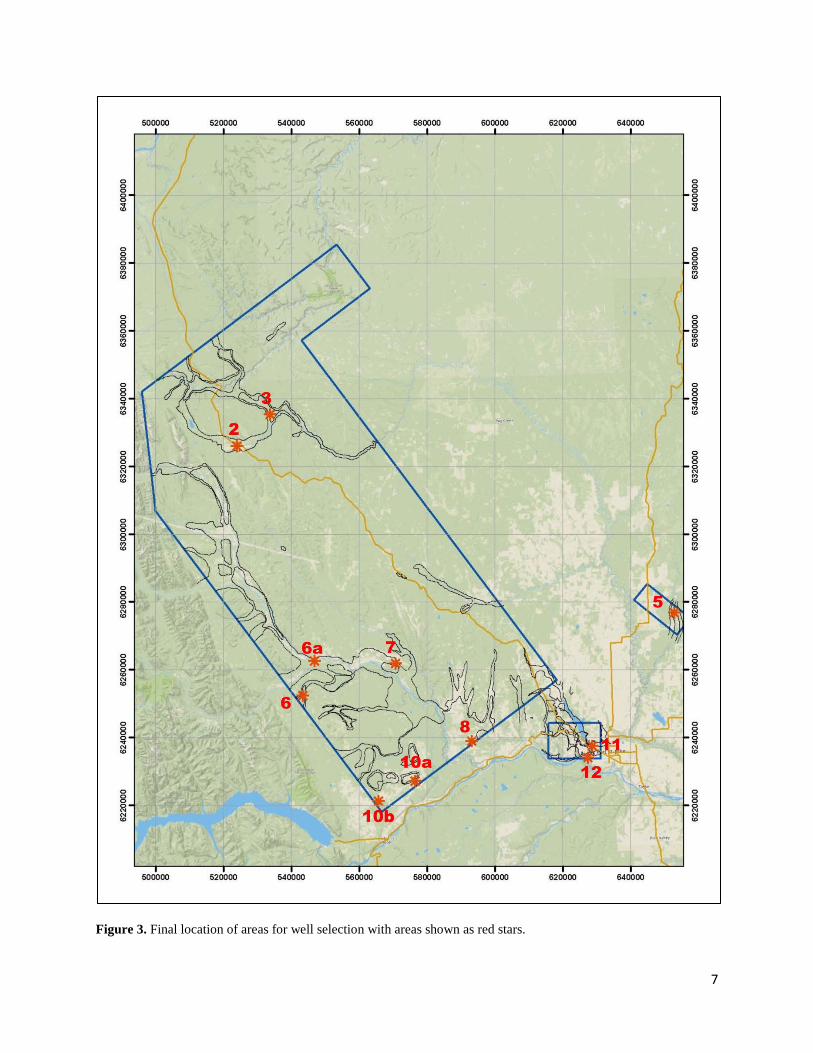
WELL LOCATIONS AND DESCRIPTIONS Figure 2 is a map showing the 12 areas originally selected for the location of the wells. Locations were selected so as to include: a wide geographic distribution of sites with range in geological complexities, different types of potential aquifers (e.g. floodplains, terraces and buried channels), areas with some well data (ideally both water well and gamma logs from gas wells), areas requested by First Nations and areas likely to have good road access. Three sites were originally located in the Sikanni block (areas 1, 2, 3), one in the Conoco block (area 4), one in the Doig block (area 5), five in the SW Peace block (areas 6, 7, 8, 9, 10) and two in the Charlie Lake block (areas 11, 12). Resistivity sections and depth slices were not used to locate these areas. These areas are on the order of 10's of square km in size. The Aarhus' resistivity cross sections were then used to narrow down the location of the wells within each area. Some of the original areas had no road access so their locations were either moved (6, 7, 8, 10a, 12) or dropped (1, 4 and 9) and two new areas were added (6a and 10b). Figure 3 shows the locations of the final areas.

6
Figure 2. Surficial geology map with original location of areas for well selection shown as black stars.
7
Figure 3. Final location of areas for well selection with areas shown as red stars.

8
The remainder of this report covers the geological and resistivity structure of each well location in more detail. The areas are broken out into the 5 blocks discussed earlier. Each area has the location of the well(s) shown on resistivity depth slices (5-10m and 15-20m) and a cross section from the Aarhus SCI inversions, with the well location superimposed. A prognosis of resistivity and geology versus depth are provided for each of the 11 wells. The resistivity colour bars are the same for all depth slices but the colour bars for the resistivity cross sections differ. The areas listed refer to the red stars shown on Figure 3.
Figure 4 is a DEM from SkyTEM for the Peace block that contains the SIkanni, Conoco Phillips and SW Peace Aarhus' blocks.
Figure 4. DEM of Peace block (from SkyTEM final report and maps). This block contains the Sikanni, Conoco Phillips and SW Peace blocks from the Aarhus inversions.
Figure 5 presents maps of the DEM's from SkyTEM for the Doig and Charlie Lake blocks. Note that the scales of the three DEMs are different. Figures 4 and 5, in conjunction with the resistivity and gamma information, were used for the selection of the well locations. Table 2 lists the SkyTEM Line number and UTM coordinates for each of the 11 proposed well locations.

9
Figure 5. a) SkyTEM DEM of the Doig block. b) SkyTEM DEM of the Charlie Lake block

10
Table 2. Line number and UTM coordinates of well locations (NAD 1983 UTMZ10N) *N =north, S = south.
Sikanni block - Areas 2 and 3
Geology Area 2 is located in the Beatton River valley. The surficial geology of the valley is characterized by a blanket of glaciolacustrine sediments that have been incised by the modern river valley. The proposed well site is located outside of the modern valley on a bench mantled by silts and clays. The subsurface Quaternary stratigraphy of the area is interpreted from two gas wells and one water well, all west of the proposed drill site (Figure 6). The gas wells are 200/a-098-A 094-G-02/00 and 200/a-097-A 094-G-02/00, located about 1 km and 1.5 km, respectively, east of the proposed well site. The drill site is close to the highway and has good access from the Pink Mountain / Mile 147 Road. The site is accessed by a small side road that heads southward into an open field. The depth to bedrock in the wells is interpreted to be 17-18 m and both wells show an overlying low gamma zone that is a potential sand and gravel aquifer. Overlying that zone, a possible till unit and glaciolacustrine silts and clays are inferred to extend to surface. High gamma zones, reflecting probable clay-rich aquitards, are present at 7-8 m in both wells. The local bedrock is interpreted to be the Sully formation. Water wells in the area are mostly in the river valley, but well 88111 is located about 2 km southeast of the proposed drill site along a small tributary of the Beatton River (Figure 6). The well record shows a similar stratigraphy to that interpreted from the gas wells. Three units are described: grey silty clay (0-9 m); brown silty clay and rocks (9-14 m) and brown sand and gravel (14-18 m). Static water level was reported to be 35 ft and the lower 5 ft were screened.
Block_Name Area_Desc Line_Num UTM_E UTM_N Sikanni Area 2 L105101 523823 6325931 Sikanni Area 3 L104802 533632 6335392 Doig Area 5 L500601 652840 6276900 SW Peace N* Area 6 L116801 543242 6252436 SW Peace N Area 6a L115801 546718 6262698 SW Peace N Area 7 L118302 570600 6261960 SW Peace S Area 8 L123601 593102 6239064 SW Peace S Area 10a L123501 576400 6227223 SW Peace S Area 10b L123202 565670 6221360 Charlie Lake Area 11 L301101 628583 6237611 Charlie Lake Area 12 L301701 627284 6234107

11
Figure 6. Interpreted gamma logs from gas wells and location map for area 2.
Area 3 is located northeast of area 2 (Figure 3) in a broad topographic saddle between the Sikanni Chief River and Beatton River valleys. This saddle is interpreted to be a possible buried paleochannel between the two modern river valleys. A well was selected in this area to test the geological hypothesis that the Sikanni Chief River previously flowed southeastward through this saddle into the Beatton drainage, rather than to the northeast as it does today (Figure 3). Several gas wells have been drilled in the valley and gamma logs from these wells suggest the presence of a potentially deep (>40 m) Quaternary paleochannel there. The wells consistently show low gamma zones just above the inferred bedrock contact that are interpreted to be sands and gravels. Interpretations of two gamma logs near the proposed well site are shown on Figure 7. Depths to bedrock (DTB) below the modern surface are interpreted to be 46 m at well 200/d-096-E 094-G-01/00 and 37 m at well 200/b-095-E 094-G-01/00. The elevation of the bedrock surface is similar at both sites (Fig 7), consistent with the hypothesis of a southeasterly-trending buried paleochannel in the area. The thickness of the potential paleochannel deposits vary from about 5-10 m and the overlying sediments are interpreted to be mainly glaciolacustrine sediments although till is likely present above the lower sands and gravels. The upper parts of the gamma logs at both gas wells are missing but high-gamma zones (probable aquitards) are present at a depth of about 30 m, above which thin sandy aquifer zones may also be present. No water wells were identified in area 3.
Location 2

12
Figure 7. Interpreted gamma logs from gas wells and location map for area 3.
Location 3

13
AEM inversions: Areas 2 and 3 Figure 9 consists of 2 maps of resistivity depth slices averaged over 5 - 10 m and 15-20 m respectively. The two proposed drill site locations (areas 1 and 2) are within low resistivity sinuous features on both depth slices that mimic similar low elevation features observed on the Peace DEM (Figure 4). The resistivity values of these features go from approximately 15 - 30 ohm-m in the 5 -10 m average depth slice to less than 15 ohm-m in the 15-20 m depth slice.
Figure 9 shows a similar pattern of resistivity versus depth for both well locations on the corresponding cross sections. Well 2 is located in a region of uniform layering gently dipping to the east with a river valley a few hundred metres to the east. Well 2 is on Line 105101 and has UTM location 523823 easting and 6325931 northing (Table 2). Similarly well 3 is in a region of uniform layering gently dipping to the east with a river valley to the east. Well 3 is on Line 104802 and has UTM location 533632 easting and 6335392 northing. The relatively low resistivity unit (dark blue on Figure 9a) that extends all the way across the resistivity section in area 2 is interpreted to be bedrock shales of the Sully Formation. Proposed drill site 2 is targeting the thin, moderate-resistivity zone (colored green on the section) just above the bedrock which correlates with the low gamma zone in the nearby gas well logs. The resistivity cross-section for area 3 shows high resistivity bedrock (likely Dunvegan sandstones at surface on the mountains on either side of the paleovalley). The low resistivity, near-surface layers in the valley are interpreted to be mainly glaciolacustrine sediments and the target horizon for drilling there is a deeper, higher resistivity unit (shown in green on the section).
Figure 10 shows detailed plots of resistivity and corresponding geology (based on Table 1) versus depth for wells 2 and 3. The Quaternary sediments in area 2 are interpreted to be quite thin (about 15 m) compared to the relatively thick package of glaciolacustrine sediments (>50 m) that are inferred to infill the paleovalley in area 3.

14
Figure 8. Resistivity depth slices showing the locations of wells 2 and 3 within the Sikanni block. a) Resistivity depth slice 5-10 m. b) Resistivity depth slice 15-20 m.

15
Figure 9. a) Well location 2 on resistivity cross section (Line 105101). b) Well location 3 on resistivity cross section (Line 104802).

16
Figure 10. Well prognosis for Sikanni block a) well 2, Line 105101. b) well 3, Line 104802. Depths are not to scale.
DOIG BLOCK – Area 5
Geology The modern Doig River occupies a major late-glacial spillway channel infilled largely with glaciofluvial sediments. Two gas wells within the valley (100/06-32-087-16W6/00 and 100/06-08-088-16W6/00), north of the reserve, have gamma logs that suggest depths (below surface) to Dunvegan bedrock of about 18 and 30 m, respectively. However, when plotted against elevation as in Figure 11, a gradual paleochannel gradient trending southward is evident. Two low gamma zones totalling about 10 m thick are present on both the logs and are interpreted to represent glaciofluvial gravel and sand units overlying bedrock. The two units are separated by a thin zone with slightly higher gamma readings, likely reflecting a more silty bed. It is possible that the lowermost gamma zones are unusually clean Dunvegan sandstone The log for well 06-32-087 shows relatively low gamma extending to surface possibly indicating sands to surface although the artificial effects of conductor pipe can not be ruled out. The top of the other gamma log ends at a depth of 20 m depth. If the low gamma zones are reflecting sands and gravels, there is reasonably good potential for an aquifer in this area. Lithologic logs from two water wells near Doig reserve (well tag numbers 104429 and 104395), located in the modern valley bottom, are incomplete but both are deep (about 85 m) and appear to be developed in bedrock.

17
Figure 11. Interpreted gamma logs from gas wells and location map for area 5. EM interpretation is based on resistivity data from the proposed drill site area.
AEM inversions Figure 12 is a plot of the resistivity depth slices for average depths of 5 - 10 m and 15 -20 m for the Doig Block. The plots indicate a resistive body (greater than 50 ohm-m) sits below a moderately resistive overburden. The margins of the glacial spillway channel, as mapped at the surface, coincide remarkably well with the resistive materials at depth, particularly along the western margin of the channel. The proposed drill site targets the most resistive materials in the channel (shown in pale orange on Figure 12). The location of the proposed drill site could easily be moved to the south, closer to the reserve, as long as it is within the area of the higher resistivity materials.
Figure 13 is a plot of a resistivity cross section (Line 500601) going through the middle of the resistive feature. Well 5 is located on Line 500601 and has coordinates 652840 easting and 6276900 northing (Table 2). Figure 14 is a detailed plot of resistivity and corresponding geology (based on Table 1) versus depth for well 5. The EM data interpretation corresponds well with the geology inferred from the gamma logs. Depth to bedrock is about 25 m and the overlying materials are glaciofluvial sands and gravels. The upper most 4 m are likely abandoned floodplain silts.
Location 5

18
Figure 12. Resistivity depth slices showing the location of well 5 within the Doig block. a) Resistivity depth slice 5-10 m. b) Resistivity depth slice 15-20 m.
Figure 13. Resistivity cross section (Line 500601) showing the location of well 5.

19
Figure 14. Well prognosis for Doig block. Well 5, Line 500601. Depth scale approximate.
SW PEACE NORTH BLOCK - Areas 6, 6a and 7
Geology Areas 6, 6a and 7 are all in the Halfway River area. Area 6 is within the Kobes Creek valley, a tributary of the Halfway River. Area 6a is near the confluence of the Halfway and Graham rivers and area 7 is east of the Halfway River reserve.
Area 6 Gamma logs from two gas wells in the Kobes Creek valley (200/b-004-K 094-B-08/00 and 200/d-094-F 094-B-08/00) both show a large gamma decline at about 25 m depth, below which gamma readings are much higher and interpreted to be in Buckinghorse shales (Figure 15). Although both wells show the sharp gamma change, only well d-094-F has a complete log to surface. A low gamma zone at about 19-25 m below surface is interpreted to be an older sand and gravel unit that may underlie glacial lake or lower energy glaciofluvial sediments with abandoned terrace floodplain silts at the surface.

20
Figure 15. Interpretations of gamma logs from gas wells in the Kobes Creek valley and location map.
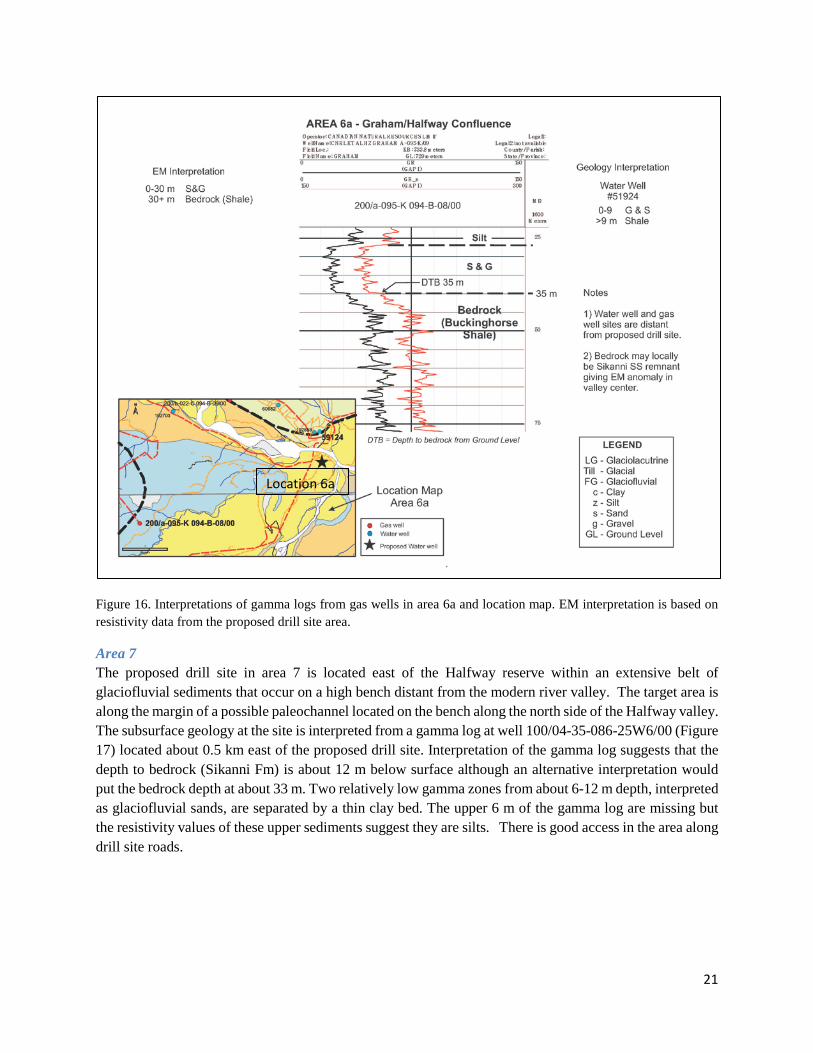
Area 6a The proposed drill site location in area 6a is located just west of the confluence of the Graham and Halfway rivers. The area was selected because of an unusual north-trending highly resistive unit in the area that cross-cuts the south-easterly strike of bedrock formations in the region. This feature may simply represent a coincidental alignment of resistive features such as coarse sandstones and glaciofluvial gravels. If so, it is likely that the resistive high at this site is a glaciofluvial gravel that corresponds to the inferred sand and gravel unit that overlies Buckinghorse shale at a depth of about 35 m below the surface at well 200/a-095-K 094-B-08/00. The unit is quite thick (about 13 m) and is overlain by lower gamma sediments interpreted to be silts (Figure 16). The upper part of the gamma log for the gas well is missing and the gas well unfortunately is located several kilometres southwest of the proposed drill site. A few water wells are present in the area but all are located north of the main part of the river valley. The closest water well (59124) is almost a kilometre north of the proposed drill site but the log from that well indicates that 9 m of gravel and sand overlie shale. The static water level was reported to be 18 ft (5.5 m). Other water wells in the area also report high static water levels and appear to be developed in bedrock which is generally quite shallow in the area. Access to the proposed site is good as there are a number of small roads in the area.
Location 6
21
Figure 16. Interpretations of gamma logs from gas wells in area 6a and location map. EM interpretation is based on resistivity data from the proposed drill site area.
Area 7 The proposed drill site in area 7 is located east of the Halfway reserve within an extensive belt of glaciofluvial sediments that occur on a high bench distant from the modern river valley. The target area is along the margin of a possible paleochannel located on the bench along the north side of the Halfway valley. The subsurface geology at the site is interpreted from a gamma log at well 100/04-35-086-25W6/00 (Figure 17) located about 0.5 km east of the proposed drill site. Interpretation of the gamma log suggests that the depth to bedrock (Sikanni Fm) is about 12 m below surface although an alternative interpretation would put the bedrock depth at about 33 m. Two relatively low gamma zones from about 6-12 m depth, interpreted as glaciofluvial sands, are separated by a thin clay bed. The upper 6 m of the gamma log are missing but the resistivity values of these upper sediments suggest they are silts. There is good access in the area along drill site roads.
Location 6a

22
Figure 17. Area 7 location map and interpretation of a gas well gamma log. EM interpretation is based on resistivity data near the specific proposed drill site.
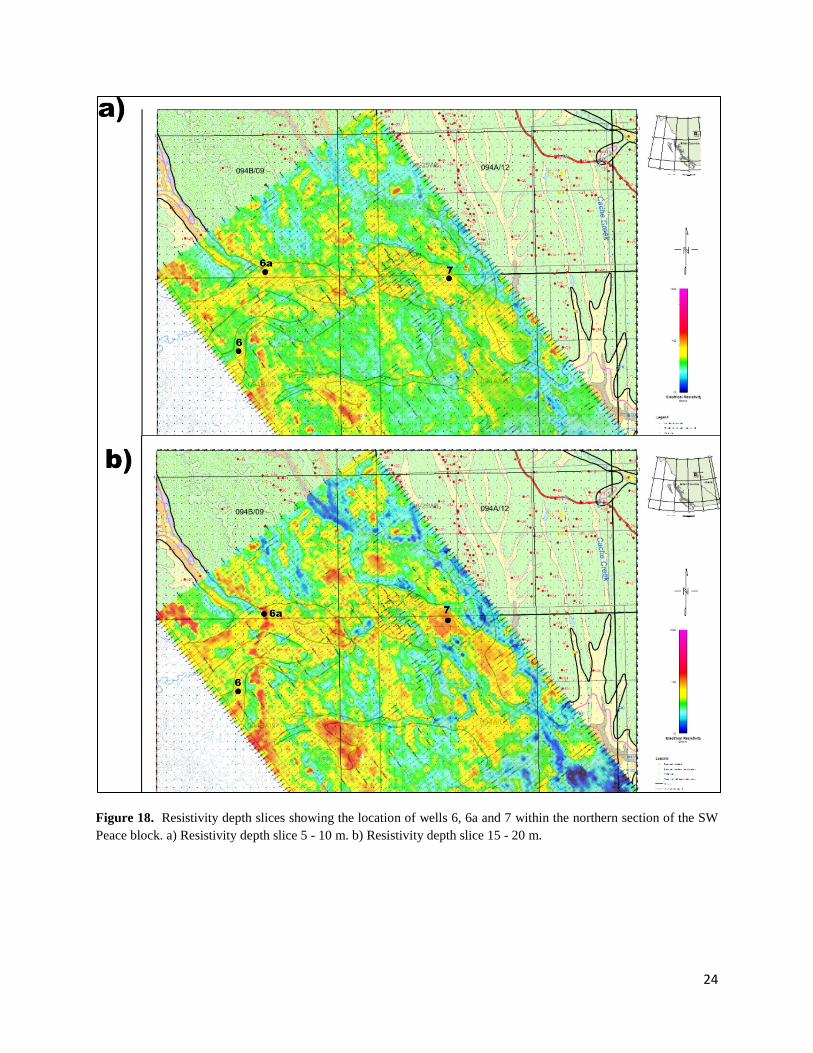
AEM inversions Figure 18 is a plot of resistivity depth slices for average depths of 5 - 10 m and 15 - 20 m for the north section of the SW Peace block. These plots indicate there are several features worth testing. Well 6 tests a resistivity feature within the Kobes Creek valley (Figure 4). Well 6a tests a north-south trending resistive feature that cross cuts the regional bedrock strike and can best be seen on Figure 18b. Well 7 tests a resistive feature farther east within the Halfway valley that is interpreted to be a buried glaciofluvial channel (or alternatively Sikanni sandstone that underlies relatively thin surface sediments).
Resistivity cross section plots for sites 6, 6a and 7 are provided in Figures 19 to 21, respectively. The section at area 6 indicates there is a resistive feature (50 - 85 ohm-m), probably glaciofluvial in origin, and approximately 25 m thick starting about 5 meters below surface (Figure 19). The upper 5 m are likely abandoned terrace floodplain silts. Well 6 is located on Line 116801 at 543242 easting and 6252436 northing. The resistivity section for area 6a indicates there is a resistive feature about 30 m thick (> 80 ohm-m) that starts close to the surface (Figure 20). One purpose of this well will be to determine if the resistive feature is sands or gravels or Sikanni sandstone. Well 6a is on Line 115801 and is at 546718 easting and 6262698 northing. Area 7 (Figure 21) has an approximately 24 m thick resistive (> 50 ohm-m) feature
Location 7

23
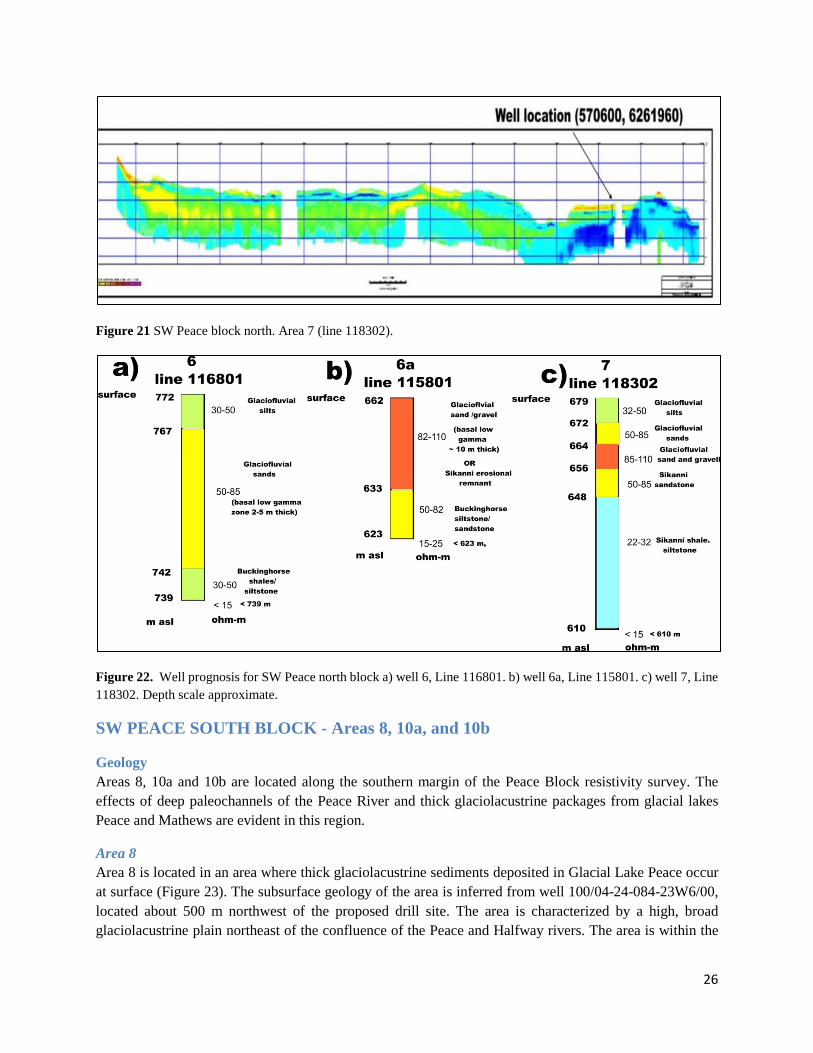
starting at 7 m below surface, similar to well 6, that is the target horizon for the well. Well 7 is located on Line 118302 and is located at 570600 easting and 6261960 northing on a high bench supporting a laterally extensive resistive feature interpreted as a glaciofluvial sand and gravel deposit. Depth to bedrock in the area is uncertain as glaciofluvial sands are difficult to differentiate from similarly resistive Sikanni sandstones based on the sections.
Figure 22 provides detailed plots of resistivity and corresponding interpreted geology (based on Table 1) versus depth for wells 6, 6a and 7.
24
Figure 18. Resistivity depth slices showing the location of wells 6, 6a and 7 within the northern section of the SW Peace block. a) Resistivity depth slice 5 - 10 m. b) Resistivity depth slice 15 - 20 m.

25
Figure 19. SW peace block north. Area 6 (Line 116801).
Figure 20. SW Peace block north. Area 6a (Line 115801).
26
Figure 21 SW Peace block north. Area 7 (line 118302).
Figure 22. Well prognosis for SW Peace north block a) well 6, Line 116801. b) well 6a, Line 115801. c) well 7, Line 118302. Depth scale approximate.
SW PEACE SOUTH BLOCK - Areas 8, 10a, and 10b
Geology Areas 8, 10a and 10b are located along the southern margin of the Peace Block resistivity survey. The effects of deep paleochannels of the Peace River and thick glaciolacustrine packages from glacial lakes Peace and Mathews are evident in this region.
Area 8 Area 8 is located in an area where thick glaciolacustrine sediments deposited in Glacial Lake Peace occur at surface (Figure 23). The subsurface geology of the area is inferred from well 100/04-24-084-23W6/00, located about 500 m northwest of the proposed drill site. The area is characterized by a high, broad glaciolacustrine plain northeast of the confluence of the Peace and Halfway rivers. The area is within the

27
region where paleovalleys of both rivers may be present. On the gamma log from the 04-24-084 gas well, a large gamma decline (>60 api) at about 60 m below the surface is interpreted to reflect the base of the Quaternary sequence. High gamma values below that depth probably reflect a shale rich sequence within the Dunvegan Formation. There is potential for a thin basal sand unit in the area as indicated by a 1 m thick low gamma zone on the log (Figure 23). More importantly, from an aquifer potential perspective, a more pronounced low gamma zone from about 48 to 51 m depth is evident on the log probably reflecting a sand and gravel unit within the overall package of finer grained sediments. The upper 30 m of the gamma log is missing but it is assumed to be mainly glaciolacustrine sediments. This is confirmed by a lithologic log from a deep water well (tag number 60090) located about a kilometre northwest of the gas well. The water well log reports a total of 76 m of silts and clays overlying about 14 m of till. The well presumably is in a much deeper part of the paleochannel and records an additional 24 m thick basal gravel unit, overlying shale bedrock at a depth of 116 metres. Other deep water wells occur in the region, further suggesting that a significant paleochannel is present. The location of the proposed drill site was intentionally selected along the margin of the paleochannel because the geologic interpretations can be tested there with a relatively shallow well compared with a drill site in the centre of the old paleochannel. There is good road access in this area (Figure 23).
Figure 23. Interpreted gamma log and water well data and location map for area 8. EM interpretation is based on the resistivity data near the proposed drill site.
Location 8

28
Areas 10a and 10b Areas 10a and 10b are located in the southwest corner of the Peace Block resistivity survey. Both sites are accessed via the Farrell Creek road. Area 10a occurs along the northern margin of a probable paleochannel of the Peace River. The paleovalley is infilled with glaciolacustrine sediments that blanket the modern surface. The subsurface geology of area 10a is inferred from the gamma log for gas well 102/01-12-083-25W6/00 located about 2 km southwest of the proposed drill site (Figure 24). Depths to bedrock of about 76 m are reported nearby but no lithologic logs are available. The depth to bedrock in gas well 01-12-083 is interpreted to be 49 m and, based on regional data, the depth to bedrock appears to thin northwards along the probable northern margin of the paleochannel. The depth to beedrock at well 100/12-07-083-24W6/00 directly west of the proposed drill site (Figure 24), for example, is interpreted to be only 19 m. The overlying paleochannel fill appears to be mainly glaciolacustrine silts, clays and sands based on the gamma log at well 01-12-083. No pronounced gravelly zone is inferred to be present although the sandiest sections in the sequence may be coarse enough to be potential aquifers.
No gas or water well logs are available for area 10b located east of Lynx Creek (see map on Figure 24). The area was selected because a well developed glaciofluvial terrace is present there and because of interest in the Quaternary stratigraphy of the area due to recent landslides in the region. A broad area of glaciofluvial sediments have been mapped along the Lynx Creek drainage system.
Figure 24. Interpreted gamma log and water well data for area 10a. EM interpretation is based on the resistivity data near the proposed drill site. Locations maps for areas 10a and 10b are provided together as no gamma or water well logs are available for area 10b.

29
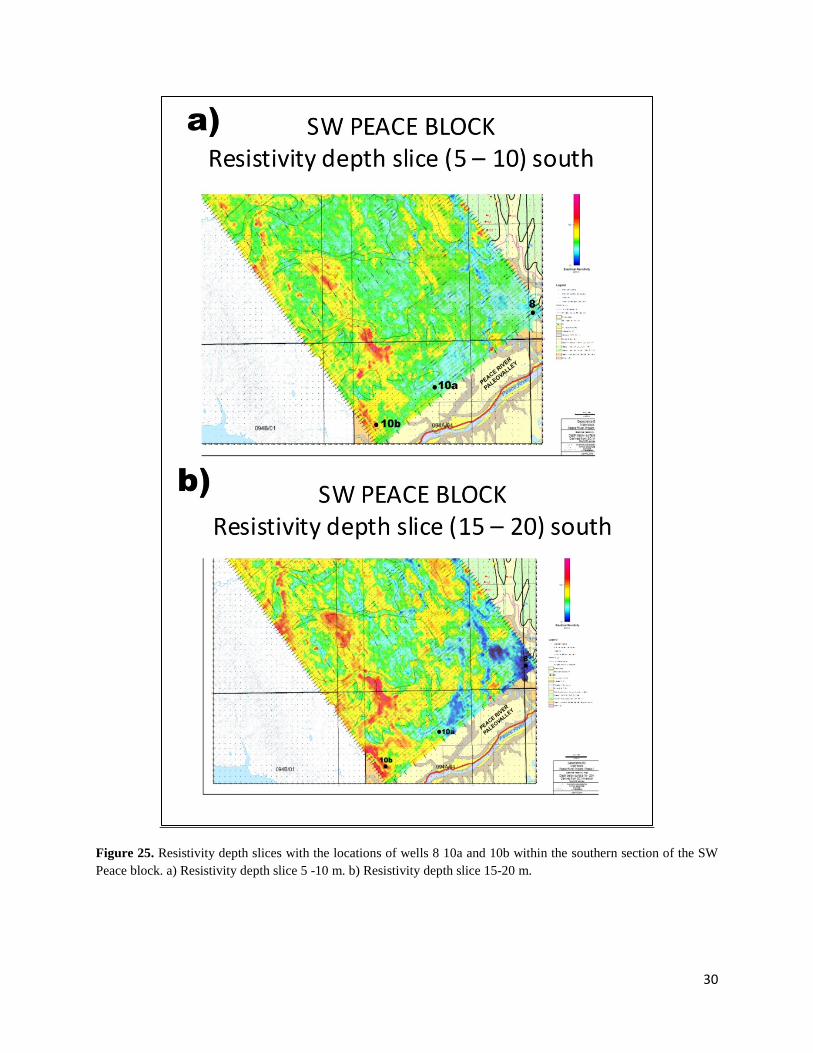
AEM inversion Figure 25 is a plot of resistivity depth slices for average depths of 5 - 10 m and 15-20 m for the south section of the SW Peace block. The south section of the SW Peace block is contained within the region with the lowest elevation of the SkyTEM survey. This block also contains the northern extension of the Peace River valley at its southern boundary. All three wells are located near the southern boundary. Figure 25 shows that areas 8 and 10a become more conductive with depth while area 10b becomes more resistive with depth. Areas 8 and 10a are within a region covered by a thick blanket of conductive glacial lake sediments whereas area 10b occurs in an area where resistant glaciofluvial sediments dominate.
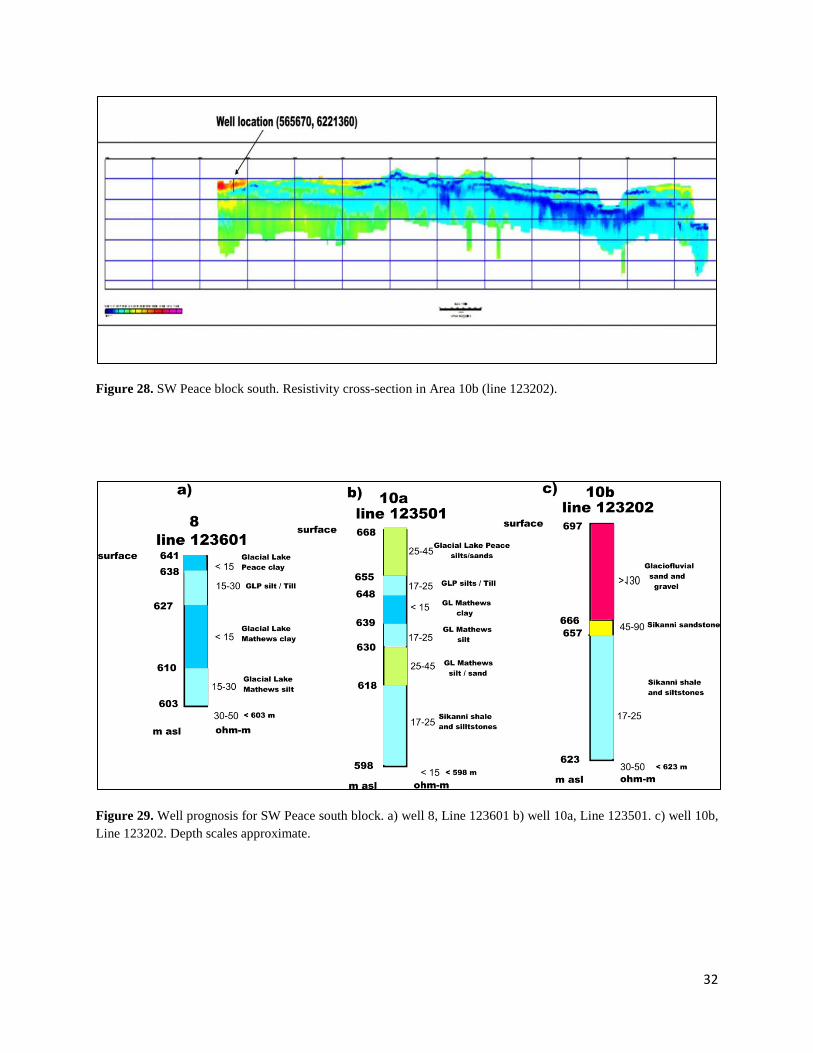
This is consistent with the resistivity cross-sections shown in Figures 26 to 28. Well 8 has a mixture of conductive and moderately conductive material from surface to approximately a depth of 38 m (Figure 26). Well 8 is located on Line 13601 and has coordinates 593102 easting and 6239064 northing. The well is located on what is interpreted to be a bedrock high with deeper paleochannel sediments located both east and west of the well site. The selected site has the advantage that similar stratigraphic intervals can be tested with a shallower well than would be required in the deeper parts of the paleochannel. Similarly, well 10a has conductive to moderately conductive material from surface to a depth of approximately 38 m (Figure 27). These sediments are interpreted to be mainly glacial lake sediments infilling the area along the margin of an old paleochannel of the Peace River Well 10a is located on Line 123501 and has coordinates 576400 easting and 6227223 northing. Well 10b has resistive material from surface to a depth of 31 m and then has moderately resistive material to a depth of 40 m where it goes into moderately conductive material (Figure 28). The resistive material in the upper 30 m is interpreted to be glaciofluvial sand and gravel. Well 10b is located on Line 123202 and has coordinates 565670 easting and 6221360 northing.
Figure 29 provides detailed plots of resistivity and corresponding geology (based on Table 1) versus depth for wells 8, 10a and 10b. The resistivity sequence at well 8 is interpreted to represent a thick paleochannel fill that includes conductive glaciolacustrine sediments from both Glacial Lake Peace and Glacial Lake Mathews with an intervening zone of moderately conductive sediments that likely includes till from the last glaciation (Figure 29a). The lower part of the sequence is also moderately conductive and may represent silty sediments or bedrock. The stratigraphic interpretation at well 10a (Figure 29b) is similar to that at well 8 except that the lowermost and uppermost units are slightly more resistive suggesting that sandy facies may also be present in the glacial lake sediments. In contrast, the surface materials at well 10b are quite resistive (Figure 29c). There are interpreted to be late glacial sands and gravels that directly overlie Sikanni sandstone, siltstone and shale.
30
Figure 25. Resistivity depth slices with the locations of wells 8 10a and 10b within the southern section of the SW Peace block. a) Resistivity depth slice 5 -10 m. b) Resistivity depth slice 15-20 m.

31
Figure 26. SW Peace block south. Resistivity cross-section in Area 8 (Line 123601).
Figure 27. SW Peace block south. Resistivity cross-section in Area 10a (Line 123501).
32
Figure 28. SW Peace block south. Resistivity cross-section in Area 10b (line 123202).
Figure 29. Well prognosis for SW Peace south block. a) well 8, Line 123601 b) well 10a, Line 123501. c) well 10b, Line 123202. Depth scales approximate.

33
CHARLIE LAKE BLOCK - Areas 11 and 12
Geology Areas 11 and 12 are located northwest and west of Ft. St. John, respectively. Area 11 occurs southeast of Charlie Lake in a largely till covered area where a narrow paleochannel has been mapped that approximately follows the highway. At least one spring is known to exist in this general area. Area 12 occurs along the northern margin of the Peace River valley. The area has a continuous cover of glaciolacustrine sediments that infill an inferred large paleochannel.
The subsurface geology of area 11 is interpreted from two water well logs (22116 and 21230) and from a gamma log at well 102/08-03-084-19W6/00 (Figure 30). Water well 22116 is located in the centre of the mapped paleochannel, a few hundred metres south of the proposed drill site which is on the northeast margin of the old channel (Figure 30). The lithologic log is brief but reports a thick package of silts and sands overlying bedrock at 162 metres depth, indicating the centre of the paleochannel is quite deep. Well 21230 is located along the southwest margin of the paleochannel, several hundred metres west of the drill site. The log at water well 21230 reports clays and sands down to a depth of 31 overlying 4 m of gravel and wet sand. The nearest gas well with a shallow gamma log is about 2 km to the southeast along the southern margin of the paleochannel (Figure 30). The depth to bedrock at the gas well is uncertain and may be shallower than the top of the log (about 16 m below the surface) as inferred or much deeper, depending on the actual location of the paleochannel margin in relation to the drill site. A drill hole in this area will help resolve this uncertainty. There is good road access in the area.
Area 12 occurs along the northern margin of a large paleochannel of the Peace River (Figure 31). Surface sediments in the area are relatively thick glaciolacustrine silts and clays deposited in Glacial Lake Peace. The subsurface stratigraphy at the proposed drill site is inferred mainly from a gamma log from well 100/16-27-083-19W6/00, located about 1 km to the northeast (Figure 31). The depth to bedrock is interpreted to be about 25 m below the surface which corresponds reasonably well with the EM interpretation at the proposed well site. The closest water well log is from a well (101572) about 2 km to the southwest (at the south end of the 271 Road). The log reports that the hole was dry but encountered gravel between 7 and 32 metres.

34
Figure 30. Interpreted gamma log and water well data for area 11. EM interpretation is based on the resistivity data near the proposed drill site.
Location 11

35
Figure 31. Interpreted gamma log and water well data for area 12. EM interpretation is based on the resistivity data near the proposed drill site.
Location 12
36
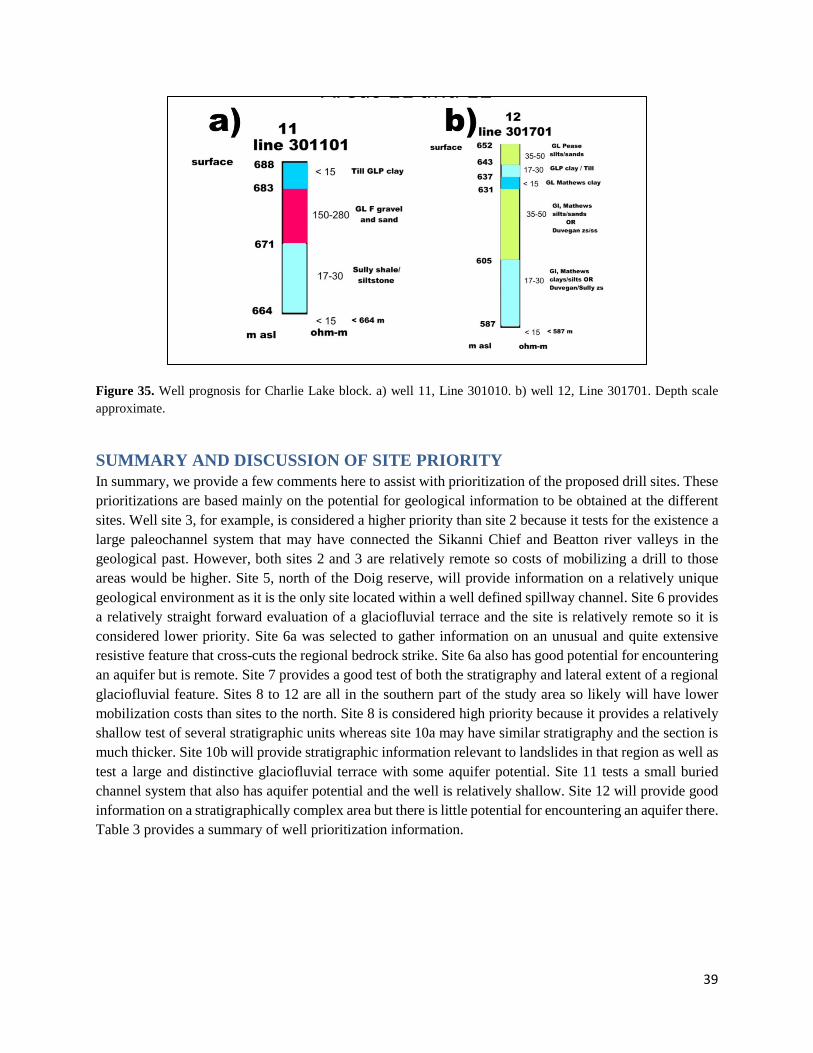
AEM inversions The Charlie Lake block is in an area with significant cultural affects that limited SkyTEM coverage (Figure 5b). However the southern section of the block was completely covered. The two well locations are in the southern portion of the survey block in an area with low relief. Figure 32 indicates that well 11 is associated with a local resistivity feature. Well 12 is a moderately conductive feature near surface becoming more conductive at an average depth of 15 to -20 m. This is consistent with the resistivity cross-sections shown in Figures 33 and 34. Well 11 starts at surface with conductive material, interpreted as clay till and glaciolacustrine sediments, going to very resistive material at a depth of approximately 5 m. This resistive feature continues to a depth of 17 m and is interpreted as a glaciofluvial paleochannel, possibly a tunnel valley. Below 17 m depth, the material is moderately conductive and interpreted to be Sully shale or siltstone. Well 11 is located on Line 301101 and has coordinates 628583 easting and 6237611 northing. Well 12 has a more conductive environment. It starts at surface with moderately resistive material and oscillates back and forth between moderately conductive and resistive materials interpreted as glaciolacustrine sediments with varying clay, silt and sand contents. Below a depth of 65 m, conductive material is interpreted to be siltstone or shale. Well 12 is located on Line 301701 and has coordinates 627284 easting and 6234107 northing.
Figure 35 provides detailed plots of resistivity and corresponding geology (based on Table 1) versus depth for wells 11 and 12. The conductive surface materials at site 11 are likely clay rich till and possibly also glacial lake clays. The highly resistive sediments from about 5-17 m depth are interpreted here to be glaciofluvial gravels and sands but it is also possible that they are Dunvegan sandstone. At well site 12, vertical changes in resistivity are interpreted to reflect textural variations in glaciolacustrine and glacial sediments that infill the inferred paleochannel (Figure 35). The sequence likely includes Glacial Lake Peace sediments overlying till and Glacial Lake Mathews sediments. The conductive material below 65 m is interpreted to be siltstone and shale. Depth to bedrock may be substantially less if the moderately resistive materials below 21 m are Dunvegan siltstones instead of glacial lake silts as suggested (Figure 35).

37
Figure 32. Resistivity depth slices showing the location of wells 11and 12 within the Charlie Lake block. a) Resistivity depth slice 5 - 10 m. b) Resistivity depth slice 15-20 m.

38
Figure 33. Charlie Lake block. Resistivity cross-section in area 11 (Line 301101).
Figure 34. Charlie Lake block. Resistivity cross-section in area 12 (Line 301701).
39
Figure 35. Well prognosis for Charlie Lake block. a) well 11, Line 301010. b) well 12, Line 301701. Depth scale approximate.
SUMMARY AND DISCUSSION OF SITE PRIORITY In summary, we provide a few comments here to assist with prioritization of the proposed drill sites. These prioritizations are based mainly on the potential for geological information to be obtained at the different sites. Well site 3, for example, is considered a higher priority than site 2 because it tests for the existence a large paleochannel system that may have connected the Sikanni Chief and Beatton river valleys in the geological past. However, both sites 2 and 3 are relatively remote so costs of mobilizing a drill to those areas would be higher. Site 5, north of the Doig reserve, will provide information on a relatively unique geological environment as it is the only site located within a well defined spillway channel. Site 6 provides a relatively straight forward evaluation of a glaciofluvial terrace and the site is relatively remote so it is considered lower priority. Site 6a was selected to gather information on an unusual and quite extensive resistive feature that cross-cuts the regional bedrock strike. Site 6a also has good potential for encountering an aquifer but is remote. Site 7 provides a good test of both the stratigraphy and lateral extent of a regional glaciofluvial feature. Sites 8 to 12 are all in the southern part of the study area so likely will have lower mobilization costs than sites to the north. Site 8 is considered high priority because it provides a relatively shallow test of several stratigraphic units whereas site 10a may have similar stratigraphy and the section is much thicker. Site 10b will provide stratigraphic information relevant to landslides in that region as well as test a large and distinctive glaciofluvial terrace with some aquifer potential. Site 11 tests a small buried channel system that also has aquifer potential and the well is relatively shallow. Site 12 will provide good information on a stratigraphically complex area but there is little potential for encountering an aquifer there. Table 3 provides a summary of well prioritization information.

40
Table 3. Summary of Well Prioritization Information (Note: more criteria, such as political considerations for example, could be added readily to this table to expand its scope)
Well # unique geologic environment
complex stratigraphy
aquifer potential
Mobilisation distance (to Ft. St John)
Relative Priority
2 No No Moderate Long Low 3 Yes Yes Good Long Mod-High 5 Yes Yes Good Moderate High 6 No No Moderate Moderate Low 6a Yes No Good Moderate Moderate 7 Yes Yes Moderate Moderate Mod-High 8 Yes Yes Low Short-mod Mod-High 10a No Yes Low Short-mod Low-Mod 10b Yes No Good Short-mod Mod-High 11 Yes Yes Good Short High 12 Yes Yes Low Short Mod-High

41
REFERENCES Aarhus Geophysics 2016a, Processing and inversion of SkyTEM data,: Geoscience BC, Peace River Main Area, Geoscience BC Report 2016-09a.
Aarhus Geophysics 2016b, Processing and inversion of SkyTEM data : Geoscience BC Charlie Lake Area, Geoscience BC Report 2016-09b.
Aarhus Geophysics 2016c, Processing and inversion of SkyTEM data : Geoscience BC Doig Area, Geoscience BC Report 2016-09c.
Aarhus Geophysics 2016d, Processing and inversion of SkyTEM data : Geoscience BC Conoco Area, Geoscience BC Report 2016-09d.
Aarhus Geophysics, 2016e: Processing and inversion of SkyTEM data: Geoscience BC Sikanni Area, Geoscience BC Report 2016-09e.
Auken, E., Foged, N. and Sørensen, K., 2002: Model recognition by 1-D laterally constrained inversion of resistivity data: Proceedings – New Technologies and Research Trends Session, 8th meeting, EEGS-ES.
Auken, E., Christiansen, A. V., Jacobsen, B. H., Foged, N., and Sørensen, K. I., 2005: Piecewise 1D Laterally Constrained Inversion of resistivity data: Geophysical Prospecting, 53, 497–506.
Brown, B., Gisseloe, P., and Best, M., 2016: SkyTEM Airborne EM Systems for Hydrogeological Mapping in British Columbia in Geoscience BC Summary of Activities 2015, Geoscience BC, Report 2016-1
Levson, V. M., 2014: NE BC Aquifer Characterization Project – Gamma Ray Interpretation; Report prepared for Ministry of Forests, Lands and Natural Resource Operations, 31 p.
Petrel Robertson Consulting Ltd., 2015: Interpretation of Quaternary sediments and depth to bedrock through data compilation and correction of gamma logs: Geoscience BC Report .