Embed Size (px)
Citation preview

Sally Beau
ty Ho
ldin
gs, inc. | 20
16 A
nn
ual R
epo
rt
WHAT’SOUR BEAUTYSECRET?
we believe that we believe that beauty
is not one-size-fits-all. not one-size-fits-all.
That’s why it is our mission That’s why it is our mission
to provide our customers to provide our customers
with a with a personalized shopping shopping
experience where we share our experience where we share our
unique beauty secrets & empower unique beauty secrets & empower
her to find her Beautiful.her to find her Beautiful.
603410.indd 1 11/28/16 2:35 PM

Shareholder Information
For more information about Sally Beauty Holdings, Inc.,please visit www.sallybeautyholdings.com
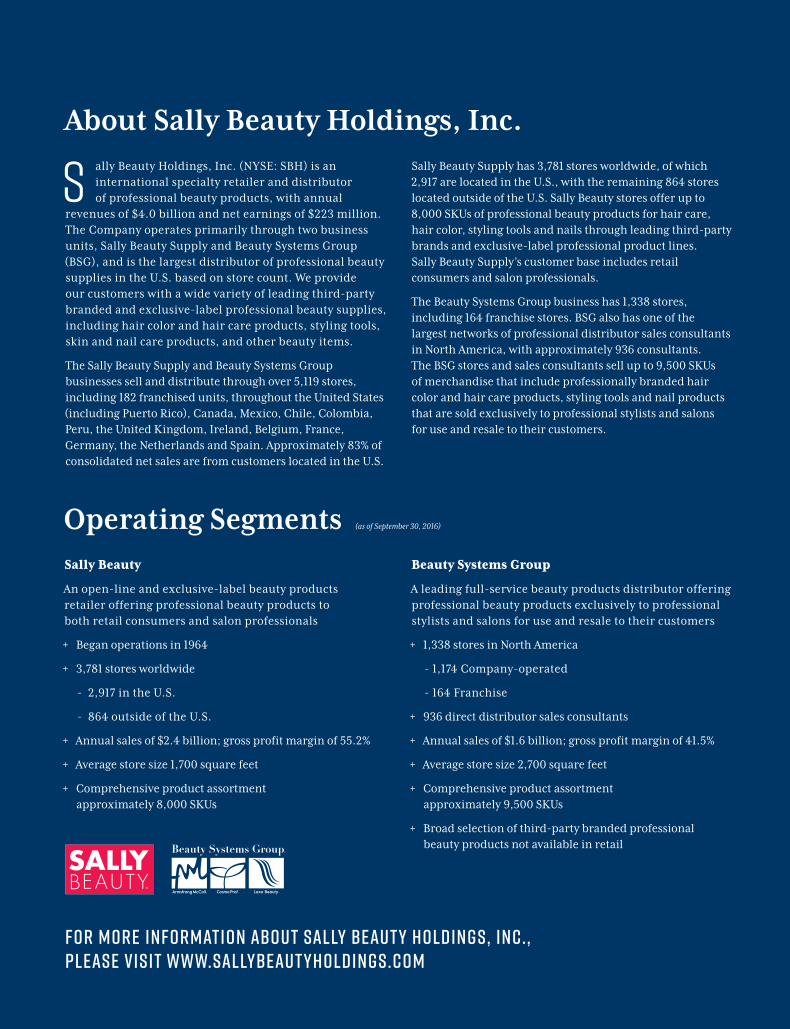
S ally Beauty Holdings, Inc. (NYSE: SBH) is an international specialty retailer and distributor of professional beauty products, with annual
revenues of $4.0 billion and net earnings of $223 million. The Company operates primarily through two business units, Sally Beauty Supply and Beauty Systems Group (BSG), and is the largest distributor of professional beauty supplies in the U.S. based on store count. We provide our customers with a wide variety of leading third-party branded and exclusive-label professional beauty supplies, including hair color and hair care products, styling tools, skin and nail care products, and other beauty items.
The Sally Beauty Supply and Beauty Systems Group businesses sell and distribute through over 5,119 stores, including 182 franchised units, throughout the United States (including Puerto Rico), Canada, Mexico, Chile, Colombia, Peru, the United Kingdom, Ireland, Belgium, France, Germany, the Netherlands and Spain. Approximately 83% of consolidated net sales are from customers located in the U.S.
Sally Beauty Supply has 3,781 stores worldwide, of which 2,917 are located in the U.S., with the remaining 864 stores located outside of the U.S. Sally Beauty stores offer up to 8,000 SKUs of professional beauty products for hair care, hair color, styling tools and nails through leading third-party brands and exclusive-label professional product lines. Sally Beauty Supply’s customer base includes retail consumers and salon professionals.
The Beauty Systems Group business has 1,338 stores, including 164 franchise stores. BSG also has one of the largest networks of professional distributor sales consultants in North America, with approximately 936 consultants. The BSG stores and sales consultants sell up to 9,500 SKUs of merchandise that include professionally branded hair color and hair care products, styling tools and nail products that are sold exclusively to professional stylists and salons for use and resale to their customers.
About Sally Beauty Holdings, Inc.
Operating SegmentsSally Beauty
An open-line and exclusive-label beauty products retailer offering professional beauty products to both retail consumers and salon professionals
+ Began operations in 1964
+ 3,781 stores worldwide
- 2,917 in the U.S.
- 864 outside of the U.S.
+ Annual sales of $2.4 billion; gross profit margin of 55.2%
+ Average store size 1,700 square feet
+ Comprehensive product assortment approximately 8,000 SKUs
Beauty Systems Group
A leading full-service beauty products distributor offering professional beauty products exclusively to professional stylists and salons for use and resale to their customers
+ 1,338 stores in North America
- 1,174 Company-operated
- 164 Franchise
+ 936 direct distributor sales consultants
+ Annual sales of $1.6 billion; gross profit margin of 41.5%
+ Average store size 2,700 square feet
+ Comprehensive product assortment approximately 9,500 SKUs
+ Broad selection of third-party branded professional beauty products not available in retail
(as of September 30, 2016)
Shareholder InformationBoard of DirectorsRobert R. McMaster
Retired Partner of KPMG LLP
Chairman of the Board
Christian A. Brickman
President and Chief Executive Officer
Sally Beauty Holdings, Inc.
Katherine Button Bell
Vice President and Chief Marketing Officer
Emerson Electric Company
Erin Nealy Cox
Retired Executive Managing Director
Stroz Friedberg LLP
Marshall E. Eisenberg
Founding Partner
Neal, Gerber & Eisenberg LLP
David W. Gibbs
President and Chief Financial Officer
Yum! Brands, Inc.
John A. Miller
President and Chief Executive Officer
North American Corporation
Susan R. Mulder
Chief Executive Officer
Nic & Zoe Co.
Edward W. Rabin
Retired President
Hyatt Hotels Corporation
Executive OfficersChristian A. Brickman
President and Chief Executive Officer
Sharon M. Leite
President, Sally Beauty Supply
Mark G. Spinks
President, Beauty Systems Group
Matthew O. Haltom
Senior Vice President, General Counsel and Secretary
Janna S. Minton
Interim Chief Financial Officer, Group Vice President,
Chief Accounting Officer and Controller
Executive Offices3001 Colorado Boulevard
Denton, Texas 76210
1-940-898-7500
1-800-777-5706
www.sallybeautyholdings.com
Common StockApproximately 900 shareholders of record.
Traded on the New York Stock Exchange (the “NYSE”)
Symbol: SBH
Independent Registered Public Accounting FirmKPMG LLP
Dallas, Texas
Transfer AgentComputershare Trust Company, N.A.
P.O. Box 30170
College Station, TX 77842-3170
Tel: 1-800-733-5001
www.computershare.com/investor
Annual MeetingThe annual meeting of stockholders is to be held on January 26, 2017,
at 9:00 a.m. (Central) at the Sally Beauty Holdings, Inc. headquarters
location at 3001 Colorado Boulevard, Denton, Texas. The Board
of Directors has also set December 1, 2016, as the record date for
determination of stockholders entitled to vote at the annual meeting.
Form 10-K Reports And Investor Relations The Company has included as an Exhibit to its Annual Report on Form
10-K filed with the Securities and Exchange Commission certificates
of the Company’s Chief Executive Officer and Interim Chief Financial
Officer certifying the quality of the Company’s public disclosure.
The certification of our Chief Executive Officer regarding compliance
with the New York Stock Exchange (NYSE) corporate governance
listing standards required by NYSE Rule 303A.12 will be filed with
the NYSE in January of 2017, following the 2017 Annual Meeting of
Stockholders. Last year, we filed this certification with the NYSE
after the 2016 Annual Meeting of Stockholders.
A copy of the Sally Beauty Holdings, Inc. 2016 Form 10-K, as filed with
the Securities and Exchange Commission, is available on the investing
section of the Company’s website at investor.sallybeautyholdings.com.
Investor inquiries or a copy of the Company Annual Report or Form
10-K or any exhibit thereto can be obtained by writing, submitting a
request via the investor section of the website, or calling the Investor
Relations department at:
Sally Beauty Holdings, Inc.
3001 Colorado Boulevard
Denton, Texas 76210
1-940-297-3877
http://investor.sallybeautyholdings.com
Cautionary StatementCautionary Notice Regarding Forward-Looking Statements
Statements in this report which are not purely historical facts or
which depend upon future events may be forward-looking statements
within the meaning of Section 27A of the Securities Act of 1933, as
amended, and Section 21E of the Securities Exchange Act of 1934,
as amended. Words such as “anticipate,” “believe,” “estimate,”
“expect,” “intend,” “plan,” “project,” “target,” “can,” “could,” “may,”
“should,” “will,” “would,” or similar expressions may also identify
such forward-looking statements.
Readers are cautioned not to place undue reliance on forward-looking
statements, as such statements speak only as of the date they were
made. Any forward-looking statements involve risks and uncertainties
that could cause actual events or results to differ materially from
the events or results described in the forward-looking statements,
including, but not limited to, risks and uncertainties related to:
anticipating and effectively responding to changes in consumer
and professional stylist preferences and buying trends in a timely
manner; the success of our strategic initiatives, including our store
refresh program and increased marketing efforts, to enhance the
customer experience, attract new customers, drive brand awareness
and improve customer loyalty; our ability to efficiently manage and
control our costs and the success of our cost control plans; the highly
competitive nature of, and the increasing consolidation of, the
beauty products distribution industry; the timing and acceptance
of new product introductions; shifts in product mix sold during any
period; potential fluctuation in our same store sales and quarterly
financial performance; our dependence upon manufacturers who
may be unwilling or unable to continue to supply products to us;
our dependence upon manufacturers who have developed or could
develop their own distribution businesses which compete directly
with ours; the possibility of material interruptions in the supply
of products by our third-party manufacturers or distributors, or
increases in the prices of products we purchase from our third-party
manufacturers or distributors; products sold by us being found to
be defective in labeling or content; compliance with current laws
and regulations or becoming subject to additional or more stringent
laws and regulations; the success of our e-commerce businesses; the
diversion of professional products sold by Beauty Systems Group to
mass retailers or other unauthorized resellers; the operational and
financial performance of our franchise-based business; successfully
identifying acquisition candidates and successfully completing
desirable acquisitions; integrating acquired businesses; the success
of our initiatives to expand into new geographies; the success of our
existing stores, and our ability to increase sales at existing stores;
opening and operating new stores profitably; the volume of traffic
to our stores; the impact of the health of the economy upon our
business; conducting business outside the United States; the impact
of Britain’s vote to leave the European Union and related or other
disruptive events in the European Union or other geographies in
which we conduct business; rising labor and rental costs; protecting
our intellectual property rights, particularly our trademarks; the risk
that our products may infringe on the intellectual property rights
of others; successfully updating and integrating our information
technology systems; disruption in our information technology systems;
a significant data security breach, including misappropriation of
our customers’ or employees’ or suppliers’ confidential information,
and the potential costs related thereto; the negative impact on our
reputation and loss of confidence of our customers, suppliers and
others arising from a significant data security breach; the costs
and diversion of management’s attention required to investigate
and remediate a data security breach and to continuously upgrade
our information technology security systems to address evolving
cyber-security threats; the ultimate determination of the extent or
scope of the potential liabilities relating to our past or any future
data security incidents; our ability to attract or retain highly skilled
management and other personnel; severe weather, natural disasters,
or acts of violence or terrorism; the preparedness of our accounting
and other management systems to meet financial reporting and
other requirements, and the upgrade of our existing financial
reporting system; being a holding company, with no operations
of our own, and depending on our subsidiaries for our liquidity
needs; our ability to execute and implement our common stock
repurchase program; our substantial indebtedness; the possibility
that we may incur substantial additional debt, including secured
debt, in the future; restrictions and limitations in the agreements
and instruments governing our debt; generating the significant
amount of cash needed to service all of our debt, and refinancing all
or a portion of our indebtedness or obtaining additional financing;
changes in interest rates increasing the cost of servicing our debt;
and the costs and effects of litigation.
Additional factors that could cause actual events or results to differ
materially from the events or results described in the forward-looking
statements can be found in our filings with the Securities and Exchange
Commission, including our most recent Annual Report on Form 10-K
for the year ended September 30, 2016, as filed with the Securities
and Exchange Commission. Consequently, all forward-looking
statements in this Annual Report are qualified by the factors, risks
and uncertainties contained therein. We assume no obligation to
publicly update or revise any forward-looking statements.
603410.indd 2 11/28/16 2:35 PM
Shareholder Information
For more information about Sally Beauty Holdings, Inc.,please visit www.sallybeautyholdings.com
S ally Beauty Holdings, Inc. (NYSE: SBH) is an international specialty retailer and distributor of professional beauty products, with annual
revenues of $4.0 billion and net earnings of $223 million. The Company operates primarily through two business units, Sally Beauty Supply and Beauty Systems Group (BSG), and is the largest distributor of professional beauty supplies in the U.S. based on store count. We provide our customers with a wide variety of leading third-party branded and exclusive-label professional beauty supplies, including hair color and hair care products, styling tools, skin and nail care products, and other beauty items.
The Sally Beauty Supply and Beauty Systems Group businesses sell and distribute through over 5,119 stores, including 182 franchised units, throughout the United States (including Puerto Rico), Canada, Mexico, Chile, Colombia, Peru, the United Kingdom, Ireland, Belgium, France, Germany, the Netherlands and Spain. Approximately 83% of consolidated net sales are from customers located in the U.S.
Sally Beauty Supply has 3,781 stores worldwide, of which 2,917 are located in the U.S., with the remaining 864 stores located outside of the U.S. Sally Beauty stores offer up to 8,000 SKUs of professional beauty products for hair care, hair color, styling tools and nails through leading third-party brands and exclusive-label professional product lines. Sally Beauty Supply’s customer base includes retail consumers and salon professionals.
The Beauty Systems Group business has 1,338 stores, including 164 franchise stores. BSG also has one of the largest networks of professional distributor sales consultants in North America, with approximately 936 consultants. The BSG stores and sales consultants sell up to 9,500 SKUs of merchandise that include professionally branded hair color and hair care products, styling tools and nail products that are sold exclusively to professional stylists and salons for use and resale to their customers.
About Sally Beauty Holdings, Inc.
Operating SegmentsSally Beauty
An open-line and exclusive-label beauty products retailer offering professional beauty products to both retail consumers and salon professionals
+ Began operations in 1964
+ 3,781 stores worldwide
- 2,917 in the U.S.
- 864 outside of the U.S.
+ Annual sales of $2.4 billion; gross profit margin of 55.2%
+ Average store size 1,700 square feet
+ Comprehensive product assortment approximately 8,000 SKUs
Beauty Systems Group
A leading full-service beauty products distributor offering professional beauty products exclusively to professional stylists and salons for use and resale to their customers
+ 1,338 stores in North America
- 1,174 Company-operated
- 164 Franchise
+ 936 direct distributor sales consultants
+ Annual sales of $1.6 billion; gross profit margin of 41.5%
+ Average store size 2,700 square feet
+ Comprehensive product assortment approximately 9,500 SKUs
+ Broad selection of third-party branded professional beauty products not available in retail
(as of September 30, 2016)
Shareholder InformationBoard of DirectorsRobert R. McMaster
Retired Partner of KPMG LLP
Chairman of the Board
Christian A. Brickman
President and Chief Executive Officer
Sally Beauty Holdings, Inc.
Katherine Button Bell
Vice President and Chief Marketing Officer
Emerson Electric Company
Erin Nealy Cox
Retired Executive Managing Director
Stroz Friedberg LLP
Marshall E. Eisenberg
Founding Partner
Neal, Gerber & Eisenberg LLP
David W. Gibbs
President and Chief Financial Officer
Yum! Brands, Inc.
John A. Miller
President and Chief Executive Officer
North American Corporation
Susan R. Mulder
Chief Executive Officer
Nic & Zoe Co.
Edward W. Rabin
Retired President
Hyatt Hotels Corporation
Executive OfficersChristian A. Brickman
President and Chief Executive Officer
Sharon M. Leite
President, Sally Beauty Supply
Mark G. Spinks
President, Beauty Systems Group
Matthew O. Haltom
Senior Vice President, General Counsel and Secretary
Janna S. Minton
Interim Chief Financial Officer, Group Vice President,
Chief Accounting Officer and Controller
Executive Offices3001 Colorado Boulevard
Denton, Texas 76210
1-940-898-7500
1-800-777-5706
www.sallybeautyholdings.com
Common StockApproximately 900 shareholders of record.
Traded on the New York Stock Exchange (the “NYSE”)
Symbol: SBH
Independent Registered Public Accounting FirmKPMG LLP
Dallas, Texas
Transfer AgentComputershare Trust Company, N.A.
P.O. Box 30170
College Station, TX 77842-3170
Tel: 1-800-733-5001
www.computershare.com/investor
Annual MeetingThe annual meeting of stockholders is to be held on January 26, 2017,
at 9:00 a.m. (Central) at the Sally Beauty Holdings, Inc. headquarters
location at 3001 Colorado Boulevard, Denton, Texas. The Board
of Directors has also set December 1, 2016, as the record date for
determination of stockholders entitled to vote at the annual meeting.
Form 10-K Reports And Investor Relations The Company has included as an Exhibit to its Annual Report on Form
10-K filed with the Securities and Exchange Commission certificates
of the Company’s Chief Executive Officer and Interim Chief Financial
Officer certifying the quality of the Company’s public disclosure.
The certification of our Chief Executive Officer regarding compliance
with the New York Stock Exchange (NYSE) corporate governance
listing standards required by NYSE Rule 303A.12 will be filed with
the NYSE in January of 2017, following the 2017 Annual Meeting of
Stockholders. Last year, we filed this certification with the NYSE
after the 2016 Annual Meeting of Stockholders.
A copy of the Sally Beauty Holdings, Inc. 2016 Form 10-K, as filed with
the Securities and Exchange Commission, is available on the investing
section of the Company’s website at investor.sallybeautyholdings.com.
Investor inquiries or a copy of the Company Annual Report or Form
10-K or any exhibit thereto can be obtained by writing, submitting a
request via the investor section of the website, or calling the Investor
Relations department at:
Sally Beauty Holdings, Inc.
3001 Colorado Boulevard
Denton, Texas 76210
1-940-297-3877
http://investor.sallybeautyholdings.com
Cautionary StatementCautionary Notice Regarding Forward-Looking Statements
Statements in this report which are not purely historical facts or
which depend upon future events may be forward-looking statements
within the meaning of Section 27A of the Securities Act of 1933, as
amended, and Section 21E of the Securities Exchange Act of 1934,
as amended. Words such as “anticipate,” “believe,” “estimate,”
“expect,” “intend,” “plan,” “project,” “target,” “can,” “could,” “may,”
“should,” “will,” “would,” or similar expressions may also identify
such forward-looking statements.
Readers are cautioned not to place undue reliance on forward-looking
statements, as such statements speak only as of the date they were
made. Any forward-looking statements involve risks and uncertainties
that could cause actual events or results to differ materially from
the events or results described in the forward-looking statements,
including, but not limited to, risks and uncertainties related to:
anticipating and effectively responding to changes in consumer
and professional stylist preferences and buying trends in a timely
manner; the success of our strategic initiatives, including our store
refresh program and increased marketing efforts, to enhance the
customer experience, attract new customers, drive brand awareness
and improve customer loyalty; our ability to efficiently manage and
control our costs and the success of our cost control plans; the highly
competitive nature of, and the increasing consolidation of, the
beauty products distribution industry; the timing and acceptance
of new product introductions; shifts in product mix sold during any
period; potential fluctuation in our same store sales and quarterly
financial performance; our dependence upon manufacturers who
may be unwilling or unable to continue to supply products to us;
our dependence upon manufacturers who have developed or could
develop their own distribution businesses which compete directly
with ours; the possibility of material interruptions in the supply
of products by our third-party manufacturers or distributors, or
increases in the prices of products we purchase from our third-party
manufacturers or distributors; products sold by us being found to
be defective in labeling or content; compliance with current laws
and regulations or becoming subject to additional or more stringent
laws and regulations; the success of our e-commerce businesses; the
diversion of professional products sold by Beauty Systems Group to
mass retailers or other unauthorized resellers; the operational and
financial performance of our franchise-based business; successfully
identifying acquisition candidates and successfully completing
desirable acquisitions; integrating acquired businesses; the success
of our initiatives to expand into new geographies; the success of our
existing stores, and our ability to increase sales at existing stores;
opening and operating new stores profitably; the volume of traffic
to our stores; the impact of the health of the economy upon our
business; conducting business outside the United States; the impact
of Britain’s vote to leave the European Union and related or other
disruptive events in the European Union or other geographies in
which we conduct business; rising labor and rental costs; protecting
our intellectual property rights, particularly our trademarks; the risk
that our products may infringe on the intellectual property rights
of others; successfully updating and integrating our information
technology systems; disruption in our information technology systems;
a significant data security breach, including misappropriation of
our customers’ or employees’ or suppliers’ confidential information,
and the potential costs related thereto; the negative impact on our
reputation and loss of confidence of our customers, suppliers and
others arising from a significant data security breach; the costs
and diversion of management’s attention required to investigate
and remediate a data security breach and to continuously upgrade
our information technology security systems to address evolving
cyber-security threats; the ultimate determination of the extent or
scope of the potential liabilities relating to our past or any future
data security incidents; our ability to attract or retain highly skilled
management and other personnel; severe weather, natural disasters,
or acts of violence or terrorism; the preparedness of our accounting
and other management systems to meet financial reporting and
other requirements, and the upgrade of our existing financial
reporting system; being a holding company, with no operations
of our own, and depending on our subsidiaries for our liquidity
needs; our ability to execute and implement our common stock
repurchase program; our substantial indebtedness; the possibility
that we may incur substantial additional debt, including secured
debt, in the future; restrictions and limitations in the agreements
and instruments governing our debt; generating the significant
amount of cash needed to service all of our debt, and refinancing all
or a portion of our indebtedness or obtaining additional financing;
changes in interest rates increasing the cost of servicing our debt;
and the costs and effects of litigation.
Additional factors that could cause actual events or results to differ
materially from the events or results described in the forward-looking
statements can be found in our filings with the Securities and Exchange
Commission, including our most recent Annual Report on Form 10-K
for the year ended September 30, 2016, as filed with the Securities
and Exchange Commission. Consequently, all forward-looking
statements in this Annual Report are qualified by the factors, risks
and uncertainties contained therein. We assume no obligation to
publicly update or revise any forward-looking statements.
603410.indd 2 11/28/16 2:35 PM
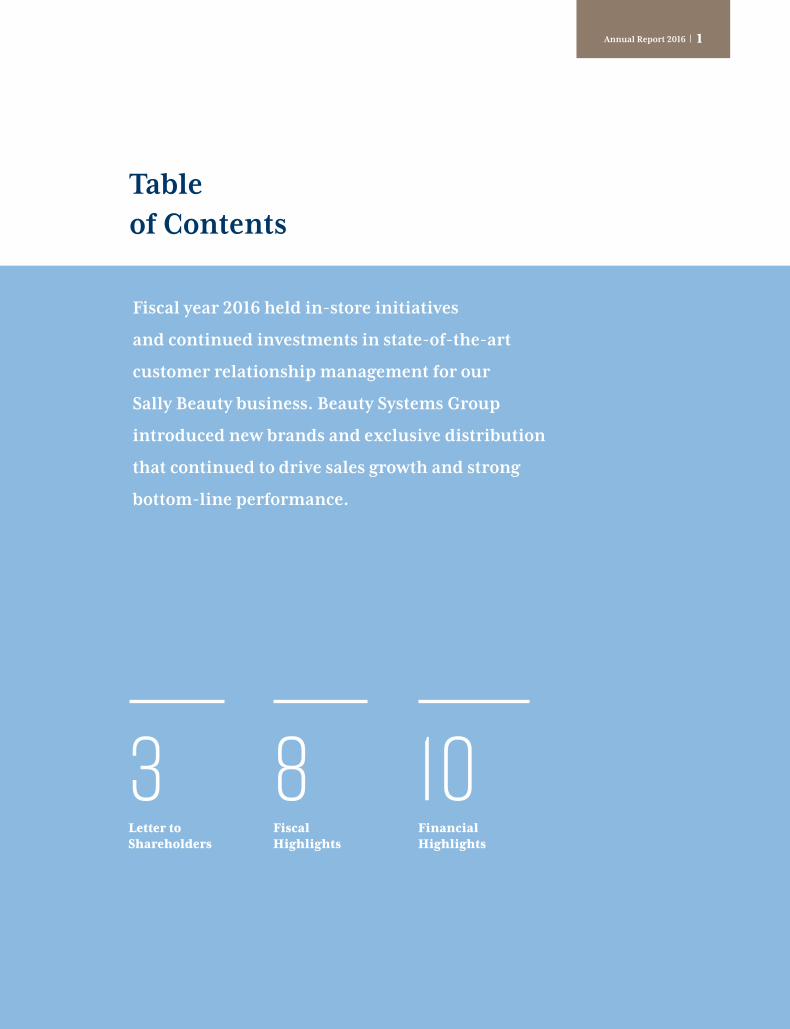
Table of Contents
Fiscal year 2016 held in-store initiatives
and continued investments in state-of-the-art
customer relationship management for our
Sally Beauty business. Beauty Systems Group
introduced new brands and exclusive distribution
that continued to drive sales growth and strong
bottom-line performance.
3Letter to Shareholders
10Financial Highlights
8Fiscal Highlights
Annual Report 2016 | 1
603410.indd 3 11/22/16 4:22 PM

Sally Beauty Holdings | 2
Beautyfor all.
603410.indd 4 11/22/16 4:22 PM
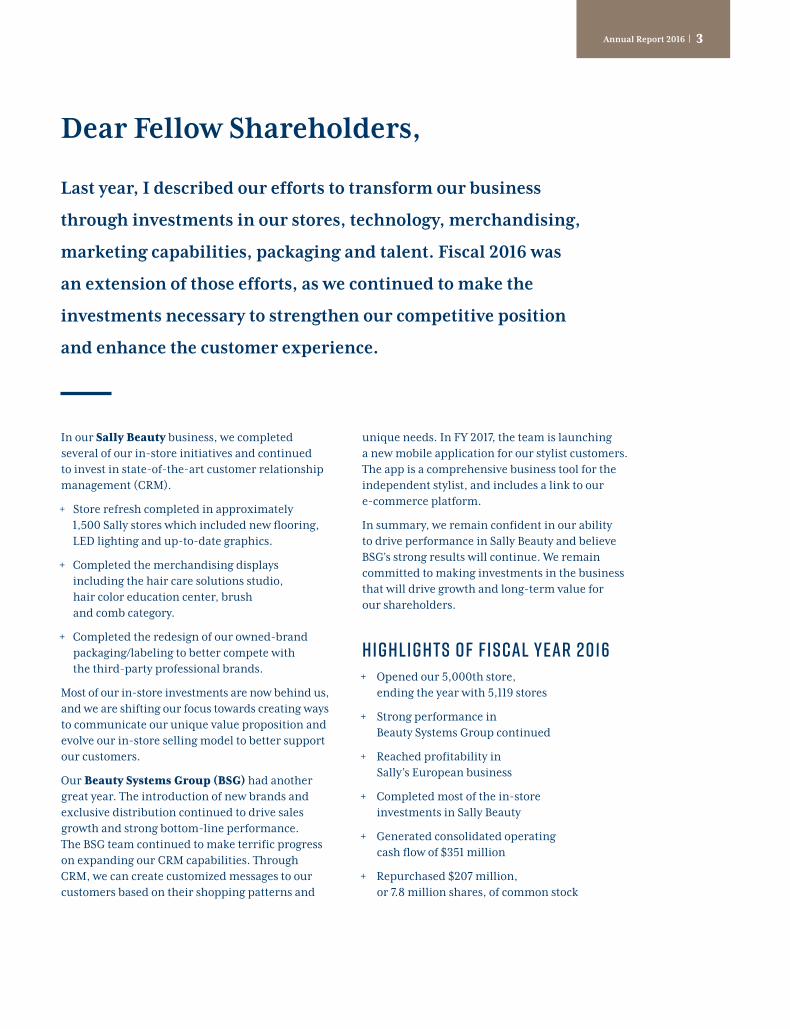
In our Sally Beauty business, we completed several of our in-store initiatives and continued to invest in state-of-the-art customer relationship management (CRM).
+ Store refresh completed in approximately 1,500 Sally stores which included new flooring, LED lighting and up-to-date graphics.
+ Completed the merchandising displays including the hair care solutions studio, hair color education center, brush and comb category.
+ Completed the redesign of our owned-brand packaging/labeling to better compete with the third-party professional brands.
Most of our in-store investments are now behind us, and we are shifting our focus towards creating ways to communicate our unique value proposition and evolve our in-store selling model to better support our customers.
Our Beauty Systems Group (BSG) had another great year. The introduction of new brands and exclusive distribution continued to drive sales growth and strong bottom-line performance. The BSG team continued to make terrific progress on expanding our CRM capabilities. Through CRM, we can create customized messages to our customers based on their shopping patterns and
Dear Fellow Shareholders,
Last year, I described our efforts to transform our business
through investments in our stores, technology, merchandising,
marketing capabilities, packaging and talent. Fiscal 2016 was
an extension of those efforts, as we continued to make the
investments necessary to strengthen our competitive position
and enhance the customer experience.
unique needs. In FY 2017, the team is launching a new mobile application for our stylist customers. The app is a comprehensive business tool for the independent stylist, and includes a link to our e-commerce platform.
In summary, we remain confident in our ability to drive performance in Sally Beauty and believe BSG’s strong results will continue. We remain committed to making investments in the business that will drive growth and long-term value for our shareholders.
Highlights of Fiscal Year 2016+ Opened our 5,000th store,
ending the year with 5,119 stores
+ Strong performance in Beauty Systems Group continued
+ Reached profitability in Sally’s European business
+ Completed most of the in-store investments in Sally Beauty
+ Generated consolidated operating cash flow of $351 million
+ Repurchased $207 million, or 7.8 million shares, of common stock
Annual Report 2016 | 3
603410.indd 5 11/22/16 4:22 PM

Sally Beauty Holdings | 4
603410.indd 6 11/28/16 2:35 PM

+
Financial Results in Fiscal Year 2016During FY 2016, our consolidated net sales reached $4.0 billion, growth of 3.1 percent over the prior year. This sales increase was driven by the addition of 152 net new stores, as well as growth of 2.9 percent in global same store sales. Gross profit ended the year at $2.0 billion, for growth of 3.5 percent. This resulted in gross profit margin of 49.7 percent, up 20 basis points from the prior year. Diluted earnings per share were $1.50, up 70 basis points from FY 2015. We generated $351 million in net operating cash flow, which funded our investments in company growth and our stock repurchase program.
Growing GloballyWe continued to grow our store base and increased our footprint by 3.1 percent (152 stores). We now operate 4,132 Sally and BSG stores in the United States. Outside of the U.S., we operate 987 stores in 12 countries: Canada, Mexico, Chile, Peru, Colombia, the United Kingdom, Ireland, Belgium, France, Germany, the Netherlands and Spain. In FY 2017, we believe we can achieve consolidated store growth of 2 to 3 percent.
BUSINESS SEGMENT FINANCIAL RESULTSSally Beauty SupplyNet sales at our Sally Beauty Supply segment reached $2.4 billion, an increase of 1.5% percent. Sales growth was driven by 108 net new stores and same store sales growth of 1.7 percent. The unfavorable impact of foreign currency exchange offset sales growth by 200 basis points. Gross margin was 55.2 percent, an increase of 40 basis points over FY 2015. Segment operating earnings were $410 million, Gross margin was 55.2 percent, an increase of
Annual Report 2016 | 5
603410.indd 7 11/28/16 2:35 PM

Sally Beauty Holdings | 6
603410.indd 8 11/22/16 4:23 PM
40 basis points over FY 2015. Segment operating earnings were $410 million, down 0.6 percent from $412 million in FY 2015. Segment operating margins were 17.3 percent of sales, down 40 basis points primarily due to higher investments in information technology and labor cost inflation. Sally Beauty Supply ended the fiscal year with 3,781 stores worldwide: 2,917 in the U.S. and Puerto Rico, and the remaining 864 stores in Canada, Mexico, Chile, Peru, Colombia, the United Kingdom, Ireland, Belgium, France, Germany, the Netherlands and Spain. Beauty Club Card memberships increased 12 percent to reach 9.9 million members.
Beauty Systems GroupOur Beauty Systems Group segment had sales growth of 5.5 percent, to reach $1.6 billion. This performance can be attributed to a 5.5 percent growth in same store sales and the addition of 44 net new stores. BSG’s gross margin rose 20 basis points from FY 2015 to 41.5 percent. Operating earnings grew 10.1 percent over the prior year to $254 million. Operating margins improved by 60 basis points to reach a high of 16.0 percent of sales. This strong operating performance was primarily due to continued operating leverage and gross margin expansion. BSG ended the fiscal year with 1,338 stores, including 164 franchise stores, an increase of 44 stores over FY 2015. Distributor sales consultants totaled 936 at year-end.
SummaryThe first tenet of our corporate values is We Put the Customer First, and that is exactly what we intend to do in fiscal 2017. We built our FY 2017 strategies and plans to focus on our customers’ needs. In Sally, the team will build upon the next phase of customer conversion and engagement. We intend to leverage our CRM capabilities and
introduce new brands to the stores. In addition, we will continue to find new and creative ways to communicate our unique value proposition through digital and social media as well as traditional media. And finally, we will roll out a new selling model to our store associates and provide them with tools to better serve our customers. In BSG, we expect to gain channel share through acquisitions and brand exclusivity. We will continue our efforts to become the indisputable partner of choice for stylist and salon customers and manufacturers through innovative ideas like the stylist mobile application and CRM.
For 2017, our operating goal is to drive profitable sales growth. We expect revenue improvement from consolidated same store sales growth and organic store openings. Gross margin expansion is anticipated and should offset higher SG&A expenses. In addition, I have challenged the team to reallocate spending to the highest return initiatives and rationalize expenditures.
As always, thank you for your support.
Best Regards,
Chris Brickman President and Chief Executive Officer
Annual Report 2016 | 7
603410.indd 9 11/22/16 4:23 PM
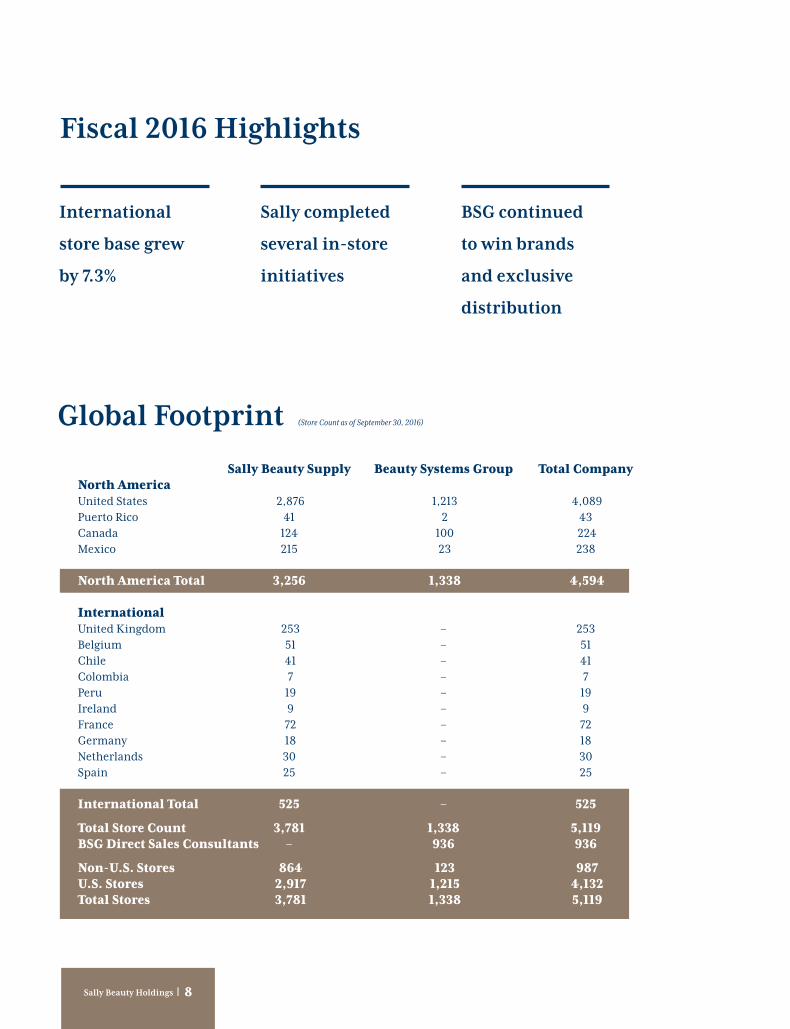
Sally Beauty Supply Beauty Systems Group Total CompanyNorth AmericaUnited States 2,876 1,213 4,089Puerto Rico 41 2 43Canada 124 100 224 Mexico 215 23 238
North America Total 3,256 1,338 4,594
InternationalUnited Kingdom 253 – 253Belgium 51 – 51Chile 41 – 41Colombia 7 – 7Peru 19 – 19Ireland 9 – 9France 72 – 72Germany 18 – 18 Netherlands 30 – 30Spain 25 – 25
International Total 525 – 525
Total Store Count 3,781 1,338 5,119BSG Direct Sales Consultants – 936 936
Non-U.S. Stores 864 123 987U.S. Stores 2,917 1,215 4,132Total Stores 3,781 1,338 5,119
(Store Count as of September 30, 2016)Global Footprint
Fiscal 2016 Highlights
International
store base grew
by 7.3%
Sally completed
several in-store
initiatives
BSG continued
to win brands
and exclusive
distribution
Sally Beauty Holdings | 8
603410.indd 10 11/28/16 2:35 PM
$0.0
$0.5
$1.0
$1.5
$2.0
$2.5
$3.0
$3.5
$4.0
2016201520142013201245%
46%
47%
48%
49%
50%
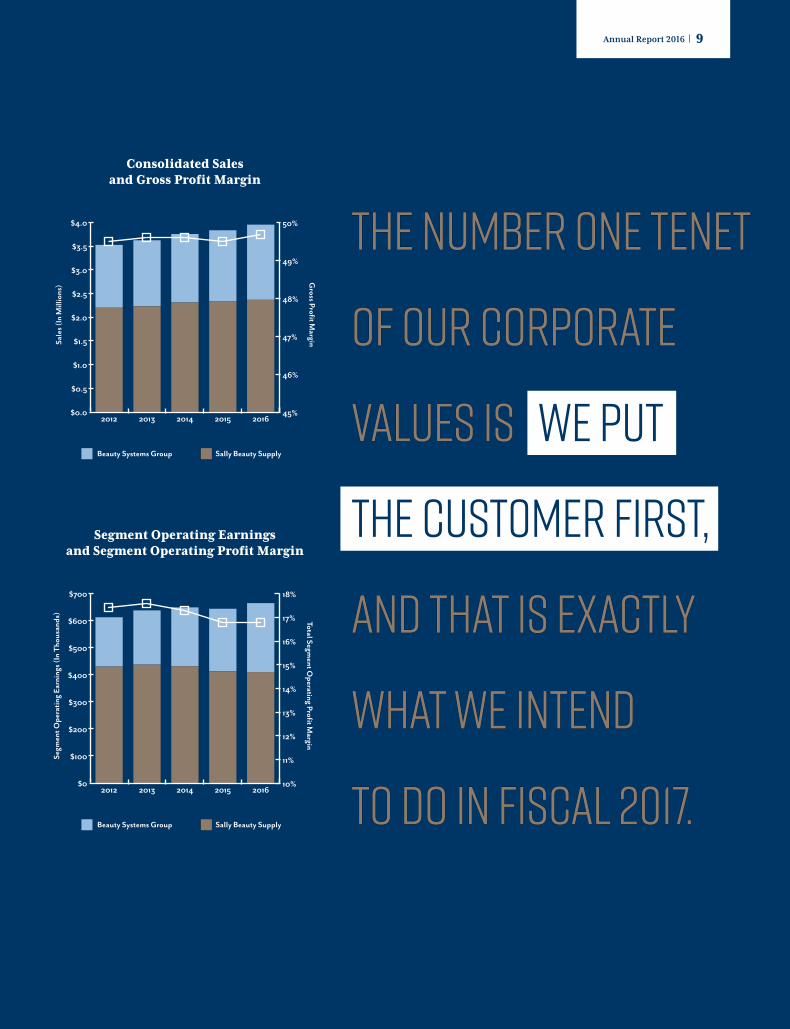
Consolidated Sales and Gross Profit Margin
Beauty Systems Group Sally Beauty Supply
Sale
s (In
Mill
ions
)
Gross Profit M
arginTotal Segm
ent Operating Profit M
argin
$0
$100
$200
$300
$400
$500
$600
$700
2016201520142013201210%
11%
12%
13%
14%
15%
16%
17%
18%
Segment Operating Earnings and Segment Operating Profit Margin
Beauty Systems Group Sally Beauty Supply
Segm
ent O
pera
ting
Earn
ings
(In
Thou
sand
s)
The NUMBER ONE tenet The NUMBER ONE tenet
of our corporateof our corporate
values is values is We Put
the Customer First,
and that is exactly and that is exactly
what we intend what we intend
to do in fiscal 2017. to do in fiscal 2017.
Annual Report 2016 | 9
603410.indd 11 11/28/16 2:35 PM
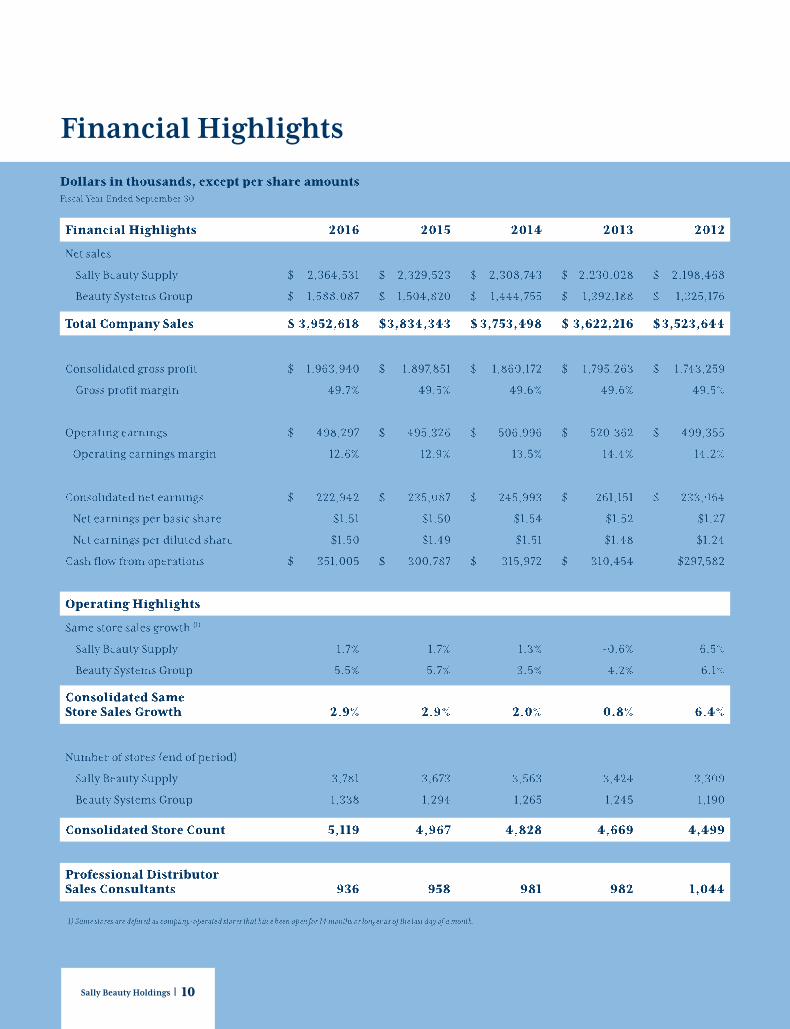
Financial HighlightsFinancial Highlights 20162016 20152015 20142014 20132013 20122012
Net salesNet sales
Sally Beauty Supply Sally Beauty Supply $ $ 2,364,5312,364,531 $ 2,329,523$ 2,329,523 $ 2,308,743$ 2,308,743 $ 2,230,028$ 2,230,028 $ 2,198,468$ 2,198,468
Beauty Systems Group Beauty Systems Group $ $ 1,588,087 1,588,087 $ 1,504,820$ 1,504,820 $ 1,444,755$ 1,444,755 $ 1,392,188$ 1,392,188 $ 1,325,176$ 1,325,176
Total Company SalesTotal Company Sales $ 3,952,618$ 3,952,618 $ 3,834,343$ 3,834,343 $ 3,753,498$ 3,753,498 $ 3,622,216$ 3,622,216 $ 3,523,644$ 3,523,644
Consolidated gross profitConsolidated gross profit $ 1,963,940$ 1,963,940 $ 1,897,851$ 1,897,851 $ 1,860,172$ 1,860,172 $ 1,795,263$ 1,795,263 $ 1,743,259$ 1,743,259
Gross profit margin Gross profit margin 49.7%49.7% 49.5%49.5% 49.6%49.6% 49.6%49.6% 49.5%49.5%
Operating earningsOperating earnings $ 498,297$ 498,297 $ 495,326$ 495,326 $ 506,996$ 506,996 $ 520,362$ 520,362 $ 499,355$ 499,355
Operating earnings margin Operating earnings margin 12.6%12.6% 12.9% 12.9% 13.5%13.5% 14.4%14.4% 14.2%14.2%
Consolidated net earnings Consolidated net earnings $ 222,942$ 222,942 $ 235,087$ 235,087 $ 245,993$ 245,993 $ 261,151$ 261,151 $ 233,064$ 233,064
Net earnings per basic share Net earnings per basic share $1.51$1.51 $1.50$1.50 $1.54$1.54 $1.52$1.52 $1.27$1.27
Net earnings per diluted share Net earnings per diluted share $1.50$1.50 $1.49$1.49 $1.51$1.51 $1.48$1.48 $1.24$1.24
Cash flow from operationsCash flow from operations $ 351,005$ 351,005 $ 300,787$ 300,787 $ 315,972$ 315,972 $ 310,454$ 310,454 $297,582$297,582
Operating HighlightsOperating Highlights
Same store sales growth Same store sales growth (1)(1)
Sally Beauty Supply Sally Beauty Supply 1.7%1.7% 1.7%1.7% 1.3%1.3% -0.6%-0.6% 6.5%6.5%
Beauty Systems Group Beauty Systems Group 5.5%5.5% 5.7%5.7% 3.5%3.5% 4.2%4.2% 6.1%6.1%
Consolidated Same Consolidated Same Store Sales GrowthStore Sales Growth 2.9%2.9% 2.9%2.9% 2.0%2.0% 0.8%0.8% 6.4%6.4%
Number of stores (end of period)Number of stores (end of period)
Sally Beauty Supply Sally Beauty Supply 3,7813,781 3,6733,673 3,5633,563 3,4243,424 3,3093,309
Beauty Systems Group Beauty Systems Group 1,3381,338 1,2941,294 1,2651,265 1,2451,245 1,1901,190
Consolidated Store CountConsolidated Store Count 5,1195,119 4,9674,967 4,8284,828 4,6694,669 4,4994,499
Professional Distributor Professional Distributor Sales ConsultantsSales Consultants 936936 958958 981981 982982 1,0441,044
(1) Same stores are defined as company-operated stores that have been open for 14 months or longer as of the last day of a month.(1) Same stores are defined as company-operated stores that have been open for 14 months or longer as of the last day of a month.
Financial Highlights
Dollars in thousands, except per share amountsDollars in thousands, except per share amountsFiscal Year Ended September 30Fiscal Year Ended September 30
Sally Beauty Holdings | 10
603410.indd 12 11/22/16 4:23 PM

10-K
2016
UNITED STATESSECURITIES AND EXCHANGE COMMISSION
Washington, D.C. 20549
FORM 10-K� ANNUAL REPORT PURSUANT TO SECTION 13 OR 15(d) OF THE
SECURITIES EXCHANGE ACT OF 1934FOR THE FISCAL YEAR ENDED: SEPTEMBER 30, 2016
-OR-
� TRANSITION REPORT PURSUANT TO SECTION 13 OR 15(d) OF THESECURITIES EXCHANGE ACT OF 1934
For the transition period from to Commission File No. 1-33145
SALLY BEAUTY HOLDINGS, INC.(Exact name of registrant as specified in its charter)
Delaware 36-2257936(State or other jurisdiction of (I.R.S. Employer Identification No.)incorporation or organization)
3001 Colorado Boulevard 76210Denton, Texas (Zip Code)
(Address of principal executive offices)Registrant’s telephone number, including area code: (940) 898-7500
Securities registered pursuant to Section 12(b) of the Act:
Title of Each Class Name of Each Exchange on Which Registered
Common Stock, par value $.01 per share New York Stock ExchangeSecurities registered pursuant to Section 12(g) of the Act: None
Indicate by check mark if the registrant is a well-known seasoned issuer, as defined under Rule 405 of the SecuritiesAct. YES � NO �
Indicate by check mark if the registrant is not required to file reports pursuant to Section 13 or Section 15(d) of theAct. YES � NO �
Indicate by check mark whether the registrant (1) has filed all reports required to be filed by Section 13 or 15(d) of theSecurities Exchange Act of 1934 during the preceding 12 months (or for such shorter period that the registrant was requiredto file such reports), and (2) has been subject to such filing requirements for the past 90 days. YES � NO �
Indicate by check mark whether the registrant has submitted electronically and posted on its corporate Web site, if any, everyInteractive Data File required to be submitted and posted pursuant to Rule 405 of Regulation S-T during the preceding12 months (or for such shorter period that the registrant was required to submit and post such files). YES � NO �
Indicate by check mark if disclosure of delinquent filers pursuant to Item 405 of Regulation S-K is not contained herein, andwill not be contained, to the best of registrant’s knowledge, in definitive proxy or information statements incorporated byreference in Part III of this Form 10-K or any amendment to this Form 10-K. �
Indicate by check mark whether the registrant is a large accelerated filer, an accelerated filer, a non-accelerated filer, or asmaller reporting company. See the definitions of ‘‘large accelerated filer,’’ ‘‘accelerated filer’’ and ‘‘smaller reportingcompany’’ in Rule 12b-2 of the Exchange Act.
Large accelerated filer � Accelerated filer � Non-accelerated filer � Smaller reporting company �(Do not check if a smaller
reporting company)
Indicate by check mark whether the registrant is a shell company (as defined in Rule 12b-2 of the ExchangeAct.) YES � NO �
The aggregate market value of registrant’s common stock held by non-affiliates of the registrant, based upon the closing priceof a share of the registrant’s common stock on March 31, 2016 was approximately $4,716,726,000. At November 9, 2016,there were 144,109,429 shares of the registrant’s common stock outstanding.
DOCUMENTS INCORPORATED BY REFERENCEPortions of the registrant’s Proxy Statement relating to the registrant’s 2017 Annual Meeting of Stockholders areincorporated by reference into Part III of this Annual Report on Form 10-K where indicated.
TABLE OF CONTENTS
Page
PART IITEM 1. BUSINESS . . . . . . . . . . . . . . . . . . . . . . . . . . . . . . . . . . . . . . . . . . . . . . . . . . . . . 1ITEM 1A. RISK FACTORS . . . . . . . . . . . . . . . . . . . . . . . . . . . . . . . . . . . . . . . . . . . . . . . . . 19ITEM 1B. UNRESOLVED STAFF COMMENTS . . . . . . . . . . . . . . . . . . . . . . . . . . . . . . . . . 36ITEM 2. PROPERTIES . . . . . . . . . . . . . . . . . . . . . . . . . . . . . . . . . . . . . . . . . . . . . . . . . . . 37ITEM 3. LEGAL PROCEEDINGS . . . . . . . . . . . . . . . . . . . . . . . . . . . . . . . . . . . . . . . . . . 38ITEM 4. MINE SAFETY DISCLOSURES . . . . . . . . . . . . . . . . . . . . . . . . . . . . . . . . . . . . . 38
PART IIITEM 5. MARKET FOR REGISTRANT’S COMMON EQUITY, RELATED
STOCKHOLDER MATTERS AND ISSUER PURCHASES OF EQUITYSECURITIES . . . . . . . . . . . . . . . . . . . . . . . . . . . . . . . . . . . . . . . . . . . . . . . . . 39
ITEM 6. SELECTED FINANCIAL DATA . . . . . . . . . . . . . . . . . . . . . . . . . . . . . . . . . . . . . 42ITEM 7. MANAGEMENT’S DISCUSSION AND ANALYSIS OF FINANCIAL
CONDITION AND RESULTS OF OPERATIONS . . . . . . . . . . . . . . . . . . . . . . 44ITEM 7A. QUANTITATIVE AND QUALITATIVE DISCLOSURES ABOUT MARKET
RISK . . . . . . . . . . . . . . . . . . . . . . . . . . . . . . . . . . . . . . . . . . . . . . . . . . . . . . . . 79ITEM 8. FINANCIAL STATEMENTS AND SUPPLEMENTARY DATA . . . . . . . . . . . . . . . 81ITEM 9. CHANGES IN AND DISAGREEMENTS WITH ACCOUNTANTS ON
ACCOUNTING AND FINANCIAL DISCLOSURE . . . . . . . . . . . . . . . . . . . . . 81ITEM 9A. CONTROLS AND PROCEDURES . . . . . . . . . . . . . . . . . . . . . . . . . . . . . . . . . . . 81ITEM 9B. OTHER INFORMATION . . . . . . . . . . . . . . . . . . . . . . . . . . . . . . . . . . . . . . . . . . 82
PART IIIITEM 10. DIRECTORS, EXECUTIVE OFFICERS AND CORPORATE GOVERNANCE . . 83ITEM 11. EXECUTIVE COMPENSATION . . . . . . . . . . . . . . . . . . . . . . . . . . . . . . . . . . . . . 83ITEM 12. SECURITY OWNERSHIP OF CERTAIN BENEFICIAL OWNERS AND
MANAGEMENT AND RELATED STOCKHOLDER MATTERS . . . . . . . . . . . 83ITEM 13. CERTAIN RELATIONSHIPS AND RELATED TRANSACTIONS, AND
DIRECTOR INDEPENDENCE . . . . . . . . . . . . . . . . . . . . . . . . . . . . . . . . . . . . 84ITEM 14. PRINCIPAL ACCOUNTING FEES AND SERVICES . . . . . . . . . . . . . . . . . . . . . . 84
PART IVITEM 15. EXHIBITS AND FINANCIAL STATEMENT SCHEDULES . . . . . . . . . . . . . . . . . 85
i
In this Annual Report, references to ‘‘the Company,’’ ‘‘Sally Beauty,’’ ‘‘our company,’’ ‘‘we,’’ ‘‘our,’’ ‘‘ours’’and ‘‘us’’ refer to Sally Beauty Holdings, Inc. and its consolidated subsidiaries unless otherwise indicated orthe context otherwise requires.
CAUTIONARY NOTICE REGARDING FORWARD-LOOKING STATEMENTS
Statements in this Annual Report on Form 10-K and in the documents incorporated by reference hereinwhich are not purely historical facts or which depend upon future events may constitute forward-lookingstatements within the meaning of Section 27A of the Securities Act of 1933, as amended, and Section 21Eof the Securities Exchange Act of 1934, as amended, which we refer to as the Exchange Act. Words such as‘‘anticipate,’’ ‘‘believe,’’ ‘‘estimate,’’ ‘‘expect,’’ ‘‘intend,’’ ‘‘plan,’’ ‘‘project,’’ ‘‘target,’’ ‘‘can,’’ ‘‘could,’’ ‘‘may,’’‘‘should,’’ ‘‘will,’’ ‘‘would’’ or similar expressions may also identify such forward-looking statements.
Readers are cautioned not to place undue reliance on forward-looking statements as such statementsspeak only as of the date they were made. Any forward-looking statements involve risks and uncertaintiesthat could cause actual events or results to differ materially from the events or results described in theforward-looking statements, including, but not limited to, risks and uncertainties related to:
• anticipating and effectively responding to changes in consumer and professional stylist preferencesand buying trends in a timely manner;
• the success of our strategic initiatives, including our store refresh program and increased marketingefforts, to enhance the customer experience, attract new customers, drive brand awareness andimprove customer loyalty;
• our ability to efficiently manage and control our costs and the success of our cost control plans;
• the highly competitive nature of, and the increasing consolidation of, the beauty productsdistribution industry;
• the timing and acceptance of new product introductions;
• shifts in product mix sold during any period;
• potential fluctuation in our same store sales and quarterly financial performance;
• our dependence upon manufacturers who may be unwilling or unable to continue to supplyproducts to us;
• our dependence upon manufacturers who have developed or could develop their own distributionbusinesses which compete directly with ours;
• the possibility of material interruptions in the supply of products by our third-party manufacturersor distributors or increases in the prices of the products we purchase from our third-partymanufacturers or distributors;
• products sold by us being found to be defective in labeling or content;
• compliance with current laws and regulations or becoming subject to additional or more stringentlaws and regulations;
• the success of our e-commerce businesses;
• diversion of professional products sold by Beauty Systems Group to mass retailers or otherunauthorized resellers;
• the operational and financial performance of our Armstrong McCall, L.P. franchise-based business,which we refer to as Armstrong McCall;
• successfully identifying acquisition candidates and successfully completing desirable acquisitions;
• integrating acquired businesses;
ii
• the success of our initiatives to expand into new geographies;
• the success of our existing stores, and our ability to increase sales at existing stores;
• opening and operating new stores profitably;
• the volume of traffic to our stores;
• the impact of the health of the economy upon our business;
• conducting business outside the United States;
• the impact of Britain’s vote to leave the European Union and related or other disruptive events inthe European Union or other geographies in which we conduct business;
• rising labor and rental costs;
• protecting our intellectual property rights, particularly our trademarks;
• the risk that our products may infringe on the intellectual property rights of others;
• successfully updating and integrating our information technology systems;
• disruption in our information technology systems;
• a significant data security breach, including misappropriation of our customers’, employees’ orsuppliers’ confidential information, and the potential costs related thereto;
• the negative impact on our reputation and loss of confidence of our customers, suppliers and othersarising from a significant data security breach;
• the costs and diversion of management’s attention required to investigate and remediate a datasecurity breach and to continuously upgrade our information technology security systems to addressevolving cyber-security threats;
• the ultimate determination of the extent or scope of the potential liabilities relating to our past orany future data security incidents;
• our ability to attract and retain highly skilled management and other personnel;
• severe weather, natural disasters or acts of violence or terrorism;
• the preparedness of our accounting and other management systems to meet financial reporting andother requirements and the upgrade of our existing financial reporting system;
• being a holding company, with no operations of our own, and depending on our subsidiaries for ourliquidity needs;
• our ability to execute and implement our share repurchase program;
• our substantial indebtedness;
• the possibility that we may incur substantial additional debt, including secured debt, in the future;
• restrictions and limitations in the agreements and instruments governing our debt;
• generating the significant amount of cash needed to service all of our debt and refinancing all or aportion of our indebtedness or obtaining additional financing;
• changes in interest rates increasing the cost of servicing our debt; and
• the costs and effects of litigation.
The events described in the forward-looking statements might not occur or might occur to a differentextent or at a different time than we have described. As a result, our actual results may differ materiallyfrom the results contemplated by these forward-looking statements. We assume no obligation to publiclyupdate or revise any forward-looking statements.
iii
PART I
ITEM 1. BUSINESS
Introduction
Sally Beauty Holdings, Inc. is an international specialty retailer and distributor of professional beautysupplies with operations primarily in North America, South America and Europe. We believe theCompany is the largest distributor of professional beauty supplies in the U.S. based on store count. AtSeptember 30, 2016, we operated primarily through two business units, Sally Beauty Supply and BeautySystems Group (BSG), and, through Sally Beauty Supply and BSG, we operated a multi-channel platformof 4,937 company-operated stores and supplied 182 franchised stores. Within BSG, we also have one of thelargest networks of professional distributor sales consultants in North America, with approximately 936professional distributor sales consultants who sell directly to salons and salon professionals. Sally BeautySupply targets retail consumers and salon professionals, while BSG exclusively targets salons and salonprofessionals. Through Sally Beauty Supply and BSG, we have store locations in the United States(including Puerto Rico), Canada, Mexico, Chile, Colombia, Peru, the United Kingdom, Ireland, Belgium,France, Germany, the Netherlands and Spain. We provide our customers with a wide variety of leadingthird-party branded and exclusive-label professional beauty supplies, including hair color products, haircare products, styling appliances, skin and nail care products and other beauty items. For each of the fiscalyears ended September 30, 2016, 2015 and 2014, over 80% of our consolidated net sales were fromcustomers located in the U.S. For the fiscal year ended September 30, 2016, our consolidated net sales andoperating earnings were $3,952.6 million and $498.3 million, respectively.
Professional Beauty Supply Industry Distribution Channels
The professional beauty supply industry serves end-users through four distribution channels: full-service/exclusive distribution, open-line distribution, direct and mega-salon stores.
Full-Service/Exclusive
This channel exclusively serves salons and salon professionals and distributes ‘‘professional-only’’ productsfor use in salons and resale to consumers in salons. Many brands are distributed through exclusivearrangements with suppliers by geographic territory. We believe that BSG is a leading full-servicedistributor in the U.S. In addition, we offer our BSG products for sale to salons and salon professionalsthrough the Company’s websites (including www.cosmoprofbeauty.com, www.cosmoprofequipment.com andwww.loxabeauty.com).
Open-Line
This channel serves retail consumers and salon professionals through retail stores and the internet. Thischannel is served by a large number of localized retailers and distributors, with only a few having a regionalpresence and significant channel share. We believe that Sally Beauty Supply is the largest open-linedistributor in the U.S. with its nationwide network of retail stores. In addition, the Company’s websites(including www.sallybeauty.com) and other e-commerce platforms provide retail consumers and salonprofessionals access to product offerings and information beyond our retail stores.
Direct
This channel focuses on direct sales to salons and salon professionals by large manufacturers. This is thedominant form of distribution in Europe, but represents a smaller channel in the U.S. due to the highlyfragmented nature of the U.S. salon industry, which makes direct distribution cost prohibitive for manymanufacturers.
1
Mega-Salon Stores
In this channel, large-format salons are supplied directly by manufacturers due to their large scale.
Key Industry and Business Trends
We operate within the large and growing professional beauty supply industry primarily in the U.S., but alsoin 12 additional countries across North America, South America and Europe. We believe the following keyindustry and business trends and characteristics will influence our business and our financial results goingforward:
High level of marketplace fragmentation. The U.S. salon industry is highly fragmented with approximately295,000 salons and barbershops. Given the fragmented and small-scale nature of the salon industry, webelieve that salon operators will continue to depend on full-service/exclusive distributors and open-linechannels for a majority of their beauty supply purchases.
Growth in chair renting and frequent stocking needs. Salon professionals primarily rely on just-in-timeinventory due to capital constraints and a lack of warehouse and shelf space at salons. In addition, chairrenters (formerly referred to as booth renters) and suite renters, who now comprise a significantpercentage of total U.S. salon professionals, are often responsible for purchasing their own supplies.Historically, the number of chair renters and suite renters has significantly increased as a percentage oftotal salon professionals, and we expect this trend to continue. Given their smaller individual purchasesand relative lack of financial resources, chair renters and suite renters are likely to be dependent onfrequent trips to professional beauty supply stores, like BSG and Sally Beauty Supply. We expect that thesefactors will continue to drive demand for conveniently located professional beauty supply stores.
Increasing use of exclusive-label products. We offer an extensive range of exclusive-label professionalbeauty products, predominantly in our Sally Beauty Supply segment. As our lines of exclusive-labelproducts have matured and become better known in our retail stores, we have seen an increase in sales ofthese products. Generally, our exclusive-label products have higher gross margins for us than the leadingthird-party branded products and, accordingly, we believe that growth in our sales of these products willlikely enhance our overall gross margins. Furthermore, we believe that we provide our customers with aunique value proposition by offering compelling exclusive-label brands that we believe to be of the samequality as leading third-party branded products at an attractive price. Please see ‘‘Risk Factors—We may beunable to anticipate and effectively respond to changes in consumer preferences and buying trends in a timelymanner’’ and ‘‘We depend upon manufacturers who may be unable to provide products of adequate quality orwho may be unwilling to continue to supply products to us.’’
Favorable consumer trends. Our industry is characterized by continuously changing fashion-related trendsthat drive new styles, including hair and nail styles, and continuing demand for beauty products. Inaddition, we expect the aging baby-boomer population in the U.S. to continue to drive sales growth incertain professional beauty product categories, including through an increase in the usage of hair color andhair loss products. Our continued success depends largely on our ability to anticipate, gauge and react in atimely and effective manner to changes in consumer spending patterns and preferences for beautyproducts. We continuously adapt our marketing and merchandising initiatives in an effort to expand ourmarket reach or to respond to changing consumer preferences. If we are unable to anticipate and respondto trends in the marketplace for beauty products and changing consumer demands, our business couldsuffer. Please see ‘‘Risk Factors—We may be unable to anticipate and effectively respond to changes inconsumer preferences and buying trends in a timely manner.’’
International growth strategies. A key element of our growth strategy is to capitalize on internationalgrowth opportunities and to grow our current level of non-U.S. operations. For example, our number ofinternational company-operated stores increased from 679 stores to 946 stores during the last five years. Inaddition, we have completed a number of international acquisitions over the past several years that
2
increased our European and South American footprint. We intend to continue to identify and evaluatenon-U.S. acquisition and/or organic international growth opportunities. Our ability to grow our non-U.S.operations, integrate our new non-U.S. acquisitions and successfully pursue additional non-U.S.acquisition and/or organic international growth opportunities may be affected by business, legal, regulatoryand economic risks. Please see ‘‘Risk Factors—We may not be able to successfully identify acquisitioncandidates or successfully complete desirable acquisitions,’’ ‘‘If we acquire any businesses in the future, theycould prove difficult to integrate, disrupt our business or have an adverse effect on our results of operations’’ and‘‘Our ability to conduct business in international marketplaces may be affected by legal, regulatory andeconomic risks.’’
Continuing consolidation. There is continuing consolidation among professional beauty productdistributors and professional beauty product manufacturers. We plan to continue to examine ways in whichwe can benefit from this trend, including the evaluation of opportunities to shift business from competingdistributors to the BSG network as well as seeking opportunistic, value-added acquisitions whichcomplement our long-term growth strategy. We believe that suppliers are increasingly likely to focus onlarger distributors and retailers with a broader scale and retail footprint and that we are well positioned tocapitalize on this trend as well as participate in the ongoing consolidation at the distributor/retail level.However, changes often occur in our relationships with suppliers that may materially affect the net salesand operating earnings of our business segments. Consolidation among suppliers could exacerbate theeffects of these relationship changes and could increase pricing pressures. For example, if L’Oreal or any ofour other suppliers acquired other distributors or suppliers that conduct significant business with BSG, wecould lose related revenue. There can be no assurance that BSG will not lose revenue over time (includingwithin its franchise-based business) due to potential losses of product lines as well as from the increasedcompetition from distribution networks affiliated with any of our suppliers. Please see ‘‘Risk Factors—Thebeauty products distribution industry is highly competitive and is consolidating’’ and ‘‘We depend uponmanufacturers who may be unable to provide products of adequate quality or who may be unwilling to continueto supply products to us.’’
Relationships with suppliers. Sally Beauty Supply and BSG, and their respective suppliers are dependenton each other for the distribution of beauty products. We do not manufacture any of the products we sell,including our exclusive-label products, and purchase these products from a limited number ofmanufacturers. As is typical in distribution businesses (particularly in our industry), these relationships aresubject to change from time to time (which often results in the expansion or loss of distribution rights,including exclusive rights, in various geographies and the addition or loss of product lines). Since wepurchase products from many of those manufacturers on an at-will basis, under contracts which cangenerally be terminated without cause upon 90 days’ notice or less or which expire without express rights ofrenewal, such manufacturers could discontinue sales to us at any time or upon the expiration of thedistribution period. Some of our contracts with manufacturers may be terminated by such manufacturers ifwe fail to meet specified minimum purchase requirements. In such cases, vendors may change the termsupon which they sell to us, as we do not have contractual assurances for the continued supply of products,pricing terms or access to the vendor’s new products. Infrequently, a supplier will seek to terminate adistribution relationship through legal action. Changes in our relationships with suppliers occur often andcould positively or negatively impact our net sales and operating earnings. We expect to continue to expandour product line offerings and to gain additional distribution rights over time through either furthernegotiation with current and prospective suppliers or by acquisitions of existing distributors. Although wefocus on developing new revenue and cost management initiatives to mitigate the negative effects resultingfrom any unfavorable changes in our supplier relationships, there can be no assurance that our efforts willcontinue to completely offset the loss of these or other distribution rights. Please see ‘‘Risk Factors—Wedepend upon manufacturers who may be unable to provide products of adequate quality or who may beunwilling to continue to supply products to us.’’
3
High level of competition. Sally Beauty Supply competes with other domestic and international beautyproduct wholesale and retail outlets, including local and regional open-line beauty supply stores,professional-only beauty supply stores, mass merchandisers, on-line retailers, drug stores andsupermarkets, as well as salons retailing hair care items. Although Sally Beauty Supply positions itself to becompetitive on price, its primary focus is to be a source of professional advice, solutions and salon-qualityproducts, rather than a discount leader. BSG competes with other domestic and international beautyproduct wholesale and retail suppliers and manufacturers selling professional beauty products directly tosalons and individual salon professionals. Although we believe BSG positions itself to be competitive onprice, its primary focus is to provide a comprehensive selection of branded products to the salonprofessional. We also face competition from authorized and unauthorized retailers and internet sitesoffering professional salon-only products. The increasing availability of unauthorized professional salonproducts in large-format retail stores such as drug stores, grocery stores and others could also have anegative impact on our business. We primarily compete with these competitors on price, selection,convenience and customer service. Our continued success is dependent on our ability to successfullycompete with our competitors and the success of our strategic initiatives to enhance the customerexperience, drive brand awareness and improve customer loyalty. Please see ‘‘Risk Factors—The beautyproducts distribution industry is highly competitive and is consolidating.’’
Economic conditions. We appeal to a wide demographic consumer profile and offer an extensive selectionof professional beauty products sold directly to retail consumers, and salons and salon professionals.Historically, these factors have provided us with reduced exposure to downturns in economic conditions inthe countries in which we operate. However, a downturn in the economy, especially for an extended periodof time, could adversely impact consumer demand of discretionary items such as beauty products and salonservices, particularly affecting our styling tools product category and our full-service sales business. Inaddition, higher freight costs including those resulting from increases in the cost of fuel, especially for anextended period of time, may impact our expenses at levels that we cannot pass through to our customers.These factors could have a material adverse effect on our business, financial condition and results ofoperations. Please see ‘‘Risk Factors—The health of the economy in the geographies we serve may affectconsumer purchases of discretionary items such as beauty products and salon services, which could have amaterial adverse effect on our business, financial condition and results of operations.’’
Controlling expenses. An important aspect of our business is our ability to control costs by right-sizing andmaximizing the efficiency of our business, particularly in an environment of increasing labor and real estatecosts. We currently expect significant labor and rental cost increases to continue for the foreseeable futureas we compete for talent and attractive retail locations with other retailers. Please see ‘‘Risk Factors—Weare not certain that our ongoing cost control plans will continue to be successful.’’
Opening new stores. The success of our growth strategy in the future depends in part on our ability toopen and profitably operate new stores in existing and additional geographic areas and, more specifically,in international geographies as international growth becomes an increasing driver of our future growth andthe U.S. marketplace becomes more saturated. While the capital requirements to open a Sally BeautySupply or BSG store, excluding inventory, vary from geography to geography, such capital requirementshave historically been relatively low in the U.S. and Canada. We may not be able to open all of the newstores we plan to open and any new stores we open may not be profitable, any of which could have amaterial adverse impact on our business, financial condition or results of operations. Please see ‘‘RiskFactors—If we are unable to profitably open and operate new stores, our business, financial condition andresults of operations may be adversely affected.’’
Changes to our information technology systems. As our operations have grown in both size and scope andas cyber-attacks and security intrusions involving retailers have become more frequent, we have improvedand upgraded our information systems and infrastructure while maintaining the reliability and integrity ofthose systems and infrastructure. These improvements have included putting in place a standardized
4
enterprise resource planning (‘‘ERP’’) system for both our domestic and international operations,upgrading our e-commerce platforms and our customer relationship management (CRM) technology andthe adoption of payment terminals with encryption technology in order to enhance the security of ourcredit card payment systems. As we continue to grow and the prevalence and sophistication of cyber-attacks continues to increase, we will continuously need to improve and upgrade our informationtechnology systems and, as a result, we anticipate incurring additional costs in the future in connection withthese continuous upgrades and improvements. Please see ‘‘Risk Factors—We may be adversely affected byany disruption in our information technology systems’’ and ‘‘Unauthorized access to confidential informationand data on our information technology systems and security and data breaches could materially adverselyaffect our business, financial condition and operating results.’’
Business Segments, Geographic Area Information and Seasonality
We operate in two business segments: (i) Sally Beauty Supply, an open-line and exclusive-label retailer ofprofessional beauty supplies offering professional beauty supplies to both retail consumers and salonprofessionals primarily in North America, South America and Europe, and (ii) BSG, including itsfranchise-based business Armstrong McCall, a full-service beauty supply distributor offering professionalbrands directly to salons and salon professionals through our own sales force and professional-only stores,many in exclusive geographical territories, primarily in North America, the United Kingdom and certainother European countries. For each of the fiscal years ended September 30, 2016, 2015 and 2014, SallyBeauty Supply accounted for approximately 60% and BSG accounted for approximately 40% of theCompany’s consolidated net sales.
Financial information about business segments and geographic area information is incorporated herein byreference to the ‘‘Business Segments and Geographic Area Information,’’ Note 18 of the ‘‘Notes toConsolidated Financial Statements’’ in ‘‘Item 8—Financial Statements and Supplementary Data’’contained elsewhere in this Annual Report.
Neither the sales nor the product assortment for Sally Beauty Supply or BSG are generally seasonal innature.
Sally Beauty Supply
As of September 30, 2016, Sally Beauty Supply operated 3,763 company-operated retail stores (generallyunder the Sally Beauty banner), 2,917 of which are located in the U.S., with the remaining 846 company-operated retail stores located in Canada, Mexico, Chile, Colombia, Peru, the United Kingdom, Ireland,Belgium, France, Germany, the Netherlands and Spain. Sally Beauty Supply also supplied 18 franchisedstores located in the United Kingdom, Belgium and certain other European countries. Our Sally Beautystores carry an extensive selection of professional beauty supplies for both retail customers and salonprofessionals, featuring an average of 8,000 stock keeping units, or SKUs, of beauty products acrossproduct categories including hair color, hair care, skin and nail care, beauty sundries and styling tools. OurSally Beauty stores carry leading third-party brands such as Clairol�, CHI�, China Glaze�, OPI� andConair�, as well as an extensive selection of exclusive-label merchandise. We believe that Sally BeautySupply has differentiated itself from its competitors through its customer value proposition based ondelivering an extensive selection of leading third-party branded and exclusive-label professional beautyproducts at attractive prices through knowledgeable sales associates and convenient store locations.
Store Design and Operations
Our Sally Beauty stores are designed to create an appealing shopping environment that embraces the retailconsumer and salon professional and highlights its extensive product offering. In the U.S. and Canada, ourSally Beauty stores average approximately 1,700 square feet in size, are located primarily in strip shoppingcenters and generally follow a consistent format, allowing customers familiarity between Sally Beauty
5
locations. Store formats, including average size and product selection, for our Sally Beauty stores outsidethe U.S. and Canada vary by marketplace.
Our Sally Beauty stores are organized by product type in ways that allow its customers to easily navigatethrough its stores and that encourage cross-selling and impulse buying through the use of strategic productplacement and displays that highlight new products and key promotional items.
During the past two years, we implemented store refresh initiatives designed to enhance the consumerexperience at our Sally Beauty stores, primarily in the U.S, by upgrading the look, feel and ‘‘shopability’’ ofour stores. As part of these initiatives we have added a ‘‘nail studio’’ display and a hair color educationcenter, and have recently reset key merchandising sections across our Sally Beauty stores in the U.S.,including the hair care and the brushes and combs categories, in order to improve the visibility of theseproducts. In addition, we have recently installed new floors, LED lighting and updated signage at a numberof our U.S. Sally Beauty stores. Our store refresh initiatives are intended to provide our customers with abrighter and more engaging store that is easier to navigate than before the refreshes. At September 30,2016, we have refreshed approximately 1,450 of our stores and expect to continue our initiatives to updatethe look and feel of our U.S. stores. At September 30, 2016, we have 2,917 company-operated Sally Beautystores in the U.S., including approximately 300 newer company-operated stores that will not undergorefreshing in the near future. The average capital requirement to complete our store refreshes isapproximately $20,000 to $25,000 per store.
Merchandise
Our Sally Beauty stores carry an extensive selection of third-party branded and exclusive-label professionalbeauty supplies. Sally Beauty Supply manages each category by product and by SKU and uses centrallydeveloped plan-o-guides to maintain a consistent merchandise presentation across its store base (primarilyin the U.S. and Canada). Through its information systems, Sally Beauty Supply actively monitors eachstore’s performance by category. We believe Sally Beauty Supply’s tailored merchandise strategy enables itto meet local demands and helps drive customer traffic into its stores. Additionally, Sally Beauty Supply’sinformation systems (implemented in its North American and in substantially all its European locations)enable it to track and automatically replenish inventory levels, generally on a weekly basis, allowing it tomaintain high levels of in-stock, in-demand merchandise, including both regular-priced and promotionalitems. Please see Liquidity and Capital Resources in ‘‘Item 7—Management’s Discussion and Analysis ofFinancial Condition and Results of Operations’’ contained elsewhere in this Annual Report.
Sally Beauty Supply’s pricing strategy is differentiated by customer segment. Professional salon customersare generally entitled to a price lower than that received by retail customers. However, Sally Beauty Supplydoes offer discounts to retail customers through its customer loyalty program (please see ‘‘Marketing andAdvertising’’ below).
6
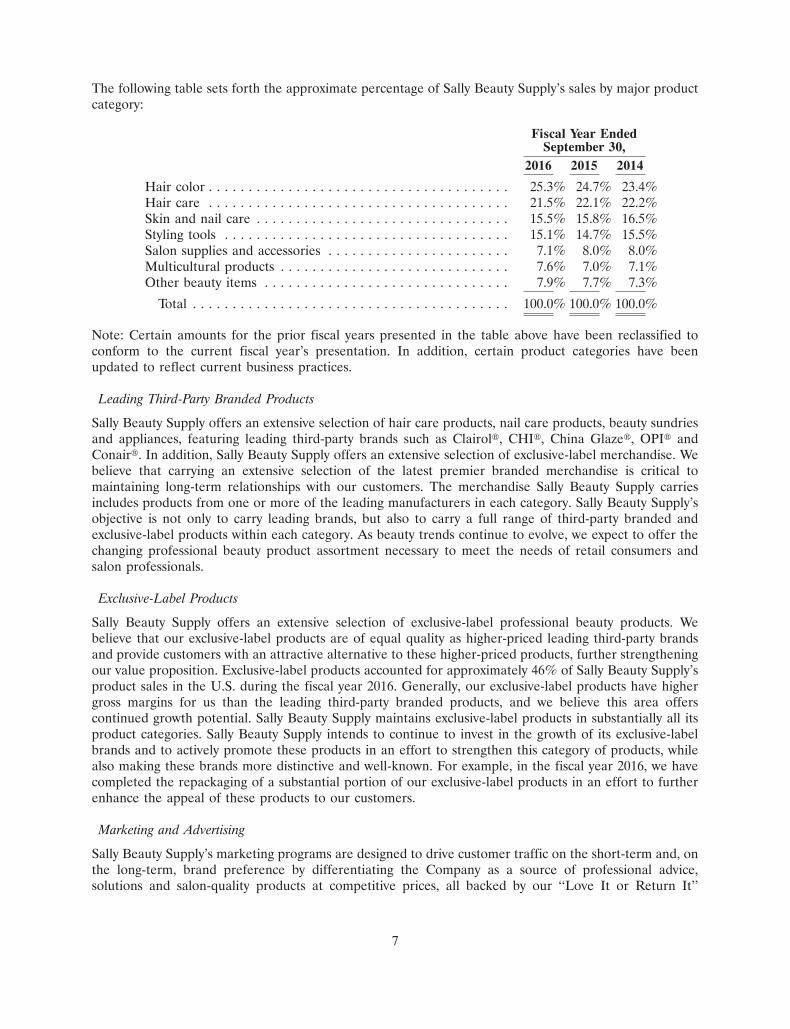
The following table sets forth the approximate percentage of Sally Beauty Supply’s sales by major productcategory:
Fiscal Year EndedSeptember 30,
2016 2015 2014
Hair color . . . . . . . . . . . . . . . . . . . . . . . . . . . . . . . . . . . . . . 25.3% 24.7% 23.4%Hair care . . . . . . . . . . . . . . . . . . . . . . . . . . . . . . . . . . . . . . 21.5% 22.1% 22.2%Skin and nail care . . . . . . . . . . . . . . . . . . . . . . . . . . . . . . . . 15.5% 15.8% 16.5%Styling tools . . . . . . . . . . . . . . . . . . . . . . . . . . . . . . . . . . . . 15.1% 14.7% 15.5%Salon supplies and accessories . . . . . . . . . . . . . . . . . . . . . . . 7.1% 8.0% 8.0%Multicultural products . . . . . . . . . . . . . . . . . . . . . . . . . . . . . 7.6% 7.0% 7.1%Other beauty items . . . . . . . . . . . . . . . . . . . . . . . . . . . . . . . 7.9% 7.7% 7.3%
Total . . . . . . . . . . . . . . . . . . . . . . . . . . . . . . . . . . . . . . . . 100.0% 100.0% 100.0%
Note: Certain amounts for the prior fiscal years presented in the table above have been reclassified toconform to the current fiscal year’s presentation. In addition, certain product categories have beenupdated to reflect current business practices.
Leading Third-Party Branded Products
Sally Beauty Supply offers an extensive selection of hair care products, nail care products, beauty sundriesand appliances, featuring leading third-party brands such as Clairol�, CHI�, China Glaze�, OPI� andConair�. In addition, Sally Beauty Supply offers an extensive selection of exclusive-label merchandise. Webelieve that carrying an extensive selection of the latest premier branded merchandise is critical tomaintaining long-term relationships with our customers. The merchandise Sally Beauty Supply carriesincludes products from one or more of the leading manufacturers in each category. Sally Beauty Supply’sobjective is not only to carry leading brands, but also to carry a full range of third-party branded andexclusive-label products within each category. As beauty trends continue to evolve, we expect to offer thechanging professional beauty product assortment necessary to meet the needs of retail consumers andsalon professionals.
Exclusive-Label Products
Sally Beauty Supply offers an extensive selection of exclusive-label professional beauty products. Webelieve that our exclusive-label products are of equal quality as higher-priced leading third-party brandsand provide customers with an attractive alternative to these higher-priced products, further strengtheningour value proposition. Exclusive-label products accounted for approximately 46% of Sally Beauty Supply’sproduct sales in the U.S. during the fiscal year 2016. Generally, our exclusive-label products have highergross margins for us than the leading third-party branded products, and we believe this area offerscontinued growth potential. Sally Beauty Supply maintains exclusive-label products in substantially all itsproduct categories. Sally Beauty Supply intends to continue to invest in the growth of its exclusive-labelbrands and to actively promote these products in an effort to strengthen this category of products, whilealso making these brands more distinctive and well-known. For example, in the fiscal year 2016, we havecompleted the repackaging of a substantial portion of our exclusive-label products in an effort to furtherenhance the appeal of these products to our customers.
Marketing and Advertising
Sally Beauty Supply’s marketing programs are designed to drive customer traffic on the short-term and, onthe long-term, brand preference by differentiating the Company as a source of professional advice,solutions and salon-quality products at competitive prices, all backed by our ‘‘Love It or Return It’’
7
guarantee. Our marketing programs differentiate between our two distinct customer groups: retailcustomers and salon professionals.
We continuously adapt our marketing initiatives and adjust our media mix and messaging with the goal ofachieving the highest possible return on our marketing and advertising dollars. We target existing andpotential customers through an integrated marketing approach designed to touch the customer throughevery medium he or she engages in, including direct mail, email, social media, text, digital advertising, printadvertising (including full page ads in fashion magazines) and television (primarily in the U.S.), throughour Project Runway partnership.
During the past year, we transformed our sallybeauty.com website from a largely transactional-basedwebsite to a content rich experience that offers customers the ability to research styles, trends andproducts, which we believe has significantly increased the number of visitors to our site and improved ouronline sales. We currently offer an average of 9,500 SKUs of our Sally Beauty Supply products for salethrough our website (www.sallybeauty.com) and believe that our website enhances our other effortsintended to promote consumer awareness of Sally Beauty Supply’s products, including through the use ofeducational videos and the presentation of relevant beauty tips and extensive product information. Wefrequently update the design of our website in an effort to enhance its appeal to our existing andprospective customers. In addition to generating e-commerce sales, we believe our website is an importantvehicle to reach consumers researching beauty products online who could potentially visit our stores as aresult of their experience with our website. Please see ‘‘Risk Factors—Our e-commerce businesses may beunsuccessful or, if successful, may divert sales from our stores.’’
Sally Beauty Supply’s customer loyalty and CRM programs, primarily in the U.S. and Canada, allow SallyBeauty Supply the opportunity to collect valuable point-of-sale customer data in order to increase itsunderstanding of customers’ needs and enhance our ability to market to them in more personalized andrelevant ways. The Sally ‘‘Beauty Club’’ is a loyalty program for customers who are not salon professionals.Beauty Club members, generally after paying a nominal annual fee, are eligible to receive a discountedprice on almost every non-sale item. Members can also earn rewards and are eligible to receive direct mail,text messages and e-mail communications that contain special offers, beauty tips and new productinformation. We have recently improved the sophistication of our CRM capabilities to better respond toour customers’ behavior in an effort to drive the customer experience and increase sales.
In addition, Sally Beauty Supply’s ‘‘ProCard’’ is a loyalty program for licensed salon professionals. ProCardmembers are eligible to receive discounts on all beauty products sold at Sally Beauty Supply’s stores andwebsite, as well as special offerings available only to salon professionals. Outside the U.S. and Canada, ourcustomer loyalty and marketing programs vary by marketplace.
Store Locations
Sally Beauty Supply selects geographic areas and store sites on the basis of demographic information, thequality and nature of neighboring tenants, store visibility and location accessibility. Sally Beauty Supplyseeks to locate stores primarily in strip malls, which are occupied by other high traffic retailers includinggrocery stores, mass merchants and home centers.
Sally Beauty Supply balances its store expansion between new and existing marketplaces, with future storegrowth expected primarily in non-U.S. geographies. In its existing marketplaces, Sally Beauty Supply addsstores as necessary to provide additional coverage. In new marketplaces, Sally Beauty Supply generallyseeks to expand in geographically contiguous areas to leverage its experience. We believe that Sally BeautySupply’s knowledge of local marketplaces is an important part of its success.
8
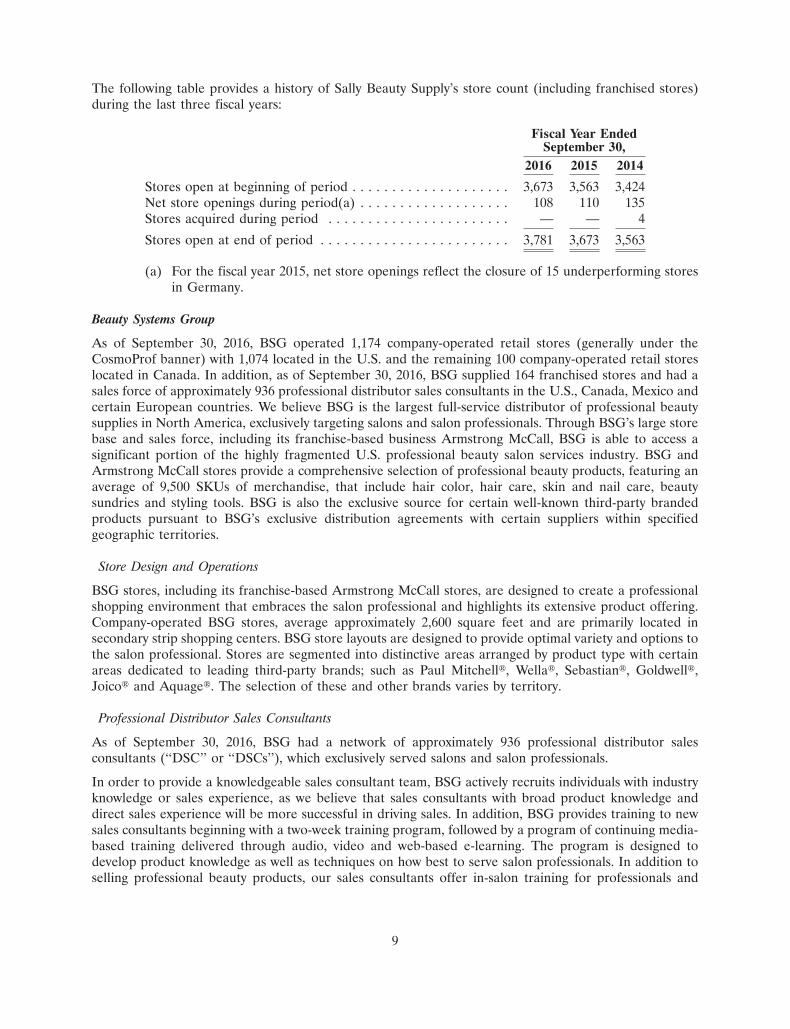
The following table provides a history of Sally Beauty Supply’s store count (including franchised stores)during the last three fiscal years:
Fiscal Year EndedSeptember 30,
2016 2015 2014
Stores open at beginning of period . . . . . . . . . . . . . . . . . . . . 3,673 3,563 3,424Net store openings during period(a) . . . . . . . . . . . . . . . . . . . 108 110 135Stores acquired during period . . . . . . . . . . . . . . . . . . . . . . . — — 4
Stores open at end of period . . . . . . . . . . . . . . . . . . . . . . . . 3,781 3,673 3,563
(a) For the fiscal year 2015, net store openings reflect the closure of 15 underperforming storesin Germany.
Beauty Systems Group
As of September 30, 2016, BSG operated 1,174 company-operated retail stores (generally under theCosmoProf banner) with 1,074 located in the U.S. and the remaining 100 company-operated retail storeslocated in Canada. In addition, as of September 30, 2016, BSG supplied 164 franchised stores and had asales force of approximately 936 professional distributor sales consultants in the U.S., Canada, Mexico andcertain European countries. We believe BSG is the largest full-service distributor of professional beautysupplies in North America, exclusively targeting salons and salon professionals. Through BSG’s large storebase and sales force, including its franchise-based business Armstrong McCall, BSG is able to access asignificant portion of the highly fragmented U.S. professional beauty salon services industry. BSG andArmstrong McCall stores provide a comprehensive selection of professional beauty products, featuring anaverage of 9,500 SKUs of merchandise, that include hair color, hair care, skin and nail care, beautysundries and styling tools. BSG is also the exclusive source for certain well-known third-party brandedproducts pursuant to BSG’s exclusive distribution agreements with certain suppliers within specifiedgeographic territories.
Store Design and Operations
BSG stores, including its franchise-based Armstrong McCall stores, are designed to create a professionalshopping environment that embraces the salon professional and highlights its extensive product offering.Company-operated BSG stores, average approximately 2,600 square feet and are primarily located insecondary strip shopping centers. BSG store layouts are designed to provide optimal variety and options tothe salon professional. Stores are segmented into distinctive areas arranged by product type with certainareas dedicated to leading third-party brands; such as Paul Mitchell�, Wella�, Sebastian�, Goldwell�,Joico� and Aquage�. The selection of these and other brands varies by territory.
Professional Distributor Sales Consultants
As of September 30, 2016, BSG had a network of approximately 936 professional distributor salesconsultants (‘‘DSC’’ or ‘‘DSCs’’), which exclusively served salons and salon professionals.
In order to provide a knowledgeable sales consultant team, BSG actively recruits individuals with industryknowledge or sales experience, as we believe that sales consultants with broad product knowledge anddirect sales experience will be more successful in driving sales. In addition, BSG provides training to newsales consultants beginning with a two-week training program, followed by a program of continuing media-based training delivered through audio, video and web-based e-learning. The program is designed todevelop product knowledge as well as techniques on how best to serve salon professionals. In addition toselling professional beauty products, our sales consultants offer in-salon training for professionals and
9
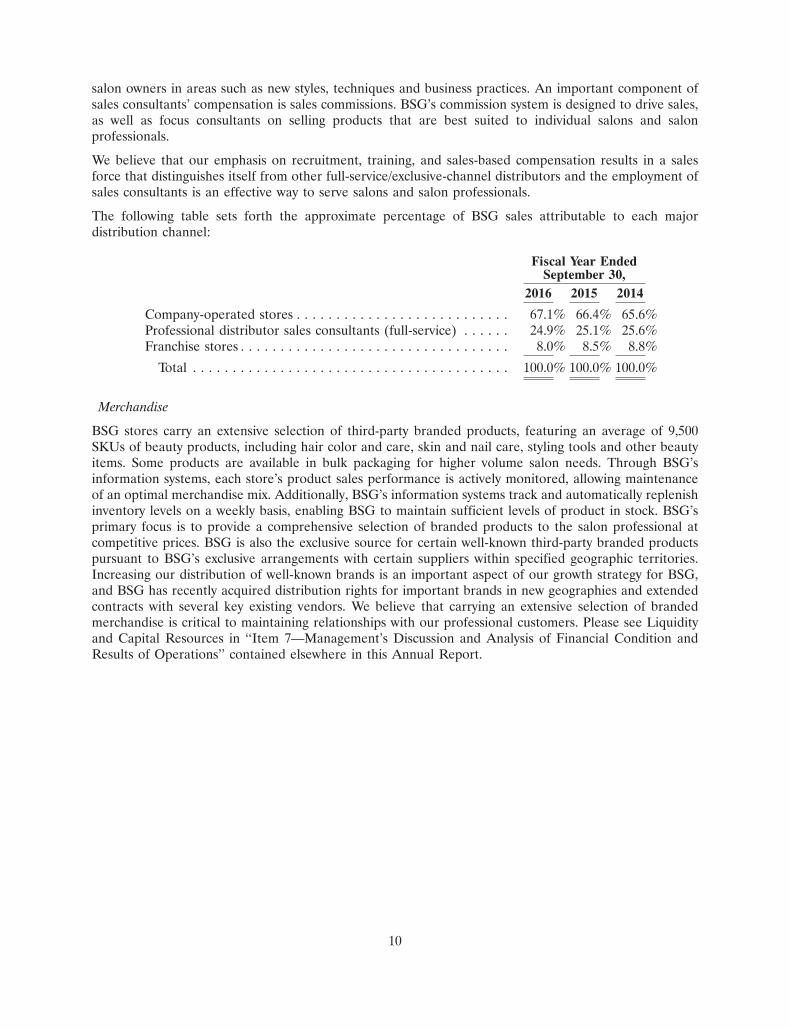
salon owners in areas such as new styles, techniques and business practices. An important component ofsales consultants’ compensation is sales commissions. BSG’s commission system is designed to drive sales,as well as focus consultants on selling products that are best suited to individual salons and salonprofessionals.
We believe that our emphasis on recruitment, training, and sales-based compensation results in a salesforce that distinguishes itself from other full-service/exclusive-channel distributors and the employment ofsales consultants is an effective way to serve salons and salon professionals.
The following table sets forth the approximate percentage of BSG sales attributable to each majordistribution channel:
Fiscal Year EndedSeptember 30,
2016 2015 2014
Company-operated stores . . . . . . . . . . . . . . . . . . . . . . . . . . . 67.1% 66.4% 65.6%Professional distributor sales consultants (full-service) . . . . . . 24.9% 25.1% 25.6%Franchise stores . . . . . . . . . . . . . . . . . . . . . . . . . . . . . . . . . . 8.0% 8.5% 8.8%
Total . . . . . . . . . . . . . . . . . . . . . . . . . . . . . . . . . . . . . . . . 100.0% 100.0% 100.0%
Merchandise
BSG stores carry an extensive selection of third-party branded products, featuring an average of 9,500SKUs of beauty products, including hair color and care, skin and nail care, styling tools and other beautyitems. Some products are available in bulk packaging for higher volume salon needs. Through BSG’sinformation systems, each store’s product sales performance is actively monitored, allowing maintenanceof an optimal merchandise mix. Additionally, BSG’s information systems track and automatically replenishinventory levels on a weekly basis, enabling BSG to maintain sufficient levels of product in stock. BSG’sprimary focus is to provide a comprehensive selection of branded products to the salon professional atcompetitive prices. BSG is also the exclusive source for certain well-known third-party branded productspursuant to BSG’s exclusive arrangements with certain suppliers within specified geographic territories.Increasing our distribution of well-known brands is an important aspect of our growth strategy for BSG,and BSG has recently acquired distribution rights for important brands in new geographies and extendedcontracts with several key existing vendors. We believe that carrying an extensive selection of brandedmerchandise is critical to maintaining relationships with our professional customers. Please see Liquidityand Capital Resources in ‘‘Item 7—Management’s Discussion and Analysis of Financial Condition andResults of Operations’’ contained elsewhere in this Annual Report.
10
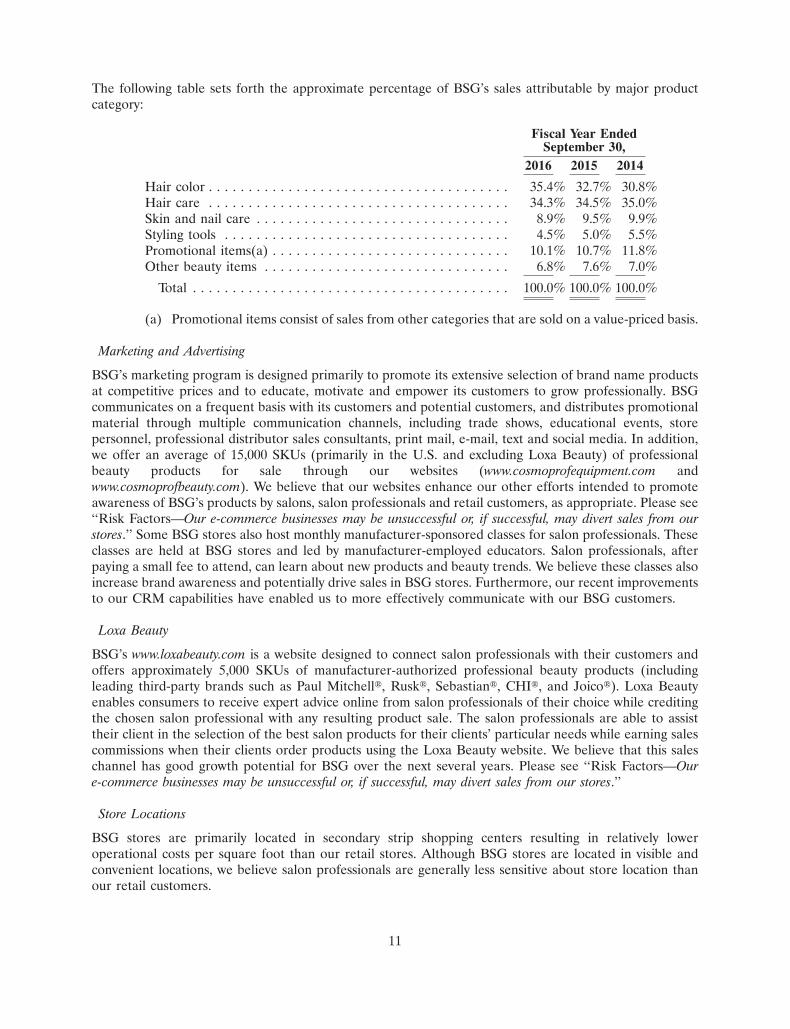
The following table sets forth the approximate percentage of BSG’s sales attributable by major productcategory:
Fiscal Year EndedSeptember 30,
2016 2015 2014
Hair color . . . . . . . . . . . . . . . . . . . . . . . . . . . . . . . . . . . . . . 35.4% 32.7% 30.8%Hair care . . . . . . . . . . . . . . . . . . . . . . . . . . . . . . . . . . . . . . 34.3% 34.5% 35.0%Skin and nail care . . . . . . . . . . . . . . . . . . . . . . . . . . . . . . . . 8.9% 9.5% 9.9%Styling tools . . . . . . . . . . . . . . . . . . . . . . . . . . . . . . . . . . . . 4.5% 5.0% 5.5%Promotional items(a) . . . . . . . . . . . . . . . . . . . . . . . . . . . . . . 10.1% 10.7% 11.8%Other beauty items . . . . . . . . . . . . . . . . . . . . . . . . . . . . . . . 6.8% 7.6% 7.0%
Total . . . . . . . . . . . . . . . . . . . . . . . . . . . . . . . . . . . . . . . . 100.0% 100.0% 100.0%
(a) Promotional items consist of sales from other categories that are sold on a value-priced basis.
Marketing and Advertising
BSG’s marketing program is designed primarily to promote its extensive selection of brand name productsat competitive prices and to educate, motivate and empower its customers to grow professionally. BSGcommunicates on a frequent basis with its customers and potential customers, and distributes promotionalmaterial through multiple communication channels, including trade shows, educational events, storepersonnel, professional distributor sales consultants, print mail, e-mail, text and social media. In addition,we offer an average of 15,000 SKUs (primarily in the U.S. and excluding Loxa Beauty) of professionalbeauty products for sale through our websites (www.cosmoprofequipment.com andwww.cosmoprofbeauty.com). We believe that our websites enhance our other efforts intended to promoteawareness of BSG’s products by salons, salon professionals and retail customers, as appropriate. Please see‘‘Risk Factors—Our e-commerce businesses may be unsuccessful or, if successful, may divert sales from ourstores.’’ Some BSG stores also host monthly manufacturer-sponsored classes for salon professionals. Theseclasses are held at BSG stores and led by manufacturer-employed educators. Salon professionals, afterpaying a small fee to attend, can learn about new products and beauty trends. We believe these classes alsoincrease brand awareness and potentially drive sales in BSG stores. Furthermore, our recent improvementsto our CRM capabilities have enabled us to more effectively communicate with our BSG customers.
Loxa Beauty
BSG’s www.loxabeauty.com is a website designed to connect salon professionals with their customers andoffers approximately 5,000 SKUs of manufacturer-authorized professional beauty products (includingleading third-party brands such as Paul Mitchell�, Rusk�, Sebastian�, CHI�, and Joico�). Loxa Beautyenables consumers to receive expert advice online from salon professionals of their choice while creditingthe chosen salon professional with any resulting product sale. The salon professionals are able to assisttheir client in the selection of the best salon products for their clients’ particular needs while earning salescommissions when their clients order products using the Loxa Beauty website. We believe that this saleschannel has good growth potential for BSG over the next several years. Please see ‘‘Risk Factors—Oure-commerce businesses may be unsuccessful or, if successful, may divert sales from our stores.’’
Store Locations
BSG stores are primarily located in secondary strip shopping centers resulting in relatively loweroperational costs per square foot than our retail stores. Although BSG stores are located in visible andconvenient locations, we believe salon professionals are generally less sensitive about store location thanour retail customers.
11
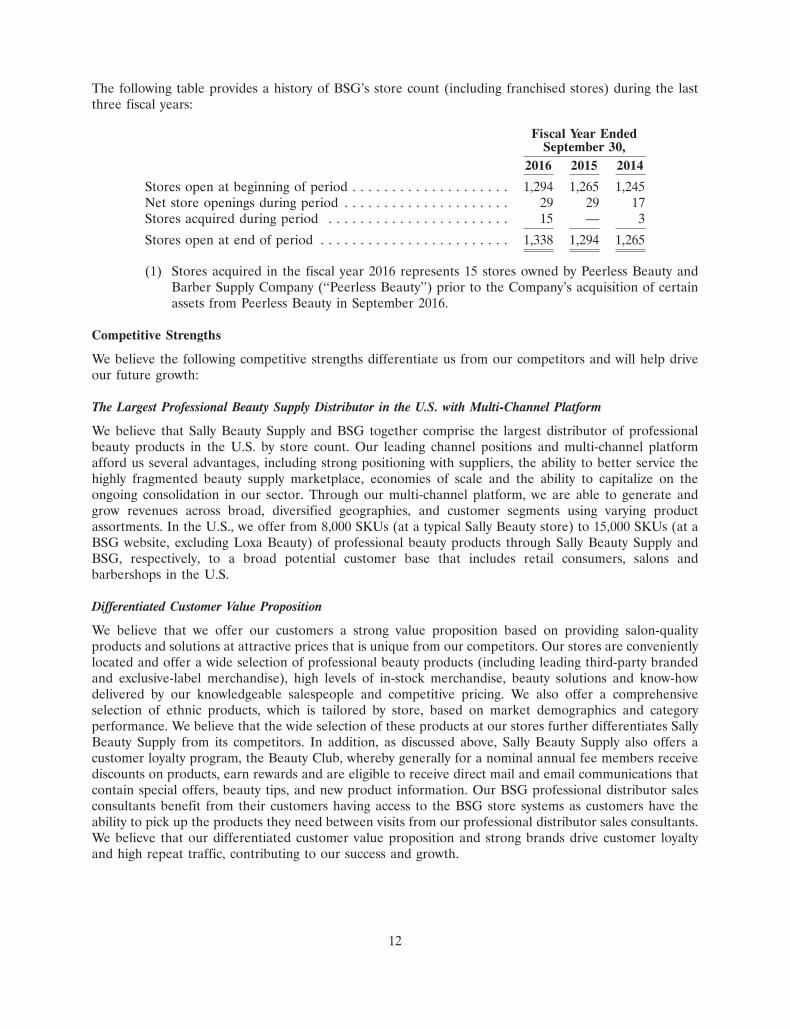
The following table provides a history of BSG’s store count (including franchised stores) during the lastthree fiscal years:
Fiscal Year EndedSeptember 30,
2016 2015 2014
Stores open at beginning of period . . . . . . . . . . . . . . . . . . . . 1,294 1,265 1,245Net store openings during period . . . . . . . . . . . . . . . . . . . . . 29 29 17Stores acquired during period . . . . . . . . . . . . . . . . . . . . . . . 15 — 3
Stores open at end of period . . . . . . . . . . . . . . . . . . . . . . . . 1,338 1,294 1,265
(1) Stores acquired in the fiscal year 2016 represents 15 stores owned by Peerless Beauty andBarber Supply Company (‘‘Peerless Beauty’’) prior to the Company’s acquisition of certainassets from Peerless Beauty in September 2016.
Competitive Strengths
We believe the following competitive strengths differentiate us from our competitors and will help driveour future growth:
The Largest Professional Beauty Supply Distributor in the U.S. with Multi-Channel Platform
We believe that Sally Beauty Supply and BSG together comprise the largest distributor of professionalbeauty products in the U.S. by store count. Our leading channel positions and multi-channel platformafford us several advantages, including strong positioning with suppliers, the ability to better service thehighly fragmented beauty supply marketplace, economies of scale and the ability to capitalize on theongoing consolidation in our sector. Through our multi-channel platform, we are able to generate andgrow revenues across broad, diversified geographies, and customer segments using varying productassortments. In the U.S., we offer from 8,000 SKUs (at a typical Sally Beauty store) to 15,000 SKUs (at aBSG website, excluding Loxa Beauty) of professional beauty products through Sally Beauty Supply andBSG, respectively, to a broad potential customer base that includes retail consumers, salons andbarbershops in the U.S.
Differentiated Customer Value Proposition
We believe that we offer our customers a strong value proposition based on providing salon-qualityproducts and solutions at attractive prices that is unique from our competitors. Our stores are convenientlylocated and offer a wide selection of professional beauty products (including leading third-party brandedand exclusive-label merchandise), high levels of in-stock merchandise, beauty solutions and know-howdelivered by our knowledgeable salespeople and competitive pricing. We also offer a comprehensiveselection of ethnic products, which is tailored by store, based on market demographics and categoryperformance. We believe that the wide selection of these products at our stores further differentiates SallyBeauty Supply from its competitors. In addition, as discussed above, Sally Beauty Supply also offers acustomer loyalty program, the Beauty Club, whereby generally for a nominal annual fee members receivediscounts on products, earn rewards and are eligible to receive direct mail and email communications thatcontain special offers, beauty tips, and new product information. Our BSG professional distributor salesconsultants benefit from their customers having access to the BSG store systems as customers have theability to pick up the products they need between visits from our professional distributor sales consultants.We believe that our differentiated customer value proposition and strong brands drive customer loyaltyand high repeat traffic, contributing to our success and growth.
12
Attractive Store Economics
We believe that our stores generate attractive returns on invested capital. In the U.S. and Canada, thecapital requirements to open a Sally Beauty Supply or BSG store, excluding inventory, averageapproximately $75,000 to $80,000. Our Sally Beauty stores average approximately 1,700 square feet andBSG stores average approximately 2,600 square feet in size in the U.S. and Canada. Strong average salesper square foot combined with minimal staffing requirements, lower rent and other occupancy costs andexpenses and limited initial capital outlay typically result in positive contribution margins within a fewmonths to a year of opening, and cash payback on investment within approximately two to three years. Dueto such attractive investment returns and relatively high operating profit contributions per store, during thepast five fiscal years Sally Beauty Supply and BSG have opened an aggregate of 595 and 157 net newstores, respectively, excluding the effect of acquisitions. In addition, each Sally Beauty Supply and BSGstore (in the U.S. and Canada) contains an average of $70,000 and $135,000, respectively, of merchandiseinventory. Outside the U.S. and Canada, our store format, sizes, inventory levels and capital requirementsvary by marketplace, but we believe these stores also generate compelling unit economics. In addition, overthe past two years, we have refreshed approximately 1,450 Sally Beauty stores in the U.S. at an average costof approximately $20,000 to $25,000 per store, and believe these stores are well-positioned to benefit fromthese recent improvements.
Our Strategy
We believe there are significant opportunities to increase our sales and profitability through the furtherimplementation of our operating strategy and by growing our store base in existing and additionalgeographic areas, both organically and through strategic acquisitions. Key elements of our growth strategyare to:
Increase Overall Traffic and Sales Productivity at Our Existing Stores
Over the past year, we have implemented a number of initiatives designed to significantly improve thecustomer experience at Sally Beauty Supply and BSG in an effort to attract new customers to our storesand improve sales productivity at our existing stores. For example, as part of these initiatives we upgradedkey merchandising sections across our U.S. Sally Beauty stores, including by installing an interactive ‘‘nailstudios’’ display and a color education center. We have recently reset key merchandising sections acrossour Sally Beauty stores in the U.S., including the brushes, cutlery and accessories category, in order toimprove the visibility of these products. In addition, we have installed new hardwood floors, LED lightingand updated signage at approximately 1,450 of our U.S. Sally Beauty stores. In addition to these physicalstore improvements, we also focused our marketing efforts on a consistent marketing campaign designedto touch our customer through every medium they engage in and by, among other things, leveraging ourCRM programs to more effectively communicate with our customers, including by tailoring our marketingefforts to reach a wider selection of prospective customers and otherwise promoting recognition of the‘‘Sally’’ brand among consumers. We believe that these initiatives will help drive increased customer trafficto our stores and increase their sales productivity.
In addition to these strategic initiatives, we also plan to grow same store sales by improving ourmerchandise mix, introducing new products (including third-party brands and exclusive-label products),growing our sales of exclusive-label products and enhancing our customer loyalty programs. To grow salesand increase customer loyalty in Sally Beauty Supply, we intend to continue to develop and introduceexclusive-label products through product innovation, to continue to introduce new third-party productsand to promote our wide selection of product offerings at a value. We believe the enhancements to ourcustomer loyalty programs at Sally Beauty Supply and BSG, will allow us to further collect valuablepoint-of-sale customer data and to increase our understanding of customers’ needs, in an effort to growsales to existing customers.
13
Expand Our Store Base
During the past five fiscal years, Sally Beauty Supply and BSG have opened an aggregate of 595 and 157net new stores, respectively, excluding the effect of acquisitions. Because of the limited initial capitaloutlay, rapid payback and attractive return on capital, we intend to continue to expand our store base. Webelieve there are growth opportunities for us to open or acquire additional stores in North America,Europe, and Central and South America. We believe such opportunities are especially strong in Europe,and Central and South America. We expect new store openings in existing and new areas to be animportant aspect of our future growth opportunities, and intend to continue our annual organic storegrowth at approximately 2.0% to 3.0% of our total stores for at least the next few years including, in ourSally Beauty Supply segment, growth in store count of approximately 2.0% in the U.S. and higher growthoutside the U.S. Despite the relatively low opening costs, we may not be able to open all of the new storeswe plan to open and any new stores we open may not be profitable, either of which could have a materialadverse impact on our financial condition or results of operations. There are several factors that couldaffect our ability to open and profitably operate new stores, including proximity to existing stores that mayreduce the new store’s sales or the sales of existing stores.
Grow Internationally
International sales represent approximately 24% of Sally Beauty Supply’s net sales and we believe there isa significant opportunity for future growth internationally. As of September 30, 2016, we had 946 SallyBeauty Supply and BSG company-operated stores and supplied 41 franchise stores across 12 countriesoutside the United States: Canada, Mexico, Chile, Colombia, Peru, the United Kingdom, Ireland, Belgium,France, Germany, the Netherlands and Spain. We believe our platform provides us with the foundation tocontinue to expand internationally. In particular, we are currently focused on profitably growing ourbusiness in Europe and in Central and South America. We are also focused on improving our business ineach of our non-U.S. geographies, and have made a series of recent leadership changes in these countriesto improve our operating discipline and growth strategy.
Increase Operating Efficiency and Profitability
We believe there are opportunities to increase the profitability of our operations by growing our exclusive-label brands, improving sourcing, shifting customer mix, continuing our cost-cutting initiatives and byfurther expanding our e-commerce channel. We continue to develop and promote our higher marginexclusive-label products and increase exclusive-label product sales, which we believe will enhance ouroverall gross margins and operating results. In addition, we have undertaken a full review of ourmerchandise procurement strategy and continue to focus on our procurement practices. This initiative hashelped identify lower-cost alternative sources of supply in certain product categories from countries withlower manufacturing costs. We continue to focus on changing our customer mix by increasing the numberof retail customers, as a percentage of total customers, within our stores at Sally Beauty Supply. Sales toretail customers generally result in higher gross margin for us.
We are also focused on growing our online sales. We currently offer approximately 9,500 SKUs of our SallyBeauty Supply products for sale through our website (www.sallybeauty.com) and offer approximately 15,000SKUs of our BSG products for sale principally through BSG’s websites for beauty professionals(www.cosmoprofbeauty.com and www.cosmoprofequipment.com), in addition to approximately 5,000 SKUsof BSG product through our website for retail customers (www.loxabeauty.com). We have upgraded oure-commerce platforms over the past year to transform these platforms from largely transactional-basedsites to more content-rich sites to drive traffic to these sites and improve sales from these sites. We believethat electronic commerce, or e-commerce, will help drive improved operating earnings over the long term,as a percentage of net sales, for both business segments since e-commerce generally lacks the incrementaloperating expenses (including rent and other occupancy expenses, payroll, and certain shipping and
14
handling expenses) associated with traditional brick-and-mortar stores. Please see ‘‘Risk Factors—Oure-commerce businesses may be unsuccessful or, if successful, may divert sales from our stores.’’
Pursue Strategic Acquisitions and New Territories for Organic Growth
We have completed more than 40 acquisitions during our last 10 full fiscal years. We believe that ourexperience in identifying attractive acquisition targets, our proven acquisition integration process and ourhighly scalable infrastructure have created a strong platform for potential future acquisitions. Recentacquisitions have included:
• In the fiscal year 2016, we acquired certain assets and business operations of Peerless Beauty andBarber Supply Company, distributors of professional beauty products with 15 stores located in Utahand Idaho;
• In the fiscal year 2015, we acquired certain assets and the business of a former exclusive distributorof John Paul Mitchell Systems beauty products with sales primarily in Iowa;
• In the fiscal year 2014, we acquired certain assets and business operations of Arctic Beauty, Inc., aprofessional-only distributor of beauty products operating in the state of Alaska;
• In the fiscal year 2013, we acquired certain assets and business operations of Essential Salon, aprofessional-only distributor of beauty products operating in the northeastern region of the UnitedStates; and
• In the fiscal year 2012, we acquired the Floral Group, a distributor of professional beauty productsthen with 19 stores located in the Netherlands and certain assets and the business of a formerexclusive distributor of John Paul Mitchell Systems beauty products with sales primarily in Ohio andWest Virginia.
We intend to continue to identify and evaluate acquisition targets and organic growth opportunities bothdomestically and internationally, with a focus on expanding our exclusive BSG territories and allowingSally Beauty Supply to enter new geographic areas, principally outside the U.S. Please see ‘‘Risk Factors—We may not be able to successfully identify acquisition candidates or successfully complete desirableacquisitions.’’
Competition
Although there are a limited number of direct competitors to our business, the beauty industry is highlycompetitive. In each geographic area in which we operate, we experience competition from domestic andinternational businesses often with more resources, including mass merchandisers, on-line retailers, drugstores, supermarkets and other chains offering similar or substitute beauty products at comparable prices.Our business also faces competition from department stores, as well as from authorized and unauthorizedretailers and internet sites offering professional beauty products. In addition, our business competes withlocal and regional open-line beauty supply stores and full-service distributors selling directly to salons andsalon professionals through both professional distributor sales consultants and outlets open only to salonsand salon professionals. Our business also faces increasing competition from certain manufacturers thatuse their own sales forces to distribute their professional beauty products directly or that align themselveswith our competitors. Some of these manufacturers are vertically integrating through the acquisition ofdistributors and stores. In addition, these manufacturers may acquire additional brands that we currentlydistribute and attempt to shift these products to their own distribution channels. Please see ‘‘RiskFactors—The beauty products distribution industry is highly competitive and is consolidating’’ for additionalinformation about our competition.
15
Customer Service
We strive to complement our extensive merchandise selection and innovative store design with superiorcustomer service. We actively recruit individuals with cosmetology experience that are not onlyknowledgeable about the products we sell, but are able to deliver practical beauty advice and solutions toour customers, which we believe strengthens customer loyalty. Additionally, Sally Beauty Supply recruitsindividuals with retail experience because we believe their general retail knowledge can be leveraged in thebeauty supply industry. We believe that employees’ knowledge of the products and ability to demonstrateand explain the advantages of the products increases sales and that their prompt, knowledgeable servicefosters the confidence and loyalty of customers and differentiates our business from other professionalbeauty supply distributors.
Most of our stores are staffed with a store manager, and two or three full-time or part-time salesassociates. BSG stores are generally also staffed with an assistant manager. The operations of each storeare supervised by a district manager, who reports to a territory manager. A significant number of our storemanagers and assistant store managers are licensed in the cosmetology field. Additionally, in certaingeographic areas in the U.S., a significant number of our store personnel, including store managers andassistant store managers, speak Spanish as a second language. We believe that these skills enhance ourstore personnel’s ability to serve our customers.
Relationships with Suppliers
We purchase our merchandise directly from manufacturers through supply contracts and by purchaseorders. For the fiscal year 2016, our five largest suppliers, Coty, Inc. (including certain business unitsformerly owned by The Procter & Gamble Company, or P&G), the Professional Products Division ofL’Oreal USA S/D, Inc., or L’Oreal, John Paul Mitchell Systems, Conair Corporation and ShiseidoCosmetics (America) Limited, accounted for approximately 38% of our consolidated merchandisepurchases. Products are purchased from these and many other manufacturers on an at-will basis or undercontracts which can be terminated without cause upon 90 days’ notice or less or expire without expressrights of renewal. Such manufacturers could discontinue sales to us at any time or upon short notice. If anyof these suppliers discontinued selling or were unable to continue selling to us, there could be a materialadverse effect on our business and results of operations.
As is typical in the distribution businesses, relationships with suppliers are subject to change from time totime (including the expansion or loss of distribution rights in various geographies and the addition or lossof product lines). For example, in 2016, Coty Inc., a leading supplier of fragrances, color cosmetics, andskin and body products, acquired the fragrances, color cosmetics, and hair color divisions of P&G andCoty, Inc. was our largest supplier. In each of the fiscal years 2014 and 2015, P&G was our largest supplier.There can be no assurances as to the impact, if any, that this acquisition will have on our ability to continueto source products from these divisions at current prices and volumes. Changes in our relationships withsuppliers occur often, and could positively or negatively impact our net sales and operating earnings.Please see ‘‘Risk Factors—We depend upon manufacturers who may be unable to provide products ofadequate quality or who may be unwilling to continue to supply products to us.’’ However, we believe that wecan be successful in mitigating negative effects resulting from unfavorable changes in the relationshipsbetween us and our suppliers through, among other things, the development of new or expanded supplierrelationships.
Distribution
As of September 30, 2016, we operated mainly through 17 distribution centers, eight of whichpredominantly serviced Sally Beauty Supply and nine of which predominantly serviced BSG.
Our purchasing and distribution system is designed to minimize the delivered cost of merchandise andmaximize the level of merchandise in-stock in stores. This distribution system also allows for monitoring of
16
delivery times and maintenance of appropriate inventory levels. Product deliveries are typically made toour stores on a weekly basis, primarily in the U.S. and Canada. Each distribution center has a qualitycontrol department that monitors products received from suppliers. We utilize proprietary softwaresystems to provide computerized warehouse locator and inventory support.
Information Technology Systems
Our information technology systems are essential to our efforts to process customer sales transactions,manage inventory levels, conduct business with our suppliers and other business partners, and record,summarize and analyze the results of our operations. These systems contain, among other things, materialoperational, financial and administrative information related to the marketing, distribution and storeoperations functions of our business. The information contained in our information technology systems,among other things, supports processing of customer payments and automatic replenishment of in-storeinventory, and provides support for product purchase decisions. A significant portion of these systems havebeen developed internally, and as a result our options are limited in seeking third-party assistance with theoperation and upgrade of these systems. The expansion of our systems and infrastructure will require us tocommit substantial financial, operational and technical resources in advance of any increase in the volumeof our business, with no assurance that the volume of business will increase. For example, we are in theprocess of implementing a standardized enterprise resource planning (‘‘ERP’’) system for both ourdomestic and international operations over the next few years, which will integrate legacy systems andprovide enhanced functionality. In addition, we recently implemented a point-of-sale system upgrade inour Sally Beauty Supply operations in the U.S. and have begun to implement a point-of-sale systemupgrade in our BSG operations in the U.S. which we believe will provide significant benefits, includingenhanced tracking of customer sales and store inventory activity. Further, following the previouslydisclosed data security incidents, we have taken and are continuing to take actions to further strengthenthe security of our information technology systems, including a recent initiative to adopt payment terminalswith end-to-end encryption technology in order to enhance the security of our credit card payment systems.We have also taken steps to upgrade our e-commerce platforms and improve the sophistication of ourCRM technology. These and any other required upgrades to our information systems and informationtechnology (or new technology), now or in the future, may require significant costs and divert ourmanagement’s attention and other resources from our core business to assist in completion of theseprojects. There can be no assurance that the time and resources our management will need to devote tothese upgrades, service outages or delays due to the installation of any new or upgraded technology (andcustomer issues therewith), or the impact on the reliability or security of our data from any new orupgraded technology will not have a material adverse effect on our financial reporting, business, financialcondition or results of operations. Please see ‘‘Risk Factors—We may be adversely affected by any disruptionin our information technology systems.’’
In addition, as part of our operations, we receive and maintain information about our customers,employees and other third parties. We have physical, technical and procedural safeguards in place that aredesigned to protect information and protect against security and data breaches as well as fraudulenttransactions and other activities. Despite these safeguards and our other security processes andprotections, we have been a victim of cyber-attacks and data security breaches, including breaches thatresulted in the unauthorized installation of malware on our information technology systems that may haveplaced at risk certain payment card data for some transactions. Furthermore, there can be no assurancesthat we will not suffer another cyber-attack or data security breach in the future and, if we do, whether ourphysical, technical and procedural safeguards will adequately protect us against such attacks and breaches.Please see ‘‘Risk Factors—Unauthorized access to confidential information and data on our informationtechnology systems and security and data breaches could materially adversely affect our business, financialcondition and operating results.’’
17
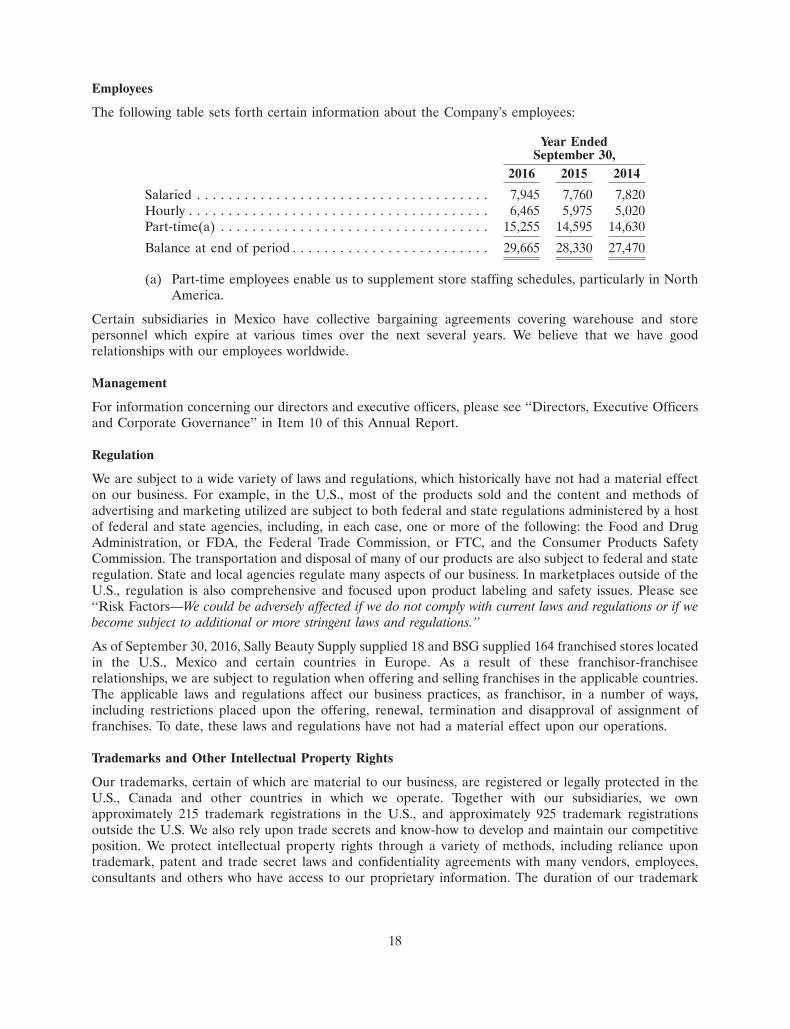
Employees
The following table sets forth certain information about the Company’s employees:
Year EndedSeptember 30,
2016 2015 2014
Salaried . . . . . . . . . . . . . . . . . . . . . . . . . . . . . . . . . . . . . 7,945 7,760 7,820Hourly . . . . . . . . . . . . . . . . . . . . . . . . . . . . . . . . . . . . . . 6,465 5,975 5,020Part-time(a) . . . . . . . . . . . . . . . . . . . . . . . . . . . . . . . . . . 15,255 14,595 14,630
Balance at end of period . . . . . . . . . . . . . . . . . . . . . . . . . 29,665 28,330 27,470
(a) Part-time employees enable us to supplement store staffing schedules, particularly in NorthAmerica.
Certain subsidiaries in Mexico have collective bargaining agreements covering warehouse and storepersonnel which expire at various times over the next several years. We believe that we have goodrelationships with our employees worldwide.
Management
For information concerning our directors and executive officers, please see ‘‘Directors, Executive Officersand Corporate Governance’’ in Item 10 of this Annual Report.
Regulation
We are subject to a wide variety of laws and regulations, which historically have not had a material effecton our business. For example, in the U.S., most of the products sold and the content and methods ofadvertising and marketing utilized are subject to both federal and state regulations administered by a hostof federal and state agencies, including, in each case, one or more of the following: the Food and DrugAdministration, or FDA, the Federal Trade Commission, or FTC, and the Consumer Products SafetyCommission. The transportation and disposal of many of our products are also subject to federal and stateregulation. State and local agencies regulate many aspects of our business. In marketplaces outside of theU.S., regulation is also comprehensive and focused upon product labeling and safety issues. Please see‘‘Risk Factors—We could be adversely affected if we do not comply with current laws and regulations or if webecome subject to additional or more stringent laws and regulations.’’
As of September 30, 2016, Sally Beauty Supply supplied 18 and BSG supplied 164 franchised stores locatedin the U.S., Mexico and certain countries in Europe. As a result of these franchisor-franchiseerelationships, we are subject to regulation when offering and selling franchises in the applicable countries.The applicable laws and regulations affect our business practices, as franchisor, in a number of ways,including restrictions placed upon the offering, renewal, termination and disapproval of assignment offranchises. To date, these laws and regulations have not had a material effect upon our operations.
Trademarks and Other Intellectual Property Rights
Our trademarks, certain of which are material to our business, are registered or legally protected in theU.S., Canada and other countries in which we operate. Together with our subsidiaries, we ownapproximately 215 trademark registrations in the U.S., and approximately 925 trademark registrationsoutside the U.S. We also rely upon trade secrets and know-how to develop and maintain our competitiveposition. We protect intellectual property rights through a variety of methods, including reliance upontrademark, patent and trade secret laws and confidentiality agreements with many vendors, employees,consultants and others who have access to our proprietary information. The duration of our trademark
18
registrations is generally 10 or 15 years, depending on the country in which a mark is registered, andgenerally the registrations can be renewed. The scope and duration of intellectual property protectionvaries by jurisdiction and by individual product. Please see ‘‘Risk Factors—If we are unable to protect ourintellectual property rights, specifically our trademarks and service marks, our ability to compete could benegatively impacted’’ and ‘‘We may have to defend our rights in intellectual property that we use in certain of ourproducts, and we could be found to infringe the intellectual property rights of others, which could be disruptiveand expensive to our business.’’
Access to Public Filings
Our Annual Report on Form 10-K, our Quarterly Reports on Form 10-Q and our Current Reports onForm 8-K, and amendments to such reports are available, without charge, on our website,www.sallybeautyholdings.com, as soon as reasonably possible after they are filed electronically with theSecurities and Exchange Commission, or SEC, under the Exchange Act. We will provide copies of suchreports to any person, without charge, upon written request to our Investor Relations Department at3001 Colorado Blvd, Denton, TX 76210. The information found on our website shall not be considered tobe part of this or any other report filed with or furnished to the SEC.
In addition to our website, you may read and copy public reports we file with or furnish to the SEC at theSEC’s Public Reference Room at 100 F Street, NE, Washington, DC 20549. You may obtain informationon the operation of the Public Reference Room by calling the SEC at 1-800-SEC-0330. The SEC maintainsan internet site that contains our reports, proxy and information statements, and other information that wefile electronically with the SEC at www.sec.gov.
ITEM 1A. RISK FACTORS
The following describes risks that we believe to be material to our business. If any of the following risks oruncertainties actually occurs, our business, financial condition and operating results could be materiallyand adversely affected. This report also contains forward-looking statements and the following risks couldcause our actual results to differ materially from those anticipated in such forward-looking statements.
Risks Relating to Our Business
The beauty products distribution industry is highly competitive and is consolidating.
The beauty products distribution industry is highly fragmented and competitive, and there are fewsignificant barriers to entry into the marketplaces for most of the types of products and services we sell.Sally Beauty Supply competes with other domestic and international beauty product wholesale and retailoutlets, including local and regional open line beauty supply stores, professional-only beauty supply stores,salons, mass merchandisers, on-line retailers, drug stores and supermarkets. BSG competes with otherdomestic and international beauty product wholesale and retail suppliers and with manufacturers sellingprofessional beauty products directly to salons and individual salon professionals. We also face competitionfrom authorized and unauthorized retailers as well as e-commerce retailers offering professionalsalon-only and other products. The availability of diverted professional salon products in unauthorizedlarge format retail stores such as drug stores, grocery stores and others could also have a negative impacton our business. The primary competitive factors in the beauty products distribution industry are the priceat which we purchase branded and exclusive-label products from manufacturers and the price at which weresell them to our customers, the quality, perceived value, consumer brand name recognition, packagingand mix of the products we sell, customer service, the efficiency of our distribution network, and theavailability of desirable store locations. Competitive conditions may limit our ability to maintain prices ormay require us to reduce prices in efforts to retain business or channel share. Some of our competitorshave greater financial and other resources than we do and are less leveraged than our business, and maytherefore be able to spend more aggressively on advertising and promotional activities and respond more
19
effectively to changing business and economic conditions. We expect existing competitors, businesspartners and new entrants to the beauty products distribution industry to constantly revise or improve theirbusiness models in response to challenges from competing businesses, including ours. If these competitorsintroduce changes or developments that we cannot address in a timely or cost-effective manner, ourbusiness may be adversely affected.
In addition, our industry is consolidating, which may give our competitors increased negotiating leveragewith suppliers and greater marketing resources, resulting in a more effective ability to compete with us. Forinstance, we may lose customers if those competitors which have broad geographic reach attract additionalsalons (individual and chain) that are currently BSG customers, or if professional beauty supplymanufacturers align themselves with our competitors. For example, one of BSG’s largest suppliers,L’Oreal, has been able to shift a material amount of revenue out of the BSG nationwide distributionnetwork and into its own regional distribution networks that compete with us. L’Oreal directly competeswith BSG and there can be no assurance that there will not be further revenue losses over time at BSG,due to potential losses of additional L’Oreal related products as well as from the increased competitionfrom L’Oreal-affiliated distribution networks. If L’Oreal (or another direct competitor) were to acquire orotherwise merge with another manufacturer which conducts business with BSG, and L’Oreal (or suchother direct competitor) decided to distribute products from that manufacturer using its own distributionnetwork, we could lose revenue from the sale of these products as well. Not only does consolidation indistribution pose risks from competing distributors, but it may also place more leverage in the hands ofthose manufacturers, resulting in smaller margins on products sold through our network.
If we are unable to compete effectively in our marketplace or if competitors divert our customers awayfrom our networks, it would adversely impact our business, financial condition and results of operations.
We may be unable to anticipate and effectively respond to changes in consumer preferences and buying trends in atimely manner.
Our success depends in part on our ability to anticipate, gauge and react in a timely manner to changes inconsumer spending patterns and preferences for specific beauty products. If we do not timely identify andproperly respond to evolving trends and changing consumer demands for beauty products in thegeographies in which we compete, our sales may decline significantly. Furthermore, we may accumulateadditional inventory and be required to mark down unsold inventory to prices that are significantly lowerthan normal prices, which would adversely impact our margins and could further adversely impact ourbusiness, financial condition and results of operations. Additionally, approximately 46% of our SallyBeauty Supply product sales come from our exclusive-label brands. The development and promotion ofthese exclusive-label brands and products often occur well before these products are sold in our stores. Asa result, the success of these exclusive-label brands and products is largely dependent on our ability todevelop brands and products that meet future consumer preferences at prices that are acceptable to ourcustomers. Furthermore, we may have to spend a significant amount on the advertising and marketing ofour exclusive-label brands to drive customer awareness of these brands. There can be no assurance thatany new exclusive-label brand or product will meet consumer preferences, gain acceptance among ourcustomer base or generate sales to become profitable or to cover the costs of its development andpromotion, which would also adversely impact our margins and could adversely impact our business,financial condition and results of operations.
In addition, we depend on our inventory management and information technology systems in order toreplenish inventories and deliver products to store locations in response to customer demands. Anysystems-related problems could result in difficulties satisfying the demands of customers which, in turn,could adversely affect our sales and profitability. In addition, our failure to manage inventory levelsappropriately during any period could adversely affect our results of operations and profitability. We alsorely on vendor relationships to provide us with access to the latest beauty products that meet the changingdemands of our customers. If we are unable to maintain these relationships, our ability to meet these
20
demands will be impaired. Please see below ‘‘—We depend upon manufacturers who may be unable toprovide products of adequate quality or who may be unwilling to continue to supply products to us.’’
We expect continuously changing fashion-related trends and consumer tastes to influence future demandfor beauty products. Changes in consumer tastes and fashion trends can have an impact on our financialperformance. If we are unable to anticipate and respond to trends in the marketplace for beauty productsand changing consumer demands, our business could suffer.
Our future success depends in part on our ability to successfully implement our strategic initiatives to improve thecustomer experience, attract new customers and improve the sales productivity of our stores.
In fiscal year 2015, we began the implementation of a number of strategic initiatives designed to improvethe customer experience at Sally Beauty Supply and BSG in an effort to attract new customers to ourstores, improve sales productivity at our existing stores and effectively compete with our competitors. Aspart of these initiatives, we have refreshed approximately 1,450 of our Sally Beauty stores in the U.S. byupgrading the ‘‘look and feel’’ of our stores and upgrading key merchandising sections across all our SallyBeauty stores, including the installation of interactive ‘‘nail studios’’ and ‘‘eyelash and brow studios,’’ a haircolor education center and improvements to the check-out areas of our stores. We intend to continue thesephysical improvements in our stores in the fiscal year 2017. In addition to these physical storeimprovements, we also focused our marketing efforts on a consistent marketing campaign designed totouch our customer through every medium they engage in and by leveraging our CRM programs to moreeffectively communicate with our customers. There can be no assurance that these strategic initiatives willattract new customers to our stores or improve sales productivity at our existing stores. Furthermore, weare investing significant resources in these initiatives and the costs of the initiatives may outweigh theirbenefits. If these strategic initiatives are not successful, our same store sales will suffer and our growthprospects, financial results, profitability and cash flows will also be adversely impacted.
We are not certain that our ongoing cost control plans will continue to be successful.
Our ability to grow profitably depends in large part on our ability to successfully control or reduce ouroperating expenses. In furtherance of this strategy, we have engaged in ongoing activities to reduce orcontrol costs, some of which are complicated and require us to expend significant resources to implement.Despite these cost control plans, we anticipate that our labor and rental costs will continue to increase forthe foreseeable future as we compete for talent and attractive retail locations with other retailers.Furthermore, we have also made significant investments in our strategic initiatives, including our storerefresh initiatives and various marketing initiatives, which have resulted in cost increases in recent periods.While we expect these costs to diminish in future periods, such costs may continue at elevated levels forfuture periods. We cannot assure you that our strategic initiatives and cost control efforts will result in theincreased profitability, cost savings or other benefits that we expect, which could have a material adverseeffect on our business, financial condition and results of operations.
Our comparable store sales and quarterly financial performance may fluctuate for a variety of reasons.
Our comparable store sales, which we refer to as same store sales, and quarterly results of operations havefluctuated in the past and we expect them to continue to fluctuate in the future. A variety of factors affectour comparable store sales and quarterly financial performance, including:
• the success of our strategic initiatives to improve the customer experience at our existing stores andattract new customers to our stores;
• changes in our merchandising strategy or mix;
• the performance of our new stores;
• our ability to increase sales and meet forecasted levels of profitability at our existing stores;
21
• our ability to anticipate and effectively respond to changing consumer preferences and buyingtrends in the geographies that our stores serve;
• the effectiveness of our inventory management processes and systems;
• the timing and concentration of new store openings, including additional human resourcerequirements and related pre-opening and other start-up costs;
• costs and disruptions associated with our store refresh program;
• the effect of our integration of acquired businesses and stores over time;
• the varying cost and profitability of new stores opened in the U.S. and in other countries;
• a portion of a typical new store’s sales (or sales we make over our e-commerce channels) comingfrom customers who previously shopped at other existing stores;
• expenditures on our distribution system;
• the timing and effectiveness of our marketing activities, particularly our ability to drive new retailtraffic into our stores and our Sally Beauty Club and ProCard promotions at an acceptable cost;
• seasonal fluctuations due to weather conditions;
• our e-commerce channels diverting sales from our stores;
• actions by our existing or new competitors;
• fluctuations over time in the cost to us of products we sell; and
• worldwide economic conditions and, in particular, the retail sales environment in the U.S.
Accordingly, our results for any one fiscal quarter are not necessarily indicative of the results to beexpected for any other quarter, and comparable store sales for any particular future period may notcontinue to increase at the same rates as we have recently experienced and may even decrease, which couldhave a material adverse effect on our business, financial condition and results of operations.
We depend upon manufacturers who may be unable to provide products of adequate quality or who may be unwillingto continue to supply products to us.
We do not manufacture any products we sell, and instead purchase our products from recognized brandmanufacturers and private label fillers. We depend on a limited number of manufacturers for a significantpercentage of the products we sell. During the fiscal year 2016, our five largest suppliers were Coty, Inc.(including certain business units formerly owned by The Procter & Gamble Company, or P&G), theProfessional Products Division of L’Oreal USA S/D, Inc., or L’Oreal, John Paul Mitchell Systems, ConairCorporation, and Shiseido Cosmetics (America) Limited and accounted for approximately 38% of ourconsolidated merchandise purchases. In addition, three of those suppliers represented approximately 37%of BSG’s merchandise purchases during the fiscal year 2016. In the fiscal year 2015, BSG reachedagreement with one of those suppliers, L’Oreal, to extend the right of BSG to distribute Matrix� andcertain other L’Oreal products in the U.S., subject to certain conditions, through December 2018. In 2016,Coty Inc., a leading supplier of fragrances, color cosmetics, and skin and body products acquired thefragrances, color cosmetics, and hair color divisions of P&G and Coty, Inc was our largest supplier. In eachof the fiscal years 2014 and 2015, P&G was our largest supplier. There can be no assurances as to theimpact, if any, that Coty’s acquisition of the fragrances, color cosmetics, and hair color divisions of P&Gwill have on our ability to continue to source products from these divisions at current prices and volumes.
Since we purchase products from many manufacturers and fillers under at-will contracts and contractswhich can be terminated without cause upon 90 days’ notice or less, or which expire without express rightsof renewal, manufacturers and fillers could discontinue sales to us immediately or upon short notice. Some
22
of our contracts with manufacturers may be terminated if we fail to meet specified minimum purchaserequirements. If minimum purchase requirements are not met, we do not have contractual assurances ofcontinued supply. In lieu of termination, a manufacturer may also change the terms upon which it sells, forexample, by raising prices or broadening distribution to third parties. Infrequently, a supplier will seek toterminate a distribution relationship through legal action. For these and other reasons, we may not be ableto acquire desired merchandise in sufficient quantities or on acceptable terms in the future.
Changes in Sally Beauty Supply’s and BSG’s relationships with suppliers occur often, and could positivelyor negatively impact the net sales and operating earnings of both business segments. Some of our suppliersmay seek to decrease their reliance on distribution intermediaries, including full-service/exclusive andopen-line distributors like BSG and Sally Beauty Supply, by promoting their own distribution channels, asdiscussed above. These suppliers may offer advantages, such as lower prices, when their products arepurchased from distribution channels they control. If our access to supplier-provided products were todiminish relative to our competitors or we were not able to purchase products at the same prices as ourcompetitors, our business could be materially and adversely affected. Also, consolidation among suppliersmay increase their negotiating leverage, thereby providing them with competitive advantages that mayincrease our costs and reduce our revenues, adversely affecting our business, financial condition andresults of operations. Therefore, there can be no assurance that the impact of these developments, if theywere to occur, will not adversely impact revenue to a greater degree than we currently expect or that ourefforts to mitigate the impact of these developments will be successful. If the impact of these developmentsis greater than we expect or our efforts to mitigate the impact of these developments are not successful,this could have a material adverse effect on our business, financial condition or results of operations.
Although we plan to mitigate the negative effects resulting from potential unfavorable changes in ourrelationships with suppliers, there can be no assurance that our efforts will partially or completely offsetthe loss of these distribution rights.
Any significant interruption in the supply of products by manufacturers and fillers could disrupt our ability todeliver merchandise to our stores and customers in a timely manner, which could have a material adverse effect onour business, financial condition and results of operations.
Manufacturers and exclusive-label fillers of beauty supply products are subject to certain risks that couldadversely impact their ability to provide us with their products on a timely basis, including inability toprocure ingredients, industrial accidents, environmental events, strikes and other labor disputes, unionorganizing activity, disruptions in logistics or information systems, loss or impairment of key manufacturingsites, product quality control, safety, licensing requirements and other regulatory issues, as well as naturaldisasters and other external factors over which neither they nor we have control. In addition, we directlysource many of our exclusive-label products, including, but not limited to, styling tools, salon equipment,sundries and other promotional products, from foreign third-party manufacturers and many of our vendorsalso use overseas sourcing to manufacture some or all of their products. Any event causing a suddendisruption of manufacturing or imports from such foreign countries, including the imposition of additionalor increased import restrictions, duties or tariffs, political instability, labor disputes, local businesspractices, legal or economic restrictions on overseas suppliers’ ability to produce and deliver products oracts of war or terrorism, could materially harm our operations to the extent they affect the production,shipment or receipt of merchandise. Our operating results depend to some extent on the orderly operationof our receiving and distribution processes, which depend on manufacturers’ adherence to shippingschedules and our effective management of our distribution facilities and capacity.
If a material interruption of supply occurs, or a significant manufacturer or filler ceases to supply us ormaterially decreases its supply to us, we may not be able to acquire products with similar quality andconsumer brand name recognition as the products we currently sell or to acquire such products insufficient quantities to meet our customers’ demands or on favorable terms to our business, any of whichcould adversely impact our business, financial condition and results of operations.
23
Fluctuations in the price, availability and quality of inventory may result in higher cost of goods, which we may notbe able to pass on to the customers.
Our suppliers are increasingly passing on higher production costs, which may impact our ability to maintainor grow our margins. The price and availability of raw materials may be impacted by demand, regulation,weather and other factors. Additionally, manufacturers have and may continue to have increases in othermanufacturing costs, such as transportation, labor and benefit costs. These increases in production costsresult in higher merchandise costs to us. We may not always be able to pass on those cost increases to ourcustomers, which could have a material adverse effect on our results of operations and financial condition.
If products sold by us are found to be defective in labeling or content, our credibility and that of the brands we sellmay be harmed, marketplace acceptance of our products may decrease, and we may be exposed to liability in excessof our products liability insurance coverage and manufacturer indemnities.
We do not control the production process for the products we sell. We may not be able to identify a defectin a product we purchase from a manufacturer or exclusive-label filler before we offer such product forresale. In many cases, we rely on representations of manufacturers and fillers about the products wepurchase for resale regarding the composition, manufacture and safety of the products, as well as thecompliance of our product labels with government regulations. Our sale of certain products exposes us topotential product liability claims, recalls or other regulatory or enforcement actions initiated by federal,state or foreign regulatory authorities or through private causes of action. Such claims, recalls or actionscould be based on allegations that, among other things, the products sold by us are misbranded, containcontaminants or impermissible ingredients, provide inadequate instructions regarding their use or misuse,or include inadequate warnings concerning flammability or interactions with other substances. Claimsagainst us could also arise as a result of the misuse by purchasers of such products or as a result of their usein a manner different than the intended use. We may be required to pay for losses or injuries actually orallegedly caused by the products we sell and to recall any product we sell that is alleged to be or is found tobe defective.
Any actual defects or allegations of defects in products sold by us could result in adverse publicity andharm our credibility or the credibility of the manufacturer, which could adversely affect our business,financial condition and results of operations. Although we may have indemnification rights against themanufacturers of many of the products we distribute and rights as an ‘‘additional insured’’ under themanufacturers’ insurance policies, it is not certain that any manufacturer or insurer will be financiallysolvent and capable of making payment to any party suffering loss or injury caused by products sold by us.Further, some types of actions and penalties, including many actions or penalties imposed by governmentalagencies and punitive damages awards, may not be remediable through reliance on indemnity agreementsor insurance. Furthermore, potential product liability claims may exceed the amount of indemnity orinsurance coverage or be excluded under the terms of an indemnity agreement or insurance policy andclaims for indemnity or reimbursement by us may require us to expend significant resources and may takeyears to resolve. If we are forced to expend significant resources and time to resolve such claims or to paymaterial amounts to satisfy such claims, it could have an adverse effect on our business, financial conditionand results of operations.
We could be adversely affected if we do not comply with current laws and regulations or if we become subject toadditional or more stringent laws and regulations.
We are subject to a number of federal, state and local laws and regulations in the U.S., as well as applicablelaws and regulations in each foreign marketplace in which we do business. These laws and regulationsgovern the composition, packaging, labeling and safety of the products we sell, as well as the methods weuse to sell and import these products. Non-compliance with applicable laws and regulations ofgovernmental authorities, including the FDA and similar authorities in other jurisdictions, by us or themanufacturers and fillers of the products sold by us could result in fines, product recalls and enforcementactions, and otherwise restrict our ability to market certain products, which could adversely affect ourbusiness, financial condition and results of operations.
24
In addition, the laws and regulations applicable to us or manufacturers of the products sold by us maybecome more stringent. For example, the State of California, where we operate a number of stores,currently enforces legislation commonly referred to as ‘‘Proposition 65’’ that requires that ‘‘clear andreasonable’’ warnings be given to consumers who are exposed to chemicals known to the State ofCalifornia to cause cancer or reproductive toxicity. Although we have sought to comply with Proposition65 requirements, there can be no assurance that we will not be adversely affected by litigation or otheractions relating to Proposition 65 or future legislation that is similar or related thereto. Continued legalcompliance with new and existing regulations, such as Proposition 65 and other federal or state-level safeconsumer product regulations, could require the review and possible reformulation or relabeling of certainproducts, as well as the possible removal of some products from the marketplace. Failure to comply withthese new and existing regulations could result in significant fines or damages, in addition to costs andexpenses to defend claims related thereto. Legal compliance could also lead to considerably higher internalregulatory costs. Manufacturers may try to recover some or all of any increased costs of compliance byincreasing the prices at which we purchase products, and we may not be able to recover some or all of suchincreased cost in our own prices to our customers. We are also subject to state and local laws andregulations that affect our franchisor-franchisee relationships. Increased compliance costs and the loss ofsales of certain products due to more stringent or new laws and regulations could adversely affect ourbusiness, financial condition and results of operations.
Laws and regulations impact our business in many areas that have no direct relation to the products wesell. For example, as a public company, we are subject to a number of laws and regulations related to thedisclosure of financial and other information about us, as well as the issuance and sale of our securities.Another area of intense regulation is that of the relationships we have with our employees, including, forexample, compliance with many different wage and hour and nondiscrimination related regulatoryschemes and, in the U.S., compliance with the 2010 Patient Protection and Affordable Care Act. Violationof any of the laws or regulations governing our business or the assertion of individual or class-wide claimscould have an adverse effect on our business, financial condition and results of operations.
Our e-commerce businesses may be unsuccessful or, if successful, may divert sales from our stores.
We offer many of our beauty products for sale through our websites in the U.S. (such aswww.sallybeauty.com, www.cosmoprofbeauty.com, www.cosmoprofequipment.com and www.loxabeauty.com)and abroad. As a result, we encounter risks and difficulties frequently experienced by internet-basedbusinesses, including risks related to our ability to attract and retain customers on a cost-effective basis andour ability to operate, support, expand and develop our e-commerce operations, websites and software andother related operational systems. Although we believe that our participation in both e-commerce andphysical store sales is a distinct advantage for us due to synergies and the potential for new customers,supporting product offerings through both of these channels could create issues that have the potential toadversely affect our results of operations. For example, if our e-commerce businesses successfully grow,they may do so in part by attracting existing customers, rather than new customers, who choose to purchaseproducts from us online rather than from our physical stores, thereby reducing the financial performanceof our stores. In addition, offering different products through each channel could cause conflicts and causesome of our current or potential internet customers to consider competing distributors of beauty products.In addition, offering products through our e-commerce channels (particularly directly to consumersthrough our professional business) could cause some of our current or potential vendors to considercompeting internet offerings of their products either directly or through competing distributors. As wecontinue to grow our e-commerce businesses, the impact of attracting existing rather than new customers,of conflicts between product offerings online and through our stores, and of opening up our channels toincreased internet competition could have a material adverse impact on our business, financial conditionand results of operations, including future growth and same store sales. Furthermore, our recent initiativesto upgrade our e-commerce platforms may not be successful in driving traffic to our websites andincreasing our online sales in the long term, which could adversely impact our net sales.
25
Diversion of professional products sold by BSG could have an adverse impact on our revenues.
The majority of the products that BSG sells, including those sold by our Armstrong McCall franchisees, aremeant to be used exclusively by salons and individual salon professionals or sold exclusively to their retailconsumers. However, despite our efforts to prevent diversion, incidents of product diversion occur,whereby our products are sold by these purchasers (and possibly by other bulk purchasers such asfranchisees) to wholesalers and ultimately to general merchandise retailers, among others. These retailers,in turn, sell such products to consumers. The diverted product may be old, tainted or damaged and soldthrough unapproved outlets, all of which could diminish the value of the particular brand. In addition, suchdiversion may result in lower net sales for BSG should consumers choose to purchase diverted productsfrom retailers rather than purchasing from our customers, or choose other products altogether because ofthe perceived loss of brand prestige.
In the BSG arena, product diversion is generally prohibited under our manufacturers’ contracts, and weare often under a contractual obligation to stop selling to salons, salon professionals and other bulkpurchasers which engage in product diversion. If we fail to comply with our anti-diversion obligationsunder these manufacturers’ contracts, including any known diversion of products sold through ourArmstrong McCall franchisees, these contracts could be adversely affected or even terminated. In addition,our investigation and enforcement of our anti-diversion obligations may result in reduced sales to ourcustomer base, thereby decreasing our revenues and profitability.
BSG’s financial results are affected by the financial results of BSG’s franchised-based business (ArmstrongMcCall).
BSG receives revenue from its sale of products to Armstrong McCall franchisees. Accordingly, a portion ofBSG’s financial results is to an extent dependent upon the operational and financial success of thesefranchisees, including their implementation of BSG’s strategic plans. If sales trends or economic conditionsworsen for Armstrong McCall’s franchisees, their financial results may worsen. Additionally, the failure ofArmstrong McCall franchisees to renew their franchise agreements, any requirement that ArmstrongMcCall restructure its franchise agreements in connection with such renewals, or any failure of ArmstrongMcCall to meet its obligations under its franchise agreements, could result in decreased revenues for BSGor create legal issues with our franchisees or with manufacturers.
We may not be able to successfully identify acquisition candidates or successfully complete desirable acquisitions.
In the past several years, we have completed multiple acquisitions and we intend to pursue additionalacquisitions in the future. We actively review acquisition prospects that we believe would complement ourexisting lines of business, increase the size and geographic scope of our operations or otherwise offerprofitable growth and operating efficiency opportunities. There can be no assurance that we will continueto identify suitable acquisition candidates.
If suitable candidates are identified, we may be unable to reach agreeable acquisition terms with suchcandidates or may not have access to sufficient funds to fund such acquisitions. We compete against manyother companies, some of which are larger and have greater financial and other resources than we do.Increased competition for acquisition candidates could result in fewer acquisition opportunities and higheracquisition prices. In addition, we are highly leveraged and the agreements governing our indebtednesscontain limits on our ability to incur additional debt to pay for acquisitions. We may be unable to financeacquisitions that would increase our growth or improve our financial and competitive position. To theextent that debt financing is available to finance acquisitions, our net indebtedness could increase as aresult of any acquisitions. Internationally, regulatory requirements, trade barriers and due diligencedifficulties, among other considerations, make acquiring suitable foreign candidates more difficult,time-consuming and expensive. See below ‘‘�Our ability to conduct business in international marketplacesmay be affected by legal, regulatory and economic risks.’’
26
If we acquire any businesses in the future, they could prove difficult to integrate, disrupt our business or have anadverse effect on our results of operations.
Any acquisitions that we do make may be difficult to integrate profitably into our business and may entailnumerous risks, including:
• difficulties in assimilating acquired operations, stores or products, including the loss of keyemployees from acquired businesses;
• difficulties and costs associated with integrating and evaluating the distribution or informationsystems and/or internal control systems of acquired businesses;
• difficulties in competing with existing stores or business or diverting sales from our existing stores orbusiness;
• expenses associated with the amortization of identifiable intangible assets;
• problems retaining key technical, operational and administrative personnel;
• diversion of management’s attention from our core business, including loss of management focus onmarketplace developments;
• complying with foreign regulatory requirements, including multi-jurisdictional competition rulesand restrictions on trade/imports;
• enforcement of intellectual property rights in foreign countries;
• adverse effects on existing business relationships with suppliers and customers, including thepotential loss of suppliers of the acquired businesses;
• operating inefficiencies and negative impact on profitability;
• entering geographic areas or channels in which we have limited or no prior experience; and
• those related to general economic and political conditions, including legal and other barriers tocross-border investment in general, or by U.S. companies in particular.
In addition, during the acquisition process, we may fail or be unable to discover some of the liabilities ofbusinesses that we acquire. These liabilities may result from a prior owner’s noncompliance with applicablelaws and regulations. Acquired businesses may also not perform as we expect or we may not be able toobtain the expected financial improvements in the acquired businesses.
If we are unable to profitably open and operate new stores, our business, financial condition and results ofoperations may be adversely affected.
Our future growth strategy depends in part on our ability to open and profitably operate new stores inexisting and additional geographic areas and, more specifically, in international geographies asinternational growth becomes an increasing driver of our future growth. While the capital requirements toopen a Sally Beauty Supply or BSG store, excluding inventory, vary from geography to geography, suchcapital requirements have historically been relatively low in the U.S. and Canada. Despite these relativelylow opening costs, we may not be able to open all of the new stores we plan to open and any new stores weopen may not be profitable, either of which could have a material adverse impact on our financialcondition or results of operations. There are several factors that could affect our ability to open andprofitably operate new stores, including:
• the inability to identify and acquire suitable sites or to negotiate acceptable leases for such sites;
• proximity to existing stores that may reduce the new store’s sales or the sales of existing stores;
27
• difficulties in adapting our distribution and other operational and management systems to anexpanded network of stores;
• the level of sales made through our e-commerce channels and the potential that sales through oure-commerce channels will divert sales from our stores;
• the potential inability to obtain adequate financing to fund expansion because of our high leverageand limitations on our ability to issue equity under our credit agreements, among other things;
• increased (and sometimes unanticipated) costs associated with opening stores in internationallocations;
• difficulties in obtaining any governmental and third-party consents, permits and licenses;
• limitations on capital expenditures which may be included in financing documents that we enterinto; and
• difficulties in adapting existing operational and management systems to the requirements ofnational or regional laws and local ordinances.
In addition, as we continue to open new stores, our management, as well as our financial, distribution andinformation systems, and other resources will be subject to greater demands. If our personnel and systemsare unable to successfully manage this increased burden, our results of operations may be materiallyaffected.
Our ability to conduct business outside the United States may be affected by legal, regulatory and economic risks.
Our ability to enter and capitalize on growth in new international marketplaces and to grow or maintainour current level of operations in our existing international marketplaces is subject to risks associated withour international operations. These risks include: the increased cost of real estate in mall locations inSouth America, unexpected changes in regulatory requirements, trade barriers to some internationalmarketplaces, economic and foreign currency fluctuations, potential difficulties in enforcing contracts,difficulty in identifying manufacturers or sourcing quality products, increasing levels of violence orterrorism, an inability to properly protect assets (including intellectual property), an inability to collectreceivables, potential tax liabilities associated with repatriating funds from foreign operations anddifficulties and costs of staffing, managing and accounting for foreign operations.
The potential impact of Britain’s recent vote to leave the European Union and any related or other disruptive eventsaffecting the European Union or other geographies in which we conduct business
Our results of operations may be materially affected by any adverse impact resulting from Britain’s recentvote to leave the European Union (commonly referred to as ‘‘Brexit’’). The Brexit vote may result inincreased uncertainty throughout the region and could adversely affect business activity, political stabilityand economic conditions throughout Europe. The uncertainty concerning the timing and terms of the exitcould also have a negative impact on future growth for the UK and/or other European economies andcause further strengthening of the U.S. dollar against foreign currencies in which we conduct business. Thestrengthening of the U.S. dollar relative to the British pound and euro may adversely affect our results ofoperations as we translate sales and other results denominated in foreign currency into U.S. dollars for ourfinancial statements. During periods of strengthening dollar, our reported international sales and earningscould be reduced because foreign currencies may translate into fewer U.S. dollars.
28
The health of the economy in the geographies we serve may affect consumer purchases of discretionary items such asbeauty products and salon services, which could have a material adverse effect on our business, financial conditionand results of operations.
Our results of operations may be materially affected by conditions in the global capital markets and theeconomy generally, both in the U.S. and internationally. Concerns over inflation, employment, tax laws,energy costs, geopolitical issues, terrorism, the availability and cost of credit, the mortgage market,sovereign and private banking systems, sovereign deficits and increasing debt burdens and the real estateand other financial markets in the U.S. and Europe have contributed to increased volatility and diminishedexpectations for the U.S. and certain foreign economies. We appeal to a wide demographic consumerprofile and offer an extensive selection of beauty products sold directly to retail consumers and salons andsalon professionals. Continued uncertainty in the economy could adversely impact consumer purchases ofdiscretionary items such as beauty products, as well as adversely impact the frequency of salon servicesperformed by professionals using products purchased from us. Factors that could affect consumers’willingness to make such discretionary purchases include: general business conditions, levels ofemployment, interest rates, tax rates, the availability of consumer credit and consumer confidence in futureeconomic conditions. In the event of a prolonged economic downturn or acute recession, consumerspending habits could be adversely affected and we could experience lower than expected net sales. Theeconomic climate could also adversely affect our vendors. The occurrence of any of these events couldhave a material adverse effect on our business, financial condition and results of operations.
Our net sales depend on a volume of traffic to our stores, and a reduction in traffic to, or the closing of, the otherdestination retailers in the shopping areas where our stores are located could significantly reduce our sales and leaveus with excess inventory, which could have a material adverse effect on our business, financial condition,profitability and cash flows.
Most of our stores are located in strip malls, which are occupied by other high traffic retailers includinggrocery stores, mass merchants and home centers. Sales at these stores are derived, in part, from thevolume of traffic generated by the other destination retailers and the anchor stores in these shopping areaswhere our stores are located. Customer traffic to these shopping areas may be adversely affected by theclosing of such destination retailers or anchor stores, or by a reduction in traffic to such stores resultingfrom a regional or global economic downturn, a general downturn in the local area where our store islocated, or a decline in the desirability of the shopping environment of a particular strip mall. Such areduction in customer traffic would reduce our sales and leave us with excess inventory, which could have amaterial adverse effect on our business, financial condition and results of operations. We may respond byincreasing markdowns, initiating marketing promotions, or transferring product to other stores to reduceexcess inventory, which would further decrease our gross profits and net income.
If we are unable to protect our intellectual property rights, specifically our trademarks and service marks, our abilityto compete could be negatively impacted.
The success of our business depends to a certain extent upon the value associated with our intellectualproperty rights. We own certain trademark and service mark rights used in connection with our businessincluding, but not limited to, ‘‘Sally,’’ ‘‘Sally Beauty,’’ ‘‘Sally Beauty Supply,’’ ‘‘Sally Beauty Club Card,’’‘‘BSG,’’ ‘‘CosmoProf,’’ ‘‘Proclub,’’ ‘‘Armstrong McCall,’’ ‘‘ion,’’ ‘‘Beyond the Zone’’ and ‘‘Salon Services.’’We protect our intellectual property rights through a variety of methods, including, but not limited to,applying for and obtaining trademark protection in the U.S., Canada and other countries throughout theworld in which our business operates. We also rely on trade secret laws, in addition to confidentialityagreements with vendors, employees, consultants and others who have access to our proprietaryinformation. While we intend to vigorously protect our trademarks against infringement, we may not besuccessful. In addition, the laws of certain foreign countries may not protect our intellectual property rights
29
to the same extent as the laws of the U.S. The costs required to protect our intellectual property rights andtrademarks are expected to continue to be substantial.
We may have to defend our rights in intellectual property that we use in certain of our products, and we could befound to infringe the intellectual property rights of others, which could be disruptive and expensive to our business.
The industry in which we operate is characterized by the need for a large number of copyrights, tradesecrets and trademarks and by frequent litigation based on allegations of infringement or other violationsof intellectual property rights. A third party may at any time assert that our products violate such party’sintellectual property rights. Successful intellectual property claims against us could result in significantfinancial liabilities and/or prevent us from selling certain of our products. In addition, the resolution ofinfringement claims may require us to redesign our products, to obtain licenses to use intellectual propertybelonging to third parties, which may not be attainable on reasonable terms, or to cease using theintellectual property altogether. Moreover, any intellectual property claim, regardless of its merits, couldbe expensive and time-consuming to defend against and could divert the attention of management. As aresult, claims based on allegations of infringement or other violations of intellectual property rights,regardless of outcome, could have a material adverse effect on our business, financial condition and resultsof operations.
We may be adversely affected by any disruption in our information technology systems.
Our operations are dependent upon our information technology systems, which encompass all of ourmajor business functions. We rely upon such information technology systems to manage and replenishinventory, to fill and ship customer orders on a timely basis, to coordinate our sales activities across all ofour products and services, to coordinate our administrative activities and to protect confidentialinformation that we receive and maintain about our customers, employees and other third parties. Asubstantial disruption in our information technology systems for any prolonged time period (arising from,for example, system capacity limits from unexpected increases in our volume of business, outages or delaysin our service) could result in delays in receiving inventory and supplies or filling customer orders andadversely affect our customer service and relationships. Our systems might be damaged or interrupted bynatural or man-made events (caused by us, by our service providers or others) or by computer viruses,physical or electronic break-ins and similar disruptions affecting the internet. Such delays, problems orcosts may have a material adverse effect on our business, financial condition and results of operations.
As our operations grow in both size and scope, we continuously need to improve and upgrade our systemsand infrastructure while maintaining their reliability and integrity. The expansion of our systems andinfrastructure will require us to commit substantial financial, operational and technical resources beforethe volume of our business increases, with no assurance that the volume of business will increase. Forexample, we are in the process of implementing a standardized ERP system for both our domestic andinternational operations over the next few years. Our domestic ERP system implementation is designed tointegrate legacy systems and to provide enhanced functionality throughout our enterprise functions,including finance and accounting, supply chain and distribution, merchandising, human resources andpayroll. In addition, we are currently implementing new point-of-sale systems in a number of our divisions,which we anticipate will provide significant benefits, including enhanced tracking of customer sales. Thedevelopment and implementation of the new ERP and point-of-sale systems and any other future upgradesto our systems and information technology may require significant costs and divert our management’sattention and other resources from our core business. There are also no assurances that these new systemsand upgrades will provide us with the anticipated benefits and efficiencies. Many of our systems areproprietary, and as a result our options are limited in seeking third-party help with the operation andupgrade of those systems. There can be no assurance that the time and resources our management willneed to devote to operations and upgrades, any delays due to the installation of any upgrade (andcustomer issues therewith), any resulting service outages, or the impact on the reliability of our data from
30
any upgrade or any legacy system, will not have a material adverse effect on our business, financialcondition or results of operations.
Unauthorized access to confidential information and data on our information technology systems and security anddata breaches could materially adversely affect our business, financial condition and operating results.
As part of our operations, we receive and maintain information about our customers, employees and otherthird parties. We have physical, technical and procedural safeguards in place that are designed to protectinformation and protect against security and data breaches as well as fraudulent transactions and otheractivities. Despite these safeguards and our other security processes and protections, we cannot be assuredthat all of our systems and processes are free from vulnerability to security breaches (through cyber-attacks, which are evolving and becoming increasingly sophisticated, physical breach or other means) orinadvertent data disclosure by third parties or us. A significant data security breach, includingmisappropriation of our customers’ or employees’ confidential information, could result in significant coststo us, which may include, among others, potential liabilities to payment card networks for reimbursementsof credit card fraud and card reissuance costs, including fines and penalties, potential liabilities fromgovernmental or third party investigations, proceedings or litigation, legal, forensic and consulting fees andexpenses, costs and diversion of management attention required for investigation and remediation actions,and the negative impact on our reputation and loss of confidence of our customers, suppliers and others,any of which could have a material adverse impact on our business, financial condition and operatingresults.
In response to the data security incidents, we have taken and are continuing to take actions to furtherstrengthen the security of our information technology systems, including a recent initiative to adoptpayment terminals with end-to-end encryption technology in order to enhance the security of our creditcard payment systems. Nevertheless, there can be no assurance that our security upgrades will be effective,that we will not suffer a similar criminal attack in the future, that unauthorized parties will not gain accessto confidential information, or that any such incident will be discovered promptly. In particular, weunderstand that the techniques used by criminals to obtain unauthorized access to sensitive data changefrequently and often are not recognized until launched against a target; accordingly, we may be unable toanticipate these techniques or implement adequate preventative measures. The failure to promptly detect,determine the extent of and appropriately respond to a significant data security breach could have amaterial adverse impact on our business, financial condition and operating results.
We have experienced data security incidents and are not yet able to determine the full extent or scope of the potentialliabilities relating to these data security incidents.
In the fiscal year ended September 30, 2014, we disclosed that we had experienced a data security incident(the ‘‘2014 data security incident’’). In the fiscal year ended September 30, 2015, we disclosed that we hadexperienced a second data security incident (the ‘‘2015 data security incident’’ and together with the 2014data security incident, the ‘‘data security incidents’’). The data security incidents involved the unauthorizedinstallation of malicious software (malware) on our information technology systems, including ourpoint-of-sale systems that, we believe may have placed at risk certain payment card data for sometransactions. The costs that the Company has incurred to date in connection with the data securityincidents include assessments from payment card networks, professional advisory fees, legal costs andexpenses relating to investigating and remediating the data security incidents. We may have also sufferedreputational harm due to multiple data security incidents and may incur additional costs and expensesrelated to the data security incidents in the future. As detailed above, these costs may result from potentialadditional liabilities to payment card networks, governmental or third party investigations, proceedings orlitigation, legal and other fees necessary to defend against any potential liabilities or claims, and furtherinvestigatory and remediation costs. We are unable at this time to determine the probability of or toreasonably estimate the magnitude of these potential liabilities. The potential liabilities or other remedies
31
against us related to the data security incidents may have a material adverse impact on our business,financial condition and operating results.
If we fail to attract and retain highly skilled management and other personnel, our business, financial condition andresults of operations may be harmed.
Our success has depended, and will continue to depend, in large part on our ability to attract and retainsenior executives, who possess extensive knowledge, experience and managerial skill applicable to ourbusiness. In February 2015, Christian A. Brickman was appointed the Company’s President and ChiefExecutive Officer (CEO) pursuant to an executive management transition plan previously approved by ourBoard of Directors (‘‘the Board’’). Mr. Brickman succeeded Mr. Gary G. Winterhalter as the Company’sCEO. In July 2015, the Board appointed Mark Spinks as President of our BSG business unit. Mr. Spinkssucceeded Mr. John R. Golliher. In January 2016, the Board appointed Sharon M. Leite as President ofour Sally Beauty Supply business unit. Prior to Ms. Leite’s appointment, the position of President of SallyBeauty Supply had been vacant since May 2014. In September 2016, Mr. Mark J. Flaherty resigned fromhis position as Senior Vice President and Chief Financial Officer. Immediately following his resignation,Janna S. Minton, the Company’s Group Vice President, Chief Accounting Officer and Controller, wasappointed and began serving as our interim principal financial officer.
Any significant leadership change or executive management transition involves inherent risk and anyfailure to ensure the effective transfer of knowledge and a smooth transition could hinder our strategicplanning, execution and future performance. In addition, from time to time, key executive personnel leaveour Company and we may not be successful in attracting, integrating and retaining the personnel requiredto grow and operate our business profitably. While we strive to mitigate the negative impact associatedwith the loss of a key executive employee, an unsuccessful transition or loss could significantly disrupt ouroperations and have a material adverse effect on our business, financial condition or results of operations.
We are also dependent on training, motivating and managing our store employees that interact with ourcustomers on a daily basis. Competition for these types of qualified employees is intense and the failure toattract, retain and properly train qualified and motivated employees could result in decreased customersatisfaction, loss of customers, and lower sales.
The occurrence of natural disasters or acts of violence or terrorism could adversely affect our operations andfinancial performance.
The occurrence of natural disasters or acts of violence or terrorism could result in physical damage to ourproperties, the temporary closure of stores or distribution centers, the temporary lack of an adequate workforce, the temporary or long-term disruption in the supply of products (or a substantial increase in the costof those products) from domestic or foreign suppliers, the temporary disruption in the delivery of goods toour distribution centers (or a substantial increase in the cost of those deliveries), the temporary reductionin the availability of products in our stores, and/or the temporary reduction in visits to stores by customers.If one or more natural disasters or acts of violence or terrorism were to impact our business, we could,among other things, incur significantly higher costs and longer lead times associated with distributingproducts. Furthermore, insurance costs associated with our business may rise significantly in the event of alarge scale natural disaster or act of violence or terrorism.
We are a holding company with no operations of our own, and we depend on our subsidiaries for cash.
We are a holding company and do not have any material assets or operations other than ownership ofequity interests of our subsidiaries. Our operations are conducted almost entirely through our subsidiaries,and our ability to generate cash to meet our obligations or to pay dividends is highly dependent on theearnings of, and receipt of funds from, our subsidiaries through dividends or intercompany loans. Theability of our subsidiaries to generate sufficient cash flow from operations to allow us and them to make
32
scheduled payments on our obligations will depend on their future financial performance, which will beaffected by a range of economic, competitive and business factors, many of which are outside of ourcontrol. We cannot assure you that the cash flow and earnings of our operating subsidiaries will beadequate for our subsidiaries to service their debt obligations. If our subsidiaries do not generate sufficientcash flow from operations to satisfy corporate obligations, we may have to: undertake alternative financingplans (such as refinancing), restructure debt, sell assets, reduce or delay capital investments, or seek toraise additional capital. We cannot assure you that any such alternative refinancing would be possible, thatany assets could be sold, or, if sold, of the timing of the sales and the amount of proceeds realized fromthose sales, that additional financing could be obtained on acceptable terms, if at all, or that additionalfinancing would be permitted under the terms of our various debt instruments then in effect. Our inabilityto generate sufficient cash flow to satisfy our obligations, or to refinance our obligations on commerciallyreasonable terms, would have an adverse effect on our business, financial condition and results ofoperations.
Furthermore, we and our subsidiaries may incur substantial additional indebtedness in the future that mayseverely restrict or prohibit our subsidiaries from making distributions, paying dividends or making loans tous.
Litigation costs and the outcome of litigation could have a material adverse effect on our business and any losscontingency accruals may not be adequate to cover actual losses.
From time to time, we are subject to litigation claims through the ordinary course of our businessoperations regarding, but not limited to, employment matters, security of consumer and employee personalinformation, contractual relations with suppliers, marketing and infringement of trademarks and otherintellectual property rights. Litigation to defend ourselves against these patent infringement claims andother claims by third parties, or to enforce any rights that we may have against third parties, may benecessary, which could result in substantial costs and diversion of our resources, causing a material adverseeffect on our business, financial condition, profitability and cash flows. We establish accruals for potentialliability arising from legal proceedings when potential liability is probable and the amount of the loss canbe reasonably estimated based on currently available information. We may still incur legal costs for amatter even if we have not accrued a liability. In addition, actual losses may be higher than the amountaccrued for a certain matter, or in the aggregate. An unfavorable resolution of a legal proceeding or claimcould materially adversely impact our business, financial condition, profitability and cash flows. There canbe no assurance that any pending or future litigation will not have a material adverse effect on ourbusiness, financial condition, profitability and cash flows.
Our previously announced share repurchase program could affect the price of our common stock and increasevolatility and may be suspended or terminated at any time, which may result in a decrease in the trading price of ourcommon stock.
Repurchases pursuant to our share repurchase program could affect our stock price and increase itsvolatility. The existence of a share repurchase program could also cause our stock price to be higher than itwould be in the absence of such a program and could potentially reduce the market liquidity for our stock.There can be no assurance that any share repurchases will enhance stockholder value because the marketprice of our common stock may decline below the levels at which we repurchased shares of common stock.Although our share repurchase program is intended to enhance long-term stockholder value, short-termstock price fluctuations could reduce the program’s effectiveness. Furthermore, the program does notobligate the Company to repurchase any dollar amount or number of shares of common stock, and may besuspended or discontinued at any time and any suspension or discontinuation could cause the market priceof our stock to decline.
33
Risks Relating to Our Substantial Indebtedness
We have substantial debt and may incur substantial additional debt, which could adversely affect our financialhealth, our ability to obtain financing in the future and our ability to react to changes in our business.
As of September 30, 2016, certain of our subsidiaries, including Sally Holdings LLC, which we refer to asSally Holdings, had an aggregate principal amount of approximately $1,784.0 million of outstanding debt,including capital lease obligations, and a total debt to equity ratio of �6.5:1.00.
Our substantial debt could have important consequences. For example, it could:
• make it more difficult for us to satisfy our obligations to our lenders, resulting in possible defaultson and acceleration of such indebtedness;
• limit our ability to obtain additional financing for working capital, capital expenditures, acquisitions,debt service requirements or general corporate purposes;
• require us to dedicate a substantial portion of our cash flow from operations to the payment ofprincipal and interest on our indebtedness, thereby reducing the availability of such cash flows tofund working capital, capital expenditures, share repurchases and other general corporate purposes;
• restrict the ability of our subsidiaries to pay dividends or otherwise transfer assets to us, which couldlimit our ability to conduct repurchases of our own equity securities or pay dividends to ourstockholders, thereby limiting our ability to enhance stockholder value through such transactions;
• increase our vulnerability to general adverse economic and industry conditions, including interestrate fluctuations (because a portion of our borrowings are at variable rates of interest), includingborrowings under our asset-based senior secured loan facility, which we refer to as the ‘‘ABLfacility’’;
• place us at a competitive disadvantage compared to our competitors with proportionately less debtor comparable debt at more favorable interest rates and that, as a result, may be better positionedto withstand economic downturns;
• limit our ability to refinance indebtedness or cause the associated costs of such refinancing toincrease; and
• limit our flexibility to adjust to changing market conditions and ability to withstand competitivepressures, or prevent us from carrying out capital spending that is necessary or important to ourgrowth strategy and efforts to improve operating margins or our business.
Any of the foregoing impacts of our substantial indebtedness could have a material adverse effect on ourbusiness, financial condition and results of operations.
Despite our current indebtedness levels, we and our subsidiaries may be able to incur substantially more debt,including secured debt, which could further exacerbate the risks associated with our substantial indebtedness.
We and our subsidiaries may incur substantial additional indebtedness in the future. The terms of theinstruments governing our indebtedness do not fully prohibit us or our subsidiaries from doing so. As ofSeptember 30, 2016, our ABL facility provided us commitments for additional borrowings of up toapproximately $478.4 million, subject to borrowing base limitations. If new debt is added to our currentdebt levels, the related risks that we face would increase, and we may not be able to meet all our debtobligations. In addition, the agreements governing our ABL facility as well as the indentures governing oursenior notes due 2022, senior notes due 2023 and senior notes due 2025, which we refer to collectively as‘‘the Notes’’ or ‘‘the senior notes due 2022, 2023 and 2025’’, do not prevent us from incurring obligationsthat do not constitute indebtedness.
34
The agreements and instruments governing our debt contain restrictions and limitations that could significantlyimpact our ability to operate our business.
The ABL facility contains covenants that, among other things, restrict Sally Holdings and its subsidiaries’ability to:
• change their line of business;
• engage in certain mergers, consolidations and transfers of all or substantially all of their assets;
• make certain dividends, share repurchases and other distributions;
• make acquisitions of all of the business or assets of, or stock representing beneficial ownership of,any person;
• dispose of certain assets;
• make voluntary prepayments on the Notes or make amendments to the terms thereof;
• prepay certain other debt or amend specific debt agreements;
• change the fiscal year of Sally Holdings or its direct parent; and
• create or incur negative pledges.
In addition, if Sally Holdings fails to maintain a specified minimum level of borrowing capacity under theABL facility, it will then be obligated to maintain a specified fixed-charge coverage ratio. Our ability tocomply with these covenants in future periods will depend on our ongoing financial and operatingperformance, which in turn will be subject to economic conditions and to financial, market and competitivefactors, many of which are beyond our control. Our ability to comply with these covenants in future periodswill also depend substantially on the pricing of our products, our success at implementing cost reductioninitiatives and our ability to successfully implement our overall business strategy.
The indentures governing the Notes also contain restrictive covenants that, among other things, limit ourability and the ability of Sally Holdings and its restricted subsidiaries to:
• dispose of assets;
• incur additional indebtedness (including guarantees of additional indebtedness);
• pay dividends, repurchase stock or make other distributions;
• prepay subordinated debt;
• create liens on assets;
• make investments (including joint ventures);
• engage in mergers, consolidations or sales of all or substantially all of Sally Holdings’ assets;
• engage in certain transactions with affiliates; and
• permit restrictions on Sally Holdings’ subsidiaries’ ability to pay dividends.
The restrictions in the indentures governing our Notes and the terms of our ABL facility may prevent usfrom taking actions that we believe would be in the best interest of our business and may make it difficultfor us to successfully execute our business strategy or effectively compete with companies that are notsimilarly restricted. We may also incur future debt obligations that might subject us to additional restrictivecovenants that could affect our financial and operational flexibility. We cannot assure you that oursubsidiaries, which are borrowers under these agreements, will be granted waivers or amendments to theseagreements if they are unable to comply with these agreements, or that we will be able to refinance ourdebt on terms acceptable to us, or at all.
35
Our ability to comply with the covenants and restrictions contained in the ABL facility and the indenturesfor the Notes may be affected by economic, financial and industry conditions beyond our control. Thebreach of any of these covenants and restrictions could result in a default under either the ABL facility orthe indentures that would permit the applicable lenders or note holders, as the case may be, to declare allamounts outstanding thereunder to be due and payable, together with accrued and unpaid interest. If weare unable to repay debt, lenders having secured obligations, such as the lenders under the ABL facility,could proceed against the collateral securing the debt. In any such case, our subsidiaries may be unable toborrow under the ABL facility and may not be able to repay the amounts due under the Notes. This couldhave serious consequences to our financial condition and results of operations and could cause us tobecome bankrupt or insolvent.
Our ability to generate the significant amount of cash needed to service all of our debt and our ability to refinance allor a portion of our indebtedness or obtain additional financing depends on many factors beyond our control.
Our ability to make scheduled payments on, or to refinance our obligations under, our debt will depend onour financial and operating performance, which, in turn, will be subject to prevailing economic andcompetitive conditions and to the financial and business factors, many of which may be beyond our control,described under ‘‘—Risks Relating to Our Business’’ above.
If our cash flow and capital resources are insufficient to fund our debt service obligations, we may beforced to reduce or delay capital expenditures, sell assets, seek to obtain additional equity capital orrestructure our debt. In the future, our cash flow and capital resources may not be sufficient for paymentsof interest on and principal of our debt, and such alternative measures may not be successful and may notpermit us to meet our scheduled debt service obligations.
We cannot assure you that we will be able to refinance any of our indebtedness or obtain additionalfinancing, particularly because of our high levels of debt and the debt incurrence restrictions imposed bythe agreements governing our debt, as well as prevailing market conditions. In the absence of suchoperating results and resources, we could face substantial liquidity problems and might be required todispose of material assets or operations to meet our debt service and other obligations. Our ABL facilityand the indentures governing the Notes restrict our ability to dispose of assets and use the proceeds fromany such dispositions. We cannot assure you we will be able to consummate those sales, or if we do, whatthe timing of the sales will be or whether the proceeds that we realize will be adequate to meet debt serviceobligations when due.
The impairment of certain financial institutions could adversely affect us.
We have exposure to different financial institutions in their capacities as lenders in our ABL facility,depositories of our corporate cash balances and counterparties on our foreign currency hedgingtransactions. All of these transactions expose us to credit risk in the event of default of the financialinstitution(s). If these financial institutions become impaired or insolvent, this could have seriousconsequences to our financial condition and results of operations.
ITEM 1B. UNRESOLVED STAFF COMMENTS
Not applicable.
36
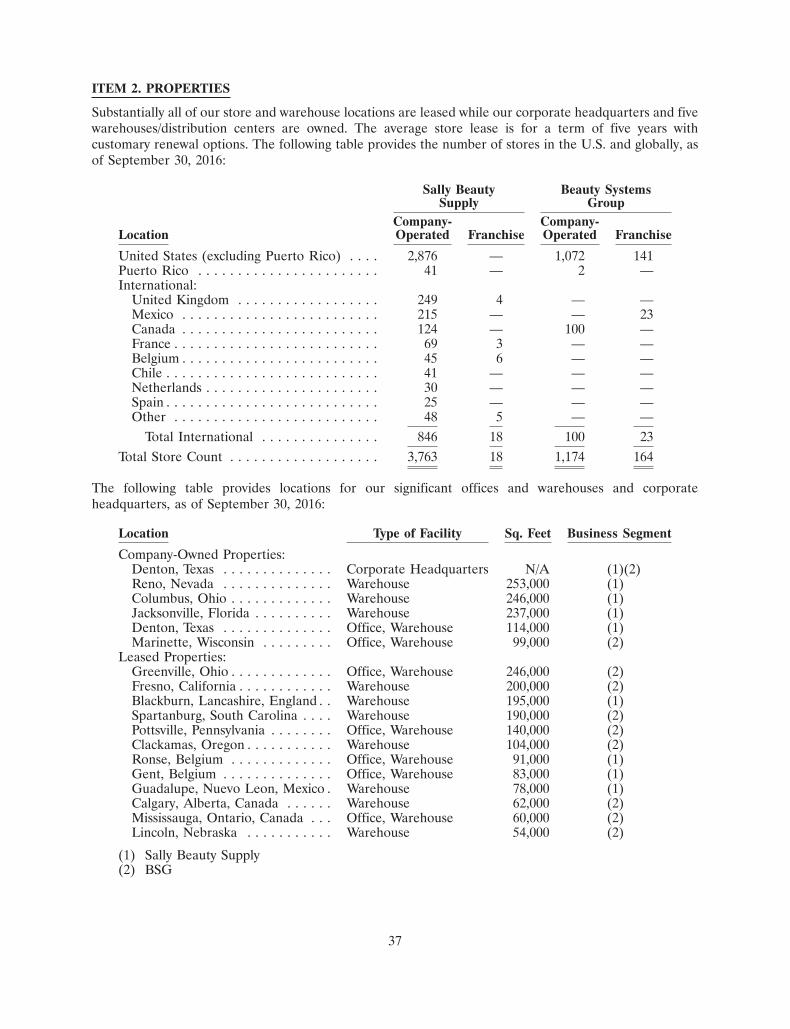
ITEM 2. PROPERTIES
Substantially all of our store and warehouse locations are leased while our corporate headquarters and fivewarehouses/distribution centers are owned. The average store lease is for a term of five years withcustomary renewal options. The following table provides the number of stores in the U.S. and globally, asof September 30, 2016:
Sally Beauty Beauty SystemsSupply Group
Company- Company-Location Operated Franchise Operated Franchise
United States (excluding Puerto Rico) . . . . 2,876 — 1,072 141Puerto Rico . . . . . . . . . . . . . . . . . . . . . . . 41 — 2 —International:
United Kingdom . . . . . . . . . . . . . . . . . . 249 4 — —Mexico . . . . . . . . . . . . . . . . . . . . . . . . . 215 — — 23Canada . . . . . . . . . . . . . . . . . . . . . . . . . 124 — 100 —France . . . . . . . . . . . . . . . . . . . . . . . . . . 69 3 — —Belgium . . . . . . . . . . . . . . . . . . . . . . . . . 45 6 — —Chile . . . . . . . . . . . . . . . . . . . . . . . . . . . 41 — — —Netherlands . . . . . . . . . . . . . . . . . . . . . . 30 — — —Spain . . . . . . . . . . . . . . . . . . . . . . . . . . . 25 — — —Other . . . . . . . . . . . . . . . . . . . . . . . . . . 48 5 — —
Total International . . . . . . . . . . . . . . . 846 18 100 23Total Store Count . . . . . . . . . . . . . . . . . . . 3,763 18 1,174 164
The following table provides locations for our significant offices and warehouses and corporateheadquarters, as of September 30, 2016:
Location Type of Facility Sq. Feet Business Segment
Company-Owned Properties:Denton, Texas . . . . . . . . . . . . . . Corporate Headquarters N/A (1)(2)Reno, Nevada . . . . . . . . . . . . . . Warehouse 253,000 (1)Columbus, Ohio . . . . . . . . . . . . . Warehouse 246,000 (1)Jacksonville, Florida . . . . . . . . . . Warehouse 237,000 (1)Denton, Texas . . . . . . . . . . . . . . Office, Warehouse 114,000 (1)Marinette, Wisconsin . . . . . . . . . Office, Warehouse 99,000 (2)
Leased Properties:Greenville, Ohio . . . . . . . . . . . . . Office, Warehouse 246,000 (2)Fresno, California . . . . . . . . . . . . Warehouse 200,000 (2)Blackburn, Lancashire, England . . Warehouse 195,000 (1)Spartanburg, South Carolina . . . . Warehouse 190,000 (2)Pottsville, Pennsylvania . . . . . . . . Office, Warehouse 140,000 (2)Clackamas, Oregon . . . . . . . . . . . Warehouse 104,000 (2)Ronse, Belgium . . . . . . . . . . . . . Office, Warehouse 91,000 (1)Gent, Belgium . . . . . . . . . . . . . . Office, Warehouse 83,000 (1)Guadalupe, Nuevo Leon, Mexico . Warehouse 78,000 (1)Calgary, Alberta, Canada . . . . . . Warehouse 62,000 (2)Mississauga, Ontario, Canada . . . Office, Warehouse 60,000 (2)Lincoln, Nebraska . . . . . . . . . . . Warehouse 54,000 (2)
(1) Sally Beauty Supply(2) BSG
37
ITEM 3. LEGAL PROCEEDINGS
We are involved, from time to time, in various claims and lawsuits incidental to the conduct of our businessin the ordinary course. We carry insurance coverage in such amounts in excess of our self-insured retentionas we believe to be reasonable under the circumstances and that may or may not cover any or all of ourliabilities in respect of these matters. We do not believe that the ultimate resolution of these matters willhave a material adverse impact on our consolidated financial position, cash flows or results of operations.
We are subject to a number of U.S., federal, state and local laws and regulations, as well as the laws andregulations applicable in each foreign country or jurisdiction in which we do business. These laws andregulations govern, among other things, the composition, packaging, labeling and safety of the products wesell, the methods we use to sell these products and the methods we use to import these products. Webelieve that we are in material compliance with such laws and regulations, although no assurance can beprovided that this will remain true going forward.
ITEM 4. MINE SAFETY DISCLOSURES
Not applicable
38
PART II
ITEM 5. MARKET FOR REGISTRANT’S COMMON EQUITY, RELATED STOCKHOLDER MATTERSAND ISSUER PURCHASES OF EQUITY SECURITIES
Market for the Registrant’s Common Equity
Market Information
Our common stock is listed on the New York Stock Exchange, Inc., or the NYSE, under the symbol‘‘SBH.’’ The following table sets forth the high and low sales prices of our common stock during the fiscalyears ended September 30, 2016 and 2015.
Quarter Ended High Low
Fiscal Year 2016:September 30, 2016 . . . . . . . . . . . . . . . . . . . . . . . . . . . . . . . . . $30.73 $25.58June 30, 2016 . . . . . . . . . . . . . . . . . . . . . . . . . . . . . . . . . . . . . . $32.75 $27.48March 31, 2016 . . . . . . . . . . . . . . . . . . . . . . . . . . . . . . . . . . . . $32.93 $24.69December 31, 2015 . . . . . . . . . . . . . . . . . . . . . . . . . . . . . . . . . . $28.70 $21.94
Fiscal Year 2015:September 30, 2015 . . . . . . . . . . . . . . . . . . . . . . . . . . . . . . . . . $32.41 $23.39June 30, 2015 . . . . . . . . . . . . . . . . . . . . . . . . . . . . . . . . . . . . . . $34.72 $29.75March 31, 2015 . . . . . . . . . . . . . . . . . . . . . . . . . . . . . . . . . . . . $35.27 $28.61December 31, 2014 . . . . . . . . . . . . . . . . . . . . . . . . . . . . . . . . . . $31.77 $27.05
Holders
As of November 9, 2016, there were 879 stockholders of record of our common stock.
Dividends
We have not declared or paid dividends at any time during the two fiscal years prior to the date of thisAnnual Report.
We currently anticipate that we will retain future earnings to support our growth strategy, to repayoutstanding debt or fund share repurchases. We do not anticipate paying regular cash dividends on ourcommon stock in the foreseeable future. Any payment of future cash dividends will be at the discretion ofour Board of Directors and will depend upon, among other things, future earnings, operations, capitalrequirements, our general financial condition, contractual restrictions (including those present in theagreements and instruments governing our debt) and general business conditions. We depend on oursubsidiaries for cash and unless we receive dividends, distributions, advances, transfers of funds or othercash payments from our subsidiaries, we will be unable to pay any cash dividends on our common stock inthe future. However, none of our subsidiaries are obligated to make funds available to us for the paymentof dividends. Further, the terms of our subsidiaries’ debt agreements and instruments significantly restrictthe ability of our subsidiaries to make certain restricted payments to us. Finally, we and our subsidiariesmay incur substantial additional indebtedness in the future that may severely restrict or prohibit oursubsidiaries from making distributions, paying dividends or making loans to us. Please see ‘‘Risk Factors—Risks Relating to Our Substantial Indebtedness’’ and Note 13 of the ‘‘Notes to Consolidated FinancialStatements’’ in ‘‘Item 8—Financial Statements and Supplementary Data.’’
39
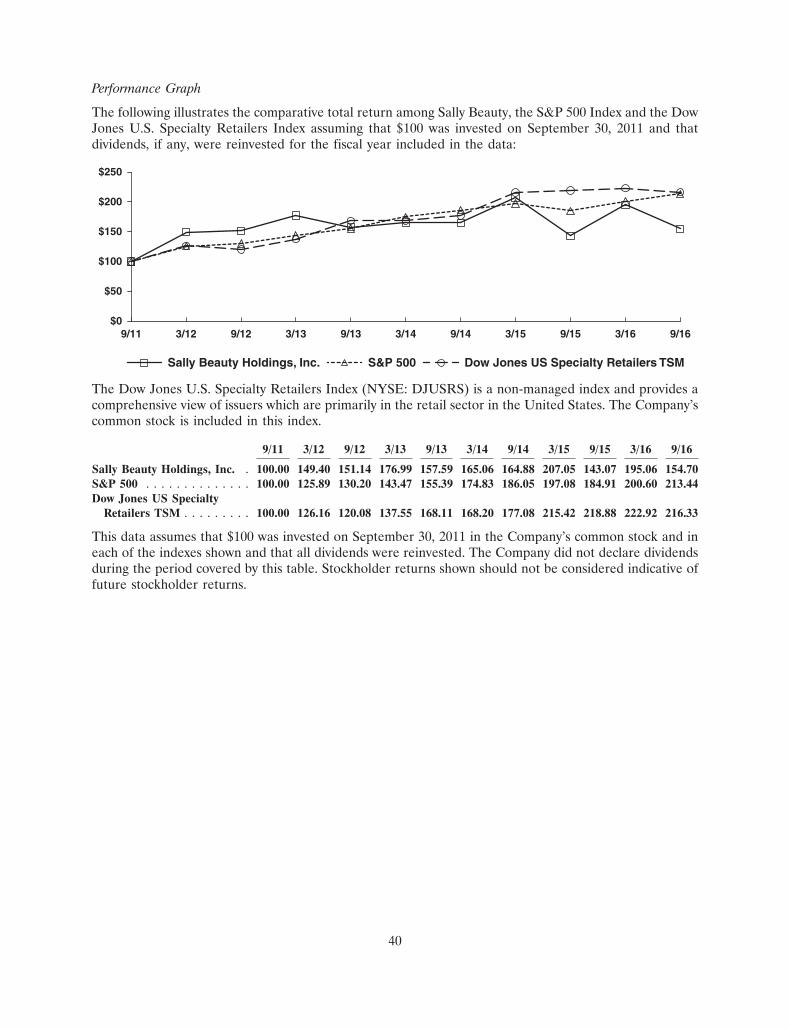
8NOV201619282860
Performance Graph
The following illustrates the comparative total return among Sally Beauty, the S&P 500 Index and the DowJones U.S. Specialty Retailers Index assuming that $100 was invested on September 30, 2011 and thatdividends, if any, were reinvested for the fiscal year included in the data:
$250
$200
$150
$100
$50
$09/11
Sally Beauty Holdings, Inc. Dow Jones US Specialty Retailers TSMS&P 500
9/123/12 9/133/13 9/143/14 9/163/169/153/15
The Dow Jones U.S. Specialty Retailers Index (NYSE: DJUSRS) is a non-managed index and provides acomprehensive view of issuers which are primarily in the retail sector in the United States. The Company’scommon stock is included in this index.
9/11 3/12 9/12 3/13 9/13 3/14 9/14 3/15 9/15 3/16 9/16
Sally Beauty Holdings, Inc. . 100.00 149.40 151.14 176.99 157.59 165.06 164.88 207.05 143.07 195.06 154.70S&P 500 . . . . . . . . . . . . . . 100.00 125.89 130.20 143.47 155.39 174.83 186.05 197.08 184.91 200.60 213.44Dow Jones US Specialty
Retailers TSM . . . . . . . . . 100.00 126.16 120.08 137.55 168.11 168.20 177.08 215.42 218.88 222.92 216.33
This data assumes that $100 was invested on September 30, 2011 in the Company’s common stock and ineach of the indexes shown and that all dividends were reinvested. The Company did not declare dividendsduring the period covered by this table. Stockholder returns shown should not be considered indicative offuture stockholder returns.
40
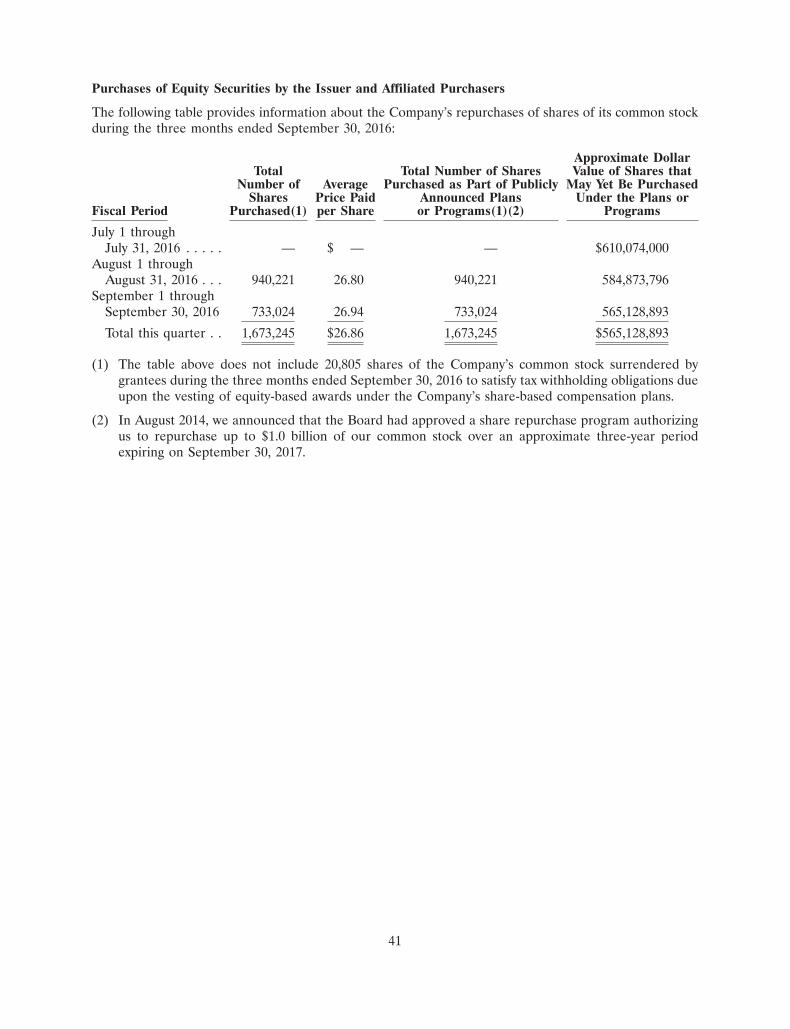
Purchases of Equity Securities by the Issuer and Affiliated Purchasers
The following table provides information about the Company’s repurchases of shares of its common stockduring the three months ended September 30, 2016:
Approximate DollarTotal Total Number of Shares Value of Shares that
Number of Average Purchased as Part of Publicly May Yet Be PurchasedShares Price Paid Announced Plans Under the Plans or
Fiscal Period Purchased(1) per Share or Programs(1)(2) Programs
July 1 throughJuly 31, 2016 . . . . . — $ — — $610,074,000
August 1 throughAugust 31, 2016 . . . 940,221 26.80 940,221 584,873,796
September 1 throughSeptember 30, 2016 733,024 26.94 733,024 565,128,893
Total this quarter . . 1,673,245 $26.86 1,673,245 $565,128,893
(1) The table above does not include 20,805 shares of the Company’s common stock surrendered bygrantees during the three months ended September 30, 2016 to satisfy tax withholding obligations dueupon the vesting of equity-based awards under the Company’s share-based compensation plans.
(2) In August 2014, we announced that the Board had approved a share repurchase program authorizingus to repurchase up to $1.0 billion of our common stock over an approximate three-year periodexpiring on September 30, 2017.
41
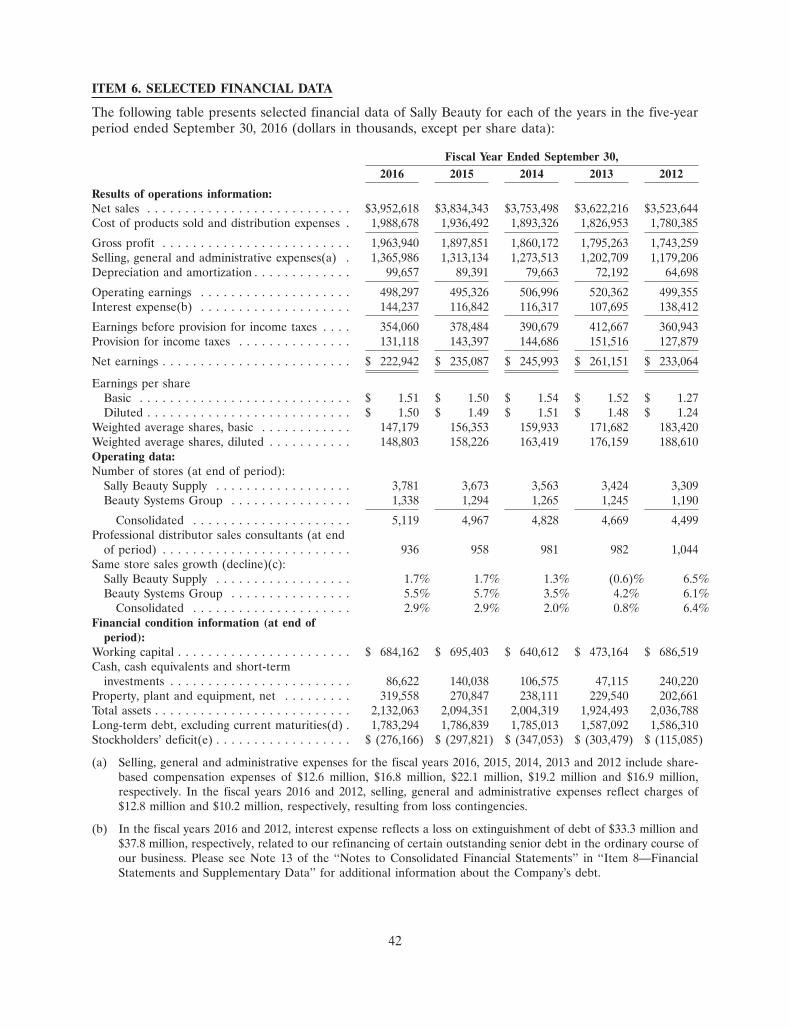
ITEM 6. SELECTED FINANCIAL DATA
The following table presents selected financial data of Sally Beauty for each of the years in the five-yearperiod ended September 30, 2016 (dollars in thousands, except per share data):
Fiscal Year Ended September 30,2016 2015 2014 2013 2012
Results of operations information:Net sales . . . . . . . . . . . . . . . . . . . . . . . . . . . $3,952,618 $3,834,343 $3,753,498 $3,622,216 $3,523,644Cost of products sold and distribution expenses . 1,988,678 1,936,492 1,893,326 1,826,953 1,780,385
Gross profit . . . . . . . . . . . . . . . . . . . . . . . . . 1,963,940 1,897,851 1,860,172 1,795,263 1,743,259Selling, general and administrative expenses(a) . 1,365,986 1,313,134 1,273,513 1,202,709 1,179,206Depreciation and amortization . . . . . . . . . . . . . 99,657 89,391 79,663 72,192 64,698
Operating earnings . . . . . . . . . . . . . . . . . . . . 498,297 495,326 506,996 520,362 499,355Interest expense(b) . . . . . . . . . . . . . . . . . . . . 144,237 116,842 116,317 107,695 138,412
Earnings before provision for income taxes . . . . 354,060 378,484 390,679 412,667 360,943Provision for income taxes . . . . . . . . . . . . . . . 131,118 143,397 144,686 151,516 127,879
Net earnings . . . . . . . . . . . . . . . . . . . . . . . . . $ 222,942 $ 235,087 $ 245,993 $ 261,151 $ 233,064
Earnings per shareBasic . . . . . . . . . . . . . . . . . . . . . . . . . . . . $ 1.51 $ 1.50 $ 1.54 $ 1.52 $ 1.27Diluted . . . . . . . . . . . . . . . . . . . . . . . . . . . $ 1.50 $ 1.49 $ 1.51 $ 1.48 $ 1.24
Weighted average shares, basic . . . . . . . . . . . . 147,179 156,353 159,933 171,682 183,420Weighted average shares, diluted . . . . . . . . . . . 148,803 158,226 163,419 176,159 188,610Operating data:Number of stores (at end of period):
Sally Beauty Supply . . . . . . . . . . . . . . . . . . 3,781 3,673 3,563 3,424 3,309Beauty Systems Group . . . . . . . . . . . . . . . . 1,338 1,294 1,265 1,245 1,190
Consolidated . . . . . . . . . . . . . . . . . . . . . 5,119 4,967 4,828 4,669 4,499Professional distributor sales consultants (at end
of period) . . . . . . . . . . . . . . . . . . . . . . . . . 936 958 981 982 1,044Same store sales growth (decline)(c):
Sally Beauty Supply . . . . . . . . . . . . . . . . . . 1.7% 1.7% 1.3% (0.6)% 6.5%Beauty Systems Group . . . . . . . . . . . . . . . . 5.5% 5.7% 3.5% 4.2% 6.1%
Consolidated . . . . . . . . . . . . . . . . . . . . . 2.9% 2.9% 2.0% 0.8% 6.4%Financial condition information (at end of
period):Working capital . . . . . . . . . . . . . . . . . . . . . . . $ 684,162 $ 695,403 $ 640,612 $ 473,164 $ 686,519Cash, cash equivalents and short-term
investments . . . . . . . . . . . . . . . . . . . . . . . . 86,622 140,038 106,575 47,115 240,220Property, plant and equipment, net . . . . . . . . . 319,558 270,847 238,111 229,540 202,661Total assets . . . . . . . . . . . . . . . . . . . . . . . . . . 2,132,063 2,094,351 2,004,319 1,924,493 2,036,788Long-term debt, excluding current maturities(d) . 1,783,294 1,786,839 1,785,013 1,587,092 1,586,310Stockholders’ deficit(e) . . . . . . . . . . . . . . . . . . $ (276,166) $ (297,821) $ (347,053) $ (303,479) $ (115,085)
(a) Selling, general and administrative expenses for the fiscal years 2016, 2015, 2014, 2013 and 2012 include share-based compensation expenses of $12.6 million, $16.8 million, $22.1 million, $19.2 million and $16.9 million,respectively. In the fiscal years 2016 and 2012, selling, general and administrative expenses reflect charges of$12.8 million and $10.2 million, respectively, resulting from loss contingencies.
(b) In the fiscal years 2016 and 2012, interest expense reflects a loss on extinguishment of debt of $33.3 million and$37.8 million, respectively, related to our refinancing of certain outstanding senior debt in the ordinary course ofour business. Please see Note 13 of the ‘‘Notes to Consolidated Financial Statements’’ in ‘‘Item 8—FinancialStatements and Supplementary Data’’ for additional information about the Company’s debt.
42
(c) For the purpose of calculating our same store sales metrics, we compare the current period sales for stores openfor 14 months or longer as of the last day of a month with the sales for these stores for the comparable period inthe prior fiscal year. Our same store sales are calculated in constant dollars and include internet-based sales(which are not material for each of the periods presented) and the effect of store expansions, if applicable, but donot generally include the sales from stores relocated until 14 months after the relocation. The sales from storesacquired are excluded from our same store sales calculation until 14 months after the acquisition.
(d) At September 30, 2016, 2015, 2014, 2013 and 2012, long-term debt is net of unamortized debt issuance costs of$23.7 million, $21.8 million, $25.7 million, $25.6 million and $29.0 million, respectively.
(e) Stockholders’ deficit for the fiscal years 2016, 2015, 2014 and 2013 reflects the repurchase and subsequentretirement of 7.8 million shares, 8.1 million shares, 12.6 million shares and 18.9 million shares of our commonstock at a cost of $207.3 million, $227.6 million, $333.3 million and $509.7 million, respectively, under sharerepurchase programs approved by the Company’s Board of Directors.
43
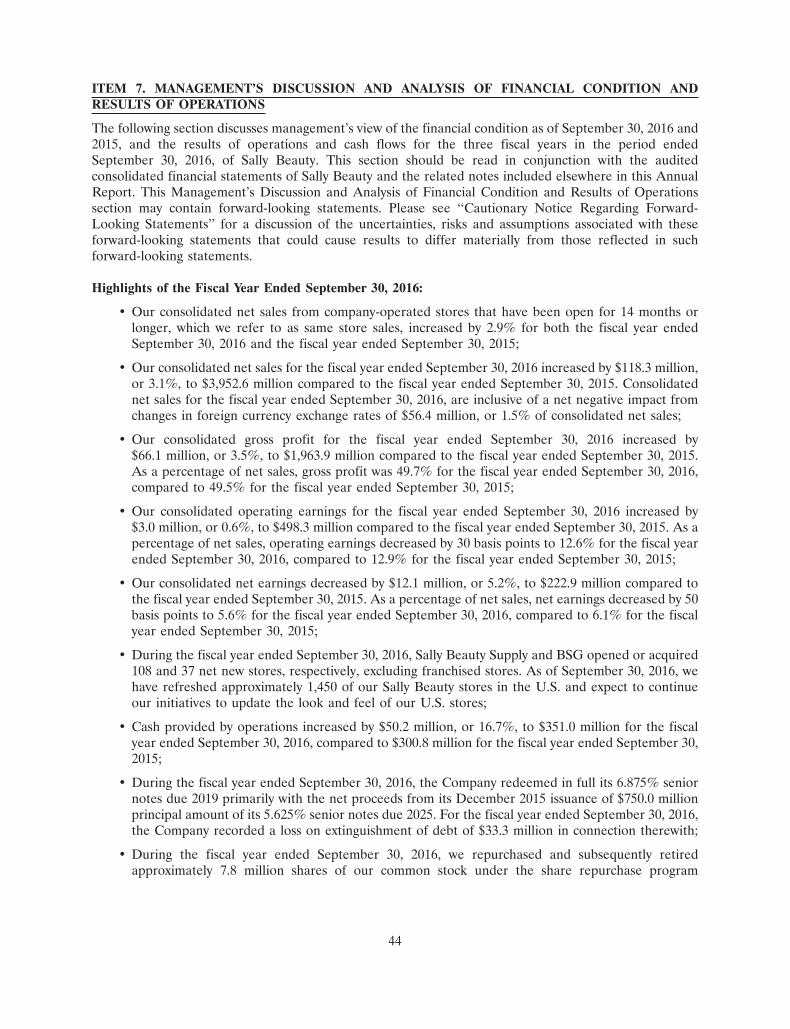
ITEM 7. MANAGEMENT’S DISCUSSION AND ANALYSIS OF FINANCIAL CONDITION ANDRESULTS OF OPERATIONS
The following section discusses management’s view of the financial condition as of September 30, 2016 and2015, and the results of operations and cash flows for the three fiscal years in the period endedSeptember 30, 2016, of Sally Beauty. This section should be read in conjunction with the auditedconsolidated financial statements of Sally Beauty and the related notes included elsewhere in this AnnualReport. This Management’s Discussion and Analysis of Financial Condition and Results of Operationssection may contain forward-looking statements. Please see ‘‘Cautionary Notice Regarding Forward-Looking Statements’’ for a discussion of the uncertainties, risks and assumptions associated with theseforward-looking statements that could cause results to differ materially from those reflected in suchforward-looking statements.
Highlights of the Fiscal Year Ended September 30, 2016:
• Our consolidated net sales from company-operated stores that have been open for 14 months orlonger, which we refer to as same store sales, increased by 2.9% for both the fiscal year endedSeptember 30, 2016 and the fiscal year ended September 30, 2015;
• Our consolidated net sales for the fiscal year ended September 30, 2016 increased by $118.3 million,or 3.1%, to $3,952.6 million compared to the fiscal year ended September 30, 2015. Consolidatednet sales for the fiscal year ended September 30, 2016, are inclusive of a net negative impact fromchanges in foreign currency exchange rates of $56.4 million, or 1.5% of consolidated net sales;
• Our consolidated gross profit for the fiscal year ended September 30, 2016 increased by$66.1 million, or 3.5%, to $1,963.9 million compared to the fiscal year ended September 30, 2015.As a percentage of net sales, gross profit was 49.7% for the fiscal year ended September 30, 2016,compared to 49.5% for the fiscal year ended September 30, 2015;
• Our consolidated operating earnings for the fiscal year ended September 30, 2016 increased by$3.0 million, or 0.6%, to $498.3 million compared to the fiscal year ended September 30, 2015. As apercentage of net sales, operating earnings decreased by 30 basis points to 12.6% for the fiscal yearended September 30, 2016, compared to 12.9% for the fiscal year ended September 30, 2015;
• Our consolidated net earnings decreased by $12.1 million, or 5.2%, to $222.9 million compared tothe fiscal year ended September 30, 2015. As a percentage of net sales, net earnings decreased by 50basis points to 5.6% for the fiscal year ended September 30, 2016, compared to 6.1% for the fiscalyear ended September 30, 2015;
• During the fiscal year ended September 30, 2016, Sally Beauty Supply and BSG opened or acquired108 and 37 net new stores, respectively, excluding franchised stores. As of September 30, 2016, wehave refreshed approximately 1,450 of our Sally Beauty stores in the U.S. and expect to continueour initiatives to update the look and feel of our U.S. stores;
• Cash provided by operations increased by $50.2 million, or 16.7%, to $351.0 million for the fiscalyear ended September 30, 2016, compared to $300.8 million for the fiscal year ended September 30,2015;
• During the fiscal year ended September 30, 2016, the Company redeemed in full its 6.875% seniornotes due 2019 primarily with the net proceeds from its December 2015 issuance of $750.0 millionprincipal amount of its 5.625% senior notes due 2025. For the fiscal year ended September 30, 2016,the Company recorded a loss on extinguishment of debt of $33.3 million in connection therewith;
• During the fiscal year ended September 30, 2016, we repurchased and subsequently retiredapproximately 7.8 million shares of our common stock under the share repurchase program
44
approved by our Board of Directors (the ‘‘Board’’) in August 2014, at an aggregate cost of$207.3 million; and
• We experienced a data security incident in fiscal year 2014 (the ‘‘2014 data security incident’’) andexperienced a second data security incident in fiscal year 2015 (the ‘‘2015 data security incident’’and, together with the 2014 data security incident, the ‘‘data security incidents’’). For the fiscal yearended September 30, 2016 and 2015, selling, general and administrative expenses reflect expensesof $14.6 million and $5.6 million (net of related insurance recovery of $0.6 million), respectively,related to the data security incidents.
Overview
Description of Business
At September 30, 2016, we operated primarily through two business units, Sally Beauty Supply and BeautySystems Group, or BSG. We believe the Company is the largest open-line distributor of professionalbeauty supplies in the U.S. based on store count. As of September 30, 2016, through Sally Beauty Supplyand BSG, we had a multi-channel platform of 4,937 company-operated stores and supplied 182 franchisedstores primarily in North America and selected South American and European countries. Within BSG, wealso have one of the largest networks of professional distributor sales consultants in North America. Weprovide our customers with a wide variety of leading third-party branded and exclusive-label professionalbeauty supplies, including hair color products, hair care products, styling appliances, skin and nail careproducts and other beauty items. Our Sally Beauty stores target retail consumers and salon professionals,while BSG exclusively targets salons and salon professionals. For the year ended September 30, 2016, ourconsolidated net sales and operating earnings were $3,952.6 million and $498.3 million, respectively.
As of September 30, 2016, Sally Beauty Supply operated 3,763 company-operated retail stores (generally,under the Sally Beauty banner), 2,917 of which are located in the U.S., with the remaining 846 company-operated stores located in Canada, Mexico, Chile, Colombia, Peru, the United Kingdom, Ireland, Belgium,France, Germany, the Netherlands and Spain. Sally Beauty Supply also supplied 18 franchised storeslocated in the United Kingdom, Belgium and certain other European countries. In the U.S. and Canada,our Sally Beauty stores average approximately 1,700 square feet in size and are located primarily in stripshopping centers. Our Sally Beauty stores carry an extensive selection of professional beauty supplies forboth retail customers and salon professionals, featuring an average of 8,000 SKUs of beauty productsacross product categories including hair color, hair care, skin and nail care, beauty sundries and stylingtools. Our Sally Beauty stores carry leading third-party brands, such as Clairol�, CHI�, China Glaze�,OPI� and Conair�, as well as an extensive selection of exclusive-label merchandise. Store formats,including average size and product selection, for Sally Beauty Supply outside the U.S. and Canada vary bymarketplace. For the year ended September 30, 2016, Sally Beauty Supply’s net sales and segmentoperating earnings were $2,364.5 million and $409.8 million, respectively, representing 60% and 62% ofour consolidated net sales and consolidated operating earnings before unallocated corporate expenses andshare-based compensation expense, respectively.
We believe BSG is the largest full-service distributor of professional beauty supplies in North America,exclusively targeting salons and salon professionals. As of September 30, 2016, BSG had 1,174 company-operated stores, supplied 164 franchised stores and had a sales force of approximately 936 professionaldistributor sales consultants selling exclusively to salons and salon professionals in the U.S., Canada,Mexico and certain European countries. Company-operated BSG stores, which primarily operate underthe CosmoProf banner, average approximately 2,600 square feet in size and are primarily located insecondary strip shopping centers. BSG stores provide a comprehensive selection of beauty productsfeaturing an average of 9,500 SKUs that include hair color and care, skin and nail care, beauty sundriesand styling tools. Through BSG’s large store base and sales force, BSG is able to access a significantportion of the highly fragmented U.S. salon industry. BSG stores carry leading third-party brands such as
45
Paul Mitchell�, Wella�, Sebastian�, Goldwell�, Joico� and Aquage�, intended for use in salons and forresale by the salons to consumers. BSG is also the exclusive source for certain well-known third-partybranded products pursuant to exclusive distribution agreements with certain suppliers within specifiedgeographic territories. For the year ended September 30, 2016, BSG’s net sales and segment operatingearnings were $1,588.1 million and $254.5 million, respectively, representing 40% and 38% of ourconsolidated net sales and consolidated operating earnings before unallocated corporate expenses andshare-based compensation expense, respectively.
Key Industry and Business Trends
We operate primarily within the large and growing U.S. beauty supply industry. We believe that a numberof key industry and business trends and characteristics will influence our business and our financial resultsgoing forward. These key trends and characteristics are discussed elsewhere in this Annual Report. Pleasesee ‘‘Key Industry and Business Trends’’ in Item 1 of this Annual Report.
Recent Acquisitions
We completed several individually immaterial acquisitions during the fiscal years 2016, 2015 and 2014 atthe aggregate cost of approximately $26.1 million, $7.1 million and $4.9 million, respectively. We recordedintangible assets subject to amortization of $10.1 million, $2.2 million and $1.4 million in connection withthese acquisitions completed in the fiscal years 2016, 2015 and 2014, respectively. In addition, we recordedgoodwill in the amount of $12.8 million, $2.8 million and $2.6 million, the majority of which is expected tobe deductible for tax purposes, in connection with these individually immaterial acquisitions. We fundedthese acquisitions primarily with cash from operations and borrowings under the ABL facility. Thevaluation of the assets acquired and liabilities assumed in connection with these acquisitions was based ontheir fair values at the acquisition date.
Share Repurchase Programs
In August 2014, we announced that the Board had approved a share repurchase program authorizing us torepurchase up to $1.0 billion of our common stock over an approximate three-year period expiring onSeptember 30, 2017 (the ‘‘2014 Share Repurchase Program’’).
During the fiscal years ended September 30, 2016 and 2015, we repurchased and subsequently retiredapproximately 7.8 million and 8.1 million shares, respectively, of our common stock under the 2014 ShareRepurchase Program at a cost of $207.3 million and $227.6 million, respectively. In addition, during thefiscal year ended September 30, 2014, we repurchased and retired approximately 12.6 million shares of ourcommon stock under the 2013 Share Repurchase Program (a share repurchase program approved by ourBoard in March 2013 and terminated in connection with the authorization of the 2014 Share RepurchaseProgram) at a cost of $333.3 million. We reduced common stock and additional paid-in capital, in theaggregate, by these amounts. However, as required by GAAP, to the extent that the share repurchaseamounts exceeded the balance of additional paid-in capital prior to such repurchases, we recorded theexcess in accumulated deficit. We funded these share repurchases with cash from operations, borrowingsunder the ABL facility and a portion of the cash proceeds from our October 2013 debt issuance.
Data Security Incidents
In the fiscal year 2014, we disclosed that we had experienced a data security incident (the ‘‘2014 datasecurity incident’’). In the fiscal year 2015, we disclosed that we had experienced a second data securityincident (the ‘‘2015 data security incident’’ and, together with the 2014 data security incident, the ‘‘datasecurity incidents’’). The data security incidents involved the unauthorized installation of malicioussoftware (malware) on our information technology systems, including our point-of-sale systems that, webelieve may have placed at risk certain payment card data for some transactions. The costs that the
46
Company has incurred to date in connection with the data security incidents include assessments bypayment card networks, professional advisory fees, legal costs and expenses relating to investigating andremediating the data security incidents.
For the fiscal years ended September 30, 2016, 2015 and 2014, selling, general and administrative expensesreflect expenses of $14.6 million, $5.6 million (net of related insurance recovery of $0.6 million) and$2.5 million, respectively, related to the data security incidents, including an accrued liability ofapproximately $2.9 million related to loss contingencies associated with the 2014 data security incidentrecorded during the fiscal year ended September 30, 2015 and an accrued liability of approximately$12.8 million related to loss contingencies associated with the 2015 data security incident recorded duringthe fiscal year ended September 30, 2016. As of September 30, 2016, the Company has an aggregateaccrued liability relating to the data security incidents of $15.6 million. The Company’s estimated probablelosses related to the claims made by the payment card networks in connection with the data securityincidents are based on currently available information. The Company disputes the validity of these claimsand intends to contest them. Estimates related to these claims may change as new information becomesavailable or circumstances change.
We expect to incur additional costs and expenses related to the data security incidents in future periods.These costs may result from potential additional liabilities to payment card networks, governmental orthird party investigations, proceedings or litigation and legal and other fees necessary to defend against anypotential liabilities or claims, and further investigatory and remediation costs. As of September 30, 2016,the scope of these additional costs, or a range thereof, cannot be reasonably estimated and, while we donot anticipate these additional costs or liabilities would have a material adverse impact on our business,financial condition and operating results, these additional costs could be significant. Please see ‘‘RiskFactors—We may be adversely affected by any disruption in our information technology systems,’’‘‘Unauthorized access to confidential information and data on our information technology systems and securityand data breaches could materially adversely affect our business, financial condition and operating results’’ and‘‘We have experienced data security incidents and are not yet able to determine the full extent or scope of thepotential liabilities relating to these data security incidents.’’
Germany Restructuring
In the fiscal year 2015, the Board approved an initiative to restructure our Sally Beauty Supply operationsin Germany (the ‘‘Germany restructuring’’), which included the closing of 15 underperforming retail storesand two supporting administrative offices. This initiative is part of our ongoing cost rationalization effortsdesigned to increase the profitability of our Sally Beauty Supply segment’s international operations. Aftercompletion of the Germany restructuring, which was substantially completed during the fourth quarter ofthe fiscal year 2015, we have continued to operate 18 retail stores in Germany.
In connection with the Germany restructuring we incurred pre-tax expenses in the aggregate amount ofapproximately A4.7 million ($5.3 million, at the weighted average exchange rate during the relevantperiod), including costs associated with lease obligations, asset impairments, employee severance, andother business transition and exit costs. Of this amount, approximately A2.2 million ($2.5 million, at theweighted average exchange rate during the relevant period) were non-cash expenses resulting from assetimpairments. In addition, approximately A0.4 million ($0.4 million, at the weighted average exchange rateduring the relevant period) represent one-time employee severance payments. The Germany restructuringexpenses are included in cost of products sold and distribution expenses (A1.2 million, $1.4 million, at theweighted average exchange rate during the relevant period) and in selling, general and administrativeexpenses (A3.5 million, $3.9 million, at the weighted average exchange rate during the relevant period) inthe Company’s consolidated statements of earnings for the fiscal year 2015, based on the nature of thecosts incurred.
47
Other Significant Items
Derivative Instruments
As a multinational corporation, we are subject to certain market risks including changes in market interestrates and foreign currency fluctuations. We may consider a variety of practices in the ordinary course ofour business to manage these market risks including, when deemed appropriate, the use of derivativeinstruments such as foreign currency forwards and options (hereafter, ‘‘foreign exchange contracts’’) andinterest rate swaps. Currently, we do not purchase or hold any derivative instruments for speculative ortrading purposes.
Foreign Currency Derivative Instruments
We are exposed to potential gains or losses from foreign currency fluctuations affecting net investments insubsidiaries (including intercompany balances not permanently invested) and earnings denominated inforeign currencies, as well as exposure resulting from the purchase of merchandise by certain of oursubsidiaries in a currency other than their functional currency and from the sale of products and servicesamong the parent company and subsidiaries with a functional currency different from the parent or amongsubsidiaries with different functional currencies. Our primary exposures are to changes in exchange ratesfor the U.S. dollar versus the Euro, the British pound sterling, the Canadian dollar, the Chilean peso andthe Mexican peso. In addition, from time to time we may have exposure to changes in the exchange rate forthe British pound sterling versus the Euro in connection with the sale of products and services amongcertain European subsidiaries of the Company. The recent vote by Britain to leave the European Unionand related or other disruptive events in the European Union could result in increased foreign currencyfluctuation, including fluctuation in currencies in which we operate. Our various foreign currencyexposures at times offset each other, sometimes providing a natural hedge against foreign currency risk. Inconnection with the remaining foreign currency risk, the Company from time to time uses foreign exchangecontracts to effectively fix the foreign currency exchange rate applicable to specific anticipated foreigncurrency-denominated cash flows, thus limiting the potential fluctuations in such cash flows resulting fromforeign currency market movements.
The Company uses foreign exchange contracts to manage the exposure to the U.S. dollar resulting fromcertain of its Sinelco Group subsidiaries’ purchases of merchandise from third-party suppliers. Sinelco’sfunctional currency is the Euro. As such, at September 30, 2016, we hold foreign currency forwards whichenable us to sell approximately A16.0 million ($18.0 million, at the September 30, 2016 exchange rate) atthe weighted average contractual exchange rate of 1.1219. The foreign currency forwards discussed in thisparagraph are with a single counterparty and expire ratably through September 15, 2017.
The Company also uses foreign exchange contracts to mitigate its exposure to changes in foreign currencyexchange rates in connection with certain intercompany balances not permanently invested. As such, atSeptember 30, 2016, we hold: (a) a foreign currency forward which enables us to sell approximatelyA22.4 million ($25.1 million, at the September 30, 2016 exchange rate) at the contractual exchange rate of1.1267, (b) a foreign currency forward which enables us to sell approximately $4.1 million Canadian dollars($3.1 million, at the September 30, 2016 exchange rate) at the contractual exchange rate of 1.3121,(c) foreign currency forwards which enable us to buy approximately $15.5 million Canadian dollars($11.8 million, at the September 30, 2016 exchange rate) at the weighted average contractual exchange rateof 1.3078, (d) a foreign currency forward which enables us to sell approximately 17.9 million Mexican pesos($0.9 million, at the September 30, 2016 exchange rate) at the contractual exchange rate of 19.4605 and(e) a foreign currency forward which enables us to buy approximately £7.2 million ($9.3 million, at theSeptember 30, 2016 exchange rate) at the contractual exchange rate of 1.3030. All the foreign currencyforwards discussed in this paragraph are with a single counterparty (not the same counterparty as that onthe forwards discussed in the preceding paragraph) and expire on or before December 30, 2016.
48
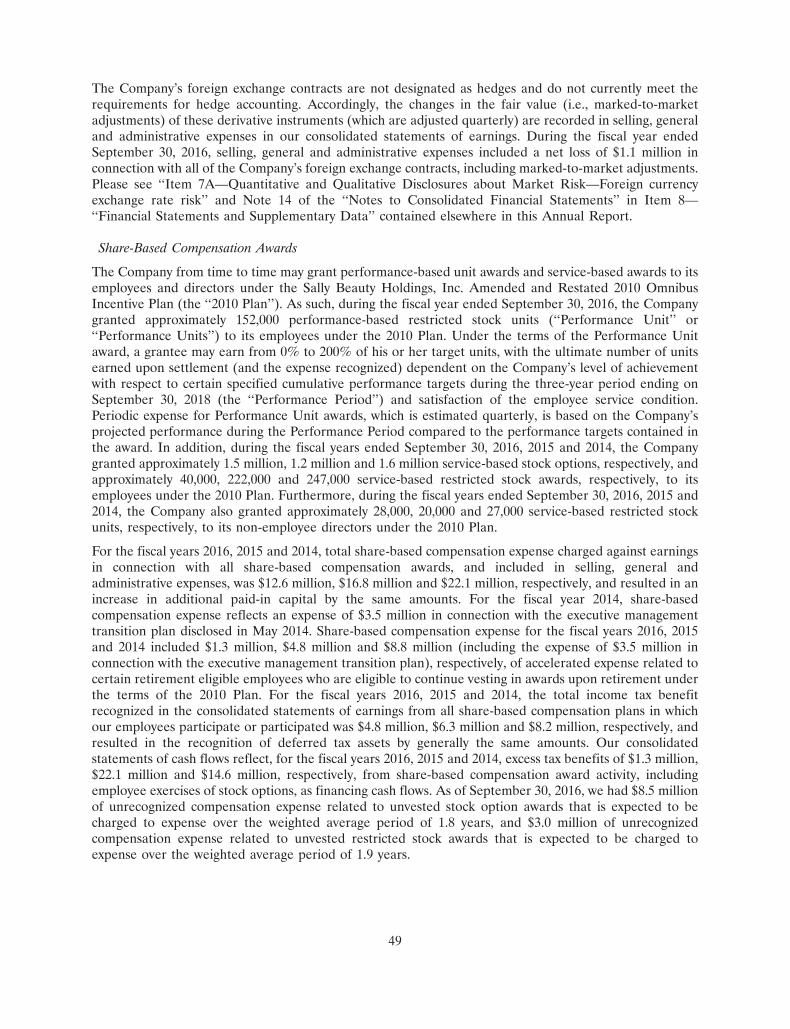
The Company’s foreign exchange contracts are not designated as hedges and do not currently meet therequirements for hedge accounting. Accordingly, the changes in the fair value (i.e., marked-to-marketadjustments) of these derivative instruments (which are adjusted quarterly) are recorded in selling, generaland administrative expenses in our consolidated statements of earnings. During the fiscal year endedSeptember 30, 2016, selling, general and administrative expenses included a net loss of $1.1 million inconnection with all of the Company’s foreign exchange contracts, including marked-to-market adjustments.Please see ‘‘Item 7A—Quantitative and Qualitative Disclosures about Market Risk—Foreign currencyexchange rate risk’’ and Note 14 of the ‘‘Notes to Consolidated Financial Statements’’ in Item 8—‘‘Financial Statements and Supplementary Data’’ contained elsewhere in this Annual Report.
Share-Based Compensation Awards
The Company from time to time may grant performance-based unit awards and service-based awards to itsemployees and directors under the Sally Beauty Holdings, Inc. Amended and Restated 2010 OmnibusIncentive Plan (the ‘‘2010 Plan’’). As such, during the fiscal year ended September 30, 2016, the Companygranted approximately 152,000 performance-based restricted stock units (‘‘Performance Unit’’ or‘‘Performance Units’’) to its employees under the 2010 Plan. Under the terms of the Performance Unitaward, a grantee may earn from 0% to 200% of his or her target units, with the ultimate number of unitsearned upon settlement (and the expense recognized) dependent on the Company’s level of achievementwith respect to certain specified cumulative performance targets during the three-year period ending onSeptember 30, 2018 (the ‘‘Performance Period’’) and satisfaction of the employee service condition.Periodic expense for Performance Unit awards, which is estimated quarterly, is based on the Company’sprojected performance during the Performance Period compared to the performance targets contained inthe award. In addition, during the fiscal years ended September 30, 2016, 2015 and 2014, the Companygranted approximately 1.5 million, 1.2 million and 1.6 million service-based stock options, respectively, andapproximately 40,000, 222,000 and 247,000 service-based restricted stock awards, respectively, to itsemployees under the 2010 Plan. Furthermore, during the fiscal years ended September 30, 2016, 2015 and2014, the Company also granted approximately 28,000, 20,000 and 27,000 service-based restricted stockunits, respectively, to its non-employee directors under the 2010 Plan.
For the fiscal years 2016, 2015 and 2014, total share-based compensation expense charged against earningsin connection with all share-based compensation awards, and included in selling, general andadministrative expenses, was $12.6 million, $16.8 million and $22.1 million, respectively, and resulted in anincrease in additional paid-in capital by the same amounts. For the fiscal year 2014, share-basedcompensation expense reflects an expense of $3.5 million in connection with the executive managementtransition plan disclosed in May 2014. Share-based compensation expense for the fiscal years 2016, 2015and 2014 included $1.3 million, $4.8 million and $8.8 million (including the expense of $3.5 million inconnection with the executive management transition plan), respectively, of accelerated expense related tocertain retirement eligible employees who are eligible to continue vesting in awards upon retirement underthe terms of the 2010 Plan. For the fiscal years 2016, 2015 and 2014, the total income tax benefitrecognized in the consolidated statements of earnings from all share-based compensation plans in whichour employees participate or participated was $4.8 million, $6.3 million and $8.2 million, respectively, andresulted in the recognition of deferred tax assets by generally the same amounts. Our consolidatedstatements of cash flows reflect, for the fiscal years 2016, 2015 and 2014, excess tax benefits of $1.3 million,$22.1 million and $14.6 million, respectively, from share-based compensation award activity, includingemployee exercises of stock options, as financing cash flows. As of September 30, 2016, we had $8.5 millionof unrecognized compensation expense related to unvested stock option awards that is expected to becharged to expense over the weighted average period of 1.8 years, and $3.0 million of unrecognizedcompensation expense related to unvested restricted stock awards that is expected to be charged toexpense over the weighted average period of 1.9 years.
49
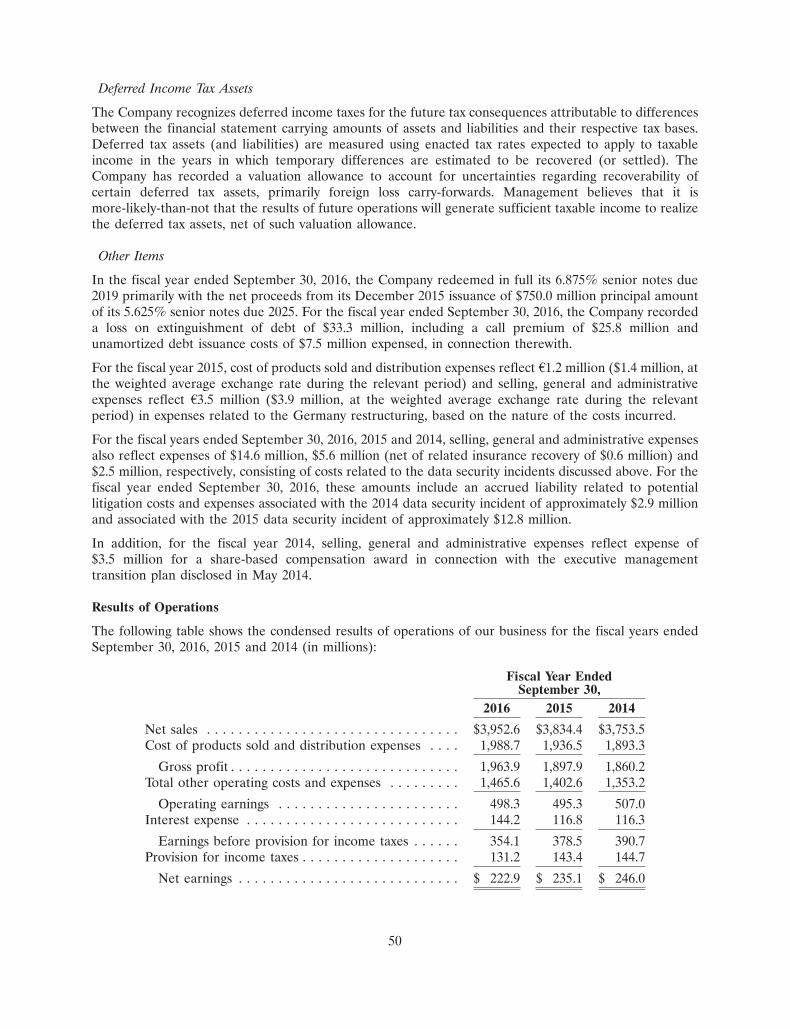
Deferred Income Tax Assets
The Company recognizes deferred income taxes for the future tax consequences attributable to differencesbetween the financial statement carrying amounts of assets and liabilities and their respective tax bases.Deferred tax assets (and liabilities) are measured using enacted tax rates expected to apply to taxableincome in the years in which temporary differences are estimated to be recovered (or settled). TheCompany has recorded a valuation allowance to account for uncertainties regarding recoverability ofcertain deferred tax assets, primarily foreign loss carry-forwards. Management believes that it ismore-likely-than-not that the results of future operations will generate sufficient taxable income to realizethe deferred tax assets, net of such valuation allowance.
Other Items
In the fiscal year ended September 30, 2016, the Company redeemed in full its 6.875% senior notes due2019 primarily with the net proceeds from its December 2015 issuance of $750.0 million principal amountof its 5.625% senior notes due 2025. For the fiscal year ended September 30, 2016, the Company recordeda loss on extinguishment of debt of $33.3 million, including a call premium of $25.8 million andunamortized debt issuance costs of $7.5 million expensed, in connection therewith.
For the fiscal year 2015, cost of products sold and distribution expenses reflect A1.2 million ($1.4 million, atthe weighted average exchange rate during the relevant period) and selling, general and administrativeexpenses reflect A3.5 million ($3.9 million, at the weighted average exchange rate during the relevantperiod) in expenses related to the Germany restructuring, based on the nature of the costs incurred.
For the fiscal years ended September 30, 2016, 2015 and 2014, selling, general and administrative expensesalso reflect expenses of $14.6 million, $5.6 million (net of related insurance recovery of $0.6 million) and$2.5 million, respectively, consisting of costs related to the data security incidents discussed above. For thefiscal year ended September 30, 2016, these amounts include an accrued liability related to potentiallitigation costs and expenses associated with the 2014 data security incident of approximately $2.9 millionand associated with the 2015 data security incident of approximately $12.8 million.
In addition, for the fiscal year 2014, selling, general and administrative expenses reflect expense of$3.5 million for a share-based compensation award in connection with the executive managementtransition plan disclosed in May 2014.
Results of Operations
The following table shows the condensed results of operations of our business for the fiscal years endedSeptember 30, 2016, 2015 and 2014 (in millions):
Fiscal Year EndedSeptember 30,
2016 2015 2014
Net sales . . . . . . . . . . . . . . . . . . . . . . . . . . . . . . . . $3,952.6 $3,834.4 $3,753.5Cost of products sold and distribution expenses . . . . 1,988.7 1,936.5 1,893.3
Gross profit . . . . . . . . . . . . . . . . . . . . . . . . . . . . . 1,963.9 1,897.9 1,860.2Total other operating costs and expenses . . . . . . . . . 1,465.6 1,402.6 1,353.2
Operating earnings . . . . . . . . . . . . . . . . . . . . . . . 498.3 495.3 507.0Interest expense . . . . . . . . . . . . . . . . . . . . . . . . . . . 144.2 116.8 116.3
Earnings before provision for income taxes . . . . . . 354.1 378.5 390.7Provision for income taxes . . . . . . . . . . . . . . . . . . . . 131.2 143.4 144.7
Net earnings . . . . . . . . . . . . . . . . . . . . . . . . . . . . $ 222.9 $ 235.1 $ 246.0
50
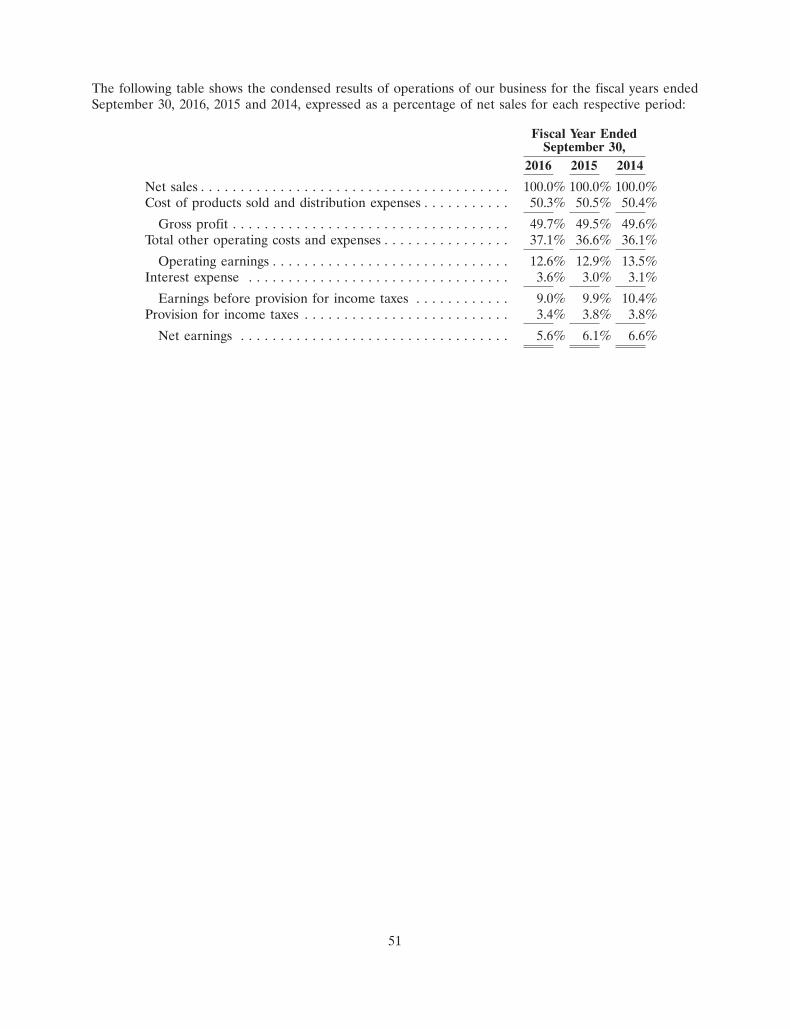
The following table shows the condensed results of operations of our business for the fiscal years endedSeptember 30, 2016, 2015 and 2014, expressed as a percentage of net sales for each respective period:
Fiscal Year EndedSeptember 30,
2016 2015 2014
Net sales . . . . . . . . . . . . . . . . . . . . . . . . . . . . . . . . . . . . . . . 100.0% 100.0% 100.0%Cost of products sold and distribution expenses . . . . . . . . . . . 50.3% 50.5% 50.4%
Gross profit . . . . . . . . . . . . . . . . . . . . . . . . . . . . . . . . . . . 49.7% 49.5% 49.6%Total other operating costs and expenses . . . . . . . . . . . . . . . . 37.1% 36.6% 36.1%
Operating earnings . . . . . . . . . . . . . . . . . . . . . . . . . . . . . . 12.6% 12.9% 13.5%Interest expense . . . . . . . . . . . . . . . . . . . . . . . . . . . . . . . . . 3.6% 3.0% 3.1%
Earnings before provision for income taxes . . . . . . . . . . . . 9.0% 9.9% 10.4%Provision for income taxes . . . . . . . . . . . . . . . . . . . . . . . . . . 3.4% 3.8% 3.8%
Net earnings . . . . . . . . . . . . . . . . . . . . . . . . . . . . . . . . . . 5.6% 6.1% 6.6%
51
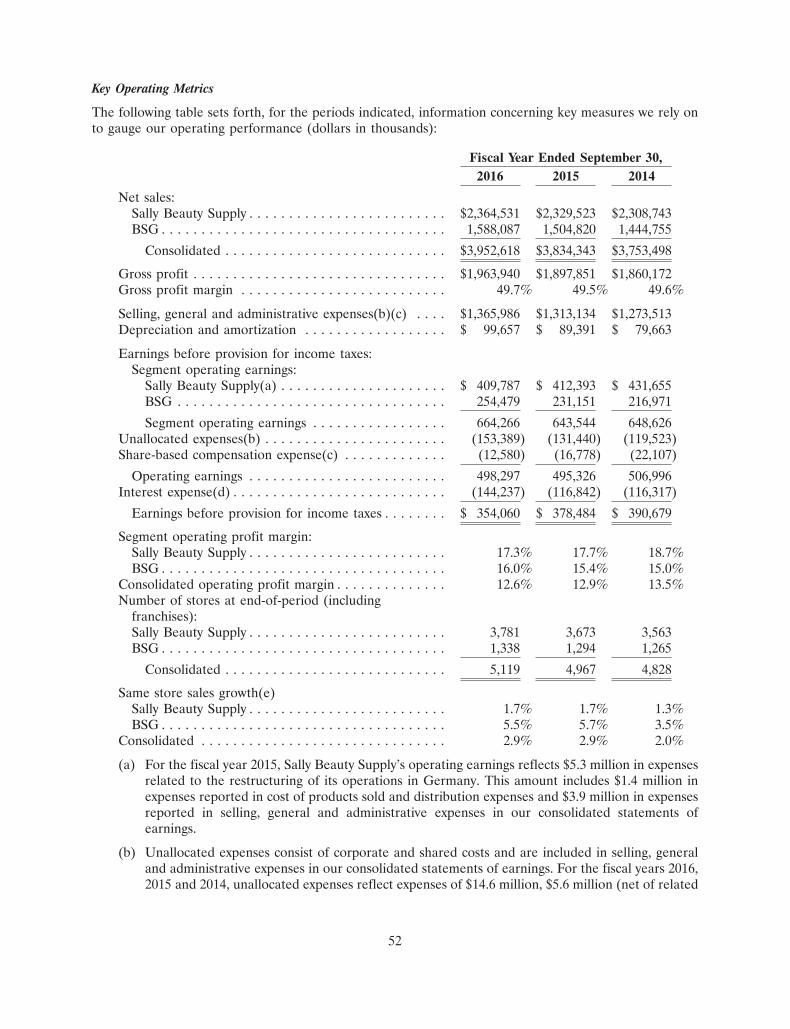
Key Operating Metrics
The following table sets forth, for the periods indicated, information concerning key measures we rely onto gauge our operating performance (dollars in thousands):
Fiscal Year Ended September 30,2016 2015 2014
Net sales:Sally Beauty Supply . . . . . . . . . . . . . . . . . . . . . . . . . $2,364,531 $2,329,523 $2,308,743BSG . . . . . . . . . . . . . . . . . . . . . . . . . . . . . . . . . . . . 1,588,087 1,504,820 1,444,755
Consolidated . . . . . . . . . . . . . . . . . . . . . . . . . . . . $3,952,618 $3,834,343 $3,753,498
Gross profit . . . . . . . . . . . . . . . . . . . . . . . . . . . . . . . . $1,963,940 $1,897,851 $1,860,172Gross profit margin . . . . . . . . . . . . . . . . . . . . . . . . . . 49.7% 49.5% 49.6%
Selling, general and administrative expenses(b)(c) . . . . $1,365,986 $1,313,134 $1,273,513Depreciation and amortization . . . . . . . . . . . . . . . . . . $ 99,657 $ 89,391 $ 79,663
Earnings before provision for income taxes:Segment operating earnings:
Sally Beauty Supply(a) . . . . . . . . . . . . . . . . . . . . . $ 409,787 $ 412,393 $ 431,655BSG . . . . . . . . . . . . . . . . . . . . . . . . . . . . . . . . . . 254,479 231,151 216,971
Segment operating earnings . . . . . . . . . . . . . . . . . 664,266 643,544 648,626Unallocated expenses(b) . . . . . . . . . . . . . . . . . . . . . . . (153,389) (131,440) (119,523)Share-based compensation expense(c) . . . . . . . . . . . . . (12,580) (16,778) (22,107)
Operating earnings . . . . . . . . . . . . . . . . . . . . . . . . . 498,297 495,326 506,996Interest expense(d) . . . . . . . . . . . . . . . . . . . . . . . . . . . (144,237) (116,842) (116,317)
Earnings before provision for income taxes . . . . . . . . $ 354,060 $ 378,484 $ 390,679
Segment operating profit margin:Sally Beauty Supply . . . . . . . . . . . . . . . . . . . . . . . . . 17.3% 17.7% 18.7%BSG . . . . . . . . . . . . . . . . . . . . . . . . . . . . . . . . . . . . 16.0% 15.4% 15.0%
Consolidated operating profit margin . . . . . . . . . . . . . . 12.6% 12.9% 13.5%Number of stores at end-of-period (including
franchises):Sally Beauty Supply . . . . . . . . . . . . . . . . . . . . . . . . . 3,781 3,673 3,563BSG . . . . . . . . . . . . . . . . . . . . . . . . . . . . . . . . . . . . 1,338 1,294 1,265
Consolidated . . . . . . . . . . . . . . . . . . . . . . . . . . . . 5,119 4,967 4,828
Same store sales growth(e)Sally Beauty Supply . . . . . . . . . . . . . . . . . . . . . . . . . 1.7% 1.7% 1.3%BSG . . . . . . . . . . . . . . . . . . . . . . . . . . . . . . . . . . . . 5.5% 5.7% 3.5%
Consolidated . . . . . . . . . . . . . . . . . . . . . . . . . . . . . . . 2.9% 2.9% 2.0%
(a) For the fiscal year 2015, Sally Beauty Supply’s operating earnings reflects $5.3 million in expensesrelated to the restructuring of its operations in Germany. This amount includes $1.4 million inexpenses reported in cost of products sold and distribution expenses and $3.9 million in expensesreported in selling, general and administrative expenses in our consolidated statements ofearnings.
(b) Unallocated expenses consist of corporate and shared costs and are included in selling, generaland administrative expenses in our consolidated statements of earnings. For the fiscal years 2016,2015 and 2014, unallocated expenses reflect expenses of $14.6 million, $5.6 million (net of related
52
insurance recovery of $0.6 million) and $2.5 million, respectively, in connection with the datasecurity incidents.
(c) For the fiscal year 2014, share-based compensation expense reflects a charge of $3.5 million inconnection with the executive management transition plan. Share-based compensation expense isincluded in selling, general and administrative expenses in our consolidated statements ofearnings.
(d) For the fiscal year 2016, interest expense includes a loss on extinguishment of debt of$33.3 million in connection with the Company’s December 2015 redemption of its senior notesdue 2019.
(e) For the purpose of calculating our same store sales metrics, we compare the current period salesfor stores open for 14 months or longer as of the last day of a month with the sales for thesestores for the comparable period in the prior fiscal year. Our same store sales are calculated inconstant dollars and include internet-based sales and the effect of store expansions, if applicable,but do not generally include the sales from stores relocated until 14 months after the relocation.The sales from stores acquired are excluded from our same store sales calculation until14 months after the acquisition.
Description of Net Sales and Expenses
Net Sales. Our net sales consist primarily of the following:
Sally Beauty Supply. Sally Beauty Supply generates net sales primarily by selling products through itsstores to both retail customers and salon professionals. Sally Beauty Supply sells products for haircolor and care, skin and nail care, beauty sundries and styling tools. Because approximately 46% ofour Sally Beauty Supply product sales come from exclusive-label brands, most of these same productsare generally not available in most other retail stores or in our BSG business segment. Various factorsinfluence Sally Beauty Supply’s net sales including overall consumer traffic, local competition,inclement weather, product assortment and availability, price, hours of operation, and marketing andpromotional activity. Sally Beauty Supply’s product assortment and sales are generally not seasonal innature.
Beauty Systems Group. BSG generates net sales primarily by selling products to salons and salonprofessionals through company-operated and franchised stores as well as through its network ofprofessional distributor sales consultants. BSG sells products for hair color and care, skin and nailcare, beauty sundries and styling tools. These products are not sold directly to the general public andare generally not the same products as those sold in our Sally Beauty stores. Various factors influenceBSG’s net sales, including product features and availability, competition, inclement weather,relationships with suppliers, new product introductions and price. BSG’s product assortment and salesare generally not seasonal in nature.
Cost of Products Sold and Distribution Expenses. We do not manufacture the products we sell, and insteadpurchase these products from recognized brand manufacturers and private label fillers. Cost of productssold and distribution expenses consist of the cost to purchase merchandise from these suppliers, as well ascertain overhead expenses including procurement costs, freight from distribution centers to stores andmerchandise handling costs at the distribution centers. Cost of products sold and distribution expenses arereduced by vendor rebates and allowances earned and include inventory shrinkage expense, whichrepresents product that is lost, stolen or damaged primarily while in the stores.
Selling, General and Administrative Expenses. Selling, general and administrative expenses consistprimarily of employee compensation (including share-based compensation expense), commissions paid toprofessional distributor sales consultants, employee benefits, rent, utilities, property maintenance,
53
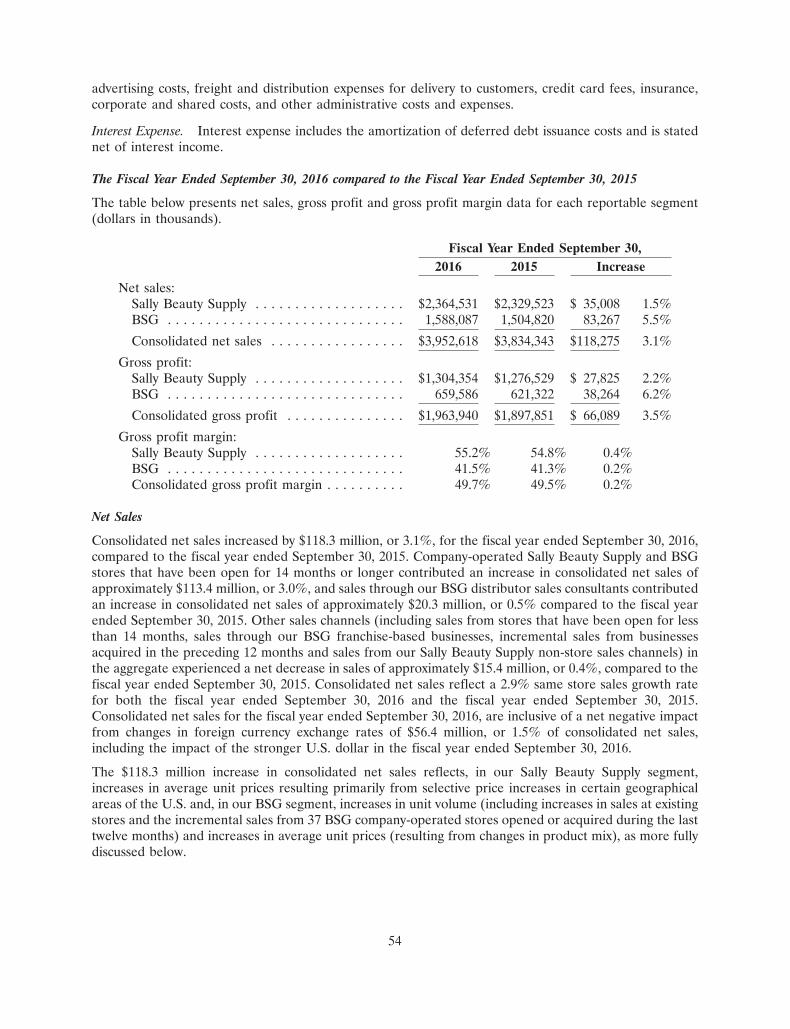
advertising costs, freight and distribution expenses for delivery to customers, credit card fees, insurance,corporate and shared costs, and other administrative costs and expenses.
Interest Expense. Interest expense includes the amortization of deferred debt issuance costs and is statednet of interest income.
The Fiscal Year Ended September 30, 2016 compared to the Fiscal Year Ended September 30, 2015
The table below presents net sales, gross profit and gross profit margin data for each reportable segment(dollars in thousands).
Fiscal Year Ended September 30,2016 2015 Increase
Net sales:Sally Beauty Supply . . . . . . . . . . . . . . . . . . . $2,364,531 $2,329,523 $ 35,008 1.5%BSG . . . . . . . . . . . . . . . . . . . . . . . . . . . . . . 1,588,087 1,504,820 83,267 5.5%
Consolidated net sales . . . . . . . . . . . . . . . . . $3,952,618 $3,834,343 $118,275 3.1%
Gross profit:Sally Beauty Supply . . . . . . . . . . . . . . . . . . . $1,304,354 $1,276,529 $ 27,825 2.2%BSG . . . . . . . . . . . . . . . . . . . . . . . . . . . . . . 659,586 621,322 38,264 6.2%
Consolidated gross profit . . . . . . . . . . . . . . . $1,963,940 $1,897,851 $ 66,089 3.5%
Gross profit margin:Sally Beauty Supply . . . . . . . . . . . . . . . . . . . 55.2% 54.8% 0.4%BSG . . . . . . . . . . . . . . . . . . . . . . . . . . . . . . 41.5% 41.3% 0.2%Consolidated gross profit margin . . . . . . . . . . 49.7% 49.5% 0.2%
Net Sales
Consolidated net sales increased by $118.3 million, or 3.1%, for the fiscal year ended September 30, 2016,compared to the fiscal year ended September 30, 2015. Company-operated Sally Beauty Supply and BSGstores that have been open for 14 months or longer contributed an increase in consolidated net sales ofapproximately $113.4 million, or 3.0%, and sales through our BSG distributor sales consultants contributedan increase in consolidated net sales of approximately $20.3 million, or 0.5% compared to the fiscal yearended September 30, 2015. Other sales channels (including sales from stores that have been open for lessthan 14 months, sales through our BSG franchise-based businesses, incremental sales from businessesacquired in the preceding 12 months and sales from our Sally Beauty Supply non-store sales channels) inthe aggregate experienced a net decrease in sales of approximately $15.4 million, or 0.4%, compared to thefiscal year ended September 30, 2015. Consolidated net sales reflect a 2.9% same store sales growth ratefor both the fiscal year ended September 30, 2016 and the fiscal year ended September 30, 2015.Consolidated net sales for the fiscal year ended September 30, 2016, are inclusive of a net negative impactfrom changes in foreign currency exchange rates of $56.4 million, or 1.5% of consolidated net sales,including the impact of the stronger U.S. dollar in the fiscal year ended September 30, 2016.
The $118.3 million increase in consolidated net sales reflects, in our Sally Beauty Supply segment,increases in average unit prices resulting primarily from selective price increases in certain geographicalareas of the U.S. and, in our BSG segment, increases in unit volume (including increases in sales at existingstores and the incremental sales from 37 BSG company-operated stores opened or acquired during the lasttwelve months) and increases in average unit prices (resulting from changes in product mix), as more fullydiscussed below.
54
Sally Beauty Supply. Net sales for Sally Beauty Supply increased by $35.0 million, or 1.5%, for the fiscalyear ended September 30, 2016, compared to the fiscal year ended September 30, 2015. In the Sally BeautySupply segment, company-operated stores that have been open for 14 months or longer contributed anincrease in segment net sales of approximately $58.5 million, or 2.5%. Other sales channels (including salesfrom stores that have been open for less than 14 months and sales from our non-store sales channels, whichinclude the catalog and internet sales of our Sinelco Group subsidiaries) in the aggregate experienced a netdecrease in sales of approximately $23.5 million, or 1.0%, compared to the fiscal year ended September 30,2015. Net sales for Sally Beauty Supply reflect a 1.7% same store sales growth rate for both the fiscal yearended September 30, 2016 and the fiscal year ended September 30, 2015. Net sales for Sally Beauty Supplyfor the fiscal year ended September 30, 2016, are inclusive of a net negative impact from changes in foreigncurrency exchange rates of approximately $45.7 million, or 2.0% of Sally Beauty Supply’s net sales.
The $35.0 million increase in the Sally Beauty Supply segment’s net sales reflects increases in average unitprices resulting from selective price increases in certain geographical areas of the U.S. and a change inproduct mix primarily resulting from the introduction of certain products with higher average unit prices inthe preceding 12 months.
Beauty Systems Group. Net sales for BSG increased by $83.3 million, or 5.5%, for the fiscal year endedSeptember 30, 2016, compared to the fiscal year ended September 30, 2015. In the BSG segment,company-operated stores that have been open for 14 months or longer contributed an increase in segmentnet sales of approximately $54.9 million, or 3.6%, and sales through our distributor sales consultantscontributed an increase in segment net sales of approximately $20.3 million, or 1.3% compared to the fiscalyear ended September 30, 2015. Other sales channels (including sales from stores that have been open forless than 14 months, sales through our franchise-based businesses and incremental sales from businessesacquired in the preceding 12 months) in the aggregate contributed a net increase in sales of approximately$8.1 million, or 0.5%, compared to the fiscal year ended September 30, 2015. For the fiscal year endedSeptember 30, 2016, the BSG segment’s net sales reflect a 5.5% same store sales growth rate compared to5.7% for the fiscal year ended September 30, 2015. Net sales for BSG for the fiscal year endedSeptember 30, 2016, are inclusive of a net negative impact from changes in foreign currency exchange ratesof approximately $10.7 million, or less than 1.0% of BSG’s net sales.
The $83.3 million increase in the BSG segment’s net sales is primarily the result of an increase in both unitvolume (including increases in sales at existing stores and the incremental sales from 37 company-operatedstores opened or acquired during the last twelve months) and increases in average unit prices (resultingfrom changes in product mix, including as a result of the introduction of certain third-party brands withhigher average unit prices in the preceding 12 months).
Gross Profit
Consolidated gross profit increased by $66.1 million, or 3.5%, for the fiscal year ended September 30, 2016,compared to the fiscal year ended September 30, 2015, principally due to higher sales volume andimproved gross profit margins in both business segments, as more fully described below. Consolidatedgross profit as a percentage of net sales, or consolidated gross profit margin, was 49.7% for the fiscal yearended September 30, 2016, compared to 49.5% for the fiscal year ended September 30, 2015.
Sally Beauty Supply. Sally Beauty Supply’s gross profit increased by $27.8 million, or 2.2%, for the fiscalyear ended September 30, 2016, compared to the fiscal year ended September 30, 2015, principally as aresult of higher sales volume and improved gross profit margin. Sally Beauty Supply’s gross profit as apercentage of net sales increased to 55.2% for the fiscal year ended September 30, 2016, compared to54.8% for the fiscal year ended September 30, 2015. This increase was primarily the result of selective priceincreases in certain geographical areas of the U.S., fewer promotions and a shift in product mix (to highermargin product) resulting from a shift in customer preferences.
55
Beauty Systems Group. BSG’s gross profit increased by $38.3 million, or 6.2%, for the fiscal year endedSeptember 30, 2016, compared to the fiscal year ended September 30, 2015, principally as a result of highersales volume and improved gross profit margin. BSG’s gross profit as a percentage of net sales increased to41.5% for the fiscal year ended September 30, 2016, compared to 41.3% for the fiscal year endedSeptember 30, 2015 primarily as a result of a shift in product mix (to higher margin product) resulting froma shift in customer preferences and sales channel mix (to higher margin store-based product sales).
Selling, General and Administrative Expenses
Consolidated selling, general and administrative expenses increased by $52.9 million, or 4.0%, for the fiscalyear ended September 30, 2016, compared to the fiscal year ended September 30, 2015. This increase wasattributable in part to incremental expenses (including employee compensation, rent and other occupancy-related expenses) resulting from stores opened or acquired in the preceding 12 months (approximately 145net additional company-operated stores added since September 30, 2015, which represents a 3.0% increasein the number of company-operated stores). In addition, the increase reflects higher employeecompensation and compensation-related expenses of $28.0 million (including incremental compensation inconnection with stores added since September 30, 2015 and expense of $1.3 million incurred in connectionwith our ongoing management transition plan), higher expenses related to on-going upgrades to ourinformation technology systems (approximately $15.2 million), higher corporate expenses related to thedata security incidents ($9.1 million, including the accrued liability of $12.8 million recorded in 2016,compared to the accrued liability of $2.9 million recorded in 2015, as described above), higher legal andother professional fees mainly in connection with certain corporate initiatives (approximately $6.1 million)and higher credit card fees (approximately $3.7 million). The increase in selling, general and administrativeexpenses was partially offset by decreases in estimated future payments in connection with the Company’sself-insurance programs of $6.3 million and by the absence of expenses related to the 2015 Germanyrestructuring initiative (approximately $3.9 million, net of approximately $1.4 million reflected in cost ofproducts sold and distribution expenses) during the fiscal year ended September 30, 2016. Selling, generaland administrative expenses, as a percentage of net sales, were 34.6% for the fiscal year endedSeptember 30, 2016, compared to 34.2% for the fiscal year ended September 30, 2015.
Depreciation and Amortization
Consolidated depreciation and amortization increased by $10.3 million to $99.7 million for the fiscal yearended September 30, 2016, compared to $89.4 million for the fiscal year ended September 30, 2015. Thisincrease reflects the incremental depreciation and amortization expenses associated with capitalexpenditures made in the preceding 12 months (mainly in connection with store openings in both operatingsegments, with store remodels in the Sally Beauty Supply segment (primarily in the U.S.) and with ongoinginformation technology upgrades), partially offset by the impact of assets that became fully depreciated inthe preceding 12 months.
56
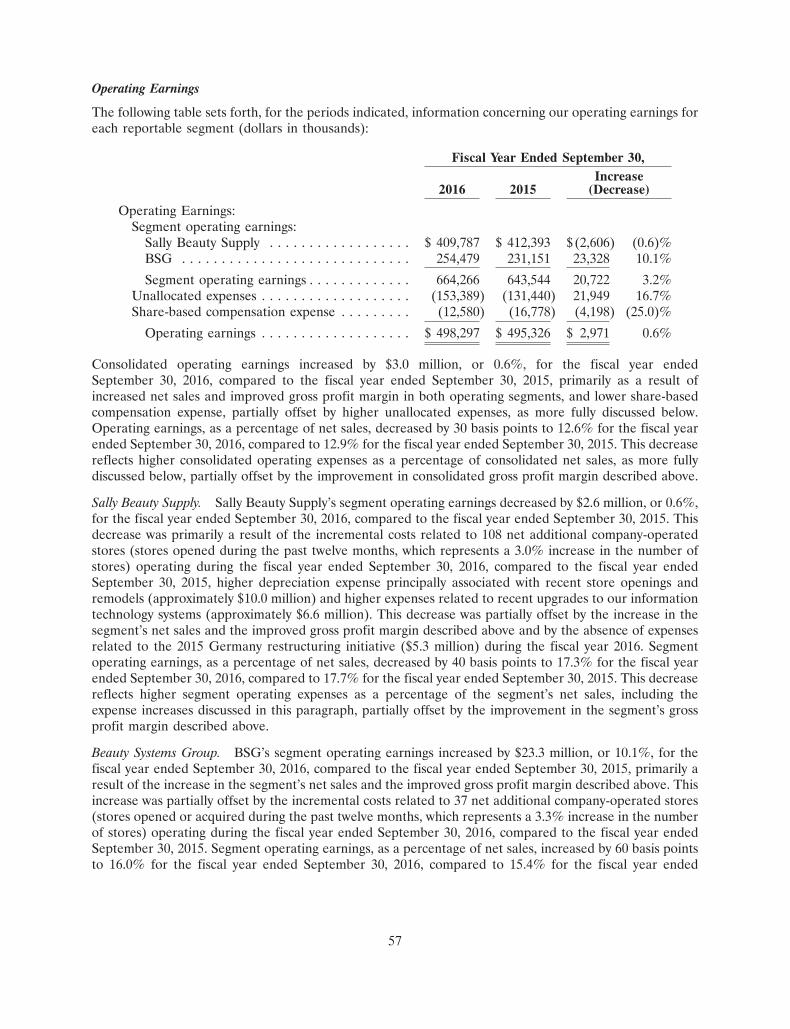
Operating Earnings
The following table sets forth, for the periods indicated, information concerning our operating earnings foreach reportable segment (dollars in thousands):
Fiscal Year Ended September 30,Increase
2016 2015 (Decrease)
Operating Earnings:Segment operating earnings:
Sally Beauty Supply . . . . . . . . . . . . . . . . . . $ 409,787 $ 412,393 $(2,606) (0.6)%BSG . . . . . . . . . . . . . . . . . . . . . . . . . . . . . 254,479 231,151 23,328 10.1%
Segment operating earnings . . . . . . . . . . . . . 664,266 643,544 20,722 3.2%Unallocated expenses . . . . . . . . . . . . . . . . . . . (153,389) (131,440) 21,949 16.7%Share-based compensation expense . . . . . . . . . (12,580) (16,778) (4,198) (25.0)%
Operating earnings . . . . . . . . . . . . . . . . . . . $ 498,297 $ 495,326 $ 2,971 0.6%
Consolidated operating earnings increased by $3.0 million, or 0.6%, for the fiscal year endedSeptember 30, 2016, compared to the fiscal year ended September 30, 2015, primarily as a result ofincreased net sales and improved gross profit margin in both operating segments, and lower share-basedcompensation expense, partially offset by higher unallocated expenses, as more fully discussed below.Operating earnings, as a percentage of net sales, decreased by 30 basis points to 12.6% for the fiscal yearended September 30, 2016, compared to 12.9% for the fiscal year ended September 30, 2015. This decreasereflects higher consolidated operating expenses as a percentage of consolidated net sales, as more fullydiscussed below, partially offset by the improvement in consolidated gross profit margin described above.
Sally Beauty Supply. Sally Beauty Supply’s segment operating earnings decreased by $2.6 million, or 0.6%,for the fiscal year ended September 30, 2016, compared to the fiscal year ended September 30, 2015. Thisdecrease was primarily a result of the incremental costs related to 108 net additional company-operatedstores (stores opened during the past twelve months, which represents a 3.0% increase in the number ofstores) operating during the fiscal year ended September 30, 2016, compared to the fiscal year endedSeptember 30, 2015, higher depreciation expense principally associated with recent store openings andremodels (approximately $10.0 million) and higher expenses related to recent upgrades to our informationtechnology systems (approximately $6.6 million). This decrease was partially offset by the increase in thesegment’s net sales and the improved gross profit margin described above and by the absence of expensesrelated to the 2015 Germany restructuring initiative ($5.3 million) during the fiscal year 2016. Segmentoperating earnings, as a percentage of net sales, decreased by 40 basis points to 17.3% for the fiscal yearended September 30, 2016, compared to 17.7% for the fiscal year ended September 30, 2015. This decreasereflects higher segment operating expenses as a percentage of the segment’s net sales, including theexpense increases discussed in this paragraph, partially offset by the improvement in the segment’s grossprofit margin described above.
Beauty Systems Group. BSG’s segment operating earnings increased by $23.3 million, or 10.1%, for thefiscal year ended September 30, 2016, compared to the fiscal year ended September 30, 2015, primarily aresult of the increase in the segment’s net sales and the improved gross profit margin described above. Thisincrease was partially offset by the incremental costs related to 37 net additional company-operated stores(stores opened or acquired during the past twelve months, which represents a 3.3% increase in the numberof stores) operating during the fiscal year ended September 30, 2016, compared to the fiscal year endedSeptember 30, 2015. Segment operating earnings, as a percentage of net sales, increased by 60 basis pointsto 16.0% for the fiscal year ended September 30, 2016, compared to 15.4% for the fiscal year ended
57
September 30, 2015. This increase reflects the increase in the segment’s gross profit margin describedabove, as well as a decrease in segment operating expenses as a percentage of the segment’s net sales.
Unallocated Expenses. Unallocated expenses, which represent certain corporate costs (such as payroll,employee benefits and travel expenses for corporate staff, certain professional fees, certain new businessdevelopment expenses and corporate governance expenses) that have not been charged to our operatingsegments, increased by $21.9 million, or 16.7%, for the fiscal year ended September 30, 2016, compared tothe fiscal year ended September 30, 2015. This increase was due primarily to higher employeecompensation and compensation-related expenses of $5.3 million (including expenses incurred inconnection with our ongoing management transition plan of $1.3 million), higher corporate expensesrelated primarily to the data security incidents (approximately $9.1 million including the accrued liability of$12.8 million recorded in 2016, compared to the accrued liability of $2.9 million recorded in 2015, asdescribed above), net of certain insurance recovery related to the data security incidents in 2015, highercorporate expenses related to on-going upgrades to our information technology systems of $7.5 million,and legal and other professional fees mainly in connection with certain corporate initiatives, in theaggregate, of $4.7 million. This increase was partially offset by decreases in estimated future payments inconnection with the Company’s self-insurance programs of $6.3 million.
Share-based Compensation Expense. Total compensation costs charged against income for share-basedcompensation arrangements decreased by $4.2 million to $12.6 million for the fiscal year endedSeptember 30, 2016, compared to $16.8 million for the fiscal year ended September 30, 2015. This decreasewas mainly due to the timing of expense recognition in connection with retirement-eligible grantees duringthe fiscal year ended September 30, 2016 and the impact of awards that became fully vested afterSeptember 30, 2015.
Interest Expense
Interest expense increased by $27.4 million to $144.2 million for the fiscal year ended September 30, 2016,compared to $116.8 million for the fiscal year ended September 30, 2015. Interest expense is net of interestincome of approximately $0.2 million for both the fiscal year ended September 30, 2016 and 2015. Theincrease in interest expense was principally due to the impact of our debt refinancing in December 2015,including a loss on extinguishment of debt of $33.3 million recognized in connection with such debtrefinancing, partially offset by lower interest expense on the senior notes due 2015 compared to the seniornotes due 2019. Please see Note 13 of the Notes to Consolidated Financial Statements in Item 8—‘‘Financial Statements and Supplementary Data’’ contained elsewhere in this Annual Report and‘‘Liquidity and Capital Resources’’ below for additional information about the Company’s debt.
Provision for Income Taxes
The provision for income taxes was $131.1 million and $143.4 million, and the annual effective income taxrate was 37.0% and 37.9%, for the fiscal years ended September 30, 2016 and 2015, respectively. Thedecrease in the effective income tax rate for the fiscal year ended September 30, 2016, compared to thefiscal year ended September 30, 2015, is primarily due to decreased losses subject to a valuation allowancein certain of the Company’s foreign operations and a reduction in non-deductible executive compensation.
Net Earnings
As a result of the foregoing, consolidated net earnings decreased by $12.1 million, or 5.2%, to$222.9 million for the fiscal year ended September 30, 2016, compared to $235.1 million for the fiscal yearended September 30, 2015. Net earnings, as a percentage of net sales, decreased by 50 basis points to 5.6%for the fiscal year ended September 30, 2016, compared to 6.1% for the fiscal year ended September 30,2015.
58
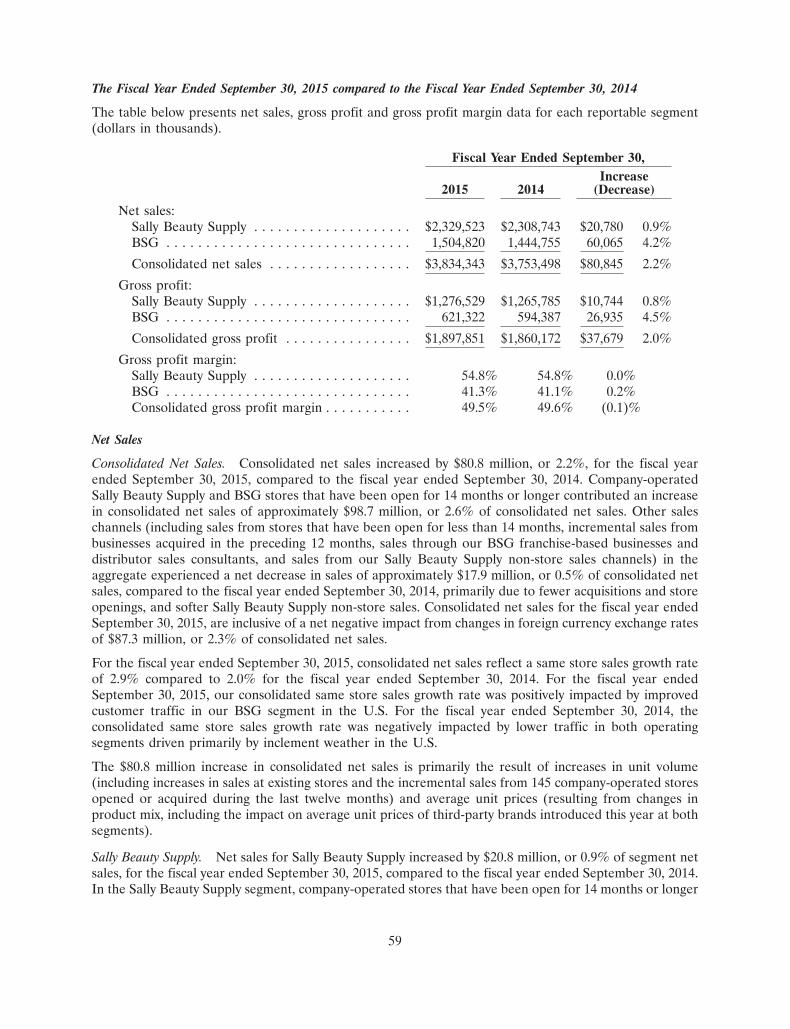
The Fiscal Year Ended September 30, 2015 compared to the Fiscal Year Ended September 30, 2014
The table below presents net sales, gross profit and gross profit margin data for each reportable segment(dollars in thousands).
Fiscal Year Ended September 30,Increase
2015 2014 (Decrease)
Net sales:Sally Beauty Supply . . . . . . . . . . . . . . . . . . . . $2,329,523 $2,308,743 $20,780 0.9%BSG . . . . . . . . . . . . . . . . . . . . . . . . . . . . . . . 1,504,820 1,444,755 60,065 4.2%
Consolidated net sales . . . . . . . . . . . . . . . . . . $3,834,343 $3,753,498 $80,845 2.2%
Gross profit:Sally Beauty Supply . . . . . . . . . . . . . . . . . . . . $1,276,529 $1,265,785 $10,744 0.8%BSG . . . . . . . . . . . . . . . . . . . . . . . . . . . . . . . 621,322 594,387 26,935 4.5%
Consolidated gross profit . . . . . . . . . . . . . . . . $1,897,851 $1,860,172 $37,679 2.0%
Gross profit margin:Sally Beauty Supply . . . . . . . . . . . . . . . . . . . . 54.8% 54.8% 0.0%BSG . . . . . . . . . . . . . . . . . . . . . . . . . . . . . . . 41.3% 41.1% 0.2%Consolidated gross profit margin . . . . . . . . . . . 49.5% 49.6% (0.1)%
Net Sales
Consolidated Net Sales. Consolidated net sales increased by $80.8 million, or 2.2%, for the fiscal yearended September 30, 2015, compared to the fiscal year ended September 30, 2014. Company-operatedSally Beauty Supply and BSG stores that have been open for 14 months or longer contributed an increasein consolidated net sales of approximately $98.7 million, or 2.6% of consolidated net sales. Other saleschannels (including sales from stores that have been open for less than 14 months, incremental sales frombusinesses acquired in the preceding 12 months, sales through our BSG franchise-based businesses anddistributor sales consultants, and sales from our Sally Beauty Supply non-store sales channels) in theaggregate experienced a net decrease in sales of approximately $17.9 million, or 0.5% of consolidated netsales, compared to the fiscal year ended September 30, 2014, primarily due to fewer acquisitions and storeopenings, and softer Sally Beauty Supply non-store sales. Consolidated net sales for the fiscal year endedSeptember 30, 2015, are inclusive of a net negative impact from changes in foreign currency exchange ratesof $87.3 million, or 2.3% of consolidated net sales.
For the fiscal year ended September 30, 2015, consolidated net sales reflect a same store sales growth rateof 2.9% compared to 2.0% for the fiscal year ended September 30, 2014. For the fiscal year endedSeptember 30, 2015, our consolidated same store sales growth rate was positively impacted by improvedcustomer traffic in our BSG segment in the U.S. For the fiscal year ended September 30, 2014, theconsolidated same store sales growth rate was negatively impacted by lower traffic in both operatingsegments driven primarily by inclement weather in the U.S.
The $80.8 million increase in consolidated net sales is primarily the result of increases in unit volume(including increases in sales at existing stores and the incremental sales from 145 company-operated storesopened or acquired during the last twelve months) and average unit prices (resulting from changes inproduct mix, including the impact on average unit prices of third-party brands introduced this year at bothsegments).
Sally Beauty Supply. Net sales for Sally Beauty Supply increased by $20.8 million, or 0.9% of segment netsales, for the fiscal year ended September 30, 2015, compared to the fiscal year ended September 30, 2014.In the Sally Beauty Supply segment, company-operated stores that have been open for 14 months or longer
59
contributed an increase in segment net sales of approximately $30.0 million, or 1.3% of segment net sales.Other sales channels (including sales from stores that have been open for less than 14 months and salesfrom our non-store sales channels, which include the catalog and e-commerce sales of our Sinelco Groupsubsidiaries) in the aggregate experienced a net decrease in sales of approximately $9.2 million, or 0.4% ofsegment net sales, compared to the fiscal year ended September 30, 2014, primarily due to fewer SallyBeauty Supply store openings and softer non-store sales. Net sales for Sally Beauty Supply for the fiscalyear ended September 30, 2015, are inclusive of a net negative impact from changes in foreign currencyexchange rates of approximately $70.9 million, or 3.1% of Sally Beauty Supply’s net sales.
For the fiscal year ended September 30, 2015, the Sally Beauty Supply segment’s net sales reflect a samestore sales growth rate of 1.7% compared to 1.3% for the fiscal year ended September 30, 2014. For thefiscal year ended September 30, 2015, the Sally Beauty Supply segment’s same store sales growth rate waspositively impacted by higher average sales transaction amounts at our U.S. stores compared to the fiscalyear ended September 30, 2014. For the fiscal year ended September 30, 2014, the segment’s same storesales growth rate was adversely impacted by lower traffic driven primarily by inclement weather in the U.S.
The $20.8 million increase in the Sally Beauty Supply segment’s net sales is the result of increases in unitvolume (including increases in sales at existing stores and the incremental sales from 111 company-operated stores opened during the last twelve months) and average unit prices (resulting from changes inproduct mix, including the impact on average unit prices of third-party brands introduced this year at ourSally Beauty Supply segment).
Beauty Systems Group. Net sales for BSG increased by $60.1 million, or 4.2% of segment net sales, for thefiscal year ended September 30, 2015, compared to the fiscal year ended September 30, 2014. In the BSGsegment, company-operated stores that have been open for 14 months or longer contributed an increase insegment net sales of approximately $68.7 million, or 4.8% of segment net sales, and sales through ourdistributor sales consultants contributed an increase in segment net sales of approximately $9.1 million, or0.6%, compared to the fiscal year ended September 30, 2014, while sales from stores that have been openfor less than 14 months experienced a decrease of $11.0 million, or 0.8% of segment net sales, compared tothe fiscal year ended September 30, 2014, primarily due to a shift in the timing of store openings in thenormal course of BSG’s business. Other sales channels (including sales through our franchise-basedbusinesses and incremental sales from businesses acquired in the preceding 12 months) in the aggregateexperienced a net decrease in sales of approximately $6.7 million, or 0.5% of segment net sales, comparedto the fiscal year ended September 30, 2014, primarily due to fewer acquisitions. Net sales for BSG for thefiscal year ended September 30, 2015, are inclusive of a net negative impact from changes in foreigncurrency exchange rates of approximately $16.5 million, or 1.1% of BSG’s net sales.
For the fiscal year ended September 30, 2015, the BSG segment’s net sales reflect a same store salesgrowth rate of 5.7% compared to 3.5% for the fiscal year ended September 30, 2014. For the fiscal yearended September 30, 2015, the BSG segment’s same store sales growth rate was positively impacted byimproved customer traffic in the U.S. compared to the fiscal year ended September 30, 2014.
The $60.1 million increase in the BSG segment’s net sales is primarily the result of increases in unit volume(including increases in sales at existing stores and the incremental sales from 34 company-operated storesopened or acquired during the last twelve months) and average unit prices (resulting from changes inproduct mix, including the impact of certain third-party brands with higher average unit prices introducedthis year at our BSG segment).
Gross Profit
Consolidated Gross Profit. Consolidated gross profit increased by $37.7 million, or 2.0%, for the fiscalyear ended September 30, 2015, compared to the fiscal year ended September 30, 2014, primarily due tohigher net sales. Consolidated gross profit as a percentage of net sales, or consolidated gross profit margin,was 49.5% for the fiscal year ended September 30, 2015, compared to 49.6% for the fiscal year ended
60
September 30, 2014. Consolidated gross profit for the fiscal year ended September 30, 2015 is inclusive of anegative impact from changes in foreign currency exchange rates of approximately $40.6 million.
Sally Beauty Supply. Sally Beauty Supply’s gross profit increased by $10.7 million, or 0.8%, for the fiscalyear ended September 30, 2015, compared to the fiscal year ended September 30, 2014, primarily due tohigher sales. Sally Beauty Supply’s gross profit as a percentage of net sales was 54.8% for both the fiscalyear ended September 30, 2015 and the fiscal year ended September 30, 2014. Sally Beauty Supply’s grossprofit for the fiscal year ended September 30, 2015 is inclusive of a negative impact from changes in foreigncurrency exchange rates of approximately $33.4 million.
Beauty Systems Group. BSG’s gross profit increased by $26.9 million, or 4.5%, for the fiscal year endedSeptember 30, 2015, compared to the fiscal year ended September 30, 2014, due to higher sales andimproved gross profit margin. BSG’s gross profit as a percentage of net sales was 41.3% for the fiscal yearended September 30, 2015, compared to 41.1% for the fiscal year ended September 30, 2014. BSG’s grossprofit for the fiscal year ended September 30, 2015 is inclusive of a negative impact from changes in foreigncurrency exchange rates of approximately $7.2 million.
Selling, General and Administrative Expenses
Consolidated selling, general and administrative expenses increased by $39.6 million, or 3.1%, for the fiscalyear ended September 30, 2015, compared to the fiscal year ended September 30, 2014. This increase wasattributable in part to incremental expenses (including employee compensation, rent and other occupancy-related expenses) resulting from stores opened in the preceding 12 months (approximately 145 netadditional company-operated stores added since September 30, 2014, which represents a 3.1% increase inthe number of stores). In addition, the increase reflects higher recruitment and compensation-relatedexpenses primarily in connection with our ongoing management transition plans (approximately$5.0 million), higher expenses related to on-going upgrades to our information technology systems(approximately $3.7 million), higher advertising costs in our Sally Beauty Supply segment (approximately$5.4 million) and higher expenses principally associated with store remodels and relocations(approximately $2.4 million) in the Sally Beauty Supply segment, higher corporate expenses related to thedata security incidents and to ongoing data security upgrades (approximately $4.0 million, net of relatedinsurance recovery), and expenses incurred in connection with the restructuring of our Sally Beauty Supplysegment’s operations in Germany of approximately $3.9 million ($5.3 million, net of approximately$1.4 million reflected in cost of products sold and distribution expenses) in the fiscal year endedSeptember 30, 2015. Selling, general and administrative expenses, as a percentage of net sales, increased to34.2% for the fiscal year ended September 30, 2015, compared to 33.9% for the fiscal year endedSeptember 30, 2014, mainly as a result of the expense increases mentioned earlier in this paragraph.Consolidated selling, general and administrative expenses for the fiscal year ended September 30, 2015 areinclusive of a net positive impact from changes in foreign currency exchange rates, of approximately$34.2 million, resulting from a stronger U.S. dollar during the fiscal year ended September 30, 2015.
Depreciation and Amortization
Consolidated depreciation and amortization increased by $9.7 million, or 12.2%, to $89.4 million for thefiscal year ended September 30, 2015, compared to $79.7 million for the fiscal year ended September 30,2014. This increase reflects the incremental depreciation and amortization expenses associated with capitalexpenditures made in the preceding 12 months (mainly in connection with store openings in both operatingsegments, store remodels in the Sally Beauty Supply segment in the U.S., and ongoing informationtechnology upgrades), partially offset by the impact of assets (including intangible assets) that became fullydepreciated (or fully amortized) in the preceding 12 months.
61
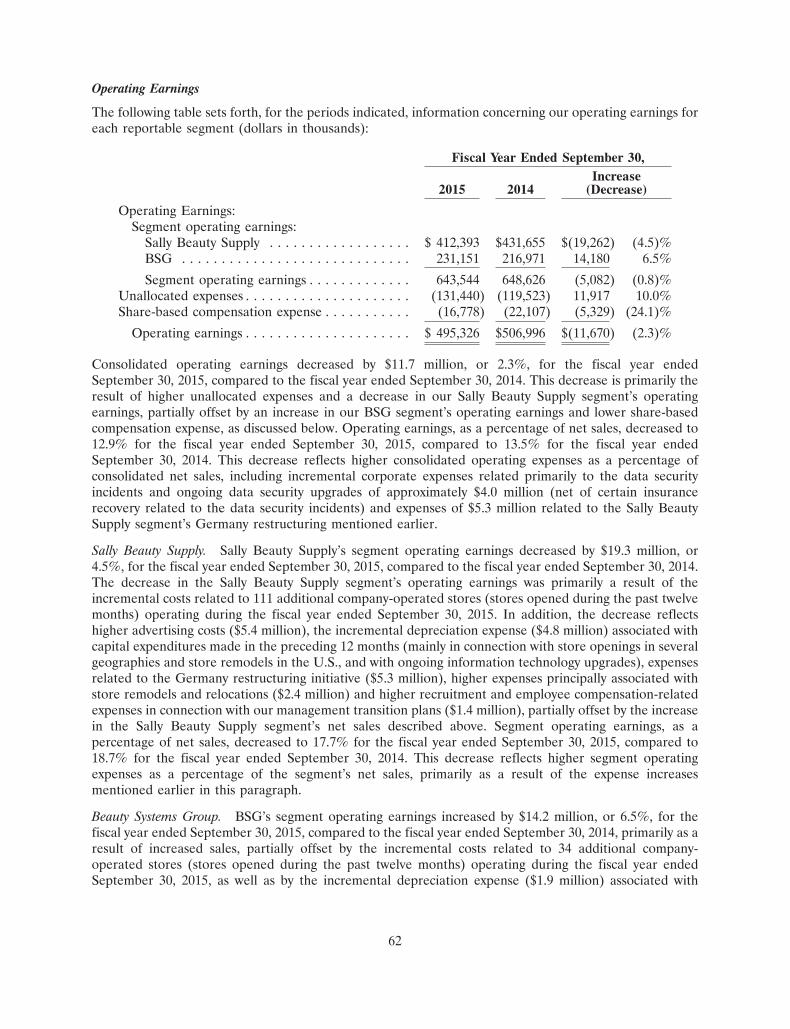
Operating Earnings
The following table sets forth, for the periods indicated, information concerning our operating earnings foreach reportable segment (dollars in thousands):
Fiscal Year Ended September 30,Increase
2015 2014 (Decrease)
Operating Earnings:Segment operating earnings:
Sally Beauty Supply . . . . . . . . . . . . . . . . . . $ 412,393 $431,655 $(19,262) (4.5)%BSG . . . . . . . . . . . . . . . . . . . . . . . . . . . . . 231,151 216,971 14,180 6.5%
Segment operating earnings . . . . . . . . . . . . . 643,544 648,626 (5,082) (0.8)%Unallocated expenses . . . . . . . . . . . . . . . . . . . . . (131,440) (119,523) 11,917 10.0%Share-based compensation expense . . . . . . . . . . . (16,778) (22,107) (5,329) (24.1)%
Operating earnings . . . . . . . . . . . . . . . . . . . . . $ 495,326 $506,996 $(11,670) (2.3)%
Consolidated operating earnings decreased by $11.7 million, or 2.3%, for the fiscal year endedSeptember 30, 2015, compared to the fiscal year ended September 30, 2014. This decrease is primarily theresult of higher unallocated expenses and a decrease in our Sally Beauty Supply segment’s operatingearnings, partially offset by an increase in our BSG segment’s operating earnings and lower share-basedcompensation expense, as discussed below. Operating earnings, as a percentage of net sales, decreased to12.9% for the fiscal year ended September 30, 2015, compared to 13.5% for the fiscal year endedSeptember 30, 2014. This decrease reflects higher consolidated operating expenses as a percentage ofconsolidated net sales, including incremental corporate expenses related primarily to the data securityincidents and ongoing data security upgrades of approximately $4.0 million (net of certain insurancerecovery related to the data security incidents) and expenses of $5.3 million related to the Sally BeautySupply segment’s Germany restructuring mentioned earlier.
Sally Beauty Supply. Sally Beauty Supply’s segment operating earnings decreased by $19.3 million, or4.5%, for the fiscal year ended September 30, 2015, compared to the fiscal year ended September 30, 2014.The decrease in the Sally Beauty Supply segment’s operating earnings was primarily a result of theincremental costs related to 111 additional company-operated stores (stores opened during the past twelvemonths) operating during the fiscal year ended September 30, 2015. In addition, the decrease reflectshigher advertising costs ($5.4 million), the incremental depreciation expense ($4.8 million) associated withcapital expenditures made in the preceding 12 months (mainly in connection with store openings in severalgeographies and store remodels in the U.S., and with ongoing information technology upgrades), expensesrelated to the Germany restructuring initiative ($5.3 million), higher expenses principally associated withstore remodels and relocations ($2.4 million) and higher recruitment and employee compensation-relatedexpenses in connection with our management transition plans ($1.4 million), partially offset by the increasein the Sally Beauty Supply segment’s net sales described above. Segment operating earnings, as apercentage of net sales, decreased to 17.7% for the fiscal year ended September 30, 2015, compared to18.7% for the fiscal year ended September 30, 2014. This decrease reflects higher segment operatingexpenses as a percentage of the segment’s net sales, primarily as a result of the expense increasesmentioned earlier in this paragraph.
Beauty Systems Group. BSG’s segment operating earnings increased by $14.2 million, or 6.5%, for thefiscal year ended September 30, 2015, compared to the fiscal year ended September 30, 2014, primarily as aresult of increased sales, partially offset by the incremental costs related to 34 additional company-operated stores (stores opened during the past twelve months) operating during the fiscal year endedSeptember 30, 2015, as well as by the incremental depreciation expense ($1.9 million) associated with
62
capital expenditures made in the preceding 12 months (mainly in connection with ongoing informationtechnology upgrades), higher allowance for doubtful accounts receivable (approximately $0.8 million,predominantly related to one customer) and higher expenses related primarily to upgrades to our BSGinformation technology systems (approximately $0.7 million). Segment operating earnings, as a percentageof net sales, increased to 15.4% for the fiscal year ended September 30, 2015, compared to 15.0% for thefiscal year ended September 30, 2014, primarily as a result of the increase in the segment’s gross profitmargin described above, as well as a reduction in the segment’s operating expenses as a percentage of thesegment’s net sales.
Unallocated Expenses. Unallocated expenses, which represent certain corporate costs (such as payroll,employee benefits and travel expenses for corporate staff, certain professional fees, certain new businessdevelopment expenses and corporate governance expenses) that have not been charged to our operatingsegments, increased by $11.9 million, or 10.0%, for the fiscal year ended September 30, 2015, compared tothe fiscal year ended September 30, 2014. This increase was due primarily to higher recruitment andemployee compensation-related expenses primarily in connection with our ongoing management transitionplans (approximately $3.2 million), incremental depreciation expense ($3.3 million) associated with capitalexpenditures made in the preceding 12 months (mainly in connection with ongoing information technologyupgrades), higher corporate expenses related primarily to on-going upgrades to our informationtechnology systems (approximately $2.5 million), higher corporate expenses related primarily to the datasecurity incidents and ongoing data security upgrades (approximately $4.0 million, net of certain insurancerecovery related to the data security incidents) and higher professional fees primarily related to newbusiness development and other corporate initiatives (approximately $1.0 million).
Share-based Compensation Expense. Total compensation costs charged against income for share-basedcompensation arrangements decreased by $5.3 million, or 24.1%, to $16.8 million for the fiscal year endedSeptember 30, 2015, compared to $22.1 million for the fiscal year ended September 30, 2014. This decreasewas mainly due to lower aggregate fair value at the date of grant of the stock options awarded during thefiscal year ended September 30, 2015 and the impact of awards that became fully vested sinceSeptember 30, 2014. In addition, this decrease reflects the impact of a $3.5 million stock options award inconnection with the executive management transition plan during the fiscal year ended September 30,2014, without a comparable award in the fiscal year ended September 30, 2015.
Interest Expense
Interest expense was $116.8 million for the fiscal year ended September 30, 2015, compared to$116.3 million the fiscal year ended September 30, 2014. Interest expense is net of interest income ofapproximately $0.2 million for each of the fiscal years ended September 30, 2015 and 2014. The increase ininterest expense was primarily attributable to the effect of higher principal balances on our debtoutstanding during the fiscal year ended September 30, 2015, including the senior notes due 2023 issued inOctober 2013. This increase was partially offset by lower borrowings under the ABL facility during thefiscal year ended September 30, 2015, compared to the fiscal year ended September 30, 2014. Please seeNote 13 of the Notes to Consolidated Financial Statements in Item 8—‘‘Financial Statements andSupplementary Data’’ contained elsewhere in this Annual Report and ‘‘Liquidity and Capital Resources’’below for additional information about the Company’s debt.
Provision for Income Taxes
The provision for income taxes was $143.4 million and $144.7 million and the annual effective tax rate was37.9% and 37.0% for the fiscal years ended September 30, 2015 and 2014, respectively. The increase in theeffective income tax rate for the fiscal year 2015, compared to the fiscal year 2014, is primarily due toincreased foreign tax losses resulting in part from our ongoing expansion into international geographiesand a beneficial tax settlement in the fiscal year 2014 without a comparable tax benefit in the fiscal year2015.
63
Net Earnings
As a result of the foregoing, consolidated net earnings decreased by $10.9 million, or 4.4%, to$235.1 million for the fiscal year ended September 30, 2015, compared to $246.0 million for the fiscal yearended September 30, 2014. Net earnings, as a percentage of net sales, were 6.1% for the fiscal year endedSeptember 30, 2015, compared to 6.6% for the fiscal year ended September 30, 2014.
Financial Condition
September 30, 2016 Compared to September 30, 2015
Working capital (current assets less current liabilities) decreased by $11.2 million to $684.2 million atSeptember 30, 2016, compared to $695.4 million at September 30, 2015. The ratio of current assets tocurrent liabilities was 2.40 to 1.00 at September 30, 2016, compared to 2.41 to 1.00 at September 30, 2015.The decrease in working capital reflects a decrease in current assets of $14.3 million, partially offset by adecrease in current liabilities of $3.0 million. The decrease in current assets is principally due to a decreasein cash and cash equivalents of $53.4 million (please see ‘‘Liquidity and Capital Resources’’ below for adescription of our sources and uses of cash) and a decrease of $5.4 million in accounts receivable, other,partially offset by an increase of $22.1 million in inventory, an increase in other current assets of$17.8 million and an increase in deferred income tax assets of $6.3 million. The decrease in currentliabilities is principally due to a decrease of $4.5 million in accounts payable and a decrease in income taxespayable of $4.3 million, partially offset by an increase of $5.9 million in accrued liabilities, as discussedbelow.
Accounts receivable, other decreased by $5.4 million to $37.0 million at September 30, 2016, compared to$42.5 million at September 30, 2015 due primarily to the timing of collections from customers and vendorsin the ordinary course of our business and the impact of foreign currency translation adjustments.Inventory increased by $22.1 million to $907.3 million at September 30, 2016, compared to $885.2 millionat September 30, 2015 primarily due to the effect of stores opened (145 net additional Sally Beauty Supplyand BSG company-operated stores added during the fiscal year ended September 30, 2016) and theaddition of new product lines in both operating segments, partially offset by the impact of foreign currencytranslation adjustments of approximately $12.5 million. Other current assets increased by $17.8 million to$54.9 million at September 30, 2016, compared to $37.0 million at September 30, 2015 due primarily to anincrease in income tax receivable in the ordinary course of our business. Deferred income tax assetsincreased by $6.3 million to $40.0 million at September 30, 2016, compared to $33.7 million atSeptember 30, 2015 due primarily to the timing of recognition, for financial accounting purposes, of theloss contingency obligation discussed earlier compared to the timing of recognition of such loss for incometax purposes. Please see Note 16 of notes to consolidated financial statements included elsewhere in thisAnnual Report.
Accounts payable decreased by $4.5 million to $271.4 million at September 30, 2016, compared to$275.9 million at September 30, 2015 due to the timing of payments to suppliers primarily in connectionwith recent purchases of merchandise inventory and capital expenditures. Accrued liabilities increased by$5.9 million to $214.6 million at September 30, 2016, compared to $208.7 million at September 30, 2015,primarily due to an increase of $12.8 million in the loss contingency obligation in connection with the datasecurity incidents and an increase in other operational accruals, partially offset by a decrease in accruedcompensation and benefits of $5.6 million and a decrease in interest payable in connection with our debt,mainly as a result of our December 2015 debt refinancing. Income taxes payable decreased by $4.3 millionto $2.0 million at September 30, 2016, compared to $6.3 million at September 30, 2015 due primarily to thetiming of federal estimated income tax payments in the ordinary course of our business.
Net property and equipment increased by $48.7 million to $319.6 million at September 30, 2016, comparedto $270.8 million at September 30, 2015, primarily due to capital expenditures of $143.4 million, including
64
amounts incurred but not paid, partially offset by the fiscal year 2016 depreciation expense of $86.3 millionand foreign currency translation adjustments of approximately $5.9 million.
Goodwill increased by $8.3 million to $532.7 million at September 30, 2016, compared to $524.4 million atSeptember 30, 2015, primarily due to $12.8 million of goodwill recorded in connection with businessesacquired during the fiscal year 2016, partially offset by foreign currency translation adjustments ofapproximately $4.5 million.
Intangible assets, excluding goodwill, decreased by $5.9 million to $93.0 million at September 30, 2016,compared to $98.8 million at September 30, 2015, primarily due to amortization expense of $13.3 millionrecognized in the fiscal year 2016 and foreign currency translation adjustments, partially offset by$10.1 million of intangible assets recorded in connection with businesses acquired during the fiscal year2016.
Long-term debt, including current portion, decreased by $3.6 million to $1,784.0 million at September 30,2016, compared to $1,787.6 million at September 30, 2015, primarily due to deferred financing costs of$12.7 million paid in connection with our December 2015 issuance of our senior notes due 2025 and theamortization of premium on certain senior notes, partially offset by unamortized deferred financing costsof $7.5 million expensed in connection with our December 2015 redemption of our senior notes due 2019and amortization of deferred financing costs of $3.3 million. Please see ‘‘Liquidity and Capital Resources’’below.
Deferred income tax liabilities increased by $28.8 million to $114.7 million at September 30, 2016,compared to $85.9 million at September 30, 2015 due primarily to the timing of recognition, for financialaccounting purposes, of depreciation and amortization expenses compared to the timing of recognition ofsuch expenses for income tax purposes. Please see Note 16 of notes to consolidated financial statementsincluded elsewhere in this Annual Report.
Total stockholders’ deficit decreased by $21.7 million to $276.2 million at September 30, 2016, compared to$297.8 million at September 30, 2015. This decrease was primarily a result of net earnings of$222.9 million, and share-based compensation expense, the impact of exercises of stock options and othershare-based compensation activity, in the aggregate, of approximately $28.4 million. This decrease waspartially offset by our repurchase and retirement of approximately 7.8 million shares of our common stockfor approximately $207.3 million and foreign currency translation adjustments, net of tax, of $22.3 million.Please see ‘‘Liquidity and Capital Resources’’ below.
Liquidity and Capital Resources
We broadly define liquidity as our ability to generate sufficient cash flow from operating activities to meetour obligations and commitments. In addition, liquidity includes the ability to obtain appropriate debt andequity financing and to convert into cash those assets that are no longer required to meet existing strategicand financial objectives. Therefore, liquidity cannot be considered separately from capital resources thatconsist of current or potentially available funds for use in achieving long-range business objectives andmeeting debt service commitments.
We are highly leveraged and a substantial portion of our liquidity needs will arise from debt service on ouroutstanding indebtedness and from funding the costs of operations, working capital, capital expendituresand share repurchases. As a holding company, we depend on our subsidiaries, including SallyHoldings LLC (which we refer to as ‘‘Sally Holdings’’), to distribute funds to us so that we may pay ourobligations and expenses. The ability of our subsidiaries to make such distributions will be subject to theiroperating results, cash requirements and financial condition and their compliance with relevant laws, andcovenants and financial ratios related to their existing or future indebtedness, including covenantsrestricting Sally Holdings’ ability to pay dividends to us. If, as a consequence of these limitations, we cannotreceive sufficient distributions from our subsidiaries, we may not be able to meet our obligations to fundgeneral corporate expenses. Please see ‘‘Risk Factors—Risks Relating to Our Business,’’ and ‘‘—RisksRelating to Our Substantial Indebtedness.’’
65
We may from time to time repurchase or otherwise retire or refinance our debt (through our subsidiariesor otherwise) and take other steps to reduce or refinance our debt. These actions may include open marketrepurchases of our notes or other retirements of outstanding debt. The amount of debt that may berepurchased, or refinanced or otherwise retired, if any, will be determined in the sole discretion of ourBoard of Directors and will depend on market conditions, trading levels of the Company’s debt from timeto time, the Company’s cash position and other considerations.
At September 30, 2016, cash and cash equivalents were $86.6 million. Based upon the current level ofoperations and anticipated growth, we anticipate that existing cash balances (excluding certain amountspermanently invested in connection with foreign operations), funds expected to be generated by operationsand funds available under the ABL facility will be sufficient to meet our working capital requirements,fund share repurchases and potential acquisitions, and finance anticipated capital expenditures, includinginformation technology upgrades and store remodels, over the next twelve months.
However, there can be no assurance that our business will generate sufficient cash flows from operations,that anticipated net sales and operating improvements will be realized, or that future borrowings will beavailable under our ABL facility in an amount sufficient to enable us to service our indebtedness or to fundour other liquidity needs. In addition, our ability to meet our debt service obligations and liquidity needsare subject to certain risks, which include, but are not limited to, increases in competitive activity, the lossof key suppliers, rising interest rates, the loss of key personnel, the ability to execute our business strategy,general economic conditions and other risks discussed in this Annual Report. Please see ‘‘Risk Factors’’ inItem 1A of this Annual Report.
We utilize our ABL facility for the issuance of letters of credit, for certain working capital and liquidityneeds and to manage normal fluctuations in our operational cash flow. In that regard, we may from time totime draw funds under the ABL facility for general corporate purposes including funding of capitalexpenditures, acquisitions, interest payments due on our indebtedness and share repurchases. The fundsdrawn on an individual occasion during the fiscal year ended September 30, 2016 have varied in amountsup to $20.0 million, total amounts outstanding have ranged from zero up to $90.0 million and the averagedaily balance outstanding was $12.3 million. During the fiscal year ended September 30, 2016, the weightedaverage interest rate on our borrowings under the ABL facility was 3.0%. The amounts drawn aregenerally paid down with cash provided by our operating activities.
As of September 30, 2016, there were no borrowings outstanding under the ABL facility and SallyHoldings had $478.4 million available for borrowings under the ABL facility, subject to borrowing baselimitations, as reduced by outstanding letters of credit.
We are a holding company and do not have any material assets or operations other than ownership ofequity interests in our subsidiaries. The agreements and instruments governing the debt of Sally Holdingsand its subsidiaries contain material limitations on their ability to pay dividends and other restrictedpayments to us which, in turn, constitute material limitations on our ability to pay dividends and otherpayments to our stockholders. Please see ‘‘Long-Term Debt Covenants’’ below.
During the fiscal years ended September 30, 2016, 2015 and 2014 we completed several individuallyimmaterial acquisitions at an aggregate cost of $26.1 million, $7.1 million and $4.9 million, respectively. Wegenerally funded these acquisitions with cash from operations, borrowings under the ABL facility and aportion of the cash proceeds from our October 2013 debt issuance.
Share Repurchase Programs
In August 2014, we announced that the Board had approved the 2014 Share Repurchase Programauthorizing us to repurchase up to $1.0 billion of our common stock over an approximate three-year periodexpiring on September 30, 2017.
66
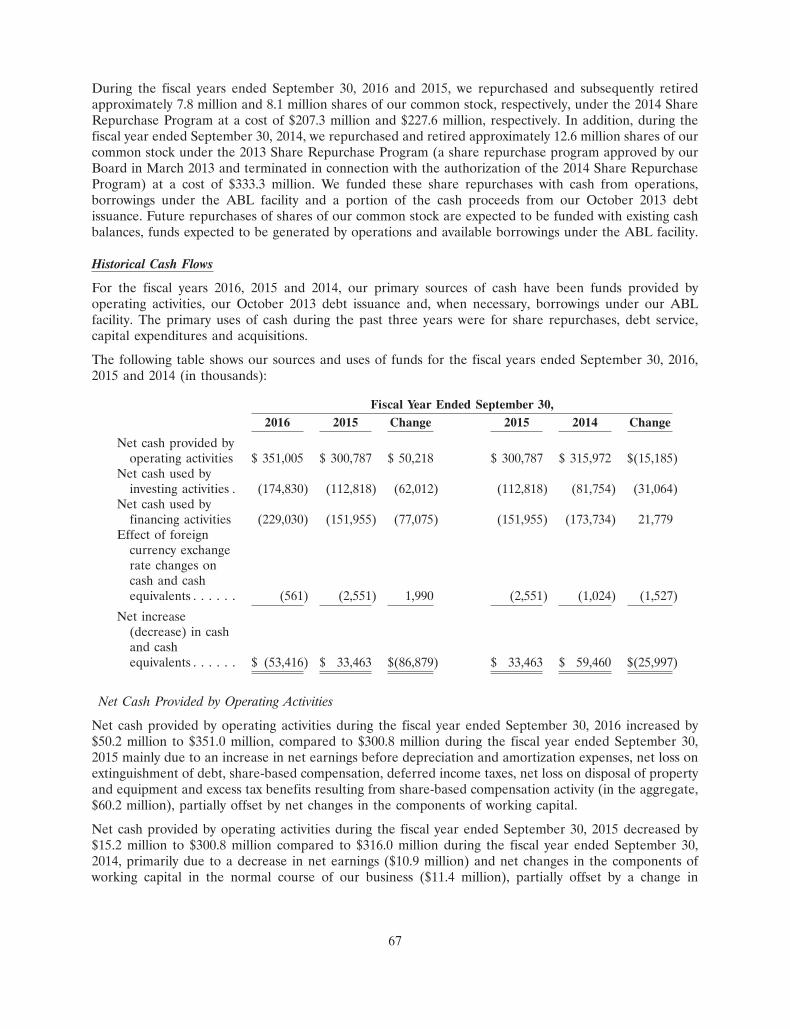
During the fiscal years ended September 30, 2016 and 2015, we repurchased and subsequently retiredapproximately 7.8 million and 8.1 million shares of our common stock, respectively, under the 2014 ShareRepurchase Program at a cost of $207.3 million and $227.6 million, respectively. In addition, during thefiscal year ended September 30, 2014, we repurchased and retired approximately 12.6 million shares of ourcommon stock under the 2013 Share Repurchase Program (a share repurchase program approved by ourBoard in March 2013 and terminated in connection with the authorization of the 2014 Share RepurchaseProgram) at a cost of $333.3 million. We funded these share repurchases with cash from operations,borrowings under the ABL facility and a portion of the cash proceeds from our October 2013 debtissuance. Future repurchases of shares of our common stock are expected to be funded with existing cashbalances, funds expected to be generated by operations and available borrowings under the ABL facility.
Historical Cash Flows
For the fiscal years 2016, 2015 and 2014, our primary sources of cash have been funds provided byoperating activities, our October 2013 debt issuance and, when necessary, borrowings under our ABLfacility. The primary uses of cash during the past three years were for share repurchases, debt service,capital expenditures and acquisitions.
The following table shows our sources and uses of funds for the fiscal years ended September 30, 2016,2015 and 2014 (in thousands):
Fiscal Year Ended September 30,2016 2015 Change 2015 2014 Change
Net cash provided byoperating activities $ 351,005 $ 300,787 $ 50,218 $ 300,787 $ 315,972 $(15,185)
Net cash used byinvesting activities . (174,830) (112,818) (62,012) (112,818) (81,754) (31,064)
Net cash used byfinancing activities (229,030) (151,955) (77,075) (151,955) (173,734) 21,779
Effect of foreigncurrency exchangerate changes oncash and cashequivalents . . . . . . (561) (2,551) 1,990 (2,551) (1,024) (1,527)
Net increase(decrease) in cashand cashequivalents . . . . . . $ (53,416) $ 33,463 $(86,879) $ 33,463 $ 59,460 $(25,997)
Net Cash Provided by Operating Activities
Net cash provided by operating activities during the fiscal year ended September 30, 2016 increased by$50.2 million to $351.0 million, compared to $300.8 million during the fiscal year ended September 30,2015 mainly due to an increase in net earnings before depreciation and amortization expenses, net loss onextinguishment of debt, share-based compensation, deferred income taxes, net loss on disposal of propertyand equipment and excess tax benefits resulting from share-based compensation activity (in the aggregate,$60.2 million), partially offset by net changes in the components of working capital.
Net cash provided by operating activities during the fiscal year ended September 30, 2015 decreased by$15.2 million to $300.8 million compared to $316.0 million during the fiscal year ended September 30,2014, primarily due to a decrease in net earnings ($10.9 million) and net changes in the components ofworking capital in the normal course of our business ($11.4 million), partially offset by a change in
67
depreciation and amortization expense ($9.7 million). The changes in the components of working capitalinclude net changes in operating assets ($49.3 million), partially offset by net changes in operatingliabilities ($37.8 million).
Net Cash Used by Investing Activities
Net cash used by investing activities during the fiscal year ended September 30, 2016 increased by$62.0 million to $174.8 million, compared to $112.8 million during the fiscal year ended September 30,2015. This increase reflects incremental capital expenditures of $44.7 million, primarily related to storeopenings and ongoing information technology upgrades in both business segments, store remodels in theSally Beauty Supply segment (primarily in the U.S.) and upgrades to certain distribution centers and anincrease of $19.7 million in cash used for acquisitions, net of cash acquired, in the fiscal year endedSeptember 30, 2016, compared to the fiscal year ended September 30, 2015, partially offset by incrementalproceeds from sale of property and equipment ($2.3 million).
Net cash used by investing activities during the fiscal year ended September 30, 2015 increased by$31.1 million to $112.8 million compared to $81.8 million during the fiscal year ended September 30, 2014.This increase reflects an increase in capital expenditures ($29.7 million) primarily related to store openingsand to ongoing information technology upgrades in both business segments, and to store remodels in theSally Beauty Supply segment in the U.S. during the fiscal year ended September 30, 2015, as well as anincrease in cash used for acquisitions (net of cash acquired) of $1.3 million during the fiscal year endedSeptember 30, 2015, compared to the fiscal year ended September 30, 2014.
Net Cash Used by Financing Activities
Net cash used by financing activities increased by $77.1 million to cash used of $229.0 million during thefiscal year ended September 30, 2016, compared to $152.0 million during the fiscal year endedSeptember 30, 2015, primarily due to the payment of a redemption premium ($25.8 million) and debtissuance costs ($12.7 million) in connection with our redemption of the senior notes due 2019 and issuanceof the senior notes due 2025 in December 2015, and a decrease in proceeds from exercises of stock optionsand excess tax benefits resulting from share-based compensation activity, in the aggregate, of $58.9 million,partially offset by a decrease in share repurchases under the 2014 Share Repurchase Program($20.2 million).
Net cash used by financing activities decreased by $21.8 million to $152.0 million during the fiscal yearended September 30, 2015, compared to $173.7 million during the fiscal year ended September 30, 2014.This decrease was primarily due to a decrease in cash used to repurchase shares of our common stock of$105.7 million, an increase in proceeds from exercises of stock options and excess tax benefits resultingfrom share-based compensation activity, in the aggregate, of $35.1 million, and the impact of debt issuancecosts of $3.9 million paid in connection with issuance of the senior notes due 2023 in the fiscal year endedSeptember 30, 2014 with no comparable amount in the fiscal year ended September 30, 2015, partiallyoffset by a decrease in net borrowings under our long-term debt of $123.0 million.
Long-Term Debt
Outstanding Long-Term Debt
In November 2006, the Company, through its subsidiaries (Sally Investment Holdings LLC and SallyHoldings) incurred $1,850.0 million of indebtedness in connection with the Company’s separation from itsformer parent, Alberto-Culver.
In the fiscal year 2011, Sally Holdings entered into a $400 million, five-year asset-based senior secured loanfacility (the ‘‘ABL facility’’). The availability of funds under the ABL facility, as amended in June 2012, issubject to a customary borrowing base comprised of: (i) a specified percentage of our eligible credit card
68
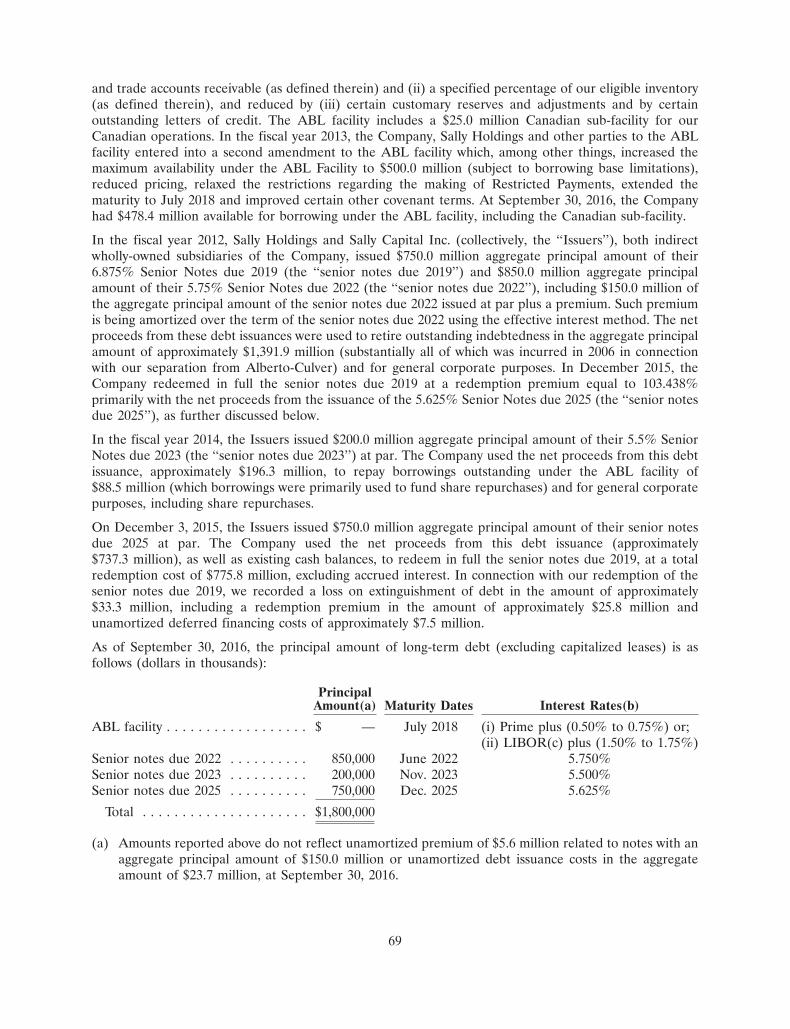
and trade accounts receivable (as defined therein) and (ii) a specified percentage of our eligible inventory(as defined therein), and reduced by (iii) certain customary reserves and adjustments and by certainoutstanding letters of credit. The ABL facility includes a $25.0 million Canadian sub-facility for ourCanadian operations. In the fiscal year 2013, the Company, Sally Holdings and other parties to the ABLfacility entered into a second amendment to the ABL facility which, among other things, increased themaximum availability under the ABL Facility to $500.0 million (subject to borrowing base limitations),reduced pricing, relaxed the restrictions regarding the making of Restricted Payments, extended thematurity to July 2018 and improved certain other covenant terms. At September 30, 2016, the Companyhad $478.4 million available for borrowing under the ABL facility, including the Canadian sub-facility.
In the fiscal year 2012, Sally Holdings and Sally Capital Inc. (collectively, the ‘‘Issuers’’), both indirectwholly-owned subsidiaries of the Company, issued $750.0 million aggregate principal amount of their6.875% Senior Notes due 2019 (the ‘‘senior notes due 2019’’) and $850.0 million aggregate principalamount of their 5.75% Senior Notes due 2022 (the ‘‘senior notes due 2022’’), including $150.0 million ofthe aggregate principal amount of the senior notes due 2022 issued at par plus a premium. Such premiumis being amortized over the term of the senior notes due 2022 using the effective interest method. The netproceeds from these debt issuances were used to retire outstanding indebtedness in the aggregate principalamount of approximately $1,391.9 million (substantially all of which was incurred in 2006 in connectionwith our separation from Alberto-Culver) and for general corporate purposes. In December 2015, theCompany redeemed in full the senior notes due 2019 at a redemption premium equal to 103.438%primarily with the net proceeds from the issuance of the 5.625% Senior Notes due 2025 (the ‘‘senior notesdue 2025’’), as further discussed below.
In the fiscal year 2014, the Issuers issued $200.0 million aggregate principal amount of their 5.5% SeniorNotes due 2023 (the ‘‘senior notes due 2023’’) at par. The Company used the net proceeds from this debtissuance, approximately $196.3 million, to repay borrowings outstanding under the ABL facility of$88.5 million (which borrowings were primarily used to fund share repurchases) and for general corporatepurposes, including share repurchases.
On December 3, 2015, the Issuers issued $750.0 million aggregate principal amount of their senior notesdue 2025 at par. The Company used the net proceeds from this debt issuance (approximately$737.3 million), as well as existing cash balances, to redeem in full the senior notes due 2019, at a totalredemption cost of $775.8 million, excluding accrued interest. In connection with our redemption of thesenior notes due 2019, we recorded a loss on extinguishment of debt in the amount of approximately$33.3 million, including a redemption premium in the amount of approximately $25.8 million andunamortized deferred financing costs of approximately $7.5 million.
As of September 30, 2016, the principal amount of long-term debt (excluding capitalized leases) is asfollows (dollars in thousands):
PrincipalAmount(a) Maturity Dates Interest Rates(b)
ABL facility . . . . . . . . . . . . . . . . . . $ — July 2018 (i) Prime plus (0.50% to 0.75%) or;(ii) LIBOR(c) plus (1.50% to 1.75%)
Senior notes due 2022 . . . . . . . . . . 850,000 June 2022 5.750%Senior notes due 2023 . . . . . . . . . . 200,000 Nov. 2023 5.500%Senior notes due 2025 . . . . . . . . . . 750,000 Dec. 2025 5.625%
Total . . . . . . . . . . . . . . . . . . . . . $1,800,000
(a) Amounts reported above do not reflect unamortized premium of $5.6 million related to notes with anaggregate principal amount of $150.0 million or unamortized debt issuance costs in the aggregateamount of $23.7 million, at September 30, 2016.
69
(b) Interest rates shown represent the coupon or contractual rate related to each debt instrument listed.
(c) When used in this Annual Report, LIBOR means the London Interbank Offered Rate.
Long-Term Debt Covenants
We are a holding company and do not have any material assets or operations other than ownership ofequity interests in our subsidiaries.
The agreements and instruments governing our debt contain restrictions and limitations that couldsignificantly impact our ability to operate our business. These restrictions and limitations relate to:
• Incurrence of additional indebtedness • Granting of liens on assets
• Repurchases and redemptions of capital stock • Making of investments, including jointand the payment of dividends ventures
• Making of certain debt prepayments • Making of acquisitions
• Mergers or consolidations • Disposition of assets
Borrowings under the ABL facility are secured by the accounts, inventory and credit card receivables (andrelated general intangibles and other property) of our domestic subsidiaries (and, in the case of borrowingsunder the Canadian sub-facility, such assets of our Canadian subsidiaries and, solely with respect toborrowings by SBH Finance B.V., intercompany notes owed to SBH Finance B.V. by our foreignsubsidiaries). The senior notes due 2022, the senior notes due 2023 and the senior notes due 2025 (whichwe refer to collectively as ‘‘the Senior Notes’’ or the ‘‘senior notes due 2022, 2023 and 2025’’) areunsecured obligations of the Issuers and are jointly and severally guaranteed by the Company and SallyInvestment, and by each material domestic subsidiary of the Company. Interest on the senior notes due2022, 2023 and 2025 is payable semi-annually, during the Company’s first and third fiscal quarters.
The ABL facility and the indentures governing the senior notes due 2022, 2023 and 2025 contain othercovenants regarding restrictions on asset dispositions, granting of liens and security interests, prepaymentof certain indebtedness and other matters and customary events of default, including customary cross-default and/or cross-acceleration provisions. As of September 30, 2016, all the net assets of ourconsolidated subsidiaries were unrestricted from transfer under our credit arrangements.
The senior notes due 2022 carry optional redemption features whereby the Company has the option toredeem the notes, in whole or in part, on or after June 1, 2020 at par, plus accrued and unpaid interest, ifany, and on or after June 1, 2017 at par plus a premium declining ratably to par, plus accrued and unpaidinterest, if any. Prior to June 1, 2017, the notes may be redeemed, in whole or in part, at a redemptionprice equal to par plus a make-whole premium as provided in the indenture, plus accrued and unpaidinterest, if any.
The senior notes due 2023 carry optional redemption features whereby the Company has the option toredeem the notes, in whole or in part, on or after November 1, 2021 at par, plus accrued and unpaidinterest, if any, and on or after November 1, 2018 at par plus a premium declining ratably to par, plusaccrued and unpaid interest, if any. Prior to November 1, 2018, the notes may be redeemed, in whole or inpart, at a redemption price equal to par plus a make-whole premium as provided in the indenture, plusaccrued and unpaid interest, if any.
The senior notes due 2025 carry optional redemption features whereby the Company has the option toredeem the notes, in whole or in part, on or after December 1, 2023 at par, plus accrued and unpaidinterest, if any, and on or after December 1, 2020 at par plus a premium declining ratably to par, plusaccrued and unpaid interest, if any. Prior to December 1, 2020, the notes may be redeemed, in whole or inpart, at a redemption price equal to par plus a make-whole premium as provided in the indenture, plus
70
accrued and unpaid interest, if any. In addition, on or prior to December 1, 2018, the Company has theright to redeem at par plus a specified premium, plus accrued and unpaid interest, if any, up to 35% of theaggregate principal amount of notes originally issued, subject to certain limitations, with the proceeds fromcertain kinds of equity offerings, as defined in the indenture.
The ABL facility does not contain any restriction against the incurrence of unsecured indebtedness.However, the ABL facility restricts the incurrence of secured indebtedness if, after giving effect to theincurrence of such secured indebtedness, the Company’s Secured Leverage Ratio exceeds 4.0 to 1.0. AtSeptember 30, 2016, the Company’s Secured Leverage Ratio was less than 0.1 to 1.0. Secured LeverageRatio is defined as the ratio of (i) Secured Funded Indebtedness (as defined in the ABL facility) to(ii) Consolidated EBITDA (as defined in the ABL facility) for the most recently completed twelve fiscalmonths.
The ABL facility is pre-payable and the commitments thereunder may be terminated, in whole or in part atany time without penalty or premium.
The indentures governing the senior notes due 2022, 2023 and 2025 contain terms which restrict the abilityof Sally Beauty’s subsidiaries to incur additional indebtedness. However, in addition to certain othermaterial exceptions, the Company may incur additional indebtedness under the indentures if itsConsolidated Coverage Ratio, after giving pro forma effect to the incurrence of such indebtedness, exceeds2.0 to 1.0 (‘‘Incurrence Test’’). At September 30, 2016, the Company’s Consolidated Coverage Ratio wasapproximately 6.1 to 1.0. Consolidated Coverage Ratio is defined as the ratio of (i) Consolidated EBITDA(as defined in the indentures) for the period containing the most recent four consecutive fiscal quarters, to(ii) Consolidated Interest Expense (as defined in the indentures) for such period.
The indentures governing the Senior Notes restrict Sally Holdings and its subsidiaries from making certaindividends and distributions to equity holders and certain other restricted payments (hereafter, a‘‘Restricted Payment’’ or ‘‘Restricted Payments’’) to us. However, the indentures permit the making of suchRestricted Payments if, at the time of the making of such Restricted Payment, the Company satisfies theIncurrence Test as described above and the cumulative amount of all Restricted Payments made since theissue date of the applicable senior notes does not exceed the sum of: (i) 50% of Sally Holdings’ and itssubsidiaries’ cumulative consolidated net earnings since July 1, 2006 (for the senior notes due 2022 and thesenior notes due 2023) or since October 1, 2015 (for the senior notes due 2025), plus (ii) the proceeds fromthe issuance of certain equity securities or conversions of indebtedness to equity, in each case, since theissue date of the applicable senior notes plus (iii) the net reduction in investments in unrestrictedsubsidiaries since the issue date of the applicable senior notes plus (iv) the return of capital with respect toany sales or dispositions of certain minority investments since the issue date of the applicable senior notesplus (v) $350 million (for the senior notes due 2025). Further, in addition to certain other baskets, theindentures permit the Company to make additional Restricted Payments in an unlimited amount if, aftergiving pro forma effect to the incurrence of any indebtedness to make such Restricted Payment, theCompany’s Consolidated Total Leverage Ratio (as defined in the indentures) is less than 3.25 to 1.00. AtSeptember 30, 2016, the Company’s Consolidated Total Leverage Ratio was approximately 2.7 to 1.0.Consolidated Total Leverage Ratio is defined as the ratio of (i) Consolidated Total Indebtedness, asdefined in the indentures, minus cash and cash equivalents on-hand up to $100.0 million, in each case, as ofthe end of the most recently-ended fiscal quarter to (ii) Consolidated EBITDA (as defined in theindentures) for the period containing the most recent four consecutive fiscal quarters.
The ABL facility also restricts the making of Restricted Payments. More specifically, under the ABLfacility, Sally Holdings may make Restricted Payments if availability under the ABL facility equals orexceeds certain thresholds, and no default then exists under the facility. For Restricted Payments up to$30.0 million during each fiscal year, borrowing availability must equal or exceed the lesser of $75.0 millionor 15% of the borrowing base for 45 days prior to such Restricted Payment. For Restricted Payments inexcess of that amount, borrowing availability must equal or exceed the lesser of $100.0 million or 20% of
71
the borrowing base for 45 days prior to such Restricted Payment and the Consolidated Fixed ChargeCoverage Ratio (as defined below) must equal or exceed 1.1 to 1.0. Further, if borrowing availability equalsor exceeds the lesser of $150.0 million or 30% of the borrowing base, Restricted Payments are not limitedby the Consolidated Fixed Charge Coverage Ratio test. The Consolidated Fixed Charge Coverage Ratio isdefined as the ratio of (i) Consolidated EBITDA (as defined in the ABL facility) during the trailing twelve-month period preceding such proposed Restricted Payment minus certain unfinanced capital expendituresmade during such period and income tax payments paid in cash during such period to (ii) fixed charges (asdefined in the ABL facility). In addition, during any period that borrowing availability under the ABLfacility is less than the greater of $40.0 million or 10% of the borrowing base, the level of the ConsolidatedFixed Charge Coverage Ratio that the Company must satisfy is 1.0 to 1.0. As of September 30, 2016, theConsolidated Fixed Charge Coverage Ratio was approximately 3.1 to 1.0.
When used in this Annual Report, the phrase ‘‘Consolidated EBITDA’’ is intended to have the meaningascribed to such phrase in the ABL facility or the indentures governing the senior notes due 2022, 2023 and2025, as appropriate. EBITDA is not a recognized measurement under accounting principles generallyaccepted in the United States of America (‘‘GAAP’’) and should not be considered a substitute forfinancial performance and liquidity measures determined in accordance with GAAP, such as net earnings,operating earnings and operating cash flows.
We are currently in compliance with the agreements and instruments governing our debt, including ourfinancial covenants. Our ability to comply with these covenants in future periods will depend on ourongoing financial and operating performance, which in turn will be subject to economic conditions and tofinancial, market and competitive factors, many of which are beyond our control. Further, our ability tocomply with these covenants in future periods will also depend substantially on the pricing of our products,our success at implementing cost reduction initiatives and our ability to successfully implement our overallbusiness strategy. Please see ‘‘Risk Factors—Risks Relating to Our Substantial Indebtedness.’’
Capital Requirements
During the fiscal year ended September 30, 2016, we had total capital expenditures of approximately$143.4 million, including amounts incurred but not paid at September 30, 2016 (approximately$3.8 million), which were primarily in connection with the addition of new stores and store remodels,expansion or relocation of existing stores in the ordinary course of our business, upgrades to certaindistribution centers in the U.S. and ongoing information technology upgrades. For the fiscal year 2017, weanticipate capital expenditures of approximately $135.0 million, excluding acquisitions. Capitalexpenditures will be primarily to fund the addition of new stores, store remodels, upgrades to ourdistribution centers in the U.S., expansion or relocation of existing stores, as well as certain corporateprojects in the ordinary course of our business, including ongoing technology upgrades.
72
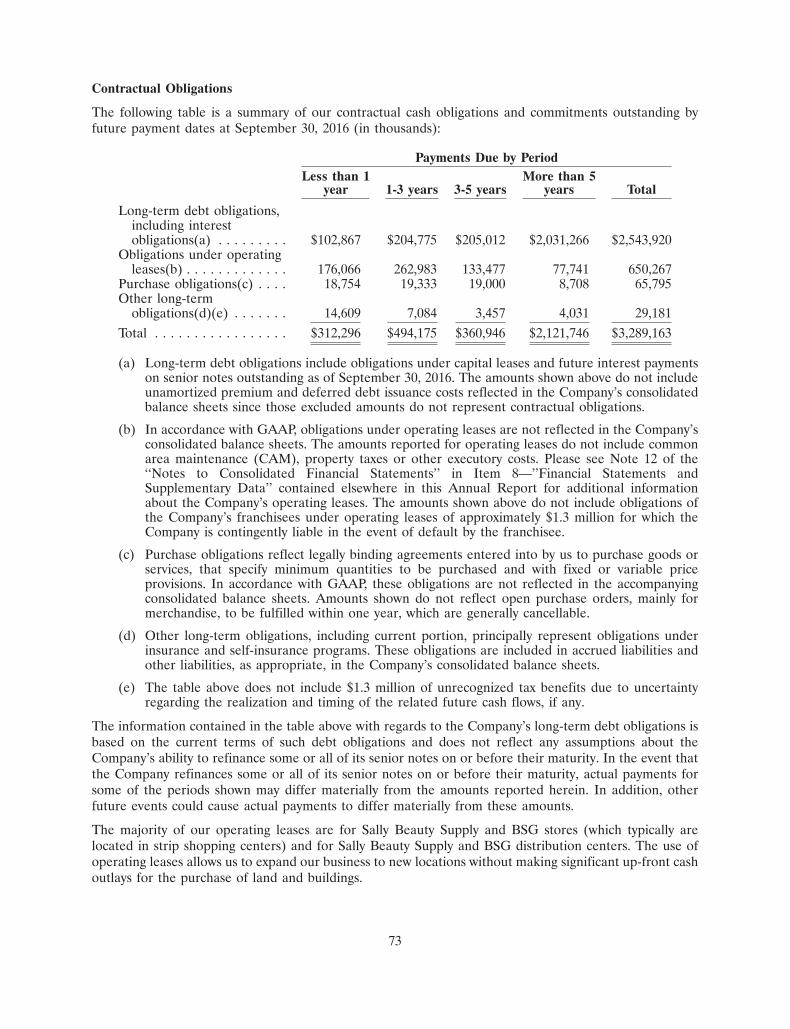
Contractual Obligations
The following table is a summary of our contractual cash obligations and commitments outstanding byfuture payment dates at September 30, 2016 (in thousands):
Payments Due by PeriodLess than 1 More than 5
year 1-3 years 3-5 years years Total
Long-term debt obligations,including interestobligations(a) . . . . . . . . . $102,867 $204,775 $205,012 $2,031,266 $2,543,920
Obligations under operatingleases(b) . . . . . . . . . . . . . 176,066 262,983 133,477 77,741 650,267
Purchase obligations(c) . . . . 18,754 19,333 19,000 8,708 65,795Other long-term
obligations(d)(e) . . . . . . . 14,609 7,084 3,457 4,031 29,181Total . . . . . . . . . . . . . . . . . $312,296 $494,175 $360,946 $2,121,746 $3,289,163
(a) Long-term debt obligations include obligations under capital leases and future interest paymentson senior notes outstanding as of September 30, 2016. The amounts shown above do not includeunamortized premium and deferred debt issuance costs reflected in the Company’s consolidatedbalance sheets since those excluded amounts do not represent contractual obligations.
(b) In accordance with GAAP, obligations under operating leases are not reflected in the Company’sconsolidated balance sheets. The amounts reported for operating leases do not include commonarea maintenance (CAM), property taxes or other executory costs. Please see Note 12 of the‘‘Notes to Consolidated Financial Statements’’ in Item 8—’’Financial Statements andSupplementary Data’’ contained elsewhere in this Annual Report for additional informationabout the Company’s operating leases. The amounts shown above do not include obligations ofthe Company’s franchisees under operating leases of approximately $1.3 million for which theCompany is contingently liable in the event of default by the franchisee.
(c) Purchase obligations reflect legally binding agreements entered into by us to purchase goods orservices, that specify minimum quantities to be purchased and with fixed or variable priceprovisions. In accordance with GAAP, these obligations are not reflected in the accompanyingconsolidated balance sheets. Amounts shown do not reflect open purchase orders, mainly formerchandise, to be fulfilled within one year, which are generally cancellable.
(d) Other long-term obligations, including current portion, principally represent obligations underinsurance and self-insurance programs. These obligations are included in accrued liabilities andother liabilities, as appropriate, in the Company’s consolidated balance sheets.
(e) The table above does not include $1.3 million of unrecognized tax benefits due to uncertaintyregarding the realization and timing of the related future cash flows, if any.
The information contained in the table above with regards to the Company’s long-term debt obligations isbased on the current terms of such debt obligations and does not reflect any assumptions about theCompany’s ability to refinance some or all of its senior notes on or before their maturity. In the event thatthe Company refinances some or all of its senior notes on or before their maturity, actual payments forsome of the periods shown may differ materially from the amounts reported herein. In addition, otherfuture events could cause actual payments to differ materially from these amounts.
The majority of our operating leases are for Sally Beauty Supply and BSG stores (which typically arelocated in strip shopping centers) and for Sally Beauty Supply and BSG distribution centers. The use ofoperating leases allows us to expand our business to new locations without making significant up-front cashoutlays for the purchase of land and buildings.
73
Off-Balance Sheet Financing Arrangements
At September 30, 2016 and 2015, we had no off-balance sheet financing arrangements other thanobligations under operating leases (see Contractual Obligations table above), and letters of credit (relatedto inventory purchases and self-insurance programs) in the aggregate amount of $21.6 million and$23.1 million, respectively.
Inflation
We believe inflation did not have a material effect on our results of operations during each of the threefiscal years in the period ended September 30, 2016. However, during the past few years, we haveexperienced an upswing in labor and real estate costs in the U.S. Employee compensation and rentexpenses represent two of our most significant operating expenses. A material increase in labor and realestate costs in the future, particularly during an extended period of time, could have a material adverseeffect on our results of operations.
Critical Accounting Estimates
The preparation of financial statements in conformity with GAAP requires us to make estimates andassumptions that affect the reported amounts of assets, liabilities, revenues and expenses and disclosure ofcontingent assets and liabilities in the financial statements. Actual results may differ from these estimates.We believe these estimates and assumptions are reasonable. We consider accounting policies to be criticalwhen they require us to make assumptions about matters that are highly uncertain at the time theaccounting estimate is made and when different estimates that our management reasonably could haveused have a material effect on the presentation of our financial condition, changes in financial condition orresults of operations.
Our critical accounting estimates include but are not limited to the valuation of inventory, vendor rebatesand concessions, retention of risk, income taxes, assessment of long-lived assets and intangible assets forimpairment and share-based payments.
Valuation of Inventory
Inventory is stated at the lower of cost, determined using the first-in, first-out (‘‘FIFO’’) method, or netrealizable value. When necessary, the Company adjusts the carrying value of inventory to the lower of costor net realizable value, including disposal costs, and for estimated inventory shrinkage. In assessing the netrealizable value of inventory, management considers several key factors including estimates of the futuredemand for the Company’s products, historical turn-over rates, the age and sales history of the inventory,and historic as well as anticipated changes in stock keeping units (‘‘SKUs’’). We estimate inventoryshrinkage between physical counts based upon our historical experience. Actual results differing fromthese estimates could significantly affect our inventory and cost of products sold and distribution expenses.Inventory shrinkage expense averaged approximately 1.0% of consolidated net sales in fiscal years 2016,2015 and 2014. A 10% increase or decrease in our estimate of inventory shrinkage at September 30, 2016,would impact net earnings by approximately $1.5 million, net of income tax.
Vendor Rebates and Concessions
The Company deems a cash consideration received from a supplier to be a reduction of the cost ofproducts sold unless it is in exchange for an asset or service or a reimbursement of a specific, incremental,identifiable cost incurred by the Company in selling the vendor’s products. The majority of cashconsideration received by the Company is considered to be a reduction of the cost of the related productsand is reflected in cost of products sold and distribution expenses in our consolidated statements ofearnings as the related products are sold. Any portion of such cash consideration received that isattributable to inventory on hand is reflected as a reduction of inventory. We consider the facts and
74
circumstances of the various contractual agreements with vendors in order to determine the appropriateclassification of amounts received in the consolidated statements of earnings. We record cashconsideration expected to be received from vendors in other receivables at the amount we believe will becollected. These receivables could be significantly affected if the actual amounts subsequently collecteddiffer from management’s expectations. A 10% increase or decrease in these receivables at September 30,2016, would impact net earnings by approximately $2.2 million, net of income tax.
Retention of Risk
Employee Health Insurance Liability
We maintain a largely self-funded program, primarily in the U.S., for healthcare benefits for employeeswho meet certain eligibility requirements. We cover the majority of expenses associated with these benefits,other than certain fees and out-of pocket expenses paid by the employees through payroll deductions.Payments for healthcare benefits below specified amounts (currently $350,000 per individual per year) areself-insured by us. We base our estimate of ultimate liability on trends in claim payment history, historicaltrends in claims incurred but not yet reported, and other components such as expected increases in medicalcosts, projected premium costs and the number of plan participants. We review our liability on a regularbasis and adjust our accruals accordingly. As of September 30, 2016 and 2015, we accrued an estimatedliability relating to employee health insurance of $7.7 million and $6.5 million, respectively.
Changes in facts and circumstances may lead to a change in the estimated liability due to revisions of theestimated ultimate costs of our employee healthcare benefits. In assessing the adequacy of our employeehealth insurance liability, management considers several key factors including estimates of medical costsand trends in claims. This liability could be significantly affected if actual results differ from management’sexpectations. A 10% increase or decrease in our employee health insurance liability at September 30, 2016would impact net earnings by approximately $0.5 million, net of income tax.
Workers’ Compensation Liability, General Liability, and Automobile and Property Liability
We maintain a large deductible insurance plan for workers’ compensation liability, general liability andautomobile and property liability loss exposures. We base our estimates of the ultimate liability on anactuarial analysis performed by an independent third-party actuary. We review our liability on a regularbasis and adjust our accruals accordingly. As of September 30, 2016 and 2015, our balance sheets includedan estimated liability related to these deductible and retention limits of approximately $21.1 million and$29.4 million, respectively.
Changes in facts and circumstances may lead to a change in the estimated liability due to revisions of theestimated ultimate costs that affect our workers’ compensation, general liability, and automobile andproperty liability insurance coverage. Changes in estimates occur over time due to such factors as claimsincidence and severity of injury or damages. Our liabilities could be significantly affected if actual resultsdiffer from management’s expectations or actuarial analyses. A 10% increase or decrease in our workers’compensation liability, general liability, and automobile and property liability at September 30, 2016 wouldimpact net earnings by approximately $1.3 million, net of income tax.
75
The change in the insurance and self-insurance liability was as follows (in thousands):
Fiscal Year EndedSeptember 30,
2016 2015
Balance at beginning of period . . . . . . . . . . . . . . . . . . . . . . . . $ 36,477 $ 39,103Self-insurance expense . . . . . . . . . . . . . . . . . . . . . . . . . . . . . . 69,668 74,277Payments, net of employee contributions . . . . . . . . . . . . . . . . . (76,966) (76,903)
Balance at end of period . . . . . . . . . . . . . . . . . . . . . . . . . . . . $ 29,179 $ 36,477
Income Taxes
We record income tax provisions in our consolidated financial statements based on an estimation ofcurrent income tax liabilities. The development of these provisions requires judgments about tax positions,potential outcomes and timing. If we prevail in tax matters for which provisions have been established orare required to settle matters in excess of established provisions, our effective tax rate for a particularperiod could be significantly affected.
For the fiscal years ended September 30, 2016, 2015 and 2014, the effective income tax rates were 37.0%,37.9% and 37.0%, respectively. The decrease in the effective income tax rate for the fiscal year endedSeptember 30, 2016, compared to the fiscal year ended September 30, 2015, is primarily due to decreasedlosses subject to a valuation allowance in certain of the Company’s foreign operations and a reduction innon-deductible executive compensation. For the fiscal year ending September 30, 2017, the annualeffective tax rate is expected to be in the range of 37.5% to 38.5%.
Deferred income taxes are recognized for the future tax consequences attributable to differences betweenthe financial statement carrying amounts of assets and liabilities and their respective tax bases. Deferredtax assets and liabilities are measured using enacted tax rates expected to apply to taxable income in theyears in which temporary differences are estimated to be recovered or settled. We believe that it ismore-likely-than-not that our results of operations in the future will generate sufficient taxable income torealize our deferred tax assets, net of the valuation allowance currently recorded. We have recorded avaluation allowance to account for uncertainties regarding the recoverability of certain deferred tax assets,primarily foreign loss carryforwards. In the future, if we determine that certain deferred tax assets will notbe realizable, the related adjustments could significantly affect our effective tax rate at that time. Theestimated tax benefit of an uncertain tax position is recorded in our financial statements only afterdetermining a more-likely-than-not probability that the uncertain tax position will withstand challenge, ifany, from applicable taxing authorities.
Assessment of Long-Lived Assets and Intangible Assets for Impairment
Long-lived assets, such as property and equipment, including store equipment, and purchased intangibleassets subject to amortization are reviewed for impairment whenever events or changes in circumstancesindicate that the carrying amount of an asset may not be fully recoverable. The recoverability of long-livedassets and intangible assets subject to amortization is assessed by comparing the net carrying amount ofeach asset to its total estimated undiscounted future cash flows expected to be generated by the asset. Ifthe carrying amount of an asset exceeds the sum of its undiscounted future cash flows, an impairmentcharge is recognized by the amount by which the carrying amount of the asset exceeds the estimated fairvalue of the asset.
Goodwill represents the excess of the purchase price over the fair value of the net assets acquired in abusiness combination. Goodwill and intangible assets with indefinite lives are not amortized; rather, theyare reviewed for impairment at least annually, and whenever events or changes in circumstances indicate it
76
is more-likely-than-not that the value of the asset may be impaired. For the purpose of reviewing goodwillfor impairment, the Company aggregates components of its operating segments with similar economiccharacteristics into a reportable unit.
When assessing goodwill and intangible assets with indefinite lives for potential impairment, managementcompares the carrying amount of the asset to its fair value. In addition, management considers whether thevalue of an asset has been impaired by evaluating if various factors (including current operating results,anticipated future results and cash flows, and relevant market and economic conditions) indicate a possibleimpairment.
When appropriate, the Company first assesses relevant qualitative factors in order to determine whether itis necessary to perform the quantitative impairment tests otherwise required under ASC Topic 350,Intangibles-Goodwill and Other (‘‘ASC 350’’). Based on the reviews performed by the Company and aftertaking into account recent potential triggering events, including the recent decline in the average dailytrading prices for shares of our common stock, there were no material asset impairments recognized in thecurrent or prior fiscal years presented, except for asset impairments in the aggregate amount of$2.5 million recognized in connection with the Germany restructuring in the fiscal year endedSeptember 30, 2015.
Share-Based Payments
We recognize share-based compensation expense on a straight-line basis over the vesting period or, inconnection with service-based awards, to the date a participant becomes eligible for retirement, if earlier.For fiscal years 2016, 2015 and 2014, total compensation cost charged against income and included inselling, general and administrative expenses for share-based compensation arrangements was $12.6 million,$16.8 million and $22.1 million, respectively.
The amount of share-based compensation expense related to stock option awards is determined based onthe fair value of each stock option award on the date of grant. The fair value of each stock option isestimated using the Black-Scholes option pricing model using the following valuation inputs: expected life,volatility, risk-free interest rate and dividend yield. The expected life of stock options represents the periodof time that the stock options granted are expected to be outstanding and is based on historical employeetenure and option exercise trends. The expected volatility reflects the average historical volatility for theCompany’s common stock. The risk-free interest rate is based on the zero-coupon U.S. Treasury notes witha remaining term, at the grant date, equal to the expected life of the stock options. The dividend yieldrepresents our anticipated cash dividend over the expected life of the stock options. The amount ofexpense recognized in connection with stock option awards is significantly affected by these estimates. Inaddition, we record periodic expense in connection with stock option awards based on an estimate of thenumber of stock options actually expected to vest, which requires us to estimate future forfeitures. Weestimate future forfeitures based on our historical experience. Actual forfeitures could differ from theseestimates and could significantly affect the amount and timing of recognition of our share-basedcompensation expense related to stock option awards.
The amount of share-based compensation expense related to performance-based restricted stock awards isdetermined based on the fair value of each award on the date of grant, which is based on the closingmarket price of the Company’s common stock on the date of grant. In addition, we record periodicexpense (which is estimated quarterly) in connection with performance-based awards based on an estimateof the number of awards actually expected to vest. This requires that we estimate the Company’s futureperformance over the performance period (generally three years) associated with each award. Actualperformance could differ from these estimates and could significantly affect the amount and timing ofrecognition of our share-based compensation expense related to performance-based awards.
We have based all share-based compensation estimates on management’s assumptions as of September 30,2016. Our estimates for future periods may be based on different assumptions and, accordingly, may differ.
77
We believe that our share-based compensation expense is based on reasonable estimates and assumptions.However, if actual results are not consistent with our estimate or assumptions, we may be exposed tochanges in share-based compensation expense that could be material. A 10% change in our share-basedcompensation expense for the year ended September 30, 2016 would affect earnings by approximately$0.8 million, net of income tax.
Recent Accounting Pronouncements
The Company has not yet adopted and is currently assessing the potential effect of the followingpronouncements on its consolidated financial statements:
In November 2015, the Financial Accounting Standards Board (‘‘FASB’’) issued Accounting StandardsUpdate (‘‘ASU’’) No. 2015-17, Income Taxes (Topic 740): Balance Sheet Classification of Deferred IncomeTaxes (‘‘ASU 2015-17’’) which aims to simplify the classification of deferred taxes on the balance sheet.More specifically, ASU 2015-17 will require that all deferred tax assets and liabilities, and any relatedvaluation allowance, be reported as noncurrent in a classified balance sheet. The new guidance will replacethe existing practice of reporting deferred taxes for each tax jurisdiction (or taxing component of ajurisdiction) as (a) a net current asset or liability and (b) a net noncurrent asset or liability. The newguidance does not change the existing requirement that only permits offsetting assets and liabilities withinthe same jurisdiction. For public companies, this amendment is effective for fiscal years, and interimperiods within those fiscal years, beginning after December 15, 2016. Early adoption is permitted.
In February 2016, the FASB issued ASU No. 2016-02, Leases (‘‘ASU 2016-02’’), which will require lesseesto report on their balance sheets a right-of-use asset and a lease liability in connection with most leaseagreements classified as operating leases under the current guidance. The lease liability will be measuredbased on the present value of future lease payments, subject to certain conditions. The right-of-use assetwill be measured based on the initial amount of the liability, plus certain initial direct costs. The newguidance will further require that leases be classified at inception as either (a) operating leases or(b) finance leases. For operating leases, periodic expense will generally be flat (straight-line) throughoutthe life of the lease. For finance leases, periodic expense will decline (similar to capital leases undercurrent rules) over the life of the lease. The new standard must be adopted using a modified retrospectivetransition method. For public companies, this amendment is effective for fiscal years, and interim periodswithin those fiscal years, beginning after December 15, 2018. Early adoption is permitted. The Companyhas completed a preliminary assessment of the potential impact of adopting ASU 2016-02 on its financialstatements. At September 30, 2016, adoption of ASU 2016-02 would result in recognition of a right-of-useasset in the estimated amount of approximately $600.0 million and a lease liability for a similar amount inthe Company’s consolidated balance sheet. The Company does not believe adoption of ASU 2016-02 willhave a material impact on the Company’s earnings or cash flows. At September 30, 2016, the Company hasnot made a decision to early adopt the new standard. The amount of the right-of-use asset and the leaseliability ultimately recognized by the Company may materially defer from this preliminary estimate,including as a result of future organic growth in our business and potential acquisitions.
In March 2016, the FASB issued ASU No. 2016-09, Improvements to Employee Share-Based PaymentAccounting, intended to simplify various aspects of how share-based payments are recorded and presentedon the financial statements. For example, the new guidance will require that all the income tax effectrelated to share-based payments be recorded in income tax expense. The new guidance further removesthe current requirement to delay recognition of a windfall tax benefit until it reduces current taxes payable.In addition, the new standard will require that excess tax benefits and shortfalls from share-basedcompensation awards be reported as operating activities in the statement of cash flows. For publiccompanies, these amendments are effective for fiscal years, and interim periods within those fiscal years,beginning after December 15, 2016. Early adoption is permitted. The Company has not completed itsassessment of the potential impact of adopting the provisions of ASU 2016-09 on its financial statements.The adoption of ASU 2016-09, however, could result in a material impact to the Company’s consolidated
78
results of operations and cash flows from operating activities in the period of adoption, and the applicationof the new standard in the future could result in greater fluctuation in the Company’s effective income taxrate and income tax expense when compared to results under the current accounting guidance.
In addition, the Company has not yet adopted the following recent accounting pronouncements and doesnot believe their adoption will have a material effect on its consolidated financial statements:
In May 2014, the FASB issued ASU No. 2014-09, Revenue from Contracts with Customers which willsupersede Accounting Standards Codification (‘‘ASC’’) Topic 605, Revenue Recognition. In August 2015,the FASB deferred the effective date of this new standard by one year. A core principle of the newguidance is that an entity should measure revenue in connection with its sale of goods and services to acustomer based on an amount that depicts the consideration to which the entity expects to be entitled inexchange for each of those goods and services. For a contract that involves more than one performanceobligation, the entity must (a) determine or, if necessary, estimate the standalone selling price at inceptionof the contract for the distinct goods or services underlying each performance obligation and (b) allocatethe transaction price to each performance obligation on the basis of the relative standalone selling prices.In addition, under the new guidance, an entity should recognize revenue when (or as) it satisfies eachperformance obligation under the contract by transferring the promised good or service to the customer. Agood or service is deemed transferred when (or as) the customer obtains control of that good or service.The new standard permits the use of either the retrospective or cumulative effect transition method. Forpublic companies, this amendment is effective for fiscal years, and interim periods within those fiscal years,beginning after December 15, 2017. Early application is permitted, but no earlier than December 16, 2016.The Company has not yet selected a transition method.
In April 2015, the FASB issued ASU No. 2015-05, Customer’s Accounting for Fees Paid in Cloud ComputingArrangement. This pronouncement provides guidance to determine whether a cloud-based computingarrangement includes a software license. If a cloud-based computing arrangement includes a softwarelicense, the customer must account for the software element of the arrangement consistent with theacquisition of other software licenses. Otherwise, the customer must account for the arrangement as aservice contract. The new standard permits the use of either the prospective or retrospective transitionmethod. For public companies, this amendment is effective for fiscal years, and interim periods withinthose fiscal years, beginning after December 15, 2015.
In September 2015, the FASB issued ASU’’ No. 2015-16, Business Combinations (Topic 805): Simplifying theAccounting for Measurement-Period Adjustments (‘‘ASU 2015-16’’) which will eliminate the currentrequirement to recognize measurement-period adjustments to provisional amounts retrospectively.Instead, ASU 2015-16 requires the acquirer to recognize measurement-period adjustments, as well as theimpact on earnings of changes in depreciation, amortization and similar items (if any) resulting from thechange to the provisional amounts, in the period when the amount of each measurement-periodadjustment is determined. For public companies, this amendment is effective for fiscal years, and interimperiods within those fiscal years, beginning after December 15, 2015.
ITEM 7A. QUANTITATIVE AND QUALITATIVE DISCLOSURES ABOUT MARKET RISK
As a multinational corporation, we are subject to certain market risks including foreign currencyfluctuations, interest rates and government actions. We consider a variety of practices to manage thesemarket risks, including, when deemed appropriate, the occasional use of derivative financial instruments.Currently, we do not purchase or hold any derivative instruments for speculative or trading purposes.
Foreign currency exchange rate risk
We are exposed to potential gains or losses from foreign currency fluctuations affecting net investmentsand earnings denominated in foreign currencies. Our primary exposures are to changes in exchange ratesfor the U.S. dollar versus the Euro, the British pound sterling, the Canadian dollar, the Chilean peso, and
79
the Mexican peso. In addition, we currently have exposure to the currencies of several countries located inSouth America. Our various foreign currency exposures at times offset each other, sometimes providing anatural hedge against foreign currency risk. For each of the fiscal years 2016, 2015 and 2014, approximately17% of our consolidated net sales were made in currencies other than the U.S. dollar. Consolidated netsales for the fiscal year ended September 30, 2016, are inclusive of an approximately $56.4 million negativeimpact from changes in foreign currency exchange rates and other comprehensive income reflects$22.3 million in foreign currency translation adjustments. For the fiscal years 2016, 2015 and 2014,fluctuations in the U.S. dollar exchange rates did not otherwise have a material effect on our consolidatedfinancial condition and consolidated results of operations.
A 10% increase or decrease in the exchange rates for the U.S. dollar versus the foreign currencies to whichwe have exposure, would have impacted our consolidated net sales by approximately 1.8% in the fiscal year2016, and would have impacted our consolidated net assets by approximately 2.3% at September 30, 2016.
As more fully discussed elsewhere in this Annual Report, the Company uses from time to time foreignexchange contracts to mitigate its exposure to changes in foreign currency exchange rates. AtSeptember 30, 2016, the aggregate net fair value of all foreign exchange contracts held by the Companywas approximately $0.3 million, consisting of contracts in a liability position.
The Company’s foreign currency derivatives are not designated as hedges and do not currently meet therequirements for hedge accounting. Accordingly, the changes in fair value of these derivative instruments,which are adjusted quarterly, are recorded in our consolidated statements of earnings. Selling, general andadministrative expenses reflect a net loss of $1.1 million for the fiscal year ended September 30, 2016, andnet gains of $2.7 million and $1.9 million in the fiscal years ended September 30, 2015 and 2014,respectively in connection with all of the Company’s foreign currency derivatives instruments, includingmarked-to-market adjustments.
Interest rate risk
We and certain of our subsidiaries are sensitive to interest rate fluctuations primarily as a result ofborrowings under our ABL facility from time to time. In order to enhance our ability to manage riskrelating to cash flow and interest rate exposure, we and/or our other subsidiaries who are borrowers underour ABL facility may from time to time enter into and maintain derivative instruments, such as interestrate swap agreements, for periods consistent with the related underlying exposures. At September 30, 2016,we had no borrowings outstanding under our ABL facility and we held no interest rate swaps or similarderivative instruments.
Credit risk
We are exposed to credit risk in connection with certain assets, primarily cash equivalents, short-terminvestments and accounts receivable. We believe that the credit risk associated with cash equivalents andshort-term investments, if any, is largely mitigated by our policy of investing in a diversified portfolio ofsecurities with high credit ratings. We provide credit to customers in the ordinary course of business andperform ongoing credit evaluations. We believe that our exposure to concentrations of credit risk withrespect to trade receivables is largely mitigated by our broad customer base and that our allowance fordoubtful accounts is sufficient to cover customer credit risks at September 30, 2016.
The derivative instruments held by the Company from time to time, including the foreign currencyderivatives mentioned above, expose the Company to credit risk in the event of default by a counterparty.We believe that such exposure is mitigated by the substantial resources and strong creditworthiness of thecounterparties to our derivative instruments at September 30, 2016. In the event that a counterpartydefaults in its obligation under our derivative instruments, we could incur substantial financial losses.However, at the present time, no such losses are deemed probable.
80
ITEM 8. FINANCIAL STATEMENTS AND SUPPLEMENTARY DATA
Please see ‘‘Index to Financial Statements’’ which is located on page 92 of this Annual Report.
ITEM 9. CHANGES IN AND DISAGREEMENTS WITH ACCOUNTANTS ON ACCOUNTING ANDFINANCIAL DISCLOSURE
None.
ITEM 9A. CONTROLS AND PROCEDURES
Background. Attached as exhibits to this Annual Report on Form 10-K are certifications of our ChiefExecutive Officer (‘‘CEO’’) and our acting Principal Financial Officer (‘‘PFO’’), which are required inaccordance with Rule 13a-14 of the Exchange Act. This ‘‘Controls and Procedures’’ section includesinformation concerning the controls and controls evaluation referred to in the certifications. Part II,Item 8—Financial Statements and Supplementary Data of this Annual Report on Form 10-K sets forth theattestation report of KPMG LLP, our independent registered public accounting firm, regarding its audit ofour internal control over financial reporting. This section should be read in conjunction with thecertifications and the KPMG attestation report for a more complete understanding of the topics presented.
Controls Evaluation and Related CEO and PFO Certifications. Our management, with the participation ofour CEO and PFO, conducted an evaluation of the effectiveness of the design and operation of ourdisclosure controls and procedures as of the end of the period covered by this Annual Report. The controlsevaluation was conducted by our Disclosure Committee, comprised of senior representatives from ourfinance, accounting, internal audit, and legal departments under the supervision of our CEO and PFO.
Certifications of our CEO and our PFO, which are required in accordance with Rule 13a-14 of theExchange Act, are attached as exhibits to this Annual Report. This ‘‘Controls and Procedures’’ sectionincludes the information concerning the controls evaluation referred to in the certifications, and it shouldbe read in conjunction with the certifications for a more complete understanding of the topics presented.
Limitations on the Effectiveness of Controls. We do not expect that our disclosure controls and procedureswill prevent all errors and all fraud. A system of controls and procedures, no matter how well conceivedand operated, can provide only reasonable, not absolute, assurance that the objectives of the system aremet. Because of the limitations in all such systems, no evaluation can provide absolute assurance that allcontrol issues and instances of fraud, if any, within the Company have been detected. Furthermore, thedesign of any system of controls and procedures is based in part upon certain assumptions about thelikelihood of future events, and there can be no assurance that any design will succeed in achieving itsstated goals under all potential future conditions, regardless of how unlikely. Because of these inherentlimitations in a cost-effective system of controls and procedures, misstatements or omissions due to erroror fraud may occur and not be detected.
Scope of the Controls Evaluation. The evaluation of our disclosure controls and procedures included areview of their objectives and design, our implementation of the controls and procedures and the effect ofthe controls and procedures on the information generated for use in this Annual Report. In the course ofthe evaluation, we sought to identify whether we had any data errors, control problems or acts of fraud andto confirm that appropriate corrective action, including process improvements, was being undertaken ifneeded. This type of evaluation is performed on a quarterly basis so that conclusions concerning theeffectiveness of our disclosure controls and procedures can be reported in our Quarterly Reports onForm 10-Q and our Annual Reports on Form 10-K. Many of the components of our disclosure controlsand procedures are also evaluated by our internal audit department, by our legal department and bypersonnel in our finance organization. The overall goals of these various evaluation activities are tomonitor our disclosure controls and procedures on an ongoing basis, and to maintain them as dynamicsystems that change as conditions warrant.
81
Conclusions regarding Disclosure Controls. Based on the required evaluation of our disclosure controlsand procedures, our CEO and PFO have concluded that, as of September 30, 2016, we maintain disclosurecontrols and procedures that are effective in providing reasonable assurance that information required tobe disclosed by us in the reports that we file or submit under the Exchange Act is recorded, processed,summarized and reported within the time periods specified in the SEC’s rules and forms, and that suchinformation is accumulated and communicated to our management, including our CEO and PFO, asappropriate to allow timely decisions regarding required disclosure.
Management’s Annual Report on Internal Control over Financial Reporting.
Management of the Company, including the CEO and PFO, is responsible for establishing and maintainingadequate internal control over financial reporting as defined in Rule 13a-15(f) under the Exchange Act.Our internal control system was designed to provide reasonable assurance to management and our Boardof Directors regarding the reliability of financial reporting and the preparation of financial statements forexternal purposes in accordance with generally accepted accounting principles.
All internal control systems, no matter how well designed, have inherent limitations. A system of internalcontrols may become inadequate over time because of changes in conditions or deterioration in the degreeof compliance with the policies or procedures. Therefore, even those systems determined to be effectivecan provide only reasonable assurance with respect to financial statement preparation and presentation.
Management assessed the effectiveness of our internal control over financial reporting as of September 30,2016 using the criteria set forth by the Committee of Sponsoring Organizations of the TreadwayCommission (‘‘COSO’’) in Internal Control—Integrated Framework (2013). Based on this assessment,management has concluded that, as of September 30, 2016 our internal control over financial reportingwas effective to provide reasonable assurance regarding the reliability of financial reporting and thepreparation of financial statements for external purposes in accordance with generally accepted accountingprinciples based on such criteria.
Report of Independent Registered Public Accounting Firm. Please refer to KPMG’s Report of IndependentRegistered Public Accounting Firm on Internal Control over Financial Reporting on page F-1 of thefinancial statements, which begin on page 92 of this Annual Report.
Changes in Internal Control over Financial Reporting. During our last fiscal quarter, other than asdescribed below, there have been no changes in our internal control over financial reporting that havematerially affected, or are reasonably likely to materially affect, our internal control over financialreporting.
During our last fiscal quarter, we implemented the Oracle enterprise resource planning software(‘‘Oracle’’), hosted by the International Business Machines Corporation (IBM), to replace our previousenterprise resource planning system, hosted internally. This new software affects aspects of our accountingand financial reporting systems, and our processes and internal control environment for U.S and Canadaoperations, including global consolidation for financial reporting purposes. These changes were notimplemented in response to a significant control deficiency or material weakness, and we believe that thesechanges will improve our overall system of internal control over financial reporting.
ITEM 9B. OTHER INFORMATION
None.
82
PART III
ITEM 10. DIRECTORS, EXECUTIVE OFFICERS AND CORPORATE GOVERNANCE
The Board of Directors has adopted: (i) Corporate Governance Guidelines and a (ii) Code of BusinessConduct and Ethics that apply to directors, officers and employees. Copies of these documents and thecommittee charters are available on our website at www.sallybeautyholdings.com and are available in printto any person, without charge, upon written request to our Vice President of Investor Relations. We intendto disclose on our website at www.sallybeautyholdings.com any substantive amendment to, or waiver from, aprovision of the Code of Business Conduct and Ethics that applies to these individuals or personsperforming similar functions.
The additional information required by Item 10 of this Annual Report on Form 10-K is incorporatedherein by reference from our Proxy Statement related to the 2017 Annual Meeting of Stockholders underthe headings ‘‘Proposal 1—Election of Directors,’’ ‘‘Executive Officers of the Registrant,’’ ‘‘InformationRegarding Corporate Governance, the Board, and Its Committees,’’ ‘‘Section 16(a) Beneficial OwnershipReporting Compliance’’ and ‘‘Report of the Audit Committee.’’
ITEM 11. EXECUTIVE COMPENSATION
The information required by Item 11 of this Annual Report on Form 10-K is incorporated herein byreference from our Proxy Statement related to the 2017 Annual Meeting of Stockholders under theheadings ‘‘Information on the Compensation of Directors,’’ ‘‘Compensation Discussion and Analysis,’’‘‘Compensation Committee Report,’’ ‘‘Executive Compensation’’ and ‘‘Compensation CommitteeInterlocks and Insider Participation.’’
ITEM 12. SECURITY OWNERSHIP OF CERTAIN BENEFICIAL OWNERS AND MANAGEMENT ANDRELATED STOCKHOLDER MATTERS
The information required by Item 12 of this Annual Report on Form 10-K is incorporated herein byreference from our Proxy Statement related to the 2017 Annual Meeting of Stockholders under theheading ‘‘Ownership of Securities.’’
83
EQUITY COMPENSATION PLAN INFORMATION
The following table gives information as of September 30, 2016, about our common stock that may beissued under all of our existing equity compensation plans:
Number of securitiesremaining available for
Number of securities to Weighted-average future issuance underbe issued upon exercise exercise price of equity compensation plansof outstanding options, outstanding options, (excluding securitieswarrants and rights(1) warrants and rights reflected in column (a))(2)
Plan Category (a) (b) (c)
Equity compensationplans approved bysecurity holders . . . . . 6,239,389 $22.95 5,909,854
Equity compensationplans not approved bysecurity holders . . . . . N/A N/A N/A
Total . . . . . . . . . . . . . 6,239,389 $22.95 5,909,854
(1) Includes options issued and available for exercise and shares available for issuance in connection withpast awards under the Sally Beauty Holdings, Inc. Amended and Restated 2010 Omnibus IncentivePlan (‘‘the 2010 Plan’’) and predecessor share-based compensation plans. We currently grant awardsonly under the 2010 Plan.
(2) Represents shares that are available for issuance pursuant to restricted stock or other full valueawards under the 2010 Plan, as amended.
ITEM 13. CERTAIN RELATIONSHIPS AND RELATED TRANSACTIONS, AND DIRECTORINDEPENDENCE
The information required by Item 13 of this Annual Report on Form 10-K is incorporated herein byreference from our Proxy Statement related to the 2017 Annual Meeting of Stockholders under theheadings ‘‘Information Regarding Corporate Governance, the Board, and Its Committees,’’‘‘Compensation Committee Interlocks and Insider Participation’’ and ‘‘Certain Relationships and RelatedParty Transactions.’’
ITEM 14. PRINCIPAL ACCOUNTING FEES AND SERVICES
The information required by Item 14 of this Annual Report on Form 10-K is incorporated herein byreference from our Proxy Statement related to the 2017 Annual Meeting of Stockholders under theheading ‘‘Proposal 4—Ratification of Selection of Auditors.’’
84
PART IV
ITEM 15. EXHIBITS, FINANCIAL STATEMENT SCHEDULES
Documents filed as part of this Annual Report:
(a) List of Financial Statements and Financial Statement Schedules
Please see ‘‘Index to Financial Statements’’ which is located on page 92 of this Annual Report.
(b) Exhibits
The following exhibits are filed as part of this Annual Report or are incorporated herein by reference:
Exhibit No. Description
3.1 Third Restated Certificate of Incorporation of Sally Beauty Holdings, Inc., datedJanuary 30, 2014, which is incorporated herein by reference from Exhibit 3.3 to theCompany’s Current Report on Form 8-K filed on January 30, 2014
3.2 Sixth Amended and Restated Bylaws of Sally Beauty Holdings, Inc., dated July 30, 2015,which is incorporated herein by reference from Exhibit 3.1 to the Company’s CurrentReport on Form 8-K filed on August 6, 2015
4.1 Credit Agreement dated as of November 12, 2010 among Sally Holdings LLC, BeautySystems Group LLC, Sally Beauty Supply LLC, as domestic borrowers, Beauty SystemsGroup (Canada), Inc., as Canadian borrower, SBH Finance B.V., as foreign borrower, theguarantors from time to time party hereto, Bank of America, N.A., as administrative agentand collateral agent, Bank of America, N.A. (acting through its Canada branch), asCanadian agent, the other lenders party hereto, JPMorgan Chase Bank, N.A., asdocumentation agent, Wells Fargo Capital Finance, LLC, as syndication agent, Banc ofAmerica Securities LLC, Wells Fargo Capital Finance, LLC, as joint lead arrangers and jointbook managers, which is incorporated herein by reference from Exhibit 4.13 to theCompany’s Quarterly Report on Form 10-Q filed on February 3, 2011
4.2 Amendment No. 1 dated June 8, 2012, to that certain Credit Agreement dated as ofNovember 12, 2010 among the Borrowers, the Guarantors, the Administrative Agent, theCollateral Agent, the Canadian Agent and the Lenders party thereto (as such terms aredefined therein), which is incorporated herein by reference from Exhibit 4.1 to theCompany’s Current Report on Form 8-K filed on June 14, 2012
4.3 Second Amendment to Credit Agreement dated July 26, 2013, to that certain CreditAgreement dated as of November 12, 2010 among the Borrowers, the Guarantors, theLenders party thereto, the Administrative Agent, the Collateral Agent, the SyndicationAgent and the Documentation Agent (as such terms are defined therein), which isincorporated herein by reference from Exhibit 4.3 to the Company’s Annual Report onForm 10-K filed on November 14, 2013†
4.4 Amended and Restated Security Agreement by Sally Holdings LLC, Beauty SystemsGroup LLC, Sally Beauty Supply LLC, as the domestic borrowers and the other domesticborrowers and domestic guarantors party hereto from time to time and Bank of America,N.A. as collateral agent dated as of July 26, 2013, which is incorporated herein by referencefrom Exhibit 4.4 to the Company’s Annual Report on Form 10-K filed on November 14,2013†
85
4.5 Amended and Restated General Security Agreement by Beauty Systems Group(Canada), Inc., as the Canadian borrower and Bank of America, N.A., (acting through itsCanada branch), as Canadian agent dated as of July 26, 2013, which is incorporated hereinby reference from Exhibit 4.5 to the Company’s Annual Report on Form 10-K filed onNovember 14, 2013†
4.6 Joinder to Loan Documents, dated as of December 20, 2011, by and among SallyHoldings LLC, Beauty Systems Group LLC, Sally Beauty Supply LLC, Beauty SystemsGroup (Canada), Inc., SBH Finance B.V., the Guarantors named therein, Sally BeautyHoldings, Inc., Sally Investment Holdings LLC and Bank of America, N.A., asadministrative agent and as collateral agent, which is incorporated herein by reference fromExhibit 4.10 to the Company’s Quarterly Report on Form 10-Q filed on February 2, 2012†
4.7 Joinder to Loan Documents, dated as of May 28, 2015, by and among Sally Holdings LLC,Beauty Systems Group LLC, Sally Beauty Supply LLC, Beauty Systems Group(Canada), Inc., SBH Finance B.V., the Guarantors named therein, Sally Beauty MilitarySupply LLC, Loxa Beauty LLC and Bank of America, N.A., as administrative agent and ascollateral agent, which is incorporated herein by reference from Exhibit 4.1 to theCompany’s Quarterly Report on Form 10-Q filed on August 6, 2015†
4.8 Indenture, dated as of May 18, 2012, by and among Sally Holdings LLC, Sally Capital Inc.and Wells Fargo Bank, National Association, which is incorporated herein by reference fromExhibit 4.1 to the Company’s Current Report on Form 8-K filed on May 18, 2012
4.9 Supplemental Indenture, dated as of May 18, 2012, by and among Sally Holdings LLC, SallyCapital Inc., the guarantors listed therein and Wells Fargo Bank, National Association(including the form of Note attached as an exhibit hereto), which is incorporated herein byreference from Exhibit 4.2 to the Company’s Current Report on Form 8-K filed on May 18,2012
4.10 Second Supplemental Indenture, dated as of October 29, 2013, by and among SallyHoldings LLC, Sally Capital Inc., the guarantors listed therein and Wells Fargo Bank,National Association (including the form of Note attached as an exhibit thereto), which isincorporated herein by reference from Exhibit 4.2 to the Company’s Current Report onForm 8-K filed on October 29, 2013
4.11 Third Supplemental Indenture, dated as of May 28, 2015, by and among Loxa Beauty LLC ,Sally Beauty Military Supply LLC, Sally Holdings LLC, Sally Capital Inc., each existingParent Guarantor and Subsidiary Guarantor listed therein and Wells Fargo Bank, NationalAssociation, which is incorporated herein by reference from Exhibit 4.2 to the Company’sQuarterly Report on Form 10-Q filed on August 6, 2015
4.12 Third Supplemental Indenture, dated as of May 28, 2015, by and among Loxa Beauty LLC ,Sally Beauty Military Supply LLC, Sally Holdings LLC, Sally Capital Inc., each existingParent Guarantor and Subsidiary Guarantor listed therein and Wells Fargo Bank, NationalAssociation, which is incorporated herein by reference from Exhibit 4.3 to the Company’sQuarterly Report on Form 10-Q filed on August 6, 2015
4.13 Third Supplemental Indenture, dated as of December 3, 2015, by and among SallyHoldings LLC, Sally Capital Inc., the guarantors listed therein and Wells Fargo Bank,National Association (including the form of Note attached as an exhibit thereto), which isincorporated herein by reference from Exhibit 4.2 to the Company’s Current Report onForm 8-K filed on December 3, 2015
86
10.1 Tax Allocation Agreement, dated as of June 19, 2006, among Alberto-Culver Company, NewAristotle Holdings, Inc., New Sally Holdings, Inc. and Sally Holdings, Inc., which isincorporated herein by reference from Exhibit 10.1 to Amendment No. 3 to the Company’sRegistration Statement on Form S-4 (File No. 333-136259) filed on October 10, 2006
10.2 First Amendment to the Tax Allocation Agreement, dated as of October 3, 2006, amongAlberto-Culver Company, New Aristotle Holdings, Inc., New Sally Holdings, Inc. and SallyHoldings, Inc., which is incorporated herein by reference from Exhibit 10.2 to AmendmentNo. 3 to the Company’s Registration Statement on Form S-4 (File No. 333-136259) filed onOctober 10, 2006
10.3 Second Amendment to the Tax Allocation Agreement, dated as of October 26, 2006, amongAlberto-Culver Company, New Aristotle Holdings, Inc., New Sally Holdings, Inc. and SallyHoldings, Inc., which is incorporated herein by reference from Exhibit 10.01 to theCompany’s Current Report on Form 8-K filed on October 30, 2006
10.4 Sally Beauty Holdings, Inc. 2007 Omnibus Incentive Plan, which is incorporated herein byreference from Exhibit 4.4 to the Company’s Registration Statement on Form S-8 filed onMay 3, 2007
10.5 2007 Form of Stock Option Agreement for Employees pursuant to the Sally BeautyHoldings, Inc. 2007 Omnibus Incentive Plan, which is incorporated herein by reference fromExhibit 10.2 to the Company’s Current Report on Form 8-K filed on April 27, 2007
10.6 2007 Form of Restricted Stock Unit Agreement for Independent Directors pursuant to theSally Beauty Holdings, Inc. 2007 Omnibus Incentive Plan, which is incorporated herein byreference from Exhibit 10.3 to the Company’s Current Report on Form 8-K filed onApril 27, 2007
10.7 2009 Form of Stock Option Agreement for Employees pursuant to the Sally BeautyHoldings, Inc. 2007 Omnibus Incentive Plan, which is incorporated herein by reference fromExhibit 10.23 to the Company’s Annual Report on Form 10-K filed on November 20, 2008
10.8 2009 Form of Restricted Stock Unit Agreement for Independent Directors pursuant to theSally Beauty Holdings, Inc. 2007 Omnibus Incentive Plan, which is incorporated herein byreference from Exhibit 10.24 to the Company’s Annual Report on Form 10-K filed onNovember 20, 2008
10.9 Tax Sharing Agreement, dated as of November 16, 2006, made and entered into by andamong Sally Beauty Holdings, Inc., Sally Investment Holdings LLC and Sally Holdings LLC,which is incorporated herein by reference from Exhibit 10.14 of the Quarterly Report onForm 10-Q of Sally Holdings LLC and Sally Capital Inc. filed on August 29, 2007
10.10 Form of Option Exercise Period Extension Agreement for Retired Executives, which isincorporated herein by reference from Exhibit 10.3 to the Company’s Quarterly Report onForm 10-Q filed on May 6, 2009
10.11 Amended and Restated Alberto-Culver Company Employee Stock Option Plan of 2003,which is incorporated herein by reference from Exhibit 10.28 to the Company’s AnnualReport on Form 10-K filed on November 19, 2009
10.12 2010 Form of Restricted Stock Unit Agreement for Independent Directors pursuant to theSally Beauty Holdings, Inc. 2007 Omnibus Incentive Plan, which is incorporated herein byreference from Exhibit 10.29 to the Company’s Annual Report on Form 10-K filed onNovember 19, 2009
87
10.13 2010 Form of Restricted Stock Agreement for Employees pursuant to the Sally BeautyHoldings, Inc. 2007 Omnibus Incentive Plan, which is incorporated herein by reference fromExhibit 10.30 to the Company’s Annual Report on Form 10-K filed on November 19, 2009
10.14 2010 Form of Stock Option Agreement for Employees pursuant to the Sally BeautyHoldings, Inc. 2007 Omnibus Incentive Plan, which is incorporated herein by reference fromExhibit 10.31 to the Company’s Annual Report on Form 10-K filed on November 19, 2009
10.15 Form of Amended and Restated Indemnification Agreement with Directors, which isincorporated herein by reference from Exhibit 10.33 to the Company’s Annual Report onForm 10-K filed on November 19, 2009
10.16 2011 Form of Restricted Stock Agreement for Employees pursuant to the Sally BeautyHoldings, Inc. 2010 Omnibus Incentive Plan, which is incorporated herein by reference fromExhibit 10.33 to the Company’s Annual Report on Form 10-K filed on November 18, 2010
10.17 2011 Form of Stock Option Agreement for Employees pursuant to the Sally BeautyHoldings, Inc. 2010 Omnibus Incentive Plan, which is incorporated herein by reference fromExhibit 10.34 to the Company’s Annual Report on Form 10-K filed on November 18, 2010
10.18 2011 Form of Restricted Stock Unit Agreement for Independent Directors pursuant to theSally Beauty Holdings, Inc. 2010 Omnibus Incentive Plan, which is incorporated herein byreference from Exhibit 10.25 to the Company’s Annual Report on Form 10-K filedNovember 15, 2012
10.19 Form of Option Exercise Period Extension and Restricted Stock Vesting ExtensionAgreement, which is incorporated herein by reference from Exhibit 10.3 to the Company’sQuarterly Report on Form 10-Q filed on February 2, 2012
10.20 2016 Form of Performance Unit Award Agreement pursuant to the Sally BeautySupply, Inc. Amended and Restated 2010 Omnibus Incentive Plan, which is incorporatedherein by reference from Exhibit 10.1 to the Company’s Quarterly Report on Form 10-Qfiled on February 4, 2016
10.21 Separation and Release Agreement by and between Gary Winterhalter and the Company,dated as of February 18, 2016, which is incorporated herein by reference from Exhibit 10.2to the Company’s Quarterly Report on Form 10-Q filed on May 5, 2016
10.22 Option Exercise Period Extension Agreement by and between the Company and GaryWinterhalter, dated as of February 18, 2016, which is incorporated herein by reference fromExhibit 10.3 to the Company’s Quarterly Report on Form 10-Q filed on May 5, 2016
10.23 Separation and Release Agreement by and between Brian E. Walker and the Company,dated as of February 15, 2016, which is incorporated herein by reference from Exhibit 10.4to the Company’s Quarterly Report on Form 10-Q filed on May 5, 2016
10.24 Offer Letter to Christian A. Brickman, dated as of April 25, 2014, which is incorporatedherein by reference from Exhibit 10.1 to the Company’s Current Report on Form 8-K filedon May 1, 2014
10.25 Form of Severance Agreement between each of Matthew Haltom and the Companyeffective as of November 5, 2012, Christian A. Brickman and the Company effective as ofJune 2, 2014, Mark G. Spinks and the Company effective July 31, 2015 and Sharon Leiteand the Company effective February 1, 2016, which is incorporated herein by reference fromExhibit 10.3 to the Company’s Current Report on Form 8-K filed on November 5, 2012
88
10.26 2012 Form of Restricted Stock Unit Agreement for Independent Directors pursuant to theSally Beauty Holdings, Inc. 2010 Omnibus Incentive Plan, which is incorporated herein byreference from Exhibit 10.37 to the Company’s Annual Report on Form 10-K filed onNovember 15, 2012
10.27 Sally Beauty Holdings, Inc. Amended and Restated Annual Incentive Plan, which isincorporated herein by reference from Exhibit 10.38 to the Company’s Annual Report onForm 10-K filed on November 15, 2012
10.28 Sally Beauty Holdings, Inc. Amended and Restated 2010 Omnibus Incentive Plan, which isincorporated herein by reference from Exhibit 10.39 to the Company’s Annual Report onForm 10-K filed on November 15, 2012
10.29 Consulting Agreement by and between Sally Beauty Holdings, Inc. and John R. Golliher,which is incorporated herein by reference from Exhibit 10.1 to the Company’s CurrentReport on Form 8-K filed on August 6, 2015
10.30 Sally Beauty Holdings, Inc. Third Amended and Restated Independent DirectorCompensation Policy*
10.31 Separation Agreement by and between Mark Flaherty and Sally Beauty Supply LLC, datedas of September 28, 2016*
21.1 List of Subsidiaries of Sally Beauty Holdings, Inc.*
23.1 Consent of KPMG*
31.1 Rule 13(a)-14(a)/15(d)-14(a) Certification of Christian A. Brickman*
31.2 Rule 13(a)-14(a)/15(d)-14(a) Certification of Janna S. Minton*
32.1 Section 1350 Certification of Christian A. Brickman*
32.2 Section 1350 Certification of Janna S. Minton*
101 The following financial information from our Annual Report on Form 10-K for the fiscalyear ended September 30, 2016, formatted in XBRL (Extensible Business ReportingLanguage): (i) the Consolidated Balance Sheets; (ii) the Consolidated Statements ofEarnings; (iii) the Consolidated Statements of Comprehensive Income; (iv) theConsolidated Statements of Cash Flows; (v) Consolidated Statements of Stockholders’Equity (Deficit) and (vi) the Notes to Consolidated Financial Statements*
* Included herewith
† Certain schedules and exhibits have been omitted pursuant to Item 601(b) (2) of Regulation S-K. TheRegistrant agrees to furnish supplementally to the Securities and Exchange Commission a copy of anyomitted schedule or exhibit upon request.
(c) Financial Statement Schedules
None
89
SIGNATURES
Pursuant to the requirements of Section 13 or 15(d) of the Securities Exchange Act of 1934, the registranthas duly caused this report to be signed on its behalf by the undersigned, thereunto duly authorized, on the15th day of November, 2016.
SALLY BEAUTY HOLDINGS, INC.
By: /s/ CHRISTIAN A. BRICKMAN
Christian A. BrickmanPresident, Chief Executive Officer andDirector
By: /s/ JANNA S. MINTON
Janna S. MintonGroup Vice President, Chief AccountingOfficer and Controller
90
Pursuant to the requirements of the Securities Exchange Act of 1934, this report has been signed below bythe following persons on behalf of the registrant and in the capacities and on the dates indicated.
Signature Title Date
/s/ CHRISTIAN A. BRICKMAN President, Chief Executive Officer November 15, 2016and Director (Principal ExecutiveChristian A. BrickmanOfficer)
/s/ JANNA S. MINTON Group Vice President, Chief November 15, 2016Accounting Officer and ControllerJanna S. Minton(Principal Financial Officer)
/s/ ROBERT R. MCMASTER Chairman of the Board of Directors November 15, 2016
Robert R. McMaster
/s/ KATHERINE BUTTON BELL Director November 15, 2016
Katherine Button Bell
/s/ MARSHALL E. EISENBERG Director November 15, 2016
Marshall E. Eisenberg
/s/ DAVID W. GIBBS Director November 15, 2016
David W. Gibbs
/s/ JOHN A. MILLER Director November 15, 2016
John A. Miller
/s/ SUSAN R. MULDER Director November 15, 2016
Susan R. Mulder
/s/ ERIN NEALY COX Director November 15, 2016
Erin Nealy Cox
/s/ EDWARD W. RABIN Director November 15, 2016
Edward W. Rabin
91
SALLY BEAUTY HOLDINGS, INC. AND SUBSIDIARIES
Financial StatementsYears ended September 30, 2016, 2015 and 2014
INDEX TO FINANCIAL STATEMENTS
Page
Report of Independent Registered Public Accounting Firm . . . . . . . . . . . . . . . . . . . . . . . . . . . . F-1Consolidated Financial Statements:
Consolidated Balance Sheets as of September 30, 2016 and 2015 . . . . . . . . . . . . . . . . . . . . . . F-3Consolidated Statements of Earnings for the years ended September 30, 2016, 2015 and 2014 . F-4Consolidated Statements of Comprehensive Income for the years ended September 30, 2016,
2015 and 2014 . . . . . . . . . . . . . . . . . . . . . . . . . . . . . . . . . . . . . . . . . . . . . . . . . . . . . . . . . F-5Consolidated Statements of Cash Flows for the years ended September 30, 2016, 2015 and
2014 . . . . . . . . . . . . . . . . . . . . . . . . . . . . . . . . . . . . . . . . . . . . . . . . . . . . . . . . . . . . . . . . F-6Consolidated Statements of Stockholders’ Deficit for the years ended September 30, 2016,
2015 and 2014 . . . . . . . . . . . . . . . . . . . . . . . . . . . . . . . . . . . . . . . . . . . . . . . . . . . . . . . . . F-7Notes to Consolidated Financial Statements for the years ended September 30, 2016, 2015 and
2014 . . . . . . . . . . . . . . . . . . . . . . . . . . . . . . . . . . . . . . . . . . . . . . . . . . . . . . . . . . . . . . . . F-8
92
Report of Independent Registered Public Accounting Firm
The Board of Directors and StockholdersSally Beauty Holdings, Inc.:
We have audited Sally Beauty Holdings, Inc. and subsidiaries’ (the Company) internal control overfinancial reporting as of September 30, 2016, based on criteria established in Internal Control—IntegratedFramework (2013) issued by the Committee of Sponsoring Organizations of the Treadway Commission(COSO). The Company’s management is responsible for maintaining effective internal control overfinancial reporting and for its assessment of the effectiveness of internal control over financial reporting,included in the accompanying Management’s Annual Report on Internal Control over Financial Reportingincluded in Item 9A. Our responsibility is to express an opinion on the Company’s internal control overfinancial reporting based on our audit.
We conducted our audit in accordance with the standards of the Public Company Accounting OversightBoard (United States). Those standards require that we plan and perform the audit to obtain reasonableassurance about whether effective internal control over financial reporting was maintained in all materialrespects. Our audit included obtaining an understanding of internal control over financial reporting,assessing the risk that a material weakness exists, and testing and evaluating the design and operatingeffectiveness of internal control based on the assessed risk. Our audit also included performing such otherprocedures as we considered necessary in the circumstances. We believe that our audit provides areasonable basis for our opinion.
A company’s internal control over financial reporting is a process designed to provide reasonableassurance regarding the reliability of financial reporting and the preparation of financial statements forexternal purposes in accordance with generally accepted accounting principles. A company’s internalcontrol over financial reporting includes those policies and procedures that (1) pertain to the maintenanceof records that, in reasonable detail, accurately and fairly reflect the transactions and dispositions of theassets of the company; (2) provide reasonable assurance that transactions are recorded as necessary topermit preparation of financial statements in accordance with generally accepted accounting principles,and that receipts and expenditures of the company are being made only in accordance with authorizationsof management and directors of the company; and (3) provide reasonable assurance regarding preventionor timely detection of unauthorized acquisition, use, or disposition of the company’s assets that could havea material effect on the financial statements.
Because of its inherent limitations, internal control over financial reporting may not prevent or detectmisstatements. Also, projections of any evaluation of effectiveness to future periods are subject to the riskthat controls may become inadequate because of changes in conditions, or that the degree of compliancewith the policies or procedures may deteriorate.
In our opinion, Sally Beauty Holdings, Inc. maintained, in all material respects, effective internal controlover financial reporting as of September 30, 2016, based on criteria established in Internal Control—Integrated Framework (2013) issued by the Committee of Sponsoring Organizations of the TreadwayCommission (COSO).
We also have audited, in accordance with the standards of the Public Company Accounting OversightBoard (United States), the consolidated balance sheets of Sally Beauty Holdings, Inc. and subsidiaries asof September 30, 2016 and 2015, and the related consolidated statements of earnings, comprehensiveincome, cash flows, and stockholders’ deficit for each of the years in the three-year period endedSeptember 30, 2016, and our report dated November 14, 2016 expressed an unqualified opinion on thoseconsolidated financial statements.
/s/ KPMG LLP
KPMG LLPDallas, TexasNovember 14, 2016
F-1
Report of Independent Registered Public Accounting Firm
The Board of Directors and StockholdersSally Beauty Holdings, Inc.:
We have audited the accompanying consolidated balance sheets of Sally Beauty Holdings, Inc. andsubsidiaries (the Company) as of September 30, 2016 and 2015, and the related consolidated statements ofearnings, comprehensive income, cash flows, and stockholders’ deficit for each of the years in thethree-year period ended September 30, 2016. These consolidated financial statements are theresponsibility of the Company’s management. Our responsibility is to express an opinion on theseconsolidated financial statements based on our audits.
We conducted our audits in accordance with the standards of the Public Company Accounting OversightBoard (United States). Those standards require that we plan and perform the audit to obtain reasonableassurance about whether the financial statements are free of material misstatement. An audit includesexamining, on a test basis, evidence supporting the amounts and disclosures in the financial statements. Anaudit also includes assessing the accounting principles used and significant estimates made bymanagement, as well as evaluating the overall financial statement presentation. We believe that our auditsprovide a reasonable basis for our opinion.
In our opinion, the consolidated financial statements referred to above present fairly, in all materialrespects, the financial position of Sally Beauty Holdings, Inc. and subsidiaries as of September 30, 2016 and2015, and the results of their operations and their cash flows for each of the years in the three-year periodended September 30, 2016, in conformity with U.S. generally accepted accounting principles.
We also have audited, in accordance with the standards of the Public Company Accounting OversightBoard (United States), the Company’s internal control over financial reporting as of September 30, 2016,based on criteria established in Internal Control—Integrated Framework (2013) issued by the Committee ofSponsoring Organizations of the Treadway Commission (COSO), and our report dated November 14, 2016expressed an unqualified opinion on the effectiveness of the Company’s internal control over financialreporting.
/s/ KPMG LLP
KPMG LLPDallas, TexasNovember 14, 2016
F-2
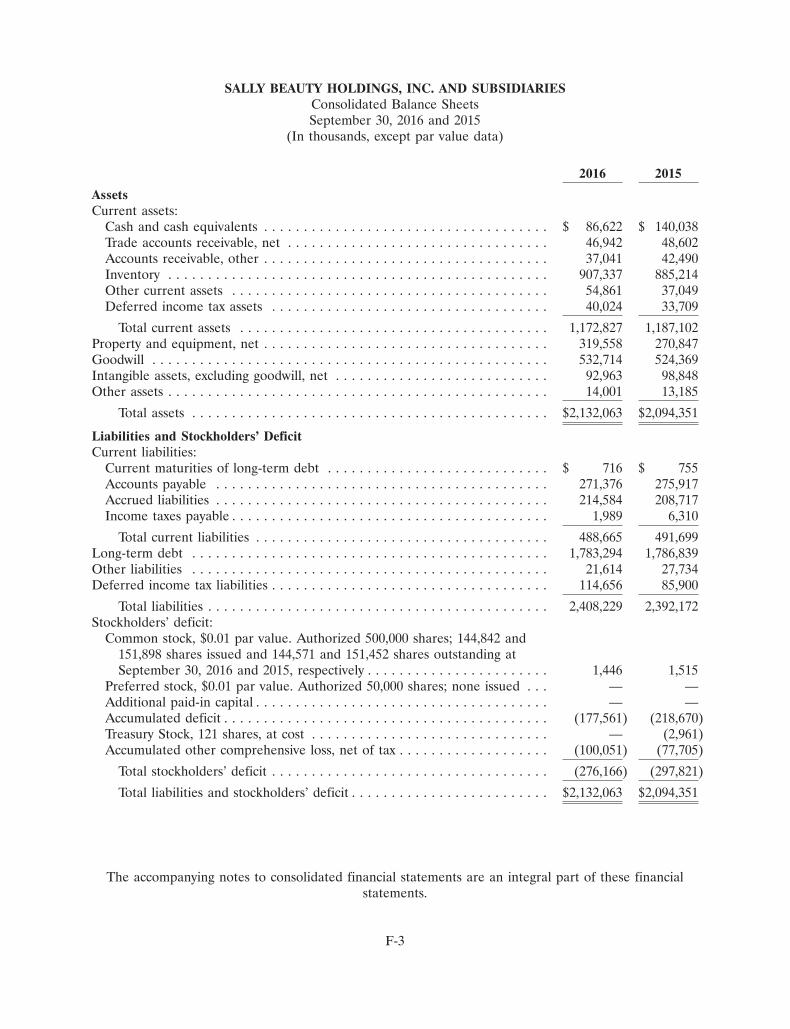
SALLY BEAUTY HOLDINGS, INC. AND SUBSIDIARIESConsolidated Balance SheetsSeptember 30, 2016 and 2015
(In thousands, except par value data)
2016 2015
AssetsCurrent assets:
Cash and cash equivalents . . . . . . . . . . . . . . . . . . . . . . . . . . . . . . . . . . . . $ 86,622 $ 140,038Trade accounts receivable, net . . . . . . . . . . . . . . . . . . . . . . . . . . . . . . . . . 46,942 48,602Accounts receivable, other . . . . . . . . . . . . . . . . . . . . . . . . . . . . . . . . . . . . 37,041 42,490Inventory . . . . . . . . . . . . . . . . . . . . . . . . . . . . . . . . . . . . . . . . . . . . . . . . 907,337 885,214Other current assets . . . . . . . . . . . . . . . . . . . . . . . . . . . . . . . . . . . . . . . . 54,861 37,049Deferred income tax assets . . . . . . . . . . . . . . . . . . . . . . . . . . . . . . . . . . . 40,024 33,709
Total current assets . . . . . . . . . . . . . . . . . . . . . . . . . . . . . . . . . . . . . . . 1,172,827 1,187,102Property and equipment, net . . . . . . . . . . . . . . . . . . . . . . . . . . . . . . . . . . . . 319,558 270,847Goodwill . . . . . . . . . . . . . . . . . . . . . . . . . . . . . . . . . . . . . . . . . . . . . . . . . . 532,714 524,369Intangible assets, excluding goodwill, net . . . . . . . . . . . . . . . . . . . . . . . . . . . 92,963 98,848Other assets . . . . . . . . . . . . . . . . . . . . . . . . . . . . . . . . . . . . . . . . . . . . . . . . 14,001 13,185
Total assets . . . . . . . . . . . . . . . . . . . . . . . . . . . . . . . . . . . . . . . . . . . . . $2,132,063 $2,094,351
Liabilities and Stockholders’ DeficitCurrent liabilities:
Current maturities of long-term debt . . . . . . . . . . . . . . . . . . . . . . . . . . . . $ 716 $ 755Accounts payable . . . . . . . . . . . . . . . . . . . . . . . . . . . . . . . . . . . . . . . . . . 271,376 275,917Accrued liabilities . . . . . . . . . . . . . . . . . . . . . . . . . . . . . . . . . . . . . . . . . . 214,584 208,717Income taxes payable . . . . . . . . . . . . . . . . . . . . . . . . . . . . . . . . . . . . . . . . 1,989 6,310
Total current liabilities . . . . . . . . . . . . . . . . . . . . . . . . . . . . . . . . . . . . . 488,665 491,699Long-term debt . . . . . . . . . . . . . . . . . . . . . . . . . . . . . . . . . . . . . . . . . . . . . 1,783,294 1,786,839Other liabilities . . . . . . . . . . . . . . . . . . . . . . . . . . . . . . . . . . . . . . . . . . . . . 21,614 27,734Deferred income tax liabilities . . . . . . . . . . . . . . . . . . . . . . . . . . . . . . . . . . . 114,656 85,900
Total liabilities . . . . . . . . . . . . . . . . . . . . . . . . . . . . . . . . . . . . . . . . . . . 2,408,229 2,392,172Stockholders’ deficit:
Common stock, $0.01 par value. Authorized 500,000 shares; 144,842 and151,898 shares issued and 144,571 and 151,452 shares outstanding atSeptember 30, 2016 and 2015, respectively . . . . . . . . . . . . . . . . . . . . . . . 1,446 1,515
Preferred stock, $0.01 par value. Authorized 50,000 shares; none issued . . . — —Additional paid-in capital . . . . . . . . . . . . . . . . . . . . . . . . . . . . . . . . . . . . . — —Accumulated deficit . . . . . . . . . . . . . . . . . . . . . . . . . . . . . . . . . . . . . . . . . (177,561) (218,670)Treasury Stock, 121 shares, at cost . . . . . . . . . . . . . . . . . . . . . . . . . . . . . . — (2,961)Accumulated other comprehensive loss, net of tax . . . . . . . . . . . . . . . . . . . (100,051) (77,705)
Total stockholders’ deficit . . . . . . . . . . . . . . . . . . . . . . . . . . . . . . . . . . . (276,166) (297,821)
Total liabilities and stockholders’ deficit . . . . . . . . . . . . . . . . . . . . . . . . . $2,132,063 $2,094,351
The accompanying notes to consolidated financial statements are an integral part of these financialstatements.
F-3
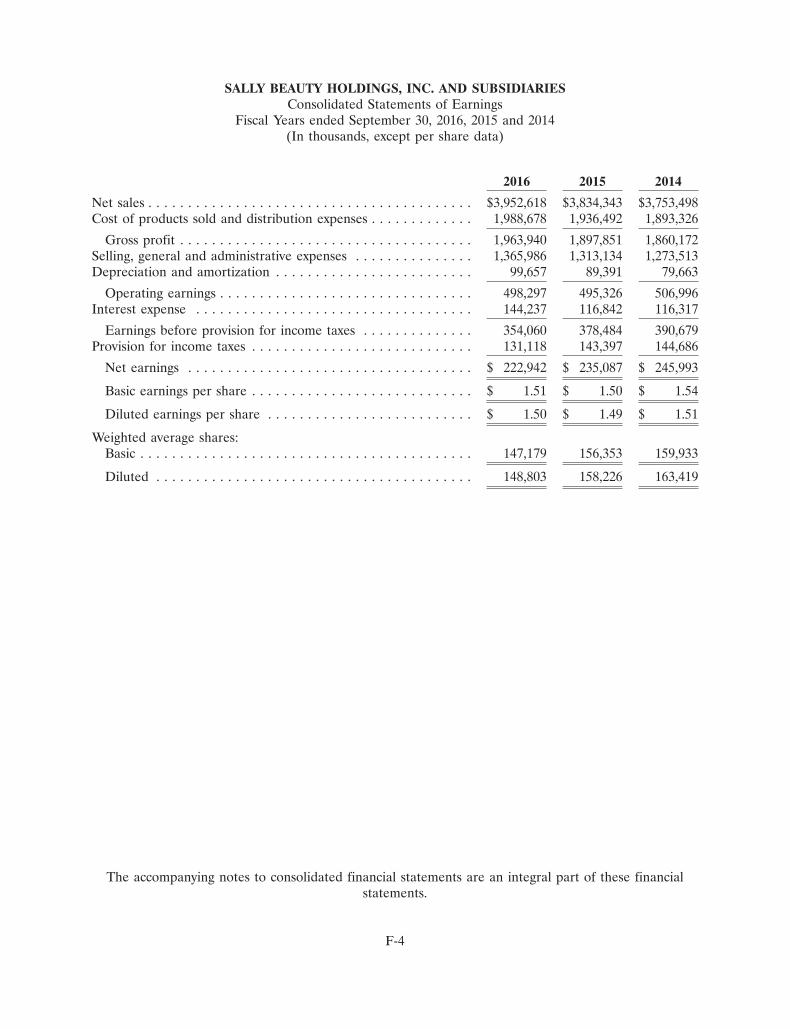
SALLY BEAUTY HOLDINGS, INC. AND SUBSIDIARIESConsolidated Statements of Earnings
Fiscal Years ended September 30, 2016, 2015 and 2014(In thousands, except per share data)
2016 2015 2014
Net sales . . . . . . . . . . . . . . . . . . . . . . . . . . . . . . . . . . . . . . . . . $3,952,618 $3,834,343 $3,753,498Cost of products sold and distribution expenses . . . . . . . . . . . . . 1,988,678 1,936,492 1,893,326
Gross profit . . . . . . . . . . . . . . . . . . . . . . . . . . . . . . . . . . . . . 1,963,940 1,897,851 1,860,172Selling, general and administrative expenses . . . . . . . . . . . . . . . 1,365,986 1,313,134 1,273,513Depreciation and amortization . . . . . . . . . . . . . . . . . . . . . . . . . 99,657 89,391 79,663
Operating earnings . . . . . . . . . . . . . . . . . . . . . . . . . . . . . . . . 498,297 495,326 506,996Interest expense . . . . . . . . . . . . . . . . . . . . . . . . . . . . . . . . . . . 144,237 116,842 116,317
Earnings before provision for income taxes . . . . . . . . . . . . . . 354,060 378,484 390,679Provision for income taxes . . . . . . . . . . . . . . . . . . . . . . . . . . . . 131,118 143,397 144,686
Net earnings . . . . . . . . . . . . . . . . . . . . . . . . . . . . . . . . . . . . $ 222,942 $ 235,087 $ 245,993
Basic earnings per share . . . . . . . . . . . . . . . . . . . . . . . . . . . . $ 1.51 $ 1.50 $ 1.54
Diluted earnings per share . . . . . . . . . . . . . . . . . . . . . . . . . . $ 1.50 $ 1.49 $ 1.51
Weighted average shares:Basic . . . . . . . . . . . . . . . . . . . . . . . . . . . . . . . . . . . . . . . . . . 147,179 156,353 159,933
Diluted . . . . . . . . . . . . . . . . . . . . . . . . . . . . . . . . . . . . . . . . 148,803 158,226 163,419
The accompanying notes to consolidated financial statements are an integral part of these financialstatements.
F-4
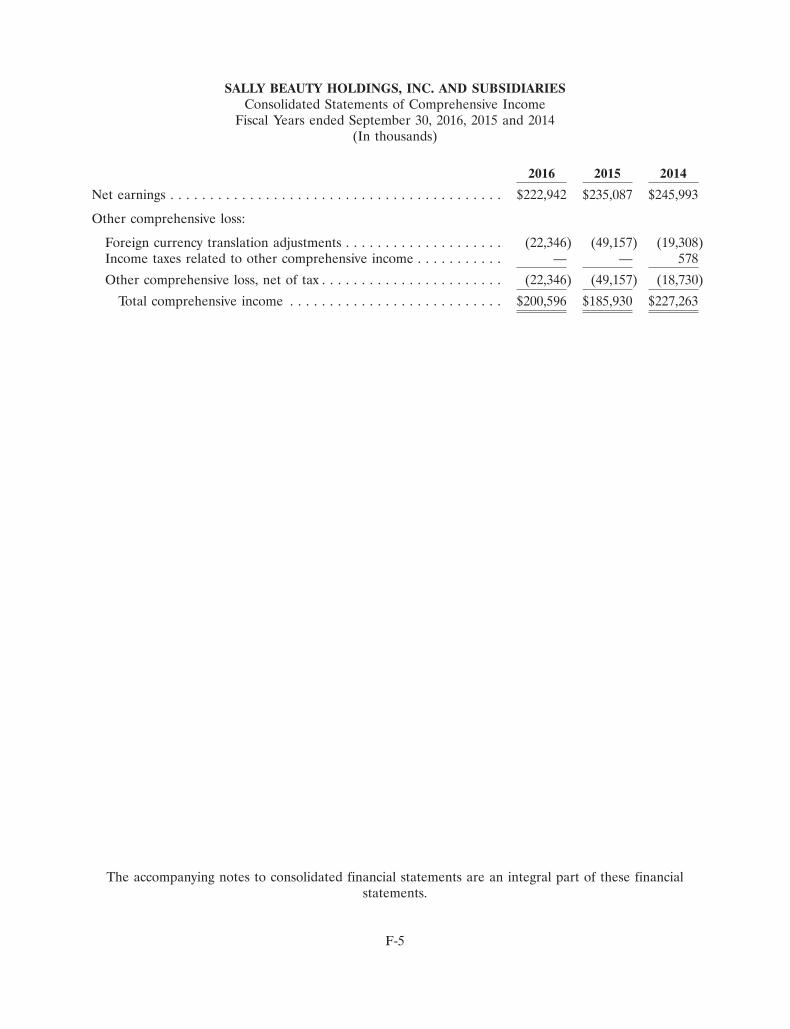
SALLY BEAUTY HOLDINGS, INC. AND SUBSIDIARIESConsolidated Statements of Comprehensive Income
Fiscal Years ended September 30, 2016, 2015 and 2014(In thousands)
2016 2015 2014
Net earnings . . . . . . . . . . . . . . . . . . . . . . . . . . . . . . . . . . . . . . . . . . $222,942 $235,087 $245,993
Other comprehensive loss:
Foreign currency translation adjustments . . . . . . . . . . . . . . . . . . . . (22,346) (49,157) (19,308)Income taxes related to other comprehensive income . . . . . . . . . . . — — 578
Other comprehensive loss, net of tax . . . . . . . . . . . . . . . . . . . . . . . (22,346) (49,157) (18,730)
Total comprehensive income . . . . . . . . . . . . . . . . . . . . . . . . . . . $200,596 $185,930 $227,263
The accompanying notes to consolidated financial statements are an integral part of these financialstatements.
F-5
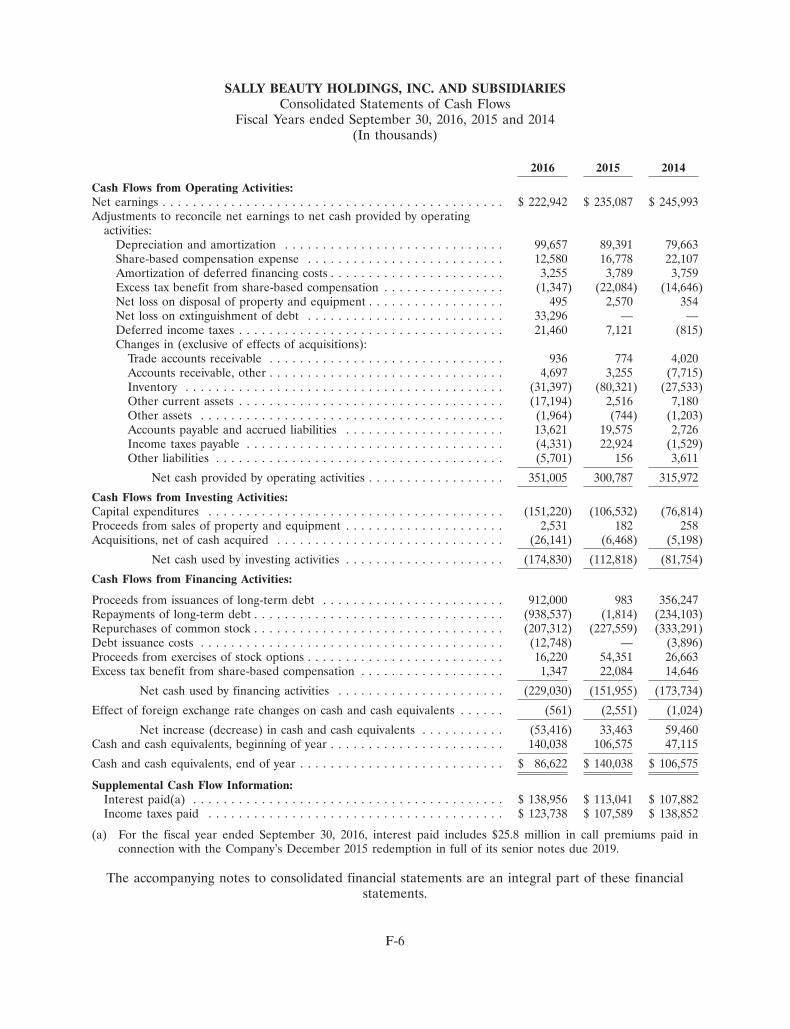
SALLY BEAUTY HOLDINGS, INC. AND SUBSIDIARIESConsolidated Statements of Cash Flows
Fiscal Years ended September 30, 2016, 2015 and 2014(In thousands)
2016 2015 2014
Cash Flows from Operating Activities:Net earnings . . . . . . . . . . . . . . . . . . . . . . . . . . . . . . . . . . . . . . . . . . . . . $ 222,942 $ 235,087 $ 245,993Adjustments to reconcile net earnings to net cash provided by operating
activities:Depreciation and amortization . . . . . . . . . . . . . . . . . . . . . . . . . . . . . 99,657 89,391 79,663Share-based compensation expense . . . . . . . . . . . . . . . . . . . . . . . . . . 12,580 16,778 22,107Amortization of deferred financing costs . . . . . . . . . . . . . . . . . . . . . . . 3,255 3,789 3,759Excess tax benefit from share-based compensation . . . . . . . . . . . . . . . . (1,347) (22,084) (14,646)Net loss on disposal of property and equipment . . . . . . . . . . . . . . . . . . 495 2,570 354Net loss on extinguishment of debt . . . . . . . . . . . . . . . . . . . . . . . . . . 33,296 — —Deferred income taxes . . . . . . . . . . . . . . . . . . . . . . . . . . . . . . . . . . . 21,460 7,121 (815)Changes in (exclusive of effects of acquisitions):
Trade accounts receivable . . . . . . . . . . . . . . . . . . . . . . . . . . . . . . . 936 774 4,020Accounts receivable, other . . . . . . . . . . . . . . . . . . . . . . . . . . . . . . . 4,697 3,255 (7,715)Inventory . . . . . . . . . . . . . . . . . . . . . . . . . . . . . . . . . . . . . . . . . . (31,397) (80,321) (27,533)Other current assets . . . . . . . . . . . . . . . . . . . . . . . . . . . . . . . . . . . (17,194) 2,516 7,180Other assets . . . . . . . . . . . . . . . . . . . . . . . . . . . . . . . . . . . . . . . . (1,964) (744) (1,203)Accounts payable and accrued liabilities . . . . . . . . . . . . . . . . . . . . . 13,621 19,575 2,726Income taxes payable . . . . . . . . . . . . . . . . . . . . . . . . . . . . . . . . . . (4,331) 22,924 (1,529)Other liabilities . . . . . . . . . . . . . . . . . . . . . . . . . . . . . . . . . . . . . . (5,701) 156 3,611
Net cash provided by operating activities . . . . . . . . . . . . . . . . . . 351,005 300,787 315,972
Cash Flows from Investing Activities:Capital expenditures . . . . . . . . . . . . . . . . . . . . . . . . . . . . . . . . . . . . . . . (151,220) (106,532) (76,814)Proceeds from sales of property and equipment . . . . . . . . . . . . . . . . . . . . . 2,531 182 258Acquisitions, net of cash acquired . . . . . . . . . . . . . . . . . . . . . . . . . . . . . . (26,141) (6,468) (5,198)
Net cash used by investing activities . . . . . . . . . . . . . . . . . . . . . (174,830) (112,818) (81,754)
Cash Flows from Financing Activities:
Proceeds from issuances of long-term debt . . . . . . . . . . . . . . . . . . . . . . . . 912,000 983 356,247Repayments of long-term debt . . . . . . . . . . . . . . . . . . . . . . . . . . . . . . . . . (938,537) (1,814) (234,103)Repurchases of common stock . . . . . . . . . . . . . . . . . . . . . . . . . . . . . . . . . (207,312) (227,559) (333,291)Debt issuance costs . . . . . . . . . . . . . . . . . . . . . . . . . . . . . . . . . . . . . . . . (12,748) — (3,896)Proceeds from exercises of stock options . . . . . . . . . . . . . . . . . . . . . . . . . . 16,220 54,351 26,663Excess tax benefit from share-based compensation . . . . . . . . . . . . . . . . . . . 1,347 22,084 14,646
Net cash used by financing activities . . . . . . . . . . . . . . . . . . . . . . (229,030) (151,955) (173,734)
Effect of foreign exchange rate changes on cash and cash equivalents . . . . . . (561) (2,551) (1,024)
Net increase (decrease) in cash and cash equivalents . . . . . . . . . . . (53,416) 33,463 59,460Cash and cash equivalents, beginning of year . . . . . . . . . . . . . . . . . . . . . . . 140,038 106,575 47,115
Cash and cash equivalents, end of year . . . . . . . . . . . . . . . . . . . . . . . . . . . $ 86,622 $ 140,038 $ 106,575
Supplemental Cash Flow Information:Interest paid(a) . . . . . . . . . . . . . . . . . . . . . . . . . . . . . . . . . . . . . . . . . $ 138,956 $ 113,041 $ 107,882Income taxes paid . . . . . . . . . . . . . . . . . . . . . . . . . . . . . . . . . . . . . . . $ 123,738 $ 107,589 $ 138,852
(a) For the fiscal year ended September 30, 2016, interest paid includes $25.8 million in call premiums paid inconnection with the Company’s December 2015 redemption in full of its senior notes due 2019.
The accompanying notes to consolidated financial statements are an integral part of these financialstatements.
F-6
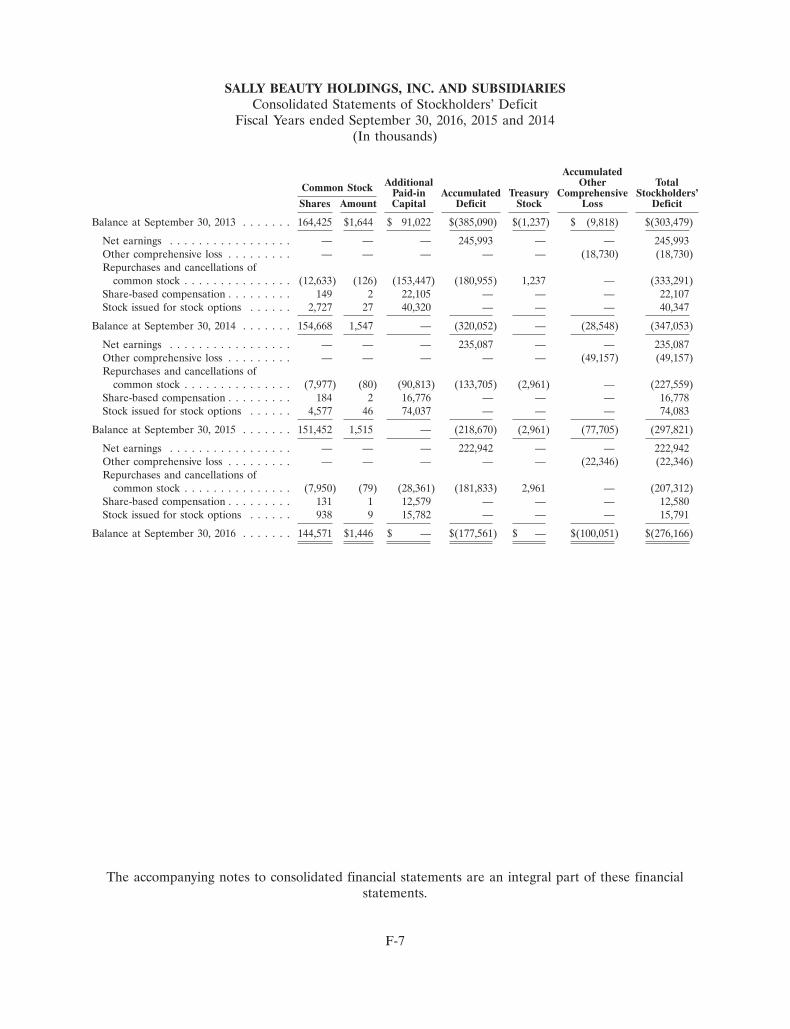
SALLY BEAUTY HOLDINGS, INC. AND SUBSIDIARIESConsolidated Statements of Stockholders’ Deficit
Fiscal Years ended September 30, 2016, 2015 and 2014(In thousands)
AccumulatedAdditional Other TotalCommon Stock Paid-in Accumulated Treasury Comprehensive Stockholders’
Shares Amount Capital Deficit Stock Loss Deficit
Balance at September 30, 2013 . . . . . . . 164,425 $1,644 $ 91,022 $(385,090) $(1,237) $ (9,818) $(303,479)
Net earnings . . . . . . . . . . . . . . . . . — — — 245,993 — — 245,993Other comprehensive loss . . . . . . . . . — — — — — (18,730) (18,730)Repurchases and cancellations of
common stock . . . . . . . . . . . . . . . (12,633) (126) (153,447) (180,955) 1,237 — (333,291)Share-based compensation . . . . . . . . . 149 2 22,105 — — — 22,107Stock issued for stock options . . . . . . 2,727 27 40,320 — — — 40,347
Balance at September 30, 2014 . . . . . . . 154,668 1,547 — (320,052) — (28,548) (347,053)
Net earnings . . . . . . . . . . . . . . . . . — — — 235,087 — — 235,087Other comprehensive loss . . . . . . . . . — — — — — (49,157) (49,157)Repurchases and cancellations of
common stock . . . . . . . . . . . . . . . (7,977) (80) (90,813) (133,705) (2,961) — (227,559)Share-based compensation . . . . . . . . . 184 2 16,776 — — — 16,778Stock issued for stock options . . . . . . 4,577 46 74,037 — — — 74,083
Balance at September 30, 2015 . . . . . . . 151,452 1,515 — (218,670) (2,961) (77,705) (297,821)
Net earnings . . . . . . . . . . . . . . . . . — — — 222,942 — — 222,942Other comprehensive loss . . . . . . . . . — — — — — (22,346) (22,346)Repurchases and cancellations of
common stock . . . . . . . . . . . . . . . (7,950) (79) (28,361) (181,833) 2,961 — (207,312)Share-based compensation . . . . . . . . . 131 1 12,579 — — — 12,580Stock issued for stock options . . . . . . 938 9 15,782 — — — 15,791
Balance at September 30, 2016 . . . . . . . 144,571 $1,446 $ — $(177,561) $ — $(100,051) $(276,166)
The accompanying notes to consolidated financial statements are an integral part of these financialstatements.
F-7
Sally Beauty Holdings, Inc. and Subsidiaries
Notes to Consolidated Financial Statements
Fiscal Years ended September 30, 2016, 2015 and 2014
1. Description of Business and Basis of Presentation
Description of Business
Sally Beauty Holdings, Inc. and its consolidated subsidiaries (‘‘Sally Beauty’’ or ‘‘the Company’’) sellprofessional beauty supplies through its Sally Beauty Supply retail stores located in the U.S., Puerto Rico,Canada, Mexico, Chile, Colombia, Peru, the United Kingdom, Ireland, Belgium, France, Germany, theNetherlands and Spain. Additionally, the Company distributes professional beauty products to salons andsalon professionals through its Beauty Systems Group (‘‘BSG’’) store operations and a commissioneddirect sales force that calls on salons primarily in the U.S., Canada, the United Kingdom and certain othercountries in Europe, and to franchises in the southern and southwestern regions of the U.S. and in Mexicothrough the operations of its subsidiary Armstrong McCall. A significant number of the Company’sproducts are also available through a number of Sally Beauty Supply and BSG-operated websites. Certainbeauty products sold by BSG and Armstrong McCall are sold under exclusive territory agreements with themanufacturers of the products.
Sally Beauty Supply began operations with a single store in New Orleans in 1964 and was acquired in 1969by our former parent company, The Alberto-Culver Company, which we refer to as Alberto-Culver. BSGbecame a subsidiary of Sally Beauty in 1995. In 2006, the Company separated from Alberto-Culver andbecame an independent company listed on the New York Stock Exchange.
Basis of Presentation
The consolidated financial statements included herein have been prepared in accordance with accountingprinciples generally accepted in the United States (‘‘GAAP’’) and include the accounts of the Companyand its subsidiaries. All significant intercompany accounts and transactions have been eliminated inconsolidation.
Certain amounts for prior fiscal years have been reclassified to conform to the current fiscal year’spresentation.
All references in these notes to ‘‘management’’ are to the management of Sally Beauty.
2. Significant Accounting Policies
The preparation of financial statements in conformity with GAAP requires us to interpret and applyaccounting standards and to develop and follow accounting policies consistent with such standards. Thefollowing is a summary of the significant accounting policies used in preparing the Company’s consolidatedfinancial statements.
Use of Estimates
The preparation of financial statements in conformity with GAAP requires management to make estimatesand assumptions that affect the reported amounts of assets, liabilities, revenues and expenses, anddisclosures of contingent liabilities in the financial statements. Our most significant estimates relate to: thevaluation of inventory, vendor rebates and concessions, retention of risk, income taxes, the assessment oflong-lived assets and intangible assets for impairment, loss contingencies and share-based payments. Thelevel of uncertainty in estimates and assumptions generally increases with the length of time until theunderlying transactions are completed. Actual results may differ from these estimates in amounts that may
F-8
Sally Beauty Holdings, Inc. and Subsidiaries
Notes to Consolidated Financial Statements (Continued)
Fiscal Years ended September 30, 2016, 2015 and 2014
be material to the financial statements. Management believes that the estimates and assumptions used inthe preparation of the Company’s consolidated financial statements are reasonable.
Cash and Cash Equivalents
Cash equivalents generally represent highly liquid investments purchased by the Company from time totime which have an original maturity of three months or less. These investments are stated at cost, whichapproximates fair value. In addition, cash equivalents include proceeds due from customer credit and debitcards and PayPal transactions, which generally settle within one to three days, and were $15.1 million and$13.3 million at September 30, 2016 and 2015, respectively.
Concentration of Credit Risk
Financial instruments that potentially expose the Company to concentration of credit risk consist primarilyof investments in cash equivalents, accounts receivable and derivative instruments. The Company investsfrom time to time in securities of financial institutions it deems to be of high creditworthiness. Accountsreceivable are deemed by the Company to be highly diversified due to the large number of individualcustomers comprising the Company’s customer base and their dispersion across diverse geographicalregions. The counterparties to our derivative instruments are deemed by the Company to be of substantialresources and strong creditworthiness. The Company believes that no significant concentration of creditrisk exists with respect to its investments in cash equivalents, its accounts receivable and its derivativeinstruments at September 30, 2016 and 2015.
Trade Accounts Receivable and Accounts Receivable, Other
Trade accounts receivable are recorded at the values invoiced to customers and do not accrue interest.Trade accounts receivable are stated net of the allowance for doubtful accounts. The allowance fordoubtful accounts requires management to estimate the future collectability of amounts receivable at thebalance sheet date. The Company records allowances for doubtful accounts on the basis of its historicalcollection data and current customer information. Customer account balances are written off against theallowance after all means of collection have been exhausted and the potential for recovery is consideredremote. In the Company’s consolidated statements of earnings, bad debt expense is included in selling,general and administrative expenses. The Company’s exposure to credit risk with respect to tradereceivables is mitigated by the Company’s broad customer base and their dispersion across diversegeographical regions.
Accounts receivable, other, consist primarily of amounts earned from vendors under various contractualagreements and are recorded at the amounts management estimates will be collected.
Inventory
Inventory consists primarily of beauty supplies and related accessories, and salon equipment for sale in thenormal course of our business. Inventory is stated at the lower of cost, determined using the first-in,first-out (‘‘FIFO’’) method, or net realizable value. Inventory cost reflects actual product costs, the cost oftransportation to the Company’s distribution centers and certain shipping and handling costs, such asfreight from the distribution centers to the stores and handling costs incurred at the distribution centers.When necessary, the Company adjusts the carrying value of inventory to the lower of cost or net realizablevalue, including anticipated disposal costs and for estimated inventory shrinkage. When assessing the netrealizable value of inventory, management considers several factors including estimates of future demand
F-9
Sally Beauty Holdings, Inc. and Subsidiaries
Notes to Consolidated Financial Statements (Continued)
Fiscal Years ended September 30, 2016, 2015 and 2014
for the Company’s products, historical turn-over rates, the age and sales history of the inventory, andhistoric as well as anticipated changes in stock keeping units (‘‘SKUs’’).
The Company estimates inventory shrinkage between physical counts based on its historical experience.Physical inventory counts are performed at substantially all stores and significant distribution centers atleast annually, and sooner when management has reason to believe that the risk of inventory shrinkage at aparticular location is heightened. Upon completion of physical inventory counts, the Company’sconsolidated financial statements are adjusted to reflect actual quantities on hand. The Company haspolicies and processes in place that are intended to minimize inventory shrinkage. Inventory shrinkageexpense has averaged approximately 1.0% of our consolidated net sales during each of the past three fiscalyears.
Lease Accounting
The majority of the Company’s lease agreements for office space, company-operated stores andwarehouse/distribution facilities are accounted for as operating leases, consistent with AccountingStandards Codification (‘‘ASC’’) Topic 840, Leases. Please see Note 3, Recent AccountingPronouncements, below for information about a new lease accounting standard released in February 2016which is effective for fiscal years beginning after December 15, 2018. Rent expense (including any rentabatements or escalation charges) is recognized on a straight-line basis from the date the Company takespossession of the property to begin preparation of the site for occupancy to the end of the lease term,including renewal options determined to be reasonably assured. Certain lease agreements to which theCompany is a party provide for contingent rents that are determined as a percentage of revenues in excessof specified levels. The Company records a contingent rent liability, along with the corresponding rentexpense, when the specified levels of revenue have been achieved or when management determines thatachieving the specified levels of revenue during the fiscal year is probable.
Certain lease agreements to which the Company is a party provide for tenant improvement allowances.Such allowances are recorded as deferred lease credits, included in accrued liabilities and other liabilities,as appropriate, on our consolidated balance sheets, and amortized on a straight-line basis over the leaseterm (including renewal options determined to be reasonably assured) as a reduction of rent expense. Theamortization period used for deferred lease credits is generally consistent with the amortization periodused for the constructed leasehold improvement asset for a given office, store or warehouse facility.
Valuation of Long-Lived Assets and Intangible Assets with Definite Lives
Long-lived assets, such as property and equipment, including store equipment, and purchased intangiblessubject to amortization are reviewed for impairment whenever events or changes in circumstances indicatethat the carrying amount of an asset may not be fully recoverable. The recoverability of long-lived assetsand intangible assets subject to amortization is assessed by comparing the net carrying amount of eachasset to its total estimated undiscounted future cash flows expected to be generated by the asset. If thecarrying amount of an asset exceeds its undiscounted future cash flows, an impairment charge isrecognized for the amount by which the carrying amount of the asset exceeds the estimated fair value ofthe asset. There were no significant impairment losses recognized in our consolidated financial statementsin the current or prior fiscal years presented in connection with long-lived assets and intangible assetssubject to amortization.
The Company’s intangible assets subject to amortization include customer relationships, certaindistribution rights and non-competition agreements, and are amortized, on a straight-line basis, over
F-10
Sally Beauty Holdings, Inc. and Subsidiaries
Notes to Consolidated Financial Statements (Continued)
Fiscal Years ended September 30, 2016, 2015 and 2014
periods of two to thirteen years. Such amortization periods are based on the estimated useful lives of theassets and take into account the terms of any underlying agreements, but do not generally reflect allrenewal terms contractually available to the Company.
Goodwill and Intangible Assets with Indefinite Lives
Goodwill represents the excess of the purchase price over the fair value of the net assets acquired in abusiness combination. Our intangible assets with indefinite lives consist of trade names acquired inbusiness combinations. Goodwill and intangible assets with indefinite lives are reviewed for impairment atleast annually, during our second fiscal quarter, and whenever events or changes in circumstances indicateit is more-likely-than-not that the value of the asset may be impaired. When assessing goodwill andintangible assets with indefinite lives for potential impairment, management considers whether the value ofthe asset has been impaired by evaluating if various factors (including current operating results, anticipatedfuture results and cash flows, and relevant market and economic conditions) indicate a possibleimpairment and, if appropriate, compares the carrying amount of the asset to its fair value.
Based on management’s assessments, after taking into account potential triggering events, including therecent decline in the average daily trading prices for shares of our common stock, there was no materialimpairment of goodwill or intangible assets with indefinite lives recognized in our financial statements inthe current or prior fiscal years presented.
Deferred Financing Costs
Certain costs incurred in connection with the issuance of debt are capitalized when incurred and areamortized over the estimated term of the related debt instruments or agreements generally using theeffective interest method. Unamortized deferred financing costs are expensed proportionally when certaindebt is prepaid or notes are redeemed. At September 30, 2016 and 2015, unamortized debt issuance costsof $23.7 million and $21.8 million, respectively, related to our senior notes are reported as a deductionfrom the related long-term debt obligations (in long-term debt) on the Company’s consolidated balancesheets. In addition, unamortized debt issuance costs related to the Company’s five-year asset-based seniorsecured loan facility (the ‘‘ABL facility’’) of $1.6 million and $2.4 million, at September 30, 2016 and 2015,respectively, are reported in other assets in our consolidated balance sheets.
Self-Insurance Programs
The Company retains a substantial portion of the risk related to certain of its workers’ compensation,general and auto liability, and property damage insurable loss exposure. Predetermined loss limits havebeen arranged with insurance companies to limit the Company’s exposure per occurrence and aggregatecash outlay. In addition, certain of our employees and their dependents are covered by a self-insuranceprogram for healthcare benefit purposes (the ‘‘healthcare plan’’). Currently these self-insurance costs (lessamounts recovered through payroll deductions) and certain out-of-pocket amounts incurred in connectionwith the employee healthcare program are funded by the Company. The Company maintains an annualstop-loss insurance policy for the healthcare plan.
The Company records an estimated liability for the ultimate cost of claims incurred and unpaid as of thebalance sheet date, which includes claims filed and estimated losses incurred but not yet reported. TheCompany estimates the ultimate cost based on an analysis of its historical data and actuarial estimates.Workers’ compensation, general and auto liability and property damage insurable loss liabilities arerecorded at the estimate of their net present value, while healthcare plan liabilities are not discounted.
F-11
Sally Beauty Holdings, Inc. and Subsidiaries
Notes to Consolidated Financial Statements (Continued)
Fiscal Years ended September 30, 2016, 2015 and 2014
These estimates are reviewed on a regular basis to ensure that the recorded liability is adequate. Duringthe fiscal year ended September 30, 2016, the Company recorded a favorable expense adjustment of$6.3 million resulting from a decrease in estimated future payments in connection with certain of itsself-insurance programs. The Company believes the amounts accrued at September 30, 2016 and 2015, areadequate.
Revenue Recognition
The Company recognizes sales revenue when a customer consummates a point-of-sale transaction at astore. The cost of sales incentive programs, including customer and consumer coupons, is recognized as areduction of revenue at the time of sale. Taxes collected from customers and remitted to governmentalauthorities are recorded on a net basis and are excluded from revenue. The Company also recognizesrevenue on merchandise shipped to customers when title and risk of loss pass to the customer (generallyupon shipment). Appropriate provisions for sales returns and cash discounts are made at the time the salesare recognized. Sales returns and allowances averaged approximately 2.0% of net sales during each of thepast three fiscal years.
Please see Note 3, Recent Accounting Pronouncements, below for more information about a new revenueaccounting standard released in May 2014, which is effective for fiscal years beginning after December 15,2017.
Cost of Products Sold and Distribution Expenses
Cost of products sold and distribution expenses include actual product costs, the cost of transportation tothe Company’s distribution centers, vendor rebates and allowances, inventory shrinkage and certainshipping and handling costs, such as freight from the distribution centers to the stores and handling costsincurred at the distribution centers. All other shipping and handling costs are included in selling, generaland administrative expenses when incurred.
Shipping and Handling
Shipping and handling costs (including freight and distribution expenses) related to delivery to customersare included in selling, general and administrative expenses in our consolidated statements of earningswhen incurred and amounted to $56.2 million, $53.1 million and $52.2 million for the fiscal years 2016,2015 and 2014, respectively.
Advertising Costs
Advertising costs relate mainly to print advertisements, digital marketing, trade shows and producteducation for salon professionals. Advertising costs incurred in connection with print advertisements areexpensed the first time the advertisement is run. Other advertising costs are expensed when incurred.Advertising costs were $93.0 million, $95.3 million and $90.2 million for the fiscal years 2016, 2015 and2014, respectively, and are included in selling, general and administrative expenses in our consolidatedstatements of earnings.
Vendor Rebates and Concessions
The Company deems a cash consideration received from a supplier to be a reduction of the cost ofproducts sold unless it is in exchange for an asset or service or a reimbursement of a specific, incremental,
F-12
Sally Beauty Holdings, Inc. and Subsidiaries
Notes to Consolidated Financial Statements (Continued)
Fiscal Years ended September 30, 2016, 2015 and 2014
identifiable cost incurred by the Company in selling the vendor’s products. The majority of cashconsideration received by the Company is considered to be a reduction of the cost of the related productsand is reflected in cost of products sold and distribution expenses in our consolidated statements ofearnings as the related products are sold. Any portion of such cash consideration received that isattributable to inventory on hand is reflected as a reduction of inventory.
Income Taxes
The Company recognizes deferred income taxes for the estimated future tax consequences attributable totemporary differences between the financial statement carrying amounts of existing assets and liabilitiesand their respective tax bases. Deferred tax assets and liabilities are measured using enacted tax ratesexpected to apply to taxable income in the years in which temporary differences are estimated to berecovered or settled. The effect on deferred taxes of a change in tax rates is recognized in the consolidatedstatements of earnings in the period of enactment. A valuation allowance is recorded to reduce thecarrying amounts of deferred tax assets to the amount expected to be realized unless it ismore-likely-than-not that such assets will be realized in full. The estimated tax benefit of an uncertain taxposition is recorded in our financial statements only after determining a more-likely-than-not probabilitythat the uncertain tax position will withstand challenge, if any, from applicable taxing authorities.
Foreign Currency
The functional currency of each of the Company’s foreign operations is generally the respective localcurrency. Balance sheet accounts are translated into U.S. dollars (the Company’s reporting currency) atthe rates of exchange in effect at the balance sheet date, while the results of operations and cash flows aregenerally translated using average exchange rates for the periods presented. Individually materialtransactions, if any, are translated using the actual rate of exchange on the transaction date. The resultingtranslation adjustments are recorded as a component of accumulated other comprehensive loss in ourconsolidated balance sheets. Foreign currency transaction gains or losses, including changes in the fairvalue (i.e., marked-to-market adjustments) of certain foreign exchange contracts held by the Company, areincluded in selling, general and administrative expenses in our consolidated statements of earnings whenincurred and were not significant in any of the periods presented in the accompanying financial statements.Please see Note 14 below for more information about the Company’s foreign exchange contracts.
3. Recent Accounting Pronouncements
The Company has not yet adopted and is currently assessing the potential effect of the followingpronouncements on its consolidated financial statements:
In November 2015, the FASB issued ASU No. 2015-17, Income Taxes (Topic 740): Balance SheetClassification of Deferred Income Taxes (‘‘ASU 2015-17’’) which aims to simplify the classification ofdeferred taxes on the balance sheet. More specifically, ASU 2015-17 will require that all deferred tax assetsand liabilities, and any related valuation allowance, be reported as noncurrent in a classified balance sheet.The new guidance will replace the existing practice of reporting deferred taxes for each tax jurisdiction (ortaxing component of a jurisdiction) as (a) a net current asset or liability and (b) a net noncurrent asset orliability. The new guidance does not change the existing requirement that only permits offsetting assets andliabilities within the same jurisdiction. For public companies, this amendment is effective for fiscal years,and interim periods within those fiscal years, beginning after December 15, 2016. Early adoption ispermitted.
F-13
Sally Beauty Holdings, Inc. and Subsidiaries
Notes to Consolidated Financial Statements (Continued)
Fiscal Years ended September 30, 2016, 2015 and 2014
In February 2016, the FASB issued ASU No. 2016-02, Leases, which will require lessees to report on theirbalance sheets a right-of-use asset and a lease liability in connection with most lease agreements classifiedas operating leases under the current guidance. The lease liability will be measured based on the presentvalue of future lease payments, subject to certain conditions. The right-of-use asset will be measured basedon the initial amount of the liability, plus certain initial direct costs. The new guidance will further requirethat leases be classified at inception as either (a) operating leases or (b) finance leases. For operatingleases, periodic expense will generally be flat (straight-line) throughout the life of the lease. For financeleases, periodic expense will decline (similar to capital leases under current rules) over the life of the lease.The new standard must be adopted using a modified retrospective transition method. For publiccompanies, this amendment is effective for fiscal years, and interim periods within those fiscal years,beginning after December 15, 2018. Early adoption is permitted.
In March 2016, the FASB issued ASU No. 2016-09, Improvements to Employee Share-Based PaymentAccounting, intended to simplify various aspects of how share-based payments are recorded and presentedon the financial statements. For example, the new guidance will require that all the income tax effectrelated to share-based payments be recorded in income tax expense. The new guidance further removesthe current requirement to delay recognition of a windfall tax benefit until it reduces current taxes payable.In addition, the new standard will require that excess tax benefits and shortfalls from share-basedcompensation awards be reported as operating activities in the statement of cash flows. For publiccompanies, these amendments are effective for fiscal years, and interim periods within those fiscal years,beginning after December 15, 2016. Early adoption is permitted.
In addition, the Company has not yet adopted the following recent accounting pronouncements and doesnot believe their adoption will have a material effect on its consolidated financial statements:
In May 2014, the FASB issued ASU No. 2014-09, Revenue from Contracts with Customers which willsupersede ASC Topic 605, Revenue Recognition. In August 2015, the FASB deferred the effective date ofthis new standard by one year. A core principle of the new guidance is that an entity should measurerevenue in connection with its sale of goods and services to a customer based on an amount that depictsthe consideration to which the entity expects to be entitled in exchange for each of those goods andservices. For a contract that involves more than one performance obligation, the entity must (a) determineor, if necessary, estimate the standalone selling price at inception of the contract for the distinct goods orservices underlying each performance obligation and (b) allocate the transaction price to eachperformance obligation on the basis of the relative standalone selling prices. In addition, under the newguidance, an entity should recognize revenue when (or as) it satisfies each performance obligation underthe contract by transferring the promised good or service to the customer. A good or service is deemedtransferred when (or as) the customer obtains control of that good or service. The new standard permitsthe use of either the retrospective or cumulative effect transition method. For public companies, thisamendment is effective for fiscal years, and interim periods within those fiscal years, beginning afterDecember 15, 2017. Early application is permitted, but no earlier than December 16, 2016. The Companyhas not yet selected a transition method.
In April 2015, the FASB issued ASU No. 2015-05, Customer’s Accounting for Fees Paid in Cloud ComputingArrangement. This pronouncement provides guidance to determine whether a cloud-based computingarrangement includes a software license. If a cloud-based computing arrangement includes a softwarelicense, the customer must account for the software element of the arrangement consistent with theacquisition of other software licenses. Otherwise, the customer must account for the arrangement as aservice contract. The new standard permits the use of either the prospective or retrospective transition
F-14
Sally Beauty Holdings, Inc. and Subsidiaries
Notes to Consolidated Financial Statements (Continued)
Fiscal Years ended September 30, 2016, 2015 and 2014
method. For public companies, this amendment is effective for fiscal years, and interim periods withinthose fiscal years, beginning after December 15, 2015.
In September 2015, the Financial Accounting Standards Board (‘‘FASB’’) issued Accounting StandardsUpdate (‘‘ASU’’) No. 2015-16, Business Combinations (Topic 805): Simplifying the Accounting forMeasurement-Period Adjustments (‘‘ASU 2015-16’’) which will eliminate the current requirement torecognize measurement-period adjustments to provisional amounts retrospectively. Instead, ASU 2015-16requires the acquirer to recognize measurement-period adjustments, as well as the impact on earnings ofchanges in depreciation, amortization and similar items (if any) resulting from the change to theprovisional amounts, in the period when the amount of each measurement-period adjustment isdetermined. For public companies, this amendment is effective for fiscal years, and interim periods withinthose fiscal years, beginning after December 15, 2015.
4. Fair Value Measurements
The Company’s financial instruments consist of cash equivalents, trade and other accounts receivable,accounts payable, foreign currency derivative instruments and debt. The carrying amounts of cashequivalents, trade and other accounts receivable and accounts payable approximate their respective fairvalues due to the short-term nature of these financial instruments.
The Company measures on a recurring basis and discloses the fair value of its financial instruments underthe provisions of ASC Topic 820, Fair Value Measurement, as amended (‘‘ASC 820’’). The Company defines‘‘fair value’’ as the price that would be received to sell an asset or paid to transfer a liability (i.e., the exitprice) in an orderly transaction between market participants at the measurement date. ASC 820 establishesa three-level hierarchy for measuring fair value and requires an entity to maximize the use of observableinputs and minimize the use of unobservable inputs when measuring fair value. This valuation hierarchy isbased upon the transparency of inputs to the valuation of an asset or liability on the measurement date.The three levels of that hierarchy are defined as follows:
Level 1—Unadjusted quoted prices in active markets for identical assets or liabilities;
Level 2—Unadjusted quoted prices in active markets for similar assets or liabilities; or unadjustedquoted prices for identical or similar assets or liabilities in markets that are not active; or inputs otherthan quoted prices that are observable for the asset or liability; or inputs that are derived principallyfrom or corroborated by observable market data; and
Level 3—Unobservable inputs for the asset or liability.
F-15
Sally Beauty Holdings, Inc. and Subsidiaries
Notes to Consolidated Financial Statements (Continued)
Fiscal Years ended September 30, 2016, 2015 and 2014
Consistent with this hierarchy, the Company categorized certain of its financial assets and liabilities asfollows at September 30, 2016 and 2015 (in thousands):
As of September 30, 2016Total Level 1 Level 2 Level 3
AssetsCash equivalents(a) . . . . . . . . . . . . . $ — $ — $ — —
Total assets . . . . . . . . . . . . . . . . . . . . . $ — $ — $ — —
LiabilitiesLong-term debt(c) . . . . . . . . . . . . . . $1,899,749 $1,897,625 $2,124 —Foreign exchange contracts(b) . . . . . 272 — 272 —
Total liabilities . . . . . . . . . . . . . . . . . . $1,900,021 $1,897,625 $2,396 —
As of September 30, 2015Total Level 1 Level 2 Level 3
AssetsCash equivalents(a) . . . . . . . . . . . . . $ 46,003 $ 46,003 $ — —Foreign exchange contracts(b) . . . . . 322 — 322 —
Total assets . . . . . . . . . . . . . . . . . . . . . $ 46,325 $ 46,003 $ 322 —
LiabilitiesLong-term debt(c) . . . . . . . . . . . . . . $1,873,620 $1,870,750 $2,870 —Foreign exchange contracts(b) . . . . . 58 — 58 —
Total liabilities . . . . . . . . . . . . . . . . . . $1,873,678 $1,870,750 $2,928 —
(a) Cash equivalents at September 30, 2015 consist of highly liquid investments which have nomaturity and are valued using unadjusted quoted market prices for such securities. TheCompany may from time to time invest in securities with maturities of three months or less(consisting primarily of investment-grade corporate and government bonds), with theprimary investment objective of minimizing the potential risk of loss of principal.
(b) Foreign exchange contracts (including foreign currency forwards and options) are valued forpurposes of this disclosure using widely accepted valuation techniques, such as discountedcash flow analyses, and observable inputs, such as market foreign currency exchange rates.Please see Note 14 for more information about the Company’s foreign exchange contracts.
(c) At September 30, 2016 and 2015, long-term debt (including current maturities andborrowings under the ABL facility, if any) is reported in the Company’s consolidatedfinancial statements at amortized cost of $1,807.7 million and $1,809.4 million, respectively,less unamortized debt issuance costs of $23.7 million and $21.8 million, respectively. TheCompany’s senior notes are valued for purposes of this disclosure using unadjusted quotedmarket prices for such debt securities. Other long-term debt (consisting primarily ofborrowings under the ABL facility, if any, and capital lease obligations) is generally valuedfor purposes of this disclosure using widely accepted valuation techniques, such asdiscounted cash flow analyses, and observable inputs, such as market interest rates. Pleasesee Note 13 for more information about the Company’s debt.
F-16
Sally Beauty Holdings, Inc. and Subsidiaries
Notes to Consolidated Financial Statements (Continued)
Fiscal Years ended September 30, 2016, 2015 and 2014
5. Accumulated Stockholders’ Deficit
The Company is authorized to issue up to 500.0 million shares of common stock with a par value of $0.01per share and up to 50.0 million shares of preferred stock with a par value of $0.01 per share. As ofSeptember 30, 2016, the Company had approximately 144.8 million shares issued of its common stock andapproximately 144.6 million shares outstanding. There have been no shares of the Company’s preferredstock issued.
In August 2014, the Company announced that its Board of Directors (the ‘‘Board’’) approved a sharerepurchase program authorizing the Company to repurchase up to $1.0 billion of its common stock over anapproximate three-year period expiring on September 30, 2017 (the ‘‘2014 Share Repurchase Program’’).During the fiscal years ended September 30, 2016 and 2015, the Company repurchased and subsequentlyretired approximately 7.8 million and 8.1 million shares of its common stock, respectively, under the 2014Share Repurchase Program at a cost of $207.3 million and $227.6 million, respectively. In addition, duringthe fiscal year ended September 30, 2014, the Company repurchased and retired approximately12.6 million shares of its common stock under the 2013 Share Repurchase Program (a share repurchaseprogram approved by the Board in March 2013 and terminated in connection with the authorization of the2014 Share Repurchase Program) at a cost of $333.3 million. We reduced common stock and additionalpaid-in capital, in the aggregate, by these amounts. However, as required by GAAP, to the extent that sharerepurchase amounts exceeded the balance of additional paid-in capital prior to us recording suchrepurchases, we recorded the excess in accumulated deficit. The Company funded these share repurchaseswith cash from operations, borrowings under the ABL facility and a portion of the cash proceeds from ourOctober 2013 debt issuance.
At September 30, 2016 and 2015, accumulated other comprehensive loss consists of cumulative foreigncurrency translation adjustments of $100.1 million and $77.7 million, respectively, and is net of incometaxes of $2.3 million at both dates. Comprehensive income reflects changes in accumulated stockholders’deficit from sources other than transactions with stockholders and, as such, includes net earnings andcertain other specified components. Currently, the Company’s only component of comprehensive income,other than net earnings, is foreign currency translation adjustments, net of income tax.
6. Earnings Per Share
Basic earnings per share, is calculated by dividing net earnings by the weighted average number of sharesof common stock outstanding during the period. Diluted earnings per share, is calculated similarly butincludes the potential dilution from the exercise of all outstanding stock options and stock awards, exceptwhen the effect would be anti-dilutive.
F-17
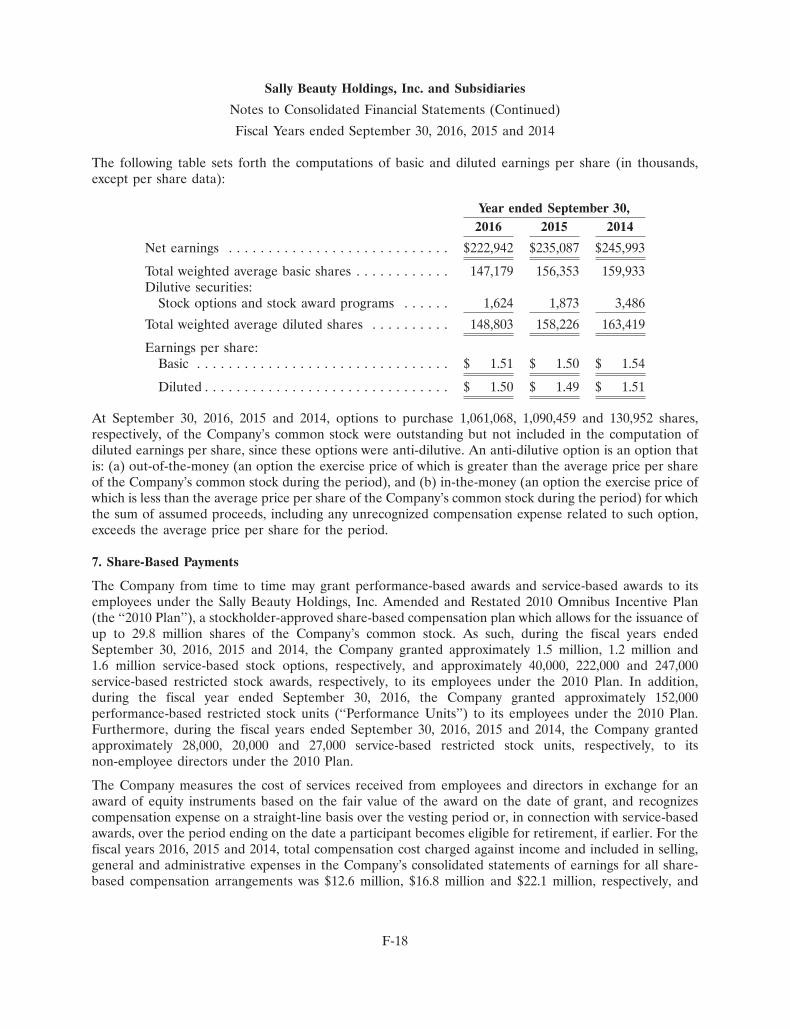
Sally Beauty Holdings, Inc. and Subsidiaries
Notes to Consolidated Financial Statements (Continued)
Fiscal Years ended September 30, 2016, 2015 and 2014
The following table sets forth the computations of basic and diluted earnings per share (in thousands,except per share data):
Year ended September 30,2016 2015 2014
Net earnings . . . . . . . . . . . . . . . . . . . . . . . . . . . . $222,942 $235,087 $245,993
Total weighted average basic shares . . . . . . . . . . . . 147,179 156,353 159,933Dilutive securities:
Stock options and stock award programs . . . . . . 1,624 1,873 3,486
Total weighted average diluted shares . . . . . . . . . . 148,803 158,226 163,419
Earnings per share:Basic . . . . . . . . . . . . . . . . . . . . . . . . . . . . . . . . $ 1.51 $ 1.50 $ 1.54
Diluted . . . . . . . . . . . . . . . . . . . . . . . . . . . . . . . $ 1.50 $ 1.49 $ 1.51
At September 30, 2016, 2015 and 2014, options to purchase 1,061,068, 1,090,459 and 130,952 shares,respectively, of the Company’s common stock were outstanding but not included in the computation ofdiluted earnings per share, since these options were anti-dilutive. An anti-dilutive option is an option thatis: (a) out-of-the-money (an option the exercise price of which is greater than the average price per shareof the Company’s common stock during the period), and (b) in-the-money (an option the exercise price ofwhich is less than the average price per share of the Company’s common stock during the period) for whichthe sum of assumed proceeds, including any unrecognized compensation expense related to such option,exceeds the average price per share for the period.
7. Share-Based Payments
The Company from time to time may grant performance-based awards and service-based awards to itsemployees under the Sally Beauty Holdings, Inc. Amended and Restated 2010 Omnibus Incentive Plan(the ‘‘2010 Plan’’), a stockholder-approved share-based compensation plan which allows for the issuance ofup to 29.8 million shares of the Company’s common stock. As such, during the fiscal years endedSeptember 30, 2016, 2015 and 2014, the Company granted approximately 1.5 million, 1.2 million and1.6 million service-based stock options, respectively, and approximately 40,000, 222,000 and 247,000service-based restricted stock awards, respectively, to its employees under the 2010 Plan. In addition,during the fiscal year ended September 30, 2016, the Company granted approximately 152,000performance-based restricted stock units (‘‘Performance Units’’) to its employees under the 2010 Plan.Furthermore, during the fiscal years ended September 30, 2016, 2015 and 2014, the Company grantedapproximately 28,000, 20,000 and 27,000 service-based restricted stock units, respectively, to itsnon-employee directors under the 2010 Plan.
The Company measures the cost of services received from employees and directors in exchange for anaward of equity instruments based on the fair value of the award on the date of grant, and recognizescompensation expense on a straight-line basis over the vesting period or, in connection with service-basedawards, over the period ending on the date a participant becomes eligible for retirement, if earlier. For thefiscal years 2016, 2015 and 2014, total compensation cost charged against income and included in selling,general and administrative expenses in the Company’s consolidated statements of earnings for all share-based compensation arrangements was $12.6 million, $16.8 million and $22.1 million, respectively, and
F-18
Sally Beauty Holdings, Inc. and Subsidiaries
Notes to Consolidated Financial Statements (Continued)
Fiscal Years ended September 30, 2016, 2015 and 2014
resulted in an increase in additional paid-in capital by the same amounts. These amounts include, for thefiscal years 2016, 2015 and 2014, $1.3 million, $4.8 million and $8.8 million, respectively, of acceleratedexpense related to certain retirement eligible employees who continue vesting in service-based awardsupon retirement, pursuant to provisions contained in the 2010 Plan, including, for the fiscal year 2014,expense of $3.5 million in connection with the executive management transition plan announced in May2014. For fiscal years 2016, 2015 and 2014, the total income tax benefit recognized in our consolidatedstatements of earnings in connection with all share-based compensation awards was $4.8 million,$6.3 million and $8.2 million, respectively.
Performance-Based Awards
The Company from time to time may grant Performance Units under the 2010 Plan. Performance Unitsrepresent unsecured obligations of the Company to issue shares of its common stock. The number ofshares, if any, which will be issued in connection with these awards, is contingent upon both (a) employeeservice conditions and (b) the Company’s level of achievement with respect to specified performancetargets. The Company measures the cost of services received from employees in exchange for an award ofPerformance Units based on the fair value of the award on the date of grant and it recognizes expense overthe requisite service period (generally three years). The fair value of a Performance Unit is determinedbased on the closing market price of the Company’s common stock on the date of grant.
During the fiscal year ended September 30, 2016, the Company granted approximately 152,000Performance Units (‘‘target units’’) to its employees. Under the terms of these awards, a grantee may earnfrom 0% to 200% of his or her target units, with the ultimate number of units earned upon settlement (andexpense recognized) dependent on the Company’s level of achievement with respect to certain specifiedcumulative performance targets during the three-year period ending on September 30, 2018 (the‘‘Performance Period’’) and satisfaction of the employee service condition. Periodic expense forPerformance Unit awards, which is estimated quarterly, is based on the Company’s projected performanceduring the Performance Period compared to the performance targets contained in the award. As such, forthe fiscal year ended September 30, 2016, the Company has estimated and recognized compensationexpense at 100% of the performance targets since it believes achievement of that percentage of theperformance targets is probable. To date, the Company has only granted Performance Units subject to theCompany’s level of achievement with respect to specified performance targets related to: consolidatedsales growth and return on invested capital, in addition to service conditions. The awards issued during thefiscal year ended September 30, 2016 contain a performance matrix for each of the two performancemetrics (consolidated sales growth and return on invested capital), which matrices provide for achievementof 0% to 100% of the applicable performance targets. The performance multiplier to be applied to thenumber of target units awarded will be calculated by adding together the percentage of the target awardearned under each of the two performance matrices.
F-19
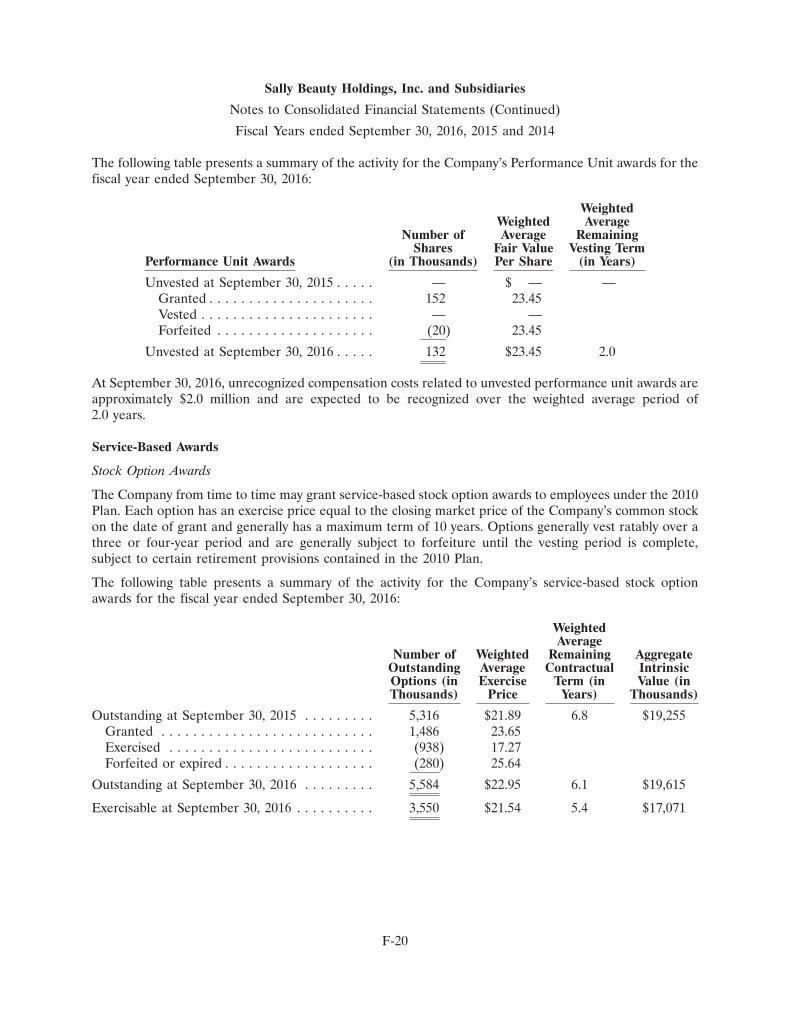
Sally Beauty Holdings, Inc. and Subsidiaries
Notes to Consolidated Financial Statements (Continued)
Fiscal Years ended September 30, 2016, 2015 and 2014
The following table presents a summary of the activity for the Company’s Performance Unit awards for thefiscal year ended September 30, 2016:
WeightedWeighted Average
Number of Average RemainingShares Fair Value Vesting Term
Performance Unit Awards (in Thousands) Per Share (in Years)
Unvested at September 30, 2015 . . . . . — $ — —Granted . . . . . . . . . . . . . . . . . . . . . 152 23.45Vested . . . . . . . . . . . . . . . . . . . . . . — —Forfeited . . . . . . . . . . . . . . . . . . . . (20) 23.45
Unvested at September 30, 2016 . . . . . 132 $23.45 2.0
At September 30, 2016, unrecognized compensation costs related to unvested performance unit awards areapproximately $2.0 million and are expected to be recognized over the weighted average period of2.0 years.
Service-Based Awards
Stock Option Awards
The Company from time to time may grant service-based stock option awards to employees under the 2010Plan. Each option has an exercise price equal to the closing market price of the Company’s common stockon the date of grant and generally has a maximum term of 10 years. Options generally vest ratably over athree or four-year period and are generally subject to forfeiture until the vesting period is complete,subject to certain retirement provisions contained in the 2010 Plan.
The following table presents a summary of the activity for the Company’s service-based stock optionawards for the fiscal year ended September 30, 2016:
WeightedAverage
Number of Weighted Remaining AggregateOutstanding Average Contractual IntrinsicOptions (in Exercise Term (in Value (inThousands) Price Years) Thousands)
Outstanding at September 30, 2015 . . . . . . . . . 5,316 $21.89 6.8 $19,255Granted . . . . . . . . . . . . . . . . . . . . . . . . . . . 1,486 23.65Exercised . . . . . . . . . . . . . . . . . . . . . . . . . . (938) 17.27Forfeited or expired . . . . . . . . . . . . . . . . . . . (280) 25.64
Outstanding at September 30, 2016 . . . . . . . . . 5,584 $22.95 6.1 $19,615
Exercisable at September 30, 2016 . . . . . . . . . . 3,550 $21.54 5.4 $17,071
F-20
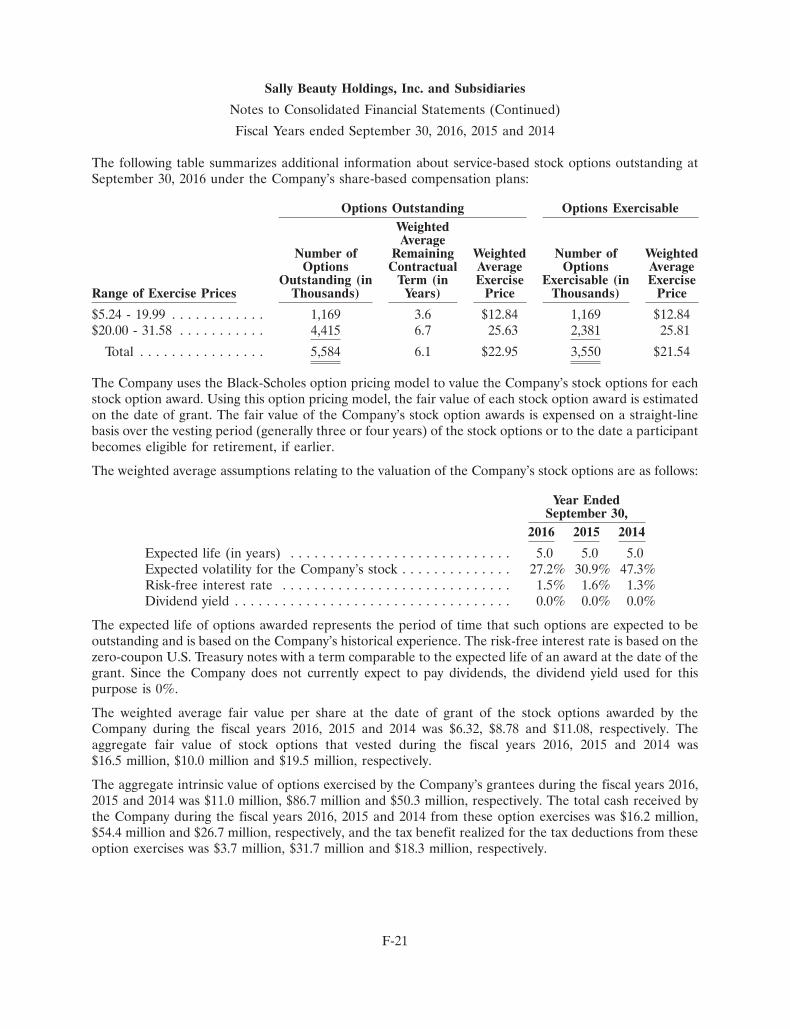
Sally Beauty Holdings, Inc. and Subsidiaries
Notes to Consolidated Financial Statements (Continued)
Fiscal Years ended September 30, 2016, 2015 and 2014
The following table summarizes additional information about service-based stock options outstanding atSeptember 30, 2016 under the Company’s share-based compensation plans:
Options Outstanding Options ExercisableWeightedAverage
Number of Remaining Weighted Number of WeightedOptions Contractual Average Options Average
Outstanding (in Term (in Exercise Exercisable (in ExerciseRange of Exercise Prices Thousands) Years) Price Thousands) Price
$5.24 - 19.99 . . . . . . . . . . . . 1,169 3.6 $12.84 1,169 $12.84$20.00 - 31.58 . . . . . . . . . . . 4,415 6.7 25.63 2,381 25.81
Total . . . . . . . . . . . . . . . . 5,584 6.1 $22.95 3,550 $21.54
The Company uses the Black-Scholes option pricing model to value the Company’s stock options for eachstock option award. Using this option pricing model, the fair value of each stock option award is estimatedon the date of grant. The fair value of the Company’s stock option awards is expensed on a straight-linebasis over the vesting period (generally three or four years) of the stock options or to the date a participantbecomes eligible for retirement, if earlier.
The weighted average assumptions relating to the valuation of the Company’s stock options are as follows:
Year EndedSeptember 30,
2016 2015 2014
Expected life (in years) . . . . . . . . . . . . . . . . . . . . . . . . . . . . 5.0 5.0 5.0Expected volatility for the Company’s stock . . . . . . . . . . . . . . 27.2% 30.9% 47.3%Risk-free interest rate . . . . . . . . . . . . . . . . . . . . . . . . . . . . . 1.5% 1.6% 1.3%Dividend yield . . . . . . . . . . . . . . . . . . . . . . . . . . . . . . . . . . . 0.0% 0.0% 0.0%
The expected life of options awarded represents the period of time that such options are expected to beoutstanding and is based on the Company’s historical experience. The risk-free interest rate is based on thezero-coupon U.S. Treasury notes with a term comparable to the expected life of an award at the date of thegrant. Since the Company does not currently expect to pay dividends, the dividend yield used for thispurpose is 0%.
The weighted average fair value per share at the date of grant of the stock options awarded by theCompany during the fiscal years 2016, 2015 and 2014 was $6.32, $8.78 and $11.08, respectively. Theaggregate fair value of stock options that vested during the fiscal years 2016, 2015 and 2014 was$16.5 million, $10.0 million and $19.5 million, respectively.
The aggregate intrinsic value of options exercised by the Company’s grantees during the fiscal years 2016,2015 and 2014 was $11.0 million, $86.7 million and $50.3 million, respectively. The total cash received bythe Company during the fiscal years 2016, 2015 and 2014 from these option exercises was $16.2 million,$54.4 million and $26.7 million, respectively, and the tax benefit realized for the tax deductions from theseoption exercises was $3.7 million, $31.7 million and $18.3 million, respectively.
F-21
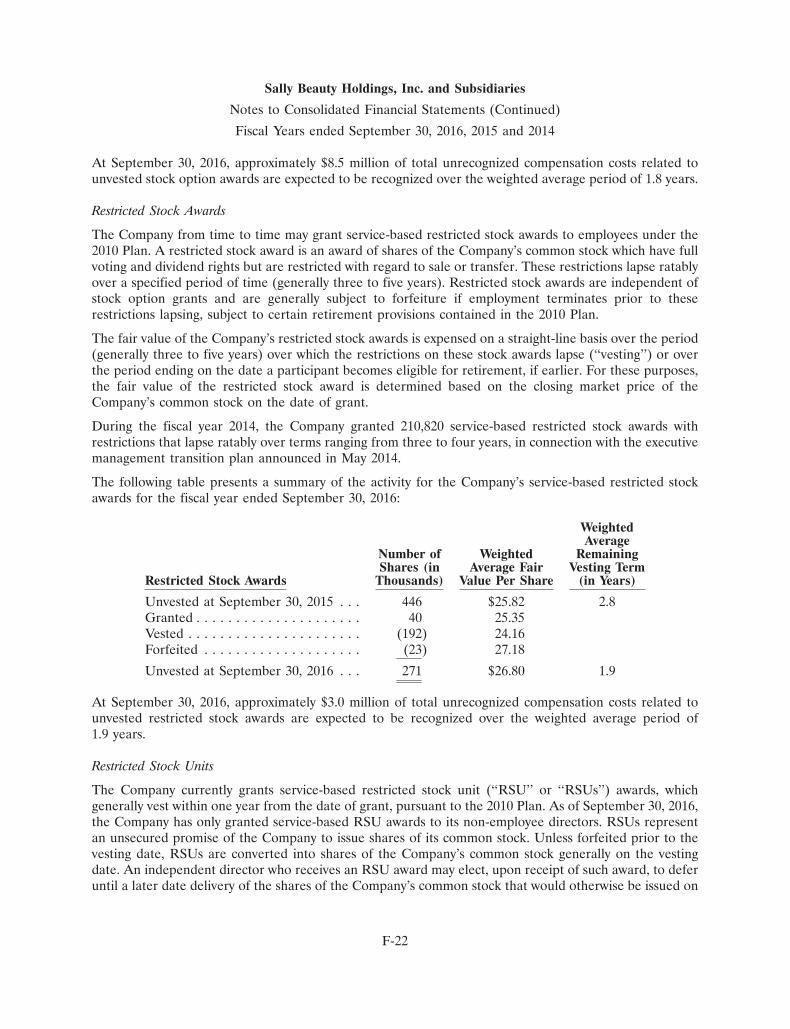
Sally Beauty Holdings, Inc. and Subsidiaries
Notes to Consolidated Financial Statements (Continued)
Fiscal Years ended September 30, 2016, 2015 and 2014
At September 30, 2016, approximately $8.5 million of total unrecognized compensation costs related tounvested stock option awards are expected to be recognized over the weighted average period of 1.8 years.
Restricted Stock Awards
The Company from time to time may grant service-based restricted stock awards to employees under the2010 Plan. A restricted stock award is an award of shares of the Company’s common stock which have fullvoting and dividend rights but are restricted with regard to sale or transfer. These restrictions lapse ratablyover a specified period of time (generally three to five years). Restricted stock awards are independent ofstock option grants and are generally subject to forfeiture if employment terminates prior to theserestrictions lapsing, subject to certain retirement provisions contained in the 2010 Plan.
The fair value of the Company’s restricted stock awards is expensed on a straight-line basis over the period(generally three to five years) over which the restrictions on these stock awards lapse (‘‘vesting’’) or overthe period ending on the date a participant becomes eligible for retirement, if earlier. For these purposes,the fair value of the restricted stock award is determined based on the closing market price of theCompany’s common stock on the date of grant.
During the fiscal year 2014, the Company granted 210,820 service-based restricted stock awards withrestrictions that lapse ratably over terms ranging from three to four years, in connection with the executivemanagement transition plan announced in May 2014.
The following table presents a summary of the activity for the Company’s service-based restricted stockawards for the fiscal year ended September 30, 2016:
WeightedAverage
Number of Weighted RemainingShares (in Average Fair Vesting Term
Restricted Stock Awards Thousands) Value Per Share (in Years)
Unvested at September 30, 2015 . . . 446 $25.82 2.8Granted . . . . . . . . . . . . . . . . . . . . . 40 25.35Vested . . . . . . . . . . . . . . . . . . . . . . (192) 24.16Forfeited . . . . . . . . . . . . . . . . . . . . (23) 27.18
Unvested at September 30, 2016 . . . 271 $26.80 1.9
At September 30, 2016, approximately $3.0 million of total unrecognized compensation costs related tounvested restricted stock awards are expected to be recognized over the weighted average period of1.9 years.
Restricted Stock Units
The Company currently grants service-based restricted stock unit (‘‘RSU’’ or ‘‘RSUs’’) awards, whichgenerally vest within one year from the date of grant, pursuant to the 2010 Plan. As of September 30, 2016,the Company has only granted service-based RSU awards to its non-employee directors. RSUs representan unsecured promise of the Company to issue shares of its common stock. Unless forfeited prior to thevesting date, RSUs are converted into shares of the Company’s common stock generally on the vestingdate. An independent director who receives an RSU award may elect, upon receipt of such award, to deferuntil a later date delivery of the shares of the Company’s common stock that would otherwise be issued on
F-22
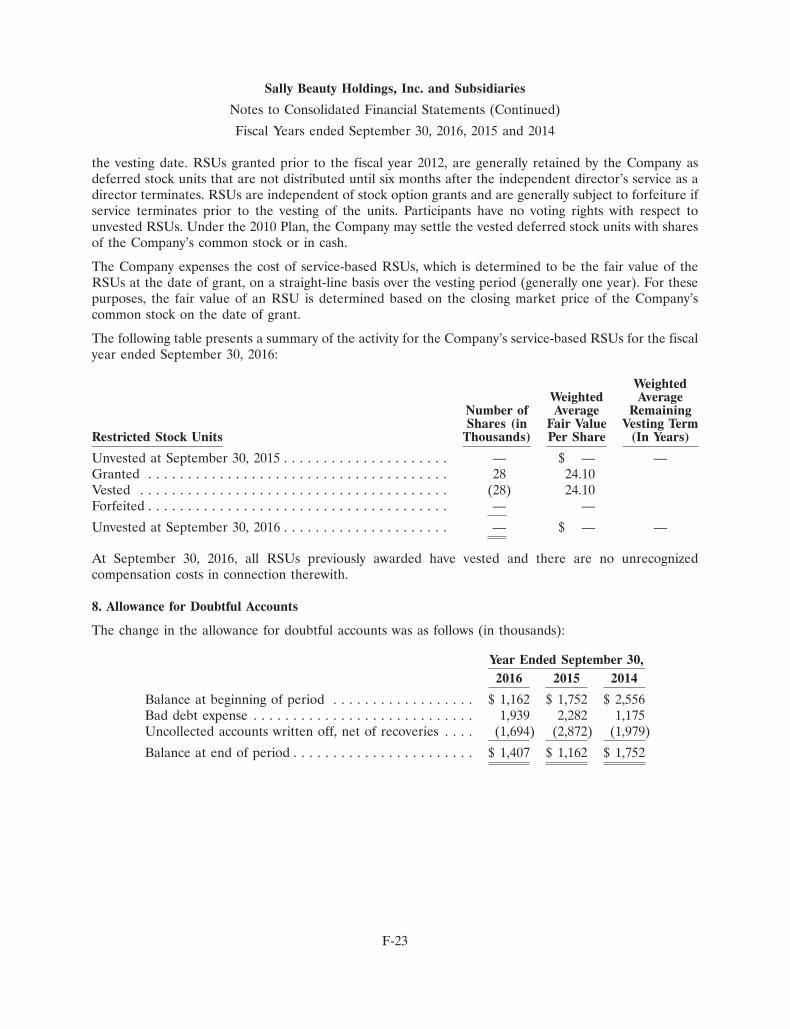
Sally Beauty Holdings, Inc. and Subsidiaries
Notes to Consolidated Financial Statements (Continued)
Fiscal Years ended September 30, 2016, 2015 and 2014
the vesting date. RSUs granted prior to the fiscal year 2012, are generally retained by the Company asdeferred stock units that are not distributed until six months after the independent director’s service as adirector terminates. RSUs are independent of stock option grants and are generally subject to forfeiture ifservice terminates prior to the vesting of the units. Participants have no voting rights with respect tounvested RSUs. Under the 2010 Plan, the Company may settle the vested deferred stock units with sharesof the Company’s common stock or in cash.
The Company expenses the cost of service-based RSUs, which is determined to be the fair value of theRSUs at the date of grant, on a straight-line basis over the vesting period (generally one year). For thesepurposes, the fair value of an RSU is determined based on the closing market price of the Company’scommon stock on the date of grant.
The following table presents a summary of the activity for the Company’s service-based RSUs for the fiscalyear ended September 30, 2016:
WeightedWeighted Average
Number of Average RemainingShares (in Fair Value Vesting Term
Restricted Stock Units Thousands) Per Share (In Years)
Unvested at September 30, 2015 . . . . . . . . . . . . . . . . . . . . . — $ — —Granted . . . . . . . . . . . . . . . . . . . . . . . . . . . . . . . . . . . . . . 28 24.10Vested . . . . . . . . . . . . . . . . . . . . . . . . . . . . . . . . . . . . . . . (28) 24.10Forfeited . . . . . . . . . . . . . . . . . . . . . . . . . . . . . . . . . . . . . . — —
Unvested at September 30, 2016 . . . . . . . . . . . . . . . . . . . . . — $ — —
At September 30, 2016, all RSUs previously awarded have vested and there are no unrecognizedcompensation costs in connection therewith.
8. Allowance for Doubtful Accounts
The change in the allowance for doubtful accounts was as follows (in thousands):
Year Ended September 30,2016 2015 2014
Balance at beginning of period . . . . . . . . . . . . . . . . . . $ 1,162 $ 1,752 $ 2,556Bad debt expense . . . . . . . . . . . . . . . . . . . . . . . . . . . . 1,939 2,282 1,175Uncollected accounts written off, net of recoveries . . . . (1,694) (2,872) (1,979)
Balance at end of period . . . . . . . . . . . . . . . . . . . . . . . $ 1,407 $ 1,162 $ 1,752
F-23
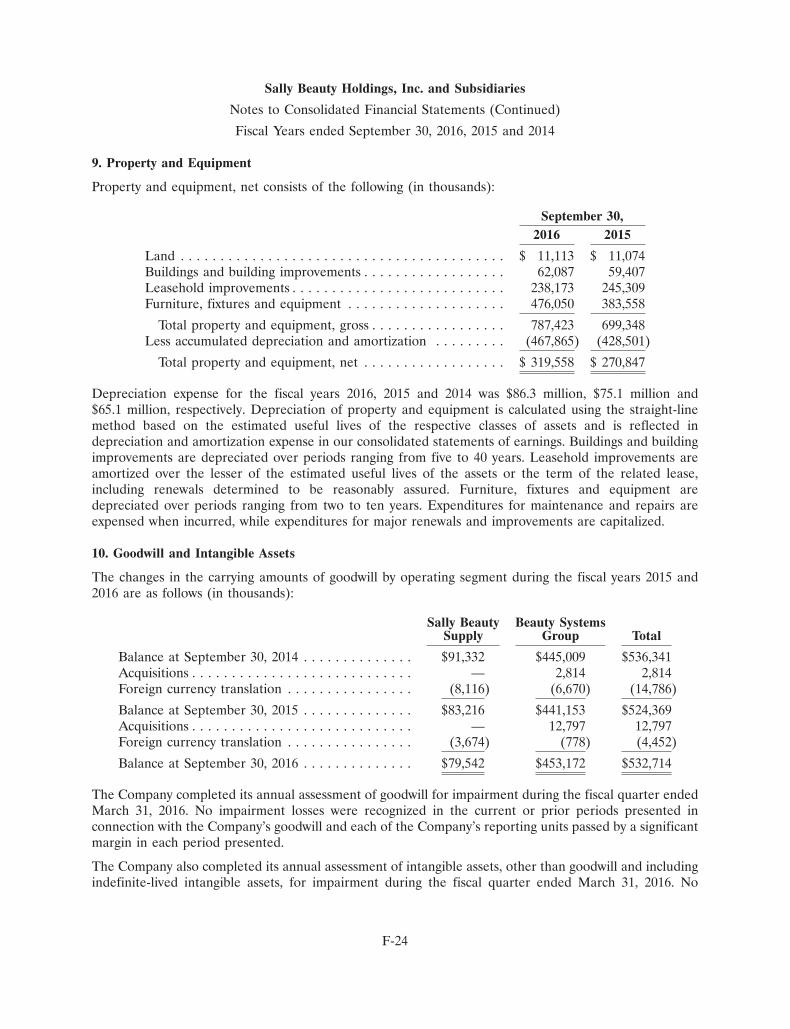
Sally Beauty Holdings, Inc. and Subsidiaries
Notes to Consolidated Financial Statements (Continued)
Fiscal Years ended September 30, 2016, 2015 and 2014
9. Property and Equipment
Property and equipment, net consists of the following (in thousands):
September 30,2016 2015
Land . . . . . . . . . . . . . . . . . . . . . . . . . . . . . . . . . . . . . . . . . $ 11,113 $ 11,074Buildings and building improvements . . . . . . . . . . . . . . . . . . 62,087 59,407Leasehold improvements . . . . . . . . . . . . . . . . . . . . . . . . . . . 238,173 245,309Furniture, fixtures and equipment . . . . . . . . . . . . . . . . . . . . 476,050 383,558
Total property and equipment, gross . . . . . . . . . . . . . . . . . 787,423 699,348Less accumulated depreciation and amortization . . . . . . . . . (467,865) (428,501)
Total property and equipment, net . . . . . . . . . . . . . . . . . . $ 319,558 $ 270,847
Depreciation expense for the fiscal years 2016, 2015 and 2014 was $86.3 million, $75.1 million and$65.1 million, respectively. Depreciation of property and equipment is calculated using the straight-linemethod based on the estimated useful lives of the respective classes of assets and is reflected indepreciation and amortization expense in our consolidated statements of earnings. Buildings and buildingimprovements are depreciated over periods ranging from five to 40 years. Leasehold improvements areamortized over the lesser of the estimated useful lives of the assets or the term of the related lease,including renewals determined to be reasonably assured. Furniture, fixtures and equipment aredepreciated over periods ranging from two to ten years. Expenditures for maintenance and repairs areexpensed when incurred, while expenditures for major renewals and improvements are capitalized.
10. Goodwill and Intangible Assets
The changes in the carrying amounts of goodwill by operating segment during the fiscal years 2015 and2016 are as follows (in thousands):
Sally Beauty Beauty SystemsSupply Group Total
Balance at September 30, 2014 . . . . . . . . . . . . . . $91,332 $445,009 $536,341Acquisitions . . . . . . . . . . . . . . . . . . . . . . . . . . . . — 2,814 2,814Foreign currency translation . . . . . . . . . . . . . . . . (8,116) (6,670) (14,786)
Balance at September 30, 2015 . . . . . . . . . . . . . . $83,216 $441,153 $524,369Acquisitions . . . . . . . . . . . . . . . . . . . . . . . . . . . . — 12,797 12,797Foreign currency translation . . . . . . . . . . . . . . . . (3,674) (778) (4,452)
Balance at September 30, 2016 . . . . . . . . . . . . . . $79,542 $453,172 $532,714
The Company completed its annual assessment of goodwill for impairment during the fiscal quarter endedMarch 31, 2016. No impairment losses were recognized in the current or prior periods presented inconnection with the Company’s goodwill and each of the Company’s reporting units passed by a significantmargin in each period presented.
The Company also completed its annual assessment of intangible assets, other than goodwill and includingindefinite-lived intangible assets, for impairment during the fiscal quarter ended March 31, 2016. No
F-24
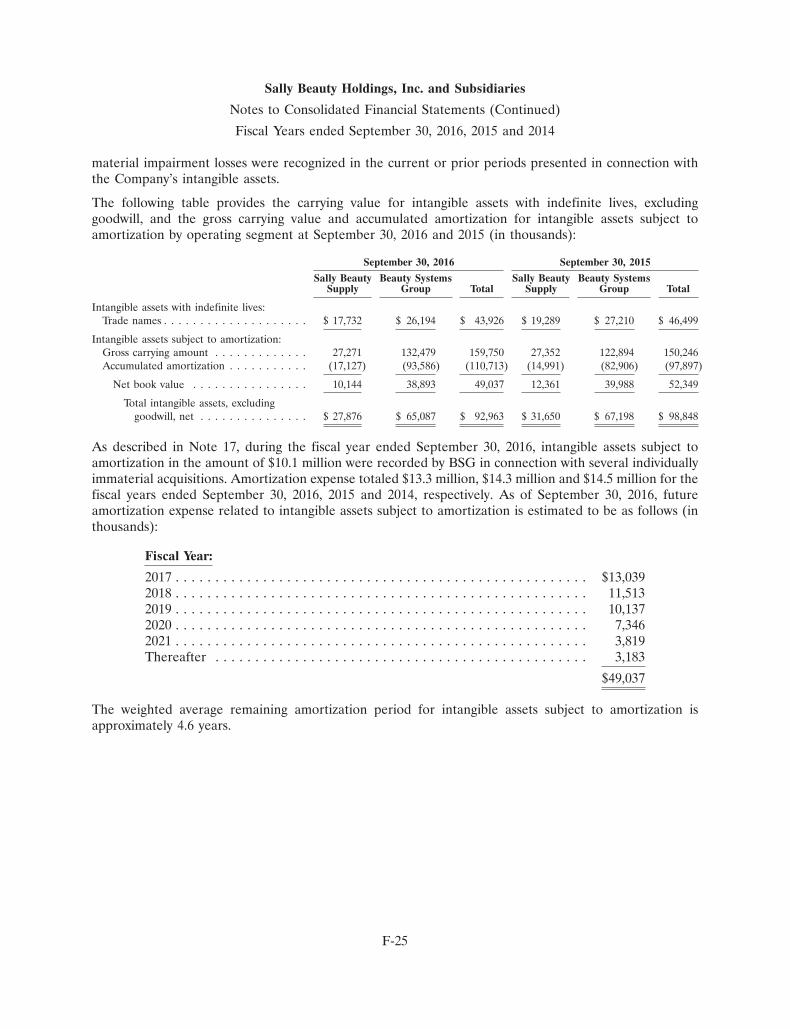
Sally Beauty Holdings, Inc. and Subsidiaries
Notes to Consolidated Financial Statements (Continued)
Fiscal Years ended September 30, 2016, 2015 and 2014
material impairment losses were recognized in the current or prior periods presented in connection withthe Company’s intangible assets.
The following table provides the carrying value for intangible assets with indefinite lives, excludinggoodwill, and the gross carrying value and accumulated amortization for intangible assets subject toamortization by operating segment at September 30, 2016 and 2015 (in thousands):
September 30, 2016 September 30, 2015
Sally Beauty Beauty Systems Sally Beauty Beauty SystemsSupply Group Total Supply Group Total
Intangible assets with indefinite lives:Trade names . . . . . . . . . . . . . . . . . . . . $ 17,732 $ 26,194 $ 43,926 $ 19,289 $ 27,210 $ 46,499
Intangible assets subject to amortization:Gross carrying amount . . . . . . . . . . . . . 27,271 132,479 159,750 27,352 122,894 150,246Accumulated amortization . . . . . . . . . . . (17,127) (93,586) (110,713) (14,991) (82,906) (97,897)
Net book value . . . . . . . . . . . . . . . . 10,144 38,893 49,037 12,361 39,988 52,349
Total intangible assets, excludinggoodwill, net . . . . . . . . . . . . . . . $ 27,876 $ 65,087 $ 92,963 $ 31,650 $ 67,198 $ 98,848
As described in Note 17, during the fiscal year ended September 30, 2016, intangible assets subject toamortization in the amount of $10.1 million were recorded by BSG in connection with several individuallyimmaterial acquisitions. Amortization expense totaled $13.3 million, $14.3 million and $14.5 million for thefiscal years ended September 30, 2016, 2015 and 2014, respectively. As of September 30, 2016, futureamortization expense related to intangible assets subject to amortization is estimated to be as follows (inthousands):
Fiscal Year:
2017 . . . . . . . . . . . . . . . . . . . . . . . . . . . . . . . . . . . . . . . . . . . . . . . . . . . . $13,0392018 . . . . . . . . . . . . . . . . . . . . . . . . . . . . . . . . . . . . . . . . . . . . . . . . . . . . 11,5132019 . . . . . . . . . . . . . . . . . . . . . . . . . . . . . . . . . . . . . . . . . . . . . . . . . . . . 10,1372020 . . . . . . . . . . . . . . . . . . . . . . . . . . . . . . . . . . . . . . . . . . . . . . . . . . . . 7,3462021 . . . . . . . . . . . . . . . . . . . . . . . . . . . . . . . . . . . . . . . . . . . . . . . . . . . . 3,819Thereafter . . . . . . . . . . . . . . . . . . . . . . . . . . . . . . . . . . . . . . . . . . . . . . . 3,183
$49,037
The weighted average remaining amortization period for intangible assets subject to amortization isapproximately 4.6 years.
F-25
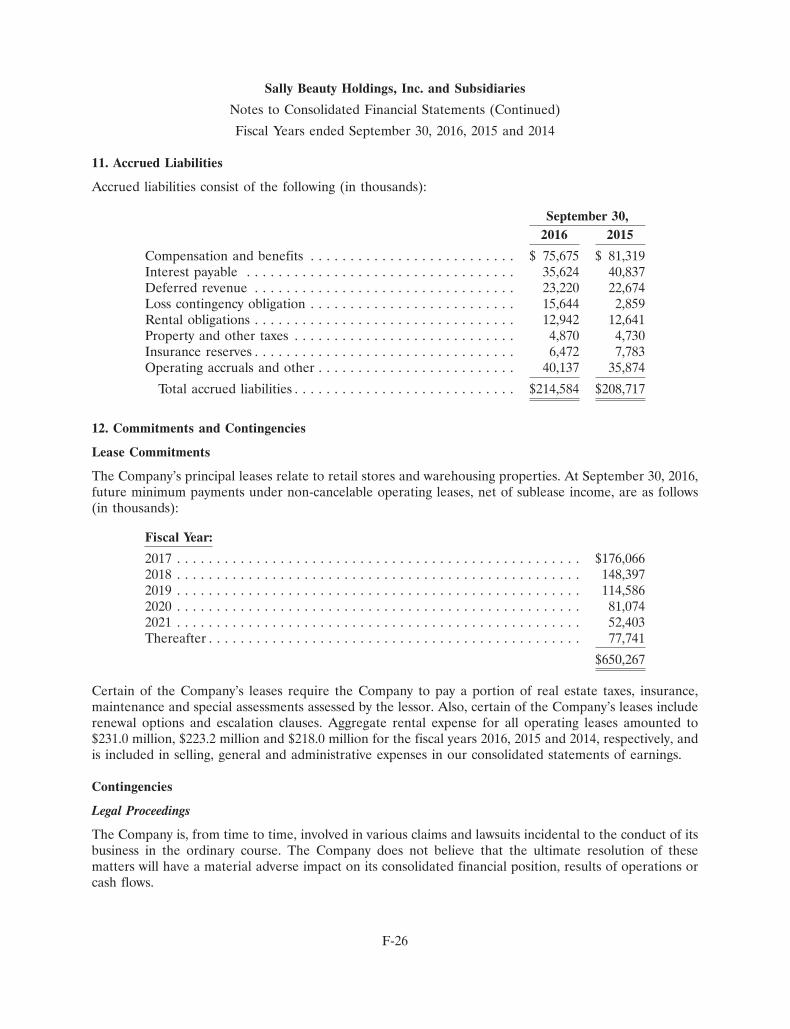
Sally Beauty Holdings, Inc. and Subsidiaries
Notes to Consolidated Financial Statements (Continued)
Fiscal Years ended September 30, 2016, 2015 and 2014
11. Accrued Liabilities
Accrued liabilities consist of the following (in thousands):
September 30,2016 2015
Compensation and benefits . . . . . . . . . . . . . . . . . . . . . . . . . . $ 75,675 $ 81,319Interest payable . . . . . . . . . . . . . . . . . . . . . . . . . . . . . . . . . . 35,624 40,837Deferred revenue . . . . . . . . . . . . . . . . . . . . . . . . . . . . . . . . . 23,220 22,674Loss contingency obligation . . . . . . . . . . . . . . . . . . . . . . . . . . 15,644 2,859Rental obligations . . . . . . . . . . . . . . . . . . . . . . . . . . . . . . . . . 12,942 12,641Property and other taxes . . . . . . . . . . . . . . . . . . . . . . . . . . . . 4,870 4,730Insurance reserves . . . . . . . . . . . . . . . . . . . . . . . . . . . . . . . . . 6,472 7,783Operating accruals and other . . . . . . . . . . . . . . . . . . . . . . . . . 40,137 35,874
Total accrued liabilities . . . . . . . . . . . . . . . . . . . . . . . . . . . . $214,584 $208,717
12. Commitments and Contingencies
Lease Commitments
The Company’s principal leases relate to retail stores and warehousing properties. At September 30, 2016,future minimum payments under non-cancelable operating leases, net of sublease income, are as follows(in thousands):
Fiscal Year:
2017 . . . . . . . . . . . . . . . . . . . . . . . . . . . . . . . . . . . . . . . . . . . . . . . . . . . $176,0662018 . . . . . . . . . . . . . . . . . . . . . . . . . . . . . . . . . . . . . . . . . . . . . . . . . . . 148,3972019 . . . . . . . . . . . . . . . . . . . . . . . . . . . . . . . . . . . . . . . . . . . . . . . . . . . 114,5862020 . . . . . . . . . . . . . . . . . . . . . . . . . . . . . . . . . . . . . . . . . . . . . . . . . . . 81,0742021 . . . . . . . . . . . . . . . . . . . . . . . . . . . . . . . . . . . . . . . . . . . . . . . . . . . 52,403Thereafter . . . . . . . . . . . . . . . . . . . . . . . . . . . . . . . . . . . . . . . . . . . . . . . 77,741
$650,267
Certain of the Company’s leases require the Company to pay a portion of real estate taxes, insurance,maintenance and special assessments assessed by the lessor. Also, certain of the Company’s leases includerenewal options and escalation clauses. Aggregate rental expense for all operating leases amounted to$231.0 million, $223.2 million and $218.0 million for the fiscal years 2016, 2015 and 2014, respectively, andis included in selling, general and administrative expenses in our consolidated statements of earnings.
Contingencies
Legal Proceedings
The Company is, from time to time, involved in various claims and lawsuits incidental to the conduct of itsbusiness in the ordinary course. The Company does not believe that the ultimate resolution of thesematters will have a material adverse impact on its consolidated financial position, results of operations orcash flows.
F-26
Sally Beauty Holdings, Inc. and Subsidiaries
Notes to Consolidated Financial Statements (Continued)
Fiscal Years ended September 30, 2016, 2015 and 2014
Other Contingencies
During the fiscal year 2014, the Company disclosed that it had experienced a data security incident (the‘‘2014 data security incident’’). During the fiscal year 2015, the Company disclosed that it had experienceda second data security incident (the ‘‘2015 data security incident’’ and, together with the 2014 data securityincident, the ‘‘data security incidents’’). The data security incidents involved the unauthorized installationof malicious software (malware) on our information technology systems, including our point-of-salesystems that, we believe may have placed at risk certain payment card data for some transactions. The coststhat the Company has incurred to date in connection with the data security incidents include assessmentsby payment card networks, professional advisory fees and legal costs and expenses relating to investigatingand remediating the data security incidents.
For the fiscal years ended September 30, 2016, 2015 and 2014, selling, general and administrative expensesreflect expenses of $14.6 million, $5.6 million (net of related insurance recovery of $0.6 million) and$2.5 million, respectively, consisting of costs related to the data security incidents, inclusive of an accruedliability of approximately $2.9 million related to loss contingencies associated with the 2014 data securityincident recorded during the fiscal year ended September 30, 2015 and an accrued liability ofapproximately $12.8 million related to loss contingencies associated with the 2015 data security incidentrecorded during the fiscal year ended September 30, 2016. As of September 30, 2016 and 2015, theCompany had an aggregate accrued liability relating to the data security incidents of $15.6 million and$2.9 million, respectively. The Company’s estimated probable losses related to the claims made by thepayment card networks in connection with the data security incidents are based on currently availableinformation. The Company disputes the validity of these claims and intends to contest them. Estimatesrelated to these claims may change as new information becomes available or circumstances change.
The Company expects to incur additional costs and expenses related to the data security incidents in thefuture. These costs may result from potential additional liabilities to payment card networks, governmentalor third party investigations, proceedings or litigation and legal and other fees necessary to defend againstany potential liabilities or claims, and further investigatory and remediation costs. As of September 30,2016, the scope of these additional costs, or a range thereof, cannot be reasonably estimated and, while wedo not anticipate these additional costs or liabilities would have a material adverse impact on our business,financial condition and operating results, these additional costs could be significant.
The Company provides healthcare benefits to most of its full-time employees. The Company is largelyself-funded for the cost of the healthcare plan (including healthcare claims) primarily in the U.S., otherthan certain fees and out-of-pocket expenses paid by the employees. In addition, the Company retains asubstantial portion of the risk related to certain workers’ compensation, general liability, and automobileand property insurance. The Company records an estimated liability for the ultimate cost of claimsincurred and unpaid as of the balance sheet date. The estimated liability is included in accrued liabilities(current portion) and other liabilities (long-term portion) in our consolidated balance sheets. TheCompany carries insurance coverage in such amounts in excess of its self-insured retention whichmanagement believes to be reasonable.
Liabilities for loss contingencies, arising from claims, assessments, litigation, fines, penalties, the datasecurity incidents and other sources are recorded when it is probable that a liability has been incurred andthe amount of the assessment can be reasonably estimated. The Company has no significant liabilities forloss contingencies at September 30, 2016 and 2015, except as disclosed above.
F-27
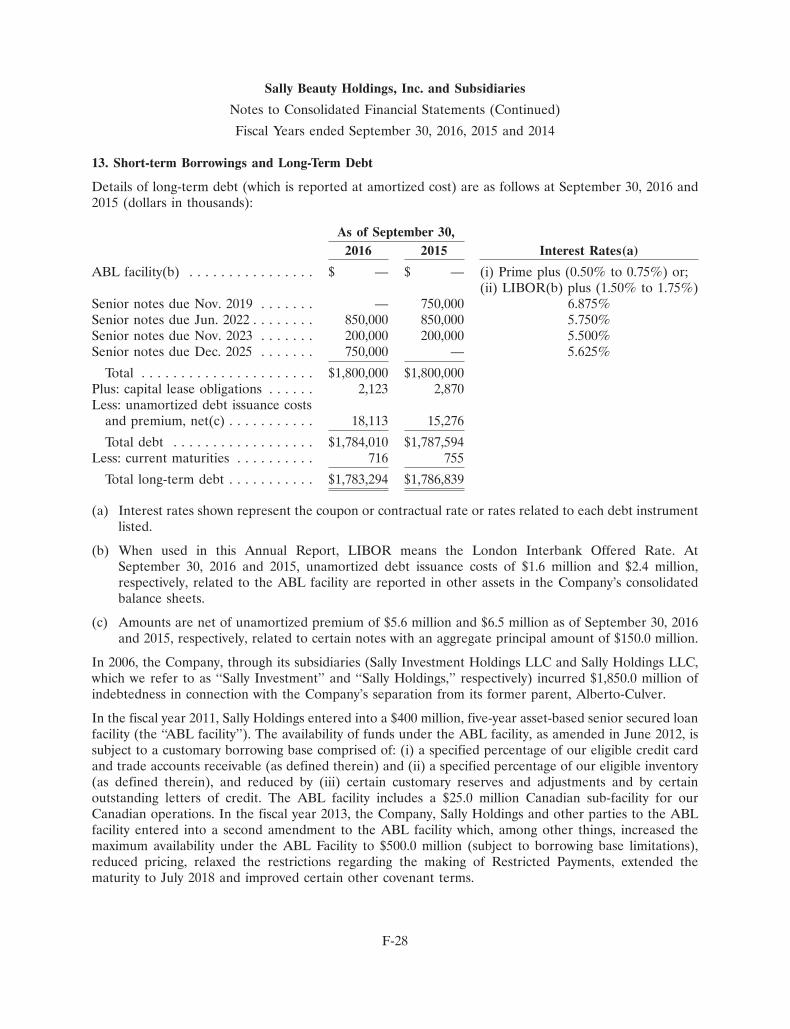
Sally Beauty Holdings, Inc. and Subsidiaries
Notes to Consolidated Financial Statements (Continued)
Fiscal Years ended September 30, 2016, 2015 and 2014
13. Short-term Borrowings and Long-Term Debt
Details of long-term debt (which is reported at amortized cost) are as follows at September 30, 2016 and2015 (dollars in thousands):
As of September 30,2016 2015 Interest Rates(a)
ABL facility(b) . . . . . . . . . . . . . . . . $ — $ — (i) Prime plus (0.50% to 0.75%) or;(ii) LIBOR(b) plus (1.50% to 1.75%)
Senior notes due Nov. 2019 . . . . . . . — 750,000 6.875%Senior notes due Jun. 2022 . . . . . . . . 850,000 850,000 5.750%Senior notes due Nov. 2023 . . . . . . . 200,000 200,000 5.500%Senior notes due Dec. 2025 . . . . . . . 750,000 — 5.625%
Total . . . . . . . . . . . . . . . . . . . . . . $1,800,000 $1,800,000Plus: capital lease obligations . . . . . . 2,123 2,870Less: unamortized debt issuance costs
and premium, net(c) . . . . . . . . . . . 18,113 15,276
Total debt . . . . . . . . . . . . . . . . . . $1,784,010 $1,787,594Less: current maturities . . . . . . . . . . 716 755
Total long-term debt . . . . . . . . . . . $1,783,294 $1,786,839
(a) Interest rates shown represent the coupon or contractual rate or rates related to each debt instrumentlisted.
(b) When used in this Annual Report, LIBOR means the London Interbank Offered Rate. AtSeptember 30, 2016 and 2015, unamortized debt issuance costs of $1.6 million and $2.4 million,respectively, related to the ABL facility are reported in other assets in the Company’s consolidatedbalance sheets.
(c) Amounts are net of unamortized premium of $5.6 million and $6.5 million as of September 30, 2016and 2015, respectively, related to certain notes with an aggregate principal amount of $150.0 million.
In 2006, the Company, through its subsidiaries (Sally Investment Holdings LLC and Sally Holdings LLC,which we refer to as ‘‘Sally Investment’’ and ‘‘Sally Holdings,’’ respectively) incurred $1,850.0 million ofindebtedness in connection with the Company’s separation from its former parent, Alberto-Culver.
In the fiscal year 2011, Sally Holdings entered into a $400 million, five-year asset-based senior secured loanfacility (the ‘‘ABL facility’’). The availability of funds under the ABL facility, as amended in June 2012, issubject to a customary borrowing base comprised of: (i) a specified percentage of our eligible credit cardand trade accounts receivable (as defined therein) and (ii) a specified percentage of our eligible inventory(as defined therein), and reduced by (iii) certain customary reserves and adjustments and by certainoutstanding letters of credit. The ABL facility includes a $25.0 million Canadian sub-facility for ourCanadian operations. In the fiscal year 2013, the Company, Sally Holdings and other parties to the ABLfacility entered into a second amendment to the ABL facility which, among other things, increased themaximum availability under the ABL Facility to $500.0 million (subject to borrowing base limitations),reduced pricing, relaxed the restrictions regarding the making of Restricted Payments, extended thematurity to July 2018 and improved certain other covenant terms.
F-28
Sally Beauty Holdings, Inc. and Subsidiaries
Notes to Consolidated Financial Statements (Continued)
Fiscal Years ended September 30, 2016, 2015 and 2014
At September 30, 2016, there were no borrowings outstanding under the ABL facility and the Companyhad $478.4 million available for borrowing under the ABL facility, including the Canadian sub-facility.Borrowings under the ABL facility are secured by the accounts, inventory and credit card receivables (andrelated general intangibles and other property) of our domestic subsidiaries (and, in the case of borrowingsunder the Canadian sub-facility, such assets of our Canadian subsidiaries and, solely with respect toborrowings by SBH Finance B.V., intercompany notes owed to SBH Finance B.V. by our foreignsubsidiaries). In addition, the terms of the ABL facility contain a commitment fee of 0.25% on the unusedportion of the facility.
In the fiscal year 2012, Sally Holdings and Sally Capital Inc. (collectively, the ‘‘Issuers’’), both indirectlywholly-owned subsidiaries of the Company, issued $750.0 million aggregate principal amount of their6.875% Senior Notes due 2019 (the ‘‘senior notes due 2019’’) and $850.0 million aggregate principalamount of their 5.75% Senior Notes due 2022 (the ‘‘senior notes due 2022’’), including $150.0 million ofthe aggregate principal amount of the senior notes due 2022 issued at par plus a premium. Such premiumis being amortized over the term of the notes using the effective interest method. The net proceeds fromthese debt issuances were used to retire outstanding indebtedness in the aggregate principal amount ofapproximately $1,391.9 million (substantially all of which was incurred in 2006 in connection with ourseparation from Alberto-Culver) and for general corporate purposes. In December 2015, the Companyredeemed in full the senior notes due 2019 at a redemption premium equal to 103.438% primarily with thenet proceeds from the issuance of the 5.625% Senior Notes due 2025 (the ‘‘senior notes due 2025’’), asfurther discussed below.
In the fiscal year 2014, the Issuers issued $200.0 million aggregate principal amount of their 5.5% SeniorNotes due 2023 (the ‘‘senior notes due 2023’’) at par. The Company used the net proceeds from this debtissuance, approximately $196.3 million, to repay borrowings outstanding under the ABL facility of$88.5 million (which borrowings were primarily used to fund share repurchases) and for general corporatepurposes, including share repurchases.
On December 3, 2015, the Issuers issued $750.0 million aggregate principal amount of their senior notesdue 2025 at par. The Company used the net proceeds from this debt issuance (approximately$737.3 million) as well as cash from operations and borrowings under the ABL facility, to redeem in fullthe senior notes due 2019 at a total redemption cost of $775.8 million, including the redemption premiumbut excluding accrued interest paid upon redemption of such notes. In connection with our redemption ofthe senior notes due 2019, we recorded a loss on extinguishment of debt in the amount of approximately$33.3 million, including a redemption premium in the amount of approximately $25.8 million andunamortized deferred financing costs of approximately $7.5 million. In connection with the issuance of thesenior notes due 2025, the Company incurred and capitalized financing costs of approximately$12.7 million. This amount is reported as a deduction from the senior notes due 2025 on the Company’sconsolidated balance sheets and is being amortized over the term of the senior notes due 2025 using theeffective interest method.
The senior notes due 2022, the senior notes due 2023 and the senior notes due 2025, which we refer tocollectively as ‘‘the Notes’’ or ‘‘the senior notes due 2022, 2023 and 2025,’’ are unsecured obligations of theIssuers and are jointly and severally guaranteed by the Company and Sally Investment, and by eachmaterial domestic subsidiary of the Company. Interest on the senior notes due 2022, 2023 and 2025 ispayable semi-annually, during the Company’s first and third fiscal quarters. Please see Note 19 for certaincondensed financial statement data pertaining to Sally Beauty, the Issuers, the guarantor subsidiaries andthe non-guarantor subsidiaries.
F-29
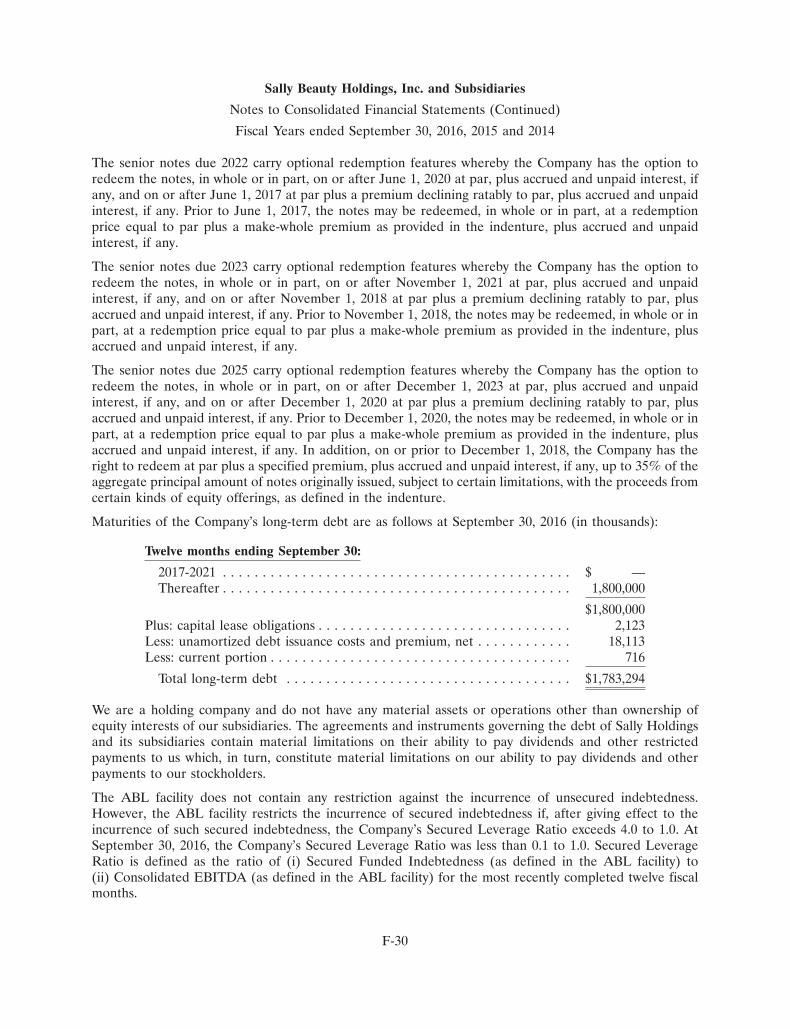
Sally Beauty Holdings, Inc. and Subsidiaries
Notes to Consolidated Financial Statements (Continued)
Fiscal Years ended September 30, 2016, 2015 and 2014
The senior notes due 2022 carry optional redemption features whereby the Company has the option toredeem the notes, in whole or in part, on or after June 1, 2020 at par, plus accrued and unpaid interest, ifany, and on or after June 1, 2017 at par plus a premium declining ratably to par, plus accrued and unpaidinterest, if any. Prior to June 1, 2017, the notes may be redeemed, in whole or in part, at a redemptionprice equal to par plus a make-whole premium as provided in the indenture, plus accrued and unpaidinterest, if any.
The senior notes due 2023 carry optional redemption features whereby the Company has the option toredeem the notes, in whole or in part, on or after November 1, 2021 at par, plus accrued and unpaidinterest, if any, and on or after November 1, 2018 at par plus a premium declining ratably to par, plusaccrued and unpaid interest, if any. Prior to November 1, 2018, the notes may be redeemed, in whole or inpart, at a redemption price equal to par plus a make-whole premium as provided in the indenture, plusaccrued and unpaid interest, if any.
The senior notes due 2025 carry optional redemption features whereby the Company has the option toredeem the notes, in whole or in part, on or after December 1, 2023 at par, plus accrued and unpaidinterest, if any, and on or after December 1, 2020 at par plus a premium declining ratably to par, plusaccrued and unpaid interest, if any. Prior to December 1, 2020, the notes may be redeemed, in whole or inpart, at a redemption price equal to par plus a make-whole premium as provided in the indenture, plusaccrued and unpaid interest, if any. In addition, on or prior to December 1, 2018, the Company has theright to redeem at par plus a specified premium, plus accrued and unpaid interest, if any, up to 35% of theaggregate principal amount of notes originally issued, subject to certain limitations, with the proceeds fromcertain kinds of equity offerings, as defined in the indenture.
Maturities of the Company’s long-term debt are as follows at September 30, 2016 (in thousands):
Twelve months ending September 30:
2017-2021 . . . . . . . . . . . . . . . . . . . . . . . . . . . . . . . . . . . . . . . . . . . . $ —Thereafter . . . . . . . . . . . . . . . . . . . . . . . . . . . . . . . . . . . . . . . . . . . . 1,800,000
$1,800,000Plus: capital lease obligations . . . . . . . . . . . . . . . . . . . . . . . . . . . . . . . . 2,123Less: unamortized debt issuance costs and premium, net . . . . . . . . . . . . 18,113Less: current portion . . . . . . . . . . . . . . . . . . . . . . . . . . . . . . . . . . . . . . 716
Total long-term debt . . . . . . . . . . . . . . . . . . . . . . . . . . . . . . . . . . . . $1,783,294
We are a holding company and do not have any material assets or operations other than ownership ofequity interests of our subsidiaries. The agreements and instruments governing the debt of Sally Holdingsand its subsidiaries contain material limitations on their ability to pay dividends and other restrictedpayments to us which, in turn, constitute material limitations on our ability to pay dividends and otherpayments to our stockholders.
The ABL facility does not contain any restriction against the incurrence of unsecured indebtedness.However, the ABL facility restricts the incurrence of secured indebtedness if, after giving effect to theincurrence of such secured indebtedness, the Company’s Secured Leverage Ratio exceeds 4.0 to 1.0. AtSeptember 30, 2016, the Company’s Secured Leverage Ratio was less than 0.1 to 1.0. Secured LeverageRatio is defined as the ratio of (i) Secured Funded Indebtedness (as defined in the ABL facility) to(ii) Consolidated EBITDA (as defined in the ABL facility) for the most recently completed twelve fiscalmonths.
F-30
Sally Beauty Holdings, Inc. and Subsidiaries
Notes to Consolidated Financial Statements (Continued)
Fiscal Years ended September 30, 2016, 2015 and 2014
The ABL facility is pre-payable, and the commitments thereunder may be terminated, in whole or in partat any time without penalty or premium.
The indentures governing the senior notes due 2022, 2023 and 2025 contain terms which restrict the abilityof Sally Beauty’s subsidiaries to incur additional indebtedness. However, in addition to certain othermaterial exceptions, the Company may incur additional indebtedness under the indentures if itsConsolidated Coverage Ratio, after giving pro forma effect to the incurrence of such indebtedness, exceeds2.0 to 1.0 (‘‘Incurrence Test’’). At September 30, 2016, the Company’s Consolidated Coverage Ratio wasapproximately 6.1 to 1.0. Consolidated Coverage Ratio is defined as the ratio of (i) Consolidated EBITDA(as defined in the indentures) for the period containing the most recent four consecutive fiscal quarters, to(ii) Consolidated Interest Expense (as defined in the indentures) for such period.
The indentures governing the senior notes due 2022, 2023 and 2025 restrict Sally Holdings and itssubsidiaries from making certain dividends and distributions to equity holders and certain other restrictedpayments (hereafter, a ‘‘Restricted Payment’’ or ‘‘Restricted Payments’’) to us. However, the indenturespermit the making of such Restricted Payments if, at the time of the making of such Restricted Payment,the Company satisfies the Incurrence Test as described above and the cumulative amount of all RestrictedPayments made since the issue date of the applicable senior notes does not exceed the sum of: (i) 50% ofSally Holdings’ and its subsidiaries’ cumulative consolidated net earnings since July 1, 2006 (for the seniornotes due 2022 and the senior notes due 2023) or since October 1, 2015 (for the senior notes due 2025),plus (ii) the proceeds from the issuance of certain equity securities or conversions of indebtedness toequity, in each case, since the issue date of the applicable senior notes plus (iii) the net reduction ininvestments in unrestricted subsidiaries since the issue date of the applicable senior notes plus (iv) thereturn of capital with respect to any sales or dispositions of certain minority investments since the issuedate of the applicable senior notes plus (v) $350 million (for the senior notes due 2025). Further, inaddition to certain other baskets, the indentures permit the Company to make additional RestrictedPayments in an unlimited amount if, after giving pro forma effect to the incurrence of any indebtedness tomake such Restricted Payment, the Company’s Consolidated Total Leverage Ratio (as defined in theindentures) is less than 3.25 to 1.00. At September 30, 2016, the Company’s Consolidated Total LeverageRatio was approximately 2.7 to 1.0. Consolidated Total Leverage Ratio is defined as the ratio of(i) Consolidated Total Indebtedness (as defined in the indentures) minus cash and cash equivalentson-hand up to $100.0 million, in each case, as of the end of the most recently-ended fiscal quarter to(ii) Consolidated EBITDA (as defined in the indentures) for the period containing the most recent fourconsecutive fiscal quarters.
The ABL facility also restricts the making of Restricted Payments. More specifically, under the ABLfacility, Sally Holdings may make Restricted Payments if availability under the ABL facility equals orexceeds certain thresholds, and no default then exists under the facility. For Restricted Payments up to$30.0 million during each fiscal year, borrowing availability must equal or exceed the lesser of $75.0 millionor 15% of the borrowing base for 45 days prior to such Restricted Payment. For Restricted Payments inexcess of that amount, borrowing availability must equal or exceed the lesser of $100.0 million or 20% ofthe borrowing base for 45 days prior to such Restricted Payment and the Consolidated Fixed ChargeCoverage Ratio (as defined below) must equal or exceed 1.1 to 1.0. Further, if borrowing availability equalsor exceeds the lesser of $150.0 million or 30% of the borrowing base, Restricted Payments are not limitedby the Consolidated Fixed Charge Coverage Ratio test. The Consolidated Fixed Charge Coverage Ratio isdefined as the ratio of (i) Consolidated EBITDA (as defined in the ABL facility) during the trailing twelve-month period preceding such proposed Restricted Payment minus certain unfinanced capital expendituresmade during such period and income tax payments paid in cash during such period to (ii) fixed charges (as
F-31
Sally Beauty Holdings, Inc. and Subsidiaries
Notes to Consolidated Financial Statements (Continued)
Fiscal Years ended September 30, 2016, 2015 and 2014
defined in the ABL facility). In addition, during any period that borrowing availability under the ABLfacility is less than the greater of $40.0 million or 10% of the borrowing base, the level of the ConsolidatedFixed Charge Coverage Ratio that the Company must satisfy is 1.0 to 1.0. As of September 30, 2016, theConsolidated Fixed Charge Coverage Ratio was approximately 3.1 to 1.0.
When used in this Annual Report, the phrase ‘‘Consolidated EBITDA’’ is intended to have the meaningascribed to such phrase in the ABL facility or the indentures governing the senior notes due 2022, 2023 and2025, as appropriate. EBITDA is not a recognized measurement under GAAP and should not beconsidered a substitute for financial performance and liquidity measures determined in accordance withGAAP, such as net earnings, operating earnings and operating cash flows.
The ABL facility and the indentures governing the senior notes due 2022, 2023 and 2025 contain othercovenants regarding restrictions on the disposition of assets, the granting of liens and security interests, theprepayment of certain indebtedness, and other matters and customary events of default, includingcustomary cross-default and/or cross-acceleration provisions. As of September 30, 2016, all the net assetsof our consolidated subsidiaries were unrestricted from transfer under our credit arrangements.
At September 30, 2016 and 2015, the Company had no off-balance sheet financing arrangements otherthan obligations under operating leases, as disclosed in Note 12, and letters of credit (related to inventorypurchases and self-insurance programs) in the aggregate amount of $21.6 million and $23.1 million,respectively.
14. Derivative Instruments and Hedging Activities
Risk Management Objectives of Using Derivative Instruments
The Company is exposed to a wide variety of risks, including risks arising from changing economicconditions. The Company manages its exposure to certain economic risks (including liquidity, credit risk,and changes in foreign currency exchange rates and in interest rates) primarily: (a) by closely managing itscash flows from operating and investing activities and the amounts and sources of its debt obligations;(b) by assessing periodically the creditworthiness of its business partners; and (c) through the use ofderivative instruments from time to time (including, foreign exchange contracts and interest rate swaps) bySally Holdings and its subsidiaries.
The Company from time to time uses foreign exchange contracts (including foreign currency forwards andoptions), as part of its overall economic risk management strategy, to fix the amount of certain foreignassets and obligations relative to its functional and reporting currency (the U.S. dollar) or relative to thefunctional currency of certain of its consolidated subsidiaries, or to add stability to cash flows resultingfrom its net investments (including intercompany notes not permanently invested) and earningsdenominated in foreign currencies. The Company’s foreign currency exposures at times offset each other,sometimes providing a natural hedge against its foreign currency risk. In connection with the remainingforeign currency risk, the Company uses foreign exchange contracts to effectively fix the foreign currencyexchange rate applicable to specific anticipated foreign currency-denominated cash flows thus limiting thepotential fluctuations in such cash flows as a result of foreign currency market movements.
The Company from time to time has used interest rate swaps, as part of its overall economic riskmanagement strategy, to add stability to the interest payments due in connection with its debt obligations.At September 30, 2016, our exposure to interest rate fluctuations relates to interest payments under theABL facility, if any, and the Company held no derivatives instruments in connection therewith.
F-32
Sally Beauty Holdings, Inc. and Subsidiaries
Notes to Consolidated Financial Statements (Continued)
Fiscal Years ended September 30, 2016, 2015 and 2014
As of September 30, 2016, the Company did not purchase or hold any derivative instruments for trading orspeculative purposes.
Designated Cash Flow Hedges
The Company may use from time to time derivative instruments designated as hedges to manage itsexposure to interest rate or foreign currency exchange rate movements, as appropriate. However, atSeptember 30, 2016, the Company did not purchase or hold any such derivatives.
Non-designated Cash Flow Hedges
The Company may use from time to time derivative instruments (such as foreign exchange contracts andinterest rate swaps) not designated as hedges or that do not meet the requirements for hedge accounting,to manage its exposure to foreign currency exchange rate or interest rate movements, as appropriate.
The Company uses foreign exchange contracts to manage the exposure to the U.S. dollar resulting fromcertain of its Sinelco Group subsidiaries’ purchases of merchandise from third-party suppliers. Sinelco’sfunctional currency is the Euro. As such, at September 30, 2016, we hold foreign currency forwards whichenable us to sell approximately A16.0 million ($18.0 million, at the September 30, 2016 exchange rate) atthe weighted average contractual exchange rate of 1.1219. The foreign currency forwards discussed in thisparagraph are with a single counterparty and expire ratably through September 15, 2017.
The Company also uses foreign exchange contracts to mitigate its exposure to changes in foreign currencyexchange rates in connection with certain intercompany balances not permanently invested. As such, atSeptember 30, 2016, we hold: (a) a foreign currency forward which enables us to sell approximatelyA22.4 million ($25.1 million, at the September 30, 2016 exchange rate) at the contractual exchange rate of1.1267, (b) a foreign currency forward which enables us to sell approximately $4.1 million Canadian dollars($3.1 million, at the September 30, 2016 exchange rate) at the contractual exchange rate of 1.3121,(c) foreign currency forwards which enable us to buy approximately $15.5 million Canadian dollars($11.8 million, at the September 30, 2016 exchange rate) at the weighted average contractual exchange rateof 1.3078, (d) a foreign currency forward which enables us to sell approximately 17.9 million Mexican pesos($0.9 million, at the September 30, 2016 exchange rate) at the contractual exchange rate of 19.4605 and(e) a foreign currency forward which enables us to buy approximately £7.2 million ($9.3 million, at theSeptember 30, 2016 exchange rate) at the contractual exchange rate of 1.3030. All the foreign currencyforwards discussed in this paragraph are with a single counterparty (not the same counterparty as that onthe forwards discussed in the preceding paragraph) and expire on or before December 30, 2016.
The Company’s foreign exchange contracts are not designated as hedges and do not currently meet therequirements for hedge accounting. Accordingly, the changes in the fair value (i.e., marked-to-marketadjustments) of these derivative instruments, which are adjusted quarterly, are recorded in selling, generaland administrative expenses in our consolidated statements of earnings. Selling, general and administrativeexpenses reflect a net loss of $1.1 million in the fiscal year ended September 30, 2016, and net gains of$2.7 million and $1.9 million in the fiscal years ended September 30, 2015 and 2014, respectively, inconnection with all of the Company’s foreign currency derivative instruments, including marked-to-marketadjustments.
F-33
Sally Beauty Holdings, Inc. and Subsidiaries
Notes to Consolidated Financial Statements (Continued)
Fiscal Years ended September 30, 2016, 2015 and 2014
The table below presents the fair value of the Company’s derivative financial instruments as well as theirclassification on the Company’s consolidated balance sheets as of September 30, 2016 and 2015 (inthousands):
Asset Derivatives Liability DerivativesAs of As of
September 30, September 30,Classification 2016 2015 Classification 2016 2015
Derivatives designated ashedging instruments:None . . . . . . . . . . . . . . . .
Derivatives not designated ashedging instruments:Foreign Exchange Contracts Other current assets $— $322 Accrued liabilities $272 $58
$— $322 $272 $58
The table below presents the effect of the Company’s derivative financial instruments on the Company’sconsolidated statements of earnings for the fiscal years ended September 30, 2016, 2015 and 2014 (inthousands):
Amount of GainAmount of Gain or (Loss)
or (Loss) ReclassifiedRecognized in from
OCI on AccumulatedDerivative OCI into(Effective Income
Portion), net of (EffectiveDerivatives Designated as Hedging Instruments tax Portion)
None . . . . . . . . . . . . . . . . . . . . . . . . . . . . . . . . . . . . . . . . . . . . . . .
Amount of Gain or(Loss) Recognized in
Income onDerivatives
Fiscal Year EndedSeptember 30,Derivatives Not Designated as Classification of Gain or (Loss)
Hedging Instruments Recognized in Income 2016 2015 2014
Foreign Exchange Contracts . . . . . . Selling, general and administrative expenses $(1,051) $2,731 $1,935
Total derivatives not designated ashedging instruments . . . . . . . . . . . . $(1,051) $2,731 $1,935
Credit-risk-related Contingent Features
At September 30, 2016, the aggregate fair value of all foreign exchange contracts held which consisted ofderivative instruments in a liability position was approximately 0.3 million. The Company was under noobligation to post and had not posted any collateral related to the derivative instruments in a liabilityposition.
F-34
Sally Beauty Holdings, Inc. and Subsidiaries
Notes to Consolidated Financial Statements (Continued)
Fiscal Years ended September 30, 2016, 2015 and 2014
The counterparties to our derivative instruments are deemed by the Company to be of substantialresources and strong creditworthiness. However, these transactions result in exposure to credit risk in theevent of default by a counterparty. For example, the financial crisis that has affected the global bankingsystems and certain financial markets in recent years has resulted in many well-known financial institutionsbecoming less creditworthy or having diminished liquidity which could expose us to an increased level ofcounterparty credit risk. In the event that a counterparty defaults in its obligation under our derivativeinstruments, we could incur substantial financial losses. However, at the present time, no such losses aredeemed probable.
15. 401(k) and Profit Sharing Plan
The Company sponsors the Sally Beauty 401(k) and Profit Sharing Plan (the ‘‘401k Plan’’), which is aqualified defined contribution plan. The 401k Plan covers employees of the Company who meet certaineligibility requirements and who are not members of a collective bargaining unit. Under the terms of the401k Plan, employees may contribute a percentage of their annual compensation to the 401k Plan up tocertain maximums, as defined by the 401k Plan and by the U.S. Internal Revenue Code. The Companycurrently matches a portion of employee contributions to the plan. The Company recognized expense of$7.1 million, $6.8 million and $6.4 million in the fiscal years ended September 30, 2016, 2015 and 2014,respectively, related to such employer matching contributions and these amounts are included in selling,general and administrative expenses in our consolidated statements of earnings.
In addition, pursuant to the 401k Plan, the Company may make profit sharing contributions to theaccounts of employees who meet certain eligibility requirements and who are not members of a collectivebargaining unit. The Company’s profit sharing contributions to the 401k Plan are determined by theCompensation Committee of the Board. The Company recognized expense of $2.6 million, $3.3 millionand $3.2 million in the fiscal years ended September 30, 2016, 2015 and 2014, respectively, related to suchprofit sharing contributions and these amounts are included in selling, general and administrative expensesin our consolidated statements of earnings.
F-35
Sally Beauty Holdings, Inc. and Subsidiaries
Notes to Consolidated Financial Statements (Continued)
Fiscal Years ended September 30, 2016, 2015 and 2014
16. Income Taxes
The provision for income taxes for the fiscal years 2016, 2015 and 2014 consists of the following (inthousands):
Fiscal Year EndedSeptember 30,
2016 2015 2014
Current:Federal . . . . . . . . . . . . . . . . . . . . . . . . . . . . . . . $ 87,088 $113,023 $121,418Foreign . . . . . . . . . . . . . . . . . . . . . . . . . . . . . . . 8,795 9,531 9,414State . . . . . . . . . . . . . . . . . . . . . . . . . . . . . . . . 13,816 13,686 14,637
Total current portion . . . . . . . . . . . . . . . . . . . 109,699 136,240 145,469
Deferred:Federal . . . . . . . . . . . . . . . . . . . . . . . . . . . . . . . 20,915 7,963 (335)Foreign . . . . . . . . . . . . . . . . . . . . . . . . . . . . . . . (932) (1,461) (895)State . . . . . . . . . . . . . . . . . . . . . . . . . . . . . . . . 1,436 655 447
Total deferred portion . . . . . . . . . . . . . . . . . . 21,419 7,157 (783)
Total provision for income taxes . . . . . . . . . . . $131,118 $143,397 $144,686
The difference between the U.S. statutory federal income tax rate and the effective income tax rate issummarized below:
Fiscal Year EndedSeptember 30,
2016 2015 2014
Statutory tax rate . . . . . . . . . . . . . . . . . . . . . . . . . . . . . . . . . . 35.0% 35.0% 35.0%State income taxes, net of federal tax benefit . . . . . . . . . . . . . . 2.9 2.7 2.7Effect of foreign operations . . . . . . . . . . . . . . . . . . . . . . . . . . (0.4) (0.1) (0.5)Other, net . . . . . . . . . . . . . . . . . . . . . . . . . . . . . . . . . . . . . . . (0.5) 0.3 (0.2)
Effective tax rate . . . . . . . . . . . . . . . . . . . . . . . . . . . . . . . . 37.0% 37.9% 37.0%
F-36
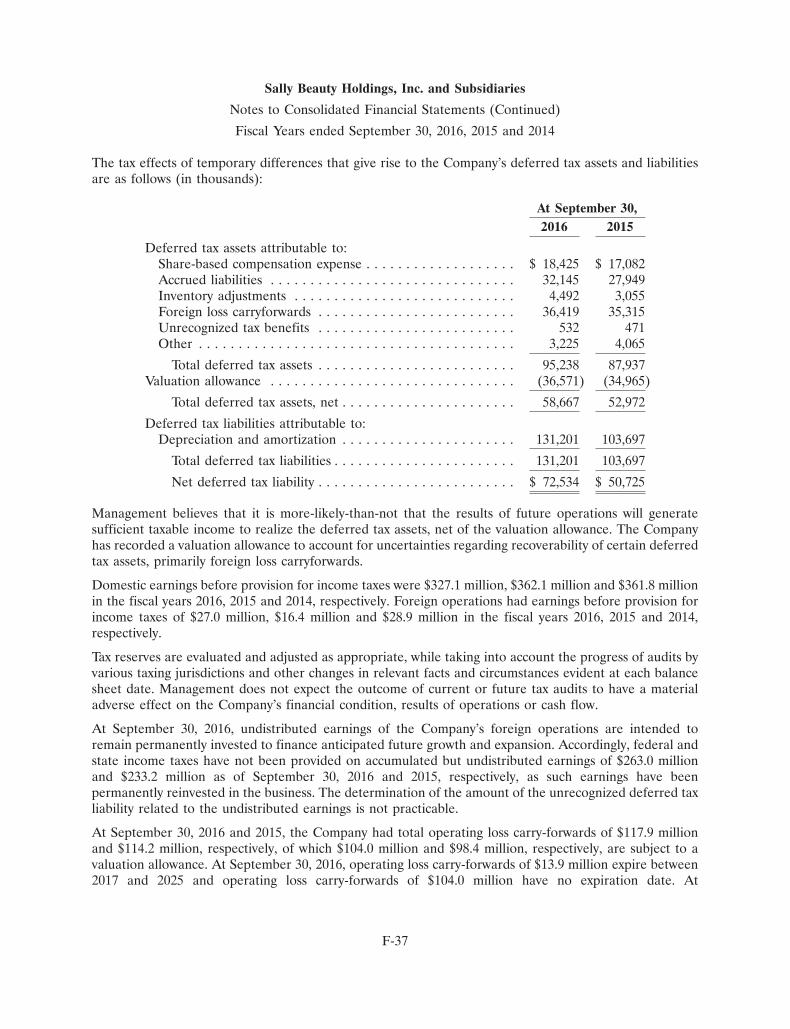
Sally Beauty Holdings, Inc. and Subsidiaries
Notes to Consolidated Financial Statements (Continued)
Fiscal Years ended September 30, 2016, 2015 and 2014
The tax effects of temporary differences that give rise to the Company’s deferred tax assets and liabilitiesare as follows (in thousands):
At September 30,2016 2015
Deferred tax assets attributable to:Share-based compensation expense . . . . . . . . . . . . . . . . . . . $ 18,425 $ 17,082Accrued liabilities . . . . . . . . . . . . . . . . . . . . . . . . . . . . . . . 32,145 27,949Inventory adjustments . . . . . . . . . . . . . . . . . . . . . . . . . . . . 4,492 3,055Foreign loss carryforwards . . . . . . . . . . . . . . . . . . . . . . . . . 36,419 35,315Unrecognized tax benefits . . . . . . . . . . . . . . . . . . . . . . . . . 532 471Other . . . . . . . . . . . . . . . . . . . . . . . . . . . . . . . . . . . . . . . . 3,225 4,065
Total deferred tax assets . . . . . . . . . . . . . . . . . . . . . . . . . 95,238 87,937Valuation allowance . . . . . . . . . . . . . . . . . . . . . . . . . . . . . . . (36,571) (34,965)
Total deferred tax assets, net . . . . . . . . . . . . . . . . . . . . . . 58,667 52,972
Deferred tax liabilities attributable to:Depreciation and amortization . . . . . . . . . . . . . . . . . . . . . . 131,201 103,697
Total deferred tax liabilities . . . . . . . . . . . . . . . . . . . . . . . 131,201 103,697
Net deferred tax liability . . . . . . . . . . . . . . . . . . . . . . . . . $ 72,534 $ 50,725
Management believes that it is more-likely-than-not that the results of future operations will generatesufficient taxable income to realize the deferred tax assets, net of the valuation allowance. The Companyhas recorded a valuation allowance to account for uncertainties regarding recoverability of certain deferredtax assets, primarily foreign loss carryforwards.
Domestic earnings before provision for income taxes were $327.1 million, $362.1 million and $361.8 millionin the fiscal years 2016, 2015 and 2014, respectively. Foreign operations had earnings before provision forincome taxes of $27.0 million, $16.4 million and $28.9 million in the fiscal years 2016, 2015 and 2014,respectively.
Tax reserves are evaluated and adjusted as appropriate, while taking into account the progress of audits byvarious taxing jurisdictions and other changes in relevant facts and circumstances evident at each balancesheet date. Management does not expect the outcome of current or future tax audits to have a materialadverse effect on the Company’s financial condition, results of operations or cash flow.
At September 30, 2016, undistributed earnings of the Company’s foreign operations are intended toremain permanently invested to finance anticipated future growth and expansion. Accordingly, federal andstate income taxes have not been provided on accumulated but undistributed earnings of $263.0 millionand $233.2 million as of September 30, 2016 and 2015, respectively, as such earnings have beenpermanently reinvested in the business. The determination of the amount of the unrecognized deferred taxliability related to the undistributed earnings is not practicable.
At September 30, 2016 and 2015, the Company had total operating loss carry-forwards of $117.9 millionand $114.2 million, respectively, of which $104.0 million and $98.4 million, respectively, are subject to avaluation allowance. At September 30, 2016, operating loss carry-forwards of $13.9 million expire between2017 and 2025 and operating loss carry-forwards of $104.0 million have no expiration date. At
F-37
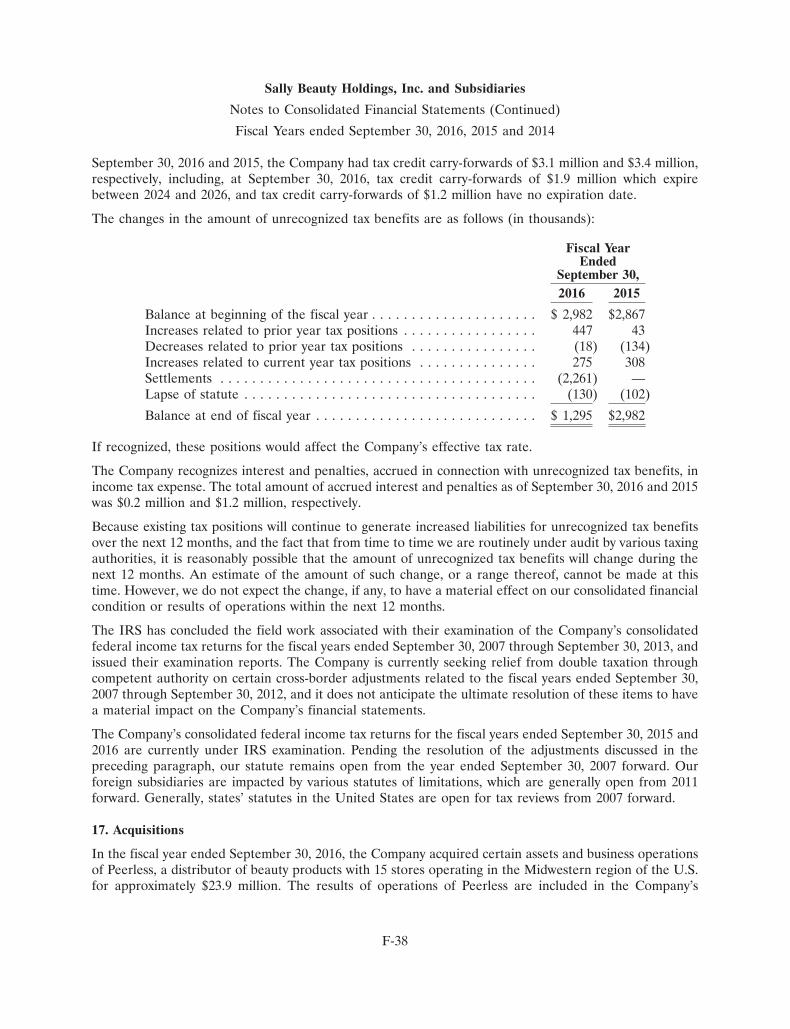
Sally Beauty Holdings, Inc. and Subsidiaries
Notes to Consolidated Financial Statements (Continued)
Fiscal Years ended September 30, 2016, 2015 and 2014
September 30, 2016 and 2015, the Company had tax credit carry-forwards of $3.1 million and $3.4 million,respectively, including, at September 30, 2016, tax credit carry-forwards of $1.9 million which expirebetween 2024 and 2026, and tax credit carry-forwards of $1.2 million have no expiration date.
The changes in the amount of unrecognized tax benefits are as follows (in thousands):
Fiscal YearEnded
September 30,2016 2015
Balance at beginning of the fiscal year . . . . . . . . . . . . . . . . . . . . . $ 2,982 $2,867Increases related to prior year tax positions . . . . . . . . . . . . . . . . . 447 43Decreases related to prior year tax positions . . . . . . . . . . . . . . . . (18) (134)Increases related to current year tax positions . . . . . . . . . . . . . . . 275 308Settlements . . . . . . . . . . . . . . . . . . . . . . . . . . . . . . . . . . . . . . . . (2,261) —Lapse of statute . . . . . . . . . . . . . . . . . . . . . . . . . . . . . . . . . . . . . (130) (102)
Balance at end of fiscal year . . . . . . . . . . . . . . . . . . . . . . . . . . . . $ 1,295 $2,982
If recognized, these positions would affect the Company’s effective tax rate.
The Company recognizes interest and penalties, accrued in connection with unrecognized tax benefits, inincome tax expense. The total amount of accrued interest and penalties as of September 30, 2016 and 2015was $0.2 million and $1.2 million, respectively.
Because existing tax positions will continue to generate increased liabilities for unrecognized tax benefitsover the next 12 months, and the fact that from time to time we are routinely under audit by various taxingauthorities, it is reasonably possible that the amount of unrecognized tax benefits will change during thenext 12 months. An estimate of the amount of such change, or a range thereof, cannot be made at thistime. However, we do not expect the change, if any, to have a material effect on our consolidated financialcondition or results of operations within the next 12 months.
The IRS has concluded the field work associated with their examination of the Company’s consolidatedfederal income tax returns for the fiscal years ended September 30, 2007 through September 30, 2013, andissued their examination reports. The Company is currently seeking relief from double taxation throughcompetent authority on certain cross-border adjustments related to the fiscal years ended September 30,2007 through September 30, 2012, and it does not anticipate the ultimate resolution of these items to havea material impact on the Company’s financial statements.
The Company’s consolidated federal income tax returns for the fiscal years ended September 30, 2015 and2016 are currently under IRS examination. Pending the resolution of the adjustments discussed in thepreceding paragraph, our statute remains open from the year ended September 30, 2007 forward. Ourforeign subsidiaries are impacted by various statutes of limitations, which are generally open from 2011forward. Generally, states’ statutes in the United States are open for tax reviews from 2007 forward.
17. Acquisitions
In the fiscal year ended September 30, 2016, the Company acquired certain assets and business operationsof Peerless, a distributor of beauty products with 15 stores operating in the Midwestern region of the U.S.for approximately $23.9 million. The results of operations of Peerless are included in the Company’s
F-38
Sally Beauty Holdings, Inc. and Subsidiaries
Notes to Consolidated Financial Statements (Continued)
Fiscal Years ended September 30, 2016, 2015 and 2014
consolidated financial statements subsequent to the acquisition date. The Company recorded intangibleassets subject to amortization of $7.8 million and goodwill of $13.1 million (which is expected to bedeductible for tax purposes) in connection with this acquisition.
In addition, we completed several other individually immaterial acquisitions during the fiscal years 2016,2015 and 2014 at the aggregate cost of approximately $2.3 million, $7.1 million and $4.9 million,respectively, and recorded intangible assets subject to amortization of $2.3 million, $2.2 million and$1.4 million in connection with these acquisitions. Further, we recorded goodwill in the amount of$2.8 million and $2.6 million, the majority of which is expected to be deductible for tax purposes, inconnection with these individually immaterial acquisitions completed in the fiscal year 2015 and 2014,respectively.
We funded the acquisitions completed in the fiscal years 2016, 2015 and 2014 primarily with cash fromoperations and borrowings under the ABL facility.
18. Business Segments and Geographic Area Information
The Company’s business is organized into two separate segments: (i) Sally Beauty Supply, a domestic andinternational chain of cash and carry retail stores which offers professional beauty supplies to both salonprofessionals and retail customers primarily in North America, Puerto Rico, and parts of Europe andSouth America and (ii) BSG, including its franchise-based business Armstrong McCall, a full servicebeauty supply distributor which offers professional brands of beauty products directly to salons and salonprofessionals through its own sales force and professional-only stores (including franchise stores) inpartially exclusive geographical territories in North America and parts of Europe.
The accounting policies of both of our business segments are the same as described in the summary ofsignificant accounting policies contained in Note 2. Sales between segments, which were eliminated inconsolidation, were not material for the fiscal years ended September 30, 2016, 2015 and 2014.
F-39
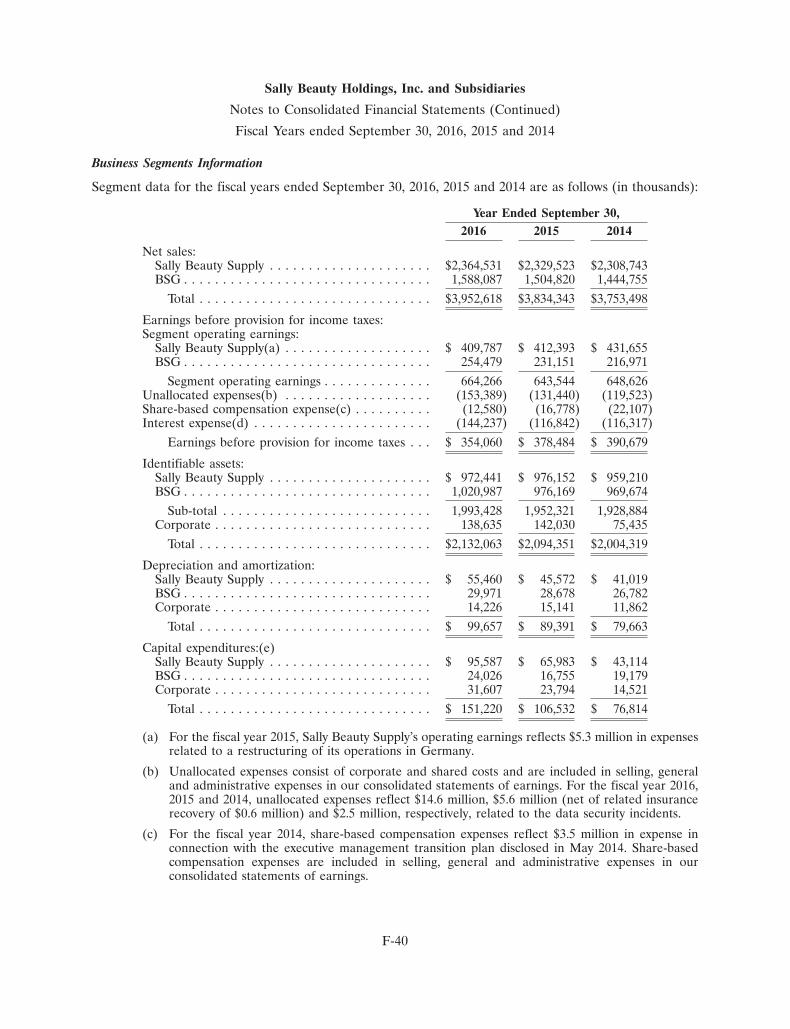
Sally Beauty Holdings, Inc. and Subsidiaries
Notes to Consolidated Financial Statements (Continued)
Fiscal Years ended September 30, 2016, 2015 and 2014
Business Segments Information
Segment data for the fiscal years ended September 30, 2016, 2015 and 2014 are as follows (in thousands):
Year Ended September 30,2016 2015 2014
Net sales:Sally Beauty Supply . . . . . . . . . . . . . . . . . . . . . $2,364,531 $2,329,523 $2,308,743BSG . . . . . . . . . . . . . . . . . . . . . . . . . . . . . . . . 1,588,087 1,504,820 1,444,755
Total . . . . . . . . . . . . . . . . . . . . . . . . . . . . . . $3,952,618 $3,834,343 $3,753,498
Earnings before provision for income taxes:Segment operating earnings:
Sally Beauty Supply(a) . . . . . . . . . . . . . . . . . . . $ 409,787 $ 412,393 $ 431,655BSG . . . . . . . . . . . . . . . . . . . . . . . . . . . . . . . . 254,479 231,151 216,971
Segment operating earnings . . . . . . . . . . . . . . 664,266 643,544 648,626Unallocated expenses(b) . . . . . . . . . . . . . . . . . . . (153,389) (131,440) (119,523)Share-based compensation expense(c) . . . . . . . . . . (12,580) (16,778) (22,107)Interest expense(d) . . . . . . . . . . . . . . . . . . . . . . . (144,237) (116,842) (116,317)
Earnings before provision for income taxes . . . $ 354,060 $ 378,484 $ 390,679
Identifiable assets:Sally Beauty Supply . . . . . . . . . . . . . . . . . . . . . $ 972,441 $ 976,152 $ 959,210BSG . . . . . . . . . . . . . . . . . . . . . . . . . . . . . . . . 1,020,987 976,169 969,674
Sub-total . . . . . . . . . . . . . . . . . . . . . . . . . . . 1,993,428 1,952,321 1,928,884Corporate . . . . . . . . . . . . . . . . . . . . . . . . . . . . 138,635 142,030 75,435
Total . . . . . . . . . . . . . . . . . . . . . . . . . . . . . . $2,132,063 $2,094,351 $2,004,319
Depreciation and amortization:Sally Beauty Supply . . . . . . . . . . . . . . . . . . . . . $ 55,460 $ 45,572 $ 41,019BSG . . . . . . . . . . . . . . . . . . . . . . . . . . . . . . . . 29,971 28,678 26,782Corporate . . . . . . . . . . . . . . . . . . . . . . . . . . . . 14,226 15,141 11,862
Total . . . . . . . . . . . . . . . . . . . . . . . . . . . . . . $ 99,657 $ 89,391 $ 79,663
Capital expenditures:(e)Sally Beauty Supply . . . . . . . . . . . . . . . . . . . . . $ 95,587 $ 65,983 $ 43,114BSG . . . . . . . . . . . . . . . . . . . . . . . . . . . . . . . . 24,026 16,755 19,179Corporate . . . . . . . . . . . . . . . . . . . . . . . . . . . . 31,607 23,794 14,521
Total . . . . . . . . . . . . . . . . . . . . . . . . . . . . . . $ 151,220 $ 106,532 $ 76,814
(a) For the fiscal year 2015, Sally Beauty Supply’s operating earnings reflects $5.3 million in expensesrelated to a restructuring of its operations in Germany.
(b) Unallocated expenses consist of corporate and shared costs and are included in selling, generaland administrative expenses in our consolidated statements of earnings. For the fiscal year 2016,2015 and 2014, unallocated expenses reflect $14.6 million, $5.6 million (net of related insurancerecovery of $0.6 million) and $2.5 million, respectively, related to the data security incidents.
(c) For the fiscal year 2014, share-based compensation expenses reflect $3.5 million in expense inconnection with the executive management transition plan disclosed in May 2014. Share-basedcompensation expenses are included in selling, general and administrative expenses in ourconsolidated statements of earnings.
F-40
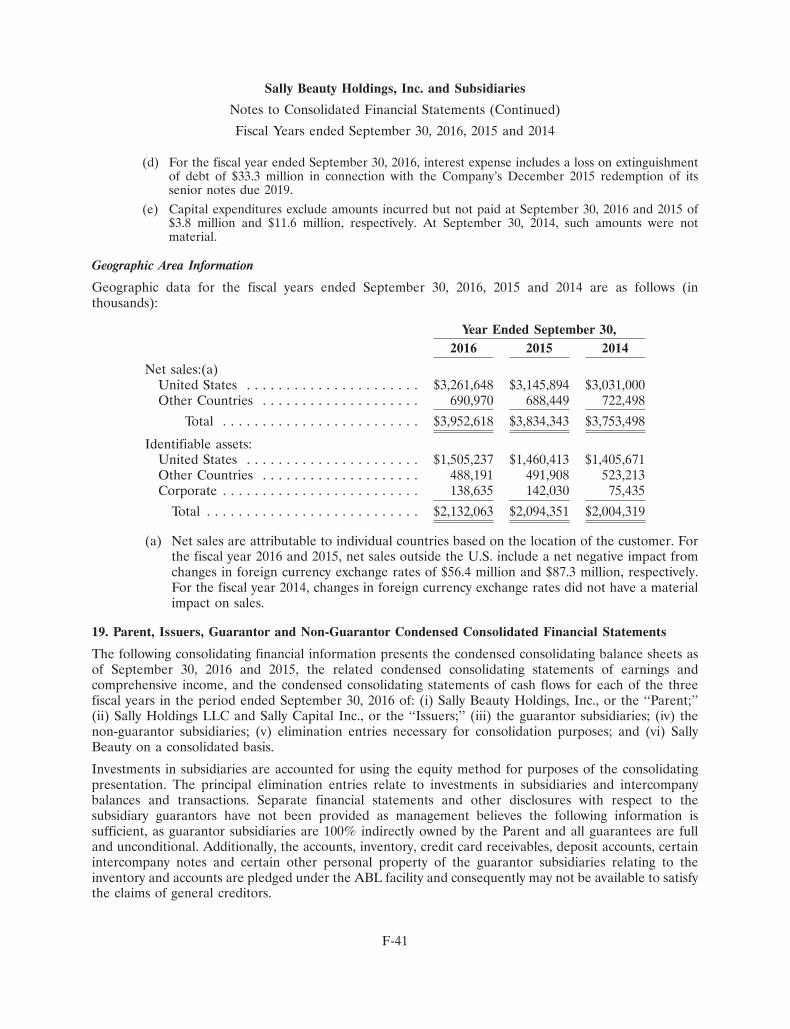
Sally Beauty Holdings, Inc. and Subsidiaries
Notes to Consolidated Financial Statements (Continued)
Fiscal Years ended September 30, 2016, 2015 and 2014
(d) For the fiscal year ended September 30, 2016, interest expense includes a loss on extinguishmentof debt of $33.3 million in connection with the Company’s December 2015 redemption of itssenior notes due 2019.
(e) Capital expenditures exclude amounts incurred but not paid at September 30, 2016 and 2015 of$3.8 million and $11.6 million, respectively. At September 30, 2014, such amounts were notmaterial.
Geographic Area Information
Geographic data for the fiscal years ended September 30, 2016, 2015 and 2014 are as follows (inthousands):
Year Ended September 30,2016 2015 2014
Net sales:(a)United States . . . . . . . . . . . . . . . . . . . . . . $3,261,648 $3,145,894 $3,031,000Other Countries . . . . . . . . . . . . . . . . . . . . 690,970 688,449 722,498
Total . . . . . . . . . . . . . . . . . . . . . . . . . $3,952,618 $3,834,343 $3,753,498
Identifiable assets:United States . . . . . . . . . . . . . . . . . . . . . . $1,505,237 $1,460,413 $1,405,671Other Countries . . . . . . . . . . . . . . . . . . . . 488,191 491,908 523,213Corporate . . . . . . . . . . . . . . . . . . . . . . . . . 138,635 142,030 75,435
Total . . . . . . . . . . . . . . . . . . . . . . . . . . . $2,132,063 $2,094,351 $2,004,319
(a) Net sales are attributable to individual countries based on the location of the customer. Forthe fiscal year 2016 and 2015, net sales outside the U.S. include a net negative impact fromchanges in foreign currency exchange rates of $56.4 million and $87.3 million, respectively.For the fiscal year 2014, changes in foreign currency exchange rates did not have a materialimpact on sales.
19. Parent, Issuers, Guarantor and Non-Guarantor Condensed Consolidated Financial Statements
The following consolidating financial information presents the condensed consolidating balance sheets asof September 30, 2016 and 2015, the related condensed consolidating statements of earnings andcomprehensive income, and the condensed consolidating statements of cash flows for each of the threefiscal years in the period ended September 30, 2016 of: (i) Sally Beauty Holdings, Inc., or the ‘‘Parent;’’(ii) Sally Holdings LLC and Sally Capital Inc., or the ‘‘Issuers;’’ (iii) the guarantor subsidiaries; (iv) thenon-guarantor subsidiaries; (v) elimination entries necessary for consolidation purposes; and (vi) SallyBeauty on a consolidated basis.
Investments in subsidiaries are accounted for using the equity method for purposes of the consolidatingpresentation. The principal elimination entries relate to investments in subsidiaries and intercompanybalances and transactions. Separate financial statements and other disclosures with respect to thesubsidiary guarantors have not been provided as management believes the following information issufficient, as guarantor subsidiaries are 100% indirectly owned by the Parent and all guarantees are fulland unconditional. Additionally, the accounts, inventory, credit card receivables, deposit accounts, certainintercompany notes and certain other personal property of the guarantor subsidiaries relating to theinventory and accounts are pledged under the ABL facility and consequently may not be available to satisfythe claims of general creditors.
F-41
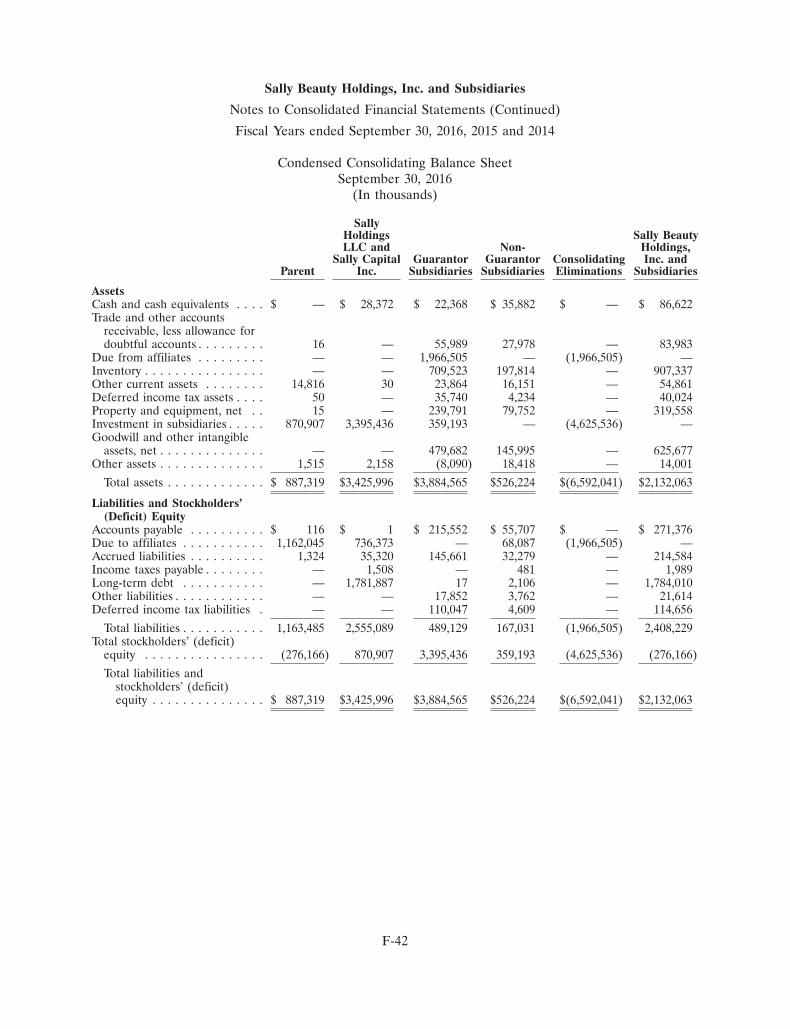
Sally Beauty Holdings, Inc. and Subsidiaries
Notes to Consolidated Financial Statements (Continued)
Fiscal Years ended September 30, 2016, 2015 and 2014
Condensed Consolidating Balance SheetSeptember 30, 2016
(In thousands)
SallyHoldings Sally BeautyLLC and Non- Holdings,
Sally Capital Guarantor Guarantor Consolidating Inc. andParent Inc. Subsidiaries Subsidiaries Eliminations Subsidiaries
AssetsCash and cash equivalents . . . . $ — $ 28,372 $ 22,368 $ 35,882 $ — $ 86,622Trade and other accounts
receivable, less allowance fordoubtful accounts . . . . . . . . . 16 — 55,989 27,978 — 83,983
Due from affiliates . . . . . . . . . — — 1,966,505 — (1,966,505) —Inventory . . . . . . . . . . . . . . . . — — 709,523 197,814 — 907,337Other current assets . . . . . . . . 14,816 30 23,864 16,151 — 54,861Deferred income tax assets . . . . 50 — 35,740 4,234 — 40,024Property and equipment, net . . 15 — 239,791 79,752 — 319,558Investment in subsidiaries . . . . . 870,907 3,395,436 359,193 — (4,625,536) —Goodwill and other intangible
assets, net . . . . . . . . . . . . . . — — 479,682 145,995 — 625,677Other assets . . . . . . . . . . . . . . 1,515 2,158 (8,090) 18,418 — 14,001
Total assets . . . . . . . . . . . . . $ 887,319 $3,425,996 $3,884,565 $526,224 $(6,592,041) $2,132,063
Liabilities and Stockholders’(Deficit) Equity
Accounts payable . . . . . . . . . . $ 116 $ 1 $ 215,552 $ 55,707 $ — $ 271,376Due to affiliates . . . . . . . . . . . 1,162,045 736,373 — 68,087 (1,966,505) —Accrued liabilities . . . . . . . . . . 1,324 35,320 145,661 32,279 — 214,584Income taxes payable . . . . . . . . — 1,508 — 481 — 1,989Long-term debt . . . . . . . . . . . — 1,781,887 17 2,106 — 1,784,010Other liabilities . . . . . . . . . . . . — — 17,852 3,762 — 21,614Deferred income tax liabilities . — — 110,047 4,609 — 114,656
Total liabilities . . . . . . . . . . . 1,163,485 2,555,089 489,129 167,031 (1,966,505) 2,408,229Total stockholders’ (deficit)
equity . . . . . . . . . . . . . . . . (276,166) 870,907 3,395,436 359,193 (4,625,536) (276,166)
Total liabilities andstockholders’ (deficit)equity . . . . . . . . . . . . . . . $ 887,319 $3,425,996 $3,884,565 $526,224 $(6,592,041) $2,132,063
F-42
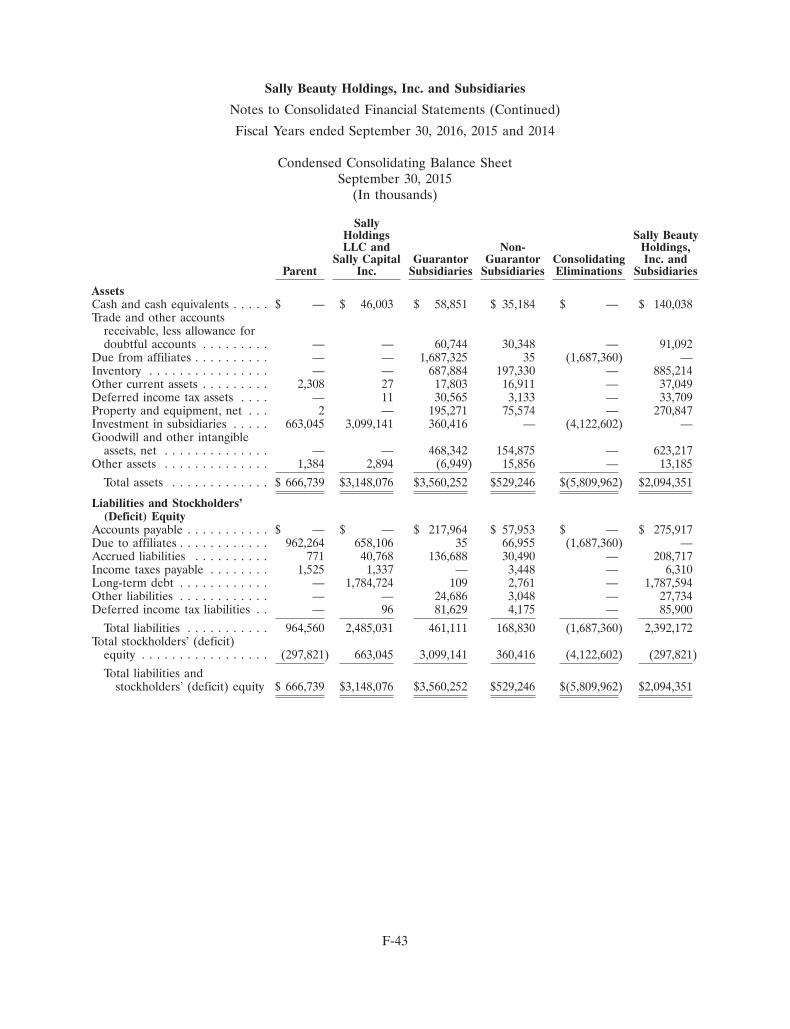
Sally Beauty Holdings, Inc. and Subsidiaries
Notes to Consolidated Financial Statements (Continued)
Fiscal Years ended September 30, 2016, 2015 and 2014
Condensed Consolidating Balance SheetSeptember 30, 2015
(In thousands)
SallyHoldings Sally BeautyLLC and Non- Holdings,
Sally Capital Guarantor Guarantor Consolidating Inc. andParent Inc. Subsidiaries Subsidiaries Eliminations Subsidiaries
AssetsCash and cash equivalents . . . . . $ — $ 46,003 $ 58,851 $ 35,184 $ — $ 140,038Trade and other accounts
receivable, less allowance fordoubtful accounts . . . . . . . . . — — 60,744 30,348 — 91,092
Due from affiliates . . . . . . . . . . — — 1,687,325 35 (1,687,360) —Inventory . . . . . . . . . . . . . . . . — — 687,884 197,330 — 885,214Other current assets . . . . . . . . . 2,308 27 17,803 16,911 — 37,049Deferred income tax assets . . . . — 11 30,565 3,133 — 33,709Property and equipment, net . . . 2 — 195,271 75,574 — 270,847Investment in subsidiaries . . . . . 663,045 3,099,141 360,416 — (4,122,602) —Goodwill and other intangible
assets, net . . . . . . . . . . . . . . — — 468,342 154,875 — 623,217Other assets . . . . . . . . . . . . . . 1,384 2,894 (6,949) 15,856 — 13,185
Total assets . . . . . . . . . . . . . $ 666,739 $3,148,076 $3,560,252 $529,246 $(5,809,962) $2,094,351
Liabilities and Stockholders’(Deficit) Equity
Accounts payable . . . . . . . . . . . $ — $ — $ 217,964 $ 57,953 $ — $ 275,917Due to affiliates . . . . . . . . . . . . 962,264 658,106 35 66,955 (1,687,360) —Accrued liabilities . . . . . . . . . . 771 40,768 136,688 30,490 — 208,717Income taxes payable . . . . . . . . 1,525 1,337 — 3,448 — 6,310Long-term debt . . . . . . . . . . . . — 1,784,724 109 2,761 — 1,787,594Other liabilities . . . . . . . . . . . . — — 24,686 3,048 — 27,734Deferred income tax liabilities . . — 96 81,629 4,175 — 85,900
Total liabilities . . . . . . . . . . . 964,560 2,485,031 461,111 168,830 (1,687,360) 2,392,172Total stockholders’ (deficit)
equity . . . . . . . . . . . . . . . . . (297,821) 663,045 3,099,141 360,416 (4,122,602) (297,821)
Total liabilities andstockholders’ (deficit) equity $ 666,739 $3,148,076 $3,560,252 $529,246 $(5,809,962) $2,094,351
F-43

Sally Beauty Holdings, Inc. and Subsidiaries
Notes to Consolidated Financial Statements (Continued)
Fiscal Years ended September 30, 2016, 2015 and 2014
Condensed Consolidating Statement of Earnings and Comprehensive IncomeFiscal Year Ended September 30, 2016
(In thousands)
Sally Holdings Non- Sally BeautyLLC and Sally Guarantor Guarantor Consolidating Holdings, Inc.
Parent Capital Inc. Subsidiaries Subsidiaries Eliminations and Subsidiaries
Net sales . . . . . . . . . . . . . $ — $ — $3,219,812 $732,806 $ — $3,952,618Related party sales . . . . . . — — 2,666 — (2,666) —Cost of products sold and
distribution expenses . . . — — 1,595,187 396,157 (2,666) 1,988,678
Gross profit . . . . . . . . . — — 1,627,291 336,649 — 1,963,940Selling, general and
administrative expenses . . 11,902 364 1,074,821 278,899 — 1,365,986Depreciation and
amortization . . . . . . . . . 3 — 76,250 23,404 — 99,657
Operating earnings (loss) (11,905) (364) 476,220 34,346 — 498,297Interest expense (income) . — 144,229 (6) 14 — 144,237
Earnings (loss) beforeprovision for incometaxes . . . . . . . . . . . . . (11,905) (144,593) 476,226 34,332 — 354,060
Provision (benefit) forincome taxes . . . . . . . . . (4,638) (56,161) 181,932 9,985 — 131,118
Equity in earnings ofsubsidiaries, net of tax . . 230,209 318,641 24,347 — (573,197) —
Net earnings . . . . . . . . . 222,942 230,209 318,641 24,347 (573,197) 222,942
Other comprehensiveincome (loss), net of tax . — — — (22,346) — (22,346)
Total comprehensiveincome . . . . . . . . . . . $222,942 $ 230,209 $ 318,641 $ 2,001 $(573,197) $ 200,596
F-44
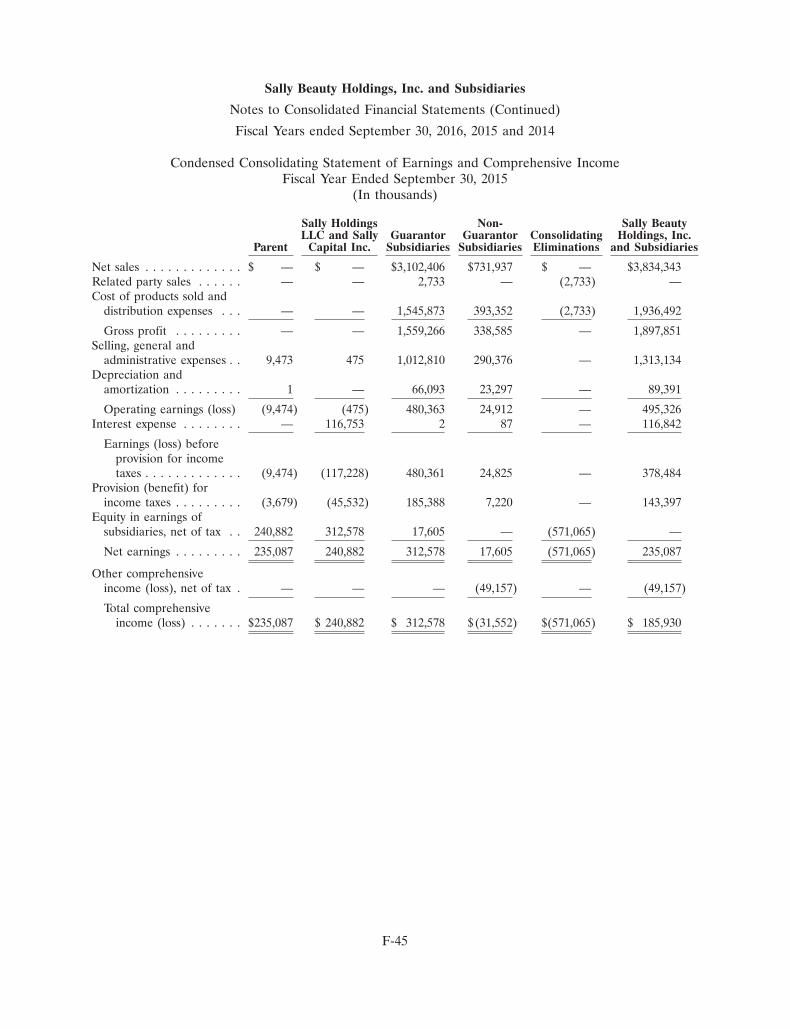
Sally Beauty Holdings, Inc. and Subsidiaries
Notes to Consolidated Financial Statements (Continued)
Fiscal Years ended September 30, 2016, 2015 and 2014
Condensed Consolidating Statement of Earnings and Comprehensive IncomeFiscal Year Ended September 30, 2015
(In thousands)
Sally Holdings Non- Sally BeautyLLC and Sally Guarantor Guarantor Consolidating Holdings, Inc.
Parent Capital Inc. Subsidiaries Subsidiaries Eliminations and Subsidiaries
Net sales . . . . . . . . . . . . . $ — $ — $3,102,406 $731,937 $ — $3,834,343Related party sales . . . . . . — — 2,733 — (2,733) —Cost of products sold and
distribution expenses . . . — — 1,545,873 393,352 (2,733) 1,936,492
Gross profit . . . . . . . . . — — 1,559,266 338,585 — 1,897,851Selling, general and
administrative expenses . . 9,473 475 1,012,810 290,376 — 1,313,134Depreciation and
amortization . . . . . . . . . 1 — 66,093 23,297 — 89,391
Operating earnings (loss) (9,474) (475) 480,363 24,912 — 495,326Interest expense . . . . . . . . — 116,753 2 87 — 116,842
Earnings (loss) beforeprovision for incometaxes . . . . . . . . . . . . . (9,474) (117,228) 480,361 24,825 — 378,484
Provision (benefit) forincome taxes . . . . . . . . . (3,679) (45,532) 185,388 7,220 — 143,397
Equity in earnings ofsubsidiaries, net of tax . . 240,882 312,578 17,605 — (571,065) —
Net earnings . . . . . . . . . 235,087 240,882 312,578 17,605 (571,065) 235,087
Other comprehensiveincome (loss), net of tax . — — — (49,157) — (49,157)
Total comprehensiveincome (loss) . . . . . . . $235,087 $ 240,882 $ 312,578 $(31,552) $(571,065) $ 185,930
F-45
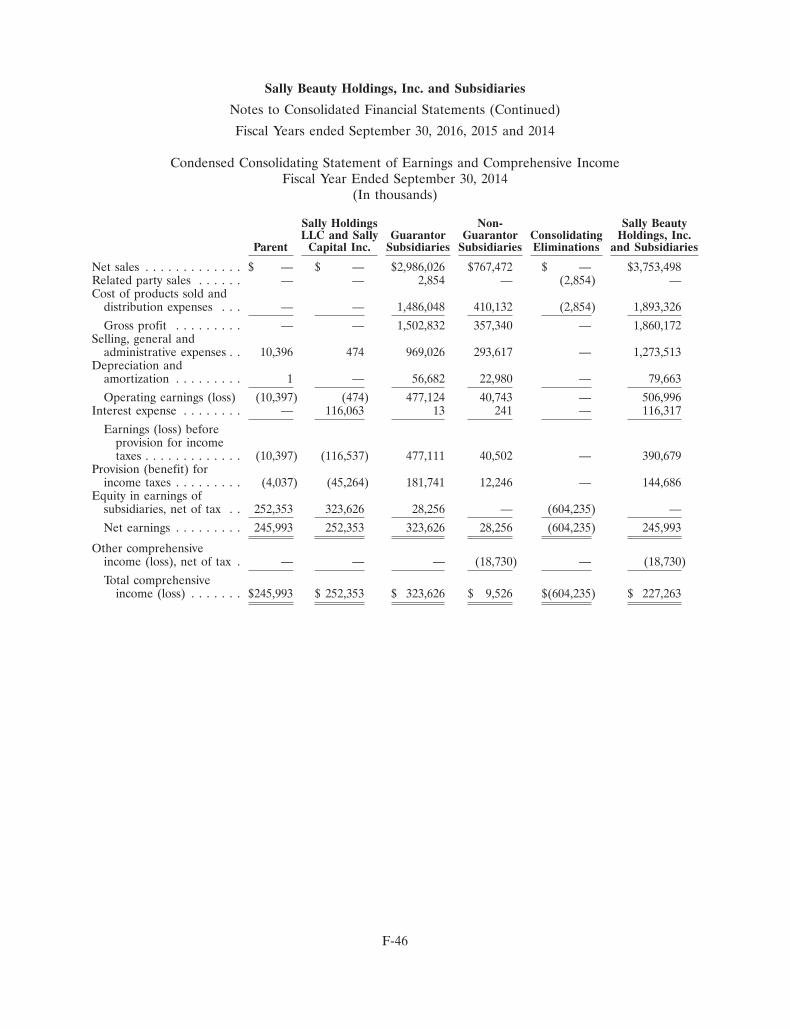
Sally Beauty Holdings, Inc. and Subsidiaries
Notes to Consolidated Financial Statements (Continued)
Fiscal Years ended September 30, 2016, 2015 and 2014
Condensed Consolidating Statement of Earnings and Comprehensive IncomeFiscal Year Ended September 30, 2014
(In thousands)
Sally Holdings Non- Sally BeautyLLC and Sally Guarantor Guarantor Consolidating Holdings, Inc.
Parent Capital Inc. Subsidiaries Subsidiaries Eliminations and Subsidiaries
Net sales . . . . . . . . . . . . . $ — $ — $2,986,026 $767,472 $ — $3,753,498Related party sales . . . . . . — — 2,854 — (2,854) —Cost of products sold and
distribution expenses . . . — — 1,486,048 410,132 (2,854) 1,893,326
Gross profit . . . . . . . . . — — 1,502,832 357,340 — 1,860,172Selling, general and
administrative expenses . . 10,396 474 969,026 293,617 — 1,273,513Depreciation and
amortization . . . . . . . . . 1 — 56,682 22,980 — 79,663
Operating earnings (loss) (10,397) (474) 477,124 40,743 — 506,996Interest expense . . . . . . . . — 116,063 13 241 — 116,317
Earnings (loss) beforeprovision for incometaxes . . . . . . . . . . . . . (10,397) (116,537) 477,111 40,502 — 390,679
Provision (benefit) forincome taxes . . . . . . . . . (4,037) (45,264) 181,741 12,246 — 144,686
Equity in earnings ofsubsidiaries, net of tax . . 252,353 323,626 28,256 — (604,235) —
Net earnings . . . . . . . . . 245,993 252,353 323,626 28,256 (604,235) 245,993
Other comprehensiveincome (loss), net of tax . — — — (18,730) — (18,730)
Total comprehensiveincome (loss) . . . . . . . $245,993 $ 252,353 $ 323,626 $ 9,526 $(604,235) $ 227,263
F-46
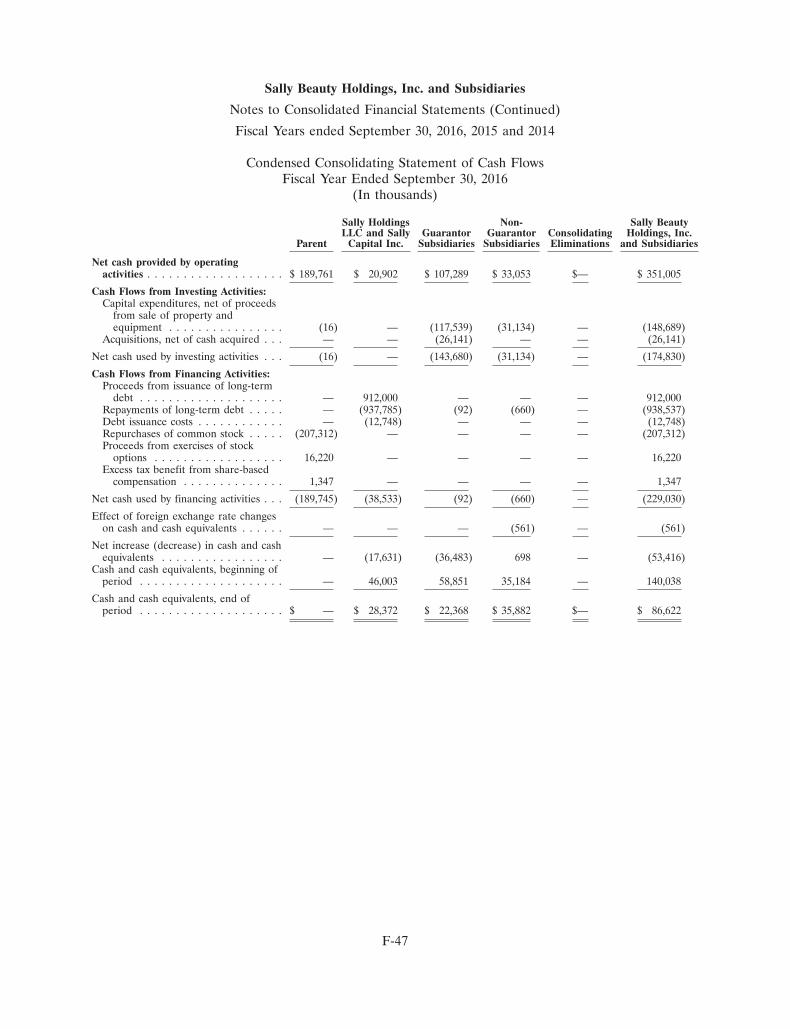
Sally Beauty Holdings, Inc. and Subsidiaries
Notes to Consolidated Financial Statements (Continued)
Fiscal Years ended September 30, 2016, 2015 and 2014
Condensed Consolidating Statement of Cash FlowsFiscal Year Ended September 30, 2016
(In thousands)
Sally Holdings Non- Sally BeautyLLC and Sally Guarantor Guarantor Consolidating Holdings, Inc.
Parent Capital Inc. Subsidiaries Subsidiaries Eliminations and Subsidiaries
Net cash provided by operatingactivities . . . . . . . . . . . . . . . . . . . $ 189,761 $ 20,902 $ 107,289 $ 33,053 $— $ 351,005
Cash Flows from Investing Activities:Capital expenditures, net of proceeds
from sale of property andequipment . . . . . . . . . . . . . . . . (16) — (117,539) (31,134) — (148,689)
Acquisitions, net of cash acquired . . . — — (26,141) — — (26,141)
Net cash used by investing activities . . . (16) — (143,680) (31,134) — (174,830)
Cash Flows from Financing Activities:Proceeds from issuance of long-term
debt . . . . . . . . . . . . . . . . . . . . — 912,000 — — — 912,000Repayments of long-term debt . . . . . — (937,785) (92) (660) — (938,537)Debt issuance costs . . . . . . . . . . . . — (12,748) — — — (12,748)Repurchases of common stock . . . . . (207,312) — — — — (207,312)Proceeds from exercises of stock
options . . . . . . . . . . . . . . . . . . 16,220 — — — — 16,220Excess tax benefit from share-based
compensation . . . . . . . . . . . . . . 1,347 — — — — 1,347
Net cash used by financing activities . . . (189,745) (38,533) (92) (660) — (229,030)
Effect of foreign exchange rate changeson cash and cash equivalents . . . . . . — — — (561) — (561)
Net increase (decrease) in cash and cashequivalents . . . . . . . . . . . . . . . . . — (17,631) (36,483) 698 — (53,416)
Cash and cash equivalents, beginning ofperiod . . . . . . . . . . . . . . . . . . . . — 46,003 58,851 35,184 — 140,038
Cash and cash equivalents, end ofperiod . . . . . . . . . . . . . . . . . . . . $ — $ 28,372 $ 22,368 $ 35,882 $— $ 86,622
F-47
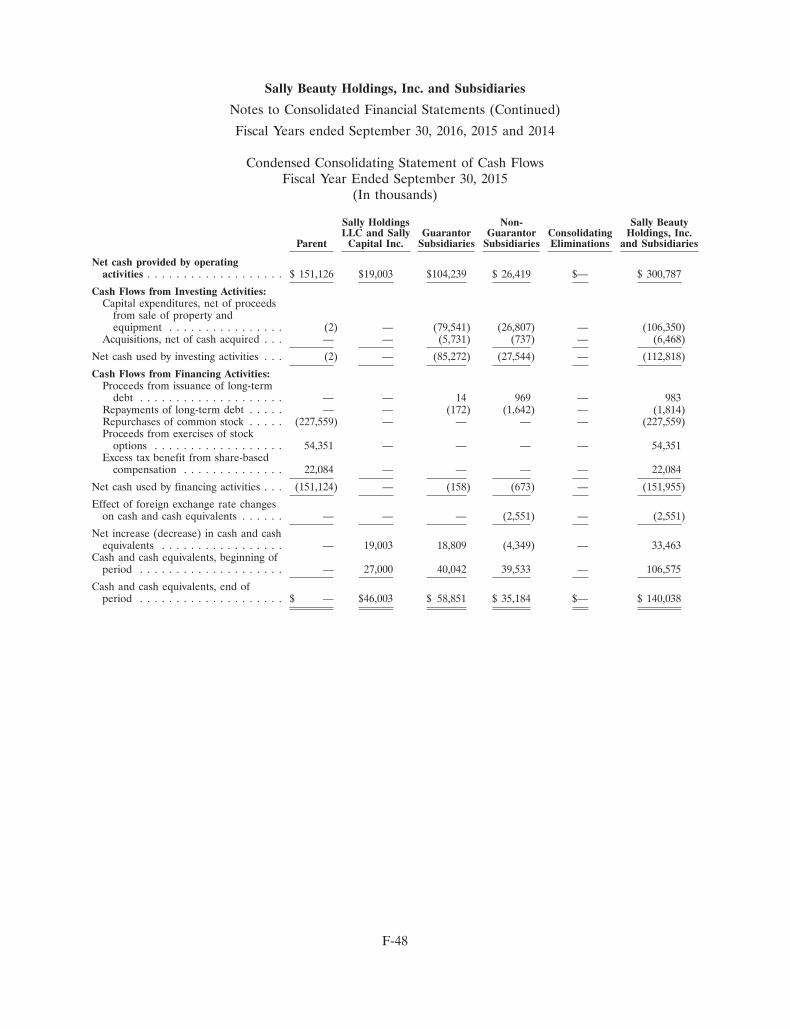
Sally Beauty Holdings, Inc. and Subsidiaries
Notes to Consolidated Financial Statements (Continued)
Fiscal Years ended September 30, 2016, 2015 and 2014
Condensed Consolidating Statement of Cash FlowsFiscal Year Ended September 30, 2015
(In thousands)
Sally Holdings Non- Sally BeautyLLC and Sally Guarantor Guarantor Consolidating Holdings, Inc.
Parent Capital Inc. Subsidiaries Subsidiaries Eliminations and Subsidiaries
Net cash provided by operatingactivities . . . . . . . . . . . . . . . . . . . $ 151,126 $19,003 $104,239 $ 26,419 $— $ 300,787
Cash Flows from Investing Activities:Capital expenditures, net of proceeds
from sale of property andequipment . . . . . . . . . . . . . . . . (2) — (79,541) (26,807) — (106,350)
Acquisitions, net of cash acquired . . . — — (5,731) (737) — (6,468)
Net cash used by investing activities . . . (2) — (85,272) (27,544) — (112,818)
Cash Flows from Financing Activities:Proceeds from issuance of long-term
debt . . . . . . . . . . . . . . . . . . . . — — 14 969 — 983Repayments of long-term debt . . . . . — — (172) (1,642) — (1,814)Repurchases of common stock . . . . . (227,559) — — — — (227,559)Proceeds from exercises of stock
options . . . . . . . . . . . . . . . . . . 54,351 — — — — 54,351Excess tax benefit from share-based
compensation . . . . . . . . . . . . . . 22,084 — — — — 22,084
Net cash used by financing activities . . . (151,124) — (158) (673) — (151,955)
Effect of foreign exchange rate changeson cash and cash equivalents . . . . . . — — — (2,551) — (2,551)
Net increase (decrease) in cash and cashequivalents . . . . . . . . . . . . . . . . . — 19,003 18,809 (4,349) — 33,463
Cash and cash equivalents, beginning ofperiod . . . . . . . . . . . . . . . . . . . . — 27,000 40,042 39,533 — 106,575
Cash and cash equivalents, end ofperiod . . . . . . . . . . . . . . . . . . . . $ — $46,003 $ 58,851 $ 35,184 $— $ 140,038
F-48
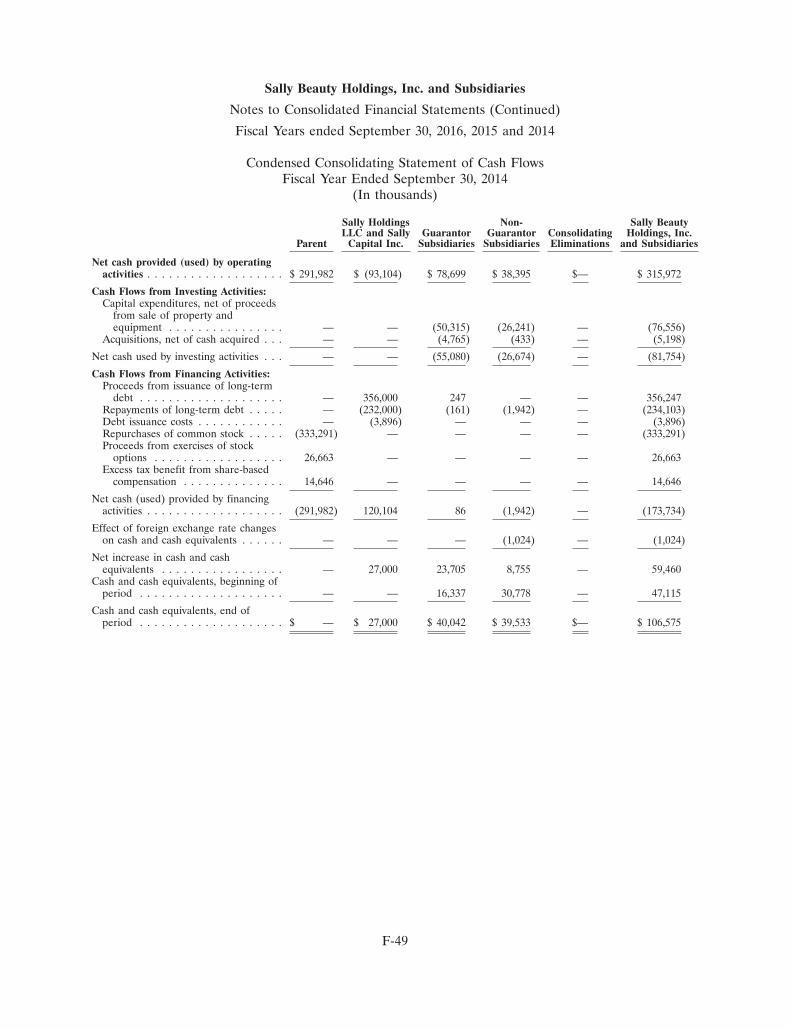
Sally Beauty Holdings, Inc. and Subsidiaries
Notes to Consolidated Financial Statements (Continued)
Fiscal Years ended September 30, 2016, 2015 and 2014
Condensed Consolidating Statement of Cash FlowsFiscal Year Ended September 30, 2014
(In thousands)
Sally Holdings Non- Sally BeautyLLC and Sally Guarantor Guarantor Consolidating Holdings, Inc.
Parent Capital Inc. Subsidiaries Subsidiaries Eliminations and Subsidiaries
Net cash provided (used) by operatingactivities . . . . . . . . . . . . . . . . . . . $ 291,982 $ (93,104) $ 78,699 $ 38,395 $— $ 315,972
Cash Flows from Investing Activities:Capital expenditures, net of proceeds
from sale of property andequipment . . . . . . . . . . . . . . . . — — (50,315) (26,241) — (76,556)
Acquisitions, net of cash acquired . . . — — (4,765) (433) — (5,198)
Net cash used by investing activities . . . — — (55,080) (26,674) — (81,754)
Cash Flows from Financing Activities:Proceeds from issuance of long-term
debt . . . . . . . . . . . . . . . . . . . . — 356,000 247 — — 356,247Repayments of long-term debt . . . . . — (232,000) (161) (1,942) — (234,103)Debt issuance costs . . . . . . . . . . . . — (3,896) — — — (3,896)Repurchases of common stock . . . . . (333,291) — — — — (333,291)Proceeds from exercises of stock
options . . . . . . . . . . . . . . . . . . 26,663 — — — — 26,663Excess tax benefit from share-based
compensation . . . . . . . . . . . . . . 14,646 — — — — 14,646
Net cash (used) provided by financingactivities . . . . . . . . . . . . . . . . . . . (291,982) 120,104 86 (1,942) — (173,734)
Effect of foreign exchange rate changeson cash and cash equivalents . . . . . . — — — (1,024) — (1,024)
Net increase in cash and cashequivalents . . . . . . . . . . . . . . . . . — 27,000 23,705 8,755 — 59,460
Cash and cash equivalents, beginning ofperiod . . . . . . . . . . . . . . . . . . . . — — 16,337 30,778 — 47,115
Cash and cash equivalents, end ofperiod . . . . . . . . . . . . . . . . . . . . $ — $ 27,000 $ 40,042 $ 39,533 $— $ 106,575
F-49
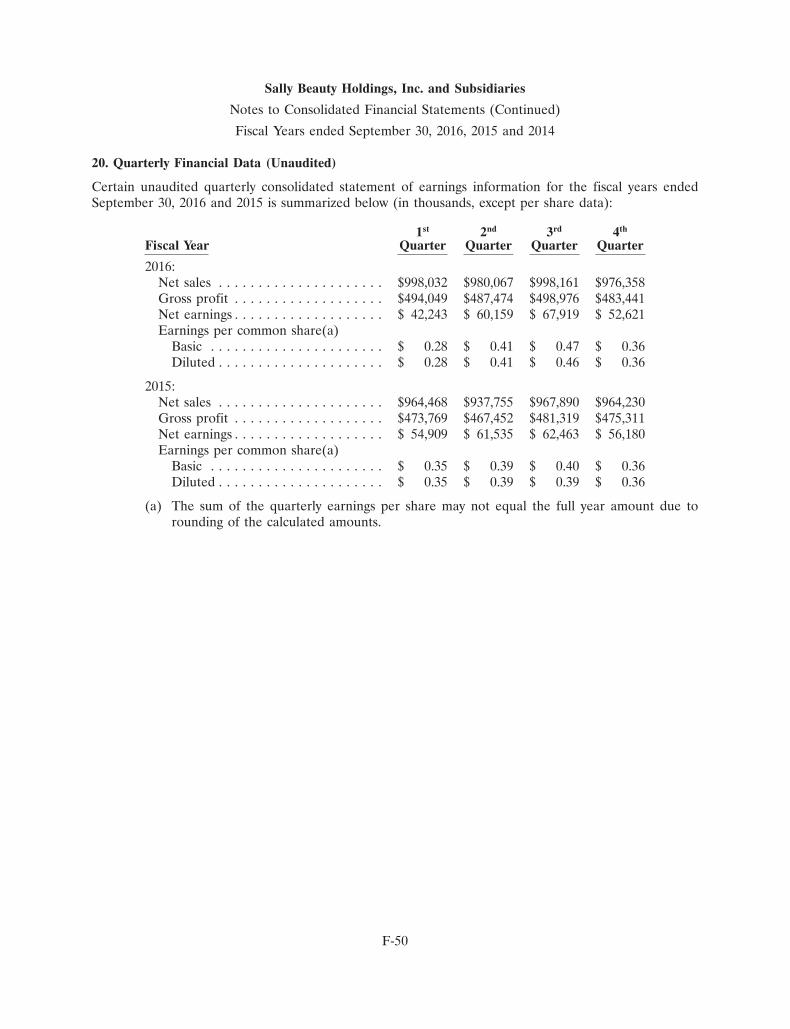
Sally Beauty Holdings, Inc. and Subsidiaries
Notes to Consolidated Financial Statements (Continued)
Fiscal Years ended September 30, 2016, 2015 and 2014
20. Quarterly Financial Data (Unaudited)
Certain unaudited quarterly consolidated statement of earnings information for the fiscal years endedSeptember 30, 2016 and 2015 is summarized below (in thousands, except per share data):
1st 2nd 3rd 4th
Fiscal Year Quarter Quarter Quarter Quarter
2016:Net sales . . . . . . . . . . . . . . . . . . . . . $998,032 $980,067 $998,161 $976,358Gross profit . . . . . . . . . . . . . . . . . . . $494,049 $487,474 $498,976 $483,441Net earnings . . . . . . . . . . . . . . . . . . . $ 42,243 $ 60,159 $ 67,919 $ 52,621Earnings per common share(a)
Basic . . . . . . . . . . . . . . . . . . . . . . $ 0.28 $ 0.41 $ 0.47 $ 0.36Diluted . . . . . . . . . . . . . . . . . . . . . $ 0.28 $ 0.41 $ 0.46 $ 0.36
2015:Net sales . . . . . . . . . . . . . . . . . . . . . $964,468 $937,755 $967,890 $964,230Gross profit . . . . . . . . . . . . . . . . . . . $473,769 $467,452 $481,319 $475,311Net earnings . . . . . . . . . . . . . . . . . . . $ 54,909 $ 61,535 $ 62,463 $ 56,180Earnings per common share(a)
Basic . . . . . . . . . . . . . . . . . . . . . . $ 0.35 $ 0.39 $ 0.40 $ 0.36Diluted . . . . . . . . . . . . . . . . . . . . . $ 0.35 $ 0.39 $ 0.39 $ 0.36
(a) The sum of the quarterly earnings per share may not equal the full year amount due torounding of the calculated amounts.
F-50
Exhibit 31.1
CERTIFICATIONPURSUANT TO EXCHANGE ACT RULES 13a-14(a) AND 15d-14(a),
AS ADOPTED PURSUANT TO SECTION 302 OF THE SARBANES-OXLEY ACT OF 2002
I, Christian A. Brickman, certify that:
(1) I have reviewed this Annual Report on Form 10-K of Sally Beauty Holdings, Inc.;
(2) Based on my knowledge, this report does not contain any untrue statement of a material fact or omitto state a material fact necessary to make the statements made, in light of the circumstances under whichsuch statements were made, not misleading with respect to the period covered by this report;
(3) Based on my knowledge, the financial statements, and other financial information included in thisreport, fairly present in all material respects the financial condition, results of operations and cash flows ofthe registrant as of, and for, the periods presented in this report;
(4) The registrant’s other certifying officer and I are responsible for establishing and maintainingdisclosure controls and procedures (as defined in Exchange Act Rules 13a-15(e) and 15d-15(e)) andinternal control over financial reporting (as defined in Exchange Act Rules 13a-15(f) and 15d-15(f)) for theregistrant and have:
a. Designed such disclosure controls and procedures, or caused such disclosure controls andprocedures to be designed under our supervision, to ensure that material information relating to theregistrant, including its consolidated subsidiaries, is made known to us by others within those entities,particularly during the period in which this report is being prepared;
b. Designed such internal control over financial reporting, or caused such internal control overfinancial reporting to be designed under our supervision, to provide reasonable assurance regardingthe reliability of financial reporting and the preparation of financial statements for external purposesin accordance with generally accepted accounting principles;
c. Evaluated the effectiveness of the registrant’s disclosure controls and procedures and presented inthis report our conclusions about the effectiveness of the disclosure controls and procedures, as of theend of the period covered by this report based on such evaluation; and
d. Disclosed in this report any change in the registrant’s internal control over financial reporting thatoccurred during the registrant’s most recent fiscal quarter (the registrant’s fourth fiscal quarter in thecase of an annual report) that has materially affected, or is reasonably likely to materially affect, theregistrant’s internal control over financial reporting; and
(5) The registrant’s other certifying officer and I have disclosed, based on our most recent evaluation ofinternal control over financial reporting, to the registrant’s auditors and the audit committee of theregistrant’s board of directors (or persons performing the equivalent functions):
a. All significant deficiencies and material weaknesses in the design or operation of internal controlover financial reporting which are reasonably likely to adversely affect the registrant’s ability torecord, process, summarize and report financial information; and
b. Any fraud, whether or not material, that involves management or other employees who have asignificant role in the registrant’s internal control over financial reporting.
Date: November 15, 2016
By: /s/ CHRISTIAN A. BRICKMAN
Christian A. BrickmanChief Executive Officer
Exhibit 31.2
CERTIFICATIONPURSUANT TO EXCHANGE ACT RULES 13a-14(a) AND 15d-14(a),
AS ADOPTED PURSUANT TO SECTION 302 OF THE SARBANES-OXLEY ACT OF 2002
I, Janna S. Minton, certify that:
(1) I have reviewed this Annual Report on Form 10-K of Sally Beauty Holdings, Inc.;
(2) Based on my knowledge, this report does not contain any untrue statement of a material fact or omitto state a material fact necessary to make the statements made, in light of the circumstances under whichsuch statements were made, not misleading with respect to the period covered by this report;
(3) Based on my knowledge, the financial statements, and other financial information included in thisreport, fairly present in all material respects the financial condition, results of operations and cash flows ofthe registrant as of, and for, the periods presented in this report;
(4) The registrant’s other certifying officer and I are responsible for establishing and maintainingdisclosure controls and procedures (as defined in Exchange Act Rules 13a-15(e) and 15d-15(e)) andinternal control over financial reporting (as defined in Exchange Act Rules 13a-15(f) and 15d-15(f)) for theregistrant and have:
a. Designed such disclosure controls and procedures, or caused such disclosure controls andprocedures to be designed under our supervision, to ensure that material information relating to theregistrant, including its consolidated subsidiaries, is made known to us by others within those entities,particularly during the period in which this report is being prepared;
b. Designed such internal control over financial reporting, or caused such internal control overfinancial reporting to be designed under our supervision, to provide reasonable assurance regardingthe reliability of financial reporting and the preparation of financial statements for external purposesin accordance with generally accepted accounting principles;
c. Evaluated the effectiveness of the registrant’s disclosure controls and procedures and presented inthis report our conclusions about the effectiveness of the disclosure controls and procedures, as of theend of the period covered by this report based on such evaluation; and
d. Disclosed in this report any change in the registrant’s internal control over financial reporting thatoccurred during the registrant’s most recent fiscal quarter (the registrant’s fourth fiscal quarter in thecase of an annual report) that has materially affected, or is reasonably likely to materially affect, theregistrant’s internal control over financial reporting; and
(5) The registrant’s other certifying officer and I have disclosed, based on our most recent evaluation ofinternal control over financial reporting, to the registrant’s auditors and the audit committee of theregistrant’s board of directors (or persons performing the equivalent functions):
a. All significant deficiencies and material weaknesses in the design or operation of internal controlover financial reporting which are reasonably likely to adversely affect the registrant’s ability torecord, process, summarize and report financial information; and
b. Any fraud, whether or not material, that involves management or other employees who have asignificant role in the registrant’s internal control over financial reporting.
Date: November 15, 2016
By: /s/ JANNA S. MINTON
Janna S. MintonGroup Vice President, Chief Accounting Officerand Controller (Principal Financial Officer)
Exhibit 32.1
CERTIFICATION PURSUANT TO18 U.S.C. SECTION 1350,
AS ADOPTED PURSUANT TOSECTION 906 OF THE SARBANES-OXLEY ACT OF 2002
In connection with the Annual Report of Sally Beauty Holdings, Inc. (the ‘‘Company’’) on Form 10-K forthe fiscal year ended September 30, 2016 as filed with the Securities and Exchange Commission on thedate hereof (the ‘‘Report’’), I, Christian A. Brickman, Chief Executive Officer of the Company, certify,pursuant to 18 U.S.C. §1350, as adopted pursuant to §906 of the Sarbanes-Oxley Act of 2002, that:
(1) The Report fully complies with the requirements of Section 13(a) or 15(d) of the SecuritiesExchange Act of 1934; and
(2) The information contained in the Report fairly presents, in all material respects, the financialcondition and result of operations of the Company.
By: /s/ CHRISTIAN A. BRICKMAN
Christian A. BrickmanChief Executive Officer
Date: November 15, 2016
Exhibit 32.2
CERTIFICATION PURSUANT TO18 U.S.C. SECTION 1350,
AS ADOPTED PURSUANT TOSECTION 906 OF THE SARBANES-OXLEY ACT OF 2002
In connection with the Annual Report of Sally Beauty Holdings, Inc. (the ‘‘Company’’) on Form 10-K forthe fiscal year ended September 30, 2016 as filed with the Securities and Exchange Commission on thedate hereof (the ‘‘Report’’), I, Janna S. Minton, Group Vice President, Chief Accounting Officer andController of the Company, certify, pursuant to 18 U.S.C. §1350, as adopted pursuant to §906 of theSarbanes-Oxley Act of 2002, that:
(1) The Report fully complies with the requirements of Section 13(a) or 15(d) of the SecuritiesExchange Act of 1934; and
(2) The information contained in the Report fairly presents, in all material respects, the financialcondition and result of operations of the Company.
By: /s/ JANNA S. MINTON
Janna S. MintonGroup Vice President, Chief Accounting Officerand Controller (Principal Financial Officer)
Date: November 15, 2016
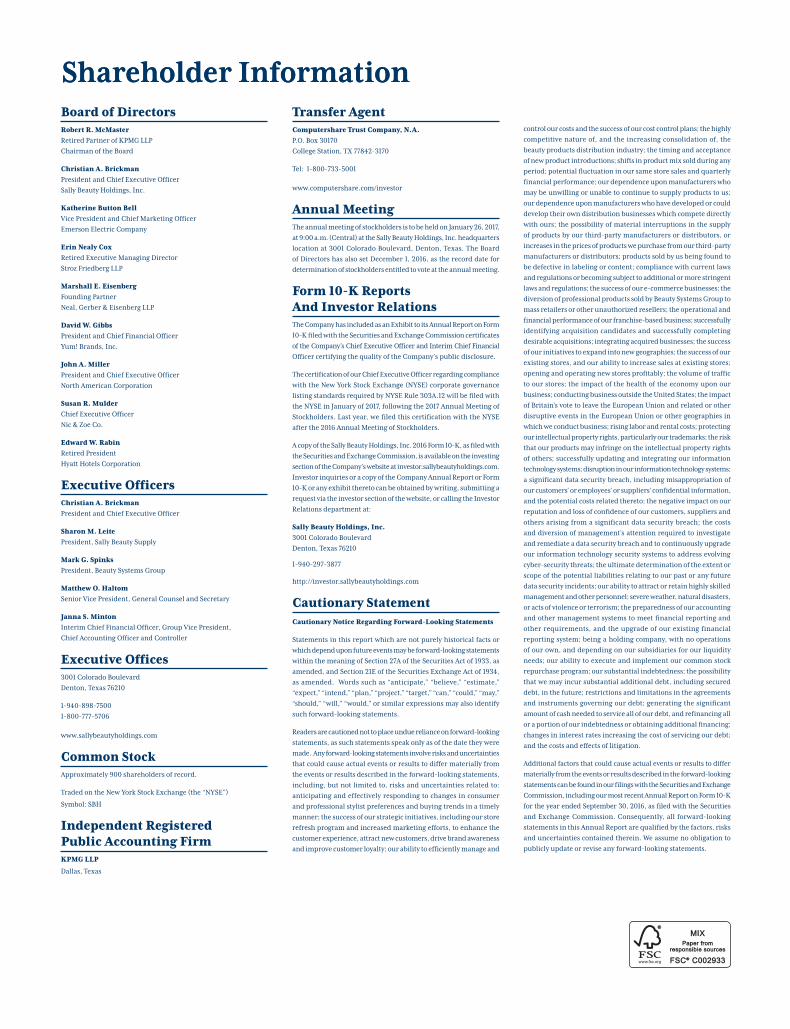
Shareholder Information
For more information about Sally Beauty Holdings, Inc.,please visit www.sallybeautyholdings.com
S ally Beauty Holdings, Inc. (NYSE: SBH) is an international specialty retailer and distributor of professional beauty products, with annual
revenues of $4.0 billion and net earnings of $223 million. The Company operates primarily through two business units, Sally Beauty Supply and Beauty Systems Group (BSG), and is the largest distributor of professional beauty supplies in the U.S. based on store count. We provide our customers with a wide variety of leading third-party branded and exclusive-label professional beauty supplies, including hair color and hair care products, styling tools, skin and nail care products, and other beauty items.
The Sally Beauty Supply and Beauty Systems Group businesses sell and distribute through over 5,119 stores, including 182 franchised units, throughout the United States (including Puerto Rico), Canada, Mexico, Chile, Colombia, Peru, the United Kingdom, Ireland, Belgium, France, Germany, the Netherlands and Spain. Approximately 83% of consolidated net sales are from customers located in the U.S.
Sally Beauty Supply has 3,781 stores worldwide, of which 2,917 are located in the U.S., with the remaining 864 stores located outside of the U.S. Sally Beauty stores offer up to 8,000 SKUs of professional beauty products for hair care, hair color, styling tools and nails through leading third-party brands and exclusive-label professional product lines. Sally Beauty Supply’s customer base includes retail consumers and salon professionals.
The Beauty Systems Group business has 1,338 stores, including 164 franchise stores. BSG also has one of the largest networks of professional distributor sales consultants in North America, with approximately 936 consultants. The BSG stores and sales consultants sell up to 9,500 SKUs of merchandise that include professionally branded hair color and hair care products, styling tools and nail products that are sold exclusively to professional stylists and salons for use and resale to their customers.
About Sally Beauty Holdings, Inc.
Operating SegmentsSally Beauty
An open-line and exclusive-label beauty products retailer offering professional beauty products to both retail consumers and salon professionals
+ Began operations in 1964
+ 3,781 stores worldwide
- 2,917 in the U.S.
- 864 outside of the U.S.
+ Annual sales of $2.4 billion; gross profit margin of 55.2%
+ Average store size 1,700 square feet
+ Comprehensive product assortment approximately 8,000 SKUs
Beauty Systems Group
A leading full-service beauty products distributor offering professional beauty products exclusively to professional stylists and salons for use and resale to their customers
+ 1,338 stores in North America
- 1,174 Company-operated
- 164 Franchise
+ 936 direct distributor sales consultants
+ Annual sales of $1.6 billion; gross profit margin of 41.5%
+ Average store size 2,700 square feet
+ Comprehensive product assortment approximately 9,500 SKUs
+ Broad selection of third-party branded professional beauty products not available in retail
(as of September 30, 2016)
Shareholder InformationBoard of DirectorsRobert R. McMaster
Retired Partner of KPMG LLP
Chairman of the Board
Christian A. Brickman
President and Chief Executive Officer
Sally Beauty Holdings, Inc.
Katherine Button Bell
Vice President and Chief Marketing Officer
Emerson Electric Company
Erin Nealy Cox
Retired Executive Managing Director
Stroz Friedberg LLP
Marshall E. Eisenberg
Founding Partner
Neal, Gerber & Eisenberg LLP
David W. Gibbs
President and Chief Financial Officer
Yum! Brands, Inc.
John A. Miller
President and Chief Executive Officer
North American Corporation
Susan R. Mulder
Chief Executive Officer
Nic & Zoe Co.
Edward W. Rabin
Retired President
Hyatt Hotels Corporation
Executive OfficersChristian A. Brickman
President and Chief Executive Officer
Sharon M. Leite
President, Sally Beauty Supply
Mark G. Spinks
President, Beauty Systems Group
Matthew O. Haltom
Senior Vice President, General Counsel and Secretary
Janna S. Minton
Interim Chief Financial Officer, Group Vice President,
Chief Accounting Officer and Controller
Executive Offices3001 Colorado Boulevard
Denton, Texas 76210
1-940-898-7500
1-800-777-5706
www.sallybeautyholdings.com
Common StockApproximately 900 shareholders of record.
Traded on the New York Stock Exchange (the “NYSE”)
Symbol: SBH
Independent Registered Public Accounting FirmKPMG LLP
Dallas, Texas
Transfer AgentComputershare Trust Company, N.A.
P.O. Box 30170
College Station, TX 77842-3170
Tel: 1-800-733-5001
www.computershare.com/investor
Annual MeetingThe annual meeting of stockholders is to be held on January 26, 2017,
at 9:00 a.m. (Central) at the Sally Beauty Holdings, Inc. headquarters
location at 3001 Colorado Boulevard, Denton, Texas. The Board
of Directors has also set December 1, 2016, as the record date for
determination of stockholders entitled to vote at the annual meeting.
Form 10-K Reports And Investor Relations The Company has included as an Exhibit to its Annual Report on Form
10-K filed with the Securities and Exchange Commission certificates
of the Company’s Chief Executive Officer and Interim Chief Financial
Officer certifying the quality of the Company’s public disclosure.
The certification of our Chief Executive Officer regarding compliance
with the New York Stock Exchange (NYSE) corporate governance
listing standards required by NYSE Rule 303A.12 will be filed with
the NYSE in January of 2017, following the 2017 Annual Meeting of
Stockholders. Last year, we filed this certification with the NYSE
after the 2016 Annual Meeting of Stockholders.
A copy of the Sally Beauty Holdings, Inc. 2016 Form 10-K, as filed with
the Securities and Exchange Commission, is available on the investing
section of the Company’s website at investor.sallybeautyholdings.com.
Investor inquiries or a copy of the Company Annual Report or Form
10-K or any exhibit thereto can be obtained by writing, submitting a
request via the investor section of the website, or calling the Investor
Relations department at:
Sally Beauty Holdings, Inc.
3001 Colorado Boulevard
Denton, Texas 76210
1-940-297-3877
http://investor.sallybeautyholdings.com
Cautionary StatementCautionary Notice Regarding Forward-Looking Statements
Statements in this report which are not purely historical facts or
which depend upon future events may be forward-looking statements
within the meaning of Section 27A of the Securities Act of 1933, as
amended, and Section 21E of the Securities Exchange Act of 1934,
as amended. Words such as “anticipate,” “believe,” “estimate,”
“expect,” “intend,” “plan,” “project,” “target,” “can,” “could,” “may,”
“should,” “will,” “would,” or similar expressions may also identify
such forward-looking statements.
Readers are cautioned not to place undue reliance on forward-looking
statements, as such statements speak only as of the date they were
made. Any forward-looking statements involve risks and uncertainties
that could cause actual events or results to differ materially from
the events or results described in the forward-looking statements,
including, but not limited to, risks and uncertainties related to:
anticipating and effectively responding to changes in consumer
and professional stylist preferences and buying trends in a timely
manner; the success of our strategic initiatives, including our store
refresh program and increased marketing efforts, to enhance the
customer experience, attract new customers, drive brand awareness
and improve customer loyalty; our ability to efficiently manage and
control our costs and the success of our cost control plans; the highly
competitive nature of, and the increasing consolidation of, the
beauty products distribution industry; the timing and acceptance
of new product introductions; shifts in product mix sold during any
period; potential fluctuation in our same store sales and quarterly
financial performance; our dependence upon manufacturers who
may be unwilling or unable to continue to supply products to us;
our dependence upon manufacturers who have developed or could
develop their own distribution businesses which compete directly
with ours; the possibility of material interruptions in the supply
of products by our third-party manufacturers or distributors, or
increases in the prices of products we purchase from our third-party
manufacturers or distributors; products sold by us being found to
be defective in labeling or content; compliance with current laws
and regulations or becoming subject to additional or more stringent
laws and regulations; the success of our e-commerce businesses; the
diversion of professional products sold by Beauty Systems Group to
mass retailers or other unauthorized resellers; the operational and
financial performance of our franchise-based business; successfully
identifying acquisition candidates and successfully completing
desirable acquisitions; integrating acquired businesses; the success
of our initiatives to expand into new geographies; the success of our
existing stores, and our ability to increase sales at existing stores;
opening and operating new stores profitably; the volume of traffic
to our stores; the impact of the health of the economy upon our
business; conducting business outside the United States; the impact
of Britain’s vote to leave the European Union and related or other
disruptive events in the European Union or other geographies in
which we conduct business; rising labor and rental costs; protecting
our intellectual property rights, particularly our trademarks; the risk
that our products may infringe on the intellectual property rights
of others; successfully updating and integrating our information
technology systems; disruption in our information technology systems;
a significant data security breach, including misappropriation of
our customers’ or employees’ or suppliers’ confidential information,
and the potential costs related thereto; the negative impact on our
reputation and loss of confidence of our customers, suppliers and
others arising from a significant data security breach; the costs
and diversion of management’s attention required to investigate
and remediate a data security breach and to continuously upgrade
our information technology security systems to address evolving
cyber-security threats; the ultimate determination of the extent or
scope of the potential liabilities relating to our past or any future
data security incidents; our ability to attract or retain highly skilled
management and other personnel; severe weather, natural disasters,
or acts of violence or terrorism; the preparedness of our accounting
and other management systems to meet financial reporting and
other requirements, and the upgrade of our existing financial
reporting system; being a holding company, with no operations
of our own, and depending on our subsidiaries for our liquidity
needs; our ability to execute and implement our common stock
repurchase program; our substantial indebtedness; the possibility
that we may incur substantial additional debt, including secured
debt, in the future; restrictions and limitations in the agreements
and instruments governing our debt; generating the significant
amount of cash needed to service all of our debt, and refinancing all
or a portion of our indebtedness or obtaining additional financing;
changes in interest rates increasing the cost of servicing our debt;
and the costs and effects of litigation.
Additional factors that could cause actual events or results to differ
materially from the events or results described in the forward-looking
statements can be found in our filings with the Securities and Exchange
Commission, including our most recent Annual Report on Form 10-K
for the year ended September 30, 2016, as filed with the Securities
and Exchange Commission. Consequently, all forward-looking
statements in this Annual Report are qualified by the factors, risks
and uncertainties contained therein. We assume no obligation to
publicly update or revise any forward-looking statements.
603410.indd 2 11/28/16 2:35 PM

Sally Beau
ty Ho
ldin
gs, inc. | 20
16 A
nn
ual R
epo
rt
WHAT’SOUR BEAUTYSECRET?
we believe that we believe that beauty
is not one-size-fits-all. not one-size-fits-all.
That’s why it is our mission That’s why it is our mission
to provide our customers to provide our customers
with a with a personalized shopping shopping
experience where we share our experience where we share our
unique beauty secrets & empower unique beauty secrets & empower
her to find her Beautiful.her to find her Beautiful.
603410.indd 1 11/28/16 2:35 PM